 Zoleka Filander
 Adam N. H. Smith2,3
 Tarron Lamont
- 1Department of Forestry, Fisheries, and Environment, Oceans and Coasts Research, Cape Town, South Africa
- 2Plymouth Routines in Multivariate Ecological Research (PRIMER-e), Quest Research Limited, Auckland, New Zealand
- 3School of Mathematical and Computational Sciences, Massey University, Auckland, New Zealand
- 4Geophysics and Remote Sensing Unit, Council for Geoscience, Bellville, South Africa
- 5African Centre for Coastal Palaeoscience, Nelson Mandela University, Gqeberha/Port Elizabeth, South Africa
- 6Bayworld Centre for Research and Education, Constantia, Cape Town, South Africa
- 7Marine Research Institute and Department of Oceanography, University of Cape Town, Rondebosch, South Africa
Although submarine canyons are internationally recognized as sensitive ecosystems and reported to be biological hotspots, regional studies are required to validate this consensus. To this end, hydrographic and benthic biodiversity data were collected during three cruises (2016-2017) to provide insights on the benthic patterns within South African canyon and non-canyon offshore areas. A total of 25 stations, sampled at 200-1000 m depth range, form the basis of the multivariate analysis. Diversity gradients were calculated and then differences were compared across substrate types and depth zones represented within 12 canyon and 13 non-canyon stations. Significant differences in both substrate and depth were evident, despite measures being highly variable. This observation of varying diversity in different substrates is in line with previous studies. No clear pattern was observed for species diversity (delta+). However, non-canyon stations overall showed a higher diversity in comparison to canyon stations. A notable peak in diversity is observed in canyon areas in the 401-500 m depth zone. Species richness followed an opposing pattern, as it decreased with depth and was consistently higher in canyon areas. These results align with the well-defined influence of depth-related variables on the distribution of taxonomic groups and the substrate available, at various scales. The eutrophic characteristic of the Benguela region may have attributed to the insignificant diversity differences between canyon and non-canyon stations. To assess the benthic species structure in canyon and non-canyon areas, we converted the 108 benthic species into a gamma+ matrix. We then modelled the biological response to predictor variables (substrate and depth). Although the canyon and non-canyon areas have an overlapping species composition, the main effects (canyon vs. non-canyon, depth, and substrate) showed significant differences. Thirteen species were characteristic of canyon areas, whilst only three distinguished non-canyon areas. The region has a long history of anthropogenic activities, so the observed benthic profiles may already be altered. The current study therefore provides the first detailed taxonomic description and analysis of benthic species profiles in the Cape Canyon, and advances important baseline information necessary for understanding the ecological importance of the Cape Canyon.
1 Introduction
Submarine canyons are complex systems that host a range of substrate types and habitats, from mud banks to exposed rocky walls (De Leo et al., 2014; Fernandez-Arcaya et al., 2017). Additional factors such as the unique oceanographic signatures (Allen and Durrieu De Madron, 2009; Quattrini et al., 2015), sedimentology processes and rates, nutrient input (influenced by proximity to river outflows, among other features) (Duros et al., 2014; Lo Iacono et al., 2014; Hawie et al., 2019), morphology, bathymetry, and depth-associated hydrographic variables collectively contribute to submarine canyon heterogeneity (Duffy et al., 2014). The rich variety of habitats and environmental conditions found in canyons may contribute substantially to benthic biodiversity (De Leo et al., 2010; Di Bella et al., 2017; Bianchelli and Danovaro, 2019; Pierdomenico et al., 2019; Bertolino et al., 2019).
Patterns of benthic biodiversity in submarine canyons in the Northern Hemisphere are well documented. These studies showed that relationships between benthic biodiversity and environmental variables in submarine canyons differ among benthic taxonomic groups at various scales. For example, Quattrini et al. (2015) showed the varying degrees to which three taxonomic groups (demersal fish, decapod crustaceans, and corals) were influenced by broad-scale habitat features (canyons, seamounts, seeps, etc.) in the North Atlantic. They found that the species richness of demersal fish and decapod crustaceans declined with depth, and the turnover of species of all three groups was greatest on lower to middle slope areas where there were major boundaries between water masses. A similar result of megafaunal communities being influenced by depth-related variables, where species richness steadily increased with depth between 200-700 m before declining at deeper depths, was reported by a study on five Pacific canyons (Duffy et al., 2014). Statistical differences in benthic community structure between canyon and surrounding areas and across various substrata, were not observed (Duffy et al., 2014). Compelling evidence in their study, however, suggested that the slope of the seafloor influences species composition (Duffy et al., 2014). In the Hawaiian archipelago, submarine features in the Pacific showed that megafaunal communities in canyons differ significantly from those in nearby slope habitats at all depths (Vetter et al., 2010). An increased species richness and diversity trend was generally observed within the canyons. Notably, canyon species diversity and richness patterns are by no means consistent or universal; the canyon size and morphology, bathymetry, local anthropogenic impacts, and oceanography are some of the factors that collectively influence biodiversity patterns.
Despite the recent increase in scientific interest in submarine canyons (Huvenne and Davies, 2013), to date, there have been only a few studies of canyon ecosystems in the Southern Hemisphere. This is particularly true around South Africa, where over 40 submarine canyons have been identified from low-resolution global bathymetric datasets and from sporadic higher resolution investigations. These include: two significant canyons on the western margin (Cape Canyon and Cape Point Valley); three (Sundays, Addo, and Rocks Canyon) off the southern margin, and many more off the eastern margin between East London and Sodwana Bay. Recent fine-scale regional work in the southwestern Cape identified 14 previously unknown submarine canyon systems off the western margin between the Cape Canyon and Cape Agulhas (Palan, 2017). Research to date has focused primarily on canyons in the eastern margin at depths of ca. 150 m, as these are more accessible on the narrow continental shelf and thus more easily sampled (Bang, 1968; Sink et al., 2006; Green and Uken, 2008; Wiles et al., 2013; Green, 2011), and are home to the rare coelacanth (Venter et al., 2000; Green et al., 2009). Comparatively little is known, however, about the Cape Canyon system on the western margin.
There have been studies of the geology (Simpson and Forder, 1968; Dingle, 1973; Wigley and Compton, 2006), oceanography (Shannon and Nelson, 1996; Lamont et al., 2014; Jarre et al., 2015; Lamont et al., 2015; Barlow et al., 2018; Lamont et al., 2018; Veitch et al., 2018; Kersaleí et al., 2019), fisheries (Shannon et al., 2004; Shannon et al., 2010; Travers et al., 2010; Yemane et al., 2014; Mbatha et al., 2019), and vulnerable habitats (Sink et al., 2019) in the region, but little is known about benthic distributions (Atkinson et al., 2011; Lange, 2012; Karenyi et al., 2016; Sink et al., 2019). Deep-water (>200 m) benthic studies that focus on community structure are limited to investigations on the effects of trawling on benthic fauna at a large scale (i.e., from southern Namibia to Cape Town) (Atkinson et al., 2011), the use of demersal by-catch data to determine the distribution of soft-bottom macrofaunal assemblages (Lange, 2012), and defining unconsolidated shelf seascapes (Karenyi et al., 2016). Of interest are the epifaunal diversity patterns highlighted by Lange (2012), whereby the environmental conditions of the Benguela region (western margin) yielded distinctively lower species richness (but high biomass) in comparison to the Agulhas region (southern margin). Although there was no clear relationship between diversity patterns and depth-related environmental variables, along with sediment type (Lange, 2012), the highest number of species was recorded at 300-399 m and the lowest at 500-599 m.
Building on these Southern Benguela Upwelling regional studies is a conservation plan undertaken in 2011, which identified offshore priority conservation areas by collating the best available data at the time (Sink et al., 2011). Such a priority selection analysis developed numerical targets in consultation with stakeholders and produced nine planning scenarios, which ranged from seabed protection to pelagic biodiversity and considered industry activities. At the least cost to primary industry (e.g., fisheries and mining), the Cape Canyon head was identified as one of the areas which warrant protection. Thus, following the Operation Phakisa National Development Plan launched in 2014, research focused on the offshore conservation areas identified by Sink et al. (2011). Amongst these research plans was the three-year Cape Canyon project, which yielded datasets to support the declaration of the Cape Canyon Head as a Marine Protected Area (Department of Environmental Affairs, 2019).
Nonetheless, research focused on the Cape Canyon benthic data has not been carried out, apart from exploratory mining surveys within an area that overlaps with the canyon (see Wigley, 2004; Wigley and Compton, 2006). Here, we present the first detailed study of the benthic distributional patterns in the largest known submarine canyon in South African territory, which lies in the Benguela upwelling system – the Cape Canyon (Figure 1). Our overarching aim was to compare and characterize invertebrate benthic patterns in relation to oceanographic and bathymetric features within Cape Canyon and adjacent areas. More specifically, we compared the diversity gradients and structure of benthic distribution between canyon and non-canyon habitats and examined how these patterns change with varying environmental conditions (depth, bottom temperature, and dissolved oxygen), and among different lithological classes of substrate.
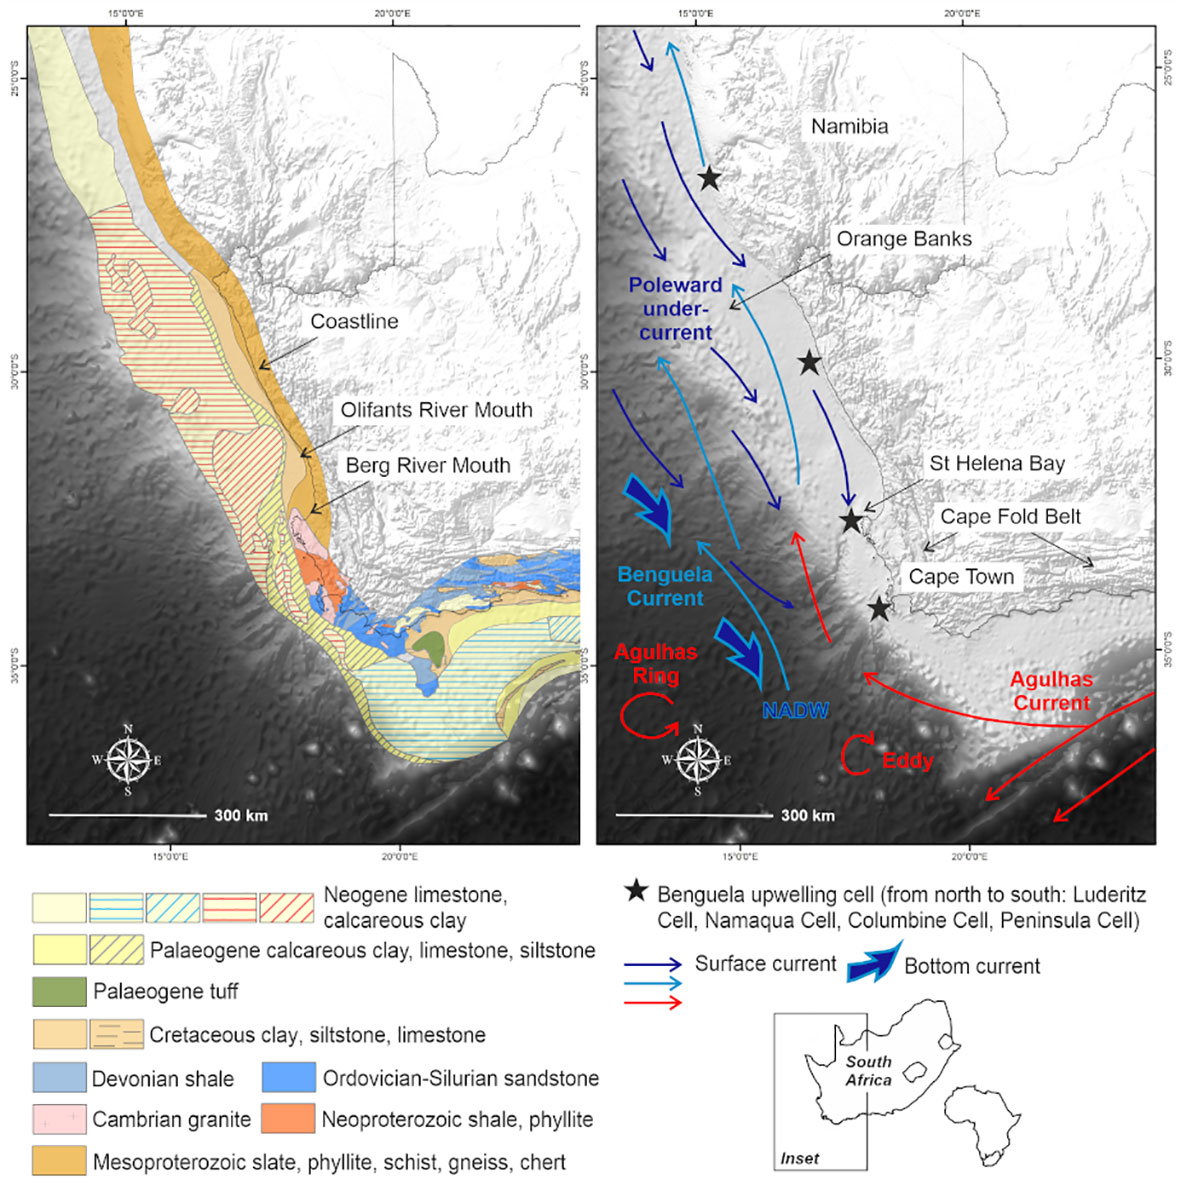
Figure 1 Map showing the South African western margin, in relation to the African continent, with underlying geology and circulation patterns of the Benguela region.
2 Materials and methods
2.1 Regional settings
This study focuses on the passive western margin of South Africa, in the Benguela upwelling system (Figure 1). The western margin of South Africa is considered unusual because it has two shelf breaks. It is broad and relatively deep and descends into the Cape Basin in the Southeast Atlantic from a depth of ~500 m (Du Plessis et al., 1972; Birch, 1975). The outer shelf between Cape Town and the Orange Banks is characterized by a rocky, erosional surface composed of seaward-dipping Neogene-Paleogene carbonate hardgrounds with patchy Quaternary sand cover less than 0.5 m thick (Birch, 1975; Rogers, 1977; Rogers and Bremner, 1991; Compton et al., 2002). The narrow and rugged continental shelf and steep continental slope south of St Helena Bay reflect the buoyant continental margin above the Columbine–Agulhas Arch (Dingle, 1979; Dingle et al., 1983). As highlighted by Wigley and Compton (2006), the seaward extent of the inner-shelf platform is marked by a steep edge. Furthermore, the knick point of the inner shelf occurs at water depths of 90 to 150 m and is partially filled by the Holocene mudbelt (Birch, 1975). Seaward-dipping Cretaceous sediments, with a thin Quaternary veneer occur in the middle shelf region (Figure 1).
The Benguela region is characterized by seasonal wind-driven upwelling (Lamont et al., 2018), which transports cold nutrient-rich waters to the surface (Shannon and Nelson, 1996), increasing primary production (Lamont et al., 2014; Barlow et al., 2018). These nearshore upwelling pathways are further complemented by shelf-edge jet currents and highly variable offshore mesoscale eddies (Veitch et al., 2017; Kersaleí et al., 2019). Spatially variable and persistent low-oxygen cells have also been reported in nearshore regions off the St Helena Bay escarpment (Jarre et al., 2015; Lamont et al., 2015) (Figure 1).
The behavior of water masses in the vicinity is influenced by the local bathymetry, which is characterized by a relatively broad continental shelf where the Cape Canyon incises and gradually extends offshore (de Wet, 2013) (Supplementary: Image 1). The Cape Canyon cuts obliquely across the narrow continental shelf south of St Helena Bay (Figure 1), and has a longitudinal extent of at least 200 km. This feature, being the most profound in the western continental shelf, incises up to the middle shelf. The head of the Cape Canyon lies immediately seaward of the southernmost extent of the Holocene mudbelt and the Columbine upwelling cell, centered over St Helena Bay (Figure 1). It forms a well-developed trench on the continental shelf, which is 100 m deep and 4 km wide, gradually extending to depths of up to 3600 m and becoming progressively broader. Two perennial rivers, the Berg and Olifants, have catchments that extend from the Cape Fold Belt Mountains to the coastal plain and discharge into St Helena Bay (Figure 1).
2.2 Sampling and data sources
During 2016-2018, the RS Algoa was used to conduct multidisciplinary cruises across the Southern Benguela region. Bathymetry and other environmental data, together with epibenthic samples, were collected to characterize the distribution of benthic assemblages within the Cape Canyon and adjacent areas.
2.2.1 Bathymetry
A SIMRAD EK60 system was used to collect split-beam bathymetric data during continuous steaming (at a constant speed of 6 knots) along regularly spaced (4 km) transects, which were orientated perpendicular to the coast and extended 65 km offshore. The processing of the collected split-beam echo-sounder data followed that outlined in de Wet (2013) but differs in that only the data from three transducers (120 kHz, 200 kHz and 38 kHz) were averaged, and the vessel’s draught was accounted for in the ES70 software before surveying the area. Prior to analysis, geographic coordinates were converted to decimal degrees, deleting entries with values of zero, and converting positive values of depth to negative values (for easier expression in the software). A grid was then created from a total of 399413 data points through a kriging method, using Golden Software Surfer. A blanking file was created to crop the area surveyed. After blanking, the resulting grid output was filtered using a low pass filter for better visualization. The bathymetric data complemented the existing topographic knowledge on the Cape Canyon (Supplementary: Image 2) and was also used to classify station data as being located either inside or outside of the canyon for subsequent analyses.
de Wet (2013) produced an updated gridded bathymetric map of the South African seafloor, assimilating available existing datasets. In this dataset, details of the inner shelf’s rocky platform were clearer and structural features can be resolved (Supplementary: Image 2B, D, right representing de Wet and Compton, 2021). In our dataset, these details were less apparent, but the terraced transition separating the inner and mid continental shelf was more apparent (Supplementary: Image 2A, C, left representing data collected through this project). While our data resolution is lower in deeper water due to the limitations of the instruments used, the inner-canyon structures are much clearer.
2.2.2 Benthic sampling and processing
Benthic epi-fauna was collected during each cruise. A stratified random design was followed, whereby stations were identified based on depth zones and whether they were located within or outside of the canyon. However, due to challenging sampling conditions, these efforts yielded an unbalanced design with 12 stations representing canyon areas and 13 non-canyon stations. Despite the unbalanced design, these 25 stations were all located in the 201-1000 m depth range and provided a total of 581 species records, significantly increasing the existing benthic species observations in the region (Supplementary: Data Sheet 1, meta-data) (Figure 2).
All epi-benthic sampling was conducted using a customized dredge with a mouth opening of 30 cm × 100 cm and mesh-lining of 1 cm2. To standardize sampling effort, dredge transects had a bottom-time of 15 to 20 minutes and constant speed of 0.5 knots. Specimens were identified to the lowest possible taxonomic level using the recently published offshore field guide (Atkinson and Sink, 2018) and expert opinion. When identification was not possible (e.g., polychaetes, sponges, ascidians, etc.) organisms were separated according to broad morpho-types. Thus, a total of 180 taxonomically distinct specimens were identified (Supplementary: Data Sheet 1, sample collection). Samples were fixed and preserved in molecular-graded ethanol for long-term storage at the National Department of Forestry, Fisheries, and Environment (DFFE). The associated higher taxonomic classifications of the 108 species/morpho-types were extracted from the World Register of Marine Species batch match online function (Supplementary: Data Sheet 1, taxonomic attributes) (WoRMS Editorial Board, 2022).
2.2.3 Other environmental data
During each cruise, profiles of temperature, salinity, and dissolved oxygen were collected throughout the water column using multiple SBE911 Conductivity-Temperature-Depth (CTD) systems. In 2016, the CTD grid focused on the canyon head and surrounding areas (48 stations). This grid was extended further south during the 2017 survey, yielding data from 131 stations, while in 2018 additional transects (191 stations in total) were added in the northern part of the region, to better capture oceanographic conditions in the upper reaches of the canyon. All CTD casts were taken from the surface to within 5–10 m of the seafloor. Dissolved oxygen concentrations (DO) of discrete seawater samples from selected depths were determined by Winkler titrations and used to calibrate the dissolved oxygen profiles. For this study, we used only bottom temperature, salinity, and dissolved oxygen measurements, which were averaged across the cruises at overlapping stations. The averaged oceanographic bottom data (Supplementary: Data Sheet 2) and bathymetry were used as environmental variables of interest for subsequent analyses.
The most recent geological spatial layer, which characterizes substrate types, was also considered. There are two published regional classifications for this area. First, Dingle and Siesser (1975) produced a regional-scale geological map of the coastal and seafloor areas and focused on the basement geology. These lithologies are mantled with unconsolidated sediment which was first published as a regional sediment map (Dingle et al., 1987) and is the basis of the National Biodiversity Assessment (Sink et al., 2019). Their recent assessment highlighted the difficulties in classifying canyon substrate types with their nested-hierarchical methodology (Sink et al., 2019). Thus, for the purposes of correlating benthic habitats to substrate, we applied the geological seafloor classification data, i.e., Dingle’s (1975) lithology groups, as substrates.
To match biotic data to environmental data, the starting points of each of the 25 dredge stations were related to the nearest coverage point of each of the three spatial environmental datasets (temperature, salinity, DO, bathymetry, and substrate) by applying the Near Function in ArcGis 10.6.1. The full resulting dataset therefore included biotic data (occurrences of 180 taxa) and associated physical and hydrographic variables, including substrate type, bottom averaged temperature, bottom averaged DO, depth, and the canyon (C)/non-canyon (NC) classification, at each of the 25 stations (Figure 2). Two substrate classes characterized the 25 stations, and these include a: CCSL =Calcareous clay, siltstone, limestone; and LCC = Limestone, Calcareous Clay. The order of sediment type within these substrate groups represents the proportion of each within a combination (Supplementary: Data Sheet 1, associated physical variables).
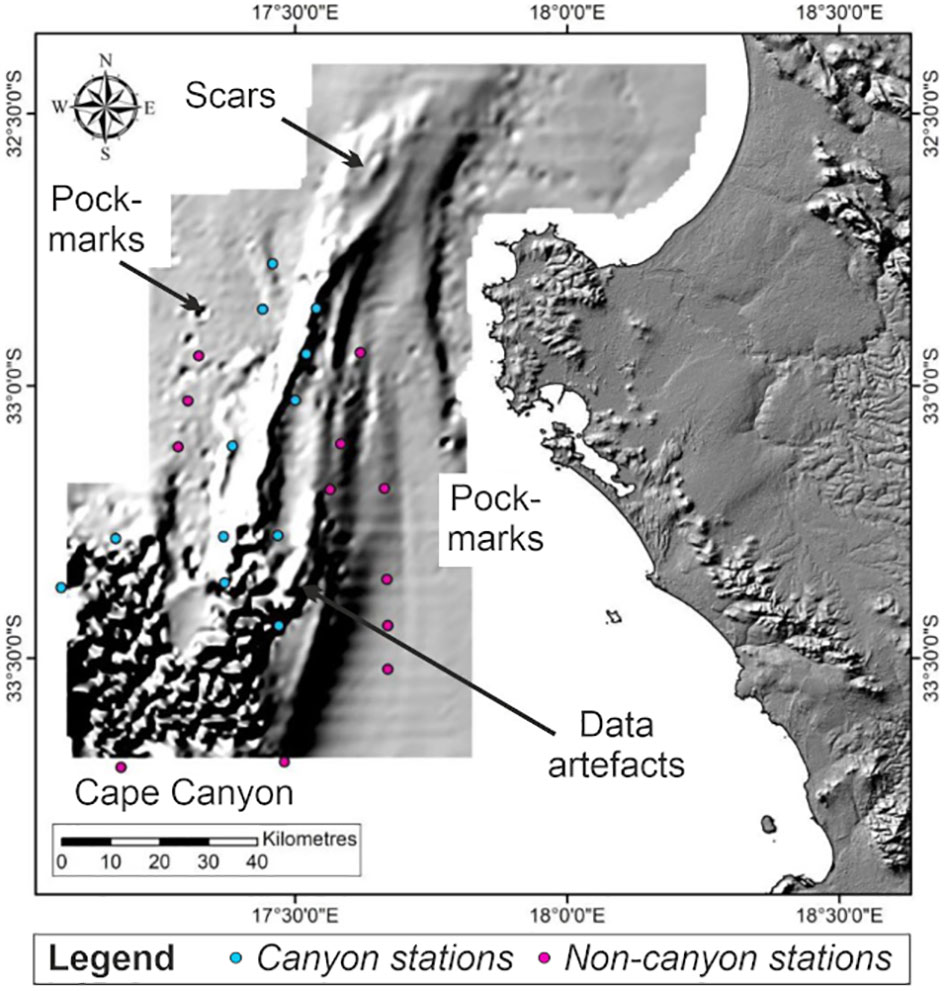
Figure 2 Map showing canyon vs. non-canyon stations overlaid onto bathymetry data (grey shading) collected through this project.
2.2.4 Sampling bias and assumptions
This study was based on qualitative biological (presence-absence) data, which was collected using an unbalanced sampling strategy and lacks rigorous terrain seabed features (e.g., slope aspect, micro-habitat). Although attempts to standardize sampling effort were prioritized (i.e., 15-20 min bottom time and speed 0.5 knots), weather conditions and seabed topography were irregular and led to sampling biases. For example, an estimated distance of 200 to 300 meters was anticipated for each dredge operation but some deployments covered a third of the total anticipated distance (i.e., stations on canyon margin). In addition, underlying geology (lithology classes) was used as a proxy for substrate type and such delineations may not accurately represent the current seafloor characteristics. Whilst these lithology classes are the best available sediment attribute data in our area of interest, the inability of epibenthic dredges to provide point specific specimen and substrate information exacerbates the existing sampling biases. CTD casts did not require such consideration, as these deployments are point specific and stations were represented by 5 x 5 nautical mile (nmi) grid. Our study therefore assumes that a dredge operation within the 5 x 5 nmi is associated to the CTD cast within that radius.
2.3 Data analysis
2.3.1. Diversity measures in canyon and non-canyon sites across substrate and depth ranges
Data on the presence and absence of 108 benthic taxa at 25 stations (Supplementary: Data Sheet 1, presence-absence matrix) were analyzed in PRIMER v7 with the PERMANOVA+ add-on package (Anderson et al., 2008; Clarke et al., 2014). We firstly calculated various measures of diversity for each station, including species richness (S) and average taxonomic distinctiveness (delta+) to examine whether diversity gradients existed within the substrate type and depth groups represented in the canyon vs. non-canyon stations. The associated dredge data was grouped according to 100 m incremental zones. These depth zones, along with the canyon vs. non-canyon and substrate classifications (see section 2.2.1. and 2.2.3.; respectively) were added as factors to the presence-absence matrix. We then tested for significant differences across the substrate types and depth groups (within the canyon vs. non-canyon comparison) by converting the diversity measures into a fourth-rooted Euclidean distance matrix. A two-way PERMANOVA (Anderson, 2001) on each fixed factor within the canyon vs. non-canyon comparison was used to test the response of diversity measures to substrate type and depth zone.
To further investigate the factors that influenced diversity we aggregated the presence-absence matrix to family level then summed it according to the combined factors. We thereafter computed a group average SIMPROF cluster analysis on the square rooted Bray-Curtis resemblance matrix of the aggregated and summed output. A shaded plot was then superimposed with SIMPROF hierarchical clusters and showed the distribution of phyla across the groups in question.
2.3.2 Relating epibenthic benthic species profiles to environmental variables
Following the above exploratory analysis, we quantified the taxonomic dissimilarity of each pair of stations, using the “Gamma+” measure (Clarke et al., 2006). The Gamma+ measure uses taxonomic information (Supplementary: Data Sheet 1, taxonomic attributes) on the species common to both samples. For species found only in one sample, a contribution to the dissimilarity is made according to its closest relative in the other sample. Two samples that share the same and/or closely related species have dissimilarity near zero, while two samples with species that share only distantly related species have a dissimilarity near one.
The matrix of among-sample Gamma+ dissimilarities was visualized with a non-metric Multi-Dimensional Scaling (nMDS) plot. We analyzed the matrix as a multivariate response using PERMANOVA to test our hypotheses regarding differences in the taxonomic composition of benthic patterns (Anderson, 2001). To achieve this, we modelled taxonomic composition according to a suite of predictor variables relating to depth, bottom temperature, bottom dissolved oxygen, and substrate type. The predictor variables were not highly skewed, so no transformation was applied. Bottom temperature and bottom dissolved oxygen were both highly correlated with depth (Pearson measure between -0.7 to 0.7), so we used depth as a predictor variable. We used a three-factor PERMANOVA to test for effects of the canyon (inside vs. outside the canyon), substrate, and depth on taxonomic composition of benthic species. All factors were treated as fixed. A SIMPER analysis showed species characteristics of canyon vs. non-canyon groups.
3 Results
3.1 Diversity measures in canyon and non-canyon sites across substrate and depth groups
Overall, the two diversity measures (species richness S and average taxonomic distinctiveness Delta+) had a skewed distribution within groups, in which non-canyon and canyon stations represented both of these substrate classes (Figures 3, 4) across depth classes in range of 201-1000 m (Figures 5, 6). The highest average taxonomic distinctness (denoted by delta +) was recorded at the calcareous clay, siltstone (CCSL) stations; for which majority of the canyon CCSL stations fell within the lower quartile (Figure 3). Outliers in both the canyon and non-canyon CCSL groups were evident. Variability in species richness also peaked in CCSL stations, whereby the non-canyon CCSL areas fell in the lower quartile (Figure 4). The PERMANOVA showed significant differences in the diversity measures between the substrate groups (DF=1, pseudo-F= 7.249, P(Perm)= 0.009), but none for the canyon vs. non-canyon groups (DF=1, pseudo-F= 1.229, P(Perm)= 0.276) (Table 1).
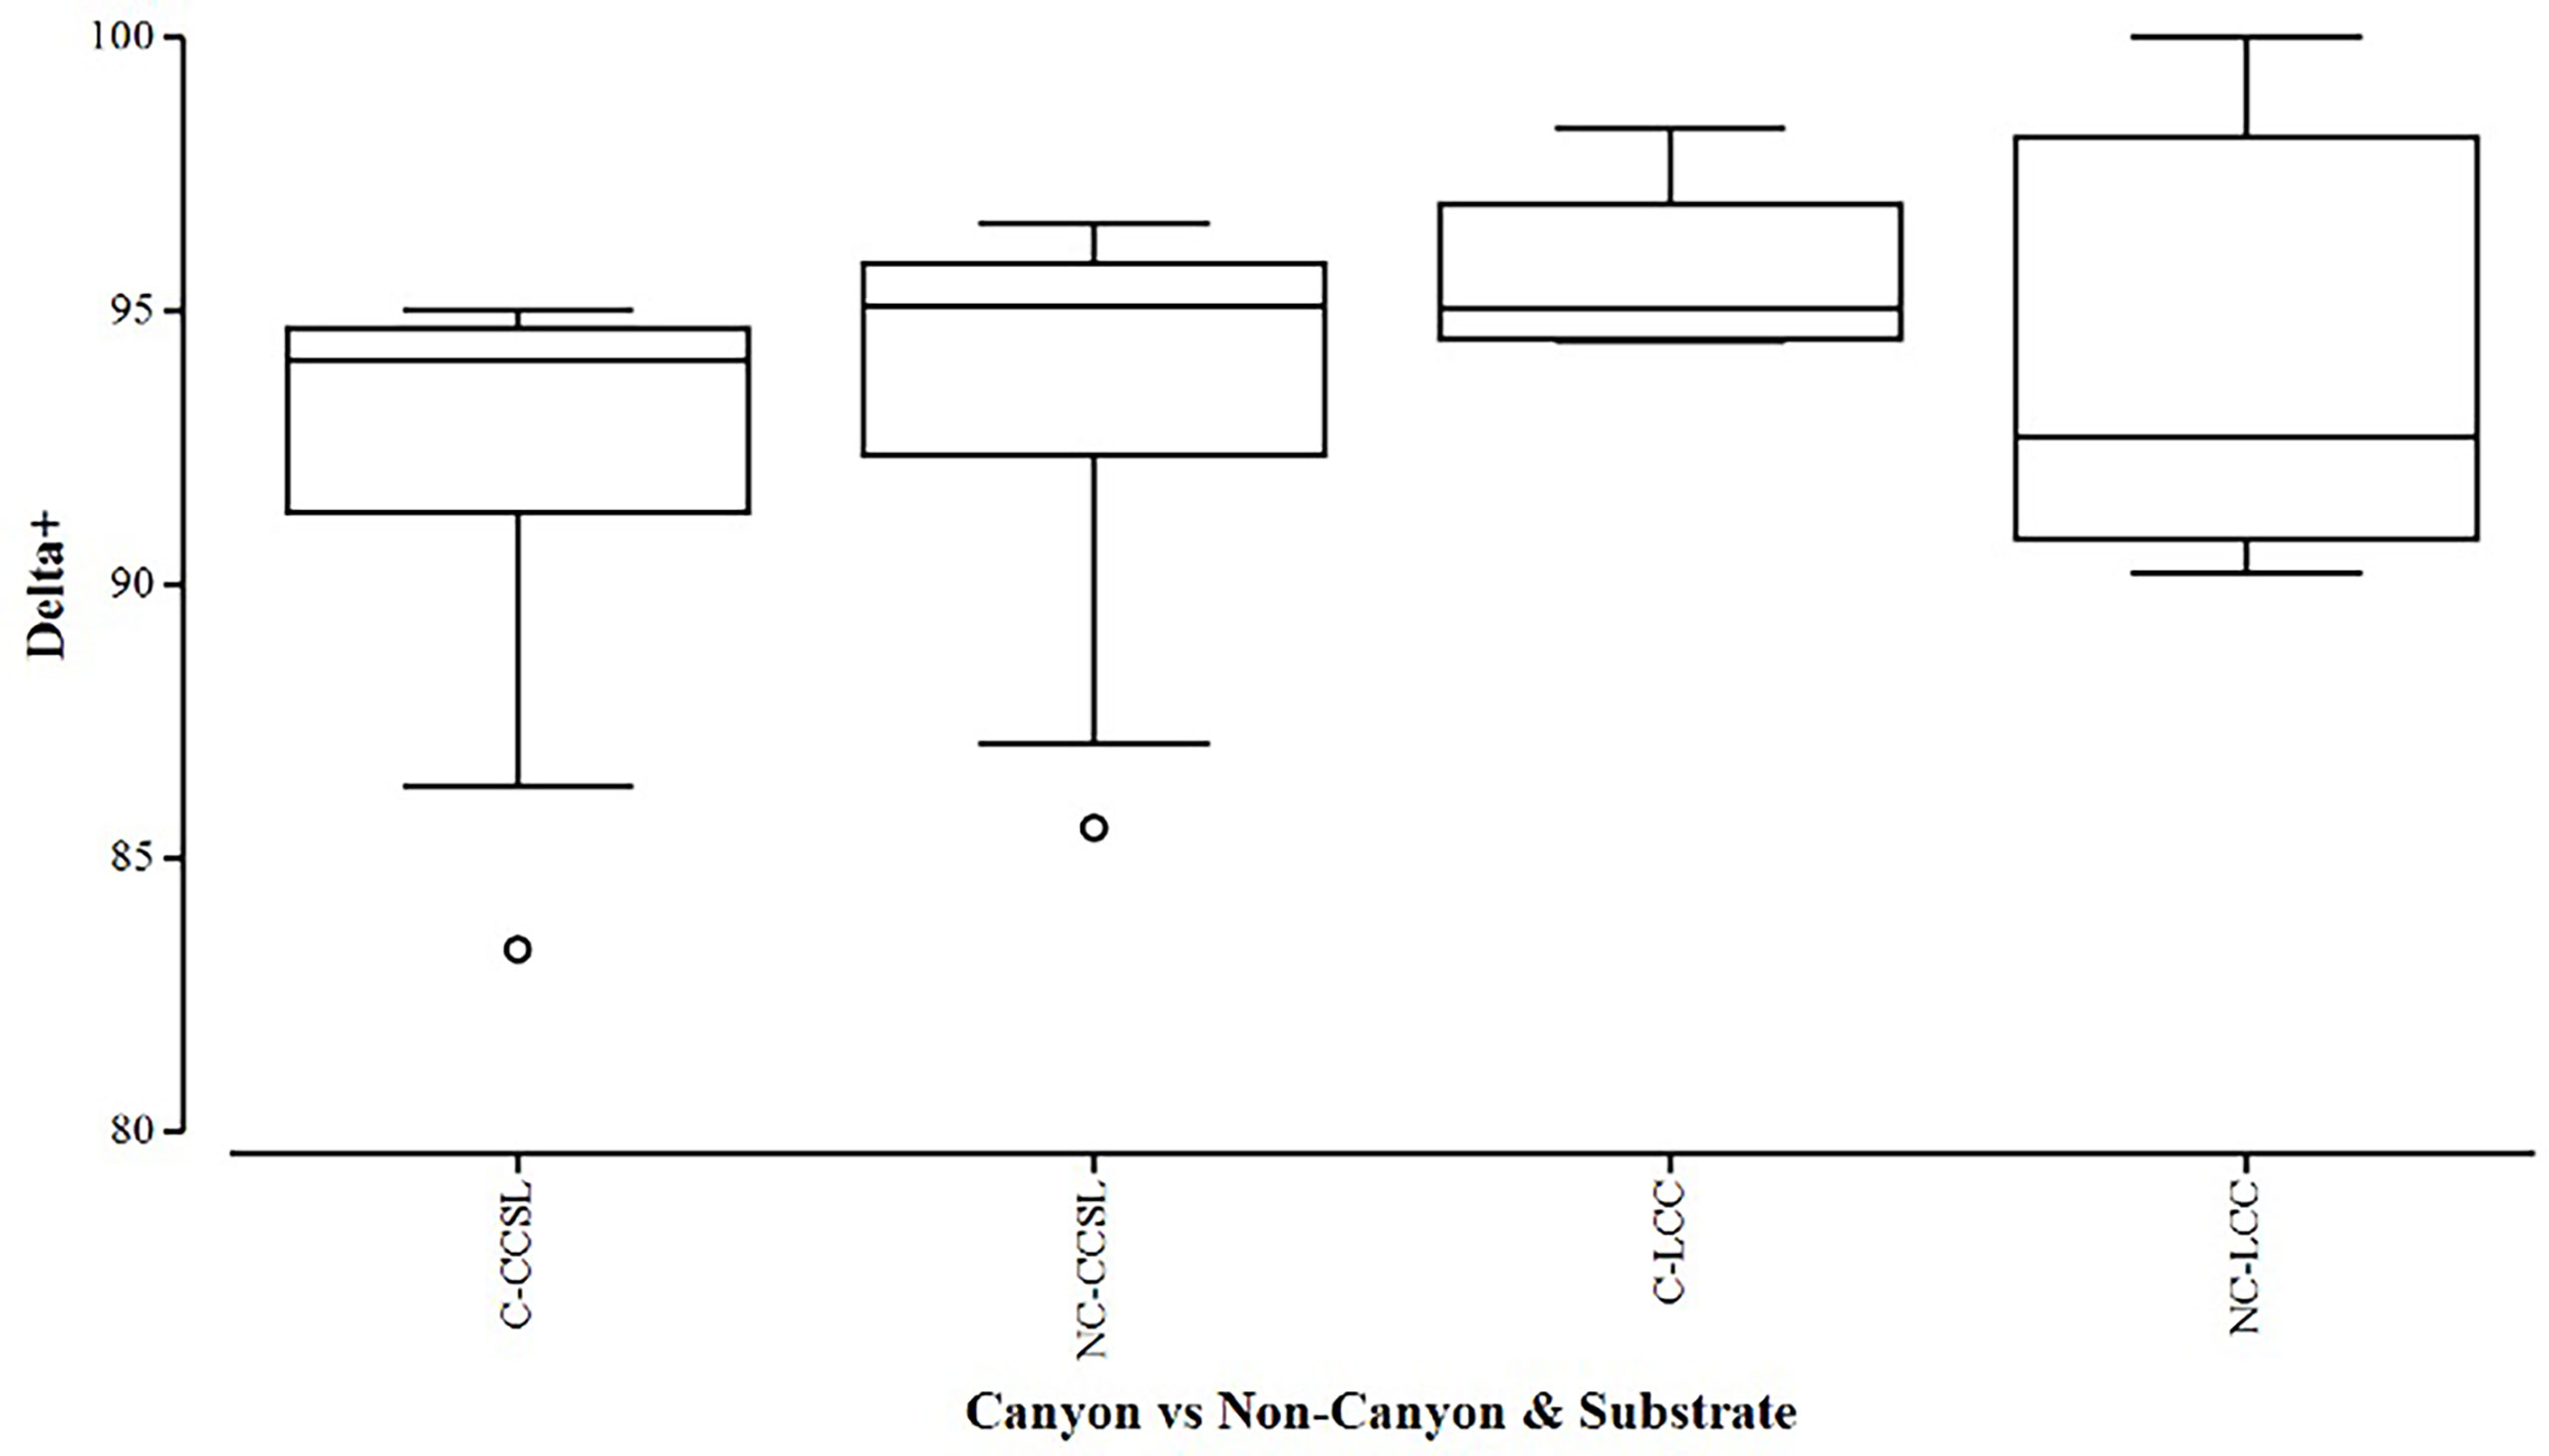
Figure 3 Box plot showing the average taxonomic distinctiveness represented within each canyon (C) vs. non-canyon (NC) substrate type group: where CCSL represents Calcareous clay, siltstone, limestone; and LCC, Limestone, Calcareous Clay.
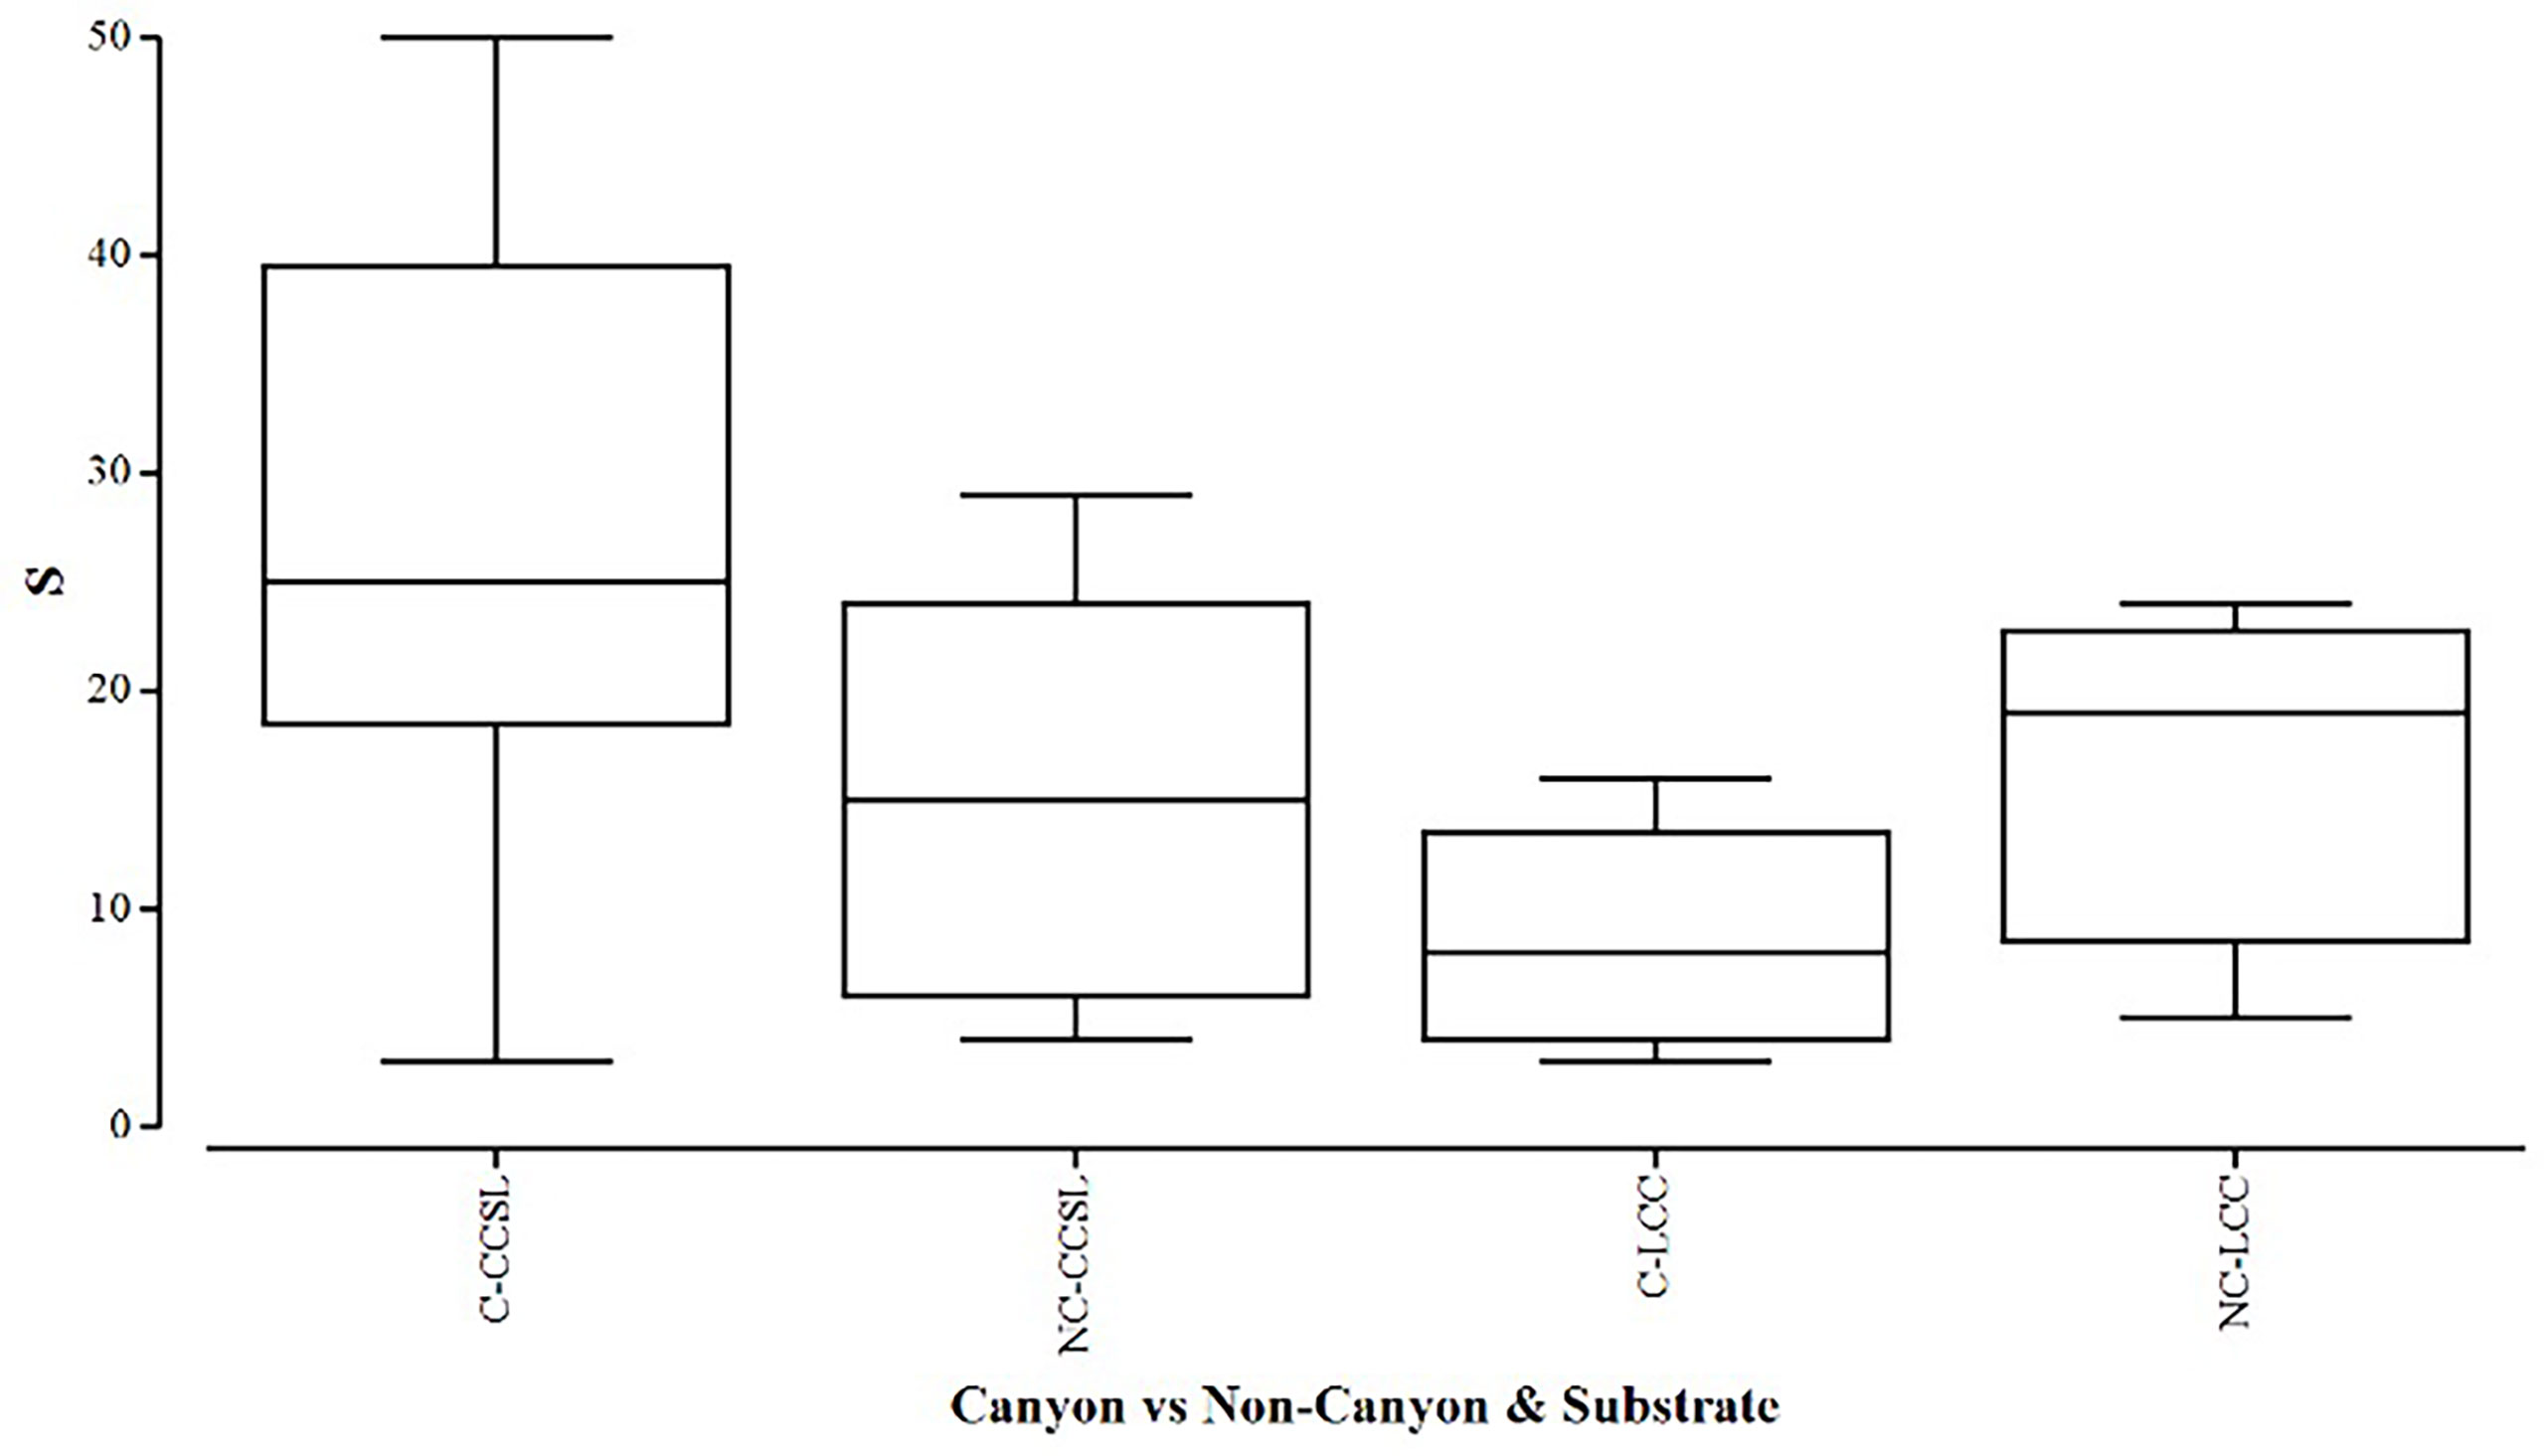
Figure 4 Box plot showing the species richness represented within each canyon (C) vs. non-canyon (NC) substrate type group: where CCSL, represents Calcareous clay, siltstone, limestone; and LCC, Limestone, Calcareous Clay.
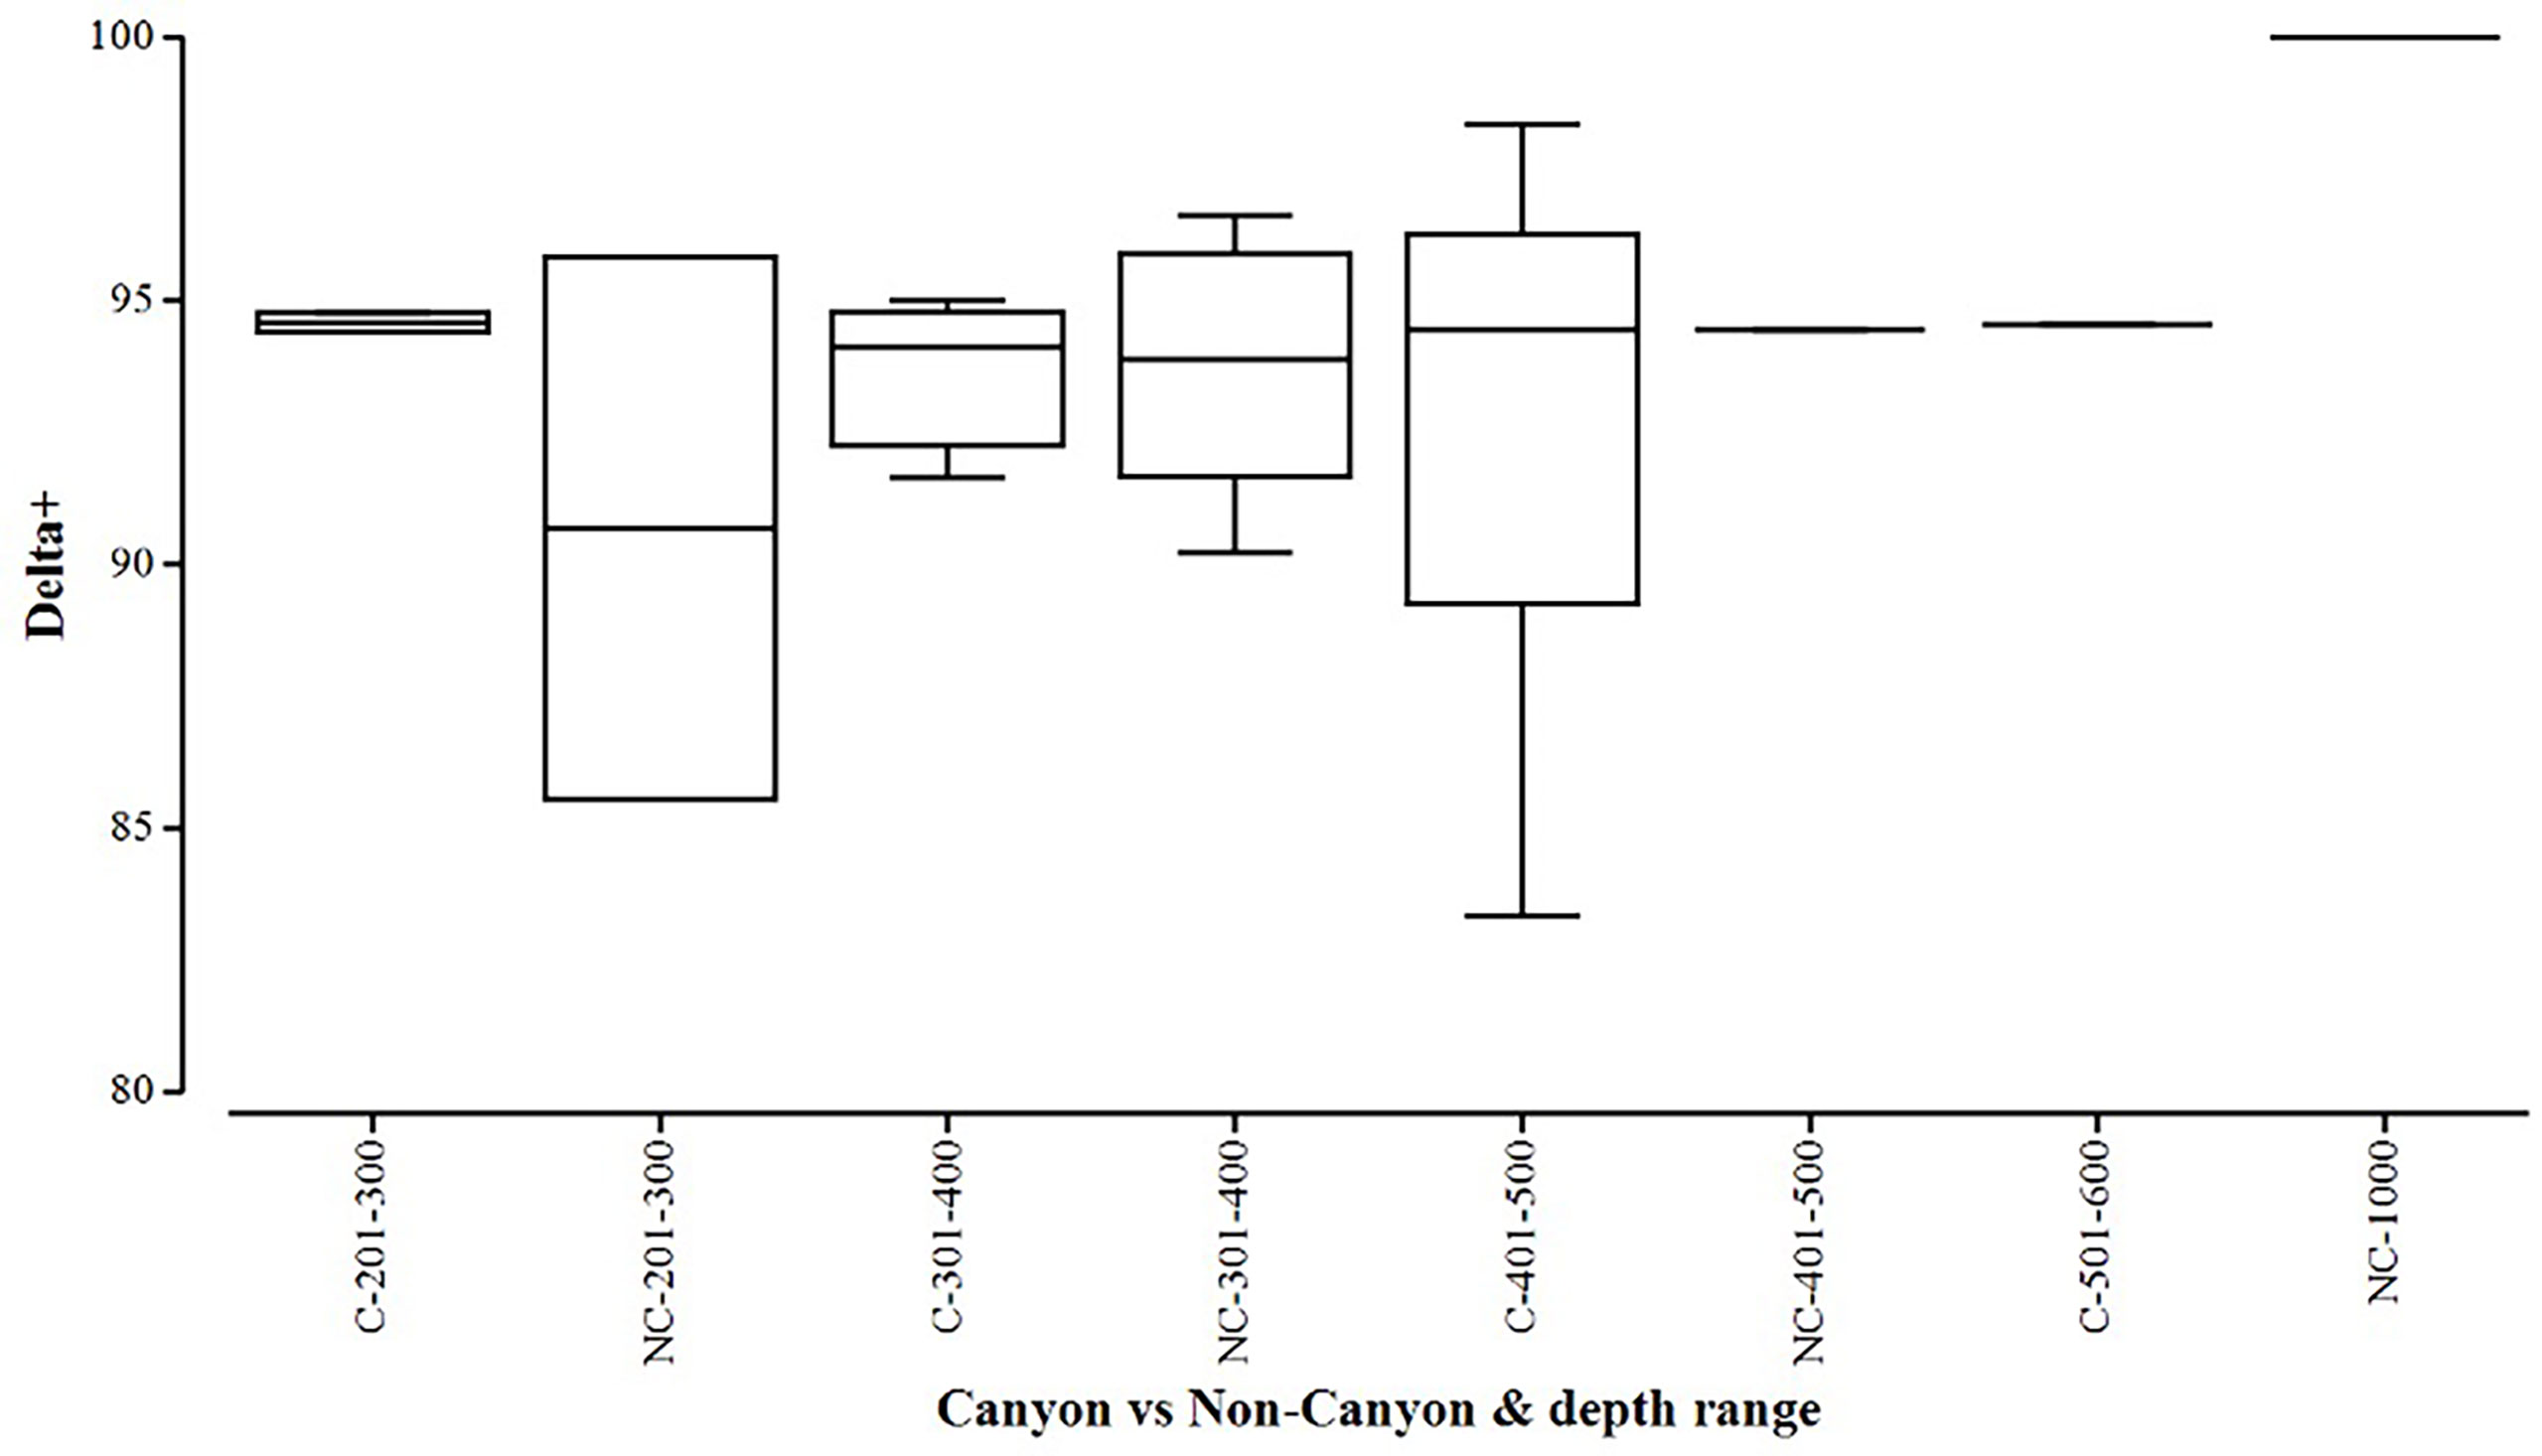
Figure 5 Box plot showing average taxonomic distinctiveness (denoted by delta+) represented within each canyon (C) vs. non-canyon (NC) depth class within the range of 201-1000 m.
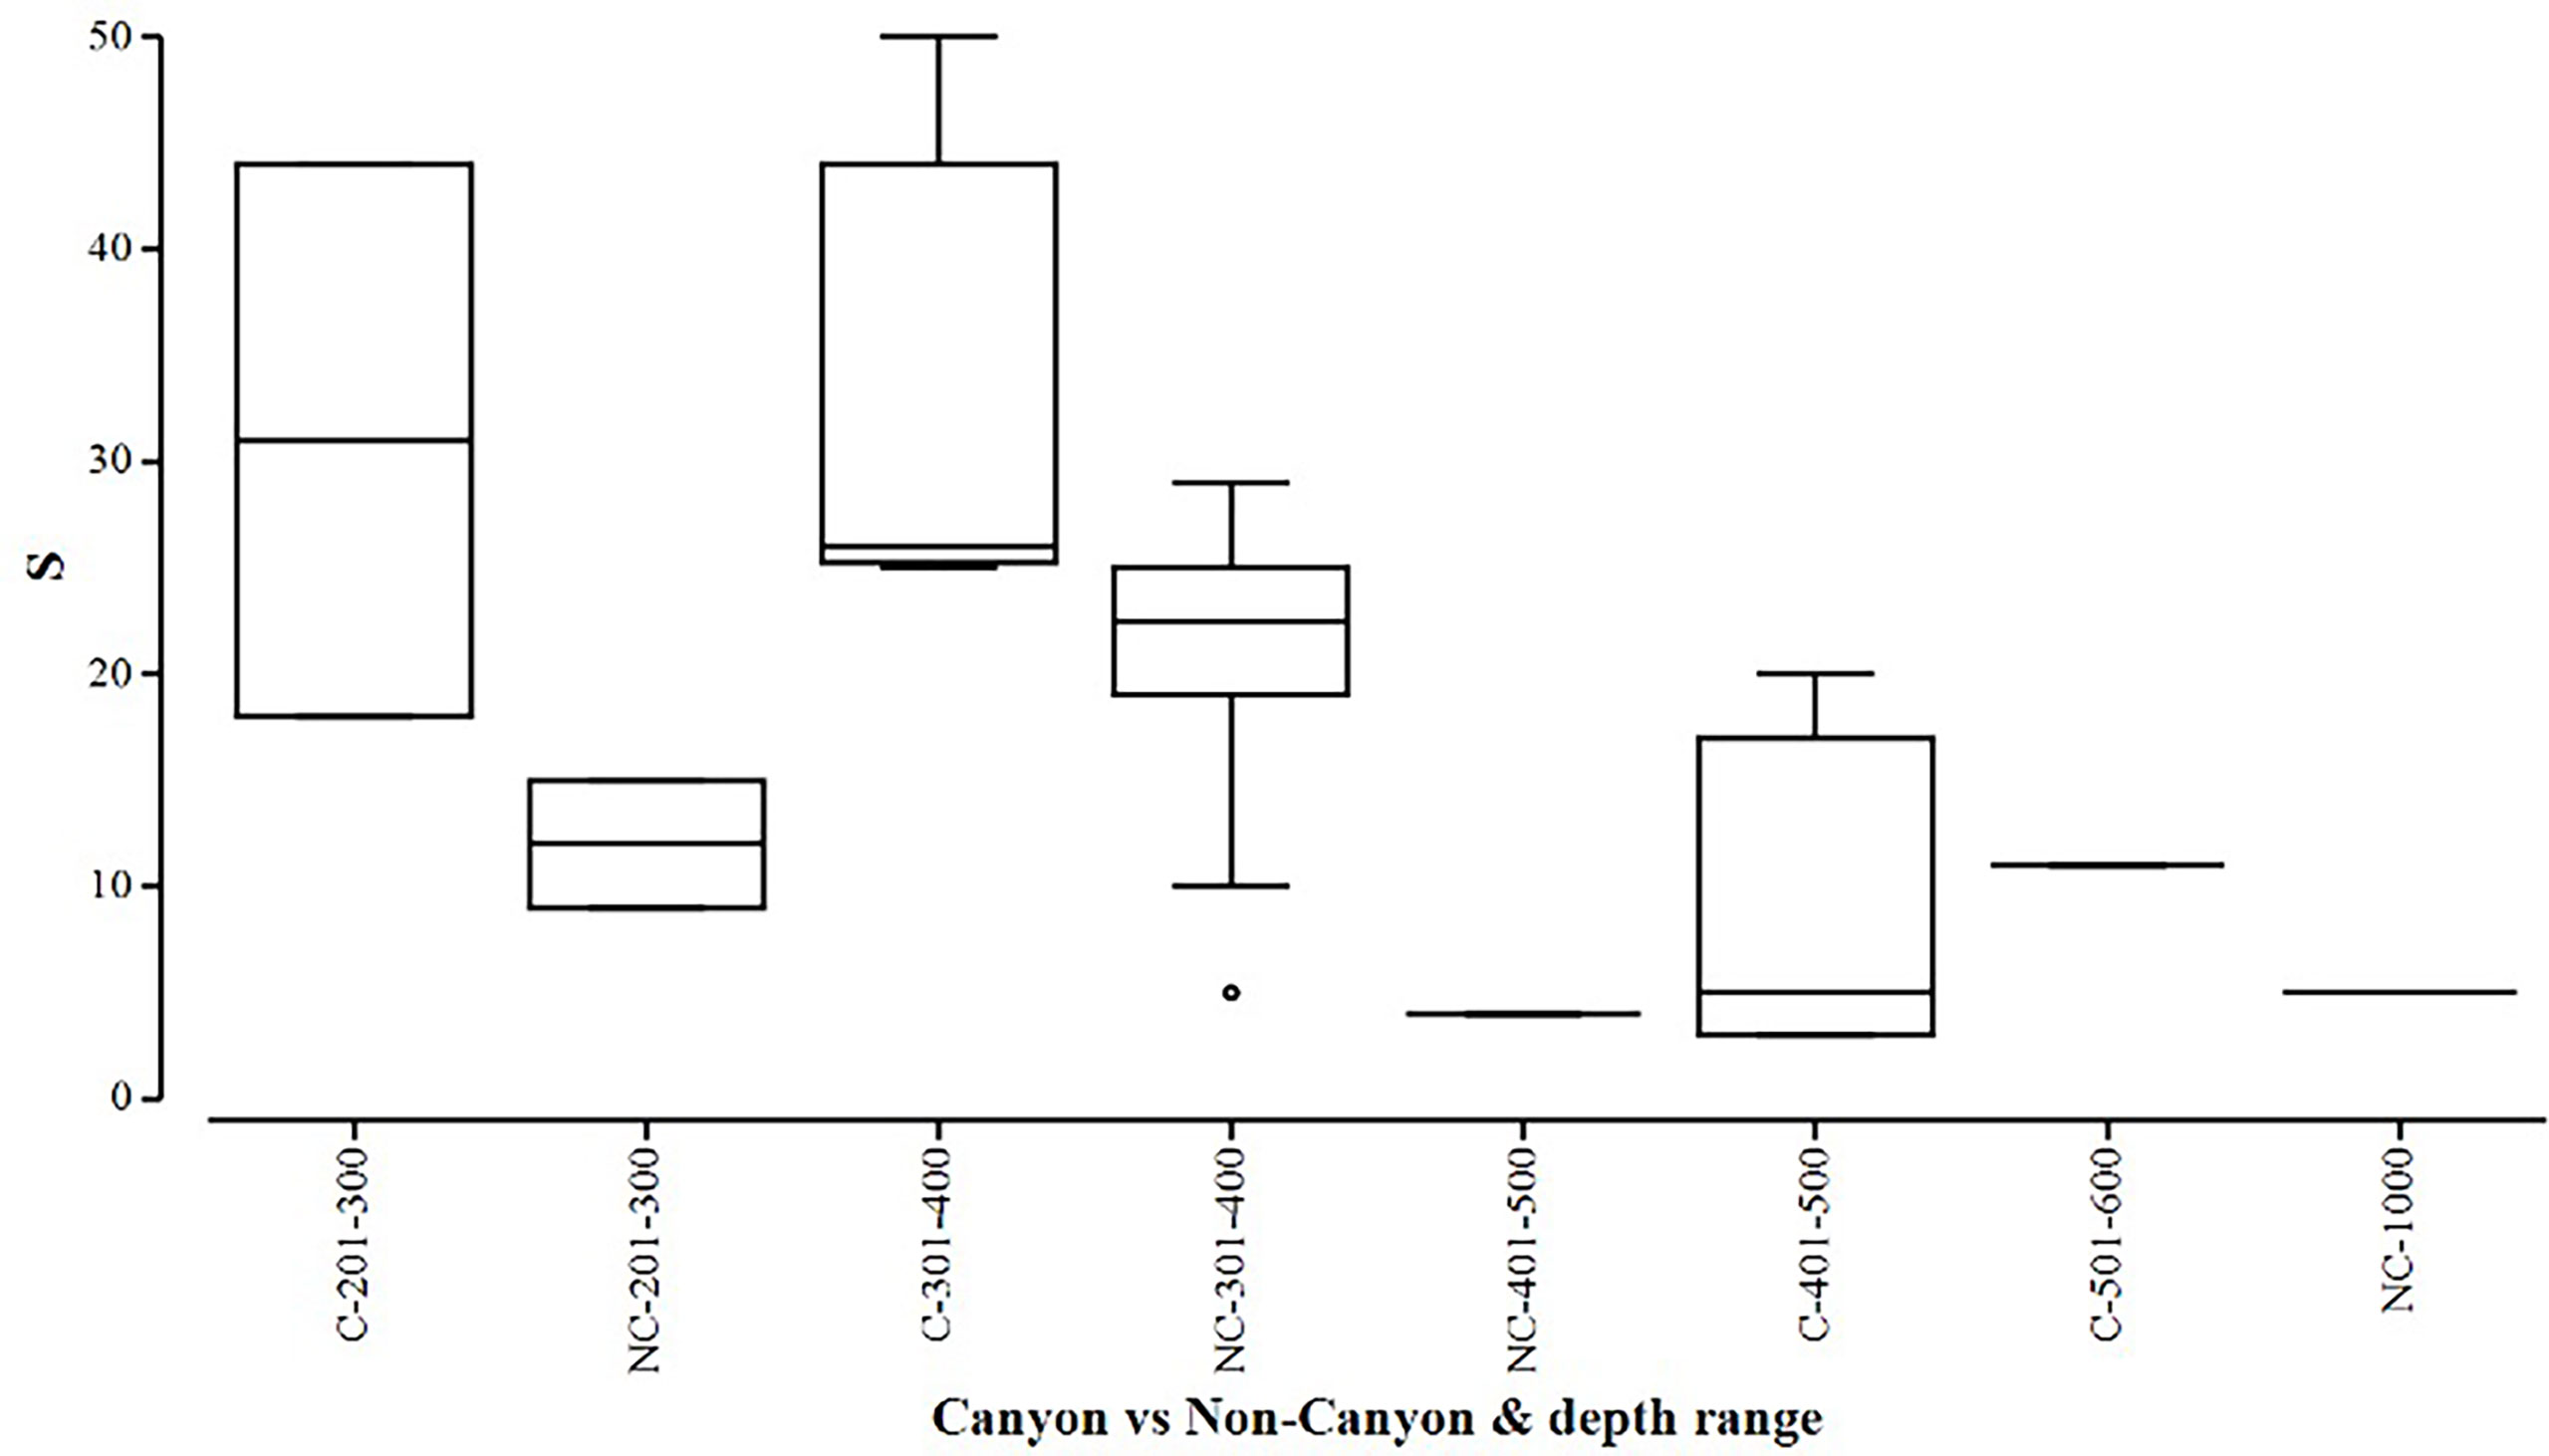
Figure 6 Box plot showing species richness (denoted by S) represented within each canyon (C) vs. non-canyon (NC) depth class within the range of 201-1000 m.
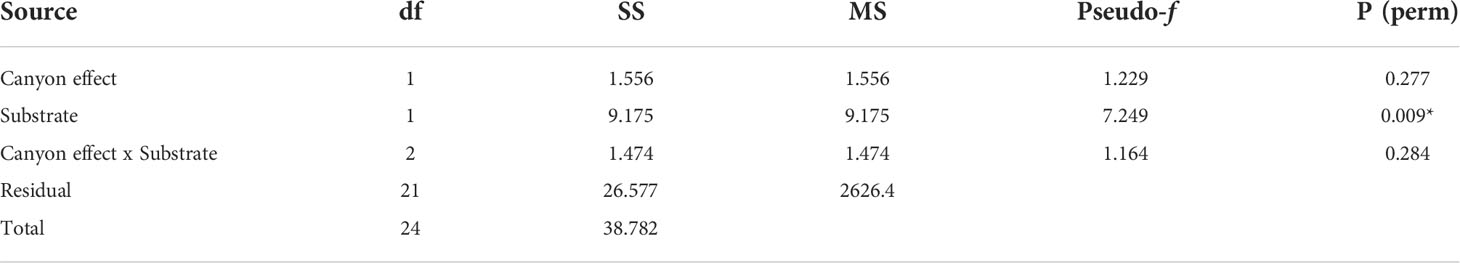
Table 1 PERMANOVA, Type1 (sequential) fixed effects on a permutation of residuals under a reduced model (9999 number of permutations), results of diversity measures in substrate groups represented in the canyon and non-canyon stations - where * shows significant values.
When comparing diversity measures between canyon and non-canyon stations across various depth classes (Figures 5, 6), diversity was highly variable in the 201-300 m depth range in which the canyon stations are represented in the higher quantile. Of note, is the consistently higher diversity in non-canyon sites up to the 401-500 m depth range. In this depth range (401-500 m) the canyon diversity measure peaks and is highly variable (Figure 5). Species richness patterns show an opposing trend, where richness was highest in canyon stations with increasing depth (Figure 6). The most variable richness measure was observed at the 201-300 m depth, in which canyon and non-canyon sites did not overlap. An outlier was evident at the 301-400 m non-canyon stations. The two-way PERMANOVA showed significant differences in diversity when comparing the depth ranges (DF=5, pseudo-F= 5.927, P(Perm)= 0.008) (Table 2).
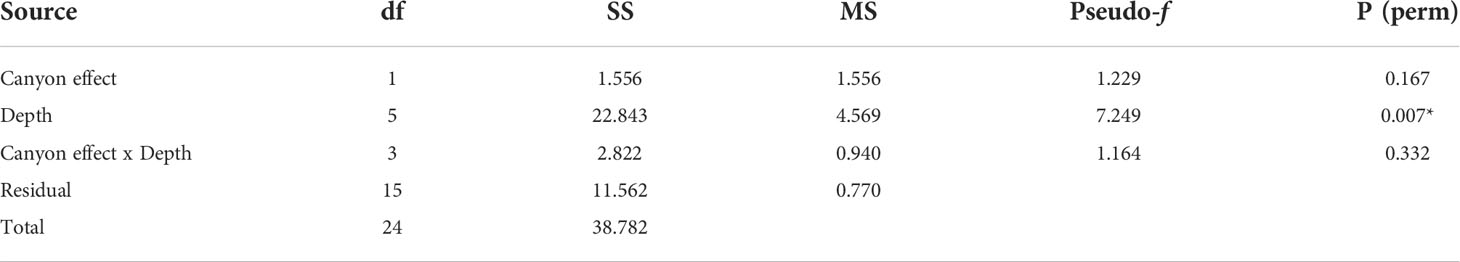
Table 2 PERMANOVA, Type1 (sequential) fixed effects on a permutation of residuals under a reduced model (9999 number of permutations), results of diversity measures in depth zones represented in the canyon and non-canyon stations - where * shows significant values.
The aggregated data confirmed that 11 phyla were unevenly distributed in the study area, three of which dominated (Arthropoda, Mollusca, and Echinodermata). Phyla additionally followed a depth gradient in which molluscs were abundant at 200-400 m, whilst echinoderms dominated the 401-500m depth range (Figure 7). A high number of arthropods were observed at 300-401 m, with depths deeper than 501 m showing a low number of species (less than 4) representing the three dominating phyla. SIMPROF results, superimposed on the shaded plot, gave two major distinctive groups at the various levels of similarity (Figure 7). The first cluster comprised of CCSL areas at 201-400 m, followed by larger group comprising of overlapping taxa across the two substrate types at a 401-1000m range. Interestingly, benthic profiles at 401-500 m formed a distinctive cluster irrespective of different substrates (Figure 7).
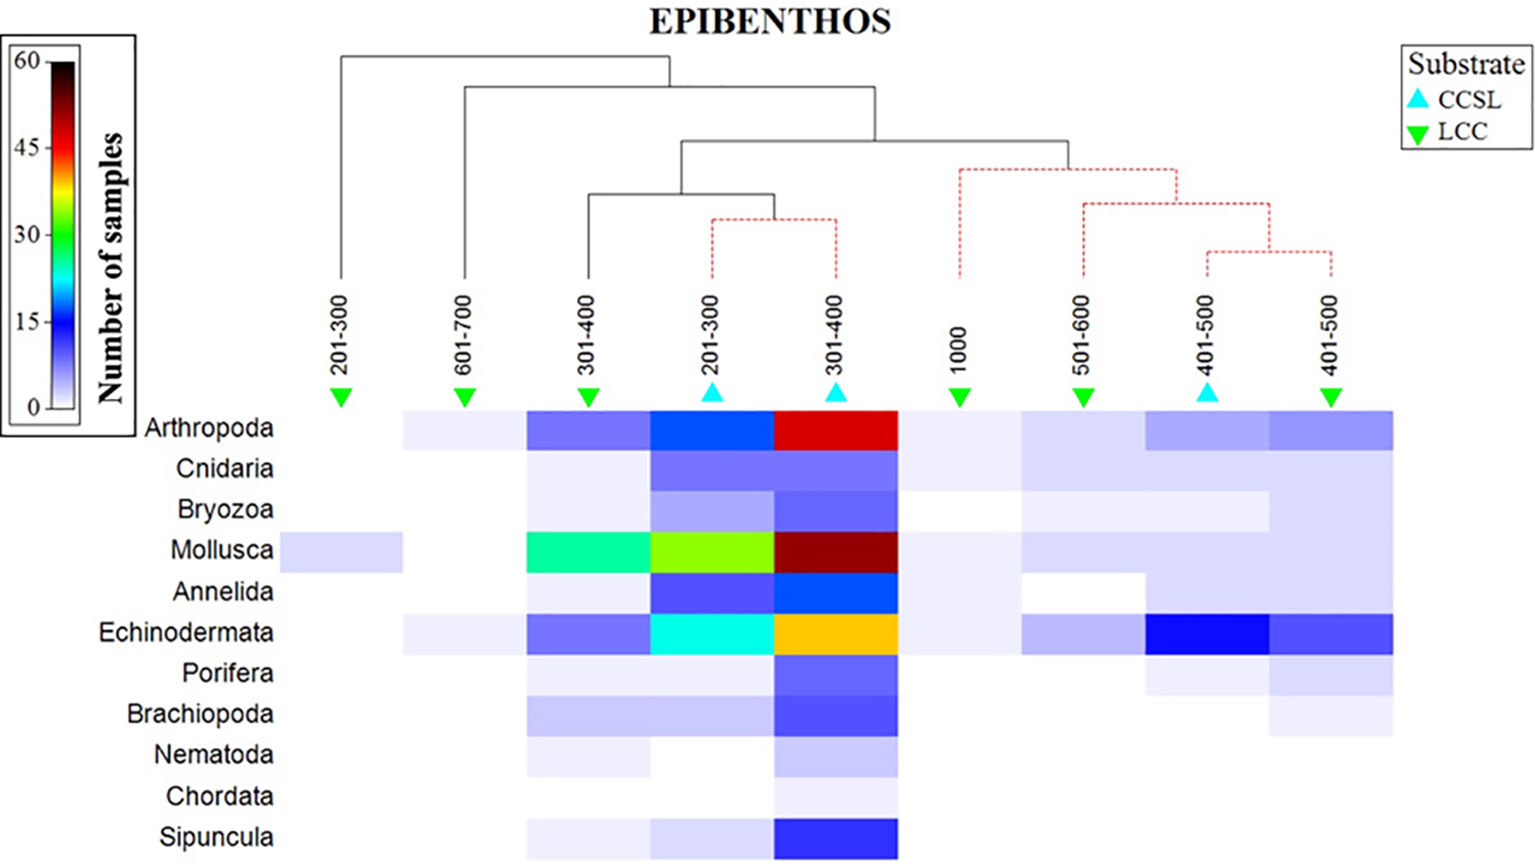
Figure 7 Shaded plot, superimposed with a SIMPROF cluster of the aggregated and summed Bray-Curtis resemblance matrix (square-rooted), showing the phyla represented in the depth and substrate groups.
3.2 Epibenthic patterns and potential environmental drivers
The non-metric MDS plot of the gamma+ resemblance matrix showed a separation between canyon and non-canyon stations, though a relatively high number of these are rather similar in species composition (Figure 8). Significant differences between the main effects were confirmed by the three-factor PERMANOVA, with canyon vs. non-canyon, depth, and substrate as fixed factors. These results indicated that the interaction of substrate and depth (DF=1, pseudo-F= 2.63, P(Perm)= 0.010), along with that of canyon vs. non-canyon and depth (DF=3, pseudo-F= 2.45, P(Perm)= 0.004), significantly contributed to the differences observed in the benthic patterns. Furthermore, all the main effects- canyon vs. non-canyon (DF=1, pseudo-F= 3.03, P(Perm)= 0.005), substrate (DF=1, pseudo-F= 2.99, P(Perm)= 0.006) and depth (DF=5, pseudo-F= 2.32, P(Perm)= 0.003) as individual factors significantly influenced benthic species profiles (Table 3, and Plate 1).
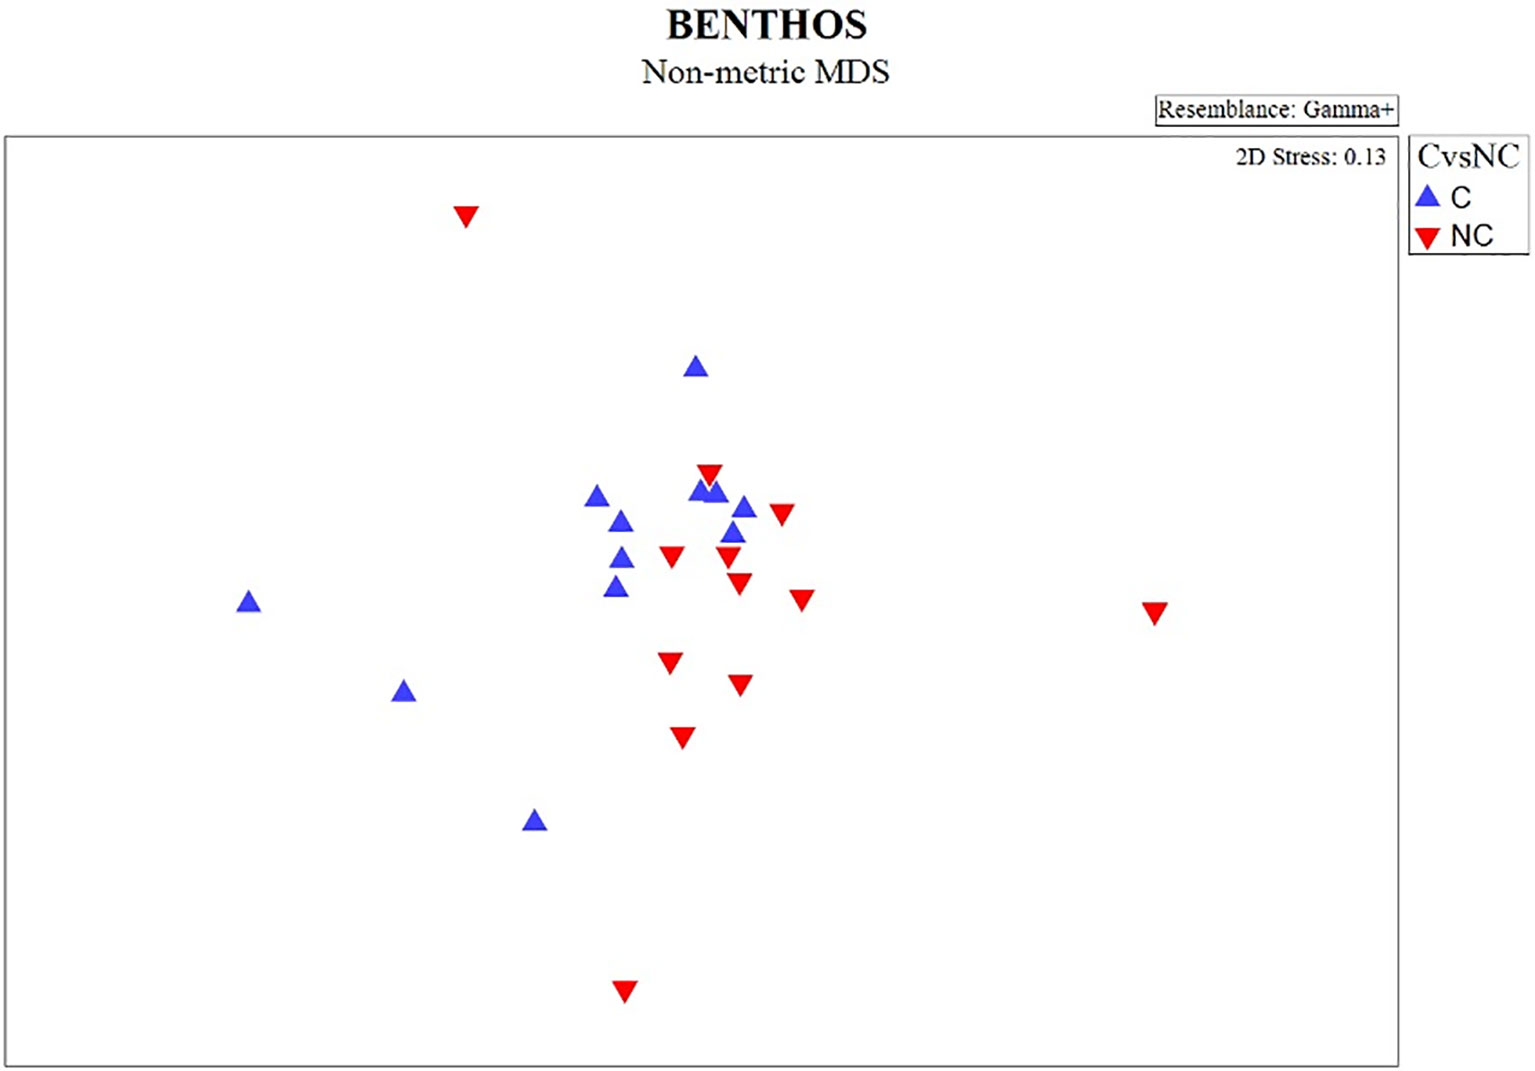
Figure 8 nMDS plot showing the gamma+ resemblance of benthic composition between canyon (C) and non-canyon (NC) stations.
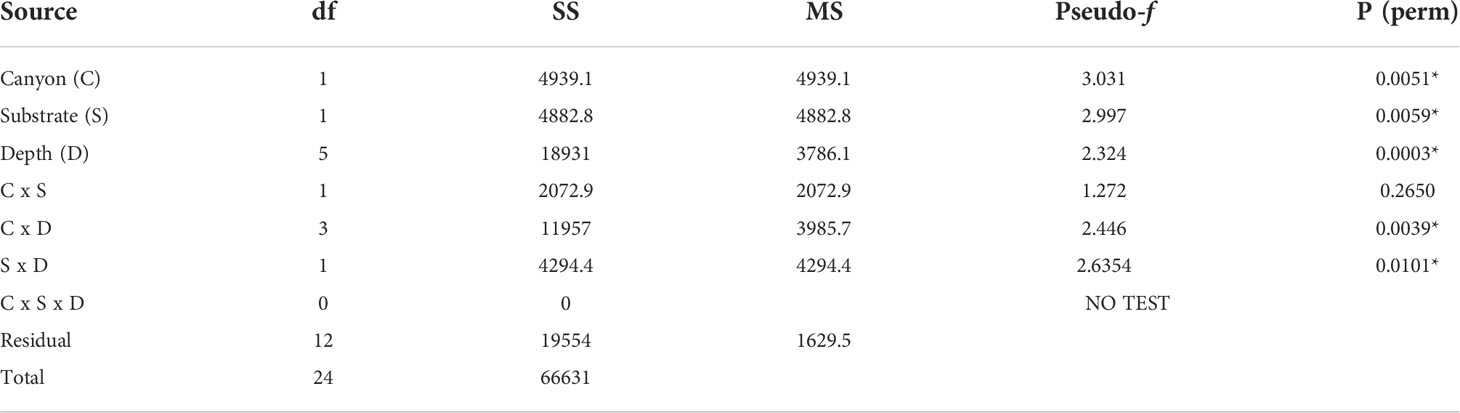
Table 3 PERMANOVA, Type1 (sequential) fixed effects on a permutation of residuals under a reduced model (9999 number of permutations), results of differences in benthic assemblages in canyon (canyon vs. non-canyon), substrate, and depth groups - where * shows significant values.
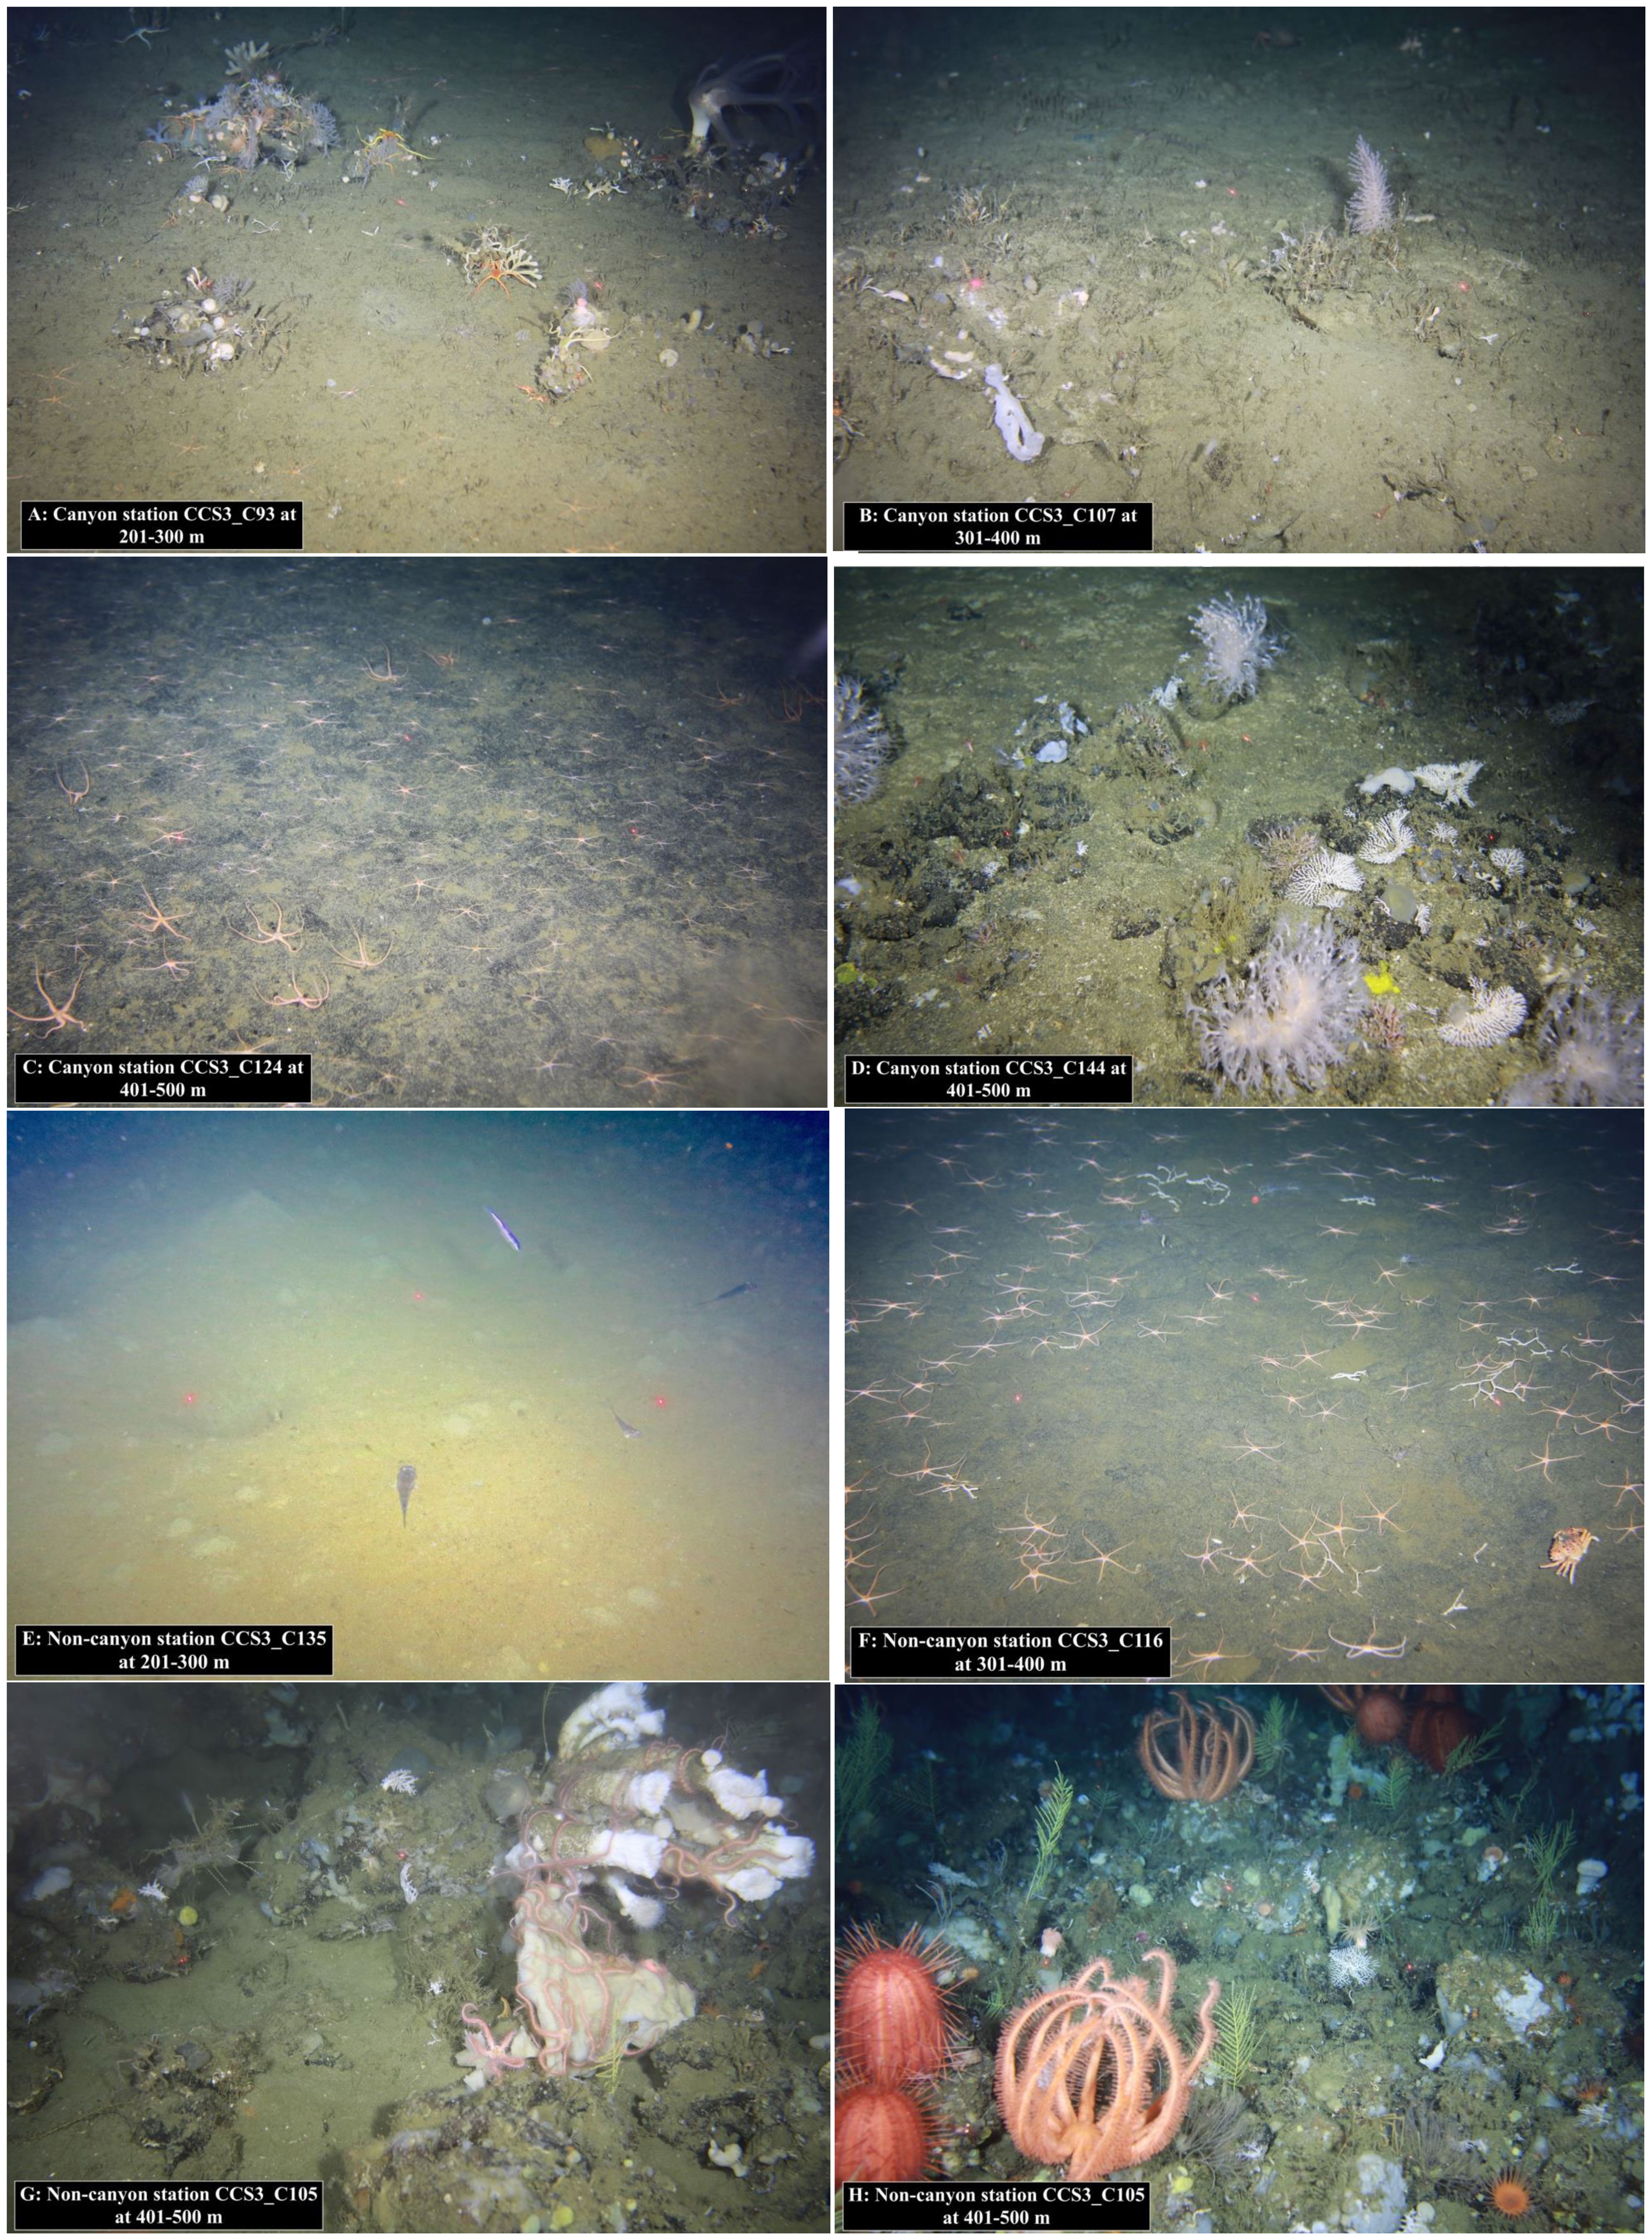
Plate 1 Examples of canyon (A–D) and non-canyon (E–H) habitats observed at a 201-500 m depth range.
SIMPER results (Supplementary: Data Sheet 1, SIMPER results) confirmed that both the canyon and non-canyon stations had variable species within each category (an average similarity being 10% and 11%, respectively). Three brittle stars (Ophiura (Ophiura) trimeni Bell, 1905, Ophiolycus dentatus (Lyman, 1878), Ophiothamnus remotus Lyman, 1878) and one crab (Dorhynchus thomsoni C. W. Thomson, 1873) contributed the most (< 6%) to canyon stations; whilst one sea urchin (Brissopsis lyrifera capensis Mortensen, 1907) and two bivalves (Lucinoma capensis and Limopsisbelcheri (Adams & Reeve, 1859)) were more dominant (> 12%) at non-canyon stations. When comparing the two groups, a higher number of species (13 species- Pasiphaea sp 1 Savigny, 1816, Neopilumnoplax heterochir (Studer, 1883), Hydrozoa sp 3 Owen, 1843, Ophiothrix fragilis (Abildgaard in O.F. Müller, 1789), Hemiocnus insolens (Théel, 1886), Ophiactis carnea Ljungman, 1867, Parapontophilus gracilis (Smith, 1882), Tanaididae sp Nobili, 1906, Miersiograpsus kingsleyi (Miers in Tizard et al., 1885), Onchoporella bombycina Bock, 2022, Kraussinidae sp Dall, 1870, Sipuncula sp 2 Stephen, 1965, Parapagurus bouvieri Stebbing, 1910) occurred exclusively at canyon stations, whilst only three species (Virgularia sp 1 Lamarck, 1816, Asychis sp 1 Kinberg, 1867, Mursia cristata H. Milne Edwards, 1834–1940) characterized non-canyon stations. Overall, species observed in both canyon and non-canyon areas exhibited varying numbers of feeding techniques, in which the non-canyon areas had a higher feeding method to species ratio (canyon = 0.23 vs. non-canyon areas = 0.66). Suspension feeders were represented in both canyon vs. non-canyon areas. In addition, mobile species exhibiting deposit feeding and scavenger techniques (N. heterochir, P. bouvieri) were observed in canyon areas, whilst a detritus feeder/predator/scavenger combination (M. cristata) was noted in non-canyon areas.
4 Discussion
Although our results showed no significant diversity differences between canyon and the surrounding non-canyon areas, significant differences (p-value > 0.04) between the substrate types and depth zones were clearly observed. The absence of a significant difference between canyon and non-canyon stations, is likely attributed to the homogenous environment observed in both areas, in which identical substrate classes were recorded. Additionally, the overall upwelling characteristics of the Benguela region are known to generally harbor low diversity, but high biomass species profiles (Lange, 2012). Thus, even though large-scale spatio-temporal variations in upwelling patterns exist (Lamont et al., 2018), the fact that upwelling takes place along and across the entire shelf results in more or less uniform environmental conditions in the bottom layers, especially in the mid-shelf to offshore regions. This may limit spatial variability in the benthos unless different substrates are present. The unbalanced dataset provided limited replicates for each factor (i.e., substrate within depth classes), which may also have also contributed to the lack of the canyon effect. Whilst the samples collected at a depth range of 401-500 m clustered together irrespective of the different substrate types, the distinctively different diversity profiles (both species richness and average taxonomic distinctiveness) between substrate class are in line with the well-established theory that sediment characteristics influence species patterns (Levin et al., 2001; Ramirez-Llodra et al., 2010; Lins et al., 2016). Thus, despite the two classes being predominantly unconsolidated, there is variability in the grain size of classes. Using lithology classes as a substrate proxy should nonetheless also be considered in this pattern and therefore better substrate classifications may yield different results.
In terms of depth gradients, the increase of species richness (S) in the 200-400 m depth range agrees with previous local studies (Lange, 2012) that observed highest richness at depths of 300-399 m. Our results, however, contrast with the Duffy et al. (2014) submarine canyon observations of species richness steadily increasing with depth between 200-700 m. This may be an artifact of the low number of samples (n < 11) represented in the 501-700 m range, as species richness is dependent on sampling effort (Clarke and Warwick, 1998; 1999; Bevilacqua et al., 2021). The average taxonomic distinctiveness index (delta +), on the other hand, showed a fluctuation and opposing trend, whereby the lowest measure was identified at 201-300 m (the second most speciose depth) and the highest at 601-1000 m (least species richness). In other words, the 200-300 m depth range encompasses a higher number of distantly related species across six taxonomic families and can be considered as highly diverse as opposed to the 601-1000 m zone which constitutes five families with one species recorded. The properties of average taxonomic distinctiveness are unbiased by sampling effort (Clarke and Warwick, 1998; 1999) and are therefore demonstrated by this inverse relationship between the delta+ and S measures. Irrespective, the observed gradual decrease in diversity at 401-1000 m in our results agrees with the previous accounts of depth-dependent diversity patterns (Hernández-Ávila et al., 2018; Levin et al., 2001). Such a pattern is linked to food availability, amongst other variables, and the change in depth-related parameters (e.g., temperature) in deeper environments (Howell et al., 2002; Ramirez-Llodra et al., 2010) which may in turn influence other processes (e.g., resource partitioning) (Levin et al., 2001).
Despite the comparatively insignificant differences in diversity measures between canyon vs. non-canyon areas, a clear variation in the benthic species profiles was observed. Canyon areas were defined by higher species richness and diversity as compared to non-canyon areas. Even though sampling biases occurred, the use of gamma+ as the basis of testing multivariate responses to predictor variables accounted for this by considering taxonomic relationships of species at all levels (Clarke et al., 2006; Bevilacqua et al., 2021). Nonetheless, high species variability at both the canyon and non-canyon stations was documented in which taxonomic groups discriminating the comparison were present. These distinguishing species represent overlapping and diverse feeding modes, with three feeding strategies being exhibited by the 13 species characteristic of canyon areas, whilst the three non-canyon species deployed only two feeding strategies. The latter consequently represents a higher feeding method to species ratio. It is however worth noting that the mode categorizations were adopted from a range of sources (MacDonald et al., 2010; Demopoulos et al., 2017; Puccinelli et al., 2018; O’Hara, pers comm; Marine Species Traits editorial board, 2022) which may not be a true reflection of local feeding patterns. Nonetheless, converging presence of suspension feeders noted in both canyon (ophiuroids, holothuroids, and bryozoans) and non-canyon stations (one octocoral and a polychaete) may be driven by the overall upwelling conditions of the Benguela region. An even number of suspension feeders were observed in both canyon and non-canyon areas, thereby further demonstrating the masking effect of the wide-spread eutrophic characteristic of the region.
In addition, the overlapping presence of mobile scavengers in the study domain may be a result of the dynamic natural environmental regimes driving continuous sediment movement (e.g., upwelling/downwelling processes and sedimentary funneling). Furthermore, anthropogenic activities such as demersal trawling have a historical footprint that dates to the 19th century. However, it was only in the 1921 that the commercial offshore enterprise kicked off (Sink et al., 2012). Such impacts, alongside offshore diamond mining and petroleum activities, within the Cape Canyon vicinity (Atkinson et al, 2011; Sink et al., 2019), may also be influencing the feeding behavior and biological distribution patterns. However, the lack of benthic species data prior to the onset of trawling makes it impossible to determine this with any certainty. In essence, the correlation between environmental variation and biota is difficult to measure in the presence of other human-induced activities. Apart from these superimposed non-linear relationships, the benthic patterns are a result of a longer time scale which may not necessarily be reflected in the oceanographic bottom profiles averaged over 3 years. Irrespective, substrate type and depth collectively underpin the heterogeneity of the study area. It therefore comes as no surprise that benthic assemblages have responded to these predictor variables (in addition to the canyon effect). The significant canyon-depth along with the depth-substrate interaction results complement the findings of Mello-Rafter et al. (2021) who identified salinity, depth, and substrate to be environmental conditions that shaped submarine canyon benthic assemblages.
The work presented here therefore represents one of the first detailed studies documenting the benthic biology of the Cape Canyon, a feature extending 200 km offshore and reaching the abyss (~3 km deep), located within the Benguela upwelling system off the South African western margin. The study tested the hypothesis that significant differences in benthic diversity should be observed within submarine canyon ecosystems, as compared to the surrounding shelf habitats. Whereas the unbalanced and homogenous nature of the study area prevented significant diversity differences between canyon and non-canyon sites, we confirmed that different benthic patterns characterize the Cape Canyon compared to the surrounding shelf areas, for which depth and substrate type were indeed significant predictors of benthic distributional patterns. In addition, we have demonstrated the importance of accounting for taxonomic relationships when exploring diversity gradients. The application of taxonomic measures (e.g., average taxonomic distinctiveness and taxonomic dissimilarity matrix), that are independent of sampling biases, gave way to understanding taxonomic lineages in relation to biological profiles. Our analysis therefore principally serves as a baseline towards understanding the ecological function of the Cape Canyon in relation to its surrounding areas. We therefore recommend future quantitative studies to build on these findings and apply biodiversity frameworks which consider abundance and biomass indices. The refinement of substrate classifications is also of research gap that warrants attention.
Data availability statement
The original contributions presented in the study are included in the article/Supplementary Material. Further enquiries should follow the formal data request avenues, atZGF0YUBvY2Vhbi5nb3YuemEs as per the South African Promotion of Access to Information Act.
Ethics statement
Ethical approval was not required for the collection of samples as per the section 83 of the Marine living resources Act, 1998 (ACT NO. 18 OF 1998) permit conditions highlighted in RES2016/DEA, RES2017/83-DEA, and RES2018/89-DEA.
Author contributions
ZF and TL conceptualized project and sampling design. ZF and HC processed the biological data and bathymetry data; respectively. TL validated oceanographic data. HC created all the maps. ZF and AS conducted the analysis and drafted the results and methodology section. ZF drafted the full version of manuscript. All authors contributed to the revision of the full manuscript and have approved submission to journal.
Funding
This was project funded by the Department of Environmental Affairs: DEA (now merged to Department of Forestry, Fisheries, and Environment) and the at-sea expeditions were supported under the Operation Phakisa Research surveys (cruise identification: ALG225 (March 2016); ALG236 (March 2017); ALG247 (March 2018).
Acknowledgments
We would like to thank Dr Sandra Brook (Florida State University: Coastal and Marine Lab) for her support and guidance in tow-camera sampling techniques. Prof Kerry Sink (SANBI) and Dr Lara Atkinson (SAEON) for expedition planning advice on the first survey in 2016. Prof Amanda Lombard (Nelson Mandela University) and Dr Lauren Williams (Department of Fisheries, Forestry, and Environment) are recognized for the ArcGIS technical assistance. The at-sea technical support provided by Mr Marcel van den Berg, Mr Mfundo Lombi, Mr Mbulelo Makhetha, Mr Gavin Tutt, Mr Gavin Louw, Mr Leon Jacobs, Mr Baxolele Mdokwana, and Mr Laurenne Snyders (Department of Forestry, Fisheries and Environment), all of which are co-authors for data analyzed herein, was instrumental throughout the project. This three-year multi-disciplinary research expedition, which forms the basis of this study, would have not been possible without the African Marine Solutions crew members onboard the R/V Algoa and all cruise participants. Taxonomic inputs and species associated knowledge was provided by Dr David Herbert (Department of Natural Sciences, National Museum Wales), Prof Charles Griffiths (University of Cape Town), Dr Christopher Mah (Department of Invertebrate Zoology, Smithsonian Institution), Dr Timothy O’Hara (Museum Victoria Museum: Australia), Dr Jennifer Olbers (WildTrust), Ms Robyn Payne (Anchor Environmental), Dr Jannes Landschoff (Sea Change), and Mr Dylan Clark (Research and Exhibitions Department, Iziko South African Museum), and therefore authorship of the associated biological data is granted. Dr Carl Palmer (Alliance of Collaboration in Climate and Earth System Science), Dr Jeroen Ingels (Florida State University: Coastal and Marine Lab), and Prof Marti Anderson (PRIMER-e. Quest Research Limited) are acknowledged for proof-reading earlier manuscript drafts. Mr Carlos Fonseca (OceanX) is thanked for the thought provoking conversations, in the early days of drafting this manuscript. The reviewers are also thanked for their input, which has improved the overall manuscript.
Conflict of interest
Dr. AS was employed by PRIMER-e. Quest Research Limited during the initial drafting of this manuscript.
The remaining authors declare that the research was conducted in the absence of any commercial or financial relationships that could be construed as a potential conflict of interest.
Publisher’s note
All claims expressed in this article are solely those of the authors and do not necessarily represent those of their affiliated organizations, or those of the publisher, the editors and the reviewers. Any product that may be evaluated in this article, or claim that may be made by its manufacturer, is not guaranteed or endorsed by the publisher.
Supplementary material
The Supplementary Material for this article can be found online at: https://www.frontiersin.org/articles/10.3389/fmars.2022.1025113/full#supplementary-material
Supplementary Figure 1 | Plot showing the bottom temperature (°C) gradient in relation to the Cape Canyon, where 100 m isobaths distinguish the canyon from surrounding areas. Dataset is representative of the averaged bottom temperature measured on the 2016, 2017, and 2018 surveys.
Supplementary Figure 2 | Comparison between the (A, C). Gridded split-beam bathymetric data collected for this study and (B, D). de Wet (2013) gridded regional bathymetry. (A) Gridded using the Kriging statistical method, with a node spacing of 0.33 decimal degrees. (C) Frame A. close-up of the Cape Canyon and surrounding shelf areas. (B) de Wet (2013) bathymetry clipped to the same blanking file used on the Cape Canyon dataset. (D) Frame (B). close-up of the Cape Canyon and surrounding shelf area.
References
Adams A., Reeve L. A.. (1848–1850) Mollusca. The zoology of the voyage of H.M.S. Samarang, under the command of Captain Sir Edward Belcher, C.B., F.R.A.S., F.G.S., during the years 1843-1846Adams A. (x + 87 pp., 24 pls. [Pt. I. Preface to Mollusca (iii–x, by Adams only), 1–24, pls. 1–9, 1 November 1848; Pt. II, 25–44, pls. 10–17, 1 May 1850; Pt. III, Preface and plate explanations (i-xv), 45–87, pls. 18–24, 1 September 1850.].) Reeve & Benham, London, available online at https://www.biodiversitylibrary.org/page/39770936
Allen S. E., Durrieu De Madron X. (2009). A review of the role of submarine canyons in deep-ocean exchange with the shelf’. Ocean Sci. 5 (4), 607–620. doi: 10.5194/os-5-607-2009
Anderson M. J. (2001). A new method for non-parametric multivariate analysis of variance. Austral Ecol. 26 (1), 32–46. doi: 10.1111/j.1442-9993.2001.01070.pp.x
Anderson M. J., Gorley R. N., Clarke K. R. (2008). PERMANOVA+ for PRIMER: guide to software and statistical methods (Plymouth, UK: PRIMER-E).
Atkinson L. J., Field J. G., Hutchings L. (2011). Effects of demersal trawling along the west coast of southern Africa: multivariate analysis of benthic assemblages. Mar. Ecol. Prog. Ser. 430, 241–255. doi: 10.3354/meps08956
Atkinson L. J., Sink K. J. (2018). Field guide to the offshore marine invertebrates of South Africa. Malachite Marketing and Media: Pretoria. 498. doi: 10.15493/SAEON.PUB.10000001
Bang N. D. (1968). Submarine canyons off the natal coast. South Afr. Geographical J. 50 (1), 45–54. doi: 10.1080/03736245.1968.10559431
Barlow R., Lamont T., Louw D., Gibberd M. J., Airs R., van der Plas A. (2018). Environmental influence on phytoplankton communities in the northern benguela ecosystem. Afr. J. Mar. Sci. 40 (4), 355–370. doi: 10.2989/1814232X.2018.1531785
Bertolino M., Ricci S., Canese S., Cau A., Bavestrello G., Pansini M., et al. (2019). Diversity of the sponge fauna associated with white coral banks from two sardinian canyons (Mediterranean Sea). J. Mar. Biol. Assoc. United Kingdom 99 (8), 1735–1751. doi: 10.1017/S0025315419000948
Bevilacqua S., Anderson M. J., Ugland K. I., Somerfield P. J., Terlizzi A. (2021). The use of taxonomic relationships among species in applied ecological research: Baseline, steps forward and future challenges. Austral Ecol. 46 (6), 950–964. doi: 10.1111/aec.13061
Bianchelli S., Danovaro R. (2019). Meiofaunal biodiversity in submarine canyons of the Mediterranean Sea: A meta-analysis, progress in oceanography. Elsevier 170 (October 2018), 69–80. doi: 10.1016/j.pocean.2018.10.018
Birch G. F. (1975). Sediments on the continental margin off the west coast of south Africa [Doctoral dissertation] ([South Africa]: University of Cape Town).
Bock P. (2022). World List of Bryozoa. Onchoporella bombycina Busk 1884. Available at: https://www.marinespecies.org/aphia.php?p=taxdetails&id=1429790 on 2022-11-07
Clarke K. R., Gorley R. N., Somerfield P. J., Warwick R. M. (2014). Change in marine communities: an approach to statistical analysis and interpretation. Primer-E Ltd. 256.
Clarke K. R., Somerfield P. J., Chapman M. G. (2006a). On resemblance measures for ecological studies, including taxonomic dissimilarities and a zero-adjusted bray–Curtis coefficient for denuded assemblages. J. Exp. Mar. Biol. Ecol. 330 (1), 55–80. doi: 10.1016/j.jembe.2005.12.017
Clarke K. R., Warwick R. M. (1998). A taxonomic distinctness index and its statistical properties. J. Appl. Ecol. 35 (4), 523–531. doi: 10.1046/j.1365-2664.1998.3540523.x
Clarke K. R., Warwick R. M. (1999). The taxonomic distinctness measure of biodiversity: weighting of step lengths between hierarchical levels. Mar. Ecol. Prog. Ser. 184, 21–29. doi: 10.3354/meps184021
Compton J. S., Mulabisana J., McMillan L. K. (2002). Origin and age of phosphorite from the last glacial maximum to Holocene transgressive succession off the orange river, south Africa. Mar. Geology 186, 243–261. doi: 10.1016/S0025-3227(02)00211-6
Dall W. H. (1870). A revision of the terebratulidae and lingulidae, with remarks on and descriptions of some recent forms. Am. J. Conchology 6 (2), 88–168. https://www.biodiversitylibrary.org/page/6991665.
Department of Environmental Affairs (2019). National Gazette No 42478 of 23-May, 647. Available at: https://cer.org.za/wp-content/uploads/2019/05/MPA-declarations.pdf
De Leo F. C., Smith C. R., Rowden A. A., Bowden D. A., Clark M. R. (2010). Submarine canyons: Hotspots of benthic biomass and productivity in the deep sea. Proc. R. Soc. B: Biol. Sci. 277 (1695), 2783–2792. doi: 10.1098/rspb.2010.0462
De Leo F. C., Vetter E. W., Smith C. R., Rowden A. A., McGranaghan M. (2014). Spatial scale-dependent habitat heterogeneity influences submarine canyon macrofaunal abundance and diversity off the main and Northwest Hawaiian islands. Deep Sea Res. Part II: Topical Stud. Oceanography 104, 267–290. doi: 10.1016/j.dsr2.2013.06.015
Demopoulos A. W., McClain-Counts J., Ross S. W., Brooke S., Mienis F. (2017). Food-web dynamics and isotopic niches in deep-sea communities residing in a submarine canyon and on the adjacent open slopes. Mar. Ecol. Prog. Ser. 578 (Elton 1927), 19–33. doi: 10.3354/meps12231
de Wet W. M., Compton J. S. (2021). Bathymetry of the South African continental shelf. Geo-Mar ine Letters 41, 40. doi: 10.1007/s00367-021-00701-y
de Wet W. M. (2013). Bathymetry of the south African continental shelf. [Masters thesis] ([South Africa]: University of Cape Town. South Africa). Available at: http://hdl.handle.net/11427/28970.
Di Bella L., Pierdomenico M., Porretta R., Chiocci F. L., Martorelli E. (2017). “Living and dead foraminiferal assemblages from an active submarine canyon and surrounding sectors: the gioia canyon system (Tyrrhenian Sea, southern Italy),” in Deep-Sea research part I: Oceanographic research papers, vol. 123. (Elsevier Ltd), 129–146. doi: 10.1016/j.dsr.2017.04.005
Dingle R. V. (1973). Regional distribution and thickness of post-Palaeozoic sediments on the continental margin of southern Africa. Geological Magazine 110 (2), 97–102. doi: 10.1017/S001675680004783X
Dingle R. V. (1979). Sedimentary basins and basement structures on the continental margin of southern Africa. Bull. Geological Survey South Afr. 63, 29–43.
Dingle R. V., Siesser W. G. (1975). Geology of the continental margin between Walvis bay and ponta do ouro (Government Printer).
Dingle R. V., Birch G. F., Bremner J. M., De Decker R. H., Du Plessis A., Engelbrecht J. C., et al (1987). Deep-sea sedimentary environments around southern Africa (south- east Atlantic and south-west Indian Oceans). Annals of the South African Museum, 98, 1–27
Dingle R. V., Siesser W. G., Newton A. R. (1983). Mesozoic and tertiary geology of southern Africa (Rotterdam: AA Balkema).
Duffy G. A., Lundsten L., Kuhnz L. A., Paull C. K. (2014). A comparison of megafaunal communities in five submarine canyons off southern California, USA. Deep Sea Res. Part II: Topical Stud. Oceanography 104, 259–266. doi: 10.1016/j.dsr2.2013.06.002
Du Plessis A., Scrutton R. A., Barnaby A. M., Simpson E. S. W. (1972). Shallow structure of the continental margin of southwestern Africa. Mar. Geology 13 (2), 77–89. doi: 10.1016/0025-3227(72)90047-3
Duros P., Jorissen F. J., Cesbron F., Zaragosi S., Schmidt S., Metzger E., et al. (2014). Benthic foraminiferal thanatocoenoses from the cap-ferret canyon area (NE atlantic): a complex interplay between hydro-sedimentary and biological processes. Deep Sea Res. Part II: Topical Stud. Oceanography 104, 145–163. doi: 10.1016/j.dsr2.2013.09.024
Fernandez-Arcaya U., Ramirez-Llodra E., Aguzzi J., Allcock A. L., Davies J. S., Dissanayake A., et al. (2017). Ecological role of submarine canyons and need for canyon conservation: A review. Front. Mar. Sci. 4:5. doi: 10.3389/fmars.2017.00005
Green A. (2011). Submarine canyons associated with alternating sediment starvation and shelf-edge wedge development: Northern KwaZulu-natal continental margin, south Africa. Mar. Geology 284 (1-4), 114–126. doi: 10.1016/j.margeo.2011.03.011
Green A., Ukena R., Ramsayb P., Leuci R., Perritt S. (2009). Potential sites for suitable coelacanth habitat using bathymetric data from the western Indian ocean: research letters. South Afr. J. Sci. 105 (3), 151–154. doi: 10.4102/sajs.v105i3/4.68
Green A., Uken R. (2008). Submarine land sliding and canyon evolution on the northern KwaZulu-natal continental shelf, south Africa, SW Indian ocean. Mar. Geology 254 (3-4), 152–170. doi: 10.1016/j.margeo.2008.06.001
Hawie N., Covault J. A., Sylvester Z. (2019). Grain-size and discharge controls on submarine-fan depositional patterns from forward stratigraphic models. Front. Earth Sci. 7 (December). doi: 10.3389/feart.2019.00334
Hernández-Ávila I., Guerra-Castro E., Bracho C., Rada M., Ocaña F. A., Pech D. (2018). Variation in species diversity of deep-water megafauna assemblages in the Caribbean across depth and ecoregions. PloS One 13 (8), e0201269. doi: 10.1371/journal.pone.0201269
Howell K. L., Billett D. S., Tyler P. A. (2002). Depth-related distribution and abundance of seastars (Echinodermata: Asteroidea) in the porcupine seabight and porcupine abyssal plain, NE Atlantic. Deep Sea Res. Part I: Oceanographic Res. Papers 49 (10), 1901–1920. doi: 10.1016/S0967-0637(02)00090-0
Huvenne V. A., Davies J. S. (2013). Towards a new and integrated approach to submarine canyon research. Deep Sea Res. Part II: Topical Stud. Oceanography 104, 1–5. doi: 10.1016/j.dsr2.2013.09.012
Jarre A., Hutchings L., Kirkman S. P., Kreiner A., Tchipalanga P. C., Kainge P., et al. (2015). Synthesis: climate effects on biodiversity, abundance, and distribution of marine organisms in the benguela. Fisheries Oceanography 24, 122–149. doi: 10.1111/fog.12086
Karenyi N., Sink K., Nel R. (2016). Defining seascapes for marine unconsolidated shelf sediments in an eastern boundary upwelling region: the southern benguela as a case study. Estuarine Coast. Shelf Sci. 169, 195–206. doi: 10.1016/j.ecss.2015.11.030
Kersalé M., Perez R. C., Speich S., Meinen C. S., Lamont T., Le Hénaff M., et al. (2019). Shallow and deep eastern boundary currents in the south Atlantic at 34.5 s: Mean structure and variability. J. Geophysical Research: Oceans 124 (3), 1634–1659. doi: 10.1029/2018JC014554
Kinberg J. G. H. (1867). Annulata nova. [Continuatio.] (Stockholm: Öfversigt af Königlich Vetenskapsakademiens förhandlingar) 23 (9), 337–357. Available at: http://biodiversitylibrary.org/page/32287795.
Lamarck J. B. M. de. (1816). Histoire naturelle des animaux sans vertèbres. tome second (Paris: Verdière), 568. Available at: http://www.biodiversitylibrary.org/item/47698.
Lamont T., Barlow R. G., Kyewalyanga M. S. (2014). Physical drivers of phytoplankton production in the southern benguela upwelling system. Deep-Sea Res. Part I: Oceanographic Res. Papers. Elsevier 90 (1), 1–16. doi: 10.1016/j.dsr.2014.03.003
Lamont T., García-Reyes M., Bograd S. J., van der Lingen C. D., Sydeman W. J. (2018). Upwelling indices for comparative ecosystem studies: Variability in the benguela upwelling system. J. Mar. Syst. 188, 3–16. doi: 10.1016/j.jmarsys.2017.05.007
Lamont T., Hutchings L., van den Berg M., Goschen W. S., Barlow R. G. (2015). Hydrographic variability in the st. Helena bay region of the southern benguela ecosystem. J. Geophys. Res. Oceans 120, 2920–2944. doi: 10.1002/2014JC010619
Lange L. (2012). Use of demersal bycatch data to determine the distribution of soft-bottom assemblages off the West and south coasts of south africa. [Doctoral thesis] ([South Africa]: University of Cape Town).
Levin L. A., Etter R. J., Rex M. A., Gooday A. J., Smith C. R., Pineda J., et al. (2001). Environmental influences on regional deep-sea species diversity. Annu. Rev. Ecol. systematics 32 (1), 51–93. doi: 10.1146/annurev.ecolsys.32.081501.114002
Lins L., Leliaert F., Riehl T., Ramalho S. P., Cordova E. A., Esteves A. M., et al. (2016). Species variability and connectivity in the deep sea: evaluating effects of spatial heterogeneity and hydrodynamics. Biogeosciences Discuss 2016, 1–33. doi: 10.1146/annurev.ecolsys.32.081501.114002
Ljungman A. (1867). Ophiuroidea viventia huc usque cognita enumerat. Öfversigt af kgl. Vetenskaps-Akademiens Förhandlingar 1866 23 (9), 303–336. https://www.biodiversitylibrary.org/page/32287761.
Lo Iacono C., Sulli A., Agate M. (2014). Submarine canyons of north-western Sicily (Southern tyrrhenian sea): Variability in morphology, sedimentary processes, and evolution on a tectonically active margin. Deep Sea Res. Part II: Topical Stud. Oceanography 104, 93–105. doi: 10.1016/j.dsr2.2013.06.018
Lyman T. (1878). “Ophiuridae and astrophytidae of the “Challenger” expedition. part I,” in Bulletin of the museum of comparative zoology, vol. 5. (Cambridge, Mass: Harvard College), 65–168, 10. Available at: https://www.biodiversitylibrary.org/page/28876644#page/85/mode/1up.
Macdonald T. A., Burd B. J., Macdonald V. I., van Roodselaar A. (2010). “Taxonomic and feeding guild classification for the marine benthic macroinvertebrates of the strait of Georgia, British Columbia,” in Fisheries and oceans Canada (Canada: Pêches et océans).
Marine Species Traits editorial board (2022). Marine Species Traits Accessed at http://www.marinespecies.org/traits on 2022
Mbatha F. L., Yemane D., Ostrowski M., Moloney C. L., Lipiński M. R. (2019). Oxygen and temperature influence the distribution of deepwater cape hake merluccius paradoxus in the southern benguela: a GAM analysis of a 10-year time-series. Afr. J. Mar. Sci. 41 (4), 413–427. doi: 10.2989/1814232X.2019.1688681
Mello-Rafter K., Sowers D., Malik M., Watling L., Mayer L. A., Dijkstra J. A. (2021). Environmental and geomorphological effects on the distribution of deep-Sea canyon and seamount communities in the Northwest Atlantic. Front. Mar. Sci. 1326. doi: 10.3389/fmars.2021.691668
Milne Edwards H. (1834-1840). Histoire naturelle des crustacés, comprenant l´Anatomie, la physiologie et la classification de ces animaux Vol. III (Paris: Encyclopédique Roret), 1-638, pls. 1–42. Available at: http://www.biodiversitylibrary.org/bibliography/16170#/summary.
Mortensen T. (1907) The Danish Ingolf-Expedition 1895–1896. Vol. 4. No. 2. Echinoidea. Part 2. Luno B., (Copenhagen), 200
Müller O. F. (1789). Zoologia danica seu animalium daniae et norvegiae rariorum ac minus notorum descriptiones et historia. Ed. Möller N. (Copenhague: Havniae), 81–120. Available at: http://gdz.sub.uni-goettingen.de/dms/load/img/?PPN=PPN614794331.
Nobili G. (1906). Diagnoses préliminaires de crustacés, décapodes et isopodes nouveaux recueillis par m. le dr. g. seurat aux îles touamotou. Bull. du Muséum Natl. d'Histoire naturelle. 12 (12), 256–270. doi: 10.5962/bhl.part.4097
Owen R. (1843)Lectures on the comparative anatomy and physiology of the invertebrate animals. Available at: https://archive.org/stream/lecturesoncompar00owe#page/82/mode/2up.
Palan K. J. (2017). Submarine canyon evolution of the southwest cape continental margin. [Doctoral dissertation] ([South Africa]: University of KwaZulu-Natal).
Pierdomenico M., Cardone F., Carluccio A., Casalbore D., Chiocci F., Maiorano P., et al. (2019). Megafauna distribution along active submarine canyons of the central Mediterranean: Relationships with environmental variables. Prog. Oceanography 171, 49–69. doi: 10.1016/j.pocean.2018.12.015
Puccinelli E., McQuaid C. D., Ansorge I. J. (2018). Factors affecting trophic compositions of offshore benthic invertebrates at a sub-Antarctic archipelago. Limnology Oceanography 63 (5), 2206–2228. doi: 10.1002/lno.10934
Quattrini A. M., Nizinski M. S., Chaytor J. D., Demopoulos A. W., Roark E. B., France S. C., et al. (2015). Exploration of the canyon-incised continental margin of the northeastern united states reveals dynamic habitats and diverse communities. PloS One 10 (10), 1–32. doi: 10.1371/journal.pone.0139904
Ramirez-Llodra E., Brandt A., Danovaro R., De Mol B., Escobar E., German C. R., et al. (2010). Deep, diverse and definitely different: unique attributes of the world's largest ecosystem. Biogeosciences 7 (9), 2851–2899. doi: 10.5194/bg-7-2851-2010
Rogers J. (1977). Sedimentation on the continental margin of the orange river and the namib desert. Bull. Joint Geological Survey: Univ. Cape Town Mar. Geosci. Group 7, 1–162.
Rogers J., Bremner J. M. (1991). The benguela ecosystem. part vn. marine-geological aspects. Oceanography Mar. Biology: Annu. Rev. 29, 1–85.
Savigny J. C. (1816). Memoires sur les animaux sans vertebres. Paris. 2, 1–239. doi: 10.5962/bhl.title.9154
Shannon L. J., Christensen V., Walters C. J. (2004). Modelling stock dynamics in the southern benguela ecosystem for the period 1978–2002. Afr. J. Mar. Sci. 26 (1), 179–196. doi: 10.2989/18142320409504056
Shannon L. J., Jarre A. C., Petersen S. L. (2010). Developing a science base for implementation of the ecosystem approach to fisheries in south Africa. Prog. Oceanography 87 (1-4), 289–303. doi: 10.1016/j.pocean.2010.08.005
Shannon L. V., Nelson G. (1996). “The benguela: large scale features and processes and system variability,” in The south Atlantic (Berlin, Heidelberg: Springer). doi: 10.1007/978-3-642-80353-6_9
Simpson E. S. W., Forder E. (1968). The cape submarine canyon. Fisheries Bull. South Africa. 5, 35–38.
Sink K. J., Attwood C. G., Lombard A. T., Grantham H., Leslie R., Samaai T., et al. (2011). “Spatial planning to identify focus areas for offshore biodiversity protection in south Africa,” in Final report for the offshore marine protected area project (Cape Town: South African National Biodiversity Institute). Available at: https://www.sadstia.co.za/assets/uploads/Benthic-report-2012.pdf
Sink K. J., Boshoff W., Samaai T., Timm P. G., Kerwath S. E. (2006). Observations of the habitats and biodiversity of the submarine canyons at sodwana bay: Coelacanth research. South Afr. J. Sci. 102 (9), 466–474.
Sink K., van der Bank M., Majiedt P., Harris L., Atkinson L., Kirkman S., et al. (2019). South African national biodiversity assessment 2018 technical report volume 4: Marine realm (Pretoria. South Africa: South African National Biodiversity Institute). Available at: http://hdl.handle.net/20.500.12143/6372.
Sink K. J., Wilkinson S., Atkinson L., Sims P., Leslie R., Attwood C. G. (2012). The potential impacts of south africa's demersal hake trawl fishery on benthic habitats: Historical perspectives, spatial analyses, current review, and potential management actions.
Smith S. I. (1882) . Reports on the results of dredging under the supervisión of Alexander Agassiz, on the east coast of the United States during the summer of 1880, by the U.S. Coast Survey Steamer "Blake", Commander J.R. Bartlett, U.S.N., commanding. (Bulletin of the Museum of comparative Zoology at Harvard College) 10 (1), 1–108.
Stebbing T. R. R. (1910). “General catalogue of south African Crustacea (Part v. @ of s. a. Crustacea, for the marine investigations in south Africa),” in Annals of the south African museum, vol. 6. , 281–593. doi: 10.5962/bhl.part.15558
Stephen A. C. (1965). A revision of the classification of the phylum sipuncula. Ann. Magazine Natural History. (Series 13) 7 (80), 457–462. doi: 10.1080/00222936408651485
Studer T. (1883). Verzeichnis der während der crustaceen, welche während der reise S.M.S. “Gazelle” an der westküste von afrika, ascension un dem cap der guten hoffnung gesammelten crustaceen Vol. 2 (Berlin: Abhandlungen der königlichen Akademie der Wissenschaften), 1–32.
Théel H. (1886). Report on the holothurioidea collected by H.M.S. challenger during the years 1873-76. part II. report on the scientific results of the voyage of H.M.S. challenger during the years 1873–76. Zoology 14 (part 39), 1–2901–16. http://19thcenturyscience.org/HMSC/HMSC-Reports/Zool-39/htm/doc.html.
Thomson C. W. (1873). The depths of the Sea: An account of the general results of the dredging cruises of HMSS" porcupine" and" lightning" during the summers of 1868, 1869, and 1870. Macmillan. 527 doi: 10.5962/bhl.title.19314
Tizard T. H., Moseley H. N., Buchanan J. Y., Murray J. (1885). Narrative of the cruise of H.M.S. challenger, with a general account of the scientific results of the expedition. Rep. Sci. Results Voyage H.M.S. Challenger during years 1873–1876. 1 (1-2), i–liv, 1-1110. https://www.biodiversitylibrary.org/page/49431318.
Travers M., Watermeyer K., Shannon L. J., Shin Y. J. (2010). Changes in food web structure underscenarios of overfishing in the southern benguela: comparison of the ecosim and OSMOSE modelling approaches. J. Mar. Syst. 79 (1-2), 101–111. doi: 10.1016/j.jmarsys.2009.07.005
Veitch J., Hermes J., Lamont T., Penven P., Dufois F. (2018). Shelf-edge jet currents in the southern benguela: A modelling approach. J. Mar. Syst. 188, 27–38. doi: 10.1016/j.jmarsys.2017.09.003
Venter P., Timm P., Gunn G., Le Roux E., Serfontein C., Smith P., et al. (2000). Discovery of a viable population of coelacanths (Latimeria chalumnae smit at sodwana bay, south Africa. South Afr. J. Sci. 96 (11-12), 567–568.
Vetter E. W., Smith C. R., De Leo F. C. (2010). Hawaiian Hotspots: enhanced megafaunal abundance and diversity in submarine canyons on the oceanic islands of Hawaii. Mar. Ecol. 31 (1), 183–199. doi: 10.1111/j.1439-0485.2009.00351.x
Wigley R. A., Compton J. S. (2006). Late Cenozoic evolution of the outer continental shelf at the head of the cape canyon, south Africa. Mar. Geology 226 (1–2), 1–23. doi: 10.1016/j.margeo.2005.09.015
Wigley R.A. (2004). Sedimentary facies from the Head of the Cape Canyon: Insights into the Cenozoic evolution of the western margin of South Africa. [Doctoral thesis]. (South Africa: University of Cape Town). Available at: https://open.uct.ac.za/handle/11427/4232
Wiles E., Green A., Watkeys M., Jokat W., Krocker R. (2013). The evolution of the tugela canyon and submarine fan: a complex interaction between margin erosion and bottom current sweeping, southwest Indian ocean, south Africa. Mar. Petroleum Geology 44, 60–70. doi: 10.1016/j.marpetgeo.2013.03.012
WoRMS Editorial Board (2022) World register of marine species. Available at: https://www.marinespecies.org (Accessed 2022-06-02).
Keywords: biodiversity, deep-sea, depth, substrate, species profiles
Citation: Filander Z, Smith ANH, Cawthra HC and Lamont T (2022) Benthic species patterns in and around the Cape Canyon: A large submarine canyon off the western passive margin of South Africa. Front. Mar. Sci. 9:1025113. doi: 10.3389/fmars.2022.1025113
Received: 22 August 2022; Accepted: 10 October 2022;
Published: 18 November 2022.
Edited by:
Jaime Selina Davies, University of Plymouth, United KingdomReviewed by:
Daniel Pech, El Colegio de la Frontera Sur, MexicoAlvar Carranza, Universidad de la República, Uruguay
Copyright © 2022 Filander, Smith, Cawthra and Lamont. This is an open-access article distributed under the terms of the Creative Commons Attribution License (CC BY). The use, distribution or reproduction in other forums is permitted, provided the original author(s) and the copyright owner(s) are credited and that the original publication in this journal is cited, in accordance with accepted academic practice. No use, distribution or reproduction is permitted which does not comply with these terms.
*Correspondence: Zoleka Filander, emZpbGFuZGVyQGdtYWlsLmNvbQ==