 Fang Wang
 Qibiao Yu
 Weijin Yan
 Siyu Tian1,3
- 1Key Laboratory of Land Surface Pattern and Simulation, Institute of Geographic Science and Natural Resources Research, Chinese Academy of Sciences, Beijing, China
- 2College of the Environment and Ecology, Xiamen University, Xiamen, China
- 3College of Resource and Environment, University of Chinese Academy of Sciences, Beijing, China
- 4Chinese Academy for Environmental Planning, Beijing, China
Global riverine N2O emissions have been made by several studies with great uncertainty. However, the regional N2O budgets and patterns in large river networks is still unclear, due to the lacking understanding of in-river N2O emission rate and well-classified river network water areas. Furthermore, the mass ratio of N2O emission against nitrogen(N) load in river networks remains controversial. Here we report N2O emissions from the largest river of China, the Changjiang River network, emphasizing the basin-scale control on riverine N2O loss rate in response to increasing N loads and river size. We find the N2O emission rate is negatively related to Strahler river orders, and positively related to N loading. The velocity (Vf) of N conversion into N2O was 0.131-0.436 m yr-1, and N2O loss rate (ζ) was 0.27-37.64 ×10⁻⁴ d-1 and declined exponentially with water discharge. Both the loss rate and the mass ratio of N conversion into N2O varied significantly at basin scale, indicating the diminishing capacity of river ecosystems to convert excess DIN into N2O when N load increased as a direct result of human activities. Our study shows N2O emission was 0.66 Gg N2O-N (1Gg=109g) in 1986 and increased to 10.3 Gg N2O-N in 2014 for the whole Changjiang River network. We identified the headwater streams are hotspots of N2O emission across the headwater stream to the estuary aquatic continuum. N2O emission was about 0.82% - 5.31% of global riverine N2O budget during 2010-2014. Our study suggested that an integrated approach in view of the riverine N loads and river hydrology is needed to improve estimates of riverine N2O emissions.
Introduction
Nitrous oxide (N2O) emitted from rivers and streams is a key component of both the global and regional N2O budgets (Beaulieu et al., 2011; Borges et al., 2015; Turner et al., 2015; Hu et al., 2016) owing to their favorable hydrological and biogeochemical conditions in conversion of bioavailable nitrogen (bio-N, defined as dissolved inorganic nitrogen, DIN, mainly including ammonium and nitrate) into reduced N through the processes as nitrification, denitrification, or/and nitrifier-denitrification (Seitzinger et al., 2006; Mulholland et al., 2008; Kool et al., 2011), during which N2O is produced. Some studies showed that bio-N inputs to rivers and streams significantly increased in the last few decades (Mayorga et al., 2010; Seitzinger et al., 2010; Yan et al., 2010; Nevison et al., 2016; Battye et al., 2017). For example, DIN input increased from 3.01 million t/yr in 1970 to 13.14 million t/yr in 2003 in Changjiang River watershed (Yan et al., 2010), from 1.49 million t/yr in 1986 to 3.58 million t/yr in 2015 in Zhujiang watershed (Cui et al., 2020), and from ~6000 t/yr in 1980 to ~20000 t/yr in 2010 in Jiulong River watershed (Yu et al., 2015). Thus, there is the potential to markedly stimulate N2O production in river networks (Seitzinger, 1988; Bouwman, 1996; Yan et al., 2012). However, the response of N2O emissions to increasing DIN load is still unclear within a large river network. Although the Intergovernmental Panel on Climate Change (IPCC) methodology has recommended an emission factor (EF) to facilitate estimation of N2O emissions from rivers and streams (EF5-r) (IPCC, 2006), uncertainty still remains (Beaulieu et al., 2011; Hinshaw and Dahlgren, 2013; Turner et al., 2015; Wang et al., 2015a).
In river networks, N2O can be produced in situ through nitrification and denitrification in river sediments and water column (Wang et al., 2017; Li et al., 2019). Nitrification, the oxidation of to nitrate ), releases N2O as a by-product, whereas denitrification ( reduction) can either produce N2O or transform it to N2 in a final reaction favored under highly reduced anoxic conditions. These processes may be influenced by river hydrological characteristics, such as river depth, width, and river retention time (Seitzinger et al., 2006; Zarnetske et al., 2011). As river networks receive increasing DIN loads, the mass of DIN converted to N2O emissions from water per unit area of riverbed per unit time, responds differently to DIN increase and hydrological conditions. Here, we define conversion velocity (Vf, m yr-1) as the speed of DIN converted through N2O emissions from water per unit area of riverbed per unit time. We further define the N2O loss rate (ζ) as combination of the conversion velocity and river depth, and we hypothesis that both Vf and ζ can change in response to DIN loads and river sizes. For example, small streams generally have high ratios of riverbed area to water volume, and can efficiently convert DIN to N2O, whereas, larger rivers have lower ratios of riverbed area to water volume making them less efficient in converting DIN to N2O. There are limited studies of riverine N2O emission in relation to hydrological processes in a large river network (Marzadri et al., 2014; Turner et al., 2015). Until now, researches have focused on a single river/stream or relatively small watersheds (Rosamond et al., 2012; Yan et al., 2012; Hinshaw and Dahlgren, 2013; Venkiteswaran et al., 2014) where river hydrological and watershed land use conditions are relatively homogeneous (Turner et al., 2016). However, little is known how N2O emissions vary across a range of river sizes (Borges et al., 2015). Furthermore, quantifying N2O emissions from large river networks is challenging due to the lack of data on three key variables; (1) in-stream N2O production, (2) water surface area of the river network, and (3) N2O transfer velocity.
Quantifying the amount of water surface area for a large river network is critical to evaluate riverine N2O emission. River length and width can be obtained from the combination of publicly available geographic data and hydraulic geometry laws (Raymond et al., 2013), and river surface area can be calculated by the product of river length and width. Gas transfer velocity (k) is an important factor in N2O emissions calculations. Models based on wind speed are widely applied, especially in open waters such as wide rivers, lakes, and estuaries (Cole and Caraco, 2001; Borges et al., 2004). Large river systems are not suited to wind-based models due to the challenge of measuring relative parameters across large scales. In contrast, measures of channel slope and flow velocity are easily obtained (Raymond et al., 2012), having been widely used in large space river gas emission (Butman and Raymond, 2011; Raymond et al., 2013; Borges et al., 2015).
Here, field sampling was taken for spatial, seasonal and diurnal study, along the main stem and two branches of the Changjiang River Network (CRN). We then estimated N2O production through a Michaelis-Menten equation that described the nonlinear relationship between riverine N2O concentration ([N2O]) and DIN concentration ([DIN]) based on the field observation in the CRN. We also calculated water surface area of river network k based on the River Strahler model by combining with hydraulic geometry laws and geographic information system tools (Strahler, 1957). We estimated N2O emissions for the temporal (period between 1970 and 2014) patterns from the entire CRN by combination of Global NEWS2-DIN (Yan et al., 2010). Finally, we used “nitrogen spiraling” theory to scale our analysis from field observations to the entire CRN (Workshop, 1990; Ensign and Doyle, 2006), and thereby obtained the temporal change of ratios of N2O:DIN, representing dynamic response of EF at any given [DIN] in linking to DIN loads and hydrological processes at watershed scale and calculated EF values.
Materials and methods
Study area and sampling
The study was conducted in the Changjiang River basin (24°27’-35°54’N, 90°13’-122°19’E), the third largest river in the world, with an average annual discharge of 10× 1011 m3. The Datong hydrological station (DHS), located at the upper limit of river mouth, is free from the influence of both tidal cycles and industrial waste from nearby cities. The stretch of the Changjiang River above DHS drains 94% of the whole basin and delivers more than 95% of the water to the estuary (Yan et al., 2003).
Field sampling was taken from the main stem and its tributaries in the Changjiang River network (CRN, Figure 1 and SI Table S1), including two sub-water systems in the lower reach of the CRN, the Poyang Lake-Ganjiang River water system and the Chaohu Lake water system. A total of 12 sampling sites were chosen to take samples in the CRN of which 4 sites along the main stem of the CRN; 4 sites located in the Poyang Lake-Ganjiang River water system; 2 sites in the Chaohu Lake water system; 1 site in the Jialing River branch, and 1 site in the Hanjiang branch (Figure 1 and SI Table S1). Spatial samples were taken from October to November 2011 at 4 hydrological stations along the main stem (Cuntan, Wanxian, Hankou and Datong hydrological stations, representing the 8th order river) and 2 branch stations at the Beibei Hydrological station (Jialingjiang Branch River) and Xiantao hydrological station (the Hanjiang Branch River), representing the 7th order river. The diurnal samples at the DHS were collected on 2 occasions in September 2015 and January 2016, respectively. In addition, diurnal sampling was also taken at 4 sites in the Poyang Lake-Ganjiang River water system during the summer season 2013, of which 3 sites located in the west, middle and east branch of the Ganjiang River (6th order river) and 1 site in the Xiushui River (5th order river) (Figure 1 and SI Table S1). Monthly observations were sampled at 2 sites in the Chaohu Lake water system from June to October in 2009, 1 site located at the Pai River (2nd order river) and the other one at the Hangbu River (3rd order river). All the diurnal samples were collected at an interval of 6 h.
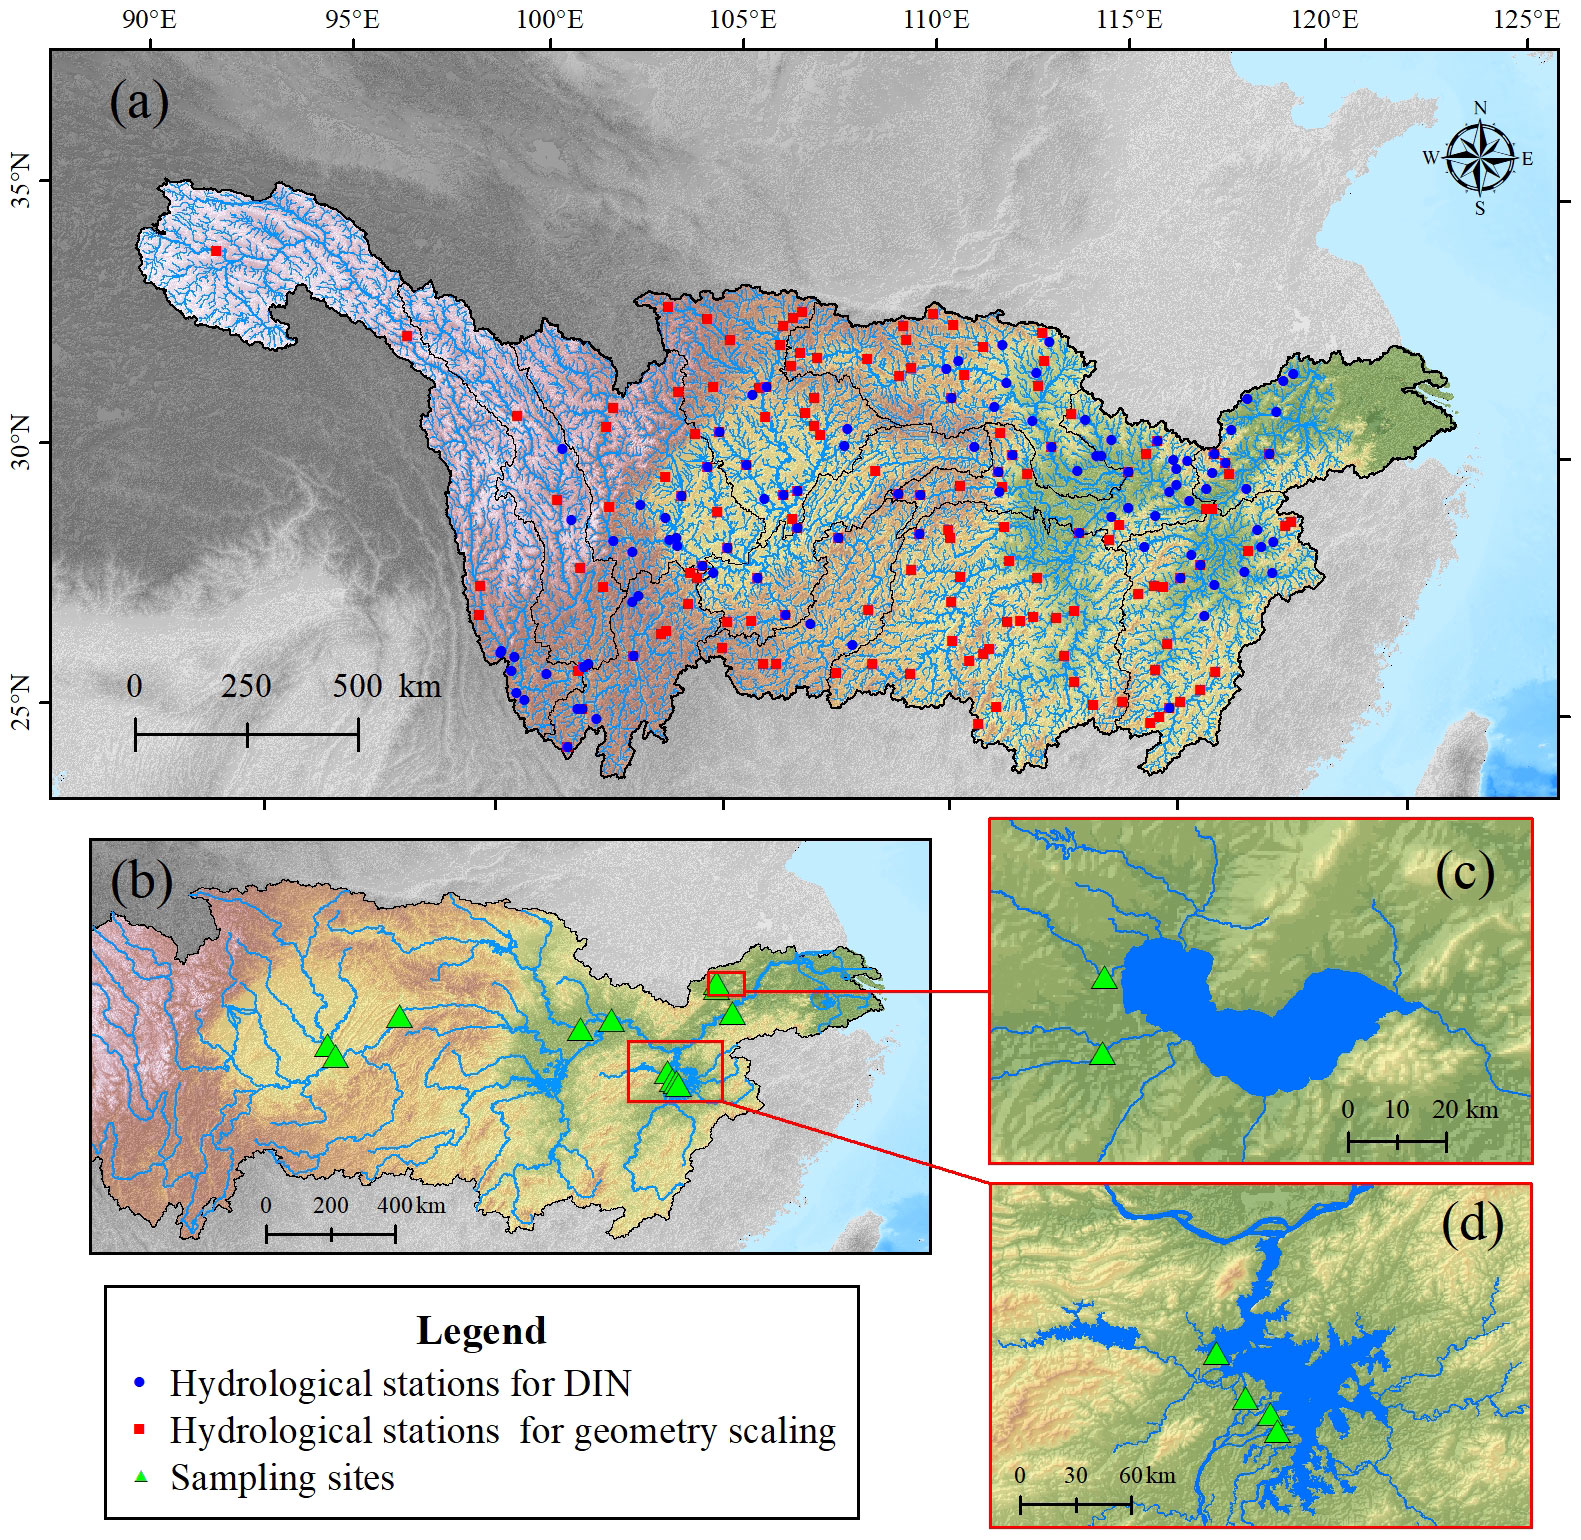
Figure 1 Location and river network of the Changjiang River basin, (A) showing the river network and hydrological stations, (B) all sampling sites, (C) sampling sites in Chaohu Lake watershed, and (D) sampling sites in Poyang Lake watershed.
At each sampling, surface water (~0.5 m) was collected in triplicate by filling in 60-mL glass serum bottles from water sampler, and water flow rate, water and air temperature, wind speed, and dissolved oxygen (DO) were measured in-situ. Samples were preserved by adding a small crystal of KOH or HgCl2 solution (5% w/v) to each bottle immediately before sealing (Yan et al., 2010; Wang et al., 2015a). Surface water was also reserved in 200-mL glass bottle after filtrating through a 0.7-μm glass microfiber filter (GF/F Waterman, UK) for testing dissolved inorganic nitrogen (DIN, referring to nitrate and ammonium) concentrations. Dissolved N2O concentrations were measured using headspace equilibrium method, that is, in headspace, water was firstly displaced with high pure Nitrogen (N2) or Helium (He) gas with syringe, shaking for >1 hour, and then tested N2O concentration of headspace by gas chromatograph (GC-2014, Shimadzu, Kyoto, Japan) or Agilent 7890A (Agilent, US) equipped with electron capture detector (ECD), with an analytical precision of 0.1 ppm (Wang et al., 2015b). Finally, dissolved N2O concentration was calculated by using Weiss equation (Weiss and Price, 1980). Samples for nitrate and ammonium concentrations were immediately determined in lab by using Flow Injection Analyzer (FIA-3100, Beijing, China). In this study, nitrite concentration was neglected, because of this kind of DIN was relative lower comparing to nitrate and ammonium. Water temperature and other parameters were measured using a portable meter (YSI 550A, Yellow Springs, US).
Estimation of the surface area for the CRN
River surface area was computed by the product of width and length. The length of the rivers in the CRN was extracted from a 90 m resolution Shuttle Radar Topography Mission (SRTM) DEM data set (Source: www.usgs.gov) in Arcgis 10.2 (ESRI, Inc, Redlands, USA) by Strahler river order method (Strahler, 1957). Besides, watershed area of each river was extracted. As a result, seven river orders were extracted directly, whereas first order streams were not captured due to the limit of resolution of the DEM data set. The length of smallest stream, first order river, for each subbasin was interpolated by empirical models, which were established by the regression relationship based on the extracted second to eighth orders.
River width was calculated from discharges according to hydraulic geometry scaling theory (Leopold and Maddock, 1953). Thus, velocity (V), width (W) and depth (D) are related to discharge (Q) with the following power relationships:
where a, c and e are hydraulic coefficients and b, d and f are hydraulic exponents. According to Leopold & Maddock (Leopold and Maddock, 1953), discharge is the product of velocity, width and depth. In this study, exponents and coefficients were fitted by hydrological station observation data of the selected 141 hydrological stations within the Changjiang River Basin (Figure 1, SI Figure S1, and SI Table S2).
The discharge of each river was computed from river watershed area and discharge yield, as:
where Qcal is the calculated discharge (m3 s-1), YQyield is the annual discharge yield (m yr-1), and Scatchment is the river catchment area (km2).
To determine annual discharge yield of each subbasin, annual precipitation data from national meteorological stations (Source: http://data.cma.cn) and annual discharge yields from hydrological stations within the Changjiang River basin were collected. We took the mean precipitation and annual discharge yield for each subbasin and found that there exited a good regression relationship between them (R2 = 0.68, n = 288, SI Figure S2a). Then we used this relationship to regress YQyield from precipitation.
Determination of nitrous oxide gas transfer velocity
Nitrous oxide gas transfer velocity (kN2O) determines the exchange volume between river and surface air. In this study, kN2O is calculated from k600 (coefficient of diffusion from water to the air for gas at 20°C), based on river channel hydraulic and basin characteristics according to Raymond et al., (Raymond et al., 2012), as:
where Sslope is the slope of the river channel, and V is river flow velocity (m s-1).
Channel slope was calculated as the difference in elevations divided by the river channel length between two hydrological stations located at the same river and river order of CRN. The channel elevation and river length data were collected from the Annual Hydrological Report (China, 1970-2012). A total of 120 pair fitted stations varying from the second- to the eighth- order were obtained (SI Figure S3a). For the smallest rivers, without available direct data, channel slope was extrapolated from the regression relationship among the second- to the eighth- order rivers (SI Figure S3a). River flow velocity was obtained from equation (1).
kN2O between river surface water and the above air could be then determined by using:
where, k600 is the coefficient of diffusion for N2O at 20°C, ScN2O is the Schmidt number for N2O related to water temperature (Wanninkhof, 1992).
We first established the regression between river water temperature and air temperature observed from hydrological stations and national meteorological stations (R2 = 0.92, n = 1224, SI Figure S2b). Then, annual river water temperature was interpolated by this regression relationship from air temperature.
Calculation of N2O emissions
The air-water N2O emission rate was calculated as
Where N2OER is the N2O emission rate (mg N m-2 h-1), [N2Ow] is the dissolved N2O concentration (μg N L-1), [N2Oequ] is the equilibrium N2O concentration (μg N L-1), ([N2Ow] - [N2Oequ]) can usually be expressed as Δ[N2O] (μg N L-1).
For the river network, the total N2O emission from the water surface was calculated as:
where Efflux is the annual N2O emission (Gg N2O-N yr-1), SA is the surface area of river network (km2), and N2OER is the N2O emission rate (mg N m-2 h-1).
Relationship between observed N2O and DIN concentrations in the CRN
We used a nonlinear Michaelis-Menten kinetics equation (MM) to determine the relationship between riverine DIN and dissolved N2O concentrations from field sampling data (Boyer et al., 2006; Turner et al., 2016). The relationship was expressed as:
where riverine dissolved N2O concentration ([N2O], mg N L-1) was set as a function of DIN concentration ([DIN], mg N L-1); Vmax (mg N L-1) represents the maximum reaction rate produced by microbial activates; Km (mg N L-1) is the affinity constant corresponding to [DIN] at half Vmax.
Riverine DIN data sources
In order to analysis longitudinal variation of [DIN] in CRN, data from annual hydrological reports from 1970 to 1985 (China, 1970-2012) and public literature from 1999 to 2012 (Han and Liu, 2004; Chetelat et al., 2008; Li et al., 2008; Wu et al., 2008; Li et al., 2009; Wang and Wang, 2009; Han et al., 2010; Lu et al., 2011; Xu et al., 2011; Zheng et al., 2011; Ji and Jiang, 2012; Jiang et al., 2012; Yan et al., 2012; Liu et al., 2013; Sun et al., 2013; Wu et al., 2013; Han et al., 2014; Li et al., 2014a; Li et al., 2014b; Luo et al., 2014; An et al., 2015; Qu et al., 2015; Wang et al., 2015a) within the Changjiang River basin were collected (SI, Figure S4). For the [DIN] observed at hydrological stations, the sampling frequency ranged from 2 to 3 times per month. Descriptions of chemical analysis and data quality were similar to that reported by Yan et al., (Yan et al., 2003). A total of 102 stations in the Changjiang drainage basin were compiled and categorized by Strahler river order. Among these stations, 4 stations were located along the main stem of the river, including (from upstream downwards) the Cuntan, Yichang, Hankou, Datong hydrological stations (Figure 1). The other 98 stations were scattered along the Changjiang’s numerous tributaries. No stations in the delta region were included in this study because of the intersections with numerous streams and rivers originated from other drainage basins. In the CRN, nitrite concentrations were usually under test limit or much lower than nitrate and ammonium. The DIN in this study was only considered as the sum of nitrate and ammonium.
As nitrogen data were not routinely measured at hydrological stations since 1986, we modeled riverine [DIN] from the Global NEWS2-DIN (Mayorga et al., 2010). The summary of NEWS2-DIN model could be expressed as:
where DINyield is the modeled annual DIN yield per river basin area (kg N km-2 yr-1); Qrem is the fraction (0-1) of consumption water from river; Lden is the fraction of nitrogen removed by denitrification in streams and rivers; Ddin is the fraction (0-1) of nitrogen retained in the reservoir; TNsew is the DIN exported from point source of industrial wastewater and domestic sewage (kg N km-2 yr-1); FEws is the fraction (0-1) of DIN exported from landscape to the rivers, and calibrated from observation data (Yan et al., 2010; Wang et al., 2014a); TNdiff is the total diffuse source of nitrogen input watershed (kg N km-2 yr-1), including nitrogen addition from chemical fertilizer, atmospheric deposition, animal manure nitrogen, and biological N-fixation. The model presents a sound prediction accuracy for [DIN] for the period of 1970 to 2003 (Yan et al., 2010), and extended to model [DIN] to 2013 (Wang et al., 2015b). Therefore, we updated the modeled [DIN] to the period of 2014 in the following analysis.
Calculation of the mass ratio of N2O emission and DIN load based on nitrogen “spiraling” metrics
The mass ratio of emitted N2O against DIN that entering the river network can be calculated by nitrogen “spiraling” theory (Workshop, 1990; Ensign and Doyle, 2006) (SI Table S3). Details of model structure and parameterization are presented in the SI Table S3.
First, areal rate of total DIN conversion velocity (Vf, m yr-1) (Royer et al., 2004; Earl et al., 2006), defined as the speed of DIN converted through N2O emissions from water per unit area of riverbed per unit time. Vf can be calculated as following:
where Vf is the N2O conversion velocity (also DIN uptake velocity) (m yr-1), N2OER is N2O emission rate (mg N m-2 h-1), and C is the [DIN] (mg N L-1). We calculated Vf for each stream and river from 2nd to 8th river order in each subbasin, and estimated total values for 1st order streams of each subbasin.
The N2O loss rate (ζ), also called the first-order reaction rate, can be calculated based on equation (12):
where D is the mean river depth of stream or river (m).
Then, the mass ratio of N2O emission and DIN load for each river order, also called the DIN removal fraction (RRF) from the river water column. RRF is related to N2O loss rate and DIN retention time in rivers, so it can be expressed as:
where τ is the DIN retention time (d). The RRF values of different order rivers are different.
Finally, the total mass ratio of N2O emission against DIN load for the entire CRN can be calculated as:
Where, TRRF is the total N removal fraction as N2O emission, RRF1, RRF2…RRFi is the removal fraction as N2O emission for each river order, and i (i = 1,2,…,8) represents river order.
In this study, for each stream and river of each subbasin, the N2O emission rate, Vf, and ζ were calculated; in each subbasin, the N2O emission amount was estimated based on the N2O emission rate and surface area of river network; for the whole basin, the total N2O emission amount was the sum of all sub-basins involving all rivers from 1st to 8th orders.
Statistical analysis
In this paper, all the regression and nonparametric analysis and data figures were performed using MATLAB software (R2015b, MathWorks, Natick, USA). The regression parameters for hydraulic geometry scaling, discharge yield, water temperature, and channel slope were conducted using built-in fitting function regress under confidence level of 95%. The parameters in Michaelis-Menten kinetics equation was fitted using a nonlinear least square fitting function mimen under confidence level of 95% running in MATLAB software.
Results
Riverine surface area of the CRN
We used data of observed river discharge, velocity, width, and depth for multiple years (1970 - 2014) from the selected hydrological stations in the Changjiang River basin to analyze hydraulic geometry relationships for streams and rivers in CRN (Figure 1, SI Figure S1 - S2). The hydraulic relationships in this study are comparable with reported data (Harman et al., 2008; Raymond et al., 2012; Jung et al., 2013; Raymond et al., 2013). Table 1 gives the statistics of extracted streams and rivers for the CRN. The calculated whole river/stream surface area is about 18765.7 ± 686.7 km2, or 1.07 ± 0.04% of the total land area of the Changjiang River basin.
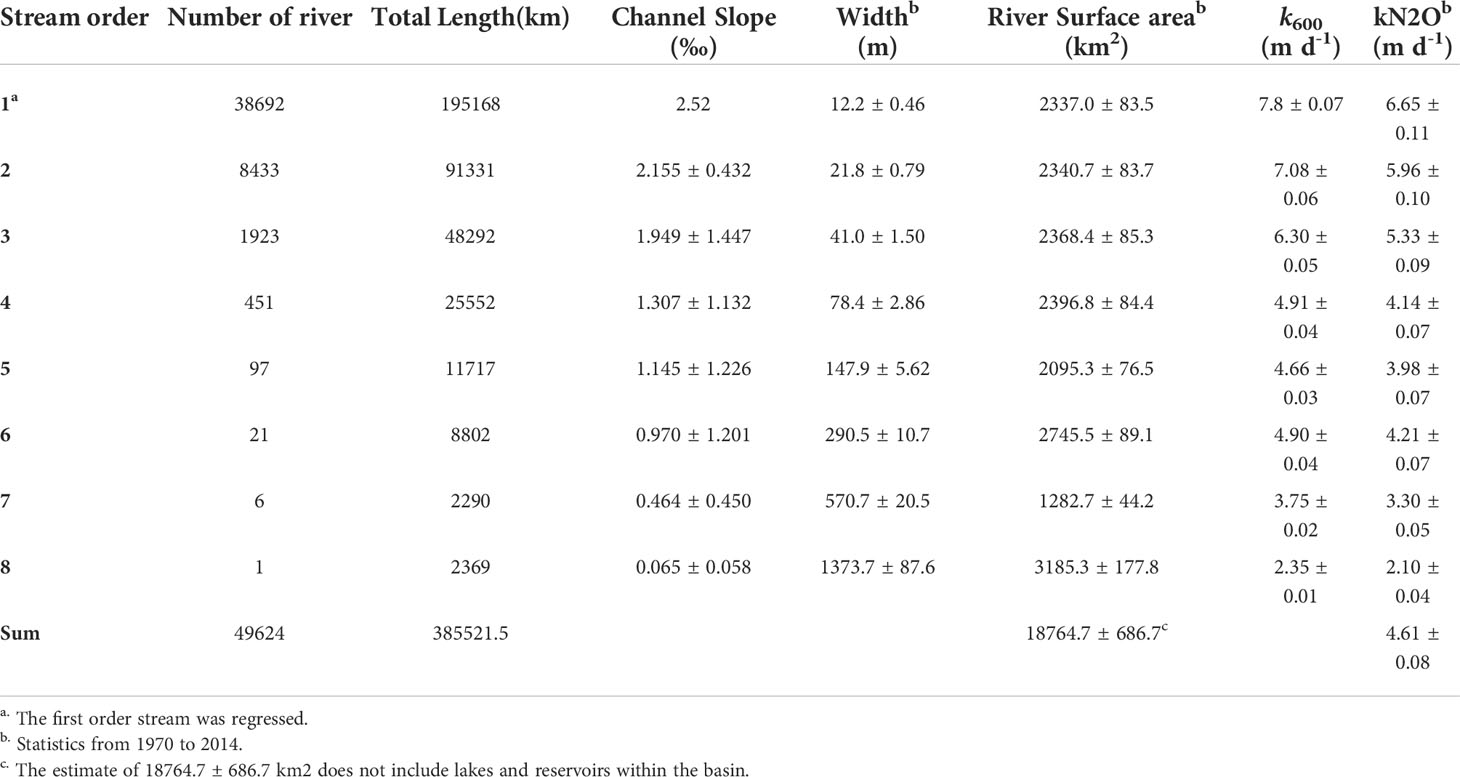
Table 1 Statistics for streams and rivers of Changjiang River Basin.
Our analysis demonstrated that 8th-order rivers, or the main stem rivers, represents the highest proportion of total river surface area at 17.0%, and 7th-order rivers have the smallest proportion of surface area at 6.8%. Surface areas for smaller 1st to 4th orders of the rivers are similar, accounting for about 12.5% of the total river surface area. The 5th and 6th order rivers together comprise the remaining 27.0% of the CRN surface area (SI Figure S5).
Riverine N2O gas transfer velocity
N2O transfer velocity (kN2O) will vary due to differences in the physical controls on water-air turbulence across the different rivers. Our calculated kN2O presents a longitudinal variation among river order, and tends to decrease with increasing river order (Table 1 and SI Figure S3). The value of kN2O is the highest for 1st order rivers, at 6.65 ± 0.11 m d-1, whereas less than 2.10 ± 0.04 m d-1 for main stem at 8th order. For the headwaters of 2nd and 3rd orders, values of k are 5.96 ± 0.10 and 5.33 ± 0.09 m d-1, respectively. The values of k for 4th, 5th and 6th order rivers are similar, at 4.14 ± 0.07, 3.98 ± 0.07 and 4.21 ± 0.07 m d-1, respectively. The average value for k is about 4.61 ± 0.08 m d-1 for the entire CRN. This value is close to results of recent regional global studies (Alin et al., 2011; Raymond et al., 2013), but is significantly higher than that used in a recent regional calculation for the Changjiang River (Yan et al., 2012; Wang et al., 2015a), and a calculation for the Amazon (Rasera et al., 2013).
River N2O and its non-linear relationship with DIN
Our in situ measurements of DIN and N2O covered seasonal, diurnal, and spatial variations in the Changjiang River basin (SI Table S1 and Figure 1). These rivers spanned widely in terms of discharge (ranging from about 6.0 to 28500 m3 s-1; average: 11770 m3 s-1), concentrations of (0.163 to 3.09 mg N L-1; average:1.283 mg N L-1), (0.04 to 1.619 mg N L-1; average: 0.271 mg N L-1), and DIN (0.308 to 3.839 mg N L-1; average: 1.554 mg N L-1), and other environmental factors (SI Table S1). Measured N2O concentrations ranged from 0.104 to 1.11 µg N L-1 (average 0.521 µg N L-1), and the associated ΔN2O concentrations (deviation from saturation) varied between -0.084 and 0.927 µg N L-1 (average 0.305 µg N L-1) at all sites.
In-river nitrification and denitrification account for N2O formation in the water column (Beaulieu et al., 2010) and sediments (Barnes and Owens, 1999; Boyer et al., 2006; Marzadri et al., 2014). Therefore, DIN load could influence N2O production, but synthesis of their relationship is lacking. Here, we obtained the relationship between riverine [DIN] and [N2O] using the Michaelis-Menten kinetics equation (Boyer et al., 2006; Turner et al., 2016). We used field observations to calculate the Vmax and Km. Here [N2O] can be derived from the [DIN] with a Vmax of 0.00106 (± 0.000041) mg N L-1 and a Km of 1.42 (± 0.11) mg N L-1 (Figure 2). Vmax represents the maximum reaction rate produced by microbial activates. Km is the affinity constant corresponding to the [DIN] at half Vmax. We then used these parameters to regress riverine [N2O] from [DIN] for the periods of 1970 to 2014 in the entire CRN.
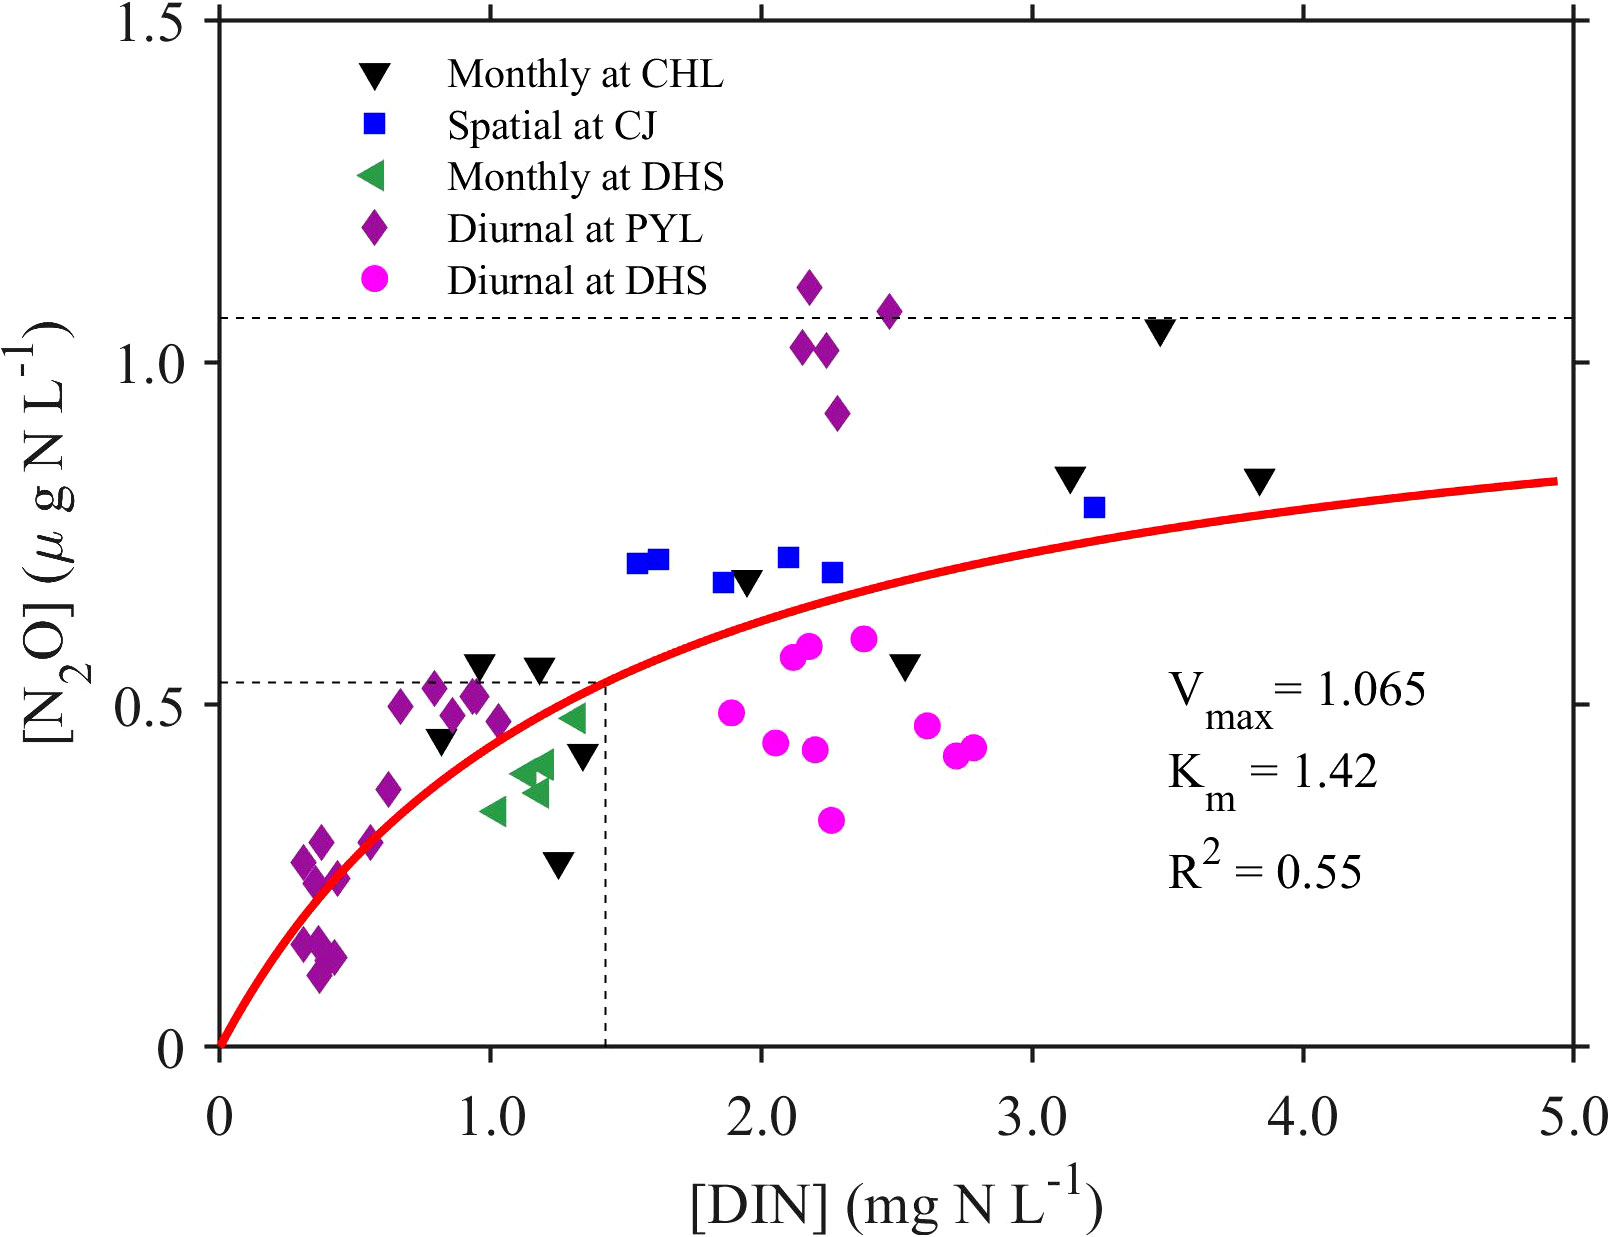
Figure 2 Field measurement of N2O concentrations as a function of DIN concentrations ( n = 55). Red line corresponds to Michaelis–Menten curves. (CH, Chaohu Lake water system, CJ, the Changjiang River, DHS, Datong Hydrological station at the Changjiang River mouth, PYH, Poyang Lake water system).
Temporal N2O emissions in the CRN
Both compiled and collected [DIN] did not show significant longitudinal variation among different Strahler river orders (SI, Figure S4). Modeled [DIN] by the NEWS-DIN for the Changjiang River, presented significantly increasing temporal trend in the CRN. The average [DIN] was about 0.17 mg N L-1 in 1970, and below 0.60 mg N L-1 between 1970 and 1985, and then rapidly increased to about 2.10 mg N L-1 in 2014. N2O emission rates ranged from 0.0019 mg m-2 h-1 for 8th river order to 0.006 mg m-2 h-1 for headwater streams (1st and 2nd river orders) in 1986, and the rate increased to 0.0298 and 0.0944 mg m-2 h-1 for 8th river order and headwater streams, respectively, in 2014. The rate was significantly negatively related to Strahler river order in CRN (Figure 3). The total N2O emission showed spatial differences for all 1st to 8th river orders. N2O emission for headwater streams (0.234 ± 0.008 and 3.657 ± 0.131 Gg N2O-N yr-1 (1 Gg=109g) in 1986 and 2014, respectively) were significantly higher than those for other river orders, and the value for 7th order was the lowest owing to its less surface area and lower N2O transfer velocity. N2O emission for 6th order is higher than that for 4th, 5th, 7th, and 8th orders between 1986 and 2014. The total emission was 0.66 Gg N2O-N yr-1 in 1986 and increased to 10.3 Gg N2O-N yr-1 in 2014 for the entire CRN.
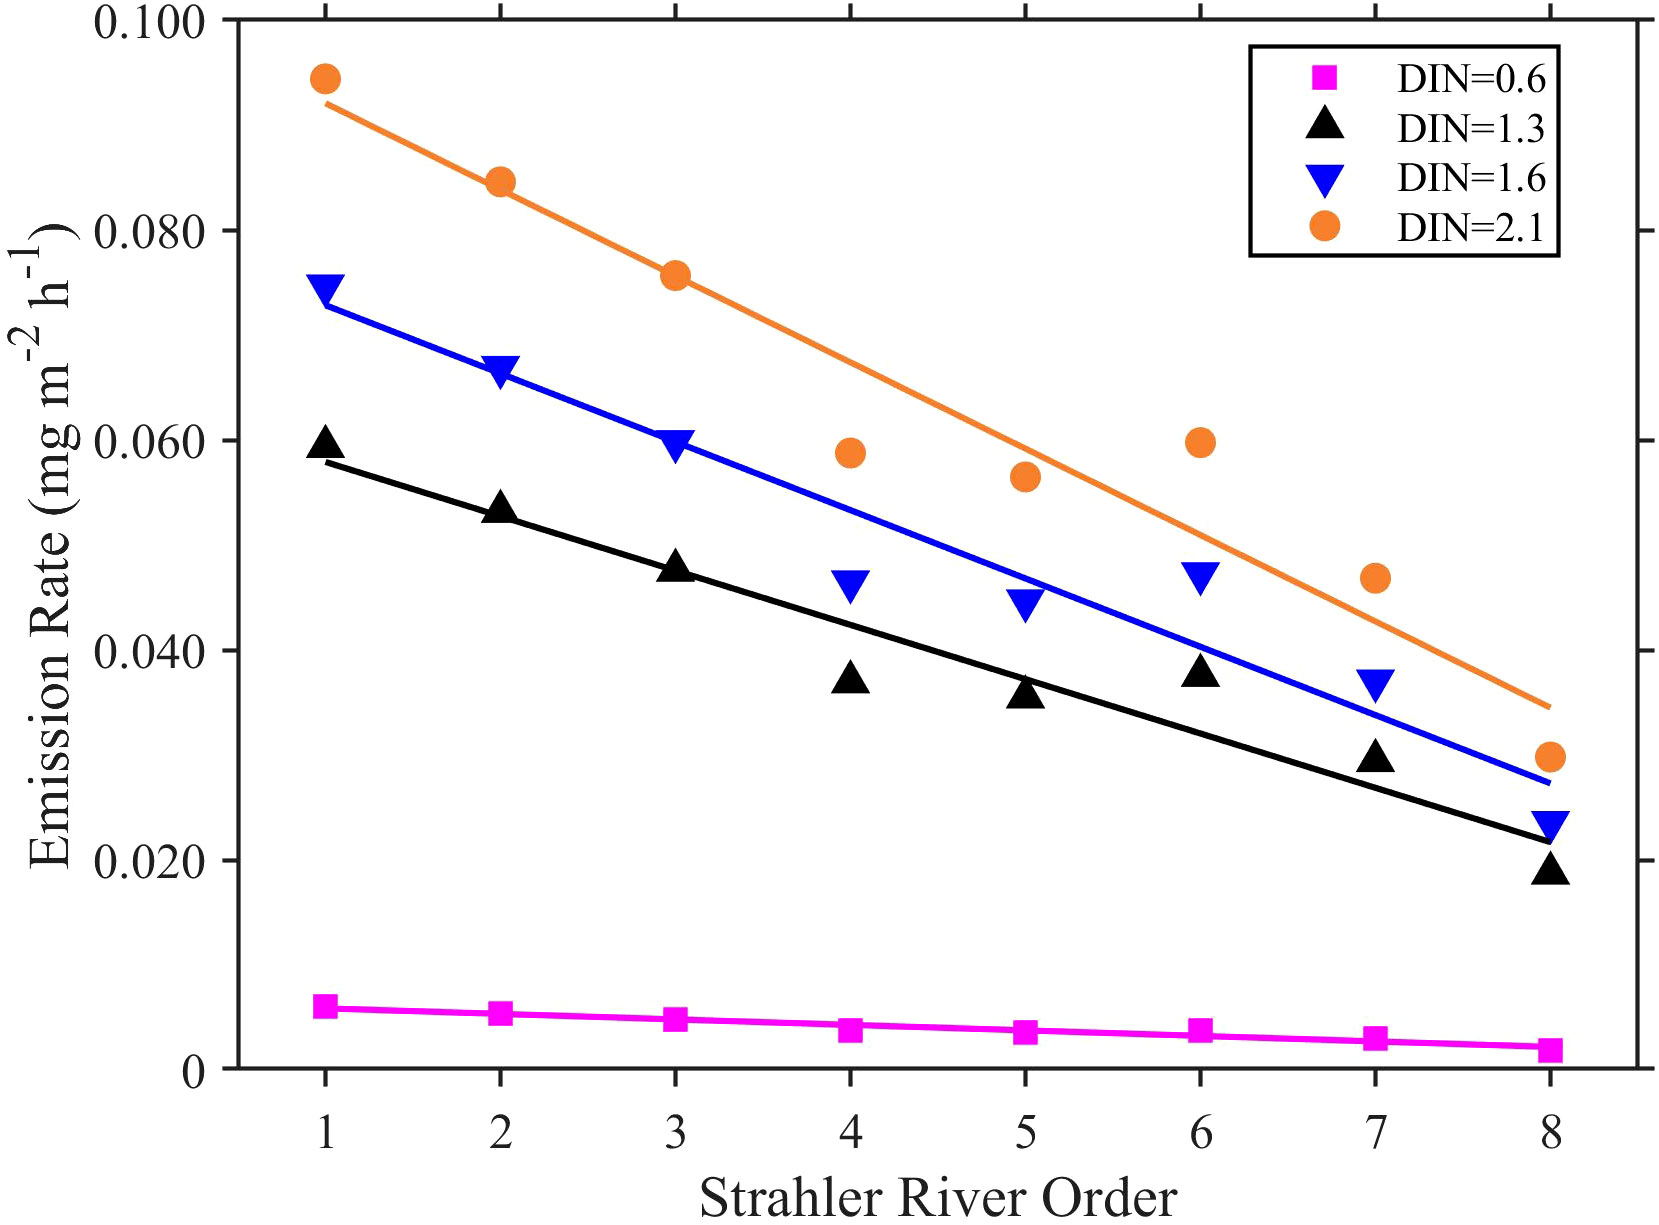
Figure 3 The relationship between N2O emission rate and the Strahler river order in the CRN at each given [DIN] between 1986 and 2014. (DIN = 0.6 mg L-1 between 1986 and 1990, 1.3 mg L-1 between 1991 and 1999, 1.6 mg L-1 between 2000 and 2009, and 2.1 mg L-1 for 2014).
Mass ratio of N2O emission to DIN load
The mass ratio of DIN that emits as N2O against that entering the river network can be considered as the EF (i.e., the ratio of N2O emission to DIN load). Then, we calculated and characterized the ratio to scale up it within the observed concentration by combining with “spiraling” theory. This ratio can be compared to test the appropriateness of the default IPCC EF5r (IPCC, 2006) with full considering N loads, biogeochemical and hydrological processes at watershed scale.
Areal rate of total DIN uptake through N2O emissions (Vf), responds differently to river hydrological processes and [DIN]. We calculated Vf of rivers from 1st to 8th orders, and Vf ranged from 0.131 m yr-1 to 0.436 m yr-1. Vf was greater in headwater rivers, and declined linearly with river order (Figure 4). In river networks, river size or river hydrological conditions such as river depth and water residence times control the processes of nitrification and denitrification in several ways. DIN can convert efficiently as N2O in rivers with lower order or small streams (due to their high ratios of riverbed area to water volume) and have a cumulative influence on entire network N2O emissions because they account for most of the river length (about 74.3% of total river length for 1st and 2nd river orders) in the CRN (Table 1). Lower ratios of riverbed area to water volume for rivers with higher order or larger rivers make them less efficient in N2O production.
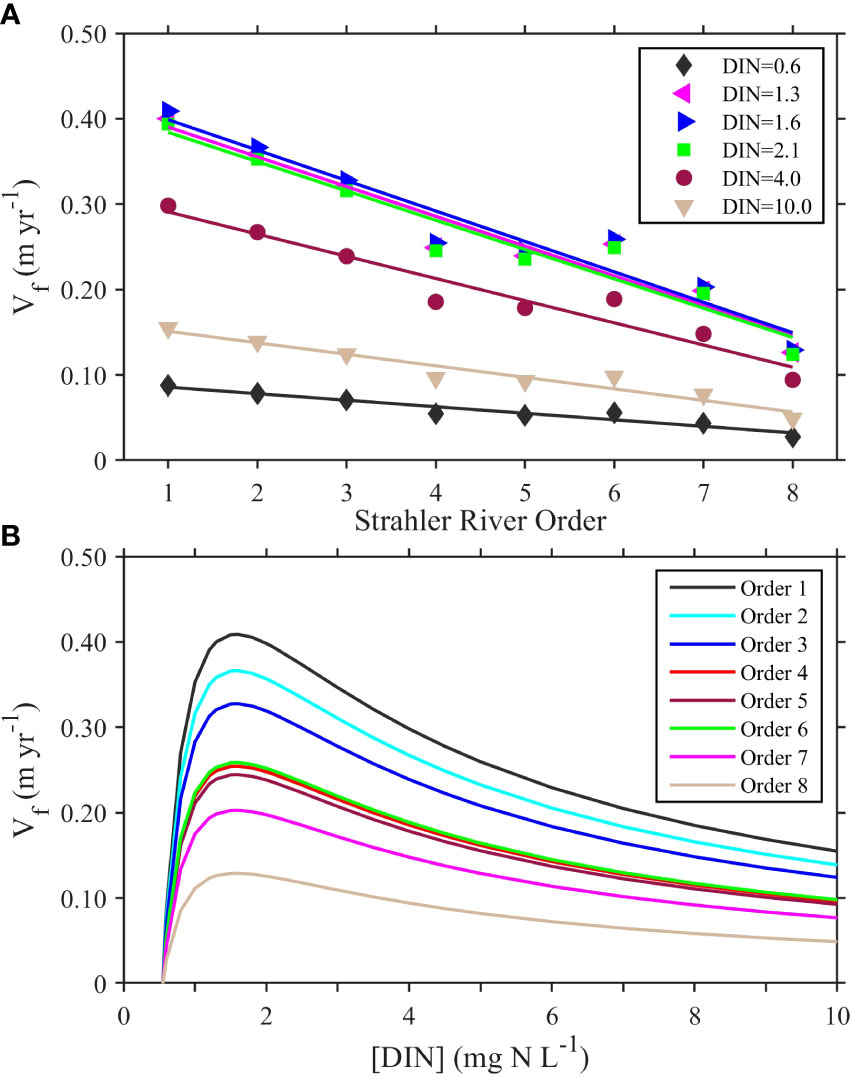
Figure 4 Relationships between Vf and river order and [DIN] in the CRN. (A) Relationships between Vf and Strahler river order at six given [DIN] (0.6,1.3, 1.6,2.1,4.0, 10.0 mg L-1); (B) Vf in response to [DIN]. Vf does not increase in parallel with [DIN] when it was higher than 1.6 mg L-1.
Vf has different dynamic responses to [DIN] in the CRN. Thus, we further estimated the change of Vf values at six given [DIN] (0.6, 1.3, 1.6, 2.1, 4.0, and 10.0 mg L-1) for each river order (Figure 4B). Vf increased linearly with [DIN] when it was less than 1.6 mg L-1, but declined linearly as [DIN] continued to increase (Figure 4B). We hypothesized that the linear decline in N2O Vf was the result of both increased [DIN] and lower efficiency in converting DIN into N2O. Our Global-NEWS2-DIN model demonstrated that the average [DIN] in the CRN was higher than 1.6 mg L-1 in 2000, and higher than 2.0 mg L-1 in 2014. Thus, our study suggests that Vf did not increase in parallel with [DIN] when it was higher than 1.6 mg L-1 in the CRN after 2000.
The N2O loss rate (ζ), combining the conversion velocity and river depth, varied from 0.27×10⁻⁴ d-1 to 37.64×10⁻⁴ d-1 for the rivers with one to eight orders (Figure 5). The ζ values had significant spatial patterns. The highest ζ value (37.64×10⁻⁴ d−1) was observed in rivers with lower order (1st to 3rd) and the lowest (0.27×10⁻⁴ d-1) in rivers with higher order (8th). We found that the ζ values declined exponentially with increased river order (R2 = 0.99, p< 0.01).

Figure 5 Relationships between N2O loss rate (ζ) and river order.
The mass ratio of DIN that emits as N2O against that entering the river network, representing EF, has a dynamic pattern in response to both [DIN] and Strahler river orders (Figure 6A). EF was the highest for 6th river order (average: 0.0556), and the lowest for 7th order rivers (average: 0.0155) in the CRN during 1986-2014 when [DIN] was in the range of 0.55-2.10 mg L-1. EF ranged from 0.0015 to 0.050 with an average of 0.0384 for the main stem of the Changjiang River (8th order river) between 1986 and 2014. For all the Strahler orders, EF increased linearly with [DIN] when [DIN] was less than 1.6 mg L-1, but declined linearly with increasing [DIN] when it was higher than 1.6 mg L-1 (Figure 6A), indicating that EF does not increase in parallel with [DIN]. Thus, rivers became less efficient at conversion of DIN although excess DIN increased uptake rate per area of streambed. The threshold value is about 1.6 mg L-1 in [DIN] for the CRN.
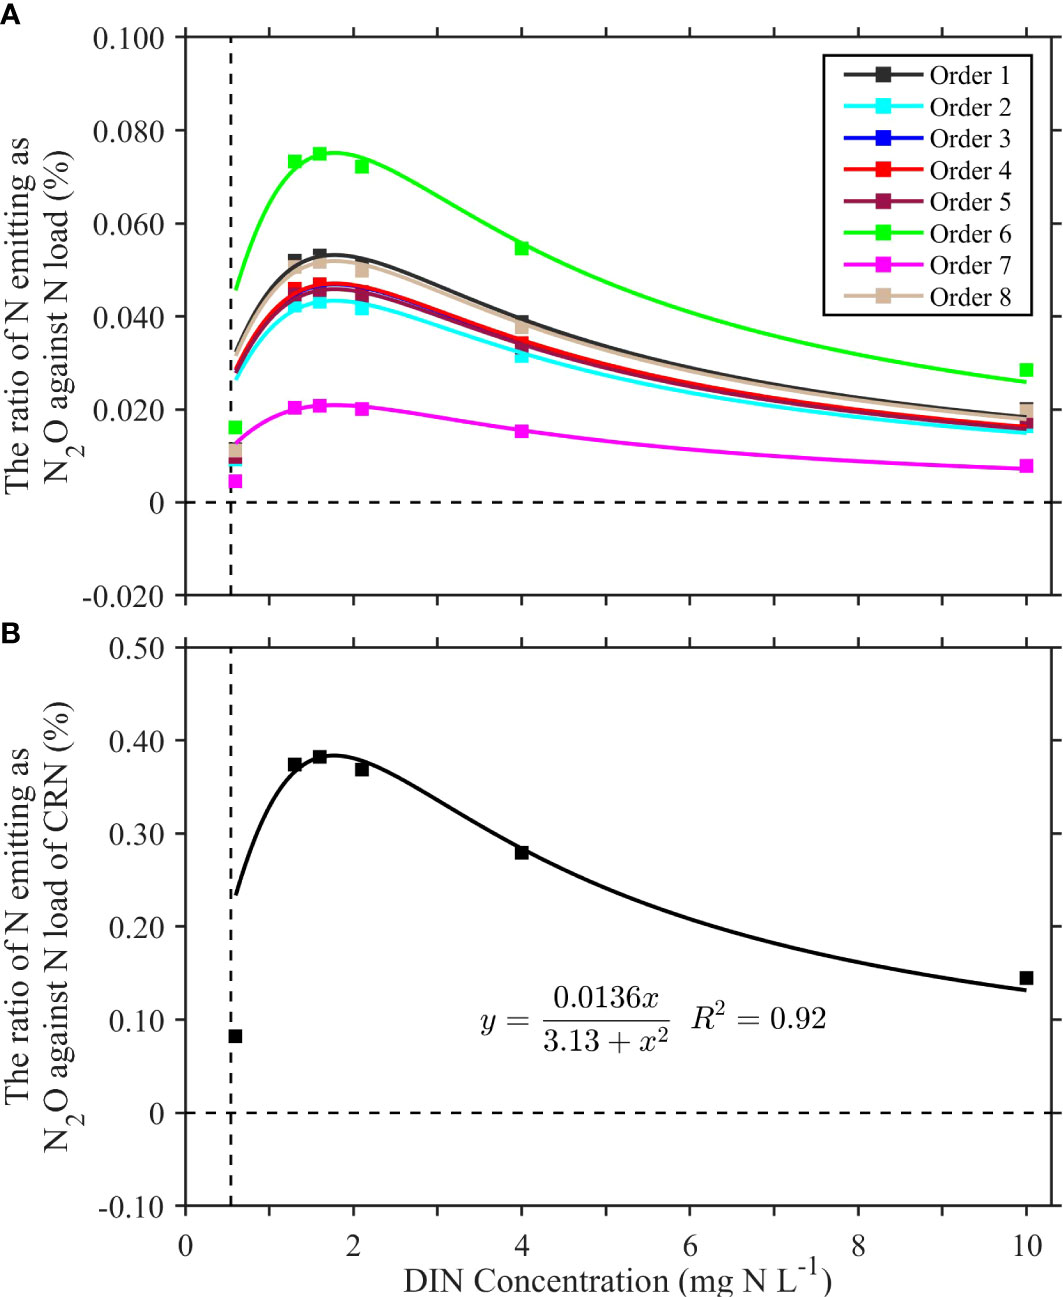
Figure 6 Dynamic response of the ratio of DIN emitting as N2O against that entering the river network to [DIN] for (A) Strahler river orders and (B) the entire CRN.
Our study shows that the integrated EF for the entire CRN, was also not a constant (Figure 6B), depending on both N loads and hydrological conditions at river ecosystem scale. When [DIN] were lower than 0.5 mg L-1, EF values were below zero, indicating no N2O emission. EF value ranged from 0.0113% to 0.382%, significantly increased with [DIN], when [DIN] was in the range of 0.55-1.6 mg L-1. EF value, however, declined linearly with increasing [DIN] when it was higher than 1.6 mg L-1. The dynamic response of EF to DIN demonstrates the diminishing capacity of river ecosystems to convert excess DIN into N2O when N load increased as a direct result of human activities.
Discussion
Uncertainties in N2O emissions
Uncertainties in quantifying N2O emissions from the CRN existed in two key variables: (1) water surface area of the river network, (2) N2O transfer velocity.
Generally, the riverine surface area determines the magnitude of riverine N2O emissions. First, our calculation of the riverine surface area is based on data extracted from a 90 m resolution Shuttle Radar Topography Mission (SRTM) DEM data set in Arcgis 10.2 in combining with the Strahler river order method (Strahler, 1957).
In our study, the lower land of the CRN, such as Taihu Lake area and its adjacent area were excluded due to the limit of DEM (Figure 1). This region represents less than 5% area of the entire Changjiang River basin, and the ignorance of river surface area of this area could not result in significant difference. Thus, despite the uncertainty of DEM extraction result, its influence on water surface area were expected to be insignificant. Secondly, there are some kinds of ephemeral and intermittent rivers in the CRN. These rivers are dry up for certain time of one year and will not involve in air-water N2O exchange. As there are no direct observation data in the CRN, we used the regression results of USGS data (Raymond et al., 2013) to determine the ephemeral surface area. As a result, the total calculated area ranged from 150.2 to 232.9 km2 for the period between 1970 and 2014, accounting for ~1.03 ± 0.10% of the total water surface area. Therefore, the influence of the ephemeral and intermittent rivers to the total emissions could be negligible. Our calculated surface area of the CRN (18765.7 ± 686.7 km2) is much lower than the reported data used by Yan et al. (Yan et al., 2012), because our calculation does not include lakes, reservoirs and ponds within the basin. We could not find any comparable previous regional estimate for river surface water area in the CRN. Nevertheless, our estimated water surface area accounts for 1.07 ± 0.04% of the Changjiang River basin. The ratio is comparable, but a little higher than that estimated by Raymond (Raymond et al., 2013) with 0.83%. Therefore, our estimation of the water surface area for the CRN is considered to be defensible.
Uncertainty in quantifying of gas transfer (k600) is significant, especially in the large river network. But considering the difficulties in measuring k600 spatially and temporally cross a wide range of the network, empirical models can be adopted to estimate the value (Raymond and Cole, 2001; Striegl et al., 2012; Borges et al., 2015). Factors used to model this value include river channel slope, flow velocity, wind, etc. At one hand, river channel slope and flow velocity, as the major parameters to determine river energy dissipation and turbulence, are intrinsically connected with k600 (Raymond et al., 2012). On the other hand, wind is considered to be the key factor controlling on k600, particular in open waters such as lakes, estuaries. In this study, we adopted in-river flow velocity and channel slope to calculate k600 that appears to vary across river orders. Our results are comparable to that measured by chambers measurements (Striegl et al., 2012), and fall in the range of model-estimated for the rivers of US (Butman and Raymond, 2011), Africa (Borges et al., 2015) and the world (Raymond et al., 2013), respectively, but higher than that from wind-based calculation (Borges et al., 2004; Yan et al., 2012; Rasera et al., 2013; Wang et al., 2015a), especially for the rivers with lower river orders. The inverse relationship between k600 and river orders indicates the less gas exchange velocity for large river and more exchange for lower order rivers. Lower order rivers and middle-size rivers usually have a higher vegetation cover and shading (Bouwman et al., 2013b), river surfaces tend to be less affected by wind than larger rivers. This may explain gas transfer velocity in small and middle size rivers are more controlled by channel slope and flow velocity rather than wind speed. Therefore, it results in greater uncertainties in estimating k600 based on wind. The surface area weighted average k600 value for the entire CRN was 5.22 ± 0.04 m d-1, much higher than those calculated with wind-based models (Yan et al., 2012; Wang et al., 2015a). Our revisiting calculation of k600 values based on in-river flow velocity and channel slope, together with the estimation of the riverine surface area, can also contribute to understand regional riverine budgets of other greenhouse gases such as CO2 and CH4 in the CRN.
Previous estimations were assumed that N2O emissions were linearly correlated with DIN loads, but riverine N2O production was nonlinearly response to [DIN]. Therefore, it may overestimate N2O emissions at low DIN loads such as rivers in Africa (Borges et al., 2015) and the Quebec (Soued et al., 2016), and underestimate N2O emissions at high DIN loads in rivers such as in corn belt (Turner et al., 2015).
N2O hotspots along the aquatic continuum from headwater streams to the estuary
The N2O emission rates increased rapidly from 1986 to 2014, and reached to be about 2.332 ± 0.186 mg N m-2 d-1 during the period of 2010 - 2014 in headwater streams. The 1st to 3rd Strahler order rivers were defined as headwater streams (Gong et al., 2021). We used the surface areas of all 1st to 3rd order streams and rivers, and calculated the emission amount to be 1.998 ± 0.195 Gg N2O-N yr-1 in 2010-2014. The averaged N2O emission rate in the mainstem was about 0.686 ± 0.054 mg N m-2 d-1 in 2010-2014. We used the surface areas of mainstem, and calculated the emission amount to be 0.786 ± 0.061 Gg N2O-N yr-1.
We compiled the data of N2O emission rate and amount in the Changjiang river estuary reported by Wang et al. (2014b) compared with these for the rivers of the continuum (Figure 7). We found the N2O emission rate and amount were higher in the headwater streams than these in the mainstem and the estuary. These suggested that headwater streams are hotspots of N2O emission across the whole aquatic continuum.
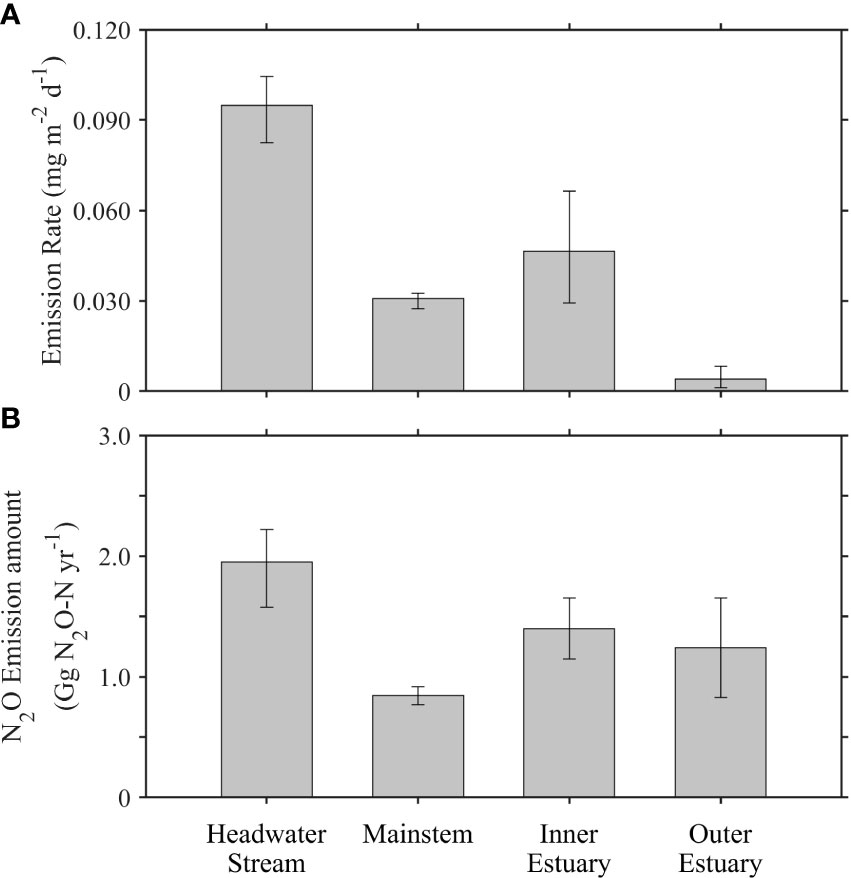
Figure 7 (A) N2O emission rate and (B) N2O emission amoun across the aquatic continuum among the headwater streams (1st to 3rd order), mainstem, and the estuary in the same research period of 2010-2014. The data of N2O emission in the estuary from Wang et al. (2014b).
Significance of the CRN N2O emissions for the regional budget
As we discussed in the above section, N2O emissions ranged from 0.66 to 10.3 Gg N2O-N yr-1 between 1986 and 2014 for the entire CRN. The estimations of the total N2O emissions for the period between 1986 and 2002 are much higher than that of the previous report by Yan et al. (2012) for the same period owing to the revisiting higher values for both k600 and EF (Yan et al., 2012; Wang et al., 2015a). This is because previous studies calculated N2O emission from the entire CRN using wind speed method only in main stem, which neglected longitudinal variations of k600 and EF among different river orders. Lower order and middle size rivers usually with higher vegetation cover and shading, of which water surface is recognized having less affected by wind than larger rivers (Bouwman et al., 2013a), but more affected by river channel slope (Raymond and Cole, 2001; Raymond et al., 2013). As a result, mean kN2O in 1st to 3rd order streams were about 3.55, 3.14, and 2.77 times that of 8th order rivers (Figure S3b). We also compare our result with the both global and other regional scales in riverine N2O emission budgets. Taking the N2O emission for the period between 2010 and 2014, the regional budget in N2O emissions from the CRN (averaged: 10.3 Gg N2O-N yr-1) accounts for about 0.82% - 5.31% of global riverine N2O budget (Table 2) (Seitzinger and Kroeze, 1998; Seitzinger et al., 2000; Kroeze et al., 2005; Garnier et al., 2009; Beaulieu et al., 2011; Baron et al., 2012; Soued et al., 2016). Our results were lower than that estimated for US Rivers (Baron et al., 2012), but almost equal to the emission from Asian rivers (Hu et al., 2016). Our estimate may represent the minimum limit of N2O emissions because our estimate only considers rivers and streams, not including other parts of the total inland water areas, such as lakes, reservoirs, and ponds in the Changjiang River basin. In recent decades, the construct of countless dams or reservoirs may alter the hydrological and biogeochemical processes, which have increased the travel time of water, reduced down-river suspended sediment content, and changed (promoted/weakened) denitrification, etc (Wisser et al., 2010). The collection of disturbance types, their legacy and influence on N2O budgets is beyond this study, but deserve further study to accurately assessment N2O emissions from the CRN.
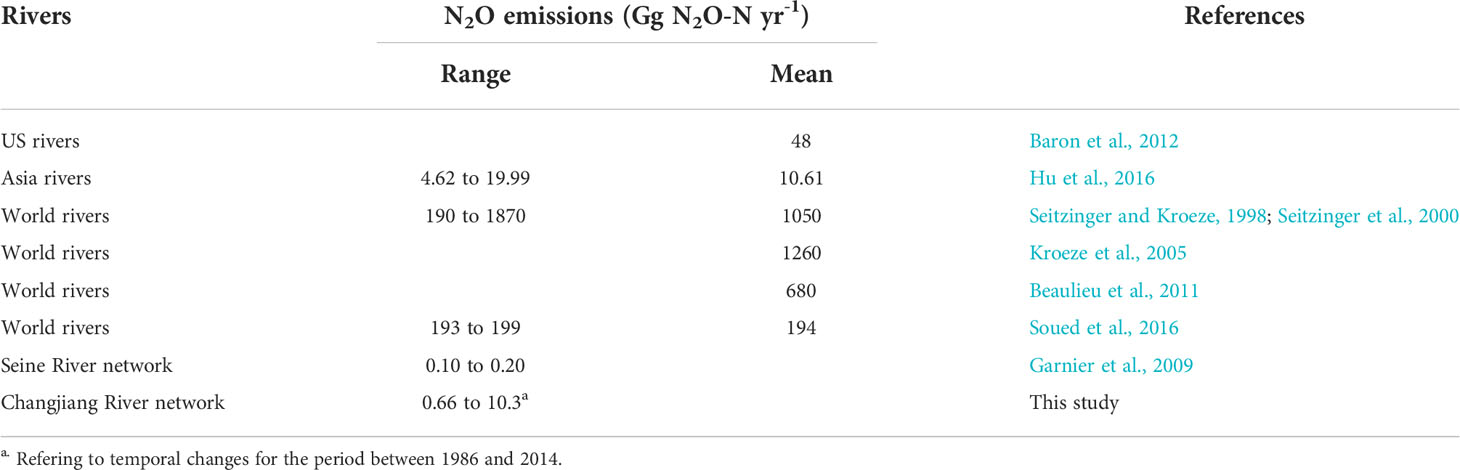
Table 2 N2O emissions from regional and world rivers.
Conclusions
Our study demonstrates the significant nonlinear relation between DIN and N2O in the CRN, and models evaluated in this study indicate that the CRN is supersaturated with N2O since 1986. We find the N2O emission rate is negatively related to Strahler river orders, and positively related to N loading. Our analysis showed that EF was dynamic rather than static in response to [DIN], it increases with N loading within a certain range, and then declines linearly with increasing N loading.
Our analysis of the N2O budget in the CRN revealed a significant temporal increasing trend at the regional scale. On average, 0.66 Gg N2O-N yr-1 in 1986 and 10.3 Gg N2O-N N yr-1 in 2014 were emitted from the entire CRN, respectively.
A comparison of our regional-scale study with other studies from different scales showed a relatively wide range of variability in riverine N2O emission. Our estimate of N2O emission in the CRN during 2010-2014 is about 0.82% - 5.31% of global riverine N2O budget. Our study shows that the headwater streams are hotspots of N2O emission across the whole aquatic continuum.
The importance of the entire river network to N2O emissions provides information on the origins of large river network N2O budget, including artificial reservoirs, natural lakes and wetlands. Further study on the surface area and N2O of these inland aquatic systems is needed to further evaluate the relative importance of different sources.
Data availability statement
The original contributions presented in the study are included in the article/Supplementary Material, further inquiries can be directed to the corresponding author/s.
Author contributions
FW, QY, and WY designed the research and wrote the manuscript. QY carried out the data analysis. ST, PZ, and JW provided the data support. All authors contributed to the article and approved the submitted version.
Funding
This work is jointly supported by National Natural Science Foundation of China (41877483, 42077304, and 42106214), National Key Research and Development Program of China (2019YFC0507805), the Strategic Leading Science and Technology Program of the Chinese Academy of Sciences (XDA20020202).
Conflict of interest
The authors declare that the research was conducted in the absence of any commercial or financial relationships that could be construed as a potential conflict of interest.
Publisher’s note
All claims expressed in this article are solely those of the authors and do not necessarily represent those of their affiliated organizations, or those of the publisher, the editors and the reviewers. Any product that may be evaluated in this article, or claim that may be made by its manufacturer, is not guaranteed or endorsed by the publisher.
Supplementary material
The Supplementary Material for this article can be found online at: https://www.frontiersin.org/articles/10.3389/fmars.2022.1025912/full#supplementary-material
References
Alin S. R., de Fátima F. L., Rasera M., Salimon C. I., Richey J. E., Holtgrieve G. W., et al. (2011). Physical controls on carbon dioxide transfer velocity and flux in low-gradient river systems and implications for regional carbon budgets. J. Geophys. Res.: Biogeosci. 116 (G1), G01009. doi: 10.1029/2010JG001398
An Y., Lyu J., Wu Q., Luo J., Jiang H., Peng W., et al. (2015). Hydro-chemical characteristics of upper chishui river basin in dry season. Environ. Sci. Technol. 38 (8), 117–122. doi: 10.3969/j.issn.1003-6504.2015.08.021
Barnes J., Owens N. J. P. (1999). Denitrification and nitrous oxide concentrations in the Humber estuary, UK, and adjacent coastal zones. Mar. pollut. Bull. 37 (3), 247–260. doi: 10.1016/S0025-326X(99)00079-X
Baron J. S., Hall E. K., Nolan B. T., Finlay J. C., Bernhardt E. S., Harrison J. A., et al. (2012). The interactive effects of excess reactive nitrogen and climate change on aquatic ecosystems and water resources of the united states. Biogeochemistry 114 (1), 71–92. doi: 10.1007/s10533-012-9788-y
Battye W., Aneja V. P., Schlesinger W. H. (2017). Is nitrogen the next carbon? Earth's Future 5 (9), 894–904. doi: 10.1002/2017EF000592
Beaulieu J. J., Shuster W. D., Rebholz J. A. (2010). Nitrous oxide emissions from a Large, impounded river: The Ohio river. Environ. Sci. Technol. 44 (19), 7527–7533. doi: 10.1021/es1016735
Beaulieu J. J., Tank J. L., Hamilton S. K., Wollheim W. M., Hall R. O., Mulholland P. J., et al. (2011). Nitrous oxide emission from denitrification in stream and river networks. Proc. Natl. Acad. Sci. 108 (1), 214–219. doi: 10.1073/pnas.1011464108
Borges A. V., Darchambeau F., Teodoru C. R., Marwick T. R., Tamooh F., Geeraert N., et al. (2015). Globally significant greenhouse-gas emissions from African inland waters. Nat. Geosci. 8 (8), 637–642. doi: 10.1038/ngeo2486
Borges A. V., Vanderborght J.-P., Schiettecatte L.-S., Gazeau F., Ferrón-Smith S., Delille B., et al. (2004). Variability of the gas transfer velocity of CO2 in a macrotidal estuary (the scheldt). Estuaries 27 (4), 593–603. doi: 10.1007/BF02907647
Bouwman A. F. (1996). Direct emission of nitrous oxide from agricultural soils. Nutrient Cycling Agroecosyst. 46 (1), 53–70. doi: 10.1007/bf00210224
Bouwman A. F., Beusen A. H. W., Griffioen J., Van Groenigen J. W., Hefting M. M., Oenema O., et al. (2013a). Global trends and uncertainties in terrestrial denitrification and N2O emissions. Philos. Trans. R. Soc. B-Biol. Sci. 368 (1621). doi: 10.1098/rstb.2013.0112
Bouwman A. F., Bierkens M. F. P., Griffioen J., Hefting M. M., Middelburg J. J., Middelkoop H., et al. (2013b). Nutrient dynamics, transfer and retention along the aquatic continuum from land to ocean: towards integration of ecological and biogeochemical models. Biogeosciences 10 (1), 1–22. doi: 10.5194/bg-10-1-2013
Boyer E. W., Alexander R. B., Parton W. J., Li C. S., Butterbach-Bahl K., Donner S. D., et al. (2006). Modeling denitrification in terrestrial and aquatic ecosystems at regional scales. Ecol. Appl. 16 (6), 2123–2142. doi: 10.1890/1051-0761(2006)016[2123:mditaa]2.0.co;2
Butman D., Raymond P. A. (2011). Significant efflux of carbon dioxide from streams and rivers in the united states. Nat. Geosci. 4 (12), 839–842. doi: 10.1038/ngeo1294
Chetelat B., Liu C. Q., Zhao Z. Q., Wang Q. L., Li S. L., Li J., et al. (2008). Geochemistry of the dissolved load of the changjiang basin rivers: Anthropogenic impacts and chemical weathering. Geochim. Cosmochim. Acta 72 (17), 4254–4277. doi: 10.1016/j.gca.2008.06.013
China (1970-2012). “Hydrological data of changjiang river basin,” in Annual hydrological report, p. r. China (Beijing: China Hydrology the ministry of water resources of the People's Republic of China).
Cole J. J., Caraco N. F. (2001). Emissions of nitrous oxide (N2O) from a tidal, freshwater river, the Hudson river, new York. Environ. Sci. Technol. 35 (6), 991–996. doi: 10.1021/es0015848
Cui X., Huang C. Z., Wu J. P., Liu X. H., Hong Y. G. (2020). Temporal and spatial variations of net anthropogenic nitrogen inputs (NANI) in the pearl river basin of China from 1986 to 2015. PloS One 15 (2), e0228683. doi: 10.1371/journal.pone.0228683
Earl S. R., Valett H. M., Webster J. R. (2006). Nitrogen saturation in stream ecosystems. Ecology 87 (12), 3140–3151. doi: 10.1890/0012-9658(2006)87[3140:NSISE]2.0.CO;2
Ensign S. H., Doyle M. W. (2006). Nutrient spiraling in streams and river networks. J. Geophys. Res.: Biogeosci. 111 (G4), G04009. doi: 10.1029/2005JG000114
Garnier J., Billen G., Vilain G., Martinez A., Silvestre M., Mounier E., et al. (2009). Nitrous oxide (N2O) in the seine river and basin: Observations and budgets. Agriculture Ecosyst. Environ. 133 (3–4), 223–233. doi: 10.1016/j.agee.2009.04.024
Gong C., Yan W., Zhang P., Yu Q., Li Y., Li X., et al. (2021). Effects of stream ecosystem metabolisms on CO2 emissions in two headwater catchments, southeastern China. Ecol. Indic. 130, 108136. doi: 10.1016/j.ecolind.2021.108136
Han G., Li F., Tan Q. (2014). Effects of land use on water chemistry in a river draining karst terrain, southwest China. Hydrol. Sci. J. 59 (5), 1063–1073. doi: 10.1080/02626667.2014.902948
Han G., Liu C. (2004). Water geochemistry controlled by carbonate dissolution: a study of the river waters draining karst-dominated terrain, guizhou province, China. Chem. Geol. 204 (1–2), 1–21. doi: 10.1016/j.chemgeo.2003.09.009
Han G., Tang Y., Xu Z. (2010). Fluvial geochemistry of rivers draining karst terrain in southwest China. J. Asian Earth Sci. 38 (1–2), 65–75. doi: 10.1016/j.jseaes.2009.12.016
Harman C., Stewardson M., DeRose R. (2008). Variability and uncertainty in reach bankfull hydraulic geometry. J. Hydrol. 351 (1–2), 13–25. doi: 10.1016/j.jhydrol.2007.11.015
Hinshaw S. E., Dahlgren R. A. (2013). Dissolved nitrous oxide concentrations and fluxes from the eutrophic San Joaquin river, California. Environ. Sci. Technol. 47 (3), 1313–1322. doi: 10.1021/es301373h
Hu M., Chen D., Dahlgren R. A. (2016). Modeling nitrous oxide emission from rivers: a global assessment. Global Change Biol. 22 (11), 3566–3582. doi: 10.1111/gcb.13351
IPCC (2006). IPCC guidelines for national greenhouse gas inventories (Cambridge, UK: Cambridge University Press).
Jiang T., Yu Z., Song X., Cao X., Yuan Y. (2012). Analysis of distribution, flux and long-term variations of dissolved inorganic nitrogen and phosphate in the changjiang river. Oceanol. Limnol. Sin. 43 (6), 1067–1075. doi: 10.11693/hyhz201206006006
Ji H., Jiang Y. (2012). Carbon flux and c, s isotopic characteristics of river waters from a karstic and a granitic terrain in the Yangtze river system. J. Asian Earth Sci. 57, 38–53. doi: 10.1016/j.jseaes.2012.06.004
Jung D., Paik K., Kim J. H. (2013). Relationship between downstream hydraulic geometry and suspended sediment concentration characteristics. J. Hydro-environment Res. 7 (4), 243–252. doi: 10.1016/j.jher.2013.03.002
Kool D. M., Dolfing J., Wrage N., Van Groenigen J. W. (2011). Nitrifier denitrification as a distinct and significant source of nitrous oxide from soil. Soil Biol. Biochem. 43 (1), 174–178. doi: 10.1016/j.soilbio.2010.09.030
Kroeze C., Dumont E., Seitzinger S. P. (2005). New estimates of global emissions of N2O from rivers and estuaries. Environ. Sci. 2 (2-3), 159–165. doi: 10.1080/15693430500384671
Leopold L. B., Maddock T. (1953). "The hydraulic geometry of stream channels and some physiographic implications". (Washington, D.C.).
Li S., Chetelat B., Yue F., Zhao Z., Liu C. (2014a). Chemical weathering processes in the yalong river draining the eastern Tibetan plateau, China. J. Asian Earth Sci. 88, 74–84. doi: 10.1016/j.jseaes.2014.03.011
Li X., Liu C., Liu X., Yu J., Liu X. (2014b). Sources and processes affecting nitrate in a dam-controlled subtropical river, southwest China. Aquat. Geochem. 20 (5), 483–500. doi: 10.1007/s10498-014-9231-1
Li X., Masuda H., Liu C. (2008). Chemical and isotopic compositions of the minjiang river, a headwater tributary of the Yangtze river. J. Environ. Qual. 37 (2), 409–416. doi: 10.2134/jeq2006.0554
Liu Q., Yu C., Zhang J., Chen X., Ge G., Wu L. (2013). Water quality variations in poyang lake. J. Agro-Environment Sci. 32 (6), 1232–1237. doi: 10.11654/jaes.2013.06.021
Li Q., Wang F., Yu Q., Yan W., Li X., Lv S. (2019). Dominance of nitrous oxide production by nitrification and denitrification in the shallow chaohu lake, Eastern China: Insight from isotopic characteristics of dissolved nitrous oxide. Environ. pollut. 255, 113212. doi: 10.1016/j.envpol.2019.113212
Li S., Xu Z., Wang H., Wang J., Zhang Q. (2009). Geochemistry of the upper han river basin, China: 3: Anthropogenic inputs and chemical weathering to the dissolved load. Chem. Geol. 264 (1–4), 89–95. doi: 10.1016/j.chemgeo.2009.02.021
Lu X., Li S., He M., Zhou Y., Bei R., Li L., et al. (2011). Seasonal changes of nutrient fluxes in the upper changjiang basin: An example of the longchuanjiang river, China. J. Hydrol. 405 (3–4), 344–351. doi: 10.1016/j.jhydrol.2011.05.032
Luo J., An Y., Wu Q., Yang R., Jiang H., Peng W., et al. (2014). Spatial distribution of surface water chemical components in the middle and lower reaches of the chishui river basin. Earth Environ. 42 (3), 297–305. doi: CNKI:SUN:DZDQ.0.2014-03-004
Marzadri A., Tonina D., Bellin A., Tank J. L. (2014). A hydrologic model demonstrates nitrous oxide emissions depend on streambed morphology. Geophys. Res. Lett. 41 (15), 5484–5491. doi: 10.1002/2014GL060732
Mayorga E., Seitzinger S. P., Harrison J. A., Dumont E., Beusen A. H. W., Bouwman A. F., et al. (2010). Global nutrient export from WaterSheds 2 (NEWS 2): Model development and implementation. Environ. Model. Software 25 (7), 837–853. doi: 10.1016/j.envsoft.2010.01.007
Mulholland P. J., Helton A. M., Poole G. C., Hall R. O., Hamilton S. K., Peterson B. J., et al. (2008). Stream denitrification across biomes and its response to anthropogenic nitrate loading. Nature 452 (7184), 202–205. doi: 10.1038/nature06686
Nevison C., Hess P., Riddick S., Ward D. (2016). Denitrification, leaching, and river nitrogen export in the community earth system model. J. Adv. Modeling Earth Syst. 8 (1), 272–291. doi: 10.1002/2015MS000573
Qu B., Sillanpää M., Zhang Y., Guo J., Wahed M. M. A., Kang S. (2015). Water chemistry of the headwaters of the Yangtze river. Environ. Earth Sci. 74 (8), 6443–6458. doi: 10.1007/s12665-015-4174-4
Rasera M., Krusche A., Richey J., Ballester M. R., Victória R. (2013). Spatial and temporal variability of pCO2 and CO2 efflux in seven Amazonian rivers. Biogeochemistry 116 (1-3), 241–259. doi: 10.1007/s10533-013-9854-0
Raymond P. A., Cole J. J. (2001). Gas exchange in rivers and estuaries: choosing a gas transfer velocity. Estuaries 24 (2), 312–317. doi: 10.2307/1352954
Raymond P. A., Hartmann J., Lauerwald R., Sobek S., McDonald C., Hoover M., et al. (2013). Global carbon dioxide emissions from inland waters. Nature 503 (7476), 355–359. doi: 10.1038/nature12760
Raymond P. A., Zappa C. J., Butman D., Bott T. L., Potter J., Mulholland P., et al. (2012). Scaling the gas transfer velocity and hydraulic geometry in streams and small rivers. Limnol. Oceanogr.: Fluids Environments 2, 41–53. doi: 10.1215/21573689-1597669
Rosamond M. S., Thuss S. J., Schiff S. L. (2012). Dependence of riverine nitrous oxide emissions on dissolved oxygen levels. Nat. Geosci. 5 (10), 715–718. doi: 10.1038/ngeo1556
Royer T. V., Tank J. L., David M. B. (2004). Transport and fate of nitrate in headwater agricultural streams in Illinois. J. Environ. Qual. 33 (4), 1296–1304. doi: 10.2134/jeq2004.1296
Seitzinger S. P. (1988). Denitrification in freshwater and coastal marine ecosystems: Ecological and geochemical significance. Limnol. Oceanogr. 33 (4part2), 702–724. doi: 10.4319/lo.1988.33.4part2.0702
Seitzinger S., Harrison J. A., Bohlke J. K., Bouwman A. F., Lowrance R., Peterson B., et al. (2006). Denitrification across landscapes and waterscapes: A synthesis. Ecol. Appl. 16 (6), 2064–2090. doi: 10.1890/1051-0761(2006)016[2064:dalawa]2.0.co;2
Seitzinger S. P., Kroeze C. (1998). Global distribution of nitrous oxide production and n inputs in freshwater and coastal marine ecosystems. Global Biogeochem. Cycles 12 (1), 93–113. doi: 10.1029/97GB03657
Seitzinger S. P., Kroeze C., Styles R. V. (2000). Global distribution of N2O emissions from aquatic systems: natural emissions and anthropogenic effects. Chem. - Global Change Sci. 2 (3–4), 267–279. doi: 10.1016/S1465-9972(00)00015-5
Seitzinger S. P., Mayorga E., Bouwman A. F., Kroeze C., Beusen A. H. W., Billen G., et al. (2010). Global river nutrient export: A scenario analysis of past and future trends. Global Biogeochem. Cycles 24 (4), GB0A08. doi: 10.1029/2009GB003587
Soued C., del Giorgio P. A., Maranger R. (2016). Nitrous oxide sinks and emissions in boreal aquatic networks in Quebec. Nat. Geosci. 9 (2), 116–120. doi: 10.1038/ngeo2611
Strahler A. N. (1957). Quantitative analysis of watershed geomorphology. Eos Trans. Am. Geophys. Union 38 (6), 913–920. doi: 10.1029/TR038i006p00913
Striegl R. G., Dornblaser M. M., McDonald C. P., Rover J. R., Stets E. G. (2012). Carbon dioxide and methane emissions from the Yukon river system. Global Biogeochem. Cycles 26 (4), GB0E05. doi: 10.1029/2012GB004306
Sun C. C., Shen Z. Y., Xiong M., Ma F. B., Li Y. Y., Chen L., et al. (2013). Trend of dissolved inorganic nitrogen at stations downstream from the three-gorges dam of Yangtze river. Environ. pollut. 180, 13–18. doi: 10.1016/j.envpol.2013.05.003
Turner P. A., Griffis T. J., Baker J. M., Lee X., Crawford J. T., Loken L. C., et al. (2016). Regional-scale controls on dissolved nitrous oxide in the upper Mississippi river. Geophys. Res. Lett. 43 (9), 2016GL068710. doi: 10.1002/2016GL068710
Turner P. A., Griffis T. J., Lee X., Baker J. M., Venterea R. T., Wood J. D. (2015). Indirect nitrous oxide emissions from streams within the US corn belt scale with stream order. Proc. Natl. Acad. Sci. 112 (32), 9839–9843. doi: 10.1073/pnas.1503598112
Venkiteswaran J. J., Rosamond M. S., Schiff S. L. (2014). Nonlinear response of riverine N2O fluxes to oxygen and temperature. Environ. Sci. Technol. 48 (3), 1566–1573. doi: 10.1021/es500069j
Wang J., Chen N., Yan W., Wang B., Yang L. (2015a). Effect of dissolved oxygen and nitrogen on emission of N2O from rivers in China. Atmospheric Environ. 103, 347–356. doi: 10.1016/j.atmosenv.2014.12.054
Wang J., Li X., Yan W., Wang F., Ma P. (2014a). Watershed nitrogen export model related to changing nitrogen balance and hydrology in the changjiang river basin. Nutrient Cycling Agroecosyst. 98 (1), 87–95. doi: 10.1007/s10705-014-9598-9
Wang H., Wang Z. (2009). Geochemical studies on the main ions and strontium isotopes in the ganjiang river water. Earth Environ. 37 (4), 326–332. doi: 10.1016/S1874-8651(10)60080-4
Wang J., Yan W., Chen N., Li X., Liu L. (2015b). Modeled long-term changes of DIN:DIP ratio in the changjiang river in relation to chl-α and DO concentrations in adjacent estuary. Estuarine Coast. Shelf Sci. 166, 153–160. doi: 10.1016/j.ecss.2014.11.028
Wang L., Zhang G.-l., Sun M.-s., Ren J.-l. (2014b). Distributions and air-Sea fluxes of dissolved nitrous oxide in the Yangtze river estuary and its adjacent marine area in spring and summer. Environ. Sci. 35 (12), 4502–4510. doi: 10.13227/j.hjkx.2014.12.012
Wang H., Zhang L., Yao X., Xue B., Yan W. (2017). Dissolved nitrous oxide and emission relating to denitrification across the poyang lake aquatic continuum. J. Environ. Sci. 52, 130–140. doi: 10.1016/j.jes.2016.03.021
Wanninkhof R. (1992). Relationship between wind speed and gas exchange over the ocean. J. Geophys. Res.: Oceans 97 (C5), 7373–7382. doi: 10.1029/92JC00188
Weiss R. F., Price B. A. (1980). Nitrous oxide solubility in water and seawater. Mar. Chem. 8 (4), 347–359. doi: 10.1016/0304-4203(80)90024-9
Wisser D., Fekete B. M., Vörösmarty C. J., Schumann A. H. (2010). Reconstructing 20th century global hydrography: a contribution to the global terrestrial network- hydrology (GTN-h). Hydrol. Earth Syst. Sci. 14 (1), 1–24. doi: 10.5194/hess-14-1-2010
Workshop S. S. (1990). Concepts and methods for assessing solute dynamics in stream ecosystems. J. North Am. Benthol. Soc. 9 (2), 95–119. doi: 10.2307/1467445
Wu W., Yang J., Xu S., Yin H. (2008). Geochemistry of the headwaters of the Yangtze river, tongtian he and jinsha jiang: Silicate weathering and CO2 consumption. Appl. Geochem. 23 (12), 3712–3727. doi: 10.1016/j.apgeochem.2008.09.005
Wu W., Zheng H., Yang J., Luo C., Zhou B. (2013). Chemical weathering, atmospheric CO2 consumption, and the controlling factors in a subtropical metamorphic-hosted watershed. Chem. Geol. 356, 141–150. doi: 10.1016/j.chemgeo.2013.08.014
Xu Z., Shi C., Tang Y., Han H. (2011). Chemical and strontium isotopic compositions of the hanjiang basin rivers in China: Anthropogenic impacts and chemical weathering. Aquat. Geochem. 17 (3), 243–264. doi: 10.1007/s10498-011-9132-5
Yan W., Mayorga E., Li X., Seitzinger S. P., Bouwman A. F. (2010). Increasing anthropogenic nitrogen inputs and riverine DIN exports from the changjiang river basin under changing human pressures. Global Biogeochem. Cycles 24, GB0A06. doi: 10.1029/2009gb003575
Yan W., Yang L., Wang F., Wang J., Ma P. (2012). Riverine N2O concentrations, exports to estuary and emissions to atmosphere from the changjiang river in response to increasing nitrogen loads. Global Biogeochem. Cycles 26, GB4006. doi: 10.1029/2010gb003984
Yan W., Zhang S., Sun P., Seitzinger S. P. (2003). How do nitrogen inputs to the changjiang basin impact the changjiang river nitrate: A temporal analysis for 1968–1997. Global Biogeochem. Cycles 17 (4), 1091. doi: 10.1029/2002GB002029
Yu D., Yan W., Chen N., Peng B., Hong H., Zhuo G. (2015). Modeling increased riverine nitrogen export: Source tracking and integrated watershed-coast management. Mar. pollut. Bull. 101 (2), 642–652. doi: 10.1016/j.marpolbul.2015.10.035
Zarnetske J. P., Haggerty R., Wondzell S. M., Baker M. A. (2011). Dynamics of nitrate production and removal as a function of residence time in the hyporheic zone. Journal of Geophysical Research: Biogeosciences 116, G1, G01025. doi: 10.1029/2010JG001356
Keywords: N2O, loss rate, emission, mass ratio, the Changjiang River network
Citation: Wang F, Yu Q, Yan W, Tian S, Zhang P and Wang J (2022) Basin-scale control on N2O loss rate and emission in the Changjiang River network, China. Front. Mar. Sci. 9:1025912. doi: 10.3389/fmars.2022.1025912
Received: 23 August 2022; Accepted: 08 September 2022;
Published: 23 September 2022.
Edited by:
Xiaofei Li, East China Normal University, ChinaReviewed by:
Zhang Lu, Nanjing Institute of Geography and Limnology (CAS), ChinaWei Qian, Fujian Normal University, China
Copyright © 2022 Wang, Yu, Yan, Tian, Zhang and Wang. This is an open-access article distributed under the terms of the Creative Commons Attribution License (CC BY). The use, distribution or reproduction in other forums is permitted, provided the original author(s) and the copyright owner(s) are credited and that the original publication in this journal is cited, in accordance with accepted academic practice. No use, distribution or reproduction is permitted which does not comply with these terms.
*Correspondence: Weijin Yan, eWFud2pAaWdzbnJyLmFjLmNu
†These authors have contributed equally to this work, and are co-first authors