Abstract
The abyssal plains are vast areas without large scale relief that occupy much of the ocean floor. Although long considered relatively featureless, they are now known to display substantial biological heterogeneity across different spatial scales. Ecological research in these regions benefits increasingly from non-destructive visual sampling of epifaunal organisms with imaging technology. We analysed images from ultra-high-definition towed camera transects at depths of around 3500 m across three stations (100–130 km apart) in the Bering Sea, to ask whether the density and distribution of visible epifauna indicated any substantial heterogeneity. We identified 71 different megafaunal taxa, of which 24 occurred at only one station. Measurements of the two most abundant faunal elements, the holothurian Elpidia minutissima and two xenophyophores morphotypes (the more common identifiable as Syringammina limosa), indicated significant differences in local densities and patchy aggregations that were strikingly dissimilar among stations. One station was dominated by xenophyophores, one was relatively depauperate in both target taxa as well as other identified megafauna, and the third station was dominated by Elpidia. This is an unexpected level of variation within comparable transects in a well-mixed oceanic basin, reinforcing the emerging view that abyssal habitats encompass biological heterogeneity at similar spatial scales to terrestrial continental realms.
Introduction
Abyssal plains, flat regions of soft sediment at depths of ~3000 m and greater, have been recognised since the earliest scientific explorations of the deep ocean (Monin, 1983). Although few research expeditions target these large expanses of seafloor (Linley et al., 2017), they in fact host a rich community of mainly infaunal animals at varying size classes (O’Hara et al., 2020). Abyssal plains make up the largest fraction of the ocean floor, with estimates varying from ~30% (Harris, 2014) to over 75% (Ramirez-Llodra et al., 2010), depending on a more or less constrained interpretation of these vast habitats. Recent advances in bathymetry have enabled a dramatically greater understanding of heterogeneity in the seafloor (Weatherall et al., 2015), including topography that breaks up areas previously assumed to be uniform and featureless (Riehl et al., 2020). The scale of the associated biological heterogeneity in the deep sea is on par with that of continental terrestrial habitats (Levin et al., 2001a; Lapointe et al., 2020; Jamieson et al., 2020). Heterogeneity at the scale of 100s of km or smaller, and many undiscovered patches of hard-bottom substrata, may further enhance the higher-than-expected species richness and diversity that has long been reported to occur in oceanic basins (Hessler and Sanders, 1967; Riehl et al., 2020). Recent studies in the northeastern Atlantic focussing on fauna associated with abyssal hills suggest small topographic variations may promote significant changes in habitat (Durden et al., 2020). However, the heterogeneity that shapes the biodiversity of the global abyssal plains still remains poorly understood and requires further comparisons across different ocean basins.
Deep-sea soft-bottom habitats are typically sampled with a wide range of extractive gear, designed to collect infaunal and epibenthic species. These provide either point samples, such as box cores that sample a 0.25 m2 area, or towed gear that collect material from a much larger area and penetrate the sediment to a greater (Agassiz trawl) or lesser extent (epibenthic sledge). Each gear is designed to sample different faunistic size classes. Previous work has compared the effectiveness and efficiency of different sampling methods to assess local biodiversity, emphasising the complementarity of extractive gear types (Montagna et al., 2017; Jóźwiak et al., 2020; Lins and Brandt, 2020).
Although these sampling devices yield vital faunal data, direct visual observations are increasingly important in understanding deep-sea ecology and biodiversity, at least for larger fauna. Video and still camera data can provide high resolution information regarding the seafloor habitat, but only limited information about benthic biodiversity. Abyssal-plain biodiversity is dominated by meio- and “macro-” faunal species (typically defined as species retained by 63 µm or 300 µm mesh sieves, respectively) that cannot be resolved from image data, either because they are too small and/or live below the sediment surface (Mizuno et al., 2022). Nonetheless, even early imaging methods were considered highly cost effective for surveying megafauna (Uzmann et al., 1977), often defined as those larger than 1 cm or so and that can be recognised in seafloor images (Rybakova et al., 2020). Image-based methods generally have higher positional accuracy and are less destructive (Diaz, 2004; Ayma et al., 2016; De Mendonça and Metaxas, 2021; Mizuno et al., 2022). They can also be implemented at long-term seafloor observatories to collect time-series data (Soltwedel et al., 2005; Taylor et al., 2017). A drawback, however, is that differences, for example in lighting, resolution, and tow-height, among other differences can make quantitative comparisons between studies difficult– although this has been significantly improved with the development of high-sensitivity cameras capable of taking very high-resolution images such as those used in the present study. For the study of smaller fauna, quantitative studies benefit from a combination of extractive and image-based gears (Chimienti et al., 2018).
One of the abiding questions in deep-sea ecology is to what extent local-scale sampling can be expanded to understand larger-scale biodiversity (Gage, 2004; Howell et al., 2021; Howell et al., 2022). Certain small megafaunal species with sizes of a few cm often dominate abyssal plains. These include elpidiid holothurians and xenophyophores, giant Foraminifera that often represent the protistan megafauna (Gooday et al., 2020a). Elpidiids are deposit feeders, while xenophyophores are thought to be suspension feeders or to passively trap organic matter in their convoluted tests, or to feed directly on the sediment, depending on the species (Levin and Thomas, 1988; Gooday et al., 1993; 2020a, 2020b). These visually dominant species may or may not exert much influence on shaping the local biodiversity, but their general abundance within and across constrained sampling sites can provide a useful case study with which to examine biological heterogeneity in the abyssal plains.
The Bering Sea deep-sea fauna has been studied by several Russian and American expeditions (Rybakova et al., 2020); probably the most important historical material was collected by the R/V Vityaz in the mid-20th Century (Monin, 1983). The majority of these expeditions have worked in the western part of the Bering Sea. Most other historical and modern studies have focussed on fisheries and on the coastal shelf (Grebmeier et al., 2006). Investigations in the central part of the Bering Sea have often concerned the Bower’s Ridge seamount, an important topological feature that encloses another smaller basin (Ludwig et al., 1971; Hood, 1983).
The present study focuses on a part of the central Aleutian Basin abyssal plain, east of Bower’s Ridge, which although supporting support significant biodiversity has been explored much less often. This area is enclosed at its southern margin by the Aleutian Islands, to the west by the Bower’s Ridge, and to the east by the continental slope of Alaska. It has a maximum width of around 500 km from east to west, and reaches approximately 570 km from north to south, with a seafloor area of about 240,000 km2. The continental slope to the east, outside of the study area, has a number of canyons (Zimmermann and Prescott, 2018). Our focal part of the Aleutian Basin provides an ideal setting to examine small-scale heterogeneity of megafauna. To test the idea of whether a single well-mixed abyssal plain with flat bottom topography is relatively homogeneous in terms of its fauna, we examined the distribution of two dominant visible taxa within the Aleutian Basin in the Bering Sea.
Methods
Data Collection
This study was conducted on-board of the German research vessel R/V SONNE during the ‘AleutBio’ expedition (cruise SO293, July-September 2022), which aimed to systematically investigate the biodiversity, biogeography, and evolution of deep-sea fauna across all size classes in the Bering Sea and Aleutian Trench. The scientific party on-board included taxonomic expertise for most major animal groups. Seafloor imaging was undertaken using the Ocean Floor Observation System (OFOS) (Taylor et al., 2017), a towed camera on-board R/V SONNE. This system is equipped with a Full-HD video camera and a 45-megapixel mirrorless camera with a resolution of 8192 x 5464 pixels (Canon EOS R5), as well as a tether-management system to maximise stability. A complementary flash set accompanies the still camera, which requires an average of 10 s to charge between shots. In addition, three laser-points arranged in a triangle and separated by 40 cm distances provide a scale, calibrated for the still camera.
Three transects sampled the Aleutian Basin in the southern Bering Sea, east of the Bowers Ridge across three stations between 53° 47.690’ - 54°33.536’ N and 172° 34.273’ - 174° 37.532’ W at depths between 3507-3653 m. The three stations were separated by approximately 100-130 km. Each towed-camera transect covered approximately 1 km (~0.5 nmi), with an average visible transect width of 1.85 m, resulting in approximately 5660 m2 of seafloor surveyed. Station 1 covered 0.91 km (0.49 nmi) from start (54° 33.219’ N, 172° 34.922’ W, depth 3512 m) to end (54° 33.536’ N, 172° 34.273’ W, depth 3507 m) in a 2:05 h transect on 28 July 2022. Station 2 covered 0.98 km (0.53 nmi) from start (54° 32.158’ N, 174° 37.532’ W, depth 3650 m) to end (54° 32.498’ N, 174° 36.825’ W, 3653 m) in a 1:45 h period on 29 July 2022. Station 3 covered 1.17 km (0.63 nmi) from start (53° 48.314’ N, 173° 38.258’ W, 3588 m) to end (53° 47.690’ N, 173° 38.262’ W, 3587 m) in 2:00 h on 30 July 2022. An Ultra Short Baseline (USBL) transponder was attached to the OFOS during all deployments, recording the positions and tow-speeds when the images were captured. The tow-speed varied but was generally between 0.1–0.5 kt per hr, and we attempted to maintain a tow-height of 1–2 m above the seafloor. The entire image set from these three stations, together with the ship’s action log and data from the USBL transponder attached to the OFOS system are available in Dryad under the DOI: 10.5061/dryad.9s4mw6mm7. Image metadata such as aperture and shutter speed are included in the Exif metadata of each image.
The interval between still images captured on each transect varied from 9 to 17 s, resulting in a different number of images for each station. Images were initially checked and frames that were too dark or out of focus were removed. Those from each transect were randomly subsampled to achieve an even coverage of around 0.3 images/m surveyed. This resulted in a set of 1001 images (336 in station 1, 322 in station 2, 343 in station 3). The pooled set of selected images from all three transects were renamed using a random number. Only one contributor (JDS) had access to the record of the original file names during the course of this study. From the pooled random set of 1001 images, 14 sets of 10 images each were then selected, again randomly. One image was added to each set that duplicated an image from another set. Another set of 10 images was composed entirely of images duplicated from other sets. Thus a total of 24 images were duplicated among sets as a quality control mechanism. As a further quality control, one contributor with specialist expertise in xenophyophores (AJG) independently counted the xenophyophores in a subset of the duplicated images, to validate the group counts. Another 8 random files were selected as a training set; these were used to test the annotation process, but data from those 8 images were also included in the final analyses. In total, the analysis included 148 unique images among 172 images annotated.
Image Annotation
Image annotation simultaneously identified all individuals of xenophyophores and holothurians identifiable as members of the genus Elpidia visible in a single frame. The focal taxa included the holothurian Elpidia, and all xenophyophores, without differentiating the two morphologically distinct forms, one with a contorted plate-like test and the other reticulated. The former is undescribed while the latter is almost certainly Syringammina limosa (Voltski et al., 2018).
These annotations were completed in small groups using a shared large screen (Sony KD-85XH9096, 85 inch diagonal). The contributors were all members of the AleutBio scientific party on board R/V SONNE. One of two lead contributors (JDS, CC) acted as group leader in each session. This method enabled a consensus-based approach to decisions on which individual organisms could be confidently identified, as well as preventing fatigue. Each session completed the annotation for one set (11 images) in approximately 1 hour. These sessions were conducted on-board R/V SONNE during AleutBio, usually twice daily, on 9 consecutive days. Only individual organisms that were fully visible, in focus, and where identity was agreed by group consensus, were included in count data.
The seafloor area in each image varied with the distance between the camera and the seafloor. In order to determine the density (i.e., individuals per square metre) of megafauna observed, each image was individually calibrated by taking the average separation of three laser sights and assuming that the average best represents the set separation of 40 cm. Image measurements were completed in ImageJ (Schneider et al., 2012). The visible area was also limited by the domed housing of the camera system which provides a circular in-focus area at the centre of the image (Figure 1D). Ten images from the total set were randomly selected and the in-focus area measured; the average in-focus area of 60.5% of the frame was then used to calculate the measured area for density measurements.
Figure 1
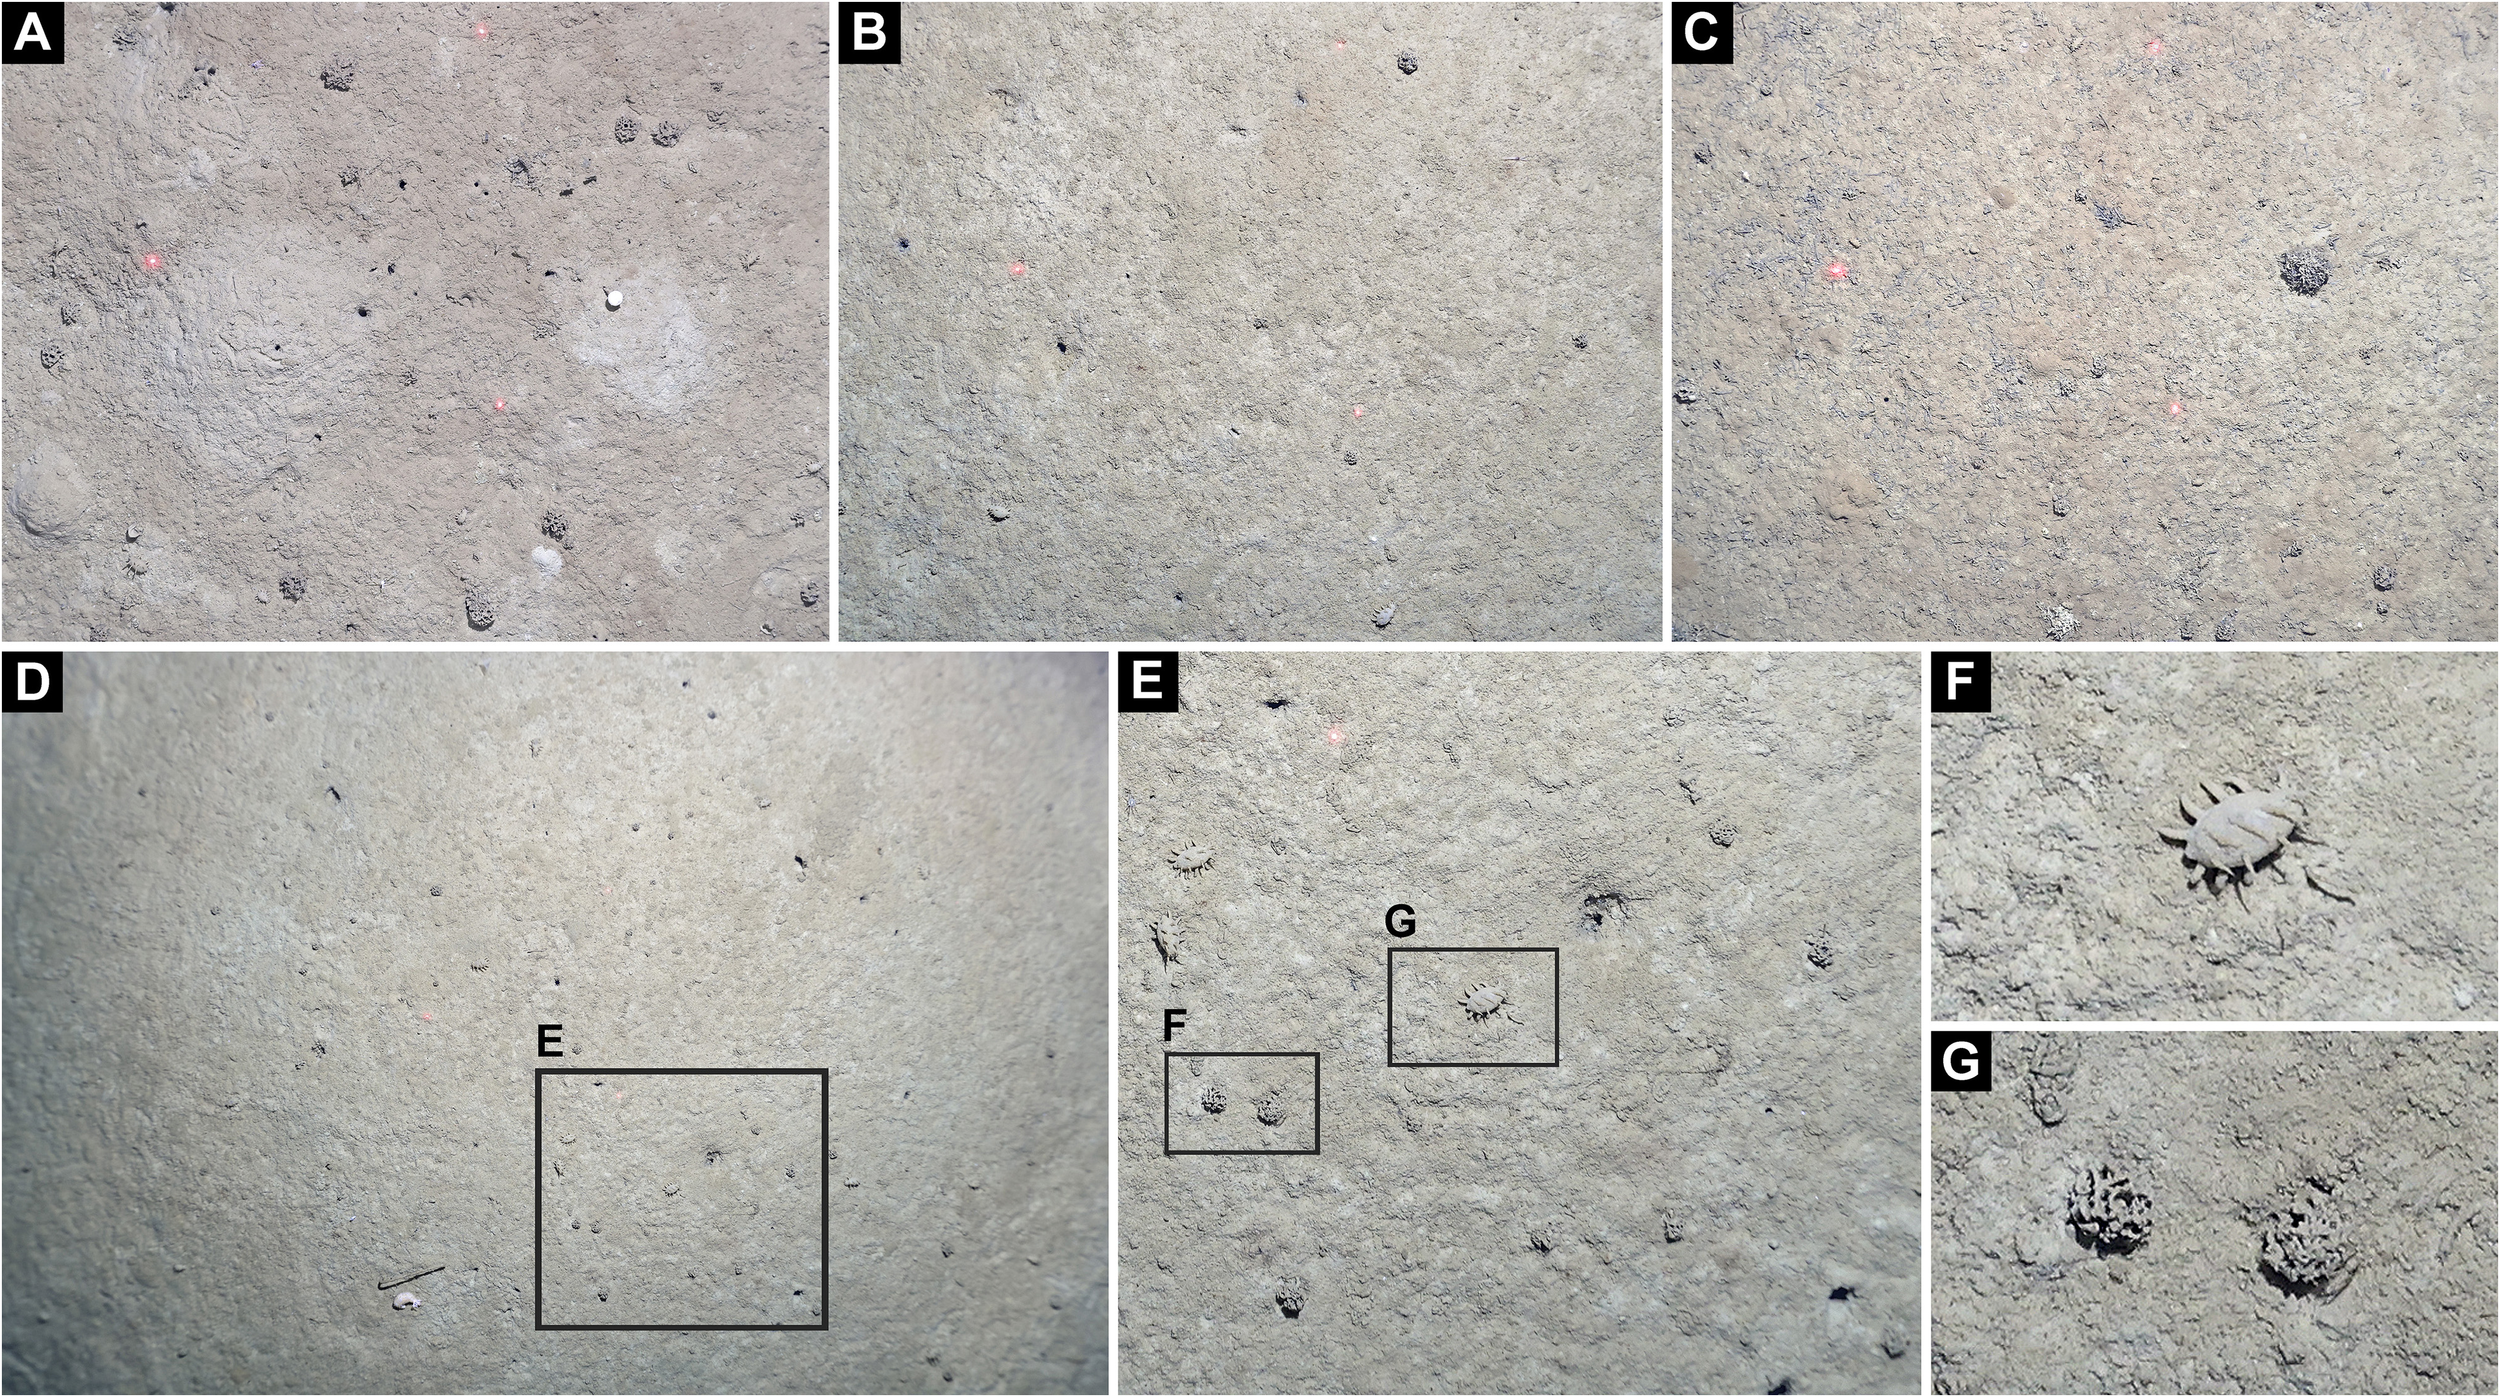
Representative OFOS seafloor still images of the Bering Sea sites. (A–C) Cropped centre portion of exemplary images from station 1, 2, and 3, respectively, each showing the same area of 0.9 x 0.7 m as calibrated by the laser pointers. (D) Example full-frame image of the Bering Sea used for quantitative analysis from station 2 at 54°32.19’ N, 174°37.50’ W, depth 3653 m. Total frame of 2.1 x 1.4 m with a usable in-focus area of 1.79 m2, including one Abyssocucumis sp. as well as 13 Elpidia minutissima holothurians and 22 xenophyophores. (E) Inset, showing clear, representative images of target taxa, (F). Elpidia minutissima, (G). reticulated xenophyophores (Syringammina limosa).
All statistical tests and file selections were conducted using R (version 4.1.2) (R Core Team, 2022). Random file selection used the R function random_files (https://github.com/bmsasilva/Rscripts). Statistical comparisons included the test function scheirerRayHare in the package rcompanion (Mangiafico, 2016).
The two lead contributors (JDS, CC) also examined the entire still image set from all three OFOS transects to extract images of clearly visible macro- and megafauna. Other contributors with specific taxonomic expertise in different animal clades examined these extracted image sets and identified each animal to the best possible taxonomic level. The occurrence of each tentative species at each of the three stations were recorded based on these taxonomic identifications.
Results
The quality of images from the OFOS allowed us to confidently identify large numbers of individuals of the target taxa for annotation, up to a maximum count of 62 individual Elpidia in a frame of around 2.2 m2 visible area, where the individuals were typically 3–5 cm long (Figure 1). Participants each contributed between 1–8 hours of analysis time, making a total of 80 person-hours to complete the annotation.
Among the 24 duplicated images that were fully analysed in two different sessions, the median difference between duplicated counts of Elpidia was 1 (maximum 12 in an image from Station 3 with an estimated 54 individuals in the frame), and the median difference between counts of xenophyophores was 2 (maximum difference of 11 at Station 1 in a frame with estimated 28 individuals). The difference in error rate between the two groups was not statistically significant (Kruskal-Wallis test: H = 0.959, N = 48, p = 0.327). Counts for xenophyophores checked by our expert (AJG) were closely aligned with the maximum of two independent counts on duplicated images. Therefore, the median count for Elpidia and the maximum count for xenophyophores were used as the representative data from the 24 duplicated images in further analyses.
The frequency distribution of the occurrence data for both target taxa was highly skewed, with a majority of frames having relative few individuals in view and a small number of frames with high abundances (Figure 2). We therefore used a Scheirer-Ray-Hare (SRH) test to examine the differences and interactions between groups. This is a nonparametric test that is an extension of the better-known Kruskal-Wallis single-factor test (Sokal and Rohlf, 1995).
Figure 2
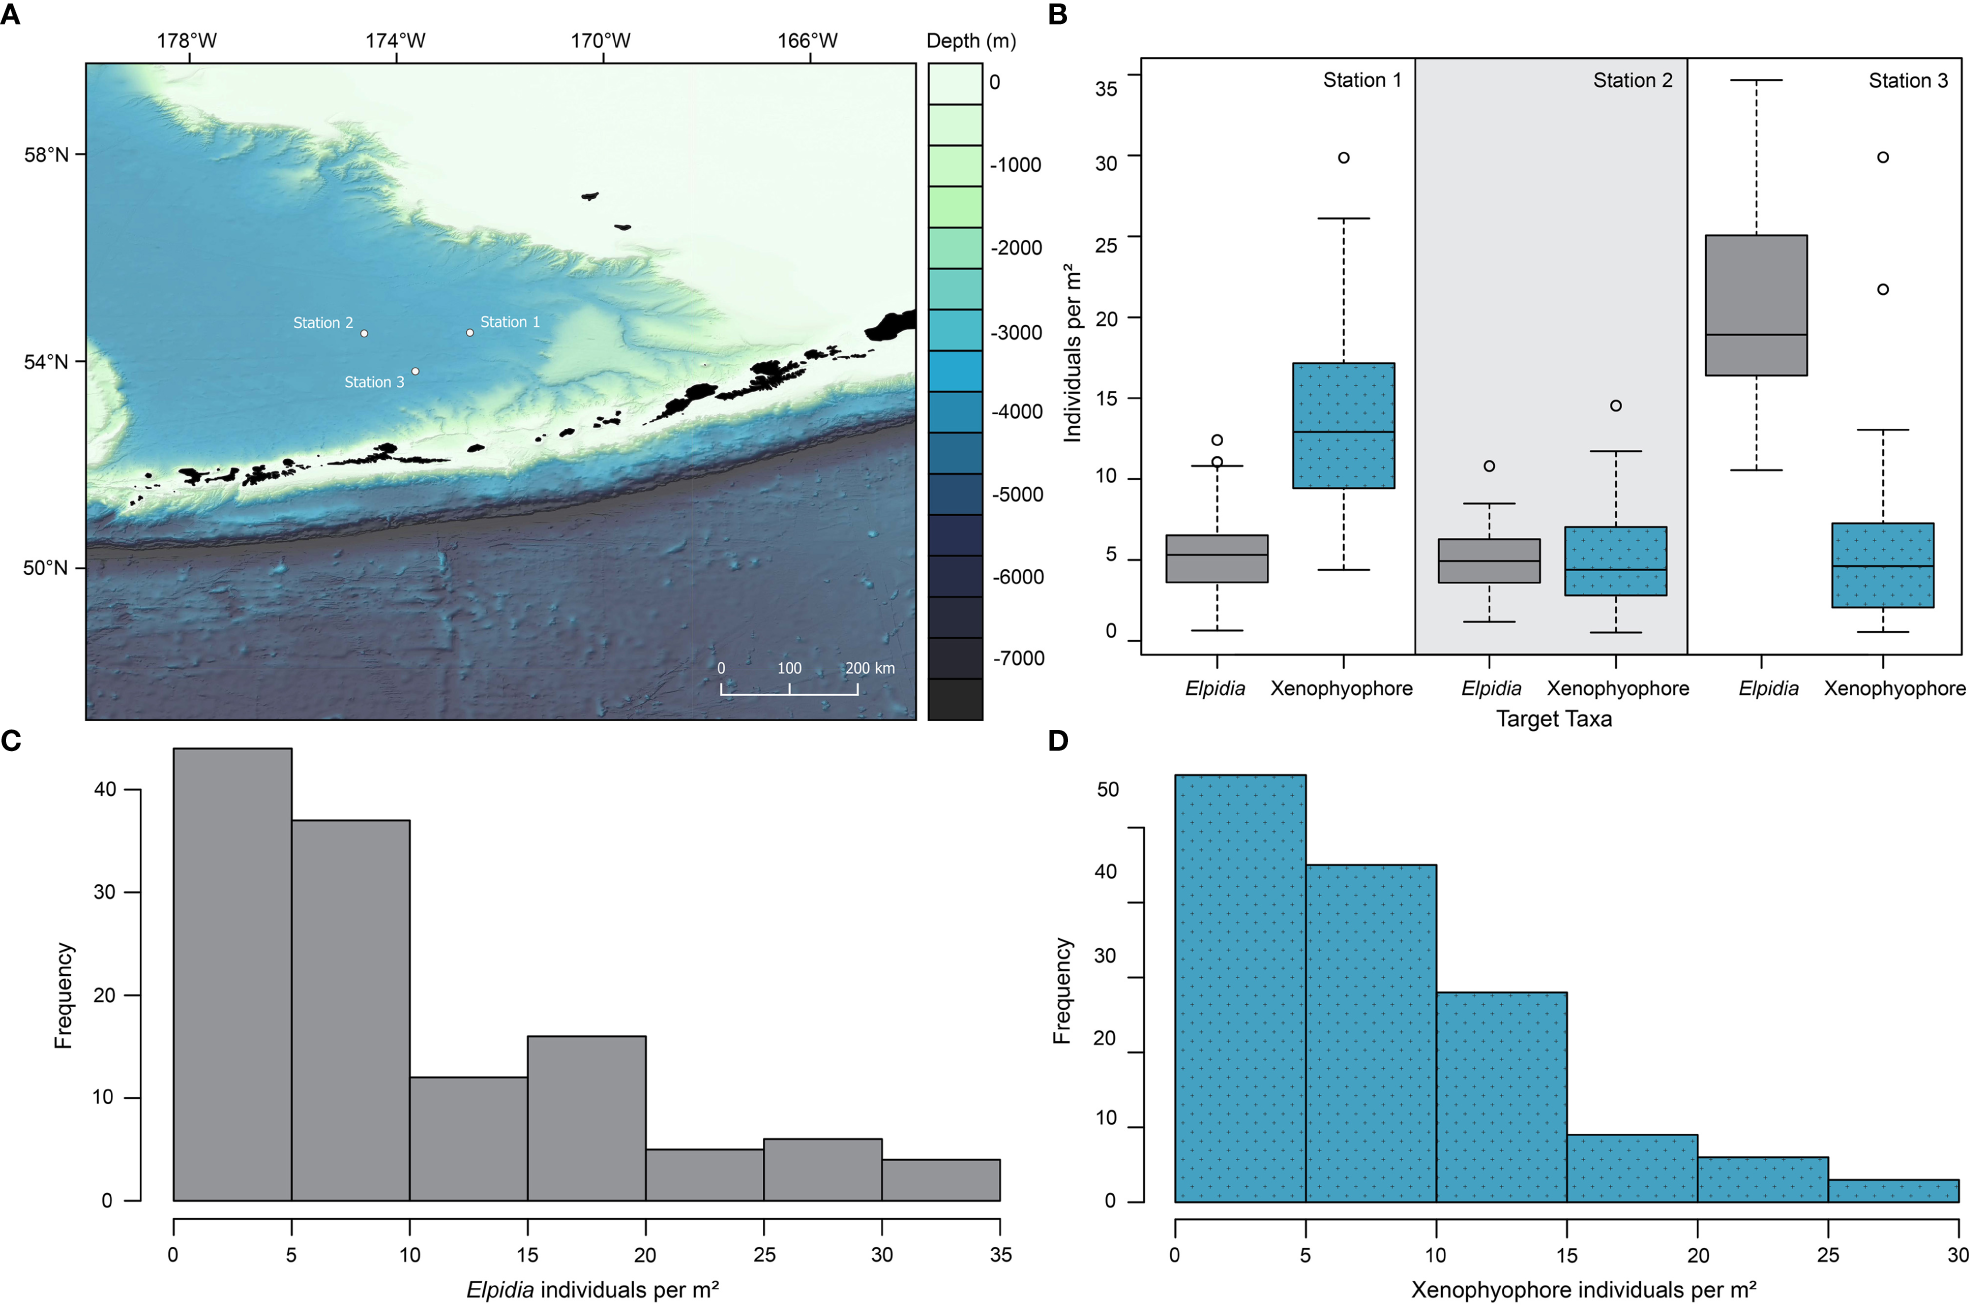
(A) Map of the study area in the Aleutian Basin, Bering Sea, surrounded by the Alaska mainland to the east, Aleutian Islands to the south, and Bower’s Ridge to the southwest. Regional bathymetry data from the General Bathymetric Chart of the Ocean (GEBCO) Project was used to generate this map (GEBCO Compilation Group, 2022). (B) Boxplot of comparative densities of Elpidia minutissima holothurians and xenophyophores in the Bering Sea, showing median and inner quartile measurements at each of the three stations. (C) Histogram of frequency distribution of Elpidia density in the Bering Sea (pooled data from the three stations). (D) Histogram of frequency distribution of xenophyophore density in the Bering Sea (pooled data from the three stations).
Comparisons of sampling stations showed a significant difference among the three dives (H = 46.18, n = 296, df = 2, p < 0.00001; Figure 2). However, there was no significant difference between the overall frequency of the two target taxa (H = 2.39, n = 296, df = 1, p = 0.12). The interaction term of the SRH term confirms significant differences between species at different sites (H = 119.14, n = 296, df = 2, p < 0.00001; Figure 2).
The organisms included in the main quantitative analysis comprised Elpidia minutissima, the only species which could be determined, and two different morphotypes of xenophyophore (reticulated and convoluted plate). The reticulated xenophyophore (Syringammina limosa) was common across all three stations, but the convoluted form was common at station 1, not found in station 2, and was rare in station 3.
A total of 71 visible macrofaunal taxa was identified from the still images by the taxonomic expertise on-board with additional help from shore-based experts (see Table 1), including 12 annelids, 12 arthropods, 5 chordates, 8 cnidarians, 2 ctenophores, 16 echinoderms, a hemichordate, 5 molluscs, a phoronid, 7 sponges, and 2 xenophyophores. Examples of abundant taxa seen across all three stations, in addition to those used in the quantitative analysis, were the holothurian Abyssocucumis sp., the irregular urchin Cystechinus loveni, the demosponge Suberites cf. japonicus, and a tube-building sabellid worm with a single-lobed crown. Some uncommon taxa, such as the polynoid scale worm cf. Harmothoe sp., an unidentified echiuran worm, a sea spider (Colossendeidae indet.), the holothurians Peniagone sp. and Pseudostichopus sp., a non-stalked crinoid, the Giant Grenadier Albatrossia pectoralis, the large mushroom-like hexatinellid sponge cf. Caulophacus sp., and the buccinid snail cf. Ancistrolepis sp. were found across all stations. Most of the species sighted were benthic, but a number of pelagic hydrozoans and ctenophores, such as Ptychogastria polaris, Rhopalonematidae indet., and Lobata indet., were also seen. Although only one live enteropneust hemichordate individual was sighted at station 2, numerous spiral enteropneust traces were seen across all three transects.
Table 1
| Phylum | Clade | Taxa | St. 1 | St. 2 | St. 3 | ID by |
|---|---|---|---|---|---|---|
| Annelida | Ampharetidae | Ampharetidae indet. | Y | N | Y | Candace J. Grimes |
| Annelida | Echiura | Echiura indet. | Y | Y | Y | Candace J. Grimes |
| Annelida | Maldanidae | Maldanidae indet. | Y | N | Y | Candace J. Grimes |
| Annelida | Onuphidae | Onuphidae indet. | N | N | Y | Candace J. Grimes |
| Annelida | Polynoida | Polynoida indet. | N | Y | Y | Candace J. Grimes |
| Annelida | Polynoidae | cf. Barrukia sp. | Y | N | Y | Candace J. Grimes |
| Annelida | Polynoidae | cf. Harmothoe sp. | Y | Y | Y | Candace J. Grimes |
| Annelida | Sabellidae | Sabellid type 1 (single-lobed) | Y | Y | Y | Candace J. Grimes |
| Annelida | Sabellidae | Sabellid type 2 (bilobed) | Y | N | Y | Candace J. Grimes |
| Annelida | Serpulidae | Serpulidae indet. | N | N | Y | Candace J. Grimes |
| Annelida | Sipuncula | Phascolion sp. | Y | Y | Y | Candace J. Grimes |
| Annelida | Syllidae? | Syllidae? indet. | Y | N | N | Candace J. Grimes |
| Arthropoda | Amphipoda | Maeridae indet. | Y | N | Y | Anne Helene S. Tandberg |
| Arthropoda | Amphipoda | Amathillopsis sp. | Y | Y | Y | Anna Maria Jażdżewska |
| Arthropoda | Cirripedia | cf. Trianguloscalpellum sp. | Y | N | Y | Chong Chen |
| Arthropoda | Decapoda | Crangonidae indet. | Y | Y | Y | Chong Chen |
| Arthropoda | Decapoda | Munidopsis sp. | Y | N | Y | Chong Chen |
| Arthropoda | Isopoda | Acanthocope sp. | Y | N | N | Angelika Brandt |
| Arthropoda | Isopoda | Demostomatidae indet. | Y | N | N | Angelika Brandt |
| Arthropoda | Isopoda | Munneurycope sp. | Y | N | N | Angelika Brandt |
| Arthropoda | Isopoda | Munnopsis sp. | Y | N | Y | Angelika Brandt |
| Arthropoda | Isopoda | Munnopsurus sp. | Y | N | Y | Angelika Brandt |
| Arthropoda | Mysida | Mysida indet. | Y | Y | Y | Chong Chen |
| Arthropoda | Pycnogonida | Colossendeidae indet. | Y | Y | Y | Candace J. Grimes, Elva Escobar |
| Chordata | Teleostei | Albatrossia pectoralis (Gilbert, 1892) | Y | Y | Y | Julia D. Sigwart, Sarah Gerken |
| Chordata | Teleostei | Liparidae indet. | N | N | Y | Julia D. Sigwart |
| Chordata | Teleostei | Synaphobranchidae indet. | Y | Y | N | Julia D. Sigwart |
| Chordata | Tunicata | Octacnemidae indet. | N | N | Y | Chong Chen |
| Chordata | Tunicata | Tunicata indet. non-stalked | Y | N | Y | Chong Chen |
| Cnidaria | Actiniaria | Actiniaria indet. | Y | N | Y | Angelo Poliseno |
| Cnidaria | Hydrozoa | Branchiocerianthus imperator (Allman, 1885) | N | Y | N | Angelo Poliseno, Chong Chen |
| Cnidaria | Hydrozoa | Hydrozoa indet. | N | N | Y | Angelo Poliseno |
| Cnidaria | Hydrozoa | Ptychogastria polaris Allman, 1878 | N | N | Y | Angelo Poliseno, Allen Collins |
| Cnidaria | Hydrozoa | Rhopalonematidae indet. | Y | N | N | Angelo Poliseno, Allen Collins |
| Cnidaria | Scyphozoa | Coronatae indet. | Y | N | Y | Candace J. Grimes |
| Cnidaria | Zoantharia | Macrocnemina sp. 1 | Y | N | Y | Angelo Poliseno, Hiroki Kise, James D. Reimer |
| Cnidaria | Zoantharia | Macrocnemina sp. 2 | Y | N | Y | Angelo Poliseno, Hiroki Kise, James D. Reimer |
| Ctenophora | – | Benthic Ctenophora indet. | Y | N | Y | Chong Chen |
| Ctenophora | Lobata | Lobata indet. | N | N | Y | Angelo Poliseno, Allen Collins |
| Echinodermata | Asteroidea | Henricia sp. | Y | N | Y | Camille Moreau |
| Echinodermata | Crinoidea | Bathycrinus sp. | N | Y | N | Camille Moreau |
| Echinodermata | Crinoidea | Non-stalked Comatulida indet. | Y | Y | Y | Camille Moreau |
| Echinodermata | Echinoidea | Cystechinus loveni Agassiz, 1898 | Y | Y | Y | Camille Moreau |
| Echinodermata | Holothuroidea | Abyssocucumis sp. | Y | Y | Y | Akito Ogawa |
| Echinodermata | Holothuroidea | Apodida indet. | Y | N | Y | Akito Ogawa |
| Echinodermata | Holothuroidea | Benthodytes cf. marianensis Li, Xiao, Zhang & Zhang, 2018 | N | N | Y | Akito Ogawa |
| Echinodermata | Holothuroidea | Dendrochirotida indet. | Y | N | N | Akito Ogawa |
| Echinodermata | Holothuroidea | Elpidia minutissima Belyaev, 1971 | Y | Y | Y | Akito Ogawa |
| Echinodermata | Holothuroidea | Molpadia sp. | N | N | Y | Akito Ogawa |
| Echinodermata | Holothuroidea | Paelopatides sp. | N | Y | N | Akito Ogawa |
| Echinodermata | Holothuroidea | Peniagone sp. | Y | Y | Y | Akito Ogawa |
| Echinodermata | Holothuroidea | Pseudostichopus sp. | Y | N | Y | Akito Ogawa |
| Echinodermata | Holothuroidea | Psychropotes raripes Ludwig, 1893 | Y | N | N | Akito Ogawa |
| Echinodermata | Ophiuroidea | Ophiura sp. | N | N | Y | Camille Moreau |
| Echinodermata | Ophiuroidea | Small Ophiuroidea indet. | Y | Y | Y | Camille Moreau |
| Foraminifera | Xenophyophorea | Xenophyophorea indet. Plate-like, convoluted | Y | N | Y | Andrew Gooday |
| Foraminifera | Xenophyophorea | Syringammina limosa | Y | Y | Y | Andrew Gooday |
| Hemichordata | Enteropneusta | Enteropneusta indet. (incl. traces) | Y | Y | Y | Chong Chen |
| Mollusca | Gastropoda | Abyssotrophon edzoevi Egorov, 1994 | Y | N | Y | Chong Chen |
| Mollusca | Gastropoda | cf. Ancistrolepis sp. | Y | Y | Y | Chong Chen |
| Mollusca | Gastropoda | Fusipagoda sp. | Y | N | N | Chong Chen |
| Mollusca | Gastropoda | Tropidofusus aequilonius (Sysoev, 2000) | N | Y | Y | Chong Chen |
| Mollusca | Gastropoda | Volutomitra cf. groenlandica (Møller, 1842) | Y | Y | Y | Chong Chen |
| Phoronida | – | Phoronida indet. | N | N | Y | Candace J. Grimes |
| Porifera | Demospongiae | Cladorhiza sp. | Y | N | N | Andreu Santín Muriel |
| Porifera | Demospongiae | Suberites cf. japonicus Thiele, 1898 | Y | Y | Y | Andreu Santín Muriel |
| Porifera | Hexatinellida | cf. Caulophacus sp. | Y | Y | Y | Andreu Santín Muriel |
| Porifera | Hexatinellida | cf. Hyalonema sp. | Y | Y | Y | Andreu Santín Muriel |
| Porifera | Hexatinellida | Hexactinosida indet. | N | N | Y | Andreu Santín Muriel |
| Porifera | Hexatinellida | Rossellidae indet. | N | Y | Y | Andreu Santín Muriel |
| Porifera | Hexatinellida | Spherical hexatinellid indet. | Y | Y | Y | Andreu Santín Muriel |
| # Present: | 53 | 30 | 58 | |||
| % Present: | 74.65% | 42.25% | 81.69% |
Sightings of animals from still images taken in the 3 Bering Sea OFOS stations during the “AleutBio” expedition.
Summary statistics in bold.
Of the 71 identified taxa, 53 (75%) were sighted at station 1, 30 (42%) at station 2, and 58 (82%) at station 3. Many taxa were apparently absent at station 2, even some that were common at stations 1 and 3 such as the convoluted xenophyophore morphotype and the zoantharians. Many rarer taxa, such as the cf. Trianguloscalpellum sp. barnacles, the polynoid scale worm cf. Barrukia sp., ampharetid and maldanid annelid worms, Munnopsis sp. and Munnopsurus sp. munnopsid isopods, and a maerid amphipod were never seen in station 2. A number of rare taxa were only seen between once and a few times in a single station, including the large munnopsid isopod in genus Munneurycope from station 1, the giant solitary hydroid Branchiocerianthus imperator from station 2, the stalked crinoid Bathycrinus sp. from station 2, and the large holothurian Benthodytes cf. marianensis from station 3.
Stations 1 and 2 were almost completely flat, with maximum elevation changes of 2–3 m over the transect length; station 3 recorded more variation in topography, with a slow uneven downward cline covering a total elevation change of around 13 m. The seafloor at site 1 (Figure 1A) was characterised by a relatively high frequency of low biogenic mounds and burrows, many of which were surrounded by paler sediment crater cones indicative of recent burrowing. Because the OFOS camera looks directly downwards, we have no means of accurately measuring the height of these mounds, but shadows allow us to estimate that most of the mounds were a few cm in height. Sediment surface at this site was typically rather clean apart from occasional holothurian faecal casts. Occasional areas were seen with sparsely scattered foraminiferal tubes, notably darker in colouration than the surrounding mud. Site 2 (Figure 1B) was visually the most flat among our sites, generally lacking any notable topographic features. Though some small burrows were evident, they were not associated with mounds and there was no paler sediment around them. The surface of the seafloor was very clean, with only occasional holothurian faecal casts and few obvious foraminiferal tubes. Site 3 (Figure 1C) differed from the other two in that the sediment surface was always densely littered with foraminiferal tube across the entire transect. Though some low mounds up to a few cm height were observed, these were much less frequent than Site 1.
Discussion
Our results demonstrate faunal heterogeneity in the Bering Sea abyssal plain across different scales. Small-scale topographic and sediment heterogeneity can have knock-on effects on the overall biodiversity (Durden et al., 2015, 2020; Simon-Lledó et al., 2020; Smith, 2020). Most conspicuously, station 2 not only exhibited low densities of both Elpidia and xenophyophores, but was also by far the most species-poor site overall with only 45% of the observed species sighted there (Table 1). Visually, the seafloor of station 2 had a notably flatter, cleaner appearance with fewer small-scale mounds and less dense coverage of Foraminifera tubes than seen at the other 2 stations. On the other hand, a few large species, such as the giant solitary hydroid Branchiocerianthus imperator (Figure 3E) and the stalked crinoid Bathycrinus sp. (Figure 3I), only occurred in station 2, indicating that some species likely prefer this location over the others, adding another layer of complexity.
Figure 3
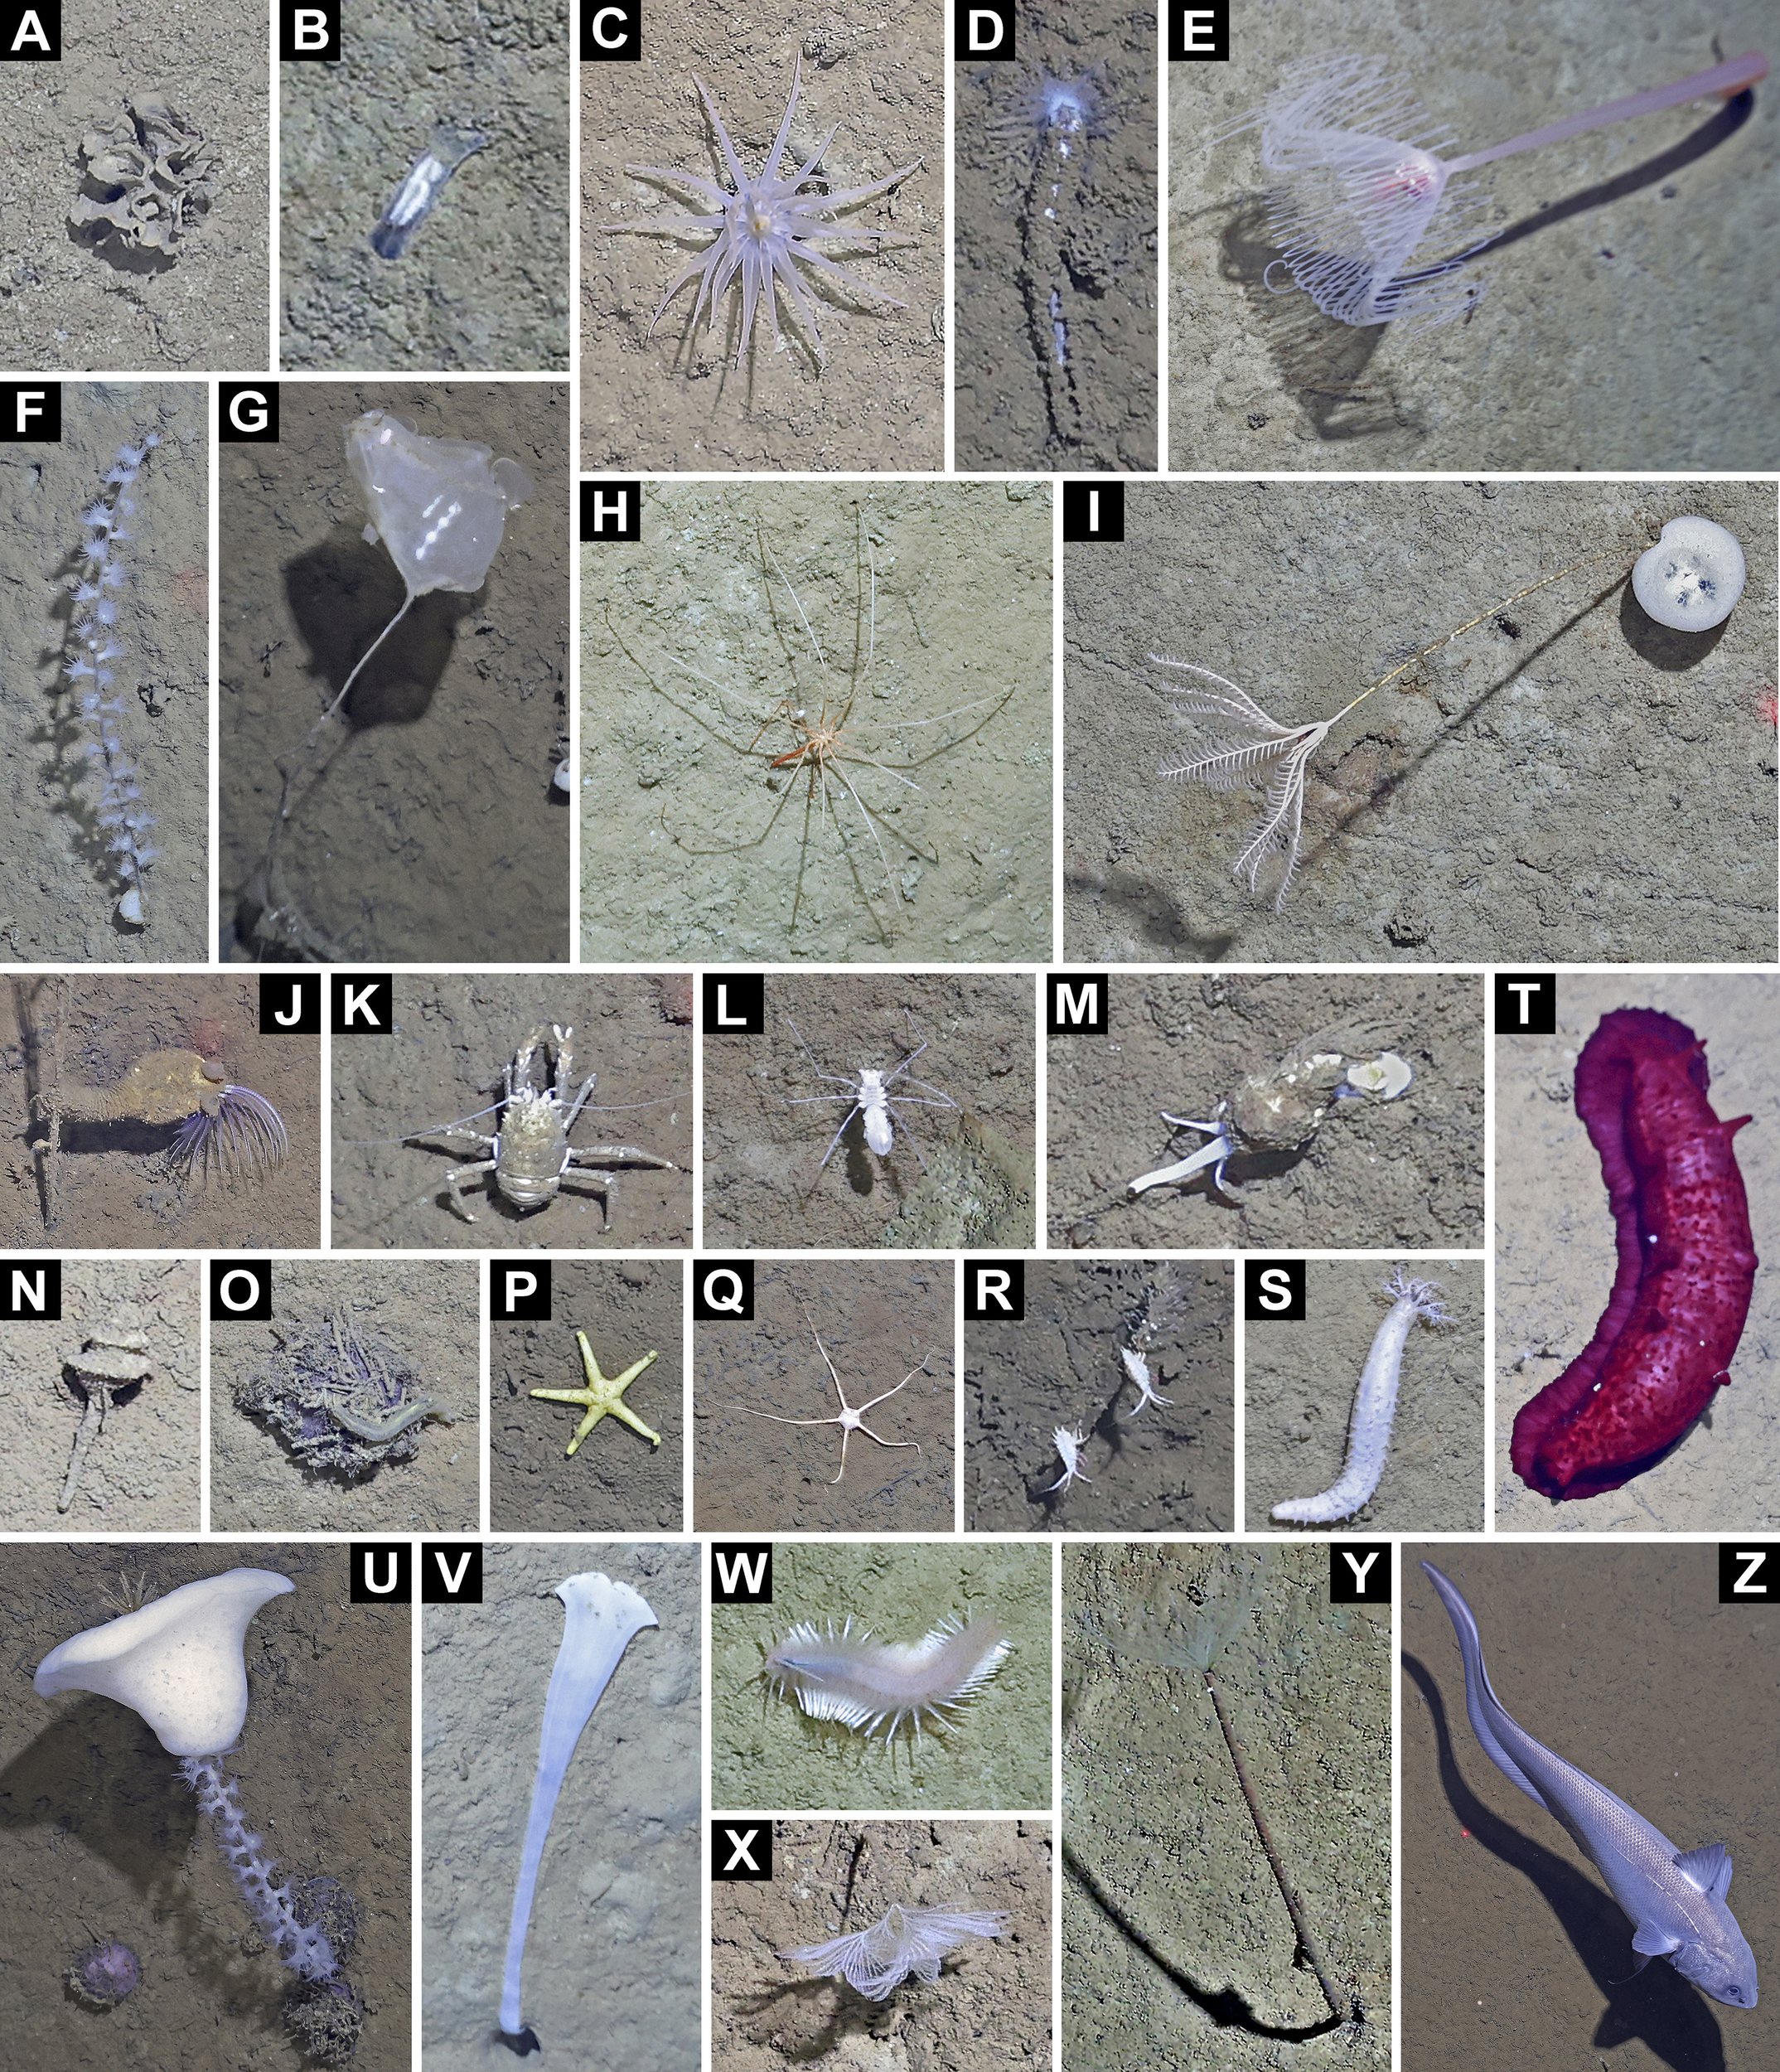
Representative megafauna sighted in the Aleutian Basin, Bering Sea. (A) Convoluted xenophyophore, (B) Enteropneusta indet., (C, D) tube anemone (Actiniaria indet.), (E) the giant solitary hydroid Branchiocerianthus imperator, (F) the zoantharian Macrocnemina sp. 2, (G) benthic Ctenophora indet., (H) the pycnogonid Colossendeidae indet., (I) the stalked crinoid Bathycrinus sp., (J) the stalked barnacle cf. Trianguloscalpellum sp., (K)Munidopsis sp. squat lobster, (L) the munnopsid isopod Munneurycope sp., (M) the buccinid snail cf. Ancistrolepis sp., (N) the pagoda snail Tropidofusus aequilanius, (O) the irregular urchin Cystechinus loveni adorned with Foraminifera tests (a behaviour previously reported in Levin et al., 2001b) and a Dendrochirotida indet. holothurian, (P) the asteroid Henricia sp., (Q) the brittle star Ophiura sp., (R) the amathillopsid amphipod Amathillopsis sp. clinging to a ‘stick’ (as previously reported in Lörz and Horton, 2021), (S) the holothurian Abyssocucumis sp., (T) the namako Benthodytes cf. marianensis, (U) the hexactinellid sponge cf. Caulophacus sp., (V) extended proboscis of Echiura indet., (W) the scale worm Polynoida indet., (X) the sabellid worm morphotype with bilobed crown, (Y) the sabellid worm morphotype with single-lobed crown, (Z) the Giant Grenadier Albatrossia pectoralis.
Species richness, and overall density of Elpidia and xenophyophores, across these three stations, differed at the scale of around 100 kilometres or less. This reflects a growing understanding of diversity in abyssal plain habitats, despite the study area lacking potential barriers for dispersal of the animal species and superficially similar conditions. Abiotic variation at a similar scale presumably dictates the overall densities of the two taxa investigated, though we cannot suggest a specific cause. An alternative causal hypothesis to explain these differences could be differences in organic matter supply at the three sites. For example, the high density of xenophyophores at station 1 may be driven by a locally increased organic-matter flux derived from ocean surface production, as large populations of xenophyophores are typically found in areas of enhanced food supply. However, we have no evidence for mesoscale variations in surface productivity in this part of the North Pacific. The fact that Elpidia and xenophyophores reached high densities at two different sites (site 3 and site 1, respectively, Figure 2B) suggests instead that other intrinsic drivers may be more likely. Furthermore, stations 1 and 3 are located closer to submarine canyons outside the study area (Zimmermann and Prescott, 2018), and canyon flushing may have an impact on the observed differences among the sites.
The skewed frequency distribution of both taxa, where most frames had few individuals and a few had very high densities, reflects a natural patchy pattern of occurrence with occasional dense aggregations. Though this heavy skew may seem surprising given the assumption of a uniform seabed environment, it is a pattern that is consistent with the known ecology of these focal taxa.
Elpidia, and many other deep-sea elasipod holothurians, have been observed to form dense aggregations or ‘herds’ (Barham et al., 1967; Pawson, 1982) of up to 50 individuals per m2 (Billett and Hansen, 1982). The densities of over 30 individuals per m2 seen during our transects (Figures 2B, C) is consistent with previously reports of Elpidia herds. One study of Elpidia glacialis in Antarctic waters reported a density distribution almost identical to that at our station 3, with a median density of 16.6 (interquartile range 10.4–19.2) individuals per m2 (Gutt and Piepenburg, 1991). Pooled data from the three sites, however, yield a median density of only ~6 m-2, since the denser aggregations were only found in our transect at station 3.
Our data from the Bering Sea reinforces the potential for relatively minor environmental differences to influence funal distributions. What drives herding behaviour in elpidiids remains contentious (Gutt and Piepenburg, 1991), but they likely follow local microhabitat differences (Haedrich et al., 1980). Generally, deep-sea holothurian densities have been shown to correlate with increases in the flux of particulate organic carbon (Kaufmann and Smith, 1997; Wigham et al., 2003; Amaro et al., 2019; Lemon et al., 2022), more specifically with labile organic matter inputs (Nomaki et al., 2021), but the patchy ‘herds’ of holothurians do not always correspond in distribution to high-quality food (Gutt and Piepenburg, 1991). Moreover, during periods of food surplus this correlation may be muted due to sediment food storage capacity (Lemon et al., 2022). Other explanations, including reproductive events and even communication within a group (Gutt and Piepenburg, 1991), have been suggested, but remain untested. Whatever the cause, Elpidia is clearly a mobile animal that can form patchy distributions, possibly following local fluctuations in habitat characteristics. The contrasts seen between our three stations which have similar food inputs to the seabed, indicate potentially persistent small-scale differences within and among these sites.
Xenophyophores are giant sessile protists, found globally below about 500 m depth on both soft sediment and hard substrates. They can occur in high densities up to 36 individuals per m2 on abyssal plains (Levin and Gooday, 1992; Gooday et al., 2020a). The densities seen in our transects were comparable to previous studies, with our highest recorded values of 26.1 individuals per m2 seen in one frame at station 1 (Figures 2B, D). Xenophyophores likely feed by trapping particles in their complex tests, suspension feeding, or feeding directly on sediment (Levin and Thomas, 1988; Gooday et al., 2020a, 2020b). They are widely distributed in the deep ocean but particularly abundant where the current flow and therefore potential food supply is enhanced, notably on seamounts and other elevated settings (Bridges et al., 2022), in submarine canyons, and on sloped topography, as well as under regions of high surface productivity such as upwelling areas. Xenophyophores may also exhibit patchy distributions, often associated with local-scale topographic features; for example, on seamounts where they aggregate near mounds and caldera walls (Levin and Thomas, 1988). Obvious small-scale topographic features of this kind were not present at station 1, where xenophyophores reached their highest densities (Figure 2B), but we did observe more frequent whitish-coloured, low biogenic mounds along this transect. There is some evidence that xenophyophores can grow remarkably rapidly. A time-lapse camera record showing three specimens on the Madeira abyssal plain documented a 10-fold increase in test volume over 8 months (Gooday et al., 1993). This suggests that these megafaunal Foraminifera are able to quickly exploit new micro-topographic features, such as biogenic mounds, thereby increasing population densities. Another important difference between stations 3 and 1 was the presence of denser accumulations of tubes on the seafloor at the former compared to the latter. These were most likely those of foraminifera. Many were probably dead, but some may have been living and possibly competing with xenophyophores for food, thereby depressing xenophyophore abundance. This tube-dominated substrate may also have hindered the settlement of these giant Foraminifera in some way, although precisely how is not clear. As already mentioned, the close relationship between xenophyophores and organic matter fluxes (Levin and Gooday, 1992; Gooday et al., 2020b) suggests that differences in food availability may account for the density contrasts observed between transects. However, all of these theories are highly speculative and we currently have no convincing explanation for the higher xenophyophore densities at station 1. Temporal differences among the expeditions in these relevant studies could also influence observations and further complicate the interpretations.
Whatever the reason for the enhanced xenophyophore abundances at station 1, it is important to note that the tests of these large foraminifera, dead as well as living, provide important microhabitats for meio- and macrofauna, both in the metazoan (Levin and Thomas, 1988) and protistan (Hughes and Gooday, 2004) faunas, and even as nurseries for fishes (Levin and Rouse, 2020). Xenophyophores therefore act as ecosystem engineers in areas where they are abundant (Gooday et al., 2020b). The uneven distribution and occasional aggregations of xenophyophores that we observed may therefore serve to increase within-station scale habitat heterogeneity and hence overall infaunal diversity.
Our seafloor images also provide valuable information on the megafaunal diversity in the Aleutian Basin, which remains among the least-studied areas in the Bering Sea. The faunal assemblages seen on the three transects were strikingly different from those recently described from the southwest Bering Sea off Bering Island, using video surveys by a remotely operated vehicle (ROV) (Rybakova et al., 2020). In a range of ROV dives on the abyssal plain down to 4278 m depth, and at different depths up to 349 m on the northern slope of the Volcanologists Massif, Rybakova et al. (2020) reported clear shifts in dominant fauna according to depth. In a transect covering a depth range of 3450–3610 m, they found the holothurian Scotoplanes kurilensis to be the dominant species. At similar depths (3507–3653 m), we did not see a single individual of Scotoplanes and instead Elpidia minutissima was by far the most abundant holothurian species. The two other common holothurians reported by Rybakova et al. (2020), Kolga kamchatica and Zygothuria sp., were also absent at our stations. Conversely, Rybakova et al. (2020) did not report sightings of Elpidia or any of the other holothurians observed during the present study (Figure 3, Table 1). Furthermore, the mean population density of Scotoplanes kurilensis reported at the 3450–3610 m station of Rybakova et al. (2020) was only 1.1 ± 0.9 m-2, much lower than the density of Elpidia minutissima in our transects (Figure 2). These clear disparities point to a high level of basin-scale faunal heterogeneity in the Bering Sea.
Apart from these ROV video transects in the northwestern part of the Bering Sea, almost all other biodiversity data regarding deep-sea megafaunal communities in this region have been obtained using extractive gear, such as trawls and corers (Rybakova et al., 2020). Extractive sampling methods are known to underestimate megafauna abundance and richness, and are not directly comparable with our data (Uzmann et al., 1977; Ayma et al., 2016; De Mendonça and Metaxas, 2021). Most other recent comparable studies evaluating epifauna densities using high-resolution image transects have focused on topographic features such as abyssal hills (e.g., Durden et al., 2015; Durden et al., 2020), manganese nodule fields (e.g., Simon-Lledó et al., 2020), or hydrothermal vents (e.g., Thornton et al., 2016). Our results extend this to abyssal plains of the northern Pacific, where sources of heterogeneity are much less obvious, and lends support to the prediction of Durden et al. (2020) that the faunal (and likely habitat) heterogeneity in the abyss has been considerably underestimated (Smith, 2020).
Using the OFOS ultra-high resolution still images, we also observed numerous, frequently unidentifiable, tubes and ‘sticks’, presumably of mixed foraminiferal, annelid, sponge, and cnidarian origin. At stations 1 and 3, another conspicuous and rather common member of the megafaunal community was the irregular urchin Cystechinus loveni, often seen adorned with the fragmented tests of xenophyophores and other Foraminifera (Levin et al., 2001b) and in a few occasions even with holothurians (order Dendrochirotida). The seafloor images also included abundant trails and burrows, but in most cases we could not identify the species responsible for their construction. While the only consistently abundant large epifaunal organisms were Elpidia holothurians and xenophyophores, these traces suggest a high abundance of unseen infaunal taxa that cannot be characterised from the images alone.
Achieving a holistic understanding of biodiversity on abyssal plains requires the combined use of different sampling equipment. For megafauna, this should include high-resolution imaging systems. From previous comparisons of sampling gears, it is clear that each method has a different efficiency in capturing various faunal groups (Montagna et al., 2017; Jóźwiak et al., 2020; Lins and Brandt, 2020), which is to be expected as they have been designed for different purposes and for collecting different taxa. Revealing the ‘hidden’ infaunal biodiversity of the Aleutian Basin requires additional extractive sampling, though recent and ongoing breakthroughs in acoustic imaging methods provide promising avenues for future developments (Mizuno et al., 2022).
Once thought to be topographically flat, visually featureless, and biologically homogeneous, new data continue to reveal that the biodiversity of abyssal plains is in fact heterogeneous across multiple scales (Levin et al., 2001a; Snelgrove and Smith, 2002; Riehl et al., 2020). Our data adds to this by showing that the Bering Sea abyssal plain has distinct densities and assemblages of megafauna within a transect (~1 km) and between transects (~100 kms), as well as striking differences with published data across and between basins (over 1000 kms).
Statements
Data availability statement
The original contributions presented in the study are included in the article/Supplementary Material. The entire image set used for analyses is available in the public repository Dryad under the DOI: 10.5061/dryad.9s4mw6mm7. Further inquiries can be directed to the corresponding author.
Author contributions
JDS and CC conceived and designed the study. All authors participated in data collection through the image annotation game. AB, AJG, AHST, AMJ, AO, AP, ASM, CC, CJG, CM, EE, JDS, and SG identified organisms seen on the still images. JDS and CC drafted the manuscript with key contributions from AJG and AO, other authors critically revised and improved the draft manuscript. All authors contributed to the article and approved the submitted version.
Funding
The data were collected in the framework of the AleutBio project of BMBF grant 03G0293A to Prof. Dr. Angelika Brandt, Senckenberg Research Institute and Natural History Museum Frankfurt, Germany. AP’s participation on the cruise was supported by funding from University of the Ryukyus to James D. Reimer; CJG’s participation in the project was supported by NSF DEB Grant 2231299; EE’s participation on the cruise was supported by funding from Universidad Nacional Autonoma de Mexico; AMJ’s participation in the expedition was supported by funding from University of Lodz.
Acknowledgments
This is a publication of the “AleutBio” expedition on-board R/V SONNE (cruise SO293). Master and crew of R/V SONNE, especially the WTD team Matthias Großmann, Heinz Voigt-Wenzel, and Wolfgang Borchert, are gratefully acknowledged for their support. We thank Hidetaka Nomaki (JAMSTEC) for useful discussion and Allen Collins (Smithsonian Institution), Hiroki Kise (National Institute of Advanced Industrial Science and Technology (AIST)), and James D. Reimer (University of the Ryukyus) for helping with cnidarian identifications. This is a contribution from the Senckenberg Ocean Species Alliance. This is AleutBio publication #2. AleutBio received endorsement from UNESCO (No. 59.2) as a project forming part of the UN Decade of Ocean Science for Sustainable Development 2021-2030, and also contributes to the UN Project Challenger 150. The entire image set from these three stations, together with the ship’s action log and data from the USBL transponder attached to the OFOS system, are available in the public repository Dryad under the DOI: 10.5061/dryad.9s4mw6mm7.
Conflict of interest
The authors declare that the research was conducted in the absence of any commercial or financial relationships that could be construed as a potential conflict of interest.
Publisher’s note
All claims expressed in this article are solely those of the authors and do not necessarily represent those of their affiliated organizations, or those of the publisher, the editors and the reviewers. Any product that may be evaluated in this article, or claim that may be made by its manufacturer, is not guaranteed or endorsed by the publisher.
Supplementary material
The Supplementary Material for this article can be found online at: https://www.frontiersin.org/articles/10.3389/fmars.2022.1037482/full#supplementary-material
References
1
AmaroT.DanovaroR.MatsuiY.RastelliE.WolffG. A.NomakiH. (2019). Possible links between holothurian lipid compositions and differences in organic matter (OM) supply at the western pacific abyssal plains. Deep Sea Res. Part I: Oceanographic Res. Papers152, 103085. doi: 10.1016/j.dsr.2019.103085
2
AymaA.AguzziJ.CanalsM.LastrasG.BahamonN.MechoA.et al. (2016). Comparison between ROV video and agassiz trawl methods for sampling deep water fauna of submarine canyons in the northwestern Mediterranean Sea with observations on behavioural reactions of target species. Deep Sea Res. Part I: Oceanographic Res. Papers114, 149–159. doi: 10.1016/j.dsr.2016.05.013
3
BarhamE. G.AyerN. J.BoyceR. E. (1967). Macrobenthos of the San Diego trough: photographic census and observations from bathyscaphe, Trieste. Deep Sea Res. Oceanographic Abstracts14, 773–784. doi: 10.1016/S0011-7471(67)80013-5
4
BillettD. S. M.HansenB. (1982). Abyssal aggregations of Kolga hyalina Danielssen and Koren (Echinodermata: Holothurioidea) in the northeast Atlantic Ocean: A preliminary report. deep Sea research part a. Oceanographic Res. Papers29, 799–818. doi: 10.1016/0198-0149(82)90047-4
5
BridgesA. E. H.BarnesD. K. A.BellJ. B.RossR. E.HowellK. L. (2022). Depth and latitudinal gradients of diversity in seamount benthic communities. J. Biogeography49, 904–915. doi: 10.1111/jbi.14355
6
ChimientiG.AngelettiL.RizzoL.TursiA.MastrototaroF. (2018). ROV vs trawling approaches in the study of benthic communities: The case of Pennatula rubra (Cnidaria: Pennatulacea). J. Mar. Biol. Assoc. United Kingdom98, 1859–1869. doi: 10.1017/S0025315418000851
7
De MendonçaS.MetaxasA. (2021). Comparing the performance of a remotely operated vehicle, a drop camera, and a trawl in capturing deep-sea epifaunal abundance and diversity. Front. Mar. Sci.8, 631354. doi: 10.3389/fmars.2021.631354
8
DiazB. (2004). Biological and physical processes structuring deep-sea surface sediments in the Scotia and weddell seas, Antarctica. Deep-Sea Res. II51, 1515–1532. doi: 10.1016/j.dsr2.2004.06.022
9
DurdenJ. M.BettB. J.JonesD. O. B.HuvenneV. A. I.RuhlH. A. (2015). Abyssal hills – hidden source of increased habitat heterogeneity, benthic megafaunal biomass and diversity in the deep sea. Prog. Oceanography137, 209–218. doi: 10.1016/j.pocean.2015.06.006
10
DurdenJ. M.BettB. J.RuhlH. A. (2020). Subtle variation in abyssal terrain induces significant change in benthic megafaunal abundance, diversity, and community structure. Prog. Oceanography186, 102395. doi: 10.1016/j.pocean.2020.102395
11
GageJ. D. (2004). Diversity in deep-sea benthic macrofauna: the importance of local ecology, the larger scale, history and the Antarctic. Deep Sea Res. Part II: Topical Stud. Oceanography51, 1689–1708. doi: 10.1016/j.dsr2.2004.07.013
12
GEBCO Compilation Group (2022). GEBCO_2022 grid. Online Publication: The General Bathymetric Chart of the Oceans. doi: 10.5285/e0f0bb80-ab44-2739-e053-6c86abc0289c
13
GoodayA. J.BettB. J.PrattD. N. (1993). Direct observation of episodic growth in an abyssal xenophyophore (Protista). Deep-Sea Res. I40, 2131–2143. doi: 10.1016/0967-0637(93)90094-J
14
GoodayA. J.DurdenJ. M.SmithC. R. (2020b). Giant, highly diverse protists in the abyssal pacific: Vulnerability to impacts from seabed mining and potential for recovery. Communicative Integr. Biol.13 (1), 189–197. doi: 10.1080/19420889.2020.1843818
15
GoodayA. J.SchoenleA.DolanJ. R.ArndtH. (2020a). Protist diversity and function in the dark ocean – challenging the paradigms of deep-sea ecology with special emphasis on foraminiferans and naked protists. Eur. J. Protistology75, 125721. doi: 10.1016/j.ejop.2020.125721
16
GrebmeierJ. M.OverlandJ. E.MooreS. E.FarleyE. V.CarmackE. C.CooperL. W.et al. (2006). A major ecosystem shift in the northern Bering Sea. Science311, 1461–1464. doi: 10.1126/science.1121365
17
GuttJ.PiepenburgD. (1991). Dense aggregations of three deep-sea holothurians in the southern Weddell Sea, Antarctica. Mar. Ecol. Prog. Ser.68, 277–285. doi: 10.3354/meps068277
18
HaedrichR. L.RoweG. T.PolloniP. T. (1980). The megabenthic fauna in the deep sea south of New England, USA. Mar. Biol.57, 165–179. doi: 10.1007/BF00390735
19
HarrisP. T. (2014). Shelf and deep-sea sedimentary environments and physical benthic disturbance regimes: A review and synthesis. Mar. Geology353, 169–184. doi: 10.1016/j.margeo.2014.03.023
20
HesslerR. R.SandersH. L. (1967). Faunal diversity in the deep-sea. Deep Sea Res. Oceanographic Abstracts14, 65–78. doi: 10.1016/0011-7471(67)90029-0
21
HoodD. W. (1983). “The Bering Sea,” in Ecosystems of the world 26: Estuaries and enclosed seas. Ed. KetchumB. H. (Amsterdam: Elsevier), 337–373.
22
HowellK. L.BridgesA. E.GravesK. P.AllcockL.La BiancaG.Ventura-CostaC.et al. (2022). Performance of deep-sea habitat suitability models assessed using independent data, and implications for use in area-based management. Mar. Ecol. Prog. Ser.695, 33–51. doi: 10.3354/meps14098
23
HowellK. L.HilárioA.AllcockA. L.BaileyD.BakerM.ClarkM. R.et al. (2021). A decade to study deep-sea life. Nat. Ecol. Evol.5, 265–267. doi: 10.1038/s41559-020-01352-5
24
HughesJ. A.GoodayA. J. (2004). Associations between living benthic foraminifera and dead tests of Syringammina fragilissima (Xenophyophorea) in the Darwin mounds region (NE Atlantic). Deep Sea Res. Part I: Oceanographic Res. Papers51, 1741–1758.
25
JamiesonA. J.StewartH. A.RowdenA. A.ClarkM. R. (2020). “Chapter 59 - geomorphology and benthic habitats of the Kermadec Trench, Southwest Pacific Ocean,” in Seafloor geomorphology as benthic habitat, 2nd ed. Eds. HarrisP. T.BakerE. (Elsevier), 949–966. doi: 10.1016/j.pocean.2019.102255
26
JóźwiakP.PabisK.BrandtA.BłażewiczM. (2020). Epibenthic sled versus giant box corer – comparison of sampling gears for tanaidacean species richness assessment in the abyssal benthic ecosystem. Prog. Oceanography181, 102255.
27
KaufmannR. S.SmithK. L. (1997). Activity patterns of mobile epibenthic megafauna at an abyssal site in the eastern North Pacific: Results from a 17-month time-lapse photographic study. Deep Sea Res. Part I: Oceanographic Res. Papers44, 559–579. doi: 10.1016/S0967-0637(97)00005-8
28
LapointeA.WatlingL.GontzA. M. (2020). “Chapter 57 - deep-sea benthic megafaunal communities on the New England and Corner Rise seamounts, Northwest Atlantic Ocean,” in Seafloor geomorphology as benthic habitat, 2nd ed. Eds. HarrisP. T.BakerE. (Amsterdam: Elsevier), 917–932.
29
LemonL. M.SmithK. L.HuffardC. L. (2022). Abyssal epibenthic holothurians respond differently to food quantity and concentration fluctuations over a decade of daily observations –2017). Deep Sea Res. Part I: Oceanographic Res. Papers188, 103853. doi: 10.1016/j.dsr.2022.103853
30
LevinL. A.EtterR. J.RexM. A.GoodayA. J.SmithC. R.PinedaJ.et al. (2001a). Environmental influences on regional deep-sea species diversity. Annu. Rev. Ecol. Systematics32, 51–93. doi: 10.1146/annurev.ecolsys.32.081501.114002
31
LevinL. A.GoodayA. J. (1992). “Possible roles for xenophyophores in deep-sea carbon cycling,” in Deep-sea food chains and the global carbon cycle. Eds. RoweG. T.ParienteV. (Dordrecht: Springer Netherlands), 93–104.
32
LevinL. A.GoodayA. J.JamesD. W. (2001b). Dressing up for the deep: Agglutinated protists adorn an irregular urchin. J. Mar. Biol. Assoc. United Kingdom81, 881–882. doi: 10.1017/S0025315401004738
33
LevinL. A.RouseG. W. (2020). Giant protists (xenophyophores) function as fish nurseries. Ecology101, e02933. doi: 10.1002/ecy.2933
34
LevinL. A.ThomasC. L. (1988). The ecology of xenophyophores (Protista) on eastern pacific seamounts. Deep Sea Res. Part A. Oceanographic Res. Papers35, 2003–2027. doi: 10.1016/0198-0149(88)90122-7
35
LinleyT. D.StewartA. L.McmillanP. J.ClarkM. R.GerringerM. E.DrazenJ. C.et al. (2017). Bait attending fishes of the abyssal zone and hadal boundary: Community structure, functional groups and species distribution in the Kermadec, New Hebrides and Mariana trenches. Deep Sea Res. Part I: Oceanographic Res. Papers121, 38–53. doi: 10.1016/j.dsr.2016.12.009
36
LinsL.BrandtA. (2020). Comparability between box-corer and epibenthic-sledge data on higher taxon level: A case study based on deep-sea samples from the NW Pacific. Prog. Oceanography182, 102273. doi: 10.1016/j.pocean.2020.102273
37
LörzA.-N.HortonT. (2021). Investigation of the Amathillopsidae (Amphipoda, Crustacea), including the description of a new species, reveals a clinging lifestyle in the deep sea worldwide. ZooKeys1031, 19–39. doi: 10.3897/zookeys.1031.62391
38
LudwigW. J.MurauchiS.DenN.EwingM.HottaH.HoutzR. E.et al. (1971). Structure of Bower’s Ridge, Bering Sea. J. Geophysical Res.76, 6350–6366. doi: 10.1029/JB076i026p06350
39
MangiaficoS. S. (2016) Summary and analysis of extension program evaluation in R, version 1.19.10. Available at: rcompanion.org/handbook/.
40
MizunoK.NomakiH.ChenC.SeikeK. (2022). Deep-sea infauna with calcified exoskeletons imaged in situ using a new 3D acoustic coring system (A-core-2000). Sci. Rep.12, 12101. doi: 10.1038/s41598-022-16356-3
41
MoninA. S. (1983). Research vessel “Vityaz” and her expeditions 1949-1979 (Moscow: Nauka Press).
42
MontagnaP. A.BaguleyJ. G.HsiangC.-Y.ReuscherM. G. (2017). Comparison of sampling methods for deep-sea infauna. Limnology Oceanography: Methods15, 166–183. doi: 10.1002/lom3.10150
43
NomakiH.RastelliE.AlvesA.SugaH.RamosS.KitahashiT.et al. (2021). Abyssal fauna, benthic microbes, and organic matter quality across a range of trophic conditions in the western Pacific Ocean. Prog. Oceanography195, 102591. doi: 10.1016/j.pocean.2021.102591
44
O’HaraT. D.WilliamsA.AhyongS. T.AldersladeP.AlvestadT.BrayD.et al. (2020). The lower bathyal and abyssal seafloor fauna of eastern Australia. Mar. Biodiversity Records13, 11. doi: 10.1186/s41200-020-00194-1
45
PawsonD. L. (1982). Deep-sea echinoderms in the tongue of the ocean, Bahama Islands: A survey, using the research submersible. Alvin. Aust. Museum Memoir16, 129–145. doi: 10.3853/j.0067-1967.16.1982.362
46
Ramirez-LlodraE.BrandtA.DanovaroR.De MolB.EscobarE.GermanC. R.et al. (2010). Deep, diverse and definitely different: Unique attributes of the world's largest ecosystem. Biogeosciences7, 2851–2899. doi: 10.5194/bg-7-2851-2010
47
RiehlT.WölflA.-C.AugustinN.DeveyC. W.BrandtA. (2020). Discovery of widely available abyssal rock patches reveals overlooked habitat type and prompts rethinking deep-sea biodiversity. Proc. Natl. Acad. Sci.117, 15450–15459. doi: 10.1073/pnas.1920706117
48
RybakovaE.GalkinS.GebrukA.SanamyanN.MartynovA. (2020). Vertical distribution of megafauna on the Bering Sea slope based on ROV survey. PeerJ8, e8628. doi: 10.7717/peerj.8628
49
SchneiderC. A.RasbandW. S.EliceiriK. W. (2012). NIH Image to ImageJ: 25 years of image analysis. Nat. Methods9, 671–675. doi: 10.1038/nmeth.2089
50
Simon-LledóE.PomeeC.AhokavaA.DrazenJ. C.LeitnerA. B.FlynnA.et al. (2020). Multi-scale variations in invertebrate and fish megafauna in the mid-eastern Clarion Clipperton Zone. Prog. Oceanography187, 102405. doi: 10.1016/j.pocean.2020.102405
51
SmithC. R. (2020). The heterogeneous abyss. Proc. Natl. Acad. Sci.117, 202010215. doi: 10.1073/pnas.2010215117
52
SnelgroveP. V. R.SmithC. R. (2002). A riot of species in an environmental calm: the paradox of the species-rich deep-sea floor. Oceanography Mar. Biology an Annu. Rev.40, 311–342.
53
SokalR. R.RohlfF. J. (1995). Biometry: The principles and practice of statistics in biological research. 3rd Edition (New York: W.H. Freeman and Co).
54
SoltwedelT.BauerfeindE.BergmannM.BudaevaN.HosteE.JaeckischN.et al. (2005). HAUSGARTEN: Multidisciplinary investigations at a deep-sea, long-term observatory in the Arctic ocean. Oceanography18, 46–61. doi: 10.5670/oceanog.2005.24
55
TaylorJ.KrumpenT.SoltwedelT.GuttJ.BergmannM. (2017). Dynamic benthic megafaunal communities: Assessing temporal variations in structure, composition and diversity at the Arctic deep-sea observatory HAUSGARTEN between 2004 and 2015. Deep Sea Res. Part I: Oceanographic Res. Papers122, 81–94. doi: 10.1016/j.dsr.2017.02.008
56
ThorntonB.BodenmannA.PizarroO.WilliamsS. B.FriedmanA.NakajimaR.et al. (2016). Biometric assessment of deep-sea vent megabenthic communities using multi-resolution 3D image reconstructions. Deep Sea Res. Part I: Oceanographic Res. Papers116, 200–219. doi: 10.1016/j.dsr.2016.08.009
57
UzmannJ. R.CooperR. A.TherouxR. B.WigleyR. L. (1977). Synoptic comparison of three sampling techniques for estimating abundance and distribution of selected megafauna: Submersible vs camera sled vs otter trawl. Mar. Fish. Rev.39, 11–19.
58
VoltskiI.WeinerA. K. M.TsuchiyaM.KitazatoH. (2018). Morphological and genetic description of Syringammina limosa sp. nov., the first xenophyophore (Foraminifera) from the deep Sea of Okhotsk. Deep Sea Res. II154, 32–46. doi: 10.1016/j.dsr2.2017.12.001
59
WeatherallP.MarksK. M.JakobssonM.SchmittT.TaniS.ArndtJ. E.et al. (2015). A new digital bathymetric model of the world's oceans. Earth Space Sci.2, 331–345. doi: 10.1002/2015EA000107
60
WighamB. D.TylerP. A.BillettD. S. M. (2003). Reproductive biology of the abyssal holothurian Amperima rosea: An opportunistic response to variable flux of surface derived organic matter? J. Mar. Biol. Assoc. United Kingdom83, 175–188. doi: 10.1017/S0025315403006957h
61
ZimmermannM.PrescottM. M. (2018). Bathymetry and canyons of the Eastern Bering Sea slope. Geosciences8, 184. doi: 10.3390/geosciences8050184
Summary
Keywords
Aleutian Basin, Annotation Game, image analysis, Elpidia, xenophyophore, abyssal plain, Arctic
Citation
Sigwart JD, Brandt A, Di Franco D, Briones EE, Gerken S, Gooday AJ, Grimes CJ, Głuchowska K, Hoffmann S, Jażdżewska AM, Kamyab E, Kelch A, Knauber H, Kohlenbach K, Miguez-Salas O, Moreau C, Ogawa A, Poliseno A, Santín Muriel A, Tandberg AHS, Theising FI, Walter T, Wölfl A-C and Chen C (2023) Heterogeneity on the abyssal plains: A case study in the Bering Sea. Front. Mar. Sci. 9:1037482. doi: 10.3389/fmars.2022.1037482
Received
05 September 2022
Accepted
20 December 2022
Published
24 January 2023
Volume
9 - 2022
Edited by
Lorenzo Angeletti, National Research Council (CNR), Italy
Reviewed by
Heather Ann Stewart, The Lyell Centre, United Kingdom; Autun Purser, Alfred Wegener Institute Helmholtz Centre for Polar and Marine Research (AWI), Germany
Updates
Copyright
© 2023 Sigwart, Brandt, Di Franco, Briones, Gerken, Gooday, Grimes, Głuchowska, Hoffmann, Jażdżewska, Kamyab, Kelch, Knauber, Kohlenbach, Miguez-Salas, Moreau, Ogawa, Poliseno, Santín Muriel, Tandberg, Theising, Walter, Wölfl and Chen.
This is an open-access article distributed under the terms of the Creative Commons Attribution License (CC BY). The use, distribution or reproduction in other forums is permitted, provided the original author(s) and the copyright owner(s) are credited and that the original publication in this journal is cited, in accordance with accepted academic practice. No use, distribution or reproduction is permitted which does not comply with these terms.
*Correspondence: Chong Chen, cchen@jamstec.go.jp
This article was submitted to Deep-Sea Environments and Ecology, a section of the journal Frontiers in Marine Science
Disclaimer
All claims expressed in this article are solely those of the authors and do not necessarily represent those of their affiliated organizations, or those of the publisher, the editors and the reviewers. Any product that may be evaluated in this article or claim that may be made by its manufacturer is not guaranteed or endorsed by the publisher.