 Jin-Ming Tang1
 Min Nina Xu2*†
 Yuxuan Lin3
 Huangxin Chen1
 Haoquan Jin1
 Li-Li Han1
 Wenbin Zou1
 Shuh-Ji Kao1,2*†
- 1State Key Laboratory of Marine Environmental Science, College of Ocean and Earth Sciences, Xiamen University, Xiamen, China
- 2State Key Laboratory of Marine Resources Utilization in South China Sea, Hainan University, Haikou, China
- 3State Key Laboratory of Marine Environmental Science, College of Environment and Ecology, Xiamen University, Xiamen, China
Estuaries channel large amounts of anthropogenic nitrogen (N) from continents to the offshore where productivity is widely limited by N and phosphorus. Ammonium and urea, two reduced forms of anthropogenic N commonly observed, are the preferred substrates for various microorganisms (e.g., uptake by phytoplankton or bacteria and oxidation by nitrifier). Yet, it remains underexplored how they transform and their concentrations vary during transport in the estuary which may influence the offshore microbial community. We applied 15N isotope tracer incubation techniques to determine the two main bio-consumption processes, i.e., uptake and oxidation, of ammonium and urea, in the dark for the Jiulong River Estuary, a eutrophic estuary in southeastern China. Results showed that light penetration depth ranged from 0.8-3.3 m leaving 76% of estuary water bodies to stay in dark situations throughout a day. Ammonia oxidation, which favors dark conditions, dominates the estuarine regenerated-N cycle, showing the rank: ammonia oxidation > ammonium uptake >> urea uptake ≈ urea oxidation. By compiling the reported case studies, we found the relatively low ratio of urea oxidation to ammonia oxidation was accompanied by a relatively high ammonium concentration. Microorganisms’ high preference for ammonium over urea may lead to an inhibitory-like phenomenon. An analogous effect was evident by the increased urea uptake at downstream when ammonium was down to a few µM. The obstructed urea utilization resulted in 10 times longer lifetime for urea relative to ammonium (surface: 19 ± 9 days; bottom 12 ± 7 days). Such an inhibitory-like effect allows urea to be preserved in the estuary and allows urea to be transported farther offshore to stimulate microorganisms capable of utilizing urea, which may have significant impacts on offshore ecology.
1. Introduction
Nitrogen (N) is one of the most critical elemental species in the aquatic environment and is greatly influenced by human activities (Voss et al., 2011). Large quantities of fertilizer and N-containing sewage are discharged from continents into the ocean (Galloway, 2014). Acting as a bioreactor in the land-ocean interface, estuarine systems play a key role to host and transform multiple anthropogenic N species. The microbial modulation of anthropogenic reactive N during their transport inside the estuary may shift downstream ecological functioning, potentially leading to outbreaks of harmful algal bloom and hypoxia, threatening the ecological security of the coastal ocean (Glibert et al., 2016). Exploring the distribution and biogeochemical behavior of these reactive N species in estuaries is therefore crucial to our understanding of the human-influenced estuarine N cycle and fundamental to the development of future coastal zone management policies.
Ammonium and urea, the most direct products of man-made fertilizers, are considered to be the two most influential anthropogenic N and are classified as reduced-N (Glibert et al., 2016). Due to the lower energy utilization threshold, ammonium is often considered to be the most bioavailable inorganic N relative to nitrate and nitrite and can be directly taken up as a source of N by a wide variety of organisms including phytoplankton and bacteria to construct biomolecules represented by proteins (Mulholland and Lomas, 2008). In addition to being assimilated, ammonium can also be consumed via oxidation by chemoautotrophic organisms to provide energy (i.e., ammonia oxidation). Nitrification is recognized as the major biological source process of nitrite/nitrate (Ward, 2008), providing substrates for N removal processes like denitrification (Tan et al., 2020). Another representative estuarine anthropogenic N, urea, the small molecule of organic N closely associated with life activities, has received increasing attention (Glibert et al., 2006; Moschonas et al., 2017). In some estuaries, urea loaded from human activities has risen to several times higher (Glibert et al., 2006). Although its presence in organic form, urea can be easily accessed (i.e., low half saturation constant in the Michaelis-Menten equation) like ammonium in a previous study (Xu et al., 2019). Some reported urea uptake studies in the ocean and estuary show that rates of urea uptake can be comparable to that of some inorganic N uptake (Moschonas et al., 2017; Xu et al., 2019), but its biogeochemical behavior has been less studied compared to ammonium. Besides being uptaken, urea has recently shown the potential to act as an energy source for chemoautotrophs (Alonso-Saez et al., 2012; Kirchman, 2012), significantly improving our knowledge of urea’s biological consumption pathway. However, only a few open-ocean (Xu et al., 2019; Shiozaki et al., 2021; Wan et al., 2021) and coastal studies (Tolar et al., 2017; Kitzinger et al., 2019) have reported on urea oxidation process. To our knowledge, there are currently no reports on urea oxidation rates in the estuarine environment to form a potential gap in estuarine N cycle research.
The four processes described above are difficult to trace by only measuring changes in substrate concentrations, especially when the rate magnitudes are small or when multiple processes occur simultaneously (Xu et al., 2017). The 15N stable isotope tracing technique is a better approach (Glibert et al., 2019). We can obtain process rates by artificially adding 15N-labelled substrates (e.g., 15N-ammonium and 15N-urea) and measuring these 15N accumulations in product reservoirs (e.g., nitrate plus nitrite () for the oxidation process; particulate organic N (PN) for the uptake process) after incubation. The highly sensitive isotope ratio mass spectrometry allows us to detect small changes in 15N in the product pools and thus simultaneously traces the transformation rates from the substrate to different products (i.e., ammonia oxidation: ammonium to ; urea oxidation: urea to ; ammonium uptake: ammonium to PN; urea uptake: urea to PN).
The high turbidity in estuaries (e.g., Changjiang River Estuary, Pearl River Estuary, and Jiulong River Estuary in this study) makes dark conditions important for estuarine N cycling (Hsiao et al., 2014; Tseng et al., 2014; Xu et al., 2022). Darkness and low light periods exceed 1/2 of the day, additionally, light decays rapidly so that most estuarine water columns are in dark conditions even during the daytime (e.g., Figure 2D). Dark incubation was a common operation for nitrification incubation (Dai et al., 2008; Zheng et al., 2017; Peng et al., 2018). And for N uptake, many studies usually use only the rates under light conditions, but dark uptake can reach more than half of light uptake in some cases (especially for reduced-stated-N, such as ammonium), which is unignorable and scarcely studied (Mulholland and Lomas, 2008; Xu et al., 2019; Chen et al., 2020).
The Jiulong River Estuary (JRE), a typical subtropical macro-tide estuary (Lin et al., 2022) with a mean water discharge of 1.4 × 10¹⁰ m3 yr-1 on the southeast coast of China, was selected to study the transformations of ammonium and urea along a salinity gradient specifically in the dark. In the past decades, JRE is heavily disturbed by anthropogenic activities like agriculture and pig/poultry farming, which have left footprints in nitrate isotopes (Wang et al., 2021). Dissolved inorganic nitrogen (DIN) flux in JRE is up to 34.8×10³ t N yr-1 with a very high areal yield rate of DIN flux (2.3×10³ kg N km-2 yr-1) (Yan et al., 2012). The DIN discharge per unit area even exceeds many of the world’s major rivers (e.g., Yangtze, Pearl River, Amazon River) (Wu et al., 2017). Previous studies of the JRE have focused on the fluxes (Yan et al., 2012), sources (Yan et al., 2019; Wang et al., 2021), and sinks (Tan et al., 2020) of N in the JRE, but little is known about the highly active internal turnover of ammonium and urea in the estuary.
In this study, we examined the ammonium and urea dynamics through the robust 15N-pulse incubation technique, which enables us to obtain rates of N oxidation and uptake simultaneously. We aim to (1) explore the dominant pathways of reduced-N in the estuary; (2) provide fresh insights into urea’s role in the nutrient-rich estuary, especially for previously unreported estuarine urea oxidation; (3) explore the importance of dark N uptake compared to N oxidation; (4) examine the lifetime of ammonium and urea in the eutrophic JRE by taking all consumption processes (uptake and oxidation) into account simultaneously.
2. Materials and methods
2.1. Study site and sampling
The investigation along the JRE was conducted by using R/V Ocean II of Xiamen University on 3rd December 2018, when JRE was in the dry season with a monthly discharge of 4.17× 10⁸ m3 (Figure S1) (data from http://slt.fujian.gov.cn/). Fourteen sampling stations were set up seaward along the main axis of the JRE (T1-T14; Figure 1) to collect samples of nitrogenous nutrients (DIN and urea), PN, Chlorophyll a (Chl a), and total suspended substances (TSS) from the 0.5 m surface water (Surface) and layer at 1 m above the bottom (Bottom), while onboard incubation was conducted simultaneously at these layers. At each station, salinity, temperature, pH, and light intensity were recorded by a Conductivity, Temperature, and Depth profiler (CTD, OCEAN SEVEN 316 Plus). Salinity for sampling layers was also measured onboard using a portable multiparameter water quality analyzer (WTW, Multi 3630 IDS Set F).
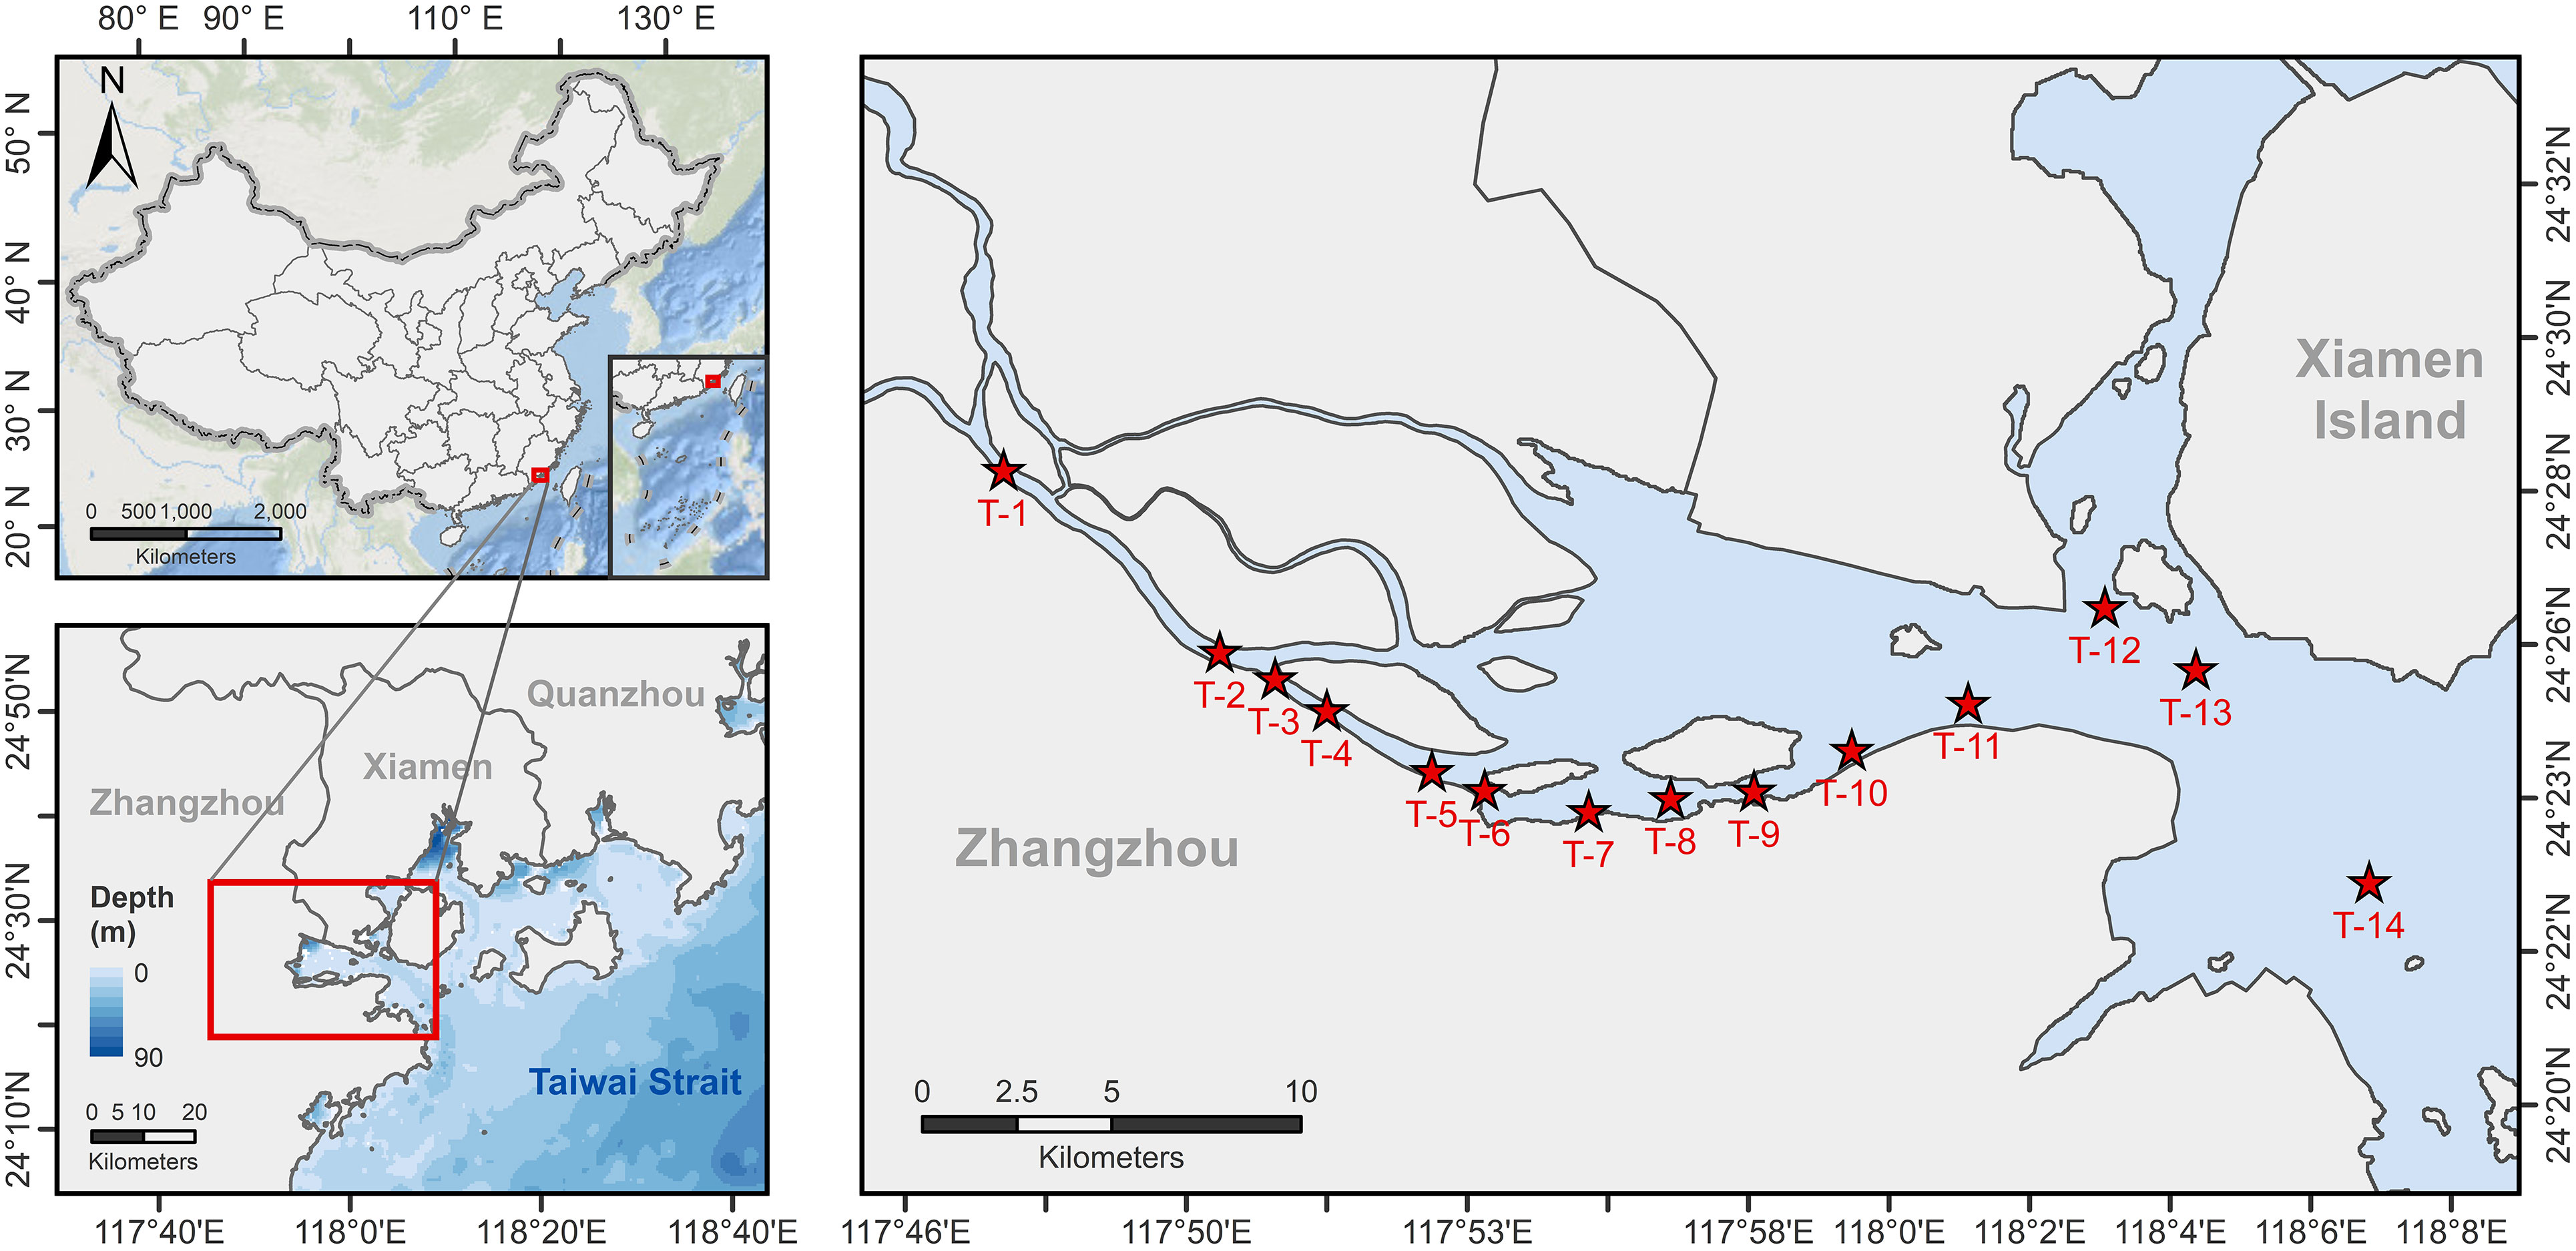
Figure 1 Station map for this study. The red stars show the 14 stations where incubation experiments were conducted and environmental parameters were collected during the study, with T1-T11 distributed along the main axis of the Jiulong River Estuary and T12-T14 representing the nearshore stations where surface salinity is above 24.
Water samples were collected in acid-washed 10 L bottles by a peristaltic pump system placed in parallel with the CTD. A portion was taken and filtered through a syringe polyethersulfone filter of 0.22 µm pore size to collect the filtrate for DIN concentration determination while approximately 50 mL of water was filtered by 0.7 µm GF/F membranes for urea measurement. 160-300 mL water samples were filtered through 25 mm pre-combusted (450°C for 4 hours) and pre-weighed GF/F membranes under a gentle vacuum pressure (< 200 mmHg) to collect the particulate samples for PN, TSS, and Chl a determination. In stations T1, T8, and T14, approximately 500 mL of water from the bottom layers was filtered in triplicate for qPCR analysis. All membrane samples were stored at -80°C while filtrate samples were stored at -20°C until analysis.
2.2. Analysis of chemical and biological parameters
2.2.1. DIN and urea analysis
Concentrations of nitrate and nitrite were measured using an AA3 Auto-Analyzer (Bran & Luebbe Co., Germany) (Dai et al., 2008), water samples pass through a copper-cadmium reduction column where the nitrate is reduced to nitrite, and nitrite is then reacted with sulfanilamide and N-1-naphthyl-ethylenediamine dihydrochloride (N-1-N/NEDD) to form a red dye for measurement of absorbance (Becker et al., 2020). Samples for ammonium were analyzed based on the indophenol blue spectrophotometric method (Pai et al., 2001), with correction for salinity/pH effect. Urea concentrations were measured using a five-centimeter cuvette based on the optimized colorimetric reaction with diacetyl monoxime (Chen et al., 2015). The detection limits for nitrate, nitrite, ammonium, and urea were 0.07, 0.02, 0.5, and 0.1 μM respectively.
2.2.2. Measurement of TSS, PN, and Chl a
After cold drying, the membrane was weighed again and the pre-filtration mass was deducted and divided by the filtration volume to obtain the TSS (mg/L). After the weighing, these GF/F filters were chemically oxidized using recrystallized potassium persulfate to turn PN into nitrate (Knapp et al., 2005; Xu et al., 2022) which was subsequently measured by NOx analyzer according to chemiluminescence method (Braman and Hendrix, 1989), with a detection limit of 0.05 μM.
We derived the total Chl a from the high-performance liquid chromatography procedure and details can be found in previous literature (Xiao et al., 2018; Ma et al., 2021).
2.2.3. amoA gene analysis
The determination of the copy numbers of the amoA gene for bacteria and archaea was performed via qPCR using a QuantStudio 7 pro instrument (ABI). Primer pairs and settings were based on previous reports, as follows: amoA-1F, amoA-2R (Rotthauwe et al., 1997) for bacterial amoA genes, and amoA-AF, amoA-AR (Francis et al., 2005) for archaeal amoA genes.
2.3. 15N isotope tracer incubation method
2.3.1. Incubation onboard
Incubation experiments for N oxidation and uptake were conducted at all 14 stations along the salinity gradients of the estuary in both surface-bottom layers. Seawater for incubation was dispensed into 250 mL HDPE bottles within half an hour of collection. For each rate group, two biological replicates were set up. The 15N tracer was added based on the historical nutrient data to achieve a final concentration of 1 µM and 0.5 µM for ammonium and urea, respectively, following the 15N-tracer addition criterion of 10% or 20% of the ambient substrate concentrations (Raimbault and Garcia, 2008). The average final 15N addition percentage was 13% and 22% for ammonium and urea, respectively (Table S1) on the basis of real measurement. And then all bottles were incubated for approximately 9 hours in the dark under in situ temperature in temperature-controlled incubators.
At the beginning (T0) and end (T1) of incubation, approximately 40 mL of water was taken for δ15N- (nitrate plus nitrite) and 100-200 mL for δ15N-PN for all groups, detailed collection and storage methods are described in section 2.1.
2.3.2. Analysis of 15N isotopic composition
The isotopic composition of nitrate plus nitrite (δ15N-) was determined by the bacterial method (Sigman et al., 2001). Briefly, ~20 nmol of nitrate plus nitrite in the water sample was quantitatively transformed into nitrous oxide gas in a 20 mL headspace bottle containing 3 mL of denitrifying bacteria (Pseudomonas aureofaciens, ATCC# 13985) that lack nitrous oxide reductase. And then the nitrous oxide gas was extracted and measured on a continuous flow Gasbench II-IRMS system (Yang et al., 2022). Three international isotopic references (IAEA-N3, δ15N = 4.70‰; USGS-34, δ15N = -1.80‰; USGS-32, δ15N = 180.00‰) and a laboratory working standard (δ15N = 13.8‰) were used to calibrate all δ15N values of samples. The standard deviations of δ15N were less than 0.2‰ based on standards measured in each batch and our previous results (Yang et al., 2022).
δ15N-PN was measured indirectly by the potassium persulfate oxidation and bacterial method (Knapp et al., 2005; Xu et al., 2022). The nitrate is formed by the digestion of the PN, after which the oxidized nitrate is analyzed by the denitrifier method as described above.
2.3.3. Rate estimate
N transformation rates (ρ), including ammonia oxidation, ammonium uptake, urea oxidation, and urea uptake were determined from the increment of 15N-composition in the product pool during the incubation, using the below equation, following Dugdale and Wilkerson (1986) and Zheng et al. (2017):
where [P] represents concentrations of product pool ( for oxidation rates and PN for uptake rates); r1 and r0 represent the isotopic composition of the product at T1 and T0; T represents incubation intervals.
2.4. Statistical analysis
The nonparametric Spearman correlation and significance tests of environmental factors and N transformation rates (n = 14 for all parameters except for temperature which n = 13) in the surface and bottom layers were performed by corrplot package (Wei and Simko, 2021) in R Language (R-Core-Team, 2022). Redundancy analysis (RDA) was performed by Canoco 5 software (ter Braak and Smilauer, 2012).
3. Results
3.1. Environmental setting
The salinity in this study area ranged from 0 to 27.7 (Figure 2A). The T1 station, located upstream of JRE (Figure 1), has the lowest salinity (~0) on both surface and bottom layers. Both surface and bottom salinity increase with the main axis of the estuarine station towards the sea, reaching a maximum at station T14. The seawater intrusion was observed since higher salinity was found in bottom compared to surface layers in all stations. In this study, the range of water temperature was approximately between 21-22.5°C. And the high salinity stations were slightly cooler than upstream, possibly due to lower seawater temperatures (Figures 2B, S2A). In general, the surface layer was slightly warmer than the bottom layer in the vertical direction probably due to higher daytime temperatures and the heating of sunlight during the day.
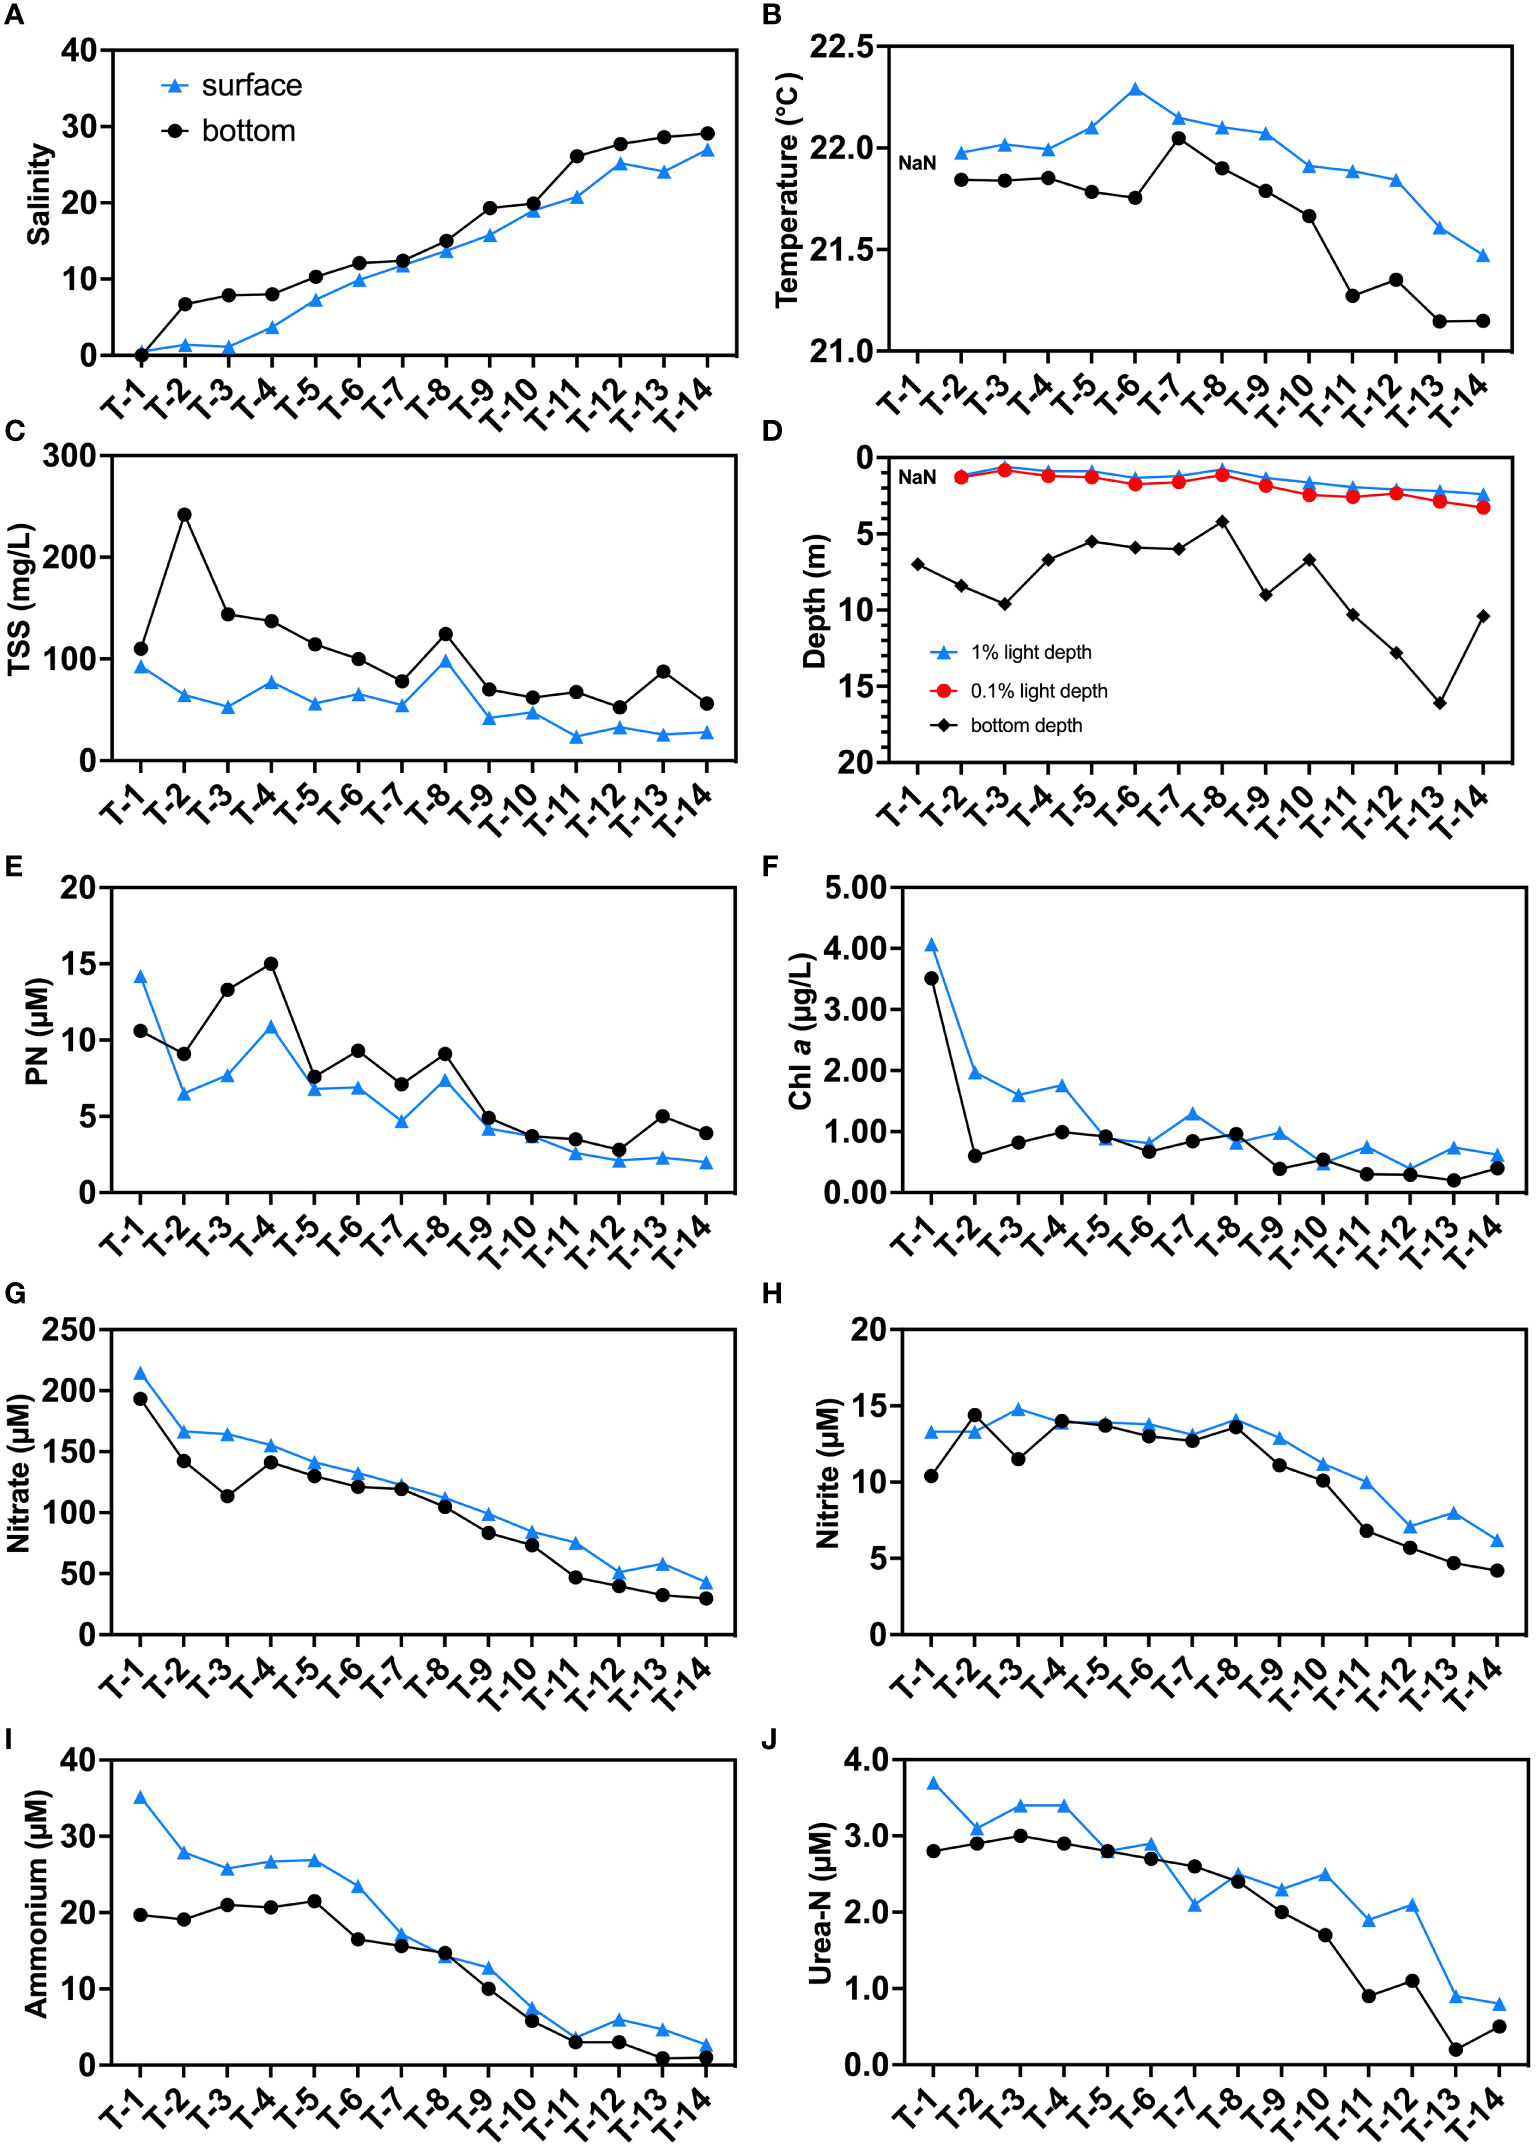
Figure 2 Distributions of environmental parameters in the sampling stations: (A) salinity; (B) temperature (°C); (C) total suspended substances (TSS, mg/L); (D) 1% surface light depth, 0.1% surface light depth, and bottom depth (m); (E) particulate N (PN, μM); (F) Chl a (μg/L); (G) nitrate (μM); (H) nitrite (μM); (I) ammonium (μM); and (J) urea-N (μM). Blue triangles indicate surface samples, black circles indicate bottom samples. “NaN” in subfigures (B) and (D) represent data that are not available.
The JRE is a turbid estuary where TSS can reach up to 272 mg/L upstream (T2) and over 50 mg/L at offshore stations (T12-T14) (Figures 2C, S2B). The bottom layers have higher TSS values (53-243 mg/L) than the surface layer (24-93 mg/L) which may be attributed to sediment resuspension. The high TSS resulted in a rapid weakening of light in the water column at the JRE. The 0.1% light intensity depths from the CTD data ranged from 0.8 m to 3.3 m, with an average of 76% (63%-91%) of depths in the sampled stations receiving no light even at noon (Figure 2D).
The PN shows a similar trend to the TSS, decreasing from upstream (~10 μM) to downstream (below 5 μM), and is higher at the bottom at most stations, suggesting a potential influence of sediment source (Figures 2E, S2C). Chl a, which is a representative of phytoplankton, had higher concentrations in the surface layer (0.39-4.07 μg/L) than in the bottom layer (0.20-3.51 μg/L), in contrast to the PN (Figures 2F, S2D).
All nitrogenous nutrients decrease in concentrations as salinity increases (Figures 2G–J, S2E–H). Nitrate dominates the DIN reservoirs in the JRE similar to previous studies (Yan et al., 2012). Nitrate concentrations fall below the conservative mixing line in upstream showing a slight deficit, and are conservative in the midstream and downstream (Figure S2E). The concentrations of nitrite (11.1 μM on average) were a magnitude lower than that of nitrate (average: 106.9 μM), and exhibit a significant addition pattern (Figure S2F). The ammonium and urea-N have their highest concentrations in upstream station T1’s surface layer, which achieve 25.2 and 3.7 μM, respectively. The ammonium generally shows a removal pattern with data falling below the conservative mixing line while urea shows a slight addition pattern in midstream (Figures S2G, 2H). Urea-N accounts for approximately 13% of the total regenerated N reservoir (defined as ammonium plus urea-N here) on average.
3.2. N transformation rates
Oxidation and uptake pathways of both ammonium and urea in all 14 stations were measured simultaneously using the highly sensitive 15N tracer technique (Figures 3, S3). Vertically, ammonia oxidation shows significantly higher rates in the bottom layers (43.7 nM/h on average) than that in the surface layers (21.6 nM/h on average) similar to previous research in Pearl River Estuary (Xu et al., 2022). The ammonia oxidation (Figure 3A) rate reaches the highest value for the surface (84.1 nM/h) and bottom (272.5 nM/h) rates at the upstream station T1. The surface rate gradually decreases from T1-T4, with little change from T4 to T14 (13.3 ± 3.6 nM/h, stands for mean value ± standard deviation of all data), while the bottom rate decreases from T1-T3, then slightly increases in T4 and T5, and reached stable in T6-T14 (16.9 ± 4.4 nM/h).
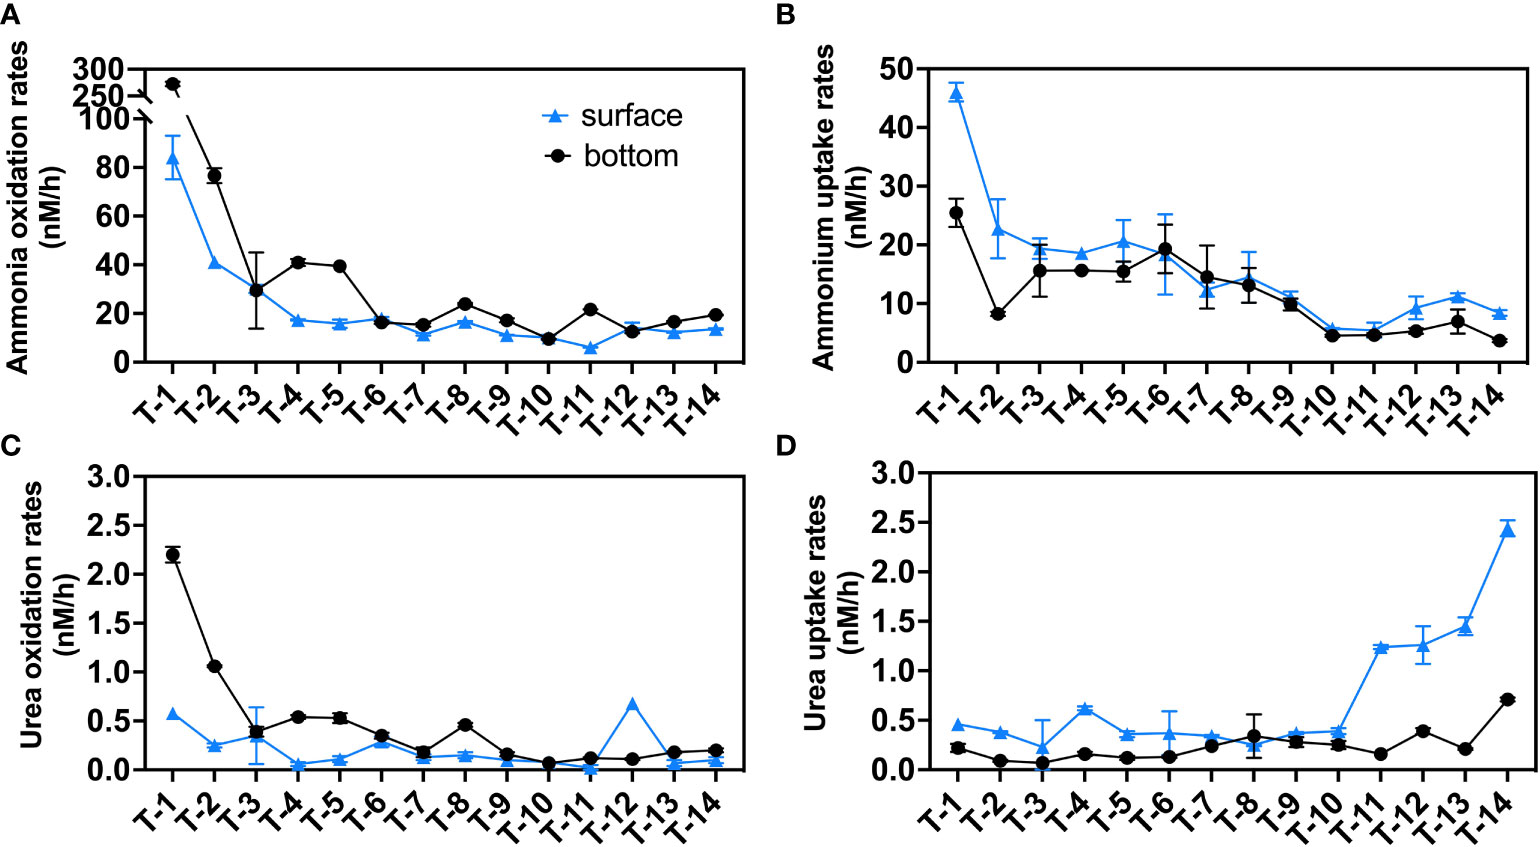
Figure 3 N transformation rates (nM/h) in the sampling stations: (A) ammonia oxidation rates; (B) ammonium uptake rates; (C) urea oxidation rates; (D) urea uptake rates. Blue triangles indicate surface rates, black circles indicate bottom rates and the error bars represent the standard deviation of the two biological replicates.
Ammonium uptake rates in the surface layers (16.0 nM/h) (Figure 3B), unlike ammonia oxidation, are generally greater than that in the bottom layers (11.6 nM/h). In the surface layers, ammonium uptake decreased from a maximum of 46.1 nM/h at station T1 to 19.4 nM/h at station T3 and then maintained a rate of ~20 nM/h at the four stations T3-T6, decreased to 5.5 nM/h (T11) seaward and finally slightly increased to ~10 nM/h at the offshore stations (T12-T14). In the bottom layers, T1 had the highest rate of 25.5 nM/h. After dropping to 8.3 nM/h at station T2, it was maintained at around 15 nM/h for the next 6 stations (T3-T8) before decreasing towards the sea end.
We report for the first time on urea oxidation and urea uptake in JRE. Similar to ammonium-related rates, vertically, urea-related rates show a bilayer structure, with urea oxidation in the surface layer (0.21 nM/h on average) being lower than the bottom layer (0.47 nM/h) and surface urea uptake (0.73 nM/h) higher than the bottom layer (0.24 nM/h) at most stations.
Urea oxidation rates (Figure 3C) in the bottom layers generally resemble the pattern of ammonia oxidation, while a slightly different pattern was found in the surface layers where urea oxidation rates peak in downstream station T12 (0.68 nM/h) which is near Xiamen Island and exhibit a high concentration of urea.
Unlike the above transformation processes, patterns of urea uptake were significantly different. Ammonia oxidation, ammonium uptake, and urea oxidation both had a negative correlation to salinity (Figures S3A–C), which may be due to the dilution of biomass (PN and Chl a, Figures S2C, D) and substrates (ammonium and urea, Figures S2G, H). Urea uptake (Figure 3D) is found to be active in the seaward, especially in the surface layers. The urea uptake rates in the seaward stations T11-T14 (1.60 ± 0.38 nM/h) were almost four times higher than that of other upstream stations (T1-T10: 0.38 ± 0.11 nM/h).
4. Discussion
4.1. Ammonia oxidation and its potentially influential factors
In the present study, we found ammonium-related rates were significantly higher than urea-related rates (Figures 4, S4). In particular, the ammonia oxidation rates were the highest of all four N transformation rates, and only at a few stations the ammonium uptake rates in the surface layer could reach the order of magnitude of the ammonia oxidation rate.
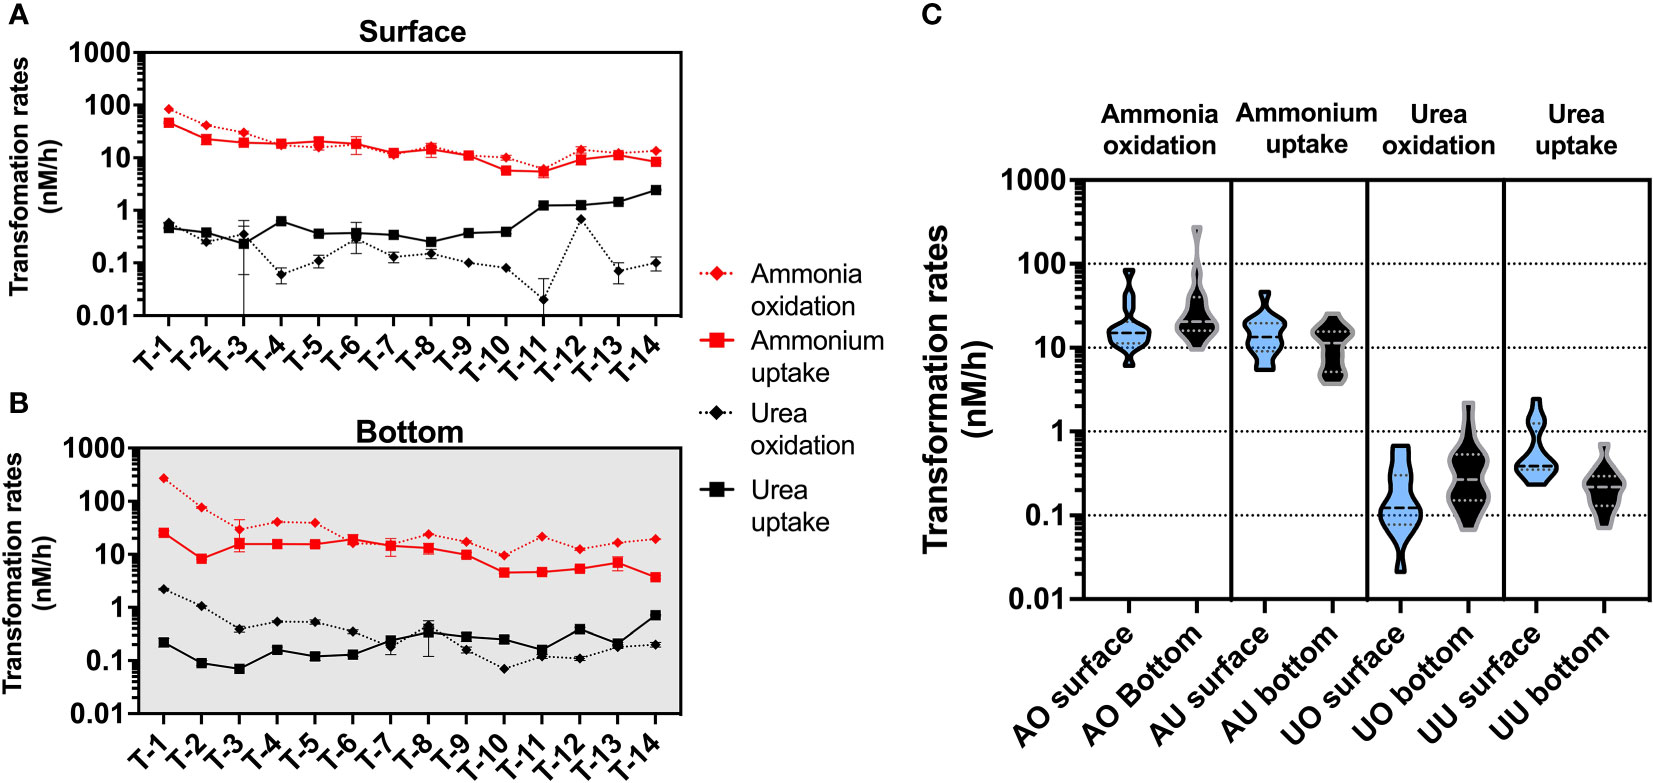
Figure 4 Magnitude distribution of different N transformation rates (nM/h) in the surface (A) and bottom (B) layers, with red and black representing ammonium and urea transformation rates, respectively. Subfigure (C) shows violin plots for different rates (AO, ammonia oxidation; AU, ammonium uptake; UO, urea oxidation; UU, urea uptake), with blue representing rates in the surface layer and black representing rates in the bottom layer.
Active ammonia oxidation in upstream stations is likely to cause nitrite accumulation in the JRE (Figure S2G) (Yan et al., 2019), which may further act as a substrate for denitrification and N uptake. The oxygen consumption that accompanies nitrification may also influence the biogeochemistry in the water column, with each molecule of ammonia oxidized being accompanied by 1.5 molecules of oxygen consumed to produce nitrite (Ward, 2008). Based on this ideal 1:1.5 stoichiometry, oxygen consumption due to nitrifiers (Figure S5) in winter averages 0.78 μM/day (0.2-3.3 μM/day) and 1.16 μM/day (0.5-9.8 μM/day) for the surface and bottom. Such consumption rates hardly affect the water column dissolved oxygen pool, especially in the case of short residence times in the estuary (days scale) (Wang et al., 2015). But in upstream (e.g., T1’s bottom layer), the oxygen consumption due to nitrifiers can achieve a high value (9.8 μM/day), which even can be compared to community respiration 1.21-10.79 μM/day in the Changjiang River Estuary (Hsiao et al., 2014). This may partially contribute to the low oxygen condition in the bottom layer of JRE upstream which was found in previous research (Li et al., 2011).
During the winter in the JRE, rates of ammonia oxidation varied considerably from 6.1-272.5 nM/h (with a mean of 21.6 nM/h and 43.7 nM/h in the surface and bottom layers, respectively), significantly lower than the previous rate magnitude (5-850 nM/h, with a mean value of 145 nM/h) in the summer of the JRE (Yan et al., 2019). Such phenomenon also occurred in Pearl River Estuary (Dai et al., 2008), which may be related to the temperature preference of ammonia oxidation, as previous temperature manipulation experiments in the JRE showed that the optimum temperature for ammonia-oxidizing organisms under eutrophic conditions can even exceed 30°C (Zheng et al., 2020), suggesting that the present study (in situ temperatures between 21.0-22.5°C) should represent a lower limit for the rate of ammonia oxidation in the JRE.
TSS and light are two environmental factors that have opposite impacts on ammonia oxidation (Ward, 2008). In our study, ammonia oxidation rates of the surface layer were significantly lower than that of the bottom layer (Figures 3A, S3A). This pattern may attribute to significantly higher TSS (Figures 2C, S2B) and potentially higher attached nitrifier biomass in the bottom layer. TSS can provide a unique microenvironment with substrates and metals, which promotes the biomass of particle-attached nitrifiers and ammonia oxidation rate (Hsiao et al., 2014; Zheng et al., 2017). This effect may also influence the horizontal distribution of ammonia oxidation, as TSS and ammonia oxidation rates have a similar distribution pattern and are both significantly higher in upstream stations (Figures 2C, 3A). In contrast to TSS, light is a factor inhibiting the function of nitrifiers (Ward, 2008; Xu et al., 2019; Xu et al., 2022). In open ocean environments, light can affect the distribution of ammonia oxidation rates by influencing the in situ nitrifying biotas (Zakem et al., 2018). The weak light situation at the base of the euphotic zone may shape the ecological niche in favor of nitrifying organisms. However, strong estuarine currents and seawater intrusion may introduce non-local biota and lead to shorter residence times of in situ communities which may greatly reduce the impact of the above-mentioned effect.
Besides the above-mentioned environmental factors, biomass may also significantly influence the spatial distribution of ammonia oxidation. In addition to being a facilitative factor in nitrification, TSS itself can be a nice indicator of nitrifiers biomass since a high proportion of nitrifiers is attached to large particles (Ma et al., 2019). We did not collect nitrifiers cell numbers. But we find that both TSS and PN in the bottom layer are significantly higher than that in the surface layer, while they are also significantly higher in the upstream than in the downstream, which is consistent with the distribution pattern of ammonia oxidation and suggests biomass difference largely shapes the spatial distribution of ammonia oxidation rates. Ammonium uptake may also be regulated by biomass. When we normalize ammonium uptake to Chl a (considered an indicator of phytoplankton biomass), the difference between upstream and downstream or surface and bottom becomes insignificant (Figure 5).
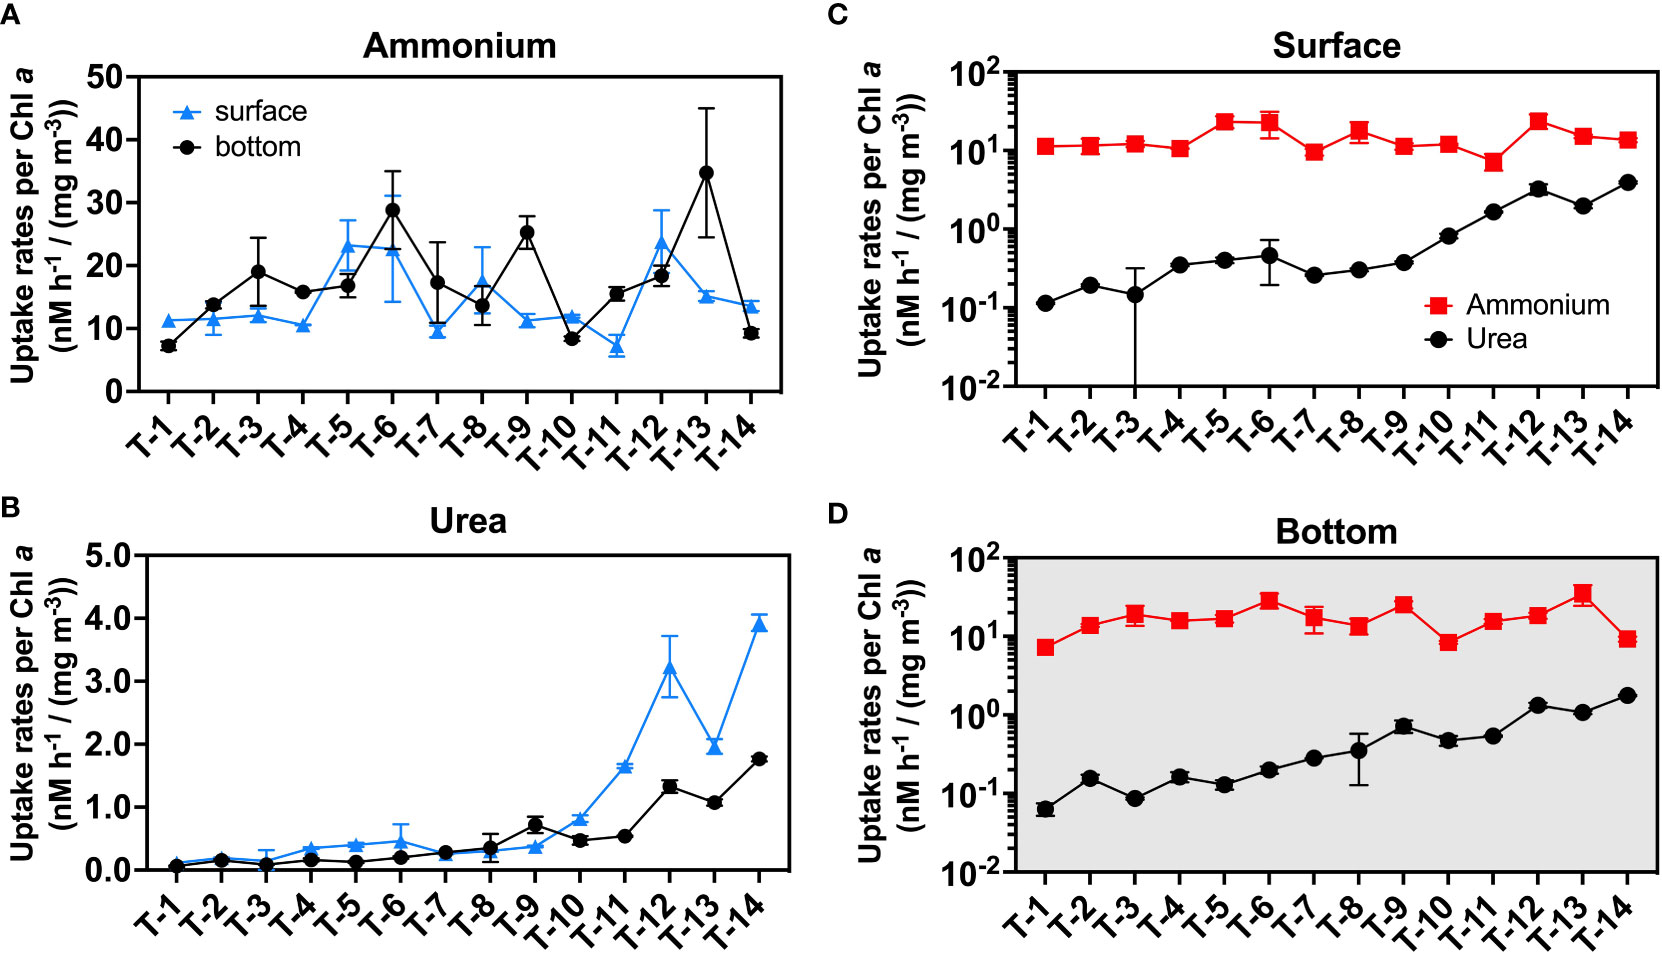
Figure 5 The uptake rate normalizes to Chl a. Subfigure (A) is plotted for the ammonium uptake rate while (B) is plotted for the urea uptake rate. Subfigures (C) and (D) are used for representing the magnitude of the rates in the surface (C) and bottom (D) layers. Blue triangles indicate surface rates, and black circles indicate bottom rates in subfigures (A, B); red squares and black circles represent normalized ammonium and urea uptake rates, respectively in subfigures (C, D). The error bars represent the standard deviation of the two biological replicates.
We also statistically analyzed the ammonia oxidation rate (and other N conversion rates) concerning environmental factors (Figure S8). But unfortunately, most of the environmental parameters are highly correlated with salinity distributions and each other, indicating the difficulties in separating single effects from multi-factors. Manipulation experiments for the mechanistic knowledge of the N cycle, need to be further implemented in future studies.
4.2. The potential inhibition-like effect of ammonium on urea utilization in eutrophic estuarine environments
Urea-N concentrations in this study were in a high range (0.25-3.73 μM, 2.25 μM on average), among the higher levels in aquatic environments worldwide (Figure 6A). This value falls within the concentration range of previous urea investigation in the winter of Xiamen sea area (0.50-3.09 μM in the surface and 0.36-3.23 μM in the bottom) (Wang et al., 2019) and comparable to those in the Pearl River estuary (0.16-8.24 μM) (Chen et al., 2015), another eutrophic estuary in southern China. Surprisingly, however, the rates of urea oxidation in JRE are of a much lower order than that of ammonia oxidation (which much higher than in the open ocean and some coastal systems, Figure 6E) and are only comparable to oligotrophic oceans where urea concentrations are only of the order of nM (e.g., western North Pacific, Figure 6D).
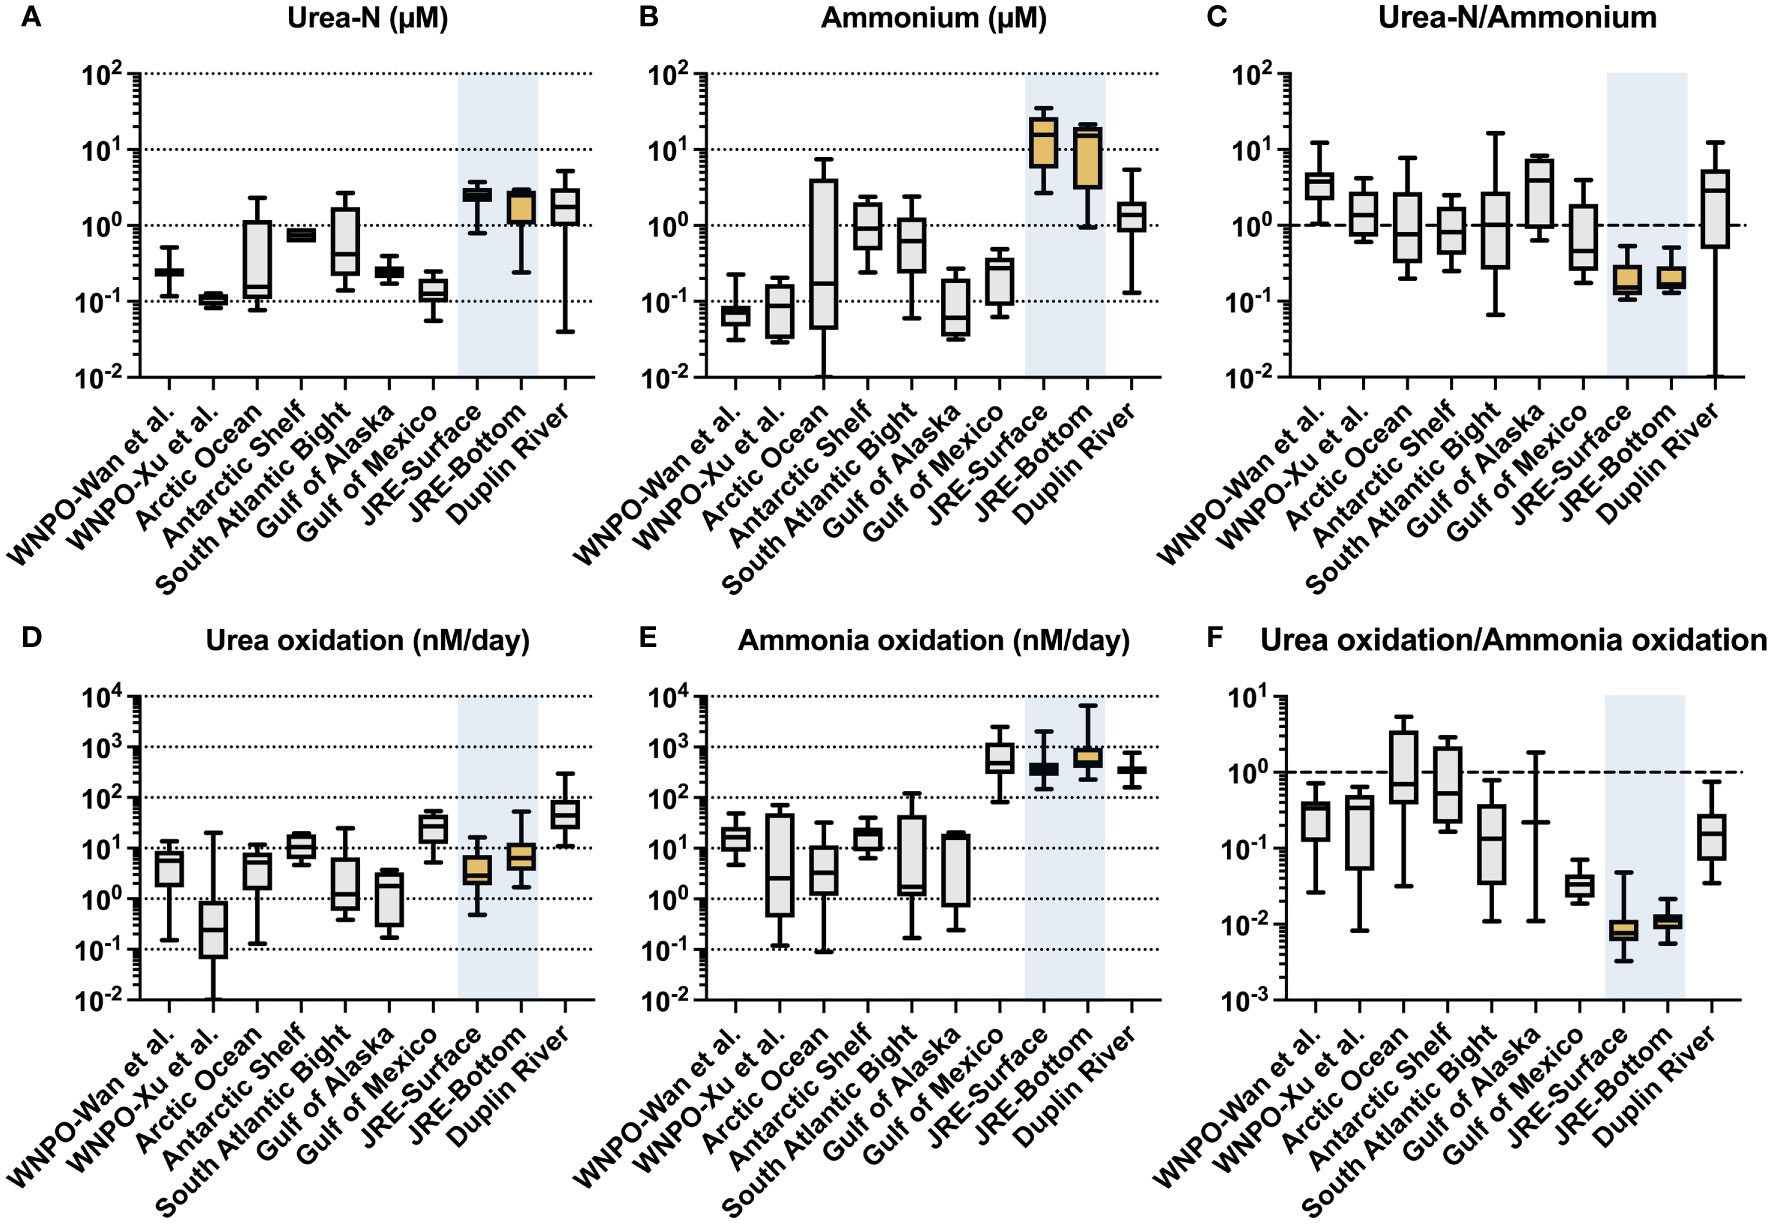
Figure 6 Urea-N concentration (μM), ammonium concentration (μM), ratio of urea-N to ammonium concentration; urea oxidation rates (nM/day), ammonia oxidation rates (nM/day), and urea oxidation to ammonia oxidation rates ratios collected from different literature: western North Pacific Ocean (WNPO) data was obtained from Wan et al. (2021) and Xu et al. (2019); Arctic Ocean data was obtained from Shiozaki et al. (2021); Antarctic Shelf, South Atlantic Bight, and Duplin River data were obtained from Tolar et al. (2017); Gulf of Mexico data was obtained from Kitzinger et al. (2019); Jiulong River Estuary (JRE) data was obtained from this study.
Both ammonia oxidation and urea oxidation can be carried out by ammonia-oxidizing microorganisms (AOM) (Alonso-Saez et al., 2012; Kitzinger et al., 2019; Shiozaki et al., 2021). In Earlier studies, ammonia-oxidizing archaea (AOA, e.g., Thaumarchaeota) are thought to be the primary performers of this process (Kirchman, 2012). But recent studies have shown that other microorganisms (including ammonia-oxidizing bacteria, AOB) may also be involved in the urea oxidation process (Shiozaki et al., 2021). Our qPCR results of amoA gene abundances suggest a switch of dominated AOM from AOB (freshwater, T1) to AOA (seaward, T14) (Figure S10). But such a switch in the nitrifiers community did not result in a significant change in the urea oxidation to ammonia oxidation rate ratio (Figure 7) from upstream to downstream. This result implies that the nitrifiers community may not be the primary factor that results in the low urea oxidation rate. But, detailed knowledge of urea oxidizers is yet still lacking, and we cannot rule out the presence of other urea oxidizers other than AOM in the JRE.
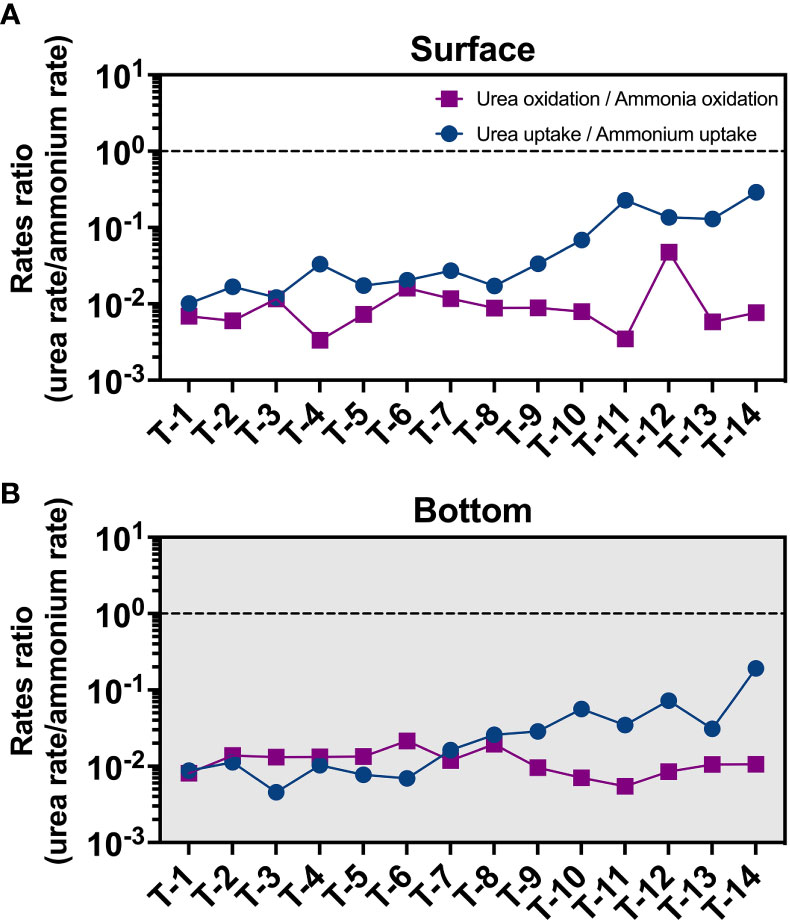
Figure 7 Distribution of urea oxidation to ammonia oxidation ratio (purple square) and urea uptake to ammonium uptake ratio (blue circle) in the surface (A) and bottom (B) layers.
We have summarized the data (including urea oxidation, ammonia oxidation, and their corresponding substrate concentrations; Figure 6) from this research and the literature covering various aquatic environments (Tolar et al., 2017; Kitzinger et al., 2019; Xu et al., 2019; Shiozaki et al., 2021; Wan et al., 2021) since the discovery of urea oxidation. A striking finding is the very low urea oxidation to ammonia oxidation ratio of the JRE (0.011 on average), which is significantly lower than open oceans such as the Northwest Pacific (0.29 on average) (Xu et al., 2019; Wan et al., 2021) and coastal regions (0.08-1.1) (Tolar et al., 2017).
Interestingly, the JRE has the highest ammonium concentration (Figure 6B) and the lowest urea-N/ammonium ratio (Figure 6C) among various aquatic environments, corresponding to the low ratio of urea oxidation/ammonia oxidation (Figure 6F). Ammonium is one of the most bioavailable forms of N and its preference by organisms may lead to a decrease in the transformation rates of other N species like nitrate, exhibiting an inhibition-like effect (Glibert et al., 2016). Urea oxidation and ammonia oxidation are both performed by nitrifiers and have similar physiological functions (provide energy). The presence of ammonium may lead to preferential use of it by microorganisms and less utilization of urea, which is requiring an additional step of hydrolysis. Yan et al. (2019) found that nitrate and nitrite uptake rates are inhibited when ammonium concentration is high, but once the ammonium is depleted, the uptakes rate greatly increases. Direct evidence about the influence of ammonium on urea oxidation has not been reported yet, but a strong inhibition of urea uptake by ammonium at a few µM was observed for a dinoflagellate species (Alexandrium catenella) (Jauzein et al., 2008). Thus, the very high concentration of ammonium in the JRE may have such effects on urea oxidation, resulting low urea oxidation to ammonia oxidation ratio, although urea is not scarce. Whereas for the open ocean, the extremely low concentration of ammonium (e.g., down to only a few nM) (Figure 6B) makes urea a potential option for nitrifying organisms and results in a higher urea oxidation ratio vs. ammonia oxidation (Figure 6F).
This may be supported by trends in urea uptake (Figures 3D, 5B, S9), which is high at stations T11-T14, where ammonium concentrations are low compared to upstream, and highest (2.5 nM/h) at the surface of station T14, where ammonium is at lowest. And a significant increase in urea uptake to ammonium uptake ratio also was observed in seaward sites (Figure 7) different from the constantly low urea oxidation to ammonia oxidation ratio. These trends may suggest that the inhibitory effect of ammonium on urea uptake is gradually released, and that urea oxidation may be more sensitive to ammonium than urea uptake and more easily be inhibited. Other factors like substrate concentration, biomass, and community structure can also influence the uptake process. But in seaward stations, urea concentrations at the sea end are much lower than upstream. The phenomenon of high values of urea uptake at the sea end did not disappear after normalization (normalize to PN as in Figure S9 and to Chl a as in Figure 5), but became more pronounced, showing that biomass is probably not the cause. Past studies have suggested that the phytoplankton of the JRE is dominated by diatoms (Xu et al., 2001; Xie et al., 2019). Fucoxanthin, a characteristic pigment of diatoms, was found to be almost dominant in the Xiamen Bay and JRE from upstream to downstream (Xu et al., 2001). Diatom has a high urea-utilizing capacity (Carpenter et al., 1972; Price and Harrison, 1988) and it is unlikely that the low urea uptake rates in upstream are caused by community reasons. Overall, it suggests that ammonium inhibition may play an important role in urea utilization in eutrophic environments.
4.3. Dark uptake, consumption, and the lifetime of ammonium and urea
Despite being in a dark condition, uptake shows considerable competitiveness relative to oxidation. In the surface layer, ammonium uptake could contribute to 44.8 ± 8.2% (Figure 8A) of total consumption rates on average, while that in the bottom layer was also able to reach an average proportion of 29.2 ± 13.2% (Figure 8B) of the ammonium consumption pathway. This proportion is even higher for urea in the surface (72.9 ± 18.9%, Figure 8C) and bottom layers (43.7 ± 26.4%, Figure 8D). These high proportions indicate that uptake is not negligible for sinks of ammonium and urea, even under dark conditions. Unlike the larger energy required for nitrate uptake, ammonium uptake is more energy-efficient, leading to a lower light-to-dark rate ratio in many aqueous environments relative to other oxidized N. In the Pearl River Estuary, the light-to-dark rate ratio for ammonium averages only about 2.45 (1.23-3.88), far below the mean value of 11.84 (1.05-28.37) for nitrate uptake (Xu et al., 2022). And in the western North Pacific, the light-to-dark ratio is less than 3 at most stations with adequate substrates for both ammonium and urea uptake (Xu et al., 2019).
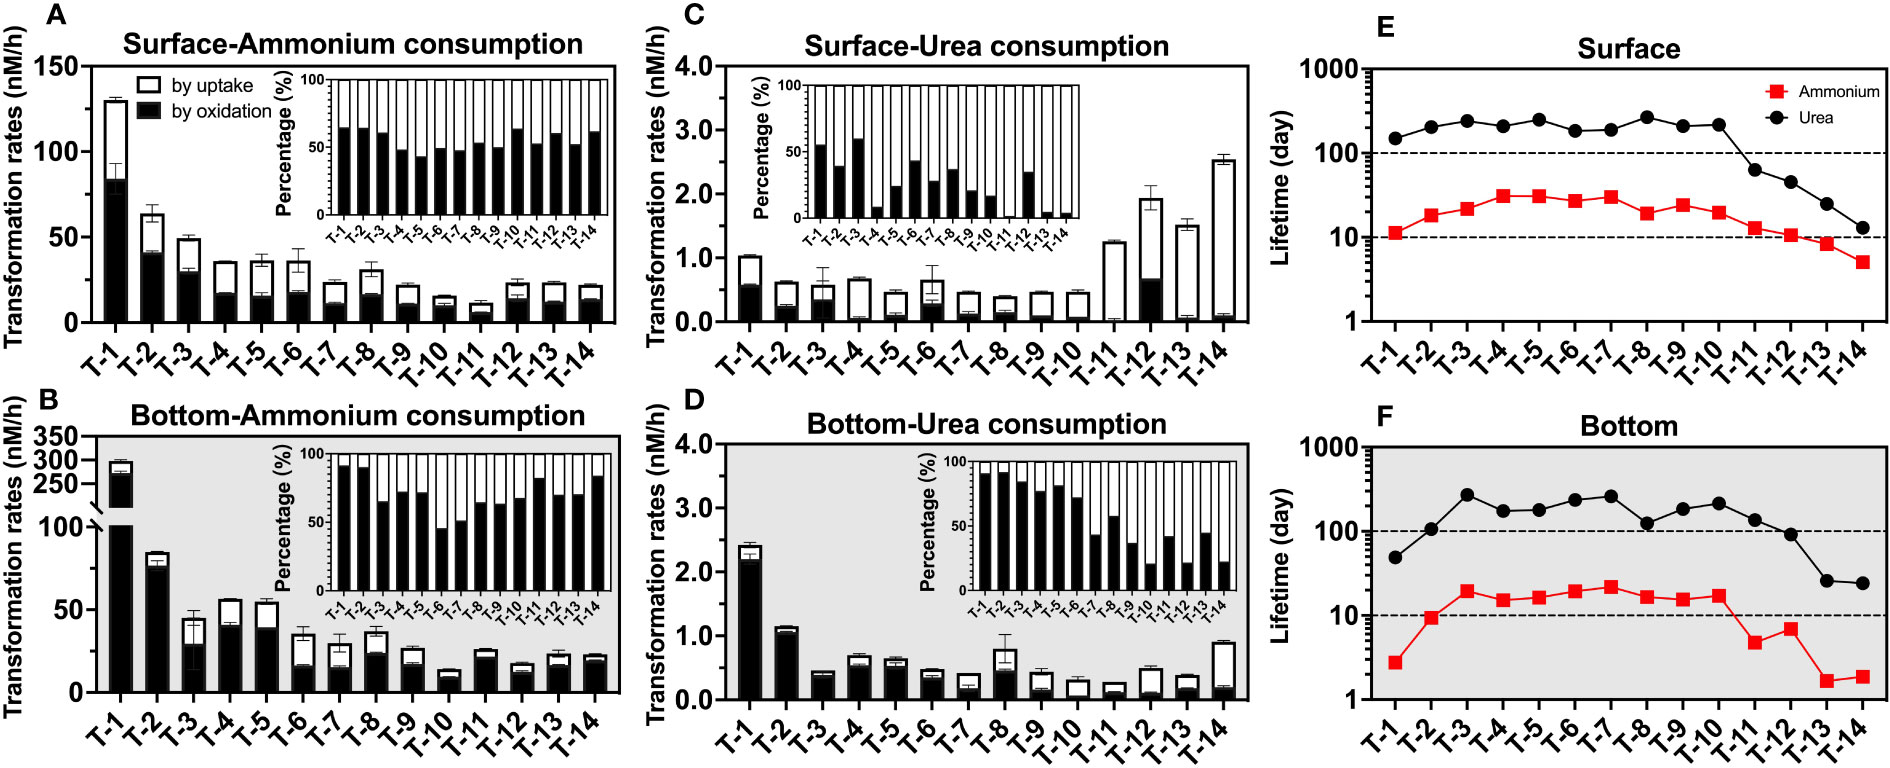
Figure 8 Consumption rates (nM/h) as well as lifetimes (day) of ammonium and urea. The graphs show the consumption rate of ammonium in the surface (A) and bottom (B) layers; the consumption rate of urea in the surface (C) and bottom (D) layers; and the lifetimes of urea and ammonium in the surface (E) and bottom (F) layers. In (A–D), white represents consumption by uptake, black represents consumption by oxidation, the error bars represent the standard deviation of the two biological replicates, and the subplots indicate the percentage of different processes; in (E, F), the red squares represent ammonium and the black circles represent urea.
Combining the uptake and oxidation pathways, we were able to obtain the total consumption rate (Figures 8A–D) to explore the lifetime (defined as the reservoir divided by the consumption rate) of both ammonium and urea (Figures 8E, F). We found the lifetime of ammonium (surface: 19.3 ± 8.7 days; bottom 12.0 ± 7.2 days) was much less than that of urea (surface: 161.7 ± 87.6 days; bottom 148.0 ± 82.3 days), possibly due to the inhibition of urea-related rates by ammonium discussed in Section 4.2. Spatially, the upstream and offshore sites show shorter ammonium and urea lifetimes than the midstream; in the upstream, this may be due to relatively higher consumption rates of both reduced-state-N. While in the nearshore sites, for the ammonium case, it was due to lower concentrations relative to a conservative mixing line, while, for urea case, it may be that significantly higher urea uptake rates reduced urea lifetime to tens of days at these sites.
Although the above estimate of lifetimes may be an upper limit for the surface layer if the rate of N consumption in the surface layer is likely to be underestimated due to the lack of light incubation data, the high turbidity of the estuary results in a very shallow photic layer (1.36 m on average, Figure 2D). Since approximately 76 ± 8% of the water bodies experienced dark situations even in the daytime and the highly active estuarine circulation may bring surface organisms to the unlit layer, this estimate can still provide insights into dynamics of ammonium and urea in the estuary. In fact, this estimate is also consistent with our observed variation of the ammonium and urea reservoir with salinity, where we assume that the surface layer at the lowest salinity station T1 is the river end-member, and assume that nitrogenous nutrients have a concentration close to 0 at salinity 33, we can find that especially nearshore, ammonium shows a significant non-conservatism (deficit), which corresponds to the lifetime of ammonium at offshore stations down to below 2 days (e.g., T13 bottom, 1.66 days), taking into account the estimate of 2.05 ± 0.95 days of flushing time in the winter derived from previous studies (Wang et al., 2015). In contrast, the trend of even near-addition of urea corresponds to its lifetime of hundreds of days, which may result from the ammonium’s inhibition-like effect discussed above.
5. Conclusion
Overall, our observations provide new insights into estuarine ammonium and urea dynamics. Generally, ammonium-related processes (mainly ammonia oxidation) dominated the estuarine reduced-N cycle and found that dark uptake may also play an important role, showing a pattern that ammonia oxidation (32.6 ± 50.5 nM/h) > ammonium uptake (13.8 ± 8.7 nM/h) >> urea uptake (0.5 ± 0.5 nM/h) ≈ urea oxidation (0.3 ± 0.4 nM/h). Through the statistical analysis, we found that the salt-fresh water mixing of estuaries may dominate the distribution of all environmental factors as well as organisms and that the covariation of multiple factors influences the distribution of these rates, all of which make it difficult to separate the effects of single factors. From this perspective, more manipulation experiments still need to be performed to untangle the role of the specific environmental factors. By summarizing the available urea oxidation rates data, we found that high ammonium concentrations may have a significant inhibition-like effect on the urea process in the JRE, and our data imply that urea oxidation may be more sensitive to this effect than urea uptake. This effect suggests that high ammonium concentrations may further decrease the intensity of biogeochemical reactions of urea in the estuary, extend the lifetime of urea, and increase the urea delivering to offshore, which may have a significant impact on the coastal ecology.
Data availability statement
The original contributions presented in the study are included in the article/Supplementary Material. Further inquiries can be directed to the corresponding authors.
Author contributions
J-MT: Conceptualization, methodology, data curation, formal analysis, validation, software, visualization, writing - original draft, writing - review & editing. MNX: Conceptualization, formal analysis, validation, investigation, methodology, funding acquisition, resources, supervision, writing - original draft, writing - review & editing. YL: Data curation, formal analysis, visualization, writing - review & editing. HC: Methodology, writing - review & editing. HJ: Methodology, data curation, writing - review & editing. L-LH: Methodology, visualization, formal analysis, writing - review & editing. WZ: Investigation, methodology, project administration. S-JK: Conceptualization, funding acquisition, resources, supervision writing - review & editing. All authors contributed to the article and approved the submitted version.
Funding
This research was supported by the National Natural Science Foundation of China (91851209, 42106048, 41721005) and the Ph.D. Fellowship of the State Key Laboratory of Marine Environmental Science at Xiamen University.
Acknowledgments
We sincerely thank all crew members of RV Ocean II for their assistance. We thank valuable help from Yafei Xiao in the sampling and analysis of TSS, Chl a, and nutrients. We thank Li Tian for her help in project administration. We appreciate Xiaoqian Zhan for her help in collecting hydrological information. We are grateful to the Center for Major Equipment and Technology (COMET), State Key Laboratory of Marine Environmental Science, Xiamen University, for providing a platform for sharing instruments. We also thank Yuanzhi Li, Ruixiang Zhai, Jiaxin Sun, Yuxin Shen, and Zixiang Yang for their valuable advice about writing and thank the editor and five reviewers for their dedication to the peer review process to make this study better.
Conflict of interest
The authors declare that the research was conducted in the absence of any commercial or financial relationships that could be construed as a potential conflict of interest.
Publisher’s note
All claims expressed in this article are solely those of the authors and do not necessarily represent those of their affiliated organizations, or those of the publisher, the editors and the reviewers. Any product that may be evaluated in this article, or claim that may be made by its manufacturer, is not guaranteed or endorsed by the publisher.
Supplementary material
The Supplementary Material for this article can be found online at: https://www.frontiersin.org/articles/10.3389/fmars.2022.1040554/full#supplementary-material
References
Alonso-Saez L., Waller A. S., Mende D. R., Bakker K., Farnelid H., Yager P. L., et al. (2012). Role for urea in nitrification by polar marine archaea. Proc. Natl. Acad. Sci. U.S.A. 109 (44), 17989–17994. doi: 10.1073/pnas.1201914109
Becker S., Aoyama M., Woodward E. M. S., Bakker K., Coverly S., Mahaffey C., et al. (2020). GO-SHIP repeat hydrography nutrient manual: The precise and accurate determination of dissolved inorganic nutrients in seawater, using continuous flow analysis methods. Front. Mar. Sci. 7, 581790. doi: 10.3389/fmars.2020.581790
Braman R. S., Hendrix S. A. (1989). Nanogram nitrite and nitrate determination in environmental and biological materials by vanadium(III) reduction with chemiluminescence detection. Anal. Chem. 61 (24), 2715–2718. doi: 10.1021/ac00199a007
Carpenter E. J., Remsen C. C., Watson S. W. (1972). Utilization of urea by some marine phytoplankters. Limnol. Oceanogr. 17 (2), 265–269. doi: 10.4319/lo.1972.17.2.0265
Chen L., Ma J., Huang Y., Dai M., Li X. (2015). Optimization of a colorimetric method to determine trace urea in seawater. Limnol. Oceanogr.: Methods 13 (6), 303–311. doi: 10.1002/lom3.10026
Chen L., Zhang X., He B., Liu J., Lu Y., Liu H., et al. (2020). Dark ammonium transformations in the pearl river estuary during summer. J. Geophys. Res.: Biogeosci. 125 (12), e2019JG005596. doi: 10.1029/2019jg005596
Dai M., Wang L., Guo X., Zhai W., Li Q., He B., et al. (2008). Nitrification and inorganic nitrogen distribution in a large perturbed river/estuarine system: the pearl river estuary, China. Biogeosciences 5 (5), 1227–1244. doi: 10.5194/bg-5-1227-2008
Dugdale R. C., Wilkerson F. P. (1986). The use of 15N to measure nitrogen uptake in eutrophic oceans; experimental considerations. Limnol. Oceanogr. 31 (4), 673–689. doi: 10.4319/lo.1986.31.4.0673
Francis C. A., Roberts K. J., Beman J. M., Santoro A. E., Oakley B. B. (2005). Ubiquity and diversity of ammonia-oxidizing archaea in water columns and sediments of the ocean. Proc. Natl. Acad. Sci. 102 (41), 14683–14688. doi: 10.1073/pnas.0506625102
Galloway J. N. (2014). “10.12 - the global nitrogen cycle,” in Treatise on geochemistry, 2nd ed., vol. 475-498 . Eds. Holland H. D., Turekian K. K. (Oxford: Elsevier).
Glibert P. M., Harrison J., Heil C., Seitzinger S. (2006). Escalating worldwide use of urea – a global change contributing to coastal eutrophication. Biogeochemistry 77 (3), 441–463. doi: 10.1007/s10533-005-3070-5
Glibert P. M., Middelburg J. J., McClelland J. W., Zanden J. V. M. (2019). Stable isotope tracers: Enriching our perspectives and questions on sources, fates, rates, and pathways of major elements in aquatic systems. Limnol. Oceanogr. 64 (3), 950–981. doi: 10.1002/lno.11087
Glibert P. M., Wilkerson F. P., Dugdale R. C., Raven J. A., Dupont C. L., Leavitt P. R., et al. (2016). Pluses and minuses of ammonium and nitrate uptake and assimilation by phytoplankton and implications for productivity and community composition, with emphasis on nitrogen-enriched conditions. Limnol. Oceanogr. 61 (1), 165–197. doi: 10.1002/lno.10203
Hsiao S. S. Y., Hsu T. C., Liu J.w., Xie X., Zhang Y., Lin J., et al. (2014). Nitrification and its oxygen consumption along the turbid Chang jiang river plume. Biogeosciences 11 (7), 2083–2098. doi: 10.5194/bg-11-2083-2014
Jauzein C., Loureiro S., Garcés E., Collos Y. (2008). Interactions between ammonium and urea uptake by five strains of Alexandrium catenella (Dinophyceae) in culture. Aquat. Microb. Ecol. 53 (3), 271–280. doi: 10.3354/ame01249
Kirchman D. L. (2012). Marine archaea take a short cut in the nitrogen cycle. Proc. Natl. Acad. Sci. U.S.A. 109 (44), 17732–17733. doi: 10.1073/pnas.1215654109
Kitzinger K., Padilla C. C., Marchant H. K., Hach P. F., Herbold C. W., Kidane A. T., et al. (2019). Cyanate and urea are substrates for nitrification by thaumarchaeota in the marine environment. Nat. Microbiol. 4 (2), 234–243. doi: 10.1038/s41564-018-0316-2
Knapp A. N., Sigman D. M., Lipschultz F. (2005). N isotopic composition of dissolved organic nitrogen and nitrate at the Bermuda Atlantic time-series study site. Global Biogeochem. Cycles 19 (1), GB1018. doi: 10.1029/2004GB002320
Li G., Gao K., Yuan D., Zheng Y., Yang G. (2011). Relationship of photosynthetic carbon fixation with environmental changes in the jiulong river estuary of the south China Sea, with special reference to the effects of solar UV radiation. Mar. pollut. Bull. 62 (8), 1852–1858. doi: 10.1016/j.marpolbul.2011.02.050
Lin J., Krom M. D., Wang F., Cheng P., Yu Q., Chen N. (2022). Simultaneous observations revealed the non-steady state effects of a tropical storm on the export of particles and inorganic nitrogen through a river-estuary continuum. J. Hydrol. 606, 127438. doi: 10.1016/j.jhydrol.2022.127438
Ma L., Lin H., Xie X., Dai M., Zhang Y. (2019). Major role of ammonia-oxidizing bacteria in N2O production in the pearl river estuary. Biogeosciences 16 (24), 4765–4781. doi: 10.5194/bg-16-4765-2019
Ma L., Xiao W., Laws E. A., Bai X., Chiang K.-P., Liu X., et al. (2021). Responses of phytoplankton communities to the effect of internal wave-powered upwelling. Limnol. Oceanogr. 66 (4), 1083–1098. doi: 10.1002/lno.11666
Moschonas G., Gowen R. J., Paterson R. F., Mitchell E., Stewart B. M., McNeill S., et al. (2017). Nitrogen dynamics and phytoplankton community structure: the role of organic nutrients. Biogeochemistry 134 (1), 125–145. doi: 10.1007/s10533-017-0351-8
Mulholland M. R., Lomas M. W. (2008). “Chapter 7 - nitrogen uptake and assimilation,” in Nitrogen in the marine environment 2nd ed. Eds. Capone D. G., Bronk D. A., Mulholland M. R., Carpenter. E. J. (San Diego: Academic Press) 303–384
Pai S.-C., Tsau Y.-J., Yang T.-I. (2001). pH and buffering capacity problems involved in the determination of ammonia in saline water using the indophenol blue spectrophotometric method. Anal. Chimica Acta 434 (2), 209–216. doi: 10.1016/S0003-2670(01)00851-0
Peng X., Fawcett S. E., van Oostende N., Wolf M. J., Marconi D., Sigman D. M., et al. (2018). Nitrogen uptake and nitrification in the subarctic north Atlantic ocean. Limnol. Oceanogr. 63 (4), 1462–1487. doi: 10.1002/lno.10784
Price N. M., Harrison P. J. (1988). Uptake of urea C and urea N by the coastal marine diatom Thalassiosira pseudonana. Limnol. Oceanogr. 33 (4), 528–537. doi: 10.4319/lo.1988.33.4.0528
Raimbault P., Garcia N. (2008). Evidence for efficient regenerated production and dinitrogen fixation in nitrogen-deficient waters of the south pacific ocean: impact on new and export production estimates. Biogeosciences 5 (2), 323–338. doi: 10.5194/bg-5-323-2008
R-Core-Team (2022) R: A language and environment for statistical computing (Vienna, Austria: R Foundation for Statistical Computing). Available at: http://www.R-project.org/ (Accessed Septempter 17, 2022).
Rotthauwe J. H., Witzel K. P., Liesack W. (1997). The ammonia monooxygenase structural gene amoA as a functional marker: molecular fine-scale analysis of natural ammonia-oxidizing populations. Appl. Environ. Microbiol. 63 (12), 4704–4712. doi: 10.1128/aem.63.12.4704-4712.1997
Shiozaki T., Hashihama F., Endo H., Ijichi M., Takeda N., Makabe A., et al. (2021). Assimilation and oxidation of urea-derived nitrogen in the summer Arctic ocean. Limnol. Oceanogr. 66 (12), 4159–4170. doi: 10.1002/lno.11950
Sigman D. M., Casciotti K. L., Andreani M., Barford C., Galanter M., Böhlke J. K. (2001). A bacterial method for the nitrogen isotopic analysis of nitrate in seawater and freshwater. Anal. Chem. 73 (17), 4145–4153. doi: 10.1021/ac010088e
Tan E., Zou W., Zheng Z., Yan X., Du M., Hsu T.-C., et al. (2020). Warming stimulates sediment denitrification at the expense of anaerobic ammonium oxidation. Nat. Climate Change 10 (4), 349–355. doi: 10.1038/s41558-020-0723-2
ter Braak C. J. F., Smilauer P. (2012). Canoco reference manual and user’s guide: software for ordination, version 5.0 (Ithaca USA: Microcomputer Power).
Tolar B. B., Wallsgrove N. J., Popp B. N., Hollibaugh J. T. (2017). Oxidation of urea-derived nitrogen by thaumarchaeota-dominated marine nitrifying communities. Environ. Microbiol. 19 (12), 4838–4850. doi: 10.1111/1462-2920.13457
Tseng Y. F., Lin J., Dai M., Kao S. J. (2014). Joint effect of freshwater plume and coastal upwelling on phytoplankton growth off the changjiang river. Biogeosciences 11 (2), 409–423. doi: 10.5194/bg-11-409-2014
Voss M., Wannicke N., Deutsch B., Bronk D., Sipler R., Purvaja R., et al. (2011) “5.07 - internal cycling of nitrogen and nitrogen transformations,” in Treatise on estuarine and coastal science Eds. Wolanski E., McLusky D. (Waltham: Academic Press), 231–259.
Wang K., Chen B.-h., Luo Y., Chen W.-f., Wang W.-l., Lin H. (2019). Spatial and temporal distribution of urea and its impacting factors in xiamen sea area (in Chinese). J. Appl. Oceanogr. 38 (2), 214–224.
Wang G., Wang Z., Zhai W., Moore W. S., Li Q., Yan X., et al. (2015). Net subterranean estuarine export fluxes of dissolved inorganic C, N, p, Si, and total alkalinity into the jiulong river estuary, China. Geochimica Cosmochimica Acta 149, 103–114. doi: 10.1016/j.gca.2014.11.001
Wang X., Wu X., Chen M., Cheng H., Chen N., Yang W., et al. (2021). Isotopic constraint on the sources and biogeochemical cycling of nitrate in the jiulong river estuary. J. Geophys. Res.: Biogeosci. 126 (3), e2020JG005850. doi: 10.1029/2020jg005850
Wan X. S., Sheng H. X., Dai M., Church M. J., Zou W., Li X., et al. (2021). Phytoplankton-nitrifier interactions control the geographic distribution of nitrite in the upper ocean. Global Biogeochem. Cycles 35 (11), e2021GB007072. doi: 10.1029/2021gb007072
Ward B. B. (2008). “Chapter 5 - nitrification in marine systems,” in Nitrogen in the marine environment, 2nd ed. Eds. Capone D. G., Bronk D. A., Mulholland M. R., Carpenter E. J. (San Diego: Academic Press), 199–261
Wei T., Simko S. (2021) R package ‘corrplot’: Visualization of a correlation matrix (Version 0.92). Available at: https://github.com/taiyun/corrplot (Accessed September 17, 2022).
Wu G., Cao W., Huang Z., Kao C.-M., Chang C.-T., Chiang P.-C., et al. (2017). Decadal changes in nutrient fluxes and environmental effects in the jiulong river estuary. Mar. pollut. Bull. 124 (2), 871–877. doi: 10.1016/j.marpolbul.2017.01.071
Xiao W., Wang L., Laws E., Xie Y., Chen J., Liu X., et al. (2018). Realized niches explain spatial gradients in seasonal abundance of phytoplankton groups in the south China Sea. Prog. Oceanogr. 162, 223–239. doi: 10.1016/j.pocean.2018.03.008
Xie Y., Wang L., Liu X., Li X., Wang Y., Huang B. (2019). Contrasting responses of intertidal microphytobenthos and phytoplankton biomass and taxonomic composition to the nutrient loads in the jiulong river estuary. Phycol. Res. 67 (2), 152–163. doi: 10.1111/pre.12363
Xu L., Hong H.-s., Wang H.-l., Chen W.-q. (2001). The biogeochemistry of photosynthetic pigments in the jiulong river estuary and Western xiamen bay. Chin. J. Oceanol. Limnol. 19 (2), 164–171. doi: 10.1007/bf02863042
Xu M. N., Li X., Shi D., Zhang Y., Dai M., Huang T., et al. (2019). Coupled effect of substrate and light on assimilation and oxidation of regenerated nitrogen in the euphotic ocean. Limnol. Oceanogr. 64 (3), 1270–1283. doi: 10.1002/lno.11114
Xu M. N., Wu Y., Zhang X., Tang J.-M., Tan E., Zheng Z. Z., et al. (2022). Diel change in inorganic nitrogenous nutrient dynamics and associated oxygen stoichiometry along the pearl river estuary. Water Res. 222, 118954. doi: 10.1016/j.watres.2022.118954
Xu M. N., Wu Y., Zheng L. W., Zheng Z., Zhao H., Laws E. A., et al. (2017). Quantification of multiple simultaneously occurring nitrogen flows in the euphotic ocean. Biogeosciences 14 (4), 1021–1038. doi: 10.5194/bg-14-1021-2017
Yang J.-Y. T., Tang J.-M., Kang S., Dai M., Kao S.-J., Yan X., et al. (2022). Comparison of nitrate isotopes between the south China Sea and Western north pacific ocean: Insights into biogeochemical signals and water exchange. J. Geophys. Res.: Oceans 127 (5), e2021JC018304. doi: 10.1029/2021JC018304
Yan X., Wan X. S., Liu L., Xu M. N., Tan E., Zheng Z., et al. (2019). Biogeochemical dynamics in a eutrophic tidal estuary revealed by isotopic compositions of multiple nitrogen species. J. Geophys. Res.: Biogeosci. 124 (7), 1849–1864. doi: 10.1029/2018jg004959
Yan X., Zhai W., Hong H., Li Y., Guo W., Huang X. (2012). Distribution, fluxes and decadal changes of nutrients in the jiulong river estuary, southwest Taiwan strait. Chin. Sci. Bull. 57 (18), 2307–2318. doi: 10.1007/s11434-012-5084-4
Zakem E. J., Al-Haj A., Church M. J., van Dijken G. L., Dutkiewicz S., Foster S. Q., et al. (2018). Ecological control of nitrite in the upper ocean. Nat. Commun. 9 (1), 1206. doi: 10.1038/s41467-018-03553-w
Zheng Z.-Z., Wan X., Xu M. N., Hsiao S. S.-Y., Zhang Y., Zheng L.-W., et al. (2017). Effects of temperature and particles on nitrification in a eutrophic coastal bay in southern China. J. Geophys. Res.: Biogeosci. 122 (9), 2325–2337. doi: 10.1002/2017JG003871
Keywords: urea oxidation, urea uptake, ammonia oxidation, ammonium uptake, Jiulong River Estuary, estuarine nitrogen cycle
Citation: Tang J-M, Xu MN, Lin Y, Chen H, Jin H, Han L-L, Zou W and Kao S-J (2022) The biological transformation of ammonium and urea in a eutrophic estuarine system in Southern China. Front. Mar. Sci. 9:1040554. doi: 10.3389/fmars.2022.1040554
Received: 09 September 2022; Accepted: 21 November 2022;
Published: 12 December 2022.
Edited by:
Xianbiao Lin, Ocean University of China, ChinaReviewed by:
Dengzhou Gao, East China Normal University, ChinaXiaoli Zhang, Yantai Institute of Coastal Zone Research (CAS), China
Haiyan Jin, Second Institute of Oceanography, Ministry of Natural Resources, China
Yanhong Lu, Hong Kong University of Science and Technology, Hong Kong SAR, China
Lin Hui, Ministry of Natural Resources, China
Copyright © 2022 Tang, Xu, Lin, Chen, Jin, Han, Zou and Kao. This is an open-access article distributed under the terms of the Creative Commons Attribution License (CC BY). The use, distribution or reproduction in other forums is permitted, provided the original author(s) and the copyright owner(s) are credited and that the original publication in this journal is cited, in accordance with accepted academic practice. No use, distribution or reproduction is permitted which does not comply with these terms.
*Correspondence: Min Nina Xu, bWlueHVAaGFpbmFudS5lZHUuY24=; Shuh-Ji Kao, c2prYW9AeG11LmVkdS5jbg==
†These authors have contributed equally to this work and share senior authorship