Abstract
Introduction:
The Zhejiang coastal area is the most important fishery ground in East China Sea, located south of the Yangtze River Estuary. The previous studies on hypoxia and mechanisms mainly focused on the outer shelf and Yangtze River Estuary, and limited knowledge on the DO depletion and low DO information in this area.
Methods:
In this study, the relationships among the DO spatial variation and depletion with nutrients, Chl-a, algal blooms, stratification were analyzed based on the investigation from July to August in 2020.
Results and discussion:
The results showed that, the DO contents were high in the surface water (4.6–11.8 mg/L) than in the bottom water (3.0-8.4 mg/L) with an increasing trend from nearshore to offshore in the surface layer, but opposite in the bottom. The vertical profile of DO showed that low DO concentrations (≤3.0 mg/L) started from the water depth of 12 m with a depth of 45 m. The low DO area appeared in the northeast and central Zhejiang coastal areas covering an area of 6,000 km2 and 4,000 km2, respectively. Our analysis indicated that the successive algal blooms (Chl-a > 40.0 μg/L) occurred in late June and during the investigation prepared the low DO pool for the hypoxia development. Stratification, generated from upper warm, light, diluted freshwater from the Yangtze River and the deeper cold, heavy, salty Taiwan Warm Current ceased the vertical convection of DO in the surface, and accelerated the hypoxia development. The hypoxia starting time was earlier and the duration was longer in this complicated area. The rising temperature, more frequency of algal blooms by global warming would likely to make this worse. Continued interdisciplinary research are badly needed to get a better view in the future.
1 Introduction
As the key ingredient that makes life in the ocean work, dissolved oxygen (DO) is of great significance. The diversity and productivity of ocean life, the complex biochemical cycles that keep ocean life in balance and the health of the marine ecosystem all depend on oxygen. The declining of DO can affect the loss of bottom fauna which are important food sources, the organisms that can’t move, the habitat of fish and the benthic community structure (Diaz and Rosenberg, 2008). When environments become too anoxic, the nitrogen cycle in the marine ecosystem will change as well as the microbial community (Seitz et al., 2009; Deutsch et al., 2011). The DO declining and low oxygen has been reported since the middle of the 20th century in many coastal area world widely (Diaz and Rosenberg, 2008; Stramma et al., 2008; Keeling et al., 2010; Breitburg et al., 2018). When the dissolved oxygen in the waters is less than 2.0 mg/L, it was defined as hypoxia area. Studies have shown that hypoxia frequently occurs in important estuaries and coastal waters where the nutrients were rich, such as the Gulf of Mexico (Trucco-Pignata et al., 2019; Pauer et al., 2020), the Mediterranean Sea (Coppola et al., 2018; Kralj et al., 2019), the Baltic Sea (Meier et al., 2019; Brzana et al., 2020; Rak et al., 2020), Chesapeake Bay (Seitz et al., 2009), the Yangtze River Estuary (Wang et al., 2012; Liu et al., 2020) and so on. The occurrence of hypoxia is usually connected with eutrophication and hydrological factors (Rabalais et al., 2009; Katin et al., 2019). The evidences have approved that eutrophication may drive and promote the hypoxia development (Li et al., 2002).
The DO depletion and hypoxia in offshore Changjiang Estuary has been concerned after the first report in 1959, more and more researches on the occurrences and mechanisms of hypoxia formation have been carried out in recent decades (Li et al., 2002; Chen et al., 2007; Wei et al., 2007; Wang et al., 2016; Zhu et al., 2017; Chen et al., 2021). Eutrophication, stratification, water masses invasion in the bottom from Taiwan warm current and strong tidal currents all have been considered the causes for low DO and hypoxia development in different seasons, especially in summer. A three-dimensional circulation model also has been applied to find out the physical forcing (flow, wind speed, and wind direction) on hypoxia in the Yangtze River Estuary (Chen et al., 2015). It was found that the center of the hypoxia area mainly around 123°E, 31°N, and extended to north in summer, although some research found that two hypoxia centers appeared in some year. Most of the studies on DO in the East China Sea have mainly focused on the offshore of Yangtze River Estuary and the adjacent area (Wang et al., 2012; Hsiao et al., 2014; Chen et al., 2015; Wei et al., 2015; Chi et al., 2017; Zhu et al., 2017; Chen et al., 2021) according to the investigation data before 2010. Less attentions were paid on the southward part of East China Sea. The Zhejiang coastal area, the most important fishery ground in China, is located south of the Yangtze River Estuary which has been under the pressures from human activities (e.g., overfishing) and excess nutrients loading from large rivers (Yangtze River, Qiantang River, etc.). This area has been suffered from more frequencies and larger areas of algal bloom outbreaks since 2012 (http://sthjt.zj.gov.cn/). The ecological effects and impacts on the stability of marine ecosystems caused by algal bloom have been reported (Wang et al., 2016; Zhu et al., 2017; Li et al., 2021; Yin et al., 2021). However, will the algal bloom impact the DO depletion and the development of hypoxia in the bottom? Will these phytoplankton blooms influence the hypoxia starting time, and the area extension and duration of hypoxia in Zhejiang coastal area? There are still some knowledge gaps about these questions in Zhejiang coastal area.
This study analyzed the surface and bottom DO contents in early summer based on the large area investigation after and during the successive algal blooms in 2020, with an attempt to find out the developing trend of low DO and hypoxia risks in this important area. Related environmental parameters of temperature, salinity, Chl-a, and nutrients were also analyzed to determine the relationships between. The results contribute to a new point of view to this important coastal area in the East China Sea, which will help on a better understanding of the future low DO and hypoxia start time, expansion areas and other ecological effects and risks.
2 Materials and methods
2.1 Study area
The Zhejiang coastal area (27°16′N~30°91′N, 120°54′E~123°38′E) is located south of the Yangtze River Estuary, impacted directly by the large amount of freshwater carrying all kinds of nutrients loading from human activities (Figure 1). There are different scales of fjords (Hangzhou Bay, Yueqing Bay, Sanmen Bay, and Xiangshan Bay) and islands (Zhoushan Archipelago) distributed in this area (Chen et al., 2021; Chen et al., 2022) with a water depth ranging from 5m to 75m. Such a complicated topography with large rivers running through resulted in a complex hydrodynamic system. The most important water masses and currents in this area are Changjiang Diluted Water (CDW), Kuroshio Branch Current (KBC), Taiwan Warm Current (TWC), and Zhejiang-Fujian Coastal Current (ZMCC). The arrows in different scales with abbreviation represent different water masses in summer (Figures 1B, C) Due to the complicated topography, four regions were divided to get a better understanding of the spatial variation in this area, which were northern, central, southern, and Hangzhou Bay (Figure 1A).
Figure 1

Sampling sites (blue dots) (A) and currents (B, C) in the Zhejiang coastal area. The current images (B, C) were changed and redrawn based on Zuo et al., 2019. The name of the bays and islands were all abbreviated, where HZB is Hangzhou Bay, XSH is Xiangshan Harbor, SMB is Sanmen Bay, TZB is Taizhou Bay, YQB is Yueqing Bay, ZSI is Zhoushan Archipelago, SSI is Shengsi Islands, QSI is Qushan Island, YSI is Yushan Islands, DJI is Dongji Islands, and TZI is Taizhou Islands.
2.2 Sampling and analysis
Water samples from 165 stations were collected in the study area from 2nd July to 20th August 2020. The temperature, salinity, DO and depth were acquired simultaneously by a Sea-Bird SBE19 plus (Sea-Bird Electronics Inc., USA). Lab analysis of DO through water samples by the Winkler Titration method were carried out in order to calibrate the DO data taken by the probe. Special attentions were paid on six stations in the northern (N1, N2), central (M1, M2), and southern (S1, S2) respectively to found out the stratification development and vertical profile (Figure 1A). Water samples for inorganic nitrogen (DIN), inorganic phosphorus (DIP), and Chl-a for lab analysis were collected by a 5 L acid-cleaned (1 N HCl) Niskin Bottle from 2 to 6 depths based on the water depth. Subsamples for nutrients and chlorophyll-a (Chl-a) were filtered immediately through a GF/F filter membrane (0.70 μm) and stored at −20°C for later laboratory analysis. Acetone was added to the subsamples for Chl-a analysis before storage. The DIN ( ) and DIP () were analyzed by SEAL QuAAtro39-SFA, and Chl-a was determined by Trilogy (Turner Design Ltd., USA). Chemical oxygen demand (COD) was measured by the alkaline potassium permanganate method.
2.3 Data processing and analysis
The spatial distributions of DO, temperature, salinity, nutrients, and other environmental parameters were mapped by OriginPro2018 and Ocean Data View (ODV 5.4.0). The relationships between DO and other environmental parameters were analyzed by SPSS 20.0. The low DO (< 3.0 mg/L) area was calculated by ArcGIS10.7.
Dissolved oxygen saturation at different temperatures and salinities was calculated according to the Weiss equation (Weiss, 1970), and apparent oxygen utilization (AOU) was calculated by the equation below:
where is the equilibrium saturated concentration in water at certain temperatures and salinities and DO is the measured concentration.
3 Results
3.1 Spatial variation of DO
Due to the complicated topography and water masses in this area, the DO content varied greatly in the four regions which ranged from 4.6 to 11.8 mg/L in the surface layer and from 3.0 to 8.4 mg/L in the bottom layer (Figures 2A, B, Table 1). In Hangzhou Bay, the water was shallow and well mixed, the DO contents were homogeneous, ranging from 6.6 to 7.5 mg/L. The water was deep but also well mixed in southern Zhejiang sea area with a mean DO value of 6.0 mg/L (Figure 2A, Table 1). It was much more complex in northern and central Zhejiang sea area. A few patched high-DO areas in the surface have been found in the offshore areas of northern and central Zhejiang sea area, with the highest surface DO concentration above 11.8 mg/L in Qushan Island and 11.2 mg/L in Taizhou Bay respectively. The surface DO saturations presented the similar pattern as the DO content, which were over 140% at all of the high DO areas (Figures 2A, C). The DO concentration was over 9.0 mg/L in all of the regions with the DO saturation above 100%, and it was below 4.0 mg/L when the saturation was less than 50%.
Figure 2
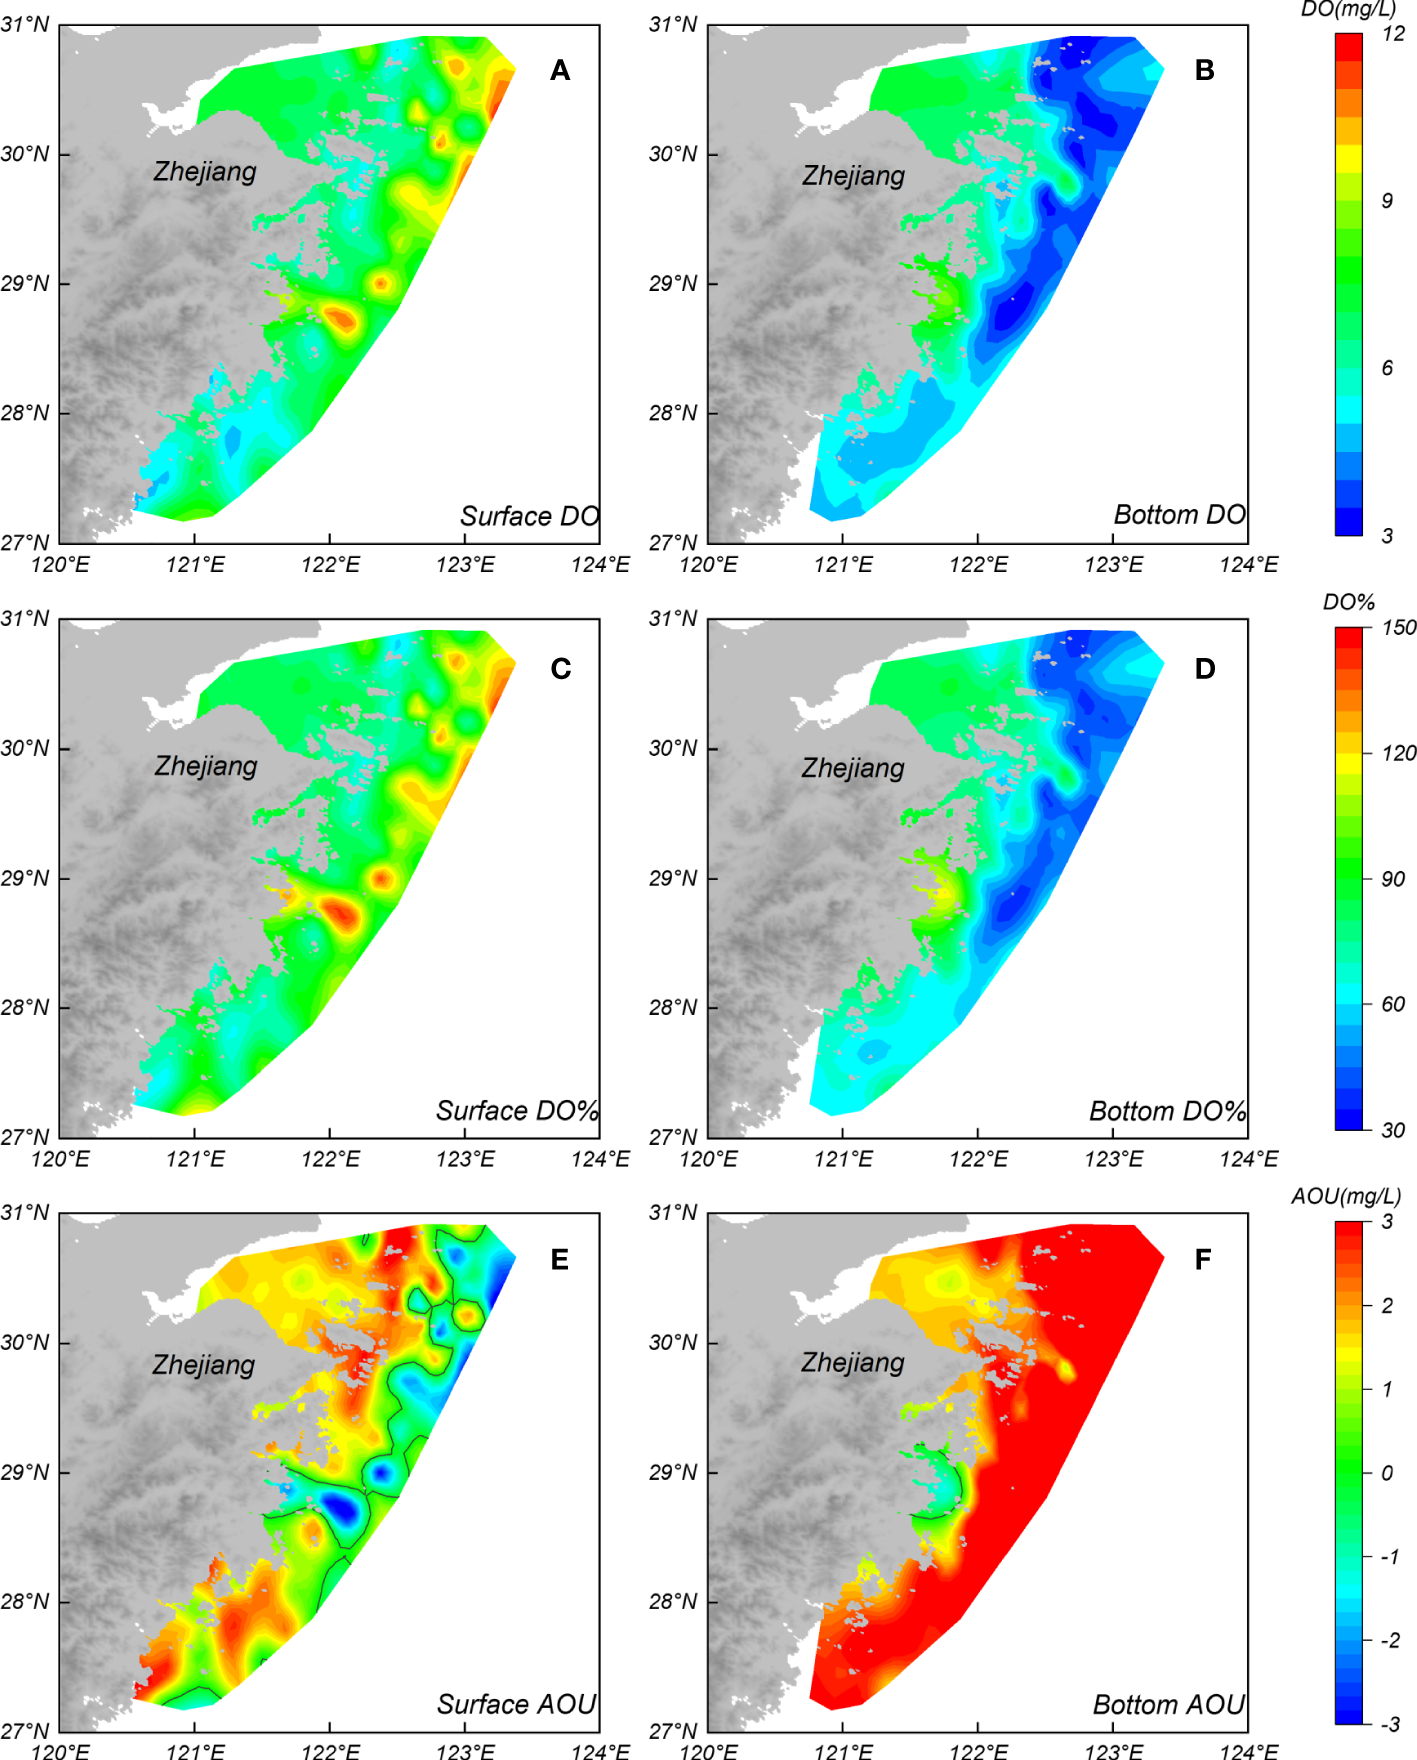
Horizontal distribution of DO concentration: surface (A) and bottom (B), DO saturation: surface (C) and bottom (D), AOU: surface (E) and bottom (F).
Table 1
| Region | DO concentration(mg/L) | DO saturation (%) | |||
|---|---|---|---|---|---|
| Range | Mean | Range | Mean | ||
| Northern | Surface | 5.1~11.8 | 7.6 | 59.3~144.3 | 90.3 |
| Bottom | 3.0~7.5 | 5.0 | 35.3~88.1 | 58.9 | |
| Central | Surface | 5.1~11.2 | 7.4 | 64.6~146.1 | 94.5 |
| Bottom | 3.1~8.4 | 5.1 | 36.5~112.7 | 62.7 | |
| Southern | Surface | 4.6~8.5 | 6.0 | 60.0~115.4 | 81.2 |
| Bottom | 4.5~6.2 | 5.1 | 57.4~79.5 | 64.1 | |
| Hangzhou Bay | Surface | 6.6~7.5 | 7.1 | 78.6~86.4 | 81.8 |
| Bottom | 6.8~7.4 | 7.1 | 79~82.3 | 81.0 | |
Surface and bottom DO concentration and saturation in Zhejiang coastal area.
The visible low DO areas appeared in the northern (29.83-30.92°N, 121.78-123.38°E) and central (28.33-29.78°N, 121.53-122.78°E) bottom layer which were consist with the high surface DO, especially in northeast Zhejiang sea areas. In these areas, the bottom DO contents were less than 4.0 mg/L with the DO saturations under 40% (Figures 2B, D). In Qushan Island (QSI), southward off the Yangtze River Estuary, hypoxia occurred with a bottom DO concentration of 3.0 mg/L but a high surface DO of 11.8 mg/L. The low-DO region in northern covered an area of 6,000.0 km2, and it was about 4,000.0 km2 in the central region. The vertical profile of DO has presented the clear trend of hypoxia development with the depth (Figure 6).
AOU was considered an indicator of DO depletion, where AOU>0 means the DO was deficient and AOU<0 means it was oxygen-rich. The DO depletion was strong in the bottom of the most study area except Taizhou Bay (Figures 2E, F). In the surface layer, the distributions of AOU were similar with the DO content (Figures 2A, E). The AOU was high in the inner bay areas, indicating the oxygen depletion. The over-saturation in the offshore of surface means it was oxygen rich.
3.2 Spatial pattern of temperature and salinity
There was obvious spatial difference for the temperature in different regions and different water layers. The temperature was high in the surface layer (23.6 - 30.5°C) than in the bottom (18.4 - 29.6°C) (Figures 3A, B), especially in the offshore areas. The low-temperature (T< 20.0°C) waters in the bottom distributed in the offshore central and southern regions with a declining trend from the coast to offshore. In the surface layer, the temperature was high in the south than in the north which made the big difference between the two layers, especially in the south, the temperature difference was about 10°C in the offshore south Zhejiang sea area. In the well mixed inner bay areas (such as Sanmen Bay, Taizhou Bay, and Yueqing Bay), which extended deeply into the land, the temperatures were high (T>30.0°C) both in the surface and the bottom.
Figure 3
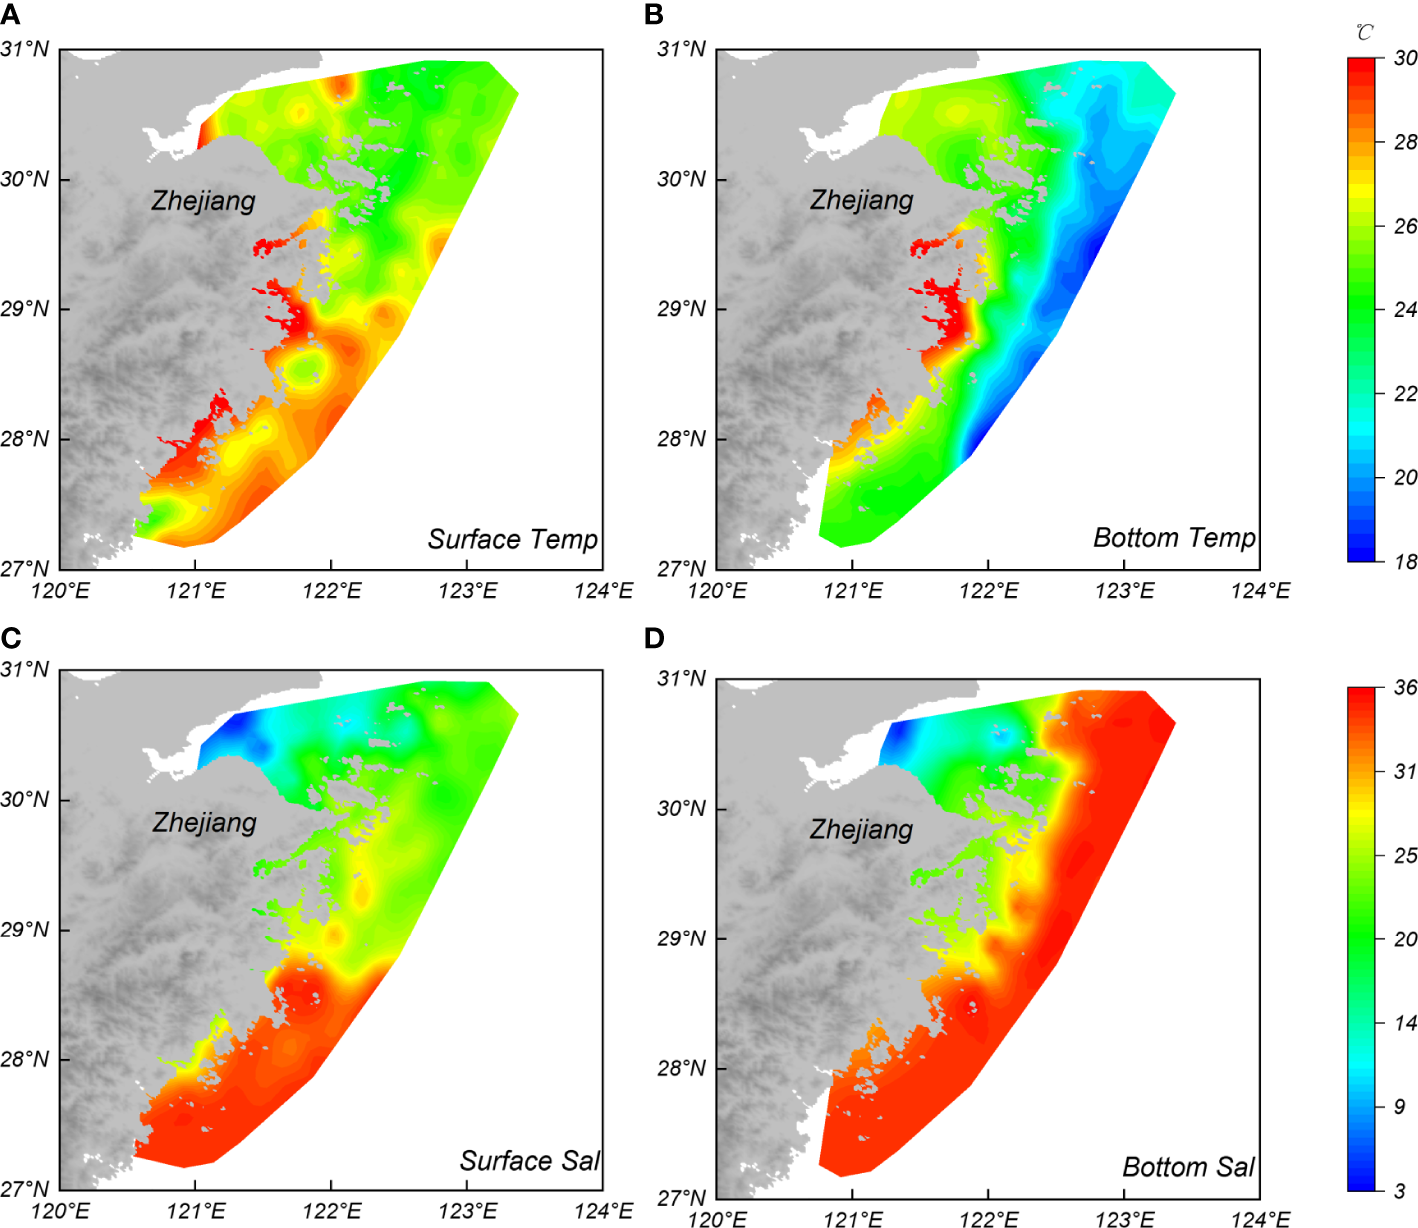
Horizontal distribution of temperature [surface (A) and bottom (B)] and salinity [surface (C) and bottom (D)] in the Zhejiang coastal area.
The spatial distribution of salinity was similar as that of temperature, but with more clearly and significant change. The low salinity mainly appeared in the surface and bottom of Hangzhou Bay (Salmin= 3.3), where the water was shallow and well mixed (Figures 3C, D) and it was around 22.0 to 27.0 in the north. In contrast, the high salinity (>30.0) distributed in most part of southern Zhejiang sea area. In the bottom water, the salinity was over 30.0 and even reached to 35.0 in the south, except Hangzhou Bay and part of the northern sea area around Zhoushan Archipelago (Table 2, Figure 3D). The opposite pattern created the dramatic salinity difference of 9.0 between the bottom and surface in the offshore of north and central Zhejiang sea area.
Table 2
| Region | Temperature (°C) | Salinity | |||
|---|---|---|---|---|---|
| Range | Mean | Range | Mean | ||
| Northern | Surface | 23.6~28.9 | 25.1 | 9.8~27.7 | 20.3 |
| Bottom | 19.7~26.9 | 22.0 | 7.1~35.2 | 28.3 | |
| Central | Surface | 24.3~30.5 | 27.0 | 22.4~34.3 | 26.7 |
| Bottom | 18.4~29.6 | 22.8 | 22.6~35.1 | 30.9 | |
| Southern | Surface | 24.2~29.7 | 27.9 | 25.9~34.4 | 32.8 |
| Bottom | 18.6~27 | 23.9 | 32.5~34.5 | 34.2 | |
| Hangzhou Bay | Surface | 25.2~29.3 | 26.2 | 3.3~20.2 | 10.9 |
| Bottom | 25.2~26.6 | 26.0 | 3.3~20.2 | 11.1 | |
Temperature and salinity variation in the Surface and bottom of Zhejiang coastal area.
3.3 Spatial distribution of nutrients
The DIN, DIP, and COD concentrations in the surface and bottom of the Zhejiang coastal area were presented (Figure 4). High nutrients levels were mainly found in the surface and bottom waters of Hangzhou Bay with the maximum value of 1.7 mg/L for DIN and 0.06 mg/L for DIP. The N:P was about 43.0, which was high than Redfield ratio (N:P=16). The nutrients contents were much higher than the national seawater quality criteria level IV (0.5 mg/L for DIN and 0.045 mg/L for DIP) (Ministry of Ecology and Environment of the People’s Republic of China, 1997). In Zhoushan Archipelago area, the nutrients concentrations were low, but still in a high level of 0.5 mg/L to 1.3 mg/L for DIN, and 0.02 to 0.035 mg/L for DIP. It was much lower (DIN< 0.2 mg/L, DIP<0.015 mg/L) in most of southern Zhejiang sea area. There were very low patched DIP concentration areas in the surface, especially in the offshore of northeast (Figure 4C). This area was found to couple with the high surface DO value distribution (Figure 2A) indicating the negative relations (r= -0.62, p< 0.001) between DO generation process with the nutrient consuming (Figure 5). There was also a high bottom DIP distribution in the offshore areas of central and northern Zhejiang sea area with the concentration ranging from 0.02 to 0.045 mg/L.
Figure 4
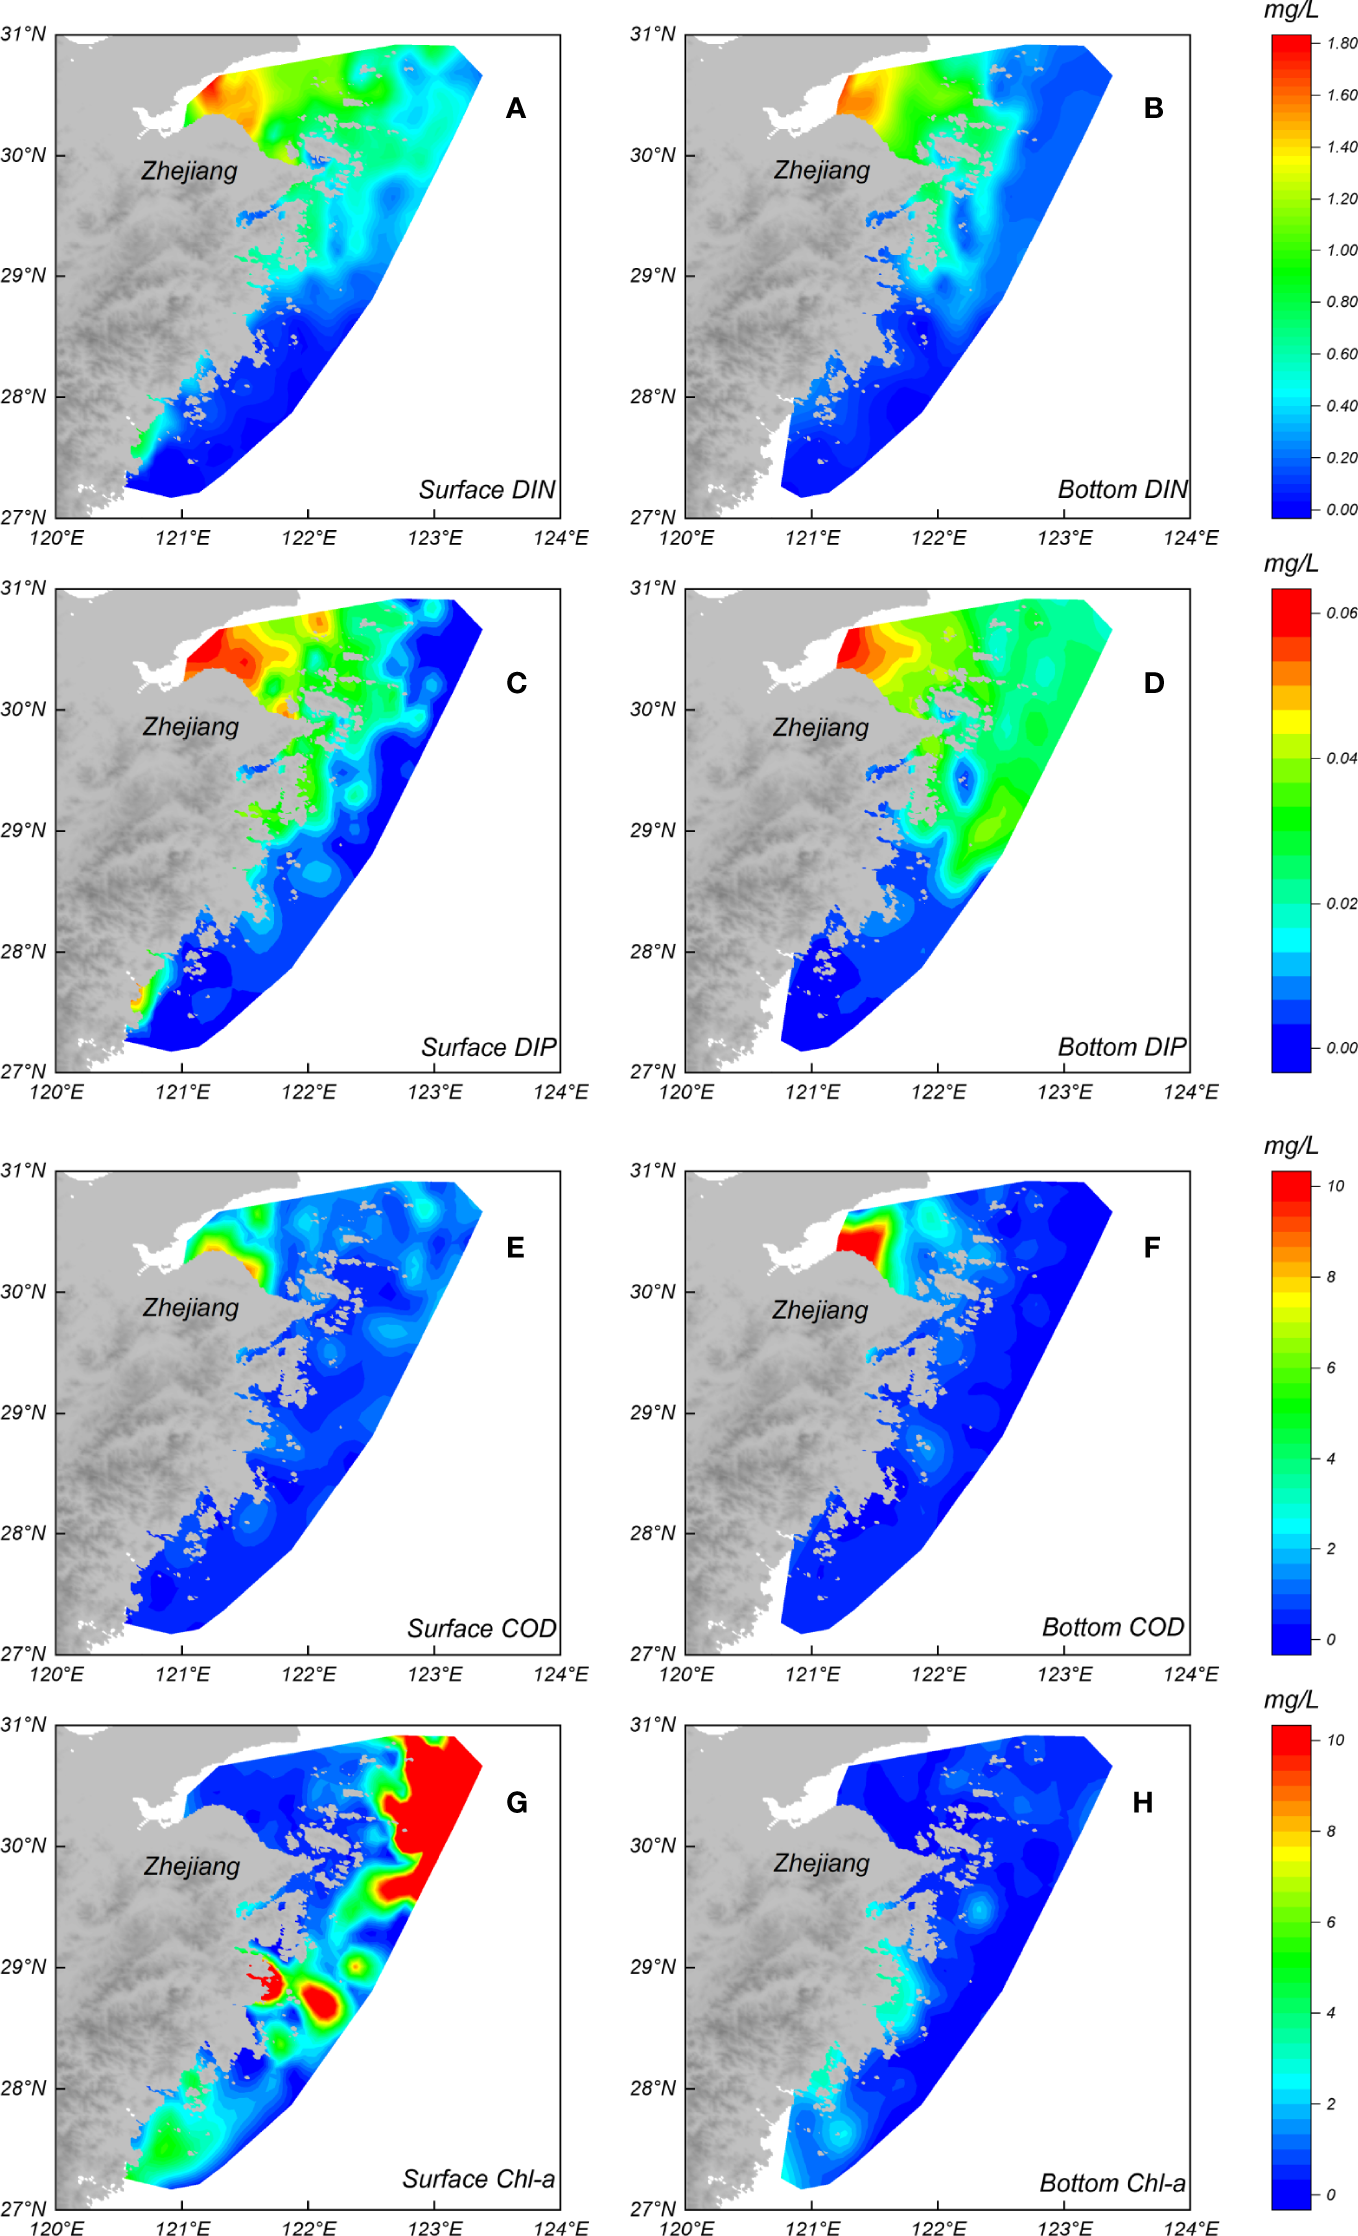
The horizontal distribution of (A) surface DIN, (B) bottom DIN, (C) surface DIP, (D) bottom DIP, (E) surface COD, (F) bottom COD, (G) surface Chl-a and (H) bottom Chl-a in the Zhejiang Coastal Area.
Figure 5
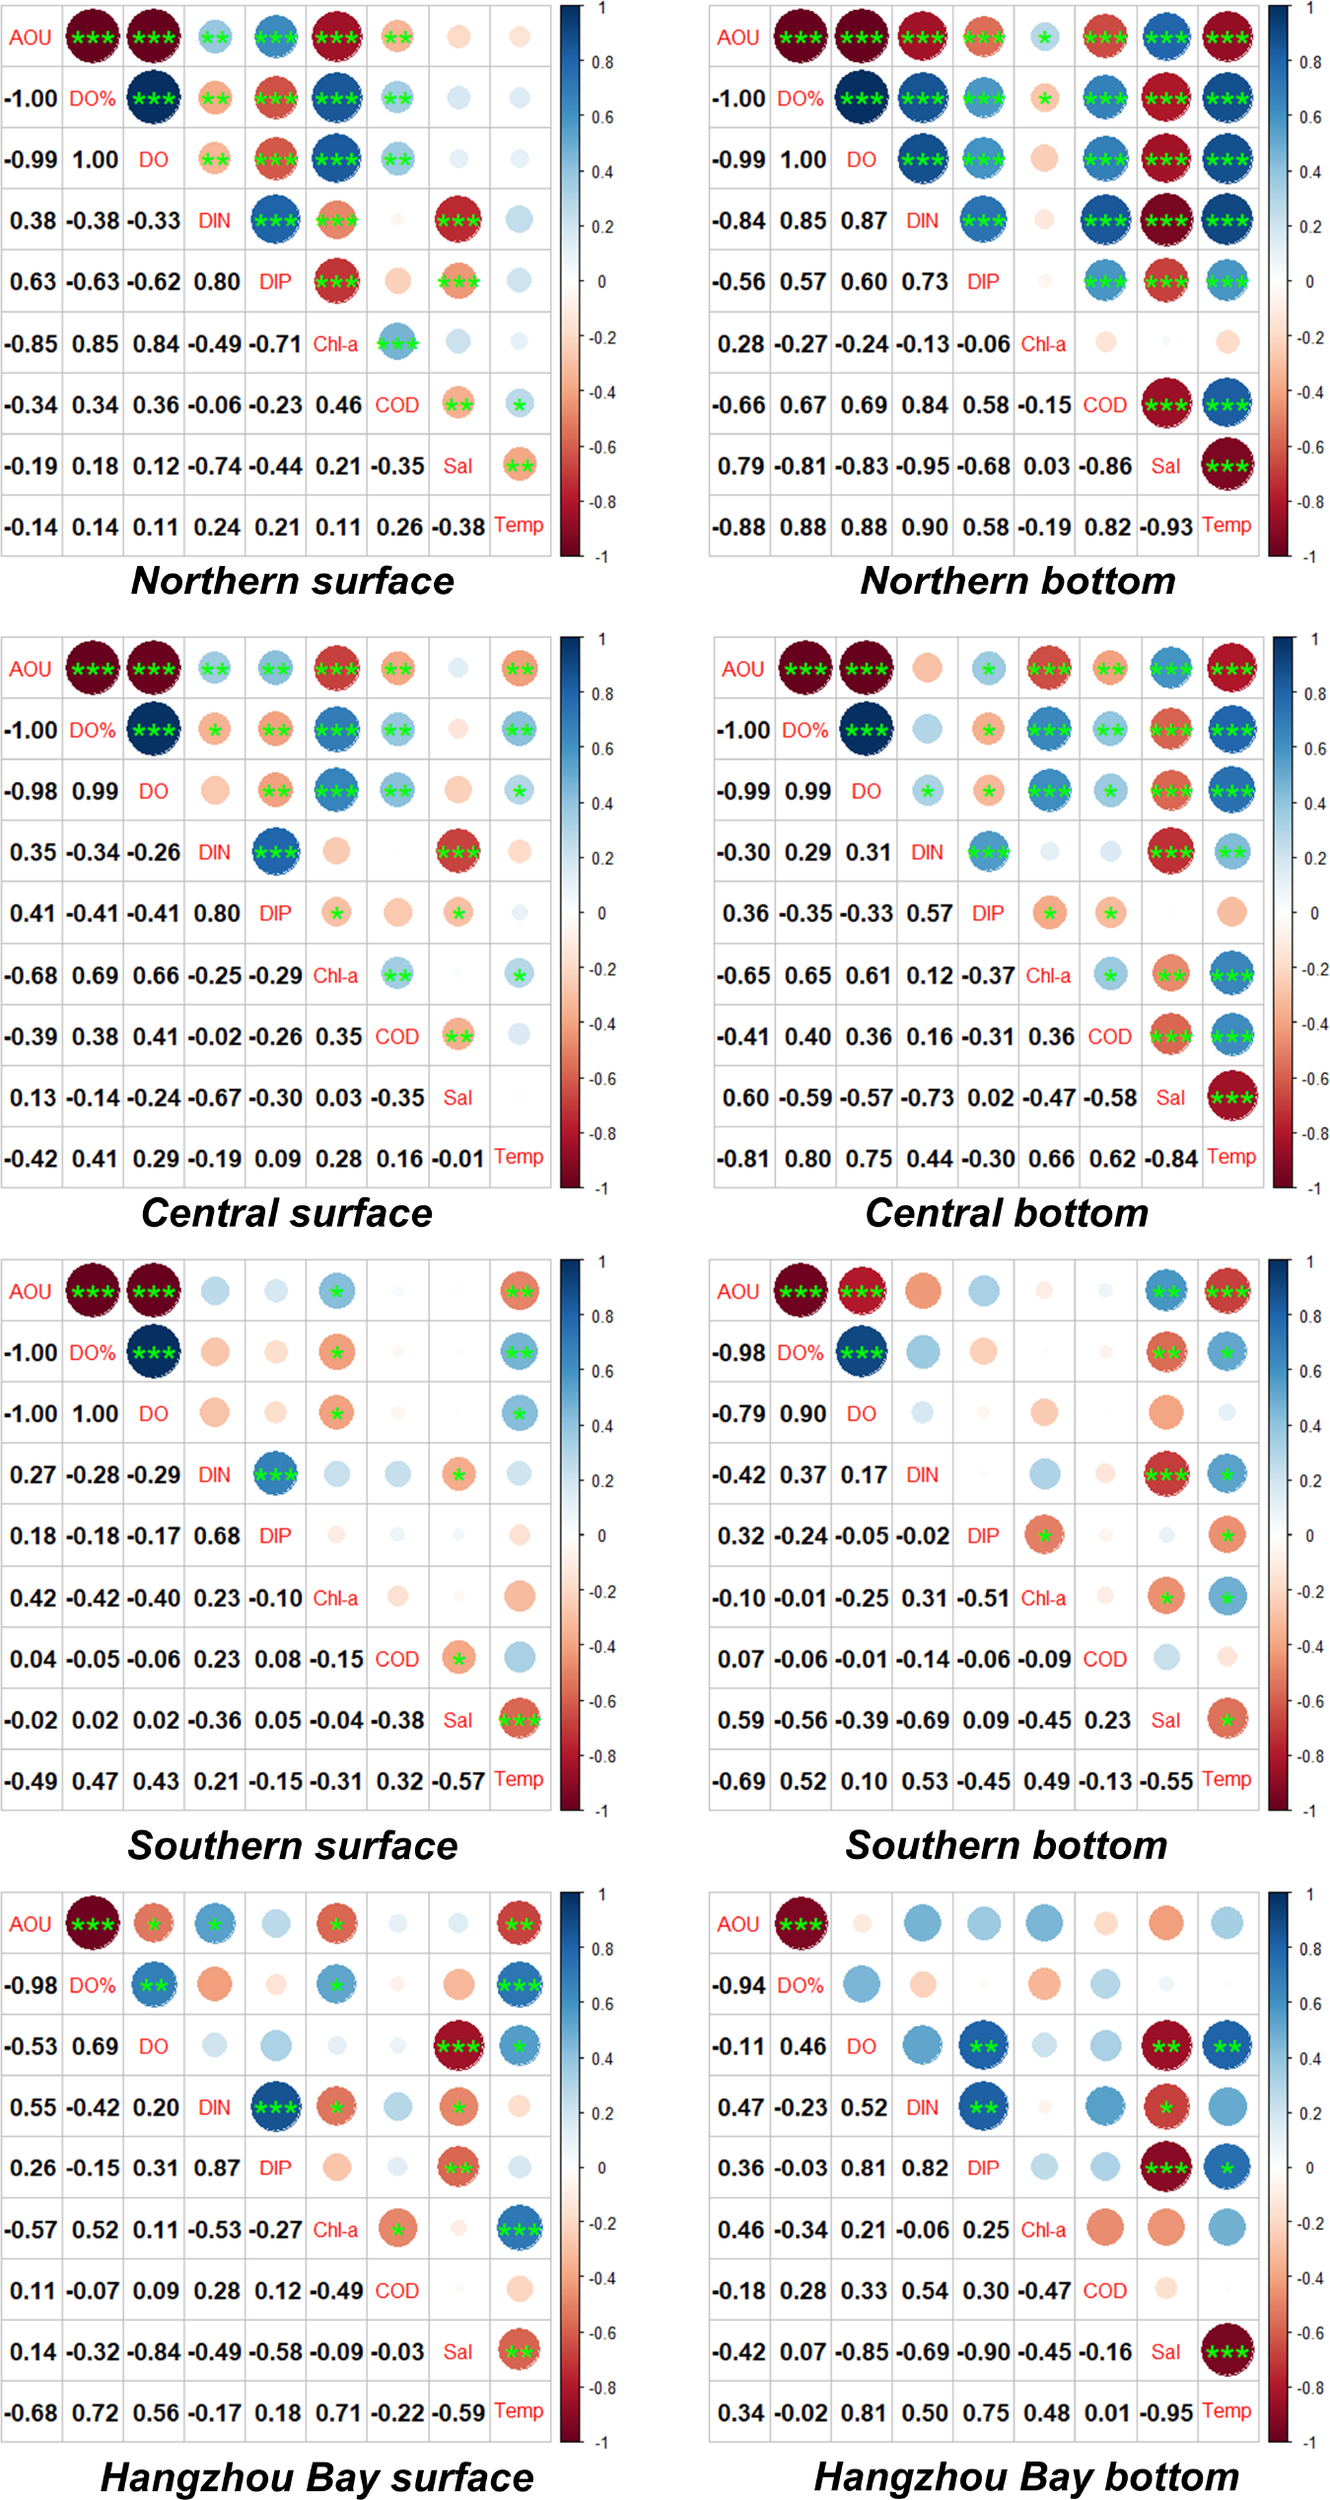
Comparative analysis of AOU and biochemical parameters in the Zhejiang Coastal Area. The red circle indicates negative correlation, the blue circle indicates positive correlation, and ***means P<0.001, **means p<0.01, *means p<0.05.
The close relationships between AOU and the biochemical parameters were analyzed to determine how they work in different areas (Figure 5). The consumption of DO in the transformation process can be reflected by AOU (Williams et al., 2015) where a high AOU indicated more DO depletion. There was a strong correlation between AOU and DIN in Hangzhou Bay (r=0.87, p<0.001), indicating that the biogeochemical cycle of DIN was the possible reason for DO depletion. Large quantities of DIN and DIP from the rivers contributed to eutrophication in Hangzhou Bay. The strong vertical exchange and shallow water resulting in no difference between the bottom and surface. Eutrophication usually promotes microbial growth and respiration, which results in a greater oxygen demand. However, in the central and other areas, the relationship between AOU and DIN (or DIP) was weak, and the low DIN and DIP concentrations in the southern area were due to the invasion of oligotrophic water masses from the Taiwan Warm. Current and Kuroshio tributaries (Figures 1B, C). A significant positive correlation between AOU and DIP (r = 0.96, p< 0.001) and DIN (r = 0.812, P< 0.001) has been reported in the bottom water of the East China Sea in summer (Zhu et al., 2017). However, the negative correlation between AOU and nutrients in the bottom water suggests that the biogeochemical process of nutrients in the bottom water may not be the main reason of DO depletion.
The spatial distribution pattern of COD was consistent with that of DIN and DIP, with the concentration meeting seawater quality standard level I (COD< 2.0 mg/L) in most of the study areas (Figure 4E), except for two patched areas in Shenjia Bay and Nanfei Bay in northern Zhejiang sea area. An extremely high COD concentration occurred south of Hangzhou Bay, with maximum values of 7.0 mg/L and 10.0 mg/L at the surface and bottom, respectively, which were much higher than the national seawater quality criteria level IV (5.0 mg/L). A possible reason for this may be the wastewater discharged from Hangzhou Bay Industrial District.
3.4 Spatial distribution of Chl-a
In most of the study area, the Chl-a concentration varied from 0.1 to 4.0 μg/L in the surface and bottom (Figures 4G, F). However, there was a very large area at the northeast, where the surface Chl-a concentration was over 10.0 μg/L, and with a maximum value of 40.0 μg/L (Figure 4G). There were another two high surface Chl-a areas (>10.0 μg/L) in Taizhou Bay and near Taizhou Islands, central Zhejiang sea area (Figure 4G), where the surrounding Chl-a concentration was below 3.0 μg/L. These high Chl-a areas all happened to correspond well with the high surface DO but low nutrients areas (Figures 2A, C, 4A, C).
3.5 Vertical profile of DO, temperature and salinity
Haloclines (ΔT/ΔZ > 0.2°C/m, ΔS/ΔZ > 0.1 PSU/m) were found in northern and central Zhejiang sea area from the vertical profiles of salinity, temperature and DO (Figure 6). The halocline occurred at different depth (ranging from 10.0m to 15.0m) at different sites, however, they shared a very similar halocline profile structure from the surface to where the halocline occurred (Figures 1, 6). The temperature decreased from 27.0°C to 19.0°C, and the salinity increased from 23.0 to 34.0 at site N2 and M1 (Figures 6B, C). At site N1, the variation is dramatic within a shallow water depth. The salinity increased from 16.0 to 34.0 and the DO decreased from 9.0 mg/L to <3.0 mg/L within a water depth of 12.0 m, indicating a low DO and hypoxia development (Figure 6A). The hypoxia thickness was estimated to be 40.0 meters. At site M2, the thermocline layers were thick and had a smooth temperature decrease from 27.0°C to 19.0°C, and salinity increased from 26.0 to 34.0 ending at a depth of approximately 20.0-25.0 m. The temperature and DO varied greatly with the halocline (ΔT>7°C, ΔDO>6.0 mg/L), while the salinity changed slowly (ΔS<10.0) at site M2. No stratification was found in the south Zhejiang sea area where the water was well mixed. The homogenous spatial variation of temperature, salinity and DO in the south of the Zhejiang sea in the surface and bottom were presented in Figures 2A, B, 3.
Figure 6
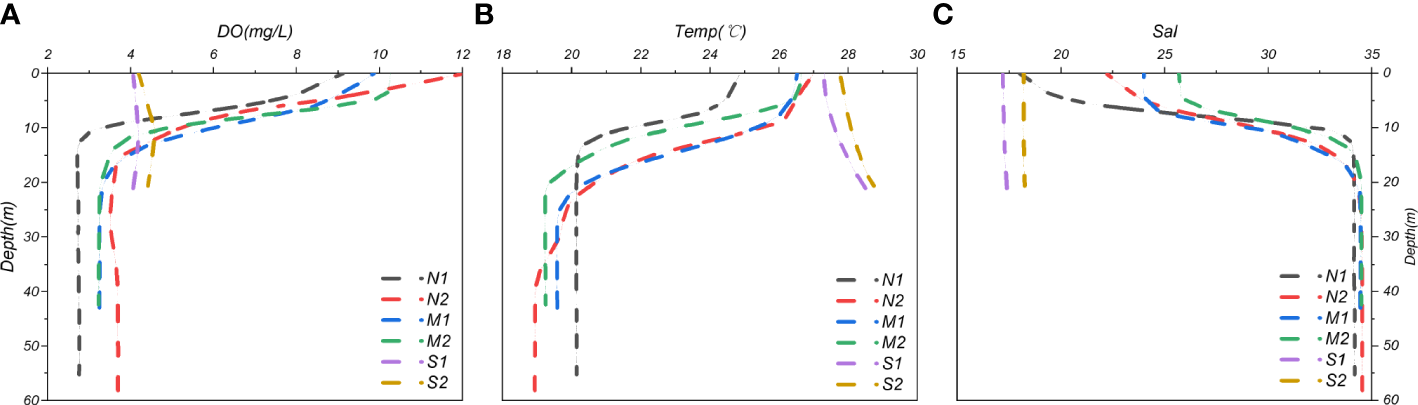
Vertical profiles of DO (A), temperature (B) and salinity (C) in different sites.
4 Discussion
4.1 Effect of temperature and salinity on the DO distribution
Without the oxygen consumption and reoxygenation processes, the DO concentration in seawater is usually affected by temperature and salinity (Weiss, 1970). High temperature often reduces the thermodynamic solubility of DO in seawater, so the temperature was considered the key driving force of DO solubility in spring and autumn when it was low. A negative correlation between DO saturation and temperature (r = -0.59, p< 0.01) and a positive correlation with salinity (r = 0.721, p< 0.01) were found in the study area in spring (unpublished data). The similar situation has also been found in the South Yellow Sea in autumn (r = -0.702, p< 0.001) (Guo et al., 2020).
However, if biological processes dominated, such as the outbreak of algal bloom, it would be different. Active phytoplankton photosynthesis processes will produce a large amount of oxygen when the temperature was as high as suitable for phytoplankton growth. During our survey in the summer of 2020, there was a significant positive correlation between DO saturation and temperature (r=0.849, p< 0.001) and a negative correlation with salinity (Figure 7). The high Chl-a concentration in the northeast and central Zhejiang sea area has been found to be consistent with the DO concentration during the survey. Chl-a was positively correlated with DO saturation (r=0.85, p < 0.001) and DO concentration (r=0.84, p < 0.001) (Figure 5). A similar correlation has been found in the surface water of the northern Gulf of Mexico approved that summer hypoxia was found (Jiang et al., 2019). Positive relations between temperature and DO contents usually occurred in summer, when the surface DO saturation was mainly dominated by biochemical processes, such as algal blooms, especially in nutrient-rich areas such as the Zhejiang coastal area.
Figure 7
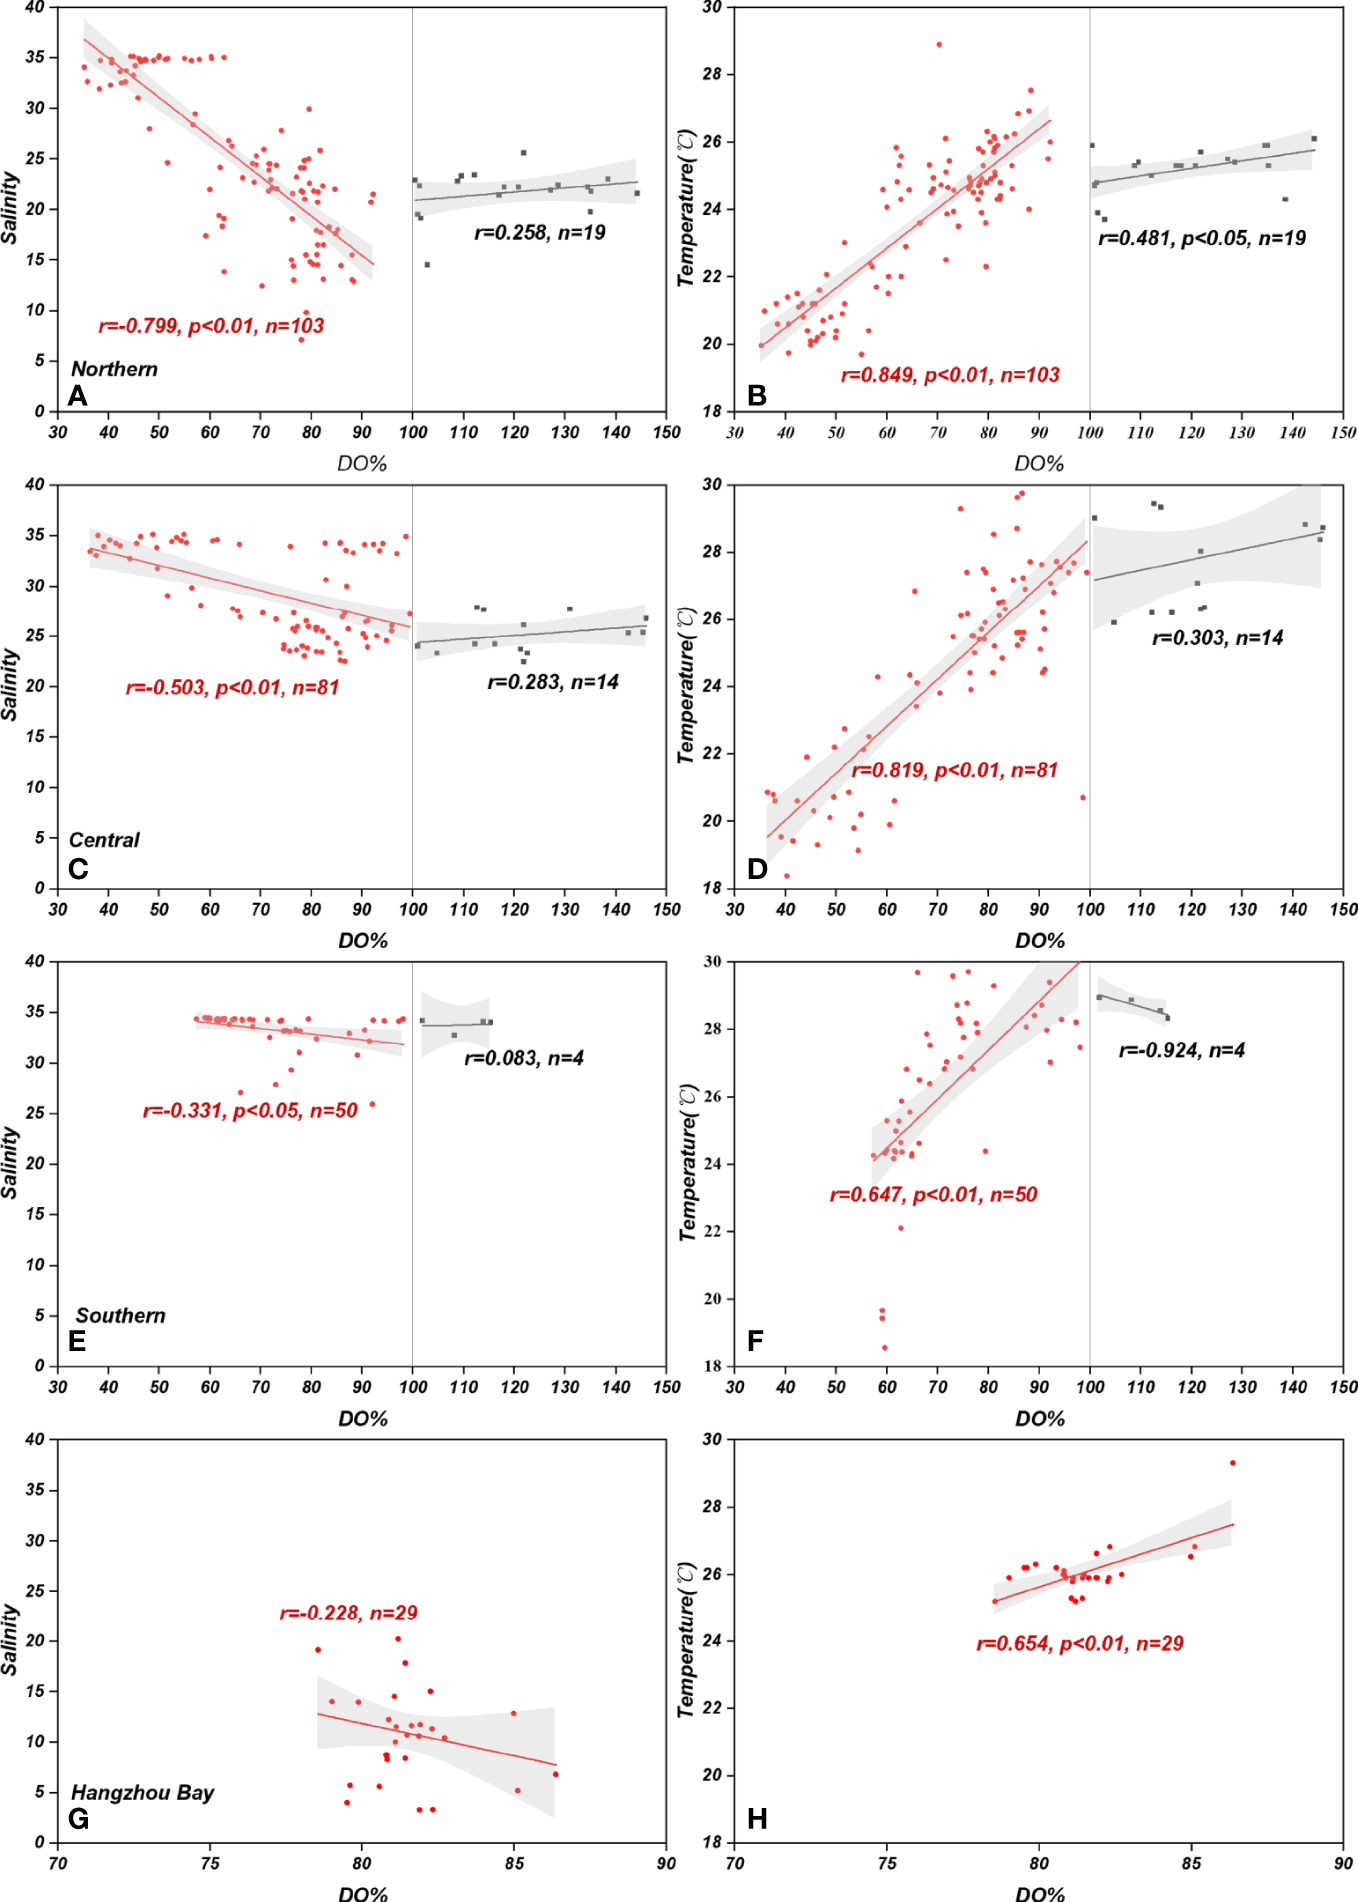
Correlation analysis. Correlation analysis between DO saturation and salinity (A, C, E, G). Correlation analysis between DO saturation and temperature (B, D, F, H).
4.2 Algal blooms on the DO distribution and the formation of hypoxia
Abundant nutrients from the CDW were conducive to the occurrence of algal bloom when the temperature and light were suitable. Algal bloom was another controlling factor on DO variation. The photosynthesis of phytoplankton in the euphotic layer is the main sources of DO in surface seawater especially in eutrophic sea area. In the summer of 2020, a significant positive correlation between Chl-a and DO concentrations (and DO saturation) was found in the surface water of northern and central Zhejiang sea area (r=0.85, p<0.001). The maximum Chl-a concentration was over 40.0 μg/L, and the DO saturation reached a very high level of 144.29%, which presented a typical characteristic of algal blooms. According to the report from Zhoushan Marine Workstation, there were three algal bloom outbreaks in northeast Zhejiang sea area from 16th June to 23th August in 2020, which was just before and during our survey. The most important thing was that the outbreak happened at the similar area covering a total area of 165.0 km2. Prorocentrum donghaiense dominated the first and third algal outbreaks, and Skeletonema costatum was the main species from July 14th to 20th. During this survey period in 2020, low DIP concentrations were found to be less than 0.01 mg/L at all of these high surface Chl-a areas (Figure 4C). The N:P ratio was over 100.0 at the areas with the Chl-a concentration >10.0 μg/L, and it even reached to 150.0 at the Chl-a > 40.0 μg/L area. Research has found that the growth and production of Prorocentrum donghaiense consumed more phosphorus than nitrogen with a minimum DIP requirement of 0.01 mg/L (Zhou et al., 2017). High N:P ratio was usually the phenomenon of Prorocentrum donghaiense bloom in the sea. Phosphorus was consumed largely when the bloom occurred until it was limited to the growth of the algal.
The algal blooms produced large amount of DO in the surface as well as a plenty of organic maters. The tremendous amount of marine biogenic organic matter deposited into the bottom water will consume large quantities of DO during the decomposition process. The high values of AOU in the bottom water indicate the evidence of this activity (Figure 2F). The low bottom DO areas distributed well below the high surface Chl-a areas. The successive algal blooms occurred in northeastern Zhejiang sea area were considered the key factor for the high Chl-a, high DO concentration as well as the low bottom DO value. Another low-bottom DO area in Taizhou Bay, central Zhejiang sea area, was also caused by the deposition of bloomed algal where the Chl-a content was over 10.0 μg/L. The decomposition of organic matter after the blooms plays an important role in the DO content and the formation of hypoxia zones. Hypoxia has been found simultaneously with the occurrence of phytoplankton blooms in 2006 (Chen et al., 2021). Hypoxia was often found at the nutrient rich estuaries or bays after the algal blooms (Diaz, 2001). Hypoxia at the bottom of the Lazdornaya Estuary was caused by the phytoplankton outbreak at the surface as well as the formation of the thermocline (Tishchenko et al., 2017). An anoxic event in St. Helena Bay was related to the intermittent deposition of organic matter (Pitcher and Probyn, 2017).
4.3 Effect of hydrodynamics and stratification on the DO distribution and hypoxia
Air-sea exchange and hydrodynamic conditions in the sea greatly influence the DO concentration (Guo et al., 2020). Our study area was in a complicated sea with different hydrodynamic processes and water masses from the coastal line to offshore combined with obvious seasonal variation. The high salinity in the bottom during the survey has showed the water mass impact from the Taiwan Warm Current and the Kuroshio subsurface tributaries, which went up to the north strongly from the bottom along the coast through cross-shelf transportation with high salinity and low nutrients. The diluted freshwater from the Yangtze River was the dominant surface water mass in most of the northern and central Zhejiang sea area with a significant low salinity, high temperature and rich nutrients. The CDW affected area usually starts from 31°N down to 29°N along the coastline (Zhou et al., 2010). The spatial distributions of salinity and temperature in the surface and bottom water have presented the clear information about how these two different water masses work in this study area during the survey period (Figures 3, 4). The water masses structure of low-salinity freshwater (CDW) moving down to the south on the surface and the intrusion of high-salinity water mass (TWC) coming up to the north at the bottom layer can generated the stratification easily in northern and central Zhejiang sea area. Temperature invasion in the oceans is usually observed to coincide with the halocline, where higher salinity in the subsurface layer compensates for stability loss due to lower SST and maintains stable temperature inversion. The stability of oceanographic is characterized by the buoyancy frequency N. Calculation of N2 for typical hydrographic casts at six sampling sites (Figure 1) found that a positive N2 values varied from 0.01/s2 to 0.045/s2 at the depth between 5m and 15m in northern (N1, N2) and central (M1, M2), especially at site N1 and M2, indicating a strong stratification happened in these areas. The vertical profile of DO showed that the minimum DO content happened right at the bottom of the stratification layer.
Water stratification has been considered a controlling factor in the formation of hypoxia (Zhu et al., 2016; Dzwonkowski et al., 2018). Studies in the Bohai Sea found that the DO concentration decreased sharply in the summer where the thermocline occurred at a depth of 10.0-15.0 m (Song et al., 2020). Seasonal bottom hypoxia in the Black Sea northwestern shelf was also caused by the seasonal stratification of the water column (Ukrainskii and Popov, 2009). The stable stratification ceased the vertical water exchanges and DO, which further advanced the development of hypoxia. Our results in the northern Zhejiang sea area indicated that strong stratification of the water column was essential for hypoxia development, as it isolates the exchange of oxygen-rich surface water to the bottom. Successive outbreaks of algal bloom have generated high DO in the surface and followed by the low DO pool in the bottom. Strong stratifications due to the water masses in the two layers further promoted the hypoxia development. The occurrence of algal bloom and stratification have been proved as the two main reasons for the occurrence of hypoxia in the Zhejiang coastal area in the summer of 2020. One, stratification of the water column to cease the vertical exchange of the oxygen rich surface water to the bottom. Two, the oxygen depletion driven by decomposition of rich organic matter in the bottom waters. This has also been concluded by Diaz in 2001 (Diaz, 2001). In this case, successive algal blooms from June played an important role on the low DO pool preparation, although researches found that the low DO from Taiwan Warm current played the foundation of hypoxia. Other factors in summer may strengthen this hypoxia development.
4.4 The low DO and hypoxia area expansion and duration
The algal bloom outbreaks in East China sea distributed mostly at adjacent areas of Yangtze River Estuary before 2000. However, it extended significantly to northeast Zhejiang sea area with more frequency after that, and this has been worse since 2010. A statistic of 30 years algal bloom data in East China Sea found that northeast Zhejiang (122°45′E-123°20′E, 29°40′N-30°50′N) was the most frequency bloom areas. Most of the previous studies on the hypoxia off the Yangtze River Estuary and East China Sea have found that the center area of hypoxia areas was around 123°E, 31°N (Chen et al., 2007; Li et al., 2002; Zhu et al., 2017). Our results found that the hypoxia area in the northeast(121.53-122.78°E, 28.33-29.78°N)and central (121.78-123.38°E, 29.83-30.92°N)distributed in southward compared to the previous studies(Figure 2B, Table 3). Our analysis found that the hypoxia area extended further to the south, which may have already started in early summer after the algal blooms. A tongue-like hypoxia area has been found in the south-west of Yangtze River Estuary with the minimum DO of 2.5 mg/L in June of 2006 (Wang et al., 2012).
The algal bloom usually happened from May to August, however, 60.65% of the blooms occurred in May and June. The reported Prorocentrum donghaiense outbreak from 16th to 23th June, 2020 in northeast Zhejiang sea area was only one week before the start of this survey. The mineralization and decomposition of these organic matters has consumed a large amount of DO, which prepared a low bottom DO pool for the hypoxia development in July, although KSSW with low DO has also been suggested as one of the causes for the formation of hypoxia in ECS (Wang et al., 2016). Compared with the previous reports on hypoxia formation in August, hypoxia may start earlier and have a longer duration time due to the algal blooms (Table 3).
Table 3
| Time | Location | Covering areas(km2) | References |
|---|---|---|---|
| 1999.8 | 122.98°E, 30.85°N | 13,700 | Li et al., 2002 |
| 2003.9 | 123.00°E, 31.00°N | 20,000 | Wei et al., 2007 |
| 2007.8 | 123.00°E, 31.50°N | 8,045 | Liu et al., 2021 |
| 2012.8 | 122.68°E, 31.75°N | 3,462 | Liu et al., 2021 |
| 2014.8 | 123.00°E, 31.30°N | 5,826 | Liu et al., 2021 |
| 2020.7 | 121.78-123.38°E, 29.83-30.92°N; 121.53-122.78°E, 28.33-29.78°N |
10,000 | This study |
Historical records of hypoxia and covered area in the East China Sea.
The duration of hypoxia that occurs over an annual cycle will also increase. Rising surface ocean temperatures, freshwater and nutrient inputs, more frequency of algal blooms would likely be further exacerbating the hypoxia expansion by global warming. Biogeochemical models for the northern Gulf of Mexico (nGoM) predict that the hypoxic area (DO< 2.0 mg/L) will increase by 26% between 2000s and ~2100 (Laurent et al., 2018). How this will be in the future in East China sea should be considered seriously, although the historical hypoxia covering areas in offshore Yangtze River varied in different years.
5 Conclusions
According to the investigation of the summertime DO spatial variation, saturation, and AOU, the DO depletion in the bottom layer was obvious. There was a low DO and even hypoxia area at the bottom layer of the northeast and central regions, covering an area of about 6,000km2 and 4,000 km2 respectively, which may harm marine ecosystem health and fishery resources. The decomposition and mineralization of organic matter after successive algal blooms enhanced the DO consumption at the bottom, promoting hypoxia development. Stratification generated by the combined effect of light warm freshwater from the Yangtze River on the surface layer and the heavy salty Taiwan Warm Current intrusion up to the north at the bottom prevented the vertical advection of high DO from the surface to the bottom, especially in northern Zhejiang sea area. These combination of strong stratification and successive algal blooms were the key driving factors leading to hypoxia formation in this area. The low DO and hypoxia started in early July in this study has proposed a deep thinking of the starting time and duration of hypoxia. The rising temperature, more frequency of algal blooms by global warming would likely to make the hypoxia starts earlier and keeps longer. Further works are badly needed to get a better understanding of the future expansion of existing hypoxic regions in summer as well as the DO status in other seasons. Continued interdisciplinary research should be further developed, which will provide more useful information for understanding the potential trend in DO depletion in the Zhejiang coastal area.
Statements
Data availability statement
The original contributions presented in the study are included in the article/supplementary material. Further inquiries can be directed to the corresponding authors.
Author contributions
XZ: Writing the manuscript, data analysis. ZW: Writing-Original draft preparation, mapping, Visualization. HC: Supervision, Writing-Reviewing and Editing, Funding acquisition. XC: Data Curation, Methodology. JT: Investigation planning,Validation, Funding acquisition. LZ: Data Curation. HJ: Investigation. All authors contributed to the article and approved the submitted version.
Funding
This work was financially supported by Science Technology department of Zhejiang province(2022C02040), Department of Natural Resources of Zhejiang Province(CTZB-2021110396), Department of Ecology and Environment of Zhejiang Province (2019A001) and the Bureau of Science and Technology of Zhoushan (2021C31026).
Acknowledgments
We thank colleagues from the Zhejiang Marine Ecological Environment Monitoring Center for their help with sample collection and crews for their cooperation during the cruises. We thank Dr. Wenbin Yin for his constructive comments on this manuscript. We thank Ms. Jing Shi for her help with mapping. We thank all the reviewers for their constructive comments on improving this paper.
Conflict of interest
The authors declare that the research was conducted in the absence of any commercial or financial relationships that could be construed as a potential conflict of interest.
Publisher’s note
All claims expressed in this article are solely those of the authors and do not necessarily represent those of their affiliated organizations, or those of the publisher, the editors and the reviewers. Any product that may be evaluated in this article, or claim that may be made by its manufacturer, is not guaranteed or endorsed by the publisher.
References
1
Breitburg D. Levin L. A. Oschlies A. Grégoire M. Chavez F. P. Conley D. J. et al . (2018). Declining oxygen in the global ocean and coastal waters. Science359, eaam7240. doi: 10.1126/science.aam7240
2
Brzana R. Janas U. Tykarska M. B. (2020). Effects of a 70-year old artificial offshore structure on oxygen concentration and macrobenthos in the gulf of gdańsk (Baltic Sea). Estuarine Coast. Shelf Sci.235, 106563. doi: 10.1016/j.ecss.2019.106563
3
Chen C. C. Gong G. C. Shiah F. K. (2007). Hypoxia in the East China Sea: one of the largest coastal low-oxygen areas in the world. Mar. Environ. Res.64, 399–408. doi: 10.1016/j.marenvres.2007.01.007
4
Chen C. Shiah F. Gong G. Chen T. (2021). Impact of upwelling on phytoplankton blooms and hypoxia along the Chinese coast in the East China Sea. Mar. Pollut. Bull.167, 112288. doi: 10.1016/j.marpolbul.2021.112288
5
Chen C. Shiahb F. Gong G. Chen T. (2021). Impact of upwelling on phytoplankton blooms and hypoxia along the Chinese coast in the East China Sea. Mar. pollut. Bull.167, 112288. doi: 10.1016/j.marpolbul.2021.112288
6
Chen H. Chen C. Zhang Z. Lu C. Wang L. He X. et al . (2021). Changes of the spatial and temporal characteristics of land-use landscape patterns using multi-temporal landsat satellite data: a case study of zhoushan island, China. Ocean Coast. Manage213, 105842. doi: 10.1016/j.ocecoaman.2021.105842
7
Chen C. Liang J. Xie F. Hu Z. Sun W. Yang G. et al . (2022). Temporal and spatial variation of coastline using remote sensing images for zhoushan archipelago, China. Int. J. Appl. Earth Obs.107, 102711. doi: 10.1016/j.jag.2022.102711
8
Chen X. Shen Z. Li Y. Yang Y. (2015). Physical controls of hypoxia in waters adjacent to the Yangtze estuary: A numerical modeling study. Mar. Pollut. Bull.97, 349–364. doi: 10.1016/j.marpolbul.2015.05.067
9
Chi L. Song X. Yuan Y. Wang W. Zhou P. Fan X. et al . (2017). Distribution and key influential factors of dissolved oxygen off the changjiang river estuary (CRE) and its adjacent waters in China. Mar. Pollut. Bull.125, 440–450. doi: 10.1016/j.marpolbul.2017.09.063
10
Coppola L. Legendre L. Lefevre D. Prieur L. Taillandier V. Diamond Riquier E. (2018). Seasonal and inter-annual variations of dissolved oxygen in the northwestern Mediterranean Sea (DYFAMED site). Prog. Oceanogr.162, 187–201. doi: 10.1016/j.pocean.2018.03.001
11
Deutsch C. Brix H. Ito T. Frenzel H. Thompson L. (2011). Climate-forced variability of ocean hypoxia. Sci. (American Assoc. Advancement Science).333, 336–339. doi: 10.1126/science.1202422
12
Diaz R. J. (2001). Overview of hypoxia around the world. J. Environ. Quality.30, 275–281. doi: 10.2134/jeq2001.302275x
13
Diaz R. J. Rosenberg R. (2008). Spreading dead zones and consequences for marine ecosystems. Science321, 926–929. doi: 10.1126/science.1156401
14
Dzwonkowski B. Fournier S. Reager J. T. Milroy S. Park K. Shiller A. M. et al . (2018). Tracking sea surface salinity and dissolved oxygen on a river-influenced, seasonally stratified shelf, Mississippi bight, northern gulf of Mexico. Cont. Shelf Res.169, 25–33. doi: 10.1016/j.csr.2018.09.009
15
Guo J. Yuan H. Song J. Li X. Duan L. (2020). Hypoxia, acidification and nutrient accumulation in the yellow Sea cold water of the south yellow Sea. Sci. Total Environ.745, 141050. doi: 10.1016/j.scitotenv.2020.141050
16
Hsiao S. S. Y. Hsu T. C. Liu J. W. Xie X. Zhang Y. Lin J. et al . (2014). Nitrification and its oxygen consumption along the turbid Chang jiang river plume. Biogeosciences11, 2083–2098. doi: 10.5194/bg-11-2083-2014
17
Jiang Z. P. Cai W. J. Chen B. Wang K. Han C. Roberts B. J. et al . (2019). Physical and biogeochemical controls on pH dynamics in the northern gulf of Mexico during summer hypoxia. J. Geophys. Res.: Oceans.124, 5979–5998. doi: 10.1029/2019JC015140
18
Katin A. Del Giudice D. Obenour D. R. (2019). Modeling biophysical controls on hypoxia in a shallow estuary using a Bayesian mechanistic approach. Environ. Modell. Software120, 104491. doi: 10.1016/j.envsoft.2019.07.016
19
Keeling R. E. Kortzinger A. Gruber N. (2010). Ocean deoxygenation in a warming world. Ann. Rev. Mar. Sci.2, 199–229. doi: 10.1146/annurev.marine.010908.163855
20
Kralj M. Lipizer M. Čermelj B. Celio M. Fabbro C. Brunetti F. et al . (2019). Hypoxia and dissolved oxygen trends in the northeastern Adriatic Sea (Gulf of Trieste). Deep Sea Res. Part II: Topical Stud. Oceanograph.164, 74–88. doi: 10.1016/j.dsr2.2019.06.002
21
Laurent A. Fennel K. Ko D.S. Lehrter J. (2018). Climate change projected to exacerbate impacts of coastal eutrophication in the northern Gulf of Mexico. J. Geophys. Res.123, 3408–3426. doi: 10.1002/2017JC013583
22
Li Y. Jin H. Chen J. Wang D. Yang Z. Wang B. et al . (2021). Nitrogen removal through sediment denitrification in the Yangtze estuary and its adjacent East China Sea: A nitrate limited process during summertime. Sci. Total Environ.795, 148616. doi: 10.1016/j.scitotenv.2021.148616
23
Liu J. Krom M. D. Ran X. Zang J. Liu J. Yao Q. et al . (2020). Sedimentary phosphorus cycling and budget in the seasonally hypoxic coastal area of changjiang estuary. Sci. Total Environ.713, 136389. doi: 10.1016/j.scitotenv.2019.136389
24
Liu H. Wang Y. An B. Qian J. (2021). Study on the variation trend and influencing factors of summer hypoxia off the Yangtze river estuary. Mar. Env. Sci.40 (3), 341–351. doi: 10.13634/j.cnki.mes.2021.03.003
25
Li D. Zhang J. Huang D. (2002). Oxygen depletion off the changjiang (Yangtze river) estuary. Sci. China Ser. D: Earth Sci.45, 1137–1146. doi: 10.1360/02yd9110
26
Meier H. E. M. Eilola K. Almroth-Rosell E. Schimanke S. Kniebusch M. Höglund A. et al . (2019). Disentangling the impact of nutrient load and climate changes on Baltic Sea hypoxia and eutrophication since 1850. Clim. Dynam.53, 1145–1166. doi: 10.1007/s00382-018-4296-y
27
Ministry of Ecology and Environment of the People’s Republic of China (1997). Sea Water quality standard. Beijing: Standard Press of China.
28
Pauer J. J. Melendez W. Feist T. J. Lehrter J. C. Rashleigh B. Lowe L. L. et al . (2020). The impact of alternative nutrient kinetics and computational grid size on model predicted primary production and hypoxic area in the northern gulf of Mexico. Environ. Modell. Software126, 104661. doi: 10.1016/j.envsoft.2020.104661
29
Pitcher G. C. Probyn T. A. (2017). Seasonal and sub-seasonal oxygen and nutrient fluctuations in an embayment of an eastern boundary upwelling system: St Helena bay. Afr. J. Mar. Sci.39, 95–110. doi: 10.2989/1814232X.2017.1305989
30
Rabalais N. N. Díaz R. J. Levin L. A. Turner R. E. Gilbert D. Zhang J. (2009). Dynamics and distribution of natural and human-caused coastal hypoxia. Biogeosci. discussions.6, 9359–9453. doi: 10.5194/bgd-6-9359-2009
31
Rak D. Walczowski W. Dzierzbicka-Głowacka L. Shchuka S. (2020). Dissolved oxygen variability in the southern Baltic Sea in 2013–2018. Oceanologia62, 525–537. doi: 10.1016/j.oceano.2020.08.005
32
Seitz R. D. Dauer D. M. Llansó R. J. Long W. C. (2009). Broad-scale effects of hypoxia on benthic community structure in Chesapeake bay, USA. J. Exp. Mar. Biol. Ecol.381, S4–S12. doi: 10.1016/j.jembe.2009.07.004
33
Song G. Zhao L. Chai F. Liu F. Li M. Xie H. et al (2020). Summertime oxygen depletion and acidification in Bohai Sea, China. Front. Mar. Sci.7, 252. doi: 10.3389/fmars.2020.00252
34
Stramma L. Johnson G. C. Sprintall J. Mohrholz V. (2008). Expanding oxygen-minimum zones in the tropical oceans. Science320, 655–658. doi: 10.1126/science.1153847
35
Tishchenko P. Y. Semkin P. J. Tishchenko P. P. Zvalinsky V. I. Barabanshchikov Y. A. Mikhailik T. A. et al . (2017). Hypoxia of bottom waters of the razdolnaya river estuary. Dokl. Earth Sci.476, 1207–1211. doi: 10.1134/S1028334X17100208
36
Trucco-Pignata P. N. Hernández-Ayón J. M. Santamaria-del-Angel E. Beier E. Sánchez-Velasco L. Godínez V. M. et al . (2019). Ventilation of the upper oxygen minimum zone in the coastal region off Mexico: Implications of El niño 2015–2016. Front. Mar. Sci.6. doi: 10.3389/fmars.2019.00459
37
Ukrainskii V. V. Popov Y. I. (2009). Climatic and hydrophysical conditions of the development of hypoxia in waters of the northwest shelf of the black Sea. Phys. Oceanograph.19, 140–150. doi: 10.1007/s11110-009-9046-6
38
Wang B. Wei Q. Chen J. Xie L. (2012). Annual cycle of hypoxia off the changjiang (Yangtze river) estuary. Mar. Environ. Res.77, 1–5. doi: 10.1016/j.marenvres.2011.12.007
39
Wang W. Yu Z. Song X. Wu Z. Yuan Y. Zhou P. et al . (2016). The effect of kuroshio current on nitrate dynamics in the southern East China Sea revealed by nitrate isotopic composition. J. Geophys. Res- Oceans121, 7073–7087. doi: 10.1002/2016JC011882
40
Wei H. He Y. Li Q. Liu Z. Wang H. (2007). Summer hypoxia adjacent to the changjiang estuary. J. Mar. Syst.67, 3–4. doi: 10.1016/j.jmarsys.2006.04.014
41
Weiss R. F. (1970). The solubility of nitrogen, oxygen and argon in water and seawater. Deep-Sea Res.17, 721–735. doi: 10.1016/0011-7471(70)90037-9
42
Wei Q. Wang B. Chen J. Xia C. Qu D. Xie L. (2015). Recognition on the forming-vanishing process and underlying mechanisms of the hypoxia off the Yangtze river estuary. Sci. China Earth Sci.58, 628–648. doi: 10.1007/s11430-014-5007-0
43
Williams N. L. Feely R. A. Sabine C. L. Dickson A. G. Swift J. H. Talley L. D. et al . (2015). Quantifying anthropogenic carbon inventory changes in the pacific sector of the southern ocean. Mar. Chem.174, 147–160. doi: 10.1016/j.marchem.2015.06.015
44
Yin M. Duan L. Song J. Zhang N. Li X. Yuan H. et al . (2021). Bacteriohopanepolyols signature in sediments of the East China Sea and its indications for hypoxia and organic matter sources. Org. Geochem.158, 104268. doi: 10.1016/j.orggeochem.2021.104268
45
Zhou F. Huang D. Ni X. Xuan J. Zhang J. Zhu K. (2010). Hydrographic analysis on the multi-time scale variability of hypoxia adjacent to the changjiang river estuary. Acta Ecol. Sin.30, 4728–4740. doi: 10.1016/S1872-5813(11)60001-7
46
Zhou Y. Yu J. Liu X. (2017). The coastal disasters and its prevention on red tides in zhejiang province (Hangzhou, China: Zhejiang University press).
47
Zhu Z. Wu H. Liu S. Wu Y. Huang D. Zhang J. et al . (2017). Hypoxia off the changjiang (Yangtze river) estuary and in the adjacent East China Sea: Quantitative approaches to estimating the tidal impact and nutrient regeneration. Mar. pollut. Bull.125, 103–114. doi: 10.1016/j.marpolbul.2017.07.029
48
Zhu J. Zhu Z. Lin J. Wu H. Zhang J. (2016). Distribution of hypoxia and pycnocline off the changjiang estuary, China. J. Mar. Syst.154, 28–40. doi: 10.1016/j.jmarsys.2015.05.002
49
Zuo J. Song J. Yuan H. Li X. Li N. Duan L. (2019). Impact of kuroshio on the dissolved oxygen in the East China Sea region. J. Oceanol. Limnol.37, 513–524. doi: 10.1007/s00343-019-7389-5
Summary
Keywords
dissolved oxygen, hypoxia, stratification, Zhejiang coastal area, algal bloom
Citation
Zhang X, Wang Z, Cai H, Chai X, Tang J, Zhuo L and Jia H (2022) Summertime dissolved oxygen concentration and hypoxia in the Zhejiang coastal area. Front. Mar. Sci. 9:1051549. doi: 10.3389/fmars.2022.1051549
Received
22 September 2022
Accepted
02 December 2022
Published
23 December 2022
Volume
9 - 2022
Edited by
Mingming Jia, Northeast Institute of Geography and Agroecology (CAS), China
Reviewed by
Jing Zhang, Ocean University of China, China; Jianwei Yu, Research Center for Eco-environmental Sciences (CAS), Beijing, China
Updates
Copyright
© 2022 Zhang, Wang, Cai, Chai, Tang, Zhuo and Jia.
This is an open-access article distributed under the terms of the Creative Commons Attribution License (CC BY). The use, distribution or reproduction in other forums is permitted, provided the original author(s) and the copyright owner(s) are credited and that the original publication in this journal is cited, in accordance with accepted academic practice. No use, distribution or reproduction is permitted which does not comply with these terms.
*Correspondence: Huiwen Cai, caihuiwen1977@hotmail.com; Xiaoping Chai, 46968738@qq.com
†These authors have contributed equally to this work
This article was submitted to Marine Conservation and Sustainability, a section of the journal Frontiers in Marine Science
Disclaimer
All claims expressed in this article are solely those of the authors and do not necessarily represent those of their affiliated organizations, or those of the publisher, the editors and the reviewers. Any product that may be evaluated in this article or claim that may be made by its manufacturer is not guaranteed or endorsed by the publisher.