 Yiqing Ma1,2
 Yuan Li
 Chen Jiang
 Li Zheng
 Shenghao Liu
 Linlin Zhao
- 1Key Laboratory of Marine Eco-Environmental Science and Technology, First Institute of Oceanography, Ministry of Natural Resources, Qingdao, China
- 2School of Advanced Manufacturing, Fuzhou University, Jinjiang, China
- 3Laboratory of Marine Biodiversity, Third Institute of Oceanography, Ministry of Natural Resources, Xiamen, China
- 4Key Laboratory of Mariculture & Stock Enhancement in North China’s Sea, Ministry of Agriculture, Dalian Ocean University, Dalian, China
Introduction
Gadus macrocephalus (Pacific cod) is a species of the order Gadiformes, the family Gadidae and the genus Gadus. It is a typical demersal fish species that is widely distributed along the coastal waters of the Pacific, from the Yellow Sea, the Bohai Sea and the Sea of Japan in the Northwest Pacific Ocean through the Bering Sea to California in the Northeast Pacific Ocean (Hart and Clemens, 1973). It is a cold-water fish species with habitat temperatures < 15°C (Sakurai, 2007). The spawning period of G. macrocephalus is approximately January to March, and there is only one spawning once a year (Wu et al., 2021). G. macrocephalus migrate from the deep-sea areas (approximately 200 m) to the coastal areas (30-50 m) during the spawning period (Wu et al., 2021). This species released all mature eggs with a relatively short time, which occurs at temperatures of 6.4-7.6°C (Sakurai and Hattori, 1996). The species is commercially important because of its abundance and high nutritional value. In recent decades, there has been an increasing tendency of the global capture of G. macrocephalus (FAO, 2020). The third generation sequencing technology is developing rapidly as an essential sequencing technology, it is also known for its prominent throughput and long-read sequencing, which could be conducive to the generation of highly contiguous genome sequences (Lang et al., 2020). Genome data, containing abundant genetic information, are considered fundamental for revealing the biological characteristics and evolutionary mechanisms of fish (Han et al., 2021). For now, two chromosome-level genomes of Gadus (Noh et al., 2022; https://www.ncbi.nlm.nih.gov/data-hub/genome/GCF_902167405.1/) are publicly available, but high-quality genomic data for G. macrocephalus have been limited.
Significance of the data
Based on PacBio HiFi long-read sequencing and Hi-C (High-throughput chromosome conformation capture) technology, we constructed a nearly complete genome of G. macrocephalus with 23 chromosomes. In total, 23,843 protein-coding genes were obtained by gene prediction. Protein-coding genes of G. macrocephalus and 12 species were used for comparative genomics analysis, for example, phylogenetic analysis, analysis of gene family expansion and contraction. This report provides the genomic characteristics of G. macrocephalus and elucidates the evolutionary relationship and divergence time of the order Gadiformes. These resources will be valuable for phylogenetic research, artificial breeding and fisheries management.
Materials and methods
Sampling and sequencing
One female G. macrocephalus was sampled from the Yellow Sea in January 2022. The muscle, brain, gonad, liver, spleen and heart were stored at -80°C. The total genomic DNA of the muscle tissue was extracted using the DNeasy Blood and Tissue Kit (Qiagen, Germany). The DNA samples were subjected to genomic sequencing to generate short and long reads. For short-read sequencing, Covaris M220 was used to break DNA into 300-350 bp fragments. DNA libraries preparation were completed by terminal repair, an A-tail addition, sequencing junction addition, DNA purification and bridge PCR. Subsequently, based on a paired-end sequencing strategy, these libraries were sequenced on the Illumina NovaSeq Nova 6000 platform. For long-read sequencing, according to the Pacific Biosciences (PacBio) standard protocol, a PacBio library was generated using a SMRTbell Template Prep Kit. Subsequently, these libraries were sequenced on the PacBio Sequel II platform, and long reads were generated from one SMRT cell. On the Illumina NovaSeq 6000 platform, a Hi-C library was sequenced and Hi-C data were generated. The total RNA of the six tissues (muscle, brain, gonad, liver, spleen and heart) was extracted using the RNeasy mini Kit (Qiagen, Germany). Then, RNA libraries were constructed for PE150 sequencing, and short reads were produced on the Illumina NovaSeq 6000 platform.
Genome assembly and evaluation
To assemble the contig-level genome, long-read sequencing data from the PacBio platform were assembled using Hifiasm v0.16.1-r375 (Cheng et al., 2021) with the default parameters. Subsequently, the assembled contigs were subjected to sequence polishing using NextPolish software (Hu et al., 2020) to reduce base errors. (non-default parameter: task = best; rewrite = yes; sgs_options = -max_depth 100 -bwa; lgs_options = -min_read_len 1k -max_depth 100; lgs_minimap2_options = -x map-pb -t {multithread_jobs}). To assemble the chromosome-level genome, Hi-C sequencing data were mapped and sorted against the draft genome assembly with Juicer v1.6 software (Durand et al., 2016a) (non-default parameter: -s MboI). Subsequently, the contigs were linked to form 23 chromosomes by using 3D-DNA v180922 software (Dudchenko et al., 2017) with the default parameters. Finally, based on chromosome interactions, the contig orientation was corrected and suspicious fragments were removed from the contigs in the Juicebox software (Durand et al., 2016b). Benchmarking Universal Single-Copy Orthologs (BUSCO) v5.2.2 (Manni et al., 2021) was using to evaluate the completeness and accuracy of the genome assembly (non-default parameter: -m genome; -i Gadus_macrocephalus.chr.v1.fa; -l actinopterygii_odb10). The reference BUSCO database was actinopterygii_odb10.
Repeat and transposable element annotation
Repetitive sequences were annotated by homology alignment and de novo prediction. For homologous alignment, we used RepeatMasker v4.1.2-p1 (http://www.repeatmasker.org) and repeat-proteinmask v4.1.0 (http://www.repeatmasker.org) to annotate the transposable elements (TEs), with the genome sequences employed as queries against the Repbase database library. For de novo prediction, we used RepeatModeler v2.0.3 (http://www.repeatmasker.org/RepeatModeler), LTR_Finder v1.07 (Xu and Wang, 2007) and RepeatScout v1.0.5 (http://www.repeatmasker.org) to construct a de novo repeat library with the default parameters. We used Tandem Repeats Finder (Trf) v4.07b (Benson, 1999) to annotate the tandem repeat elements. Finally, the results of all methods were integrated. After eliminating redundancy, we obtained the final annotated repeat sets.
Gene prediction and functional annotation
After masking repetitive sequences, protein-coding genes were predicted through a combination of homology-based, RNA-seq-based, and de novo prediction. For the homolog-based method, we downloaded the protein-coding sequences of G. morhua (Atlantic cod), G. chalcogrammus (Walleye pollock), Lota lota (Burbot), and Danio rerio (Zebrafish) from databases (Supplementary Table 1) and retained the longest transcript of each gene for further analysis. Subsequently, we used tBLASTn to align protein-coding sequences to the genome (E-value: 1e-5). Based on the results described above, we used GeneWise v2.4.1 (Birney et al., 2004) to predict gene structures. For the RNA-seq-based method, transcriptomic data were assembled using Trinity v2.11 (Grabherr et al., 2011) with the default parameters. To detect gene structure, we used BlastN to align transcriptome to the genome (E-value: 1e-5). For de novo prediction, transcriptomic data generated from the Illumina platform were aligned to the genome by using HISAT2 v2.2.1 (Kim et al., 2019). Subsequently, based on the alignment results, Augustus v3.4.0 (Stanke et al., 2006), GlimmerHMM v3.0.4 (Majoros et al., 2004) and Genscan v1.0 (Burge and Karlin, 1997) were used to generate de novo-predicted gene sets. Three gene models were combined and redundant genes were removed with Maker v2.31.10 (Carson and Mark, 2011) (non-default parameter: est = transcriptome.fasta; protein = protein.fasta; softmask = 1; run_evm = 0; est2genome = 1; protein2genome = 1; trna = 0; cpus = 1; max_dna_len = 100000; min_contig = 10000; pred_flank = 200; pred_stats=0; AED_threshold = 1; min_protein = 50; alt_splice = 0; always_complete = 1). Finally, all protein-coding genes were integrated via the HiCESAP pipeline. For gene functional annotation, we used multiple databases, including NCBI Non-Redundant (NR), Swiss-Prot, TrEMBL, InterPro database, Gene Ontology (GO) pathway, Kyoto Encyclopedia of Genes and Genomes (KEGG) pathway, to annotate the function of protein-coding genes. We used the NR, Swiss-Prot and TrEMBL (Bairoch and Apweiler, 2000) databases to annotate the function of the protein-coding genes by using BlastP (E-value: 1e-5). InterProScan v5.55-88.0 (Jones et al., 2014) was conducted to identify the functional domains of protein-coding genes with the InterPro database. GO and KEGG pathway analyses were used to obtain the pathway information of the protein-coding genes by using Blast2GO 5.2.5 (Conesa et al., 2005). To predict noncoding RNA (ncRNA) in the genome of G. macrocephalus, we used tRNAscan-SE v1.3.1 (Chan and Lowe, 2019) to identify transfer RNAs (tRNAs), and Infernal v1.1.2 (Nawrocki and Eddy, 2013) to annotate other ncRNAs, including microRNAs (miRNAs) and small nuclear RNAs (snRNAs), in the Rfam and miRbase databases.
Comparative genomic analyses
For comparative genomic analyses, we downloaded the coding sequences and corresponding protein sequences of 12 species from the online databases (Supplementary Table 1) and retained the longest transcript and encoded protein sequence of each gene for further analysis. First, we used OrthoFinder v2.5.4 (Emms and Kelly, 2019) to obtain the single-copy genes of all species with parameters: -f: data; -S: diamond; -M: msa; -T: fasttree; -t: 50. To investigate the phylogenetic relationships among these species, the single-copy genes of all species were further aligned using MUSCLE v3.8.1551 (Edgar, 2004) with the default parameters. Based on the alignment results, we used RaxML v8.2.12 (Stamatakis, 2014) software to construct a maximum likelihood phylogenetic tree, and the parameters were as follows: raxmlHPC-PTHREADS; -T: 90; -m: PROTGAMMAJTT; -f: a; -p: 123; -x: 123; -#: 100; -n: out; -s: all_FAD.muscle.fasta. Subsequently, four time-calibration points were selected from TimeTree (Kumar et al., 2017): (1) Lepisosteus oculatus (Spotted gar) and D. rerio (298.8-342.5 million years ago [Mya]), (2) D. rerio and L. lota (180.0-264.0 Mya), (3) L. lota and G. morhua (23.9-51.6 Mya), and (4) Cynoglossus semilaevis (Tongue sole) and Oryzias latipes (Medaka) (97.5-153.0 Mya). MCMCTree within the PAML v4.9j package (Yang, 2007) was used to estimate the divergence times among species with parameters: ndata = 1; seqtype = 2; usedata = 2; clock = 3; RootAge = < 4; model = 0; alpha = 0; ncatG = 5; cleandata = 0; BDparas = 1 1 0; kappa_gamma = 6 2; alpha_gamma = 1 1; rgene_gamma = 2 33; sigma2_gamma = 1 10; finetune = 1: 0.1 0.1 0.1 0.01.5. Based on the results described above, CAFA5 (Mendes et al., 2020) was used to reveal gene families showing significant differences. Biological pathways for the expanded and contracted gene families (P-value < 0.01) were investigated by using GO and KEGG pathway enrichment analysis. To investigate chromosomal collinearity, we used JCVI (Tang et al., 2008) to generate the genome synteny of G. macrocephalus and G. morhua.
Preliminary analysis report
For long-read sequencing, approximately 2,574,681 clean reads and a total of 44.50 Gb of clean data were generated by the PacBio platform (Supplementary Table 2). A 674.25 Mb genome sequence was obtained by genome assembly and polishing with a 45.05% GC content. Accordingly, the number of contig was 4,343 with a contig N50 of 282.54 kb (Supplementary Table 3). The read mapping rates of 95.33% and 99.79% and genome coverage rates of 99.57% and 99.94% determined for the Illumina and PacBio reads, respectively (Supplementary Table 4), indicated the consistency and accuracy of the genome assembly. For Hi-C sequencing, approximately 447,087,580 clean reads and a total of 66.92 Gb of clean data were obtained from the Illumina platform (Supplementary Table 2). After Hi-C data correction, 23 chromosomes were generated and 89.42% of the assembled sequences were anchored (Figures 1A, B). The genome size was 654.06 Mb, a contig and a scaffold N50 were approximately 291.52 kb and 25.26 Mb, respectively (Table 1; Supplementary Table 3). A comparison showed that more than 90% of the BUSCO core genes were completely identified for 5 Gadidae species (Table 1). Compared with G. morhua and L. lota, the contig N50 of G. macrocephalus, G. chalcogrammus and Melanogrammus aeglefinus (Haddock) was smaller (Table 1). But, the scaffold N50 of G. macrocephalus, G. morhua, G. chalcogrammus and L. lota reached more than 20 Mb, except for M. aeglefinus (Table 1). On the whole, the assembly of G. macrocephalus genome reached the level of chromosome, indicating that the assembly quality of the genome was relatively high. A 315.00 Mb repeat sequence was identified through homology alignment and de novo prediction, accounting for 48.16% of the genome of G. macrocephalus (Supplementary Table 5). The percentages of different types of repetitive sequences were as follows: 16.57% (108,408,781 bp) DNA TEs, 5.45% (35,649,299 bp) long interspersed nuclear elements (LINEs), 0.77% (5,034,419 bp) short interspersed nuclear elements (SINEs), 7.53% (49,245,913 bp) long terminal repeats (LTRs), 8.83% (57,742,721 bp) satellites and 0.07% (474,124 bp) simple repeats (Supplementary Table 6). The distribution of different TEs sequence divergence were observed with De novo and RepeatMasker method (Supplementary Figures 1A, B). After gene prediction, 23,843 protein-coding genes were identified in total, with an average of 9.27 exons per gene. The average length of each gene and its coding DNA sequence (CDS), exon and intron regions were 12,250 bp, 1,558 bp, 269.01 bp and 1,180 bp, respectively. The comparison of gene length, CDS length, exon length and intron length between G. macrocephalus and other teleost species were showed in Supplementary Figure 2. Based on multiple databases, the function of 22,581 (94.71%) protein-coding genes were annotated (Supplementary Table 7). For ncRNAs, a total of 4.44 Mb (0.68%) of ncRNA were predicted, including 58.21 kb of (0.01%) miRNA, 995.71 kb (0.15%) of tRNA, 1.35 Mb (0.21%) of rRNA, and 2.04 Mb (0.31%) of snRNA (Supplementary Table 8). BUSCO analysis showed that 3,295 (90.5%) BUSCO core genes were completely detected, including 3,241 (89.0%) single-copy genes and 54 (1.5%) multiple-copy genes, and missing BUSCO core genes accounted for 8.6% (311) of the genome (Supplementary Table 9). Among the 3,640 BUSCO groups searched, 3,195 (87.8%) of the complete BUSCOs were detected in the genome annotations (Supplementary Table 9). After gene family clustering, a total of 15,965 gene families involving 21,463 genes were found in the genome of G. macrocephalus, including 115 unique gene families and 7,733 common gene families (Figure 1C; Supplementary Table 10). The phylogenetic tree showed that G. macrocephalus was closely related to G. morhua and G. chalcogrammus, and the estimated divergence time between G. macrocephalus and G. morhua was ~5.7 (4.0-8.3) million years (Figure 1D). Compared with the common ancestor, the G. macrocephalus genome revealed that the number of expanded and contracted gene families was 148 and 1,389, respectively (Figure 1D). However, the genome of G. morhua contained 647 expanded and 273 contracted gene families. After filtering the results of CAFA5 with the P-value of 0.01, 73 expanded and 723 contracted gene families were obtained for G. macrocephalus. GO and KEGG pathway enrichment analysis displayed that the expanded gene families of G. macrocephalus participated in multiple pathways, such as G protein-coupled receptor activity (GO:0004930, P-value = 4.36e-11), calcium ion binding (GO:0005509, P-value = 1.24e-15), mRNA surveillance pathway (ko03015, P-value = 1.94e-06), metabolism of xenobiotics by cytochrome P450 (ko00980, P-value = 9.17e-07) and drug metabolism-cytochrome P450 (ko00982, P-value = 1.13e-06) (Supplementary Figures 3, 4). Conversely, some pathways, e.g., microtubule-based movement (GO:0007018, P-value = 5.44e-14), dynein complex (GO:0030286, P-value = 1.08e-19), proximal tubule bicarbonate reclamation (ko04964, P-value = 6.02e-04), GABAergic synapse (ko04727, P-value = 8.72e-05) and pathways of neurodegeneration - multiple diseases (ko05022, P-value = 1.05e-05) (Supplementary Figures 5, 6), were enriched in the GO and KEGG pathway enrichment analysis of the contracted gene families of G. macrocephalus. In addition, the genome synteny between G. macrocephalus and G. morhua showed that the collinearity and recombination of genes (Figure 1E).
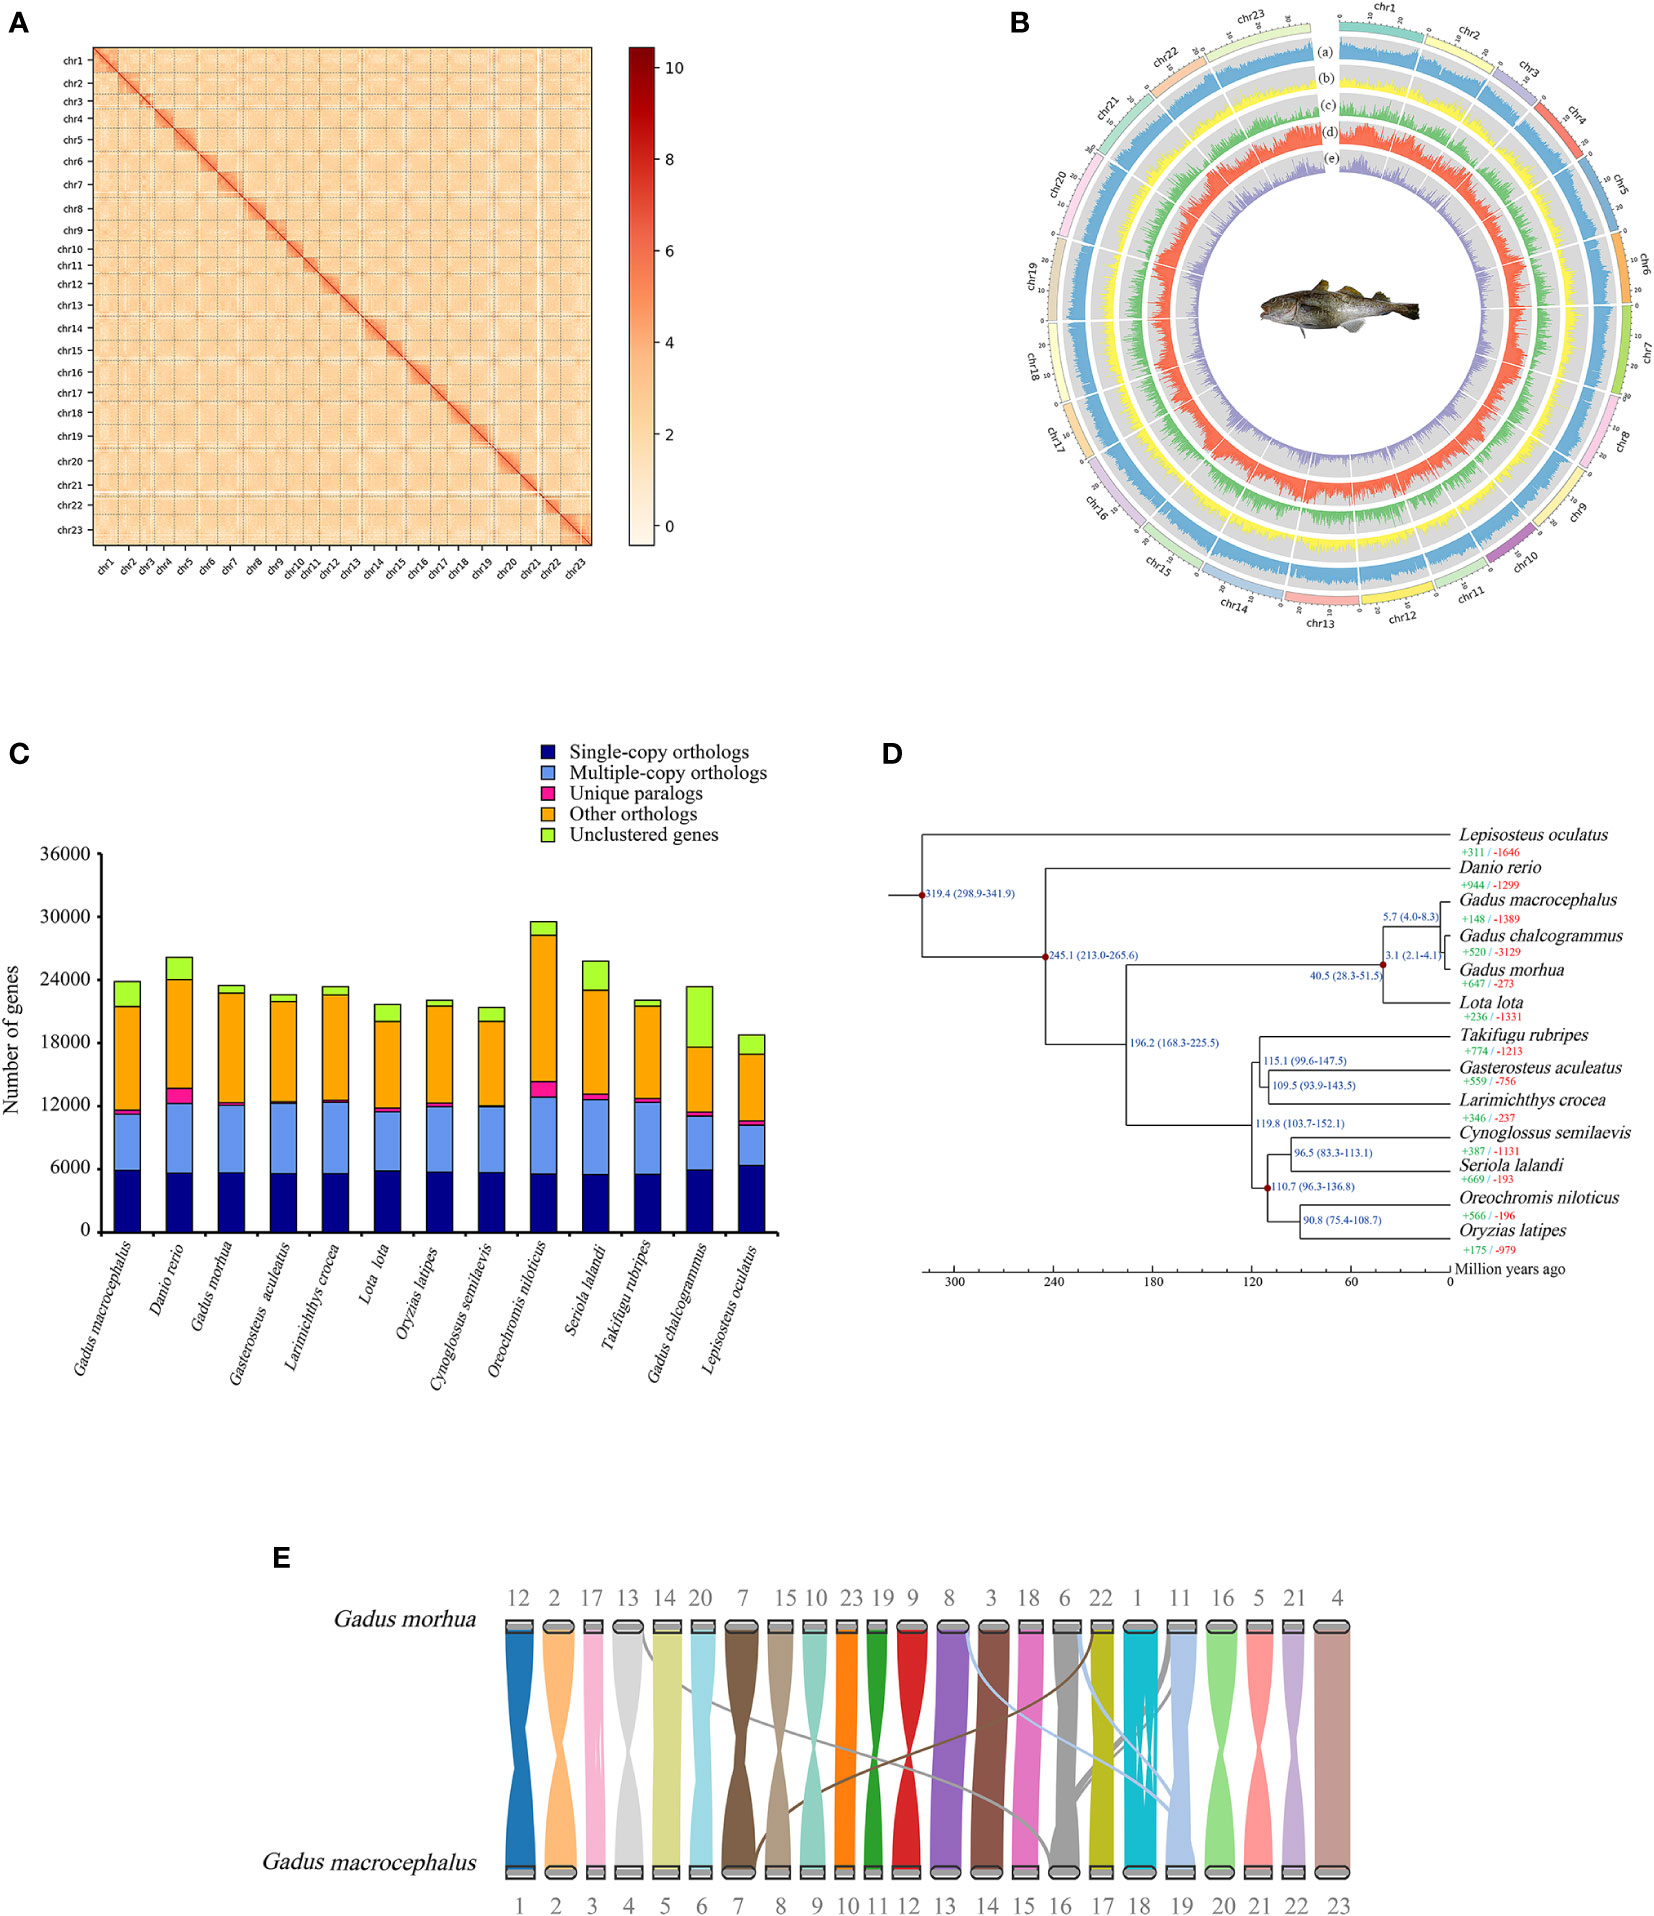
Figure 1 Characteristics of genome and summary of comparative genomics analysis. (A) 23 chromosomes of G. macrocephalus were obtained from genome assembly. (B) Statistics of genome annotation of G. macrocephalus. From outside to inside, the results correspond to: (a) GC content; (b) gene density; (c) CDS content; (d) repetitive sequence content; (e) LTR content. (C) Ortholog clustering results among 13 species. (D) Phylogenetic analysis of 13 species and analysis of gene family expansion and contraction. The red dots on the branches indicated the calibration points. The divergence time of 13 species was showed on the branches with blue numbers (Mya). The green and red numbers indicated the expanded and contracted gene families, respectively. (E) Genome synteny between G. macrocephalus and G. morhua.
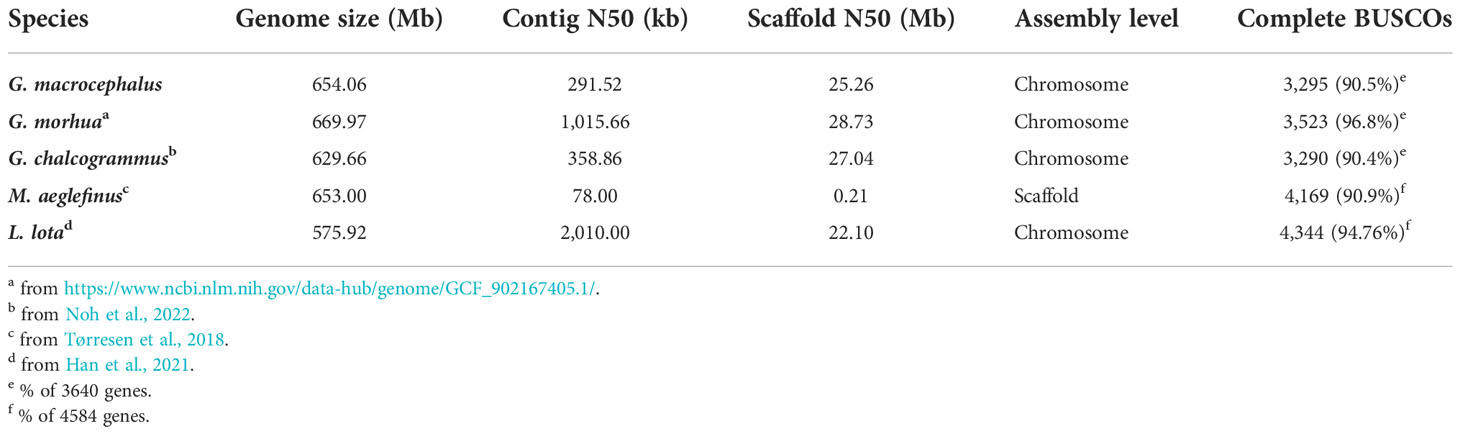
Table 1 Comparison of assembly statistics for the G. macrocephalus and other Gadidae species genome.
Data availability statement
The datasets presented in this study can be found in online repositories. The names of the repository/repositories and accession number(s) can be found below: https://www.ncbi.nlm.nih.gov/, SRR21531029, SRR21529723, SRR21531329, SRR21528393; https://bigd.big.ac.cn/gwh/, GWHBMBB00000000. All annotation files (repeats, proteins, CDS, gff) and genome were uploaded to the Figshare database (https://doi.org/10.6084/m9.figshare.21393969.v1).
Ethics statement
The animal study was reviewed and approved by Institutional Animal Care and Use Committee of First Institute of Oceanography, Ministry of Natural Resources. First Institute of Oceanography, Ministry of Natural Resources.
Author contributions
LLZ and SL designed the study. YL and CJ performed the collection of G. macrocephalus and extracted the DNA and RNA samples. YM and LZ performed genome assembly and evaluation, annotations. YM and SL performed comparative genomics. YM drafted the manuscript. CJ, SL, and LLZ revised the manuscript. All authors read and approved the final manuscript.
Funding
This work was supported by the National Natural Science Foundation of China (41706187).
Conflict of interest
The authors declare that the research was conducted in the absence of any commercial or financial relationships that could be construed as a potential conflict of interest.
Publisher’s note
All claims expressed in this article are solely those of the authors and do not necessarily represent those of their affiliated organizations, or those of the publisher, the editors and the reviewers. Any product that may be evaluated in this article, or claim that may be made by its manufacturer, is not guaranteed or endorsed by the publisher.
Supplementary material
The Supplementary Material for this article can be found online at: https://www.frontiersin.org/articles/10.3389/fmars.2022.1067526/full#supplementary-material
References
Bairoch A., Apweiler R. (2000). The SWISS-PROT protein sequence database and its supplement TrEMBL in 2000. Nucleic Acids Res. 28, 45–48. doi: 10.1093/nar/28.1.45
Benson G. (1999). Tandem repeats finder: A program to analyze DNA sequences. Nucleic Acids Res. 27 (2), 573–580. doi: 10.1093/nar/27.2.573
Birney E., Clamp M., Durbin R. (2004). GeneWise and genomewise. Genome Res. 14, 988–995. doi: 10.1101/gr.1865504
Burge C., Karlin S. (1997). Prediction of complete gene structures in human genomic DNA. J. Mol. Biol. 268, 78–94. doi: 10.1006/jmbi.1997.0951
Carson H., Mark Y. (2011). MAKER2: An annotation pipeline and GenomeDatabase management tool for second-generation genome projects. BMC Bioinform. 12, 491. doi: 10.1186/1471-2105-12-491
Chan P. P., Lowe T. M. (2019). Trnascan-SE: Searching for tRNA genes in genomic sequences. Methods Mol. Biol. 1962, 1–14. doi: 10.1007/978-1-4939-9173-0_1
Cheng H. Y., Concepcion G. T., Feng X. W., Zhang H. W., Li H. (2021). Haplotyperesolved De novo assembly using phased assembly graphs with hifiasm. Nat.Methods 18 (2), 170–175. doi: 10.1038/s41592-020-01056-5
Conesa A., Götz S., Garcıa-Gomez J. M., Terol J., Talön M., Robles M. (2005). Blast2GO: A universal tool for annotation, visualization and analysis in functional genomics research. Bioinformatics 21, 3674–3676. doi: 10.1093/bioinformatics/bti610
Dudchenko O., Batra S. S., Omer A. D., Nyquist S. K., Hoeger M., Durand N. C., et al. (2017). De novo assembly of the aedes aegypti genome using Hi-c yields chromosome-length scaffolds. Science 356 (6333), 92–95. doi: 10.1126/science.aal3327
Durand N. C., Robinson J. T., Shamim M. S., Machol I., Mesirov J. P., Lander E. S., et al. (2016b). Juicebox provides a visualization system for Hi-c contact maps with unlimited zoom. Cell Syst. 3 (1), 99–101. doi: 10.1016/j.cels.2015.07.012
Durand N. C., Shamim M. S., Machol I., Rao S. S., Huntley M. H., Lander E. S., et al. (2016a). Juicer provides a one-click system for analyzing LoopResolution Hi-c experiments. Cell Syst. 3, 95–98. doi: 10.1016/j.cels.2016.07.002
Edgar R. C. (2004). MUSCLE: Multiple sequence alignment with high accuracy and high throughput. Nucleic Acids Res. 32, 1792–1797. doi: 10.1093/molbev/msw054
Emms D. M., Kelly S. (2019). OrthoFinder: Phylogenetic orthology inference for comparative genomics. Genome Biol. 20, 238. doi: 10.1186/s13059-019-1832-y
FAO (2020). FAO fish stat J database. Available at: http://www.fao.org/fishery/statistics/software/fishstatj/en.
Grabherr M. G., Haas B. J., Yassour M., Levin J. Z., Thompson D. A., Amit I., et al. (2011). Full-length transcriptome assembly from RNA-seq data without a reference genome. Nat. Biotechnol. 29, 644–652. doi: 10.1038/nbt.1883
Han Z., Liu M., Liu Q., Zhai H., Xiao S., Gao T. (2021). Chromosome-level genome assembly of burbot (Lota lota) provides insights into the evolutionary adaptations in freshwater. Mol. Ecol. Resour. 21 (6), 2022–2033. doi: 10.1111/1755-0998.13382
Hart J. L., Clemens W. A. (1973). Pacific fishes of Canada. Bull. Fish. Res. Board Can. 47, 180–730. doi: 10.2307/1443050
Hu J., Fan J. P., Sun Z. Y., Liu S. L. (2020). NextPolish: A fast and efficient genome polishing tool for long-read assembly. Bioinformatics 36 (7), 2253–2255. doi: 10.1093/bioinformatics/btz891
Jones P., Binns D., Chang H. Y., Fraser M., Li W., McAnulla C., et al. (2014). InterProScan 5: Genome-scale protein function classification. Bioinformatics 30 (9), 1236–1240. doi: 10.1093/bioinformatics/btu031
Kim D., Paggi J. M., Park C., Bennett C., Salzberg S. L. (2019). Graph-based genome alignment and genotyping with HISAT2 and HISAT-genotype. Nat. Biotechnol. 37, 907–915. doi: 10.1038/s41587-019-0201-4
Kumar S., Stecher G., Suleski M., Hedges S. B. (2017). TimeTree: A resource for timelines, timetrees, and divergence times. Mol. Bio Evol. 34, 1812–1819. doi: 10.1093/molbev/msx116
Lang D., Zhang S., Ren P., Liang F., Sun Z., Meng G., et al. (2020). Comparison of the two up-to-date sequencing technologies for genome assembly: HiFi reads of pacific biosciences sequel II system and ultralong reads of Oxford nanopore. Gigascience 9 (12), giaa123. doi: 10.1093/gigascience/giaa123
Majoros W. H., Pertea M., Salzberg S. L. (2004). TigrScan and GlimmerHMM: Two open source ab initio eukaryotic gene-finders. Bioinformatics 20, 2878–2879. doi: 10.1093/bioinformatics/bth315
Manni M., Berkeley M. R., Seppey M., Simão F. A., Zdobnov E. M. (2021). BUSCO update: Novel and streamlined workflflows along with broader and deeper phylogenetic coverage for scoring of eukaryotic, prokaryotic, and viral genomes. Mol. Biol. Evol. 38 (10), 4647–4654. doi: 10.1093/molbev/msab199
Mendes F. K., Vanderpool D., Fulton B., Hahn M. W. (2020). CAFE 5 models variation in evolutionary rates among gene families. Bioinformatics 36 (22), 5516–5518. doi: 10.1093/bioinformatics/btaa1022
Nawrocki E. P., Eddy S. R. (2013). Infernal 1.1: 100-fold faster RNA homology searches. Bioinformatics 29 (22), 2933–2935. doi: 10.1093/bioinformatics/btt509
Noh E. S., Kang B. C., Kim J., Jeon J. H., Kim Y. O., Byun S. G., et al. (2022). Draft assembled genome of walleye Pollock (Gadus chalcogrammus). Front. Mar. Sci. 9. doi: 10.3389/fmars.2022.744941
Sakurai Y. (2007). An overview of the oyashio ecosystem. Deep Sea Res. Part II Top. Stud. Oceanogr. 54 (23), 2526–2542. doi: 10.1016/j.dsr2.2007.02.007
Sakurai Y., Hattori T. (1996). Reproductive behavior of pacific cod in captivity. Fish. Sci. 62, 222–228. doi: 10.2331/fishsci.62.222
Stamatakis A. (2014). RAxML version 8: A tool for phylogenetic analysis and post-analysis of Large phylogenies. Bioinformatics 30, 1312–1313. doi: 10.1093/bioinformatics/btu033
Stanke M., Schöffmann O., Morgenstern B., Waack S. (2006). Gene prediction in eukaryotes with a generalized hidden Markov model that uses hints from external sources. BMC Bioinf. 7, 62. doi: 10.1186/1471-2105-7-62
Tørresen O. K., Brieuc M. S. O., Solbakken M. H., Sørhus E., Nederbragt A. J., Jakobsen K. S., et al. (2018). Genomic architecture of haddock (Melanogrammus aeglefinus) shows expansions of innate immune genes and short tandem repeats. BMC Genomics 19 (1), 240. doi: 10.1186/s12864-018-4616-y
Tang H., Bowers J. E., Wang X., Ming R., Alam M., Paterson A. H. (2008). Synteny and collinearity in plant genomes. Science 320 (5875), 486–488. doi: 10.1126/science.1153917
Wu R., Li J. C., Zhang C., Pan X. D., Jiang T., Yang J., et al. (2021). Fine-scale variability in otolith chemistry: Application to the life history analysis of pacific cod (Gadus macrocephalus) in the yellow Sea. Estuar. Coast. Shelf S. 257, 107392. doi: 10.1016/j.ecss.2021.107392
Xu Z., Wang H. (2007). LTR_FINDER: An effificient tool for the prediction of full-length LTR retrotransposons. Nucleic Acids Res. 35, 265–268. doi: 10.1093/nar/gkm286
Keywords: Gadus macrocephalus, genome sequencing, chromosomal assembly, phylogenetics, comparative genomics
Citation: Ma Y, Li Y, Jiang C, Zheng L, Liu S and Zhao L (2022) High-quality chromosome-level genome assembly of Pacific cod, Gadus macrocephalus. Front. Mar. Sci. 9:1067526. doi: 10.3389/fmars.2022.1067526
Received: 12 October 2022; Accepted: 17 November 2022;
Published: 05 December 2022.
Edited by:
Montse Pérez, Spanish Institute of Oceanography (IEO), SpainReviewed by:
Chenguang Feng, Northwestern Polytechnical University, ChinaGuanpin Yang, Ocean University of China, China
Copyright © 2022 Ma, Li, Jiang, Zheng, Liu and Zhao. This is an open-access article distributed under the terms of the Creative Commons Attribution License (CC BY). The use, distribution or reproduction in other forums is permitted, provided the original author(s) and the copyright owner(s) are credited and that the original publication in this journal is cited, in accordance with accepted academic practice. No use, distribution or reproduction is permitted which does not comply with these terms.
*Correspondence: Linlin Zhao, emhhb2xpbmxpbkBmaW8ub3JnLmNu