 İsmet Saygu
 Ekin Akoglu
 Güzin Gül
 Dalida Bedikoğlu
 Nazli Demirel
- 1Fisheries Faculty, Cukurova University, Adana, Türkiye
- 2Institute of Marine Sciences, Middle East Technical University, Erdemli, Türkiye
- 3Institute of Marine Sciences and Management, Istanbul University, Istanbul, Türkiye
The Sea of Marmara (SoM), without doubt, is one of the most disturbed marine ecosystems of the Mediterranean basin. As a semi-enclosed and a recognized eutrophic basin, it has a unique natural characteristic by permanent stratification at ~25 m depth. The SoM ecosystem is under threat by multiple stressors from excessive nutrient enrichment, overfishing, invasive species, habitat loss to the climate change. Within this study, an assessment on the SoM ecosystem structure and functioning and its changes over time have been achieved. Hence, we firstly evaluate the SoM ecosystem over a period of three decades from the 1990s to the 2010s by using three mass-balance Ecopath models, secondly, we delineate the prevailing ecosystem structure and functioning in each period, thirdly we determine how the fishing impact contributed to the changes in the SoM since the 1990s and finally establish a baseline for the management and future studies of the ecosystem. The comparison of the models’ results for three consecutive time periods of the SoM showed that the energetic capacity of the ecosystem decreased significantly over the three decades while the decrease in cycling indices indicated that the SoM ecosystem became fragile to anthropogenic disturbances. According to ecosystem theory indices, the SoM is an immature ecosystem at a stage of autotrophic succession, with a very high total primary production, much more above unity that greatly exceeds total respiration. Our results highlighted that the SoM ecosystem was under bottom-up control exerted by mesozooplankton; however, anchovy was a bottleneck in energy transfers to higher trophic levels creating also a wasp-waist control in the food-web. The bycatch of demersal species with long life span, sharks and rays, brought them to the brink of going commercial extinction. Overall, the changes in the SoM ecosystem were due to the trophic cascades exerted by fisheries exploitation in addition to the changes in the productivity of the system. We conclude that the concomitant impacts of stressors on the SoM have been so diverse that an immediate action plan is required. Therefore, we propose a tentative outlook that will help in ecosystem monitoring and better management of the SoM.
Introduction
Overexploitation of marine fishery resources is known to degrade the productivity of fisheries and marine ecosystems around the world (Watson et al., 2013), with only a few exceptions of healthy fisheries as a result of good management practices (Froese et al., 2018). However, the precise level of exploitation is a matter of controversy among scientists (Worm et al., 2009; Froese et al., 2017). Existing fisheries statistics clearly indicate that the limits to the amount of fish that can be extracted from wild stocks have already been reached (Pauly and Zeller, 2016). Fishing directly affects the dynamics of stocks and its impacts can reach far beyond the targeted species through trophic cascades in the food web. Therefore, the delineation of ecosystem response to fisheries exploitation and other anthropogenic stressors; e.g., climate change, pollution, invasive species, is crucial to ensure and maintain a sustainable fishing activity and a healthy marine ecosystem. However, maintaining the existing volumes of catches and potentially increasing them will depend on our ability to rebuild depleted stocks (Froese et al., 2018; Palomares et al., 2020) and restore degraded ecosystem conditions.
The major changes in the size of a stock are attributed to the temporal dynamics of both predator and prey stocks, namely possible effects of density dependence on the development of stock biomass (Horbowy and Luzenczyk, 2016). The rebuilding of fish populations with low biomass to sustainable levels, aside from reducing fishing effort, is also dependent on their life history traits, food availability and trophic interactions amongst species (Hutchings and Reynolds, 2004; Audzijonyte and Kuparinen, 2016). Classical fisheries science theory proposes that when a stock is first fished, its catches initially increase and then stabilize at a maximum level and can be sustained long time if fishing effort is optimal. This level of stability is termed maximum sustainable yield (MSY, Beverton and Holt, 1957; Tsikliras and Froese, 2019; Pauly and Froese, 2021). Although drastic reductions in fishing pressure may contribute to fish biomass recoveries (Hutchings, 2000; Neubauer et al., 2013) unless there are cultivation/depensation effects already in play (Walters and Kitchell, 2001), the historically high overexploitation levels may result in slower recovery rates than predicted by stock assessment models (Neubauer et al., 2013). However, years long stock assessment and fisheries management practices have shown that changes in fishing and fisheries regulations (McGarvey et al., 2015) as well as environmental variability and climate change (Alheit et al., 2014; Tu et al., 2018) affect stock dynamics.
A healthy safety margin must remain in fisheries management practices to account for inter- and intra-trophic interactions such as prey-predator relationships, and competition for resources (Horbowy and Luzeńczyk, 2017) and changes in the carrying capacity of the ecosystems. Hiddink et al. (2016) found that the prey composition and abundance were remarkably affected by exploitation of predators which is, further, very important to determine their impact on life history characteristics of predator species from food intake to condition and growth rates, to spawning cycle and recruitment potential. Further, the exploited stocks, their relationships with their preys and predators are intertwined with the dynamics of lower-trophic-level organisms, primary producers and zooplankton, and affect the whole food web. Finally, fisheries exploitation can have cascading impacts (Daskalov, 2002), indirectly affecting plankton dynamics (Lynam et al., 2017) and the carrying capacity of the ecosystem. Uncontrolled fishing, combined with other human-induced effects, namely climate change and pollution, causes the resilience of marine ecosystems to weaken, their health to deteriorate and their changes become irreversible (Halpern et al., 2015). Delineating the impacts of anthropogenic activities such as fishing on the whole food web may provide knowledge for ecosystem approach to fisheries (EAF) management. Therefore, ecosystem models are useful tools to provide knowledge on the changes in structure and functioning of the aquatic ecosystems.
The Sea of Marmara (SoM) is a nearly enclosed basin and recognized as a biological corridor that connects the Mediterranean and the Black Seas via Bosphorus (Istanbul) and Dardanelles (Canakkale) Straits. The SoM is surrounded by the Marmara geographical region which is the most populated and most urbanized region in Turkey including Metropolitan city of Istanbul with a population of nearly 15.5 million, located in the northeast, and Gulf of İzmit in the east with the center of industrial activities. Over the last 30 years, the marine ecosystem of the SoM was changed by human induced pressures and it lost its large pelagic and demersal predator species (Demirel et al., 2023). In the 2000s, carnivorous pelagic species seriously decreased, 22 marine species with high trophic levels including swordfish (Xiphias gladius), leerfish (Lichia amia), angelshark (Squatina squatina) and picked dogfish (Squalus acanthias) have become commercially extinct, and biodiversity has evolved towards the dominance of planktivorous fish species (Ulman et al., 2020). Unhealthy conditions such as harmful phytoplankton blooms (Tas et al., 2020), population increase of gelatinous organisms (İşinibilir and Yılmaz, 2016), and the effect of climate change via increasing sea surface temperatures (Demirel et al., 2023) have been observed since the late 1990s. Being a continuously degraded ecosystem over the last thirty years, the SoM is in severe need of understanding the changes in the structure and functioning of its ecosystem under these multiple stressors for the development of EAF as well.
Here, we have developed for the first time a food-web model of the SoM by investigating the changes since the 1990s using trophodynamic mass-balance models set up to represent three decades separately; the 1990s, the 2000s and the 2010s. While we set up three models for each decade, we considered a series of changes reported in the SoM (Demirel et al., 2023); i) the 1990s are characterized with fast development of urbanization and industrialization especially in the Istanbul and surrounding area, ii) the 2000s are mainly dedicated to overfishing and serious eutrophication and pollution including increase in the frequency of harmful algal blooms, and iii) the 2010s are dedicated to public awareness and starting of pollution monitoring activities, a buyback programme in fisheries which lowered active number of fishing boats. In line with the different characteristics of the three decades, we first aimed to understand the state of the SoM ecosystem and then to compare outputs of the three models. Therefore, the objectives of our study were; i) describing the structure and functioning of the SoM ecosystem, ii) understanding the changes exerted by fisheries exploitation on the SoM food web, iii) determining the shifts in the structuring role of the organisms on the food web, and iv) delineating the energy flows between the trophic levels to develop advice for increasing the ecosystem’s well-being for ensuring sustainable use of the SoM’s living resources.
Material and methods
Study area and its fisheries
The SoM, a semi-enclosed basin with an area of 11,500 km2 (Figure 1), has a permanently stratified water column where upper low saline waters of the Black Sea enter from the Bosphorus Strait (upper ~20 m layer), while the Mediterranean Sea originated dense waters entering from Dardanelles Strait form the lower layer (> ~40 m) (Beşiktepe et al., 1994). It is recognized eutrophic and has an average primary productivity about 100 gC m-2 y-1 (Ergin et al., 1993). Due to strong stratification, the primary production is limited to the upper 25-30 m, where euphotic zone meets the pycnocline, and in addition to the Black Sea inflow and effluents, this high primary productivity significantly limits the light penetration (Ediger and Yilmaz, 1996; Altıok et al., 2014).
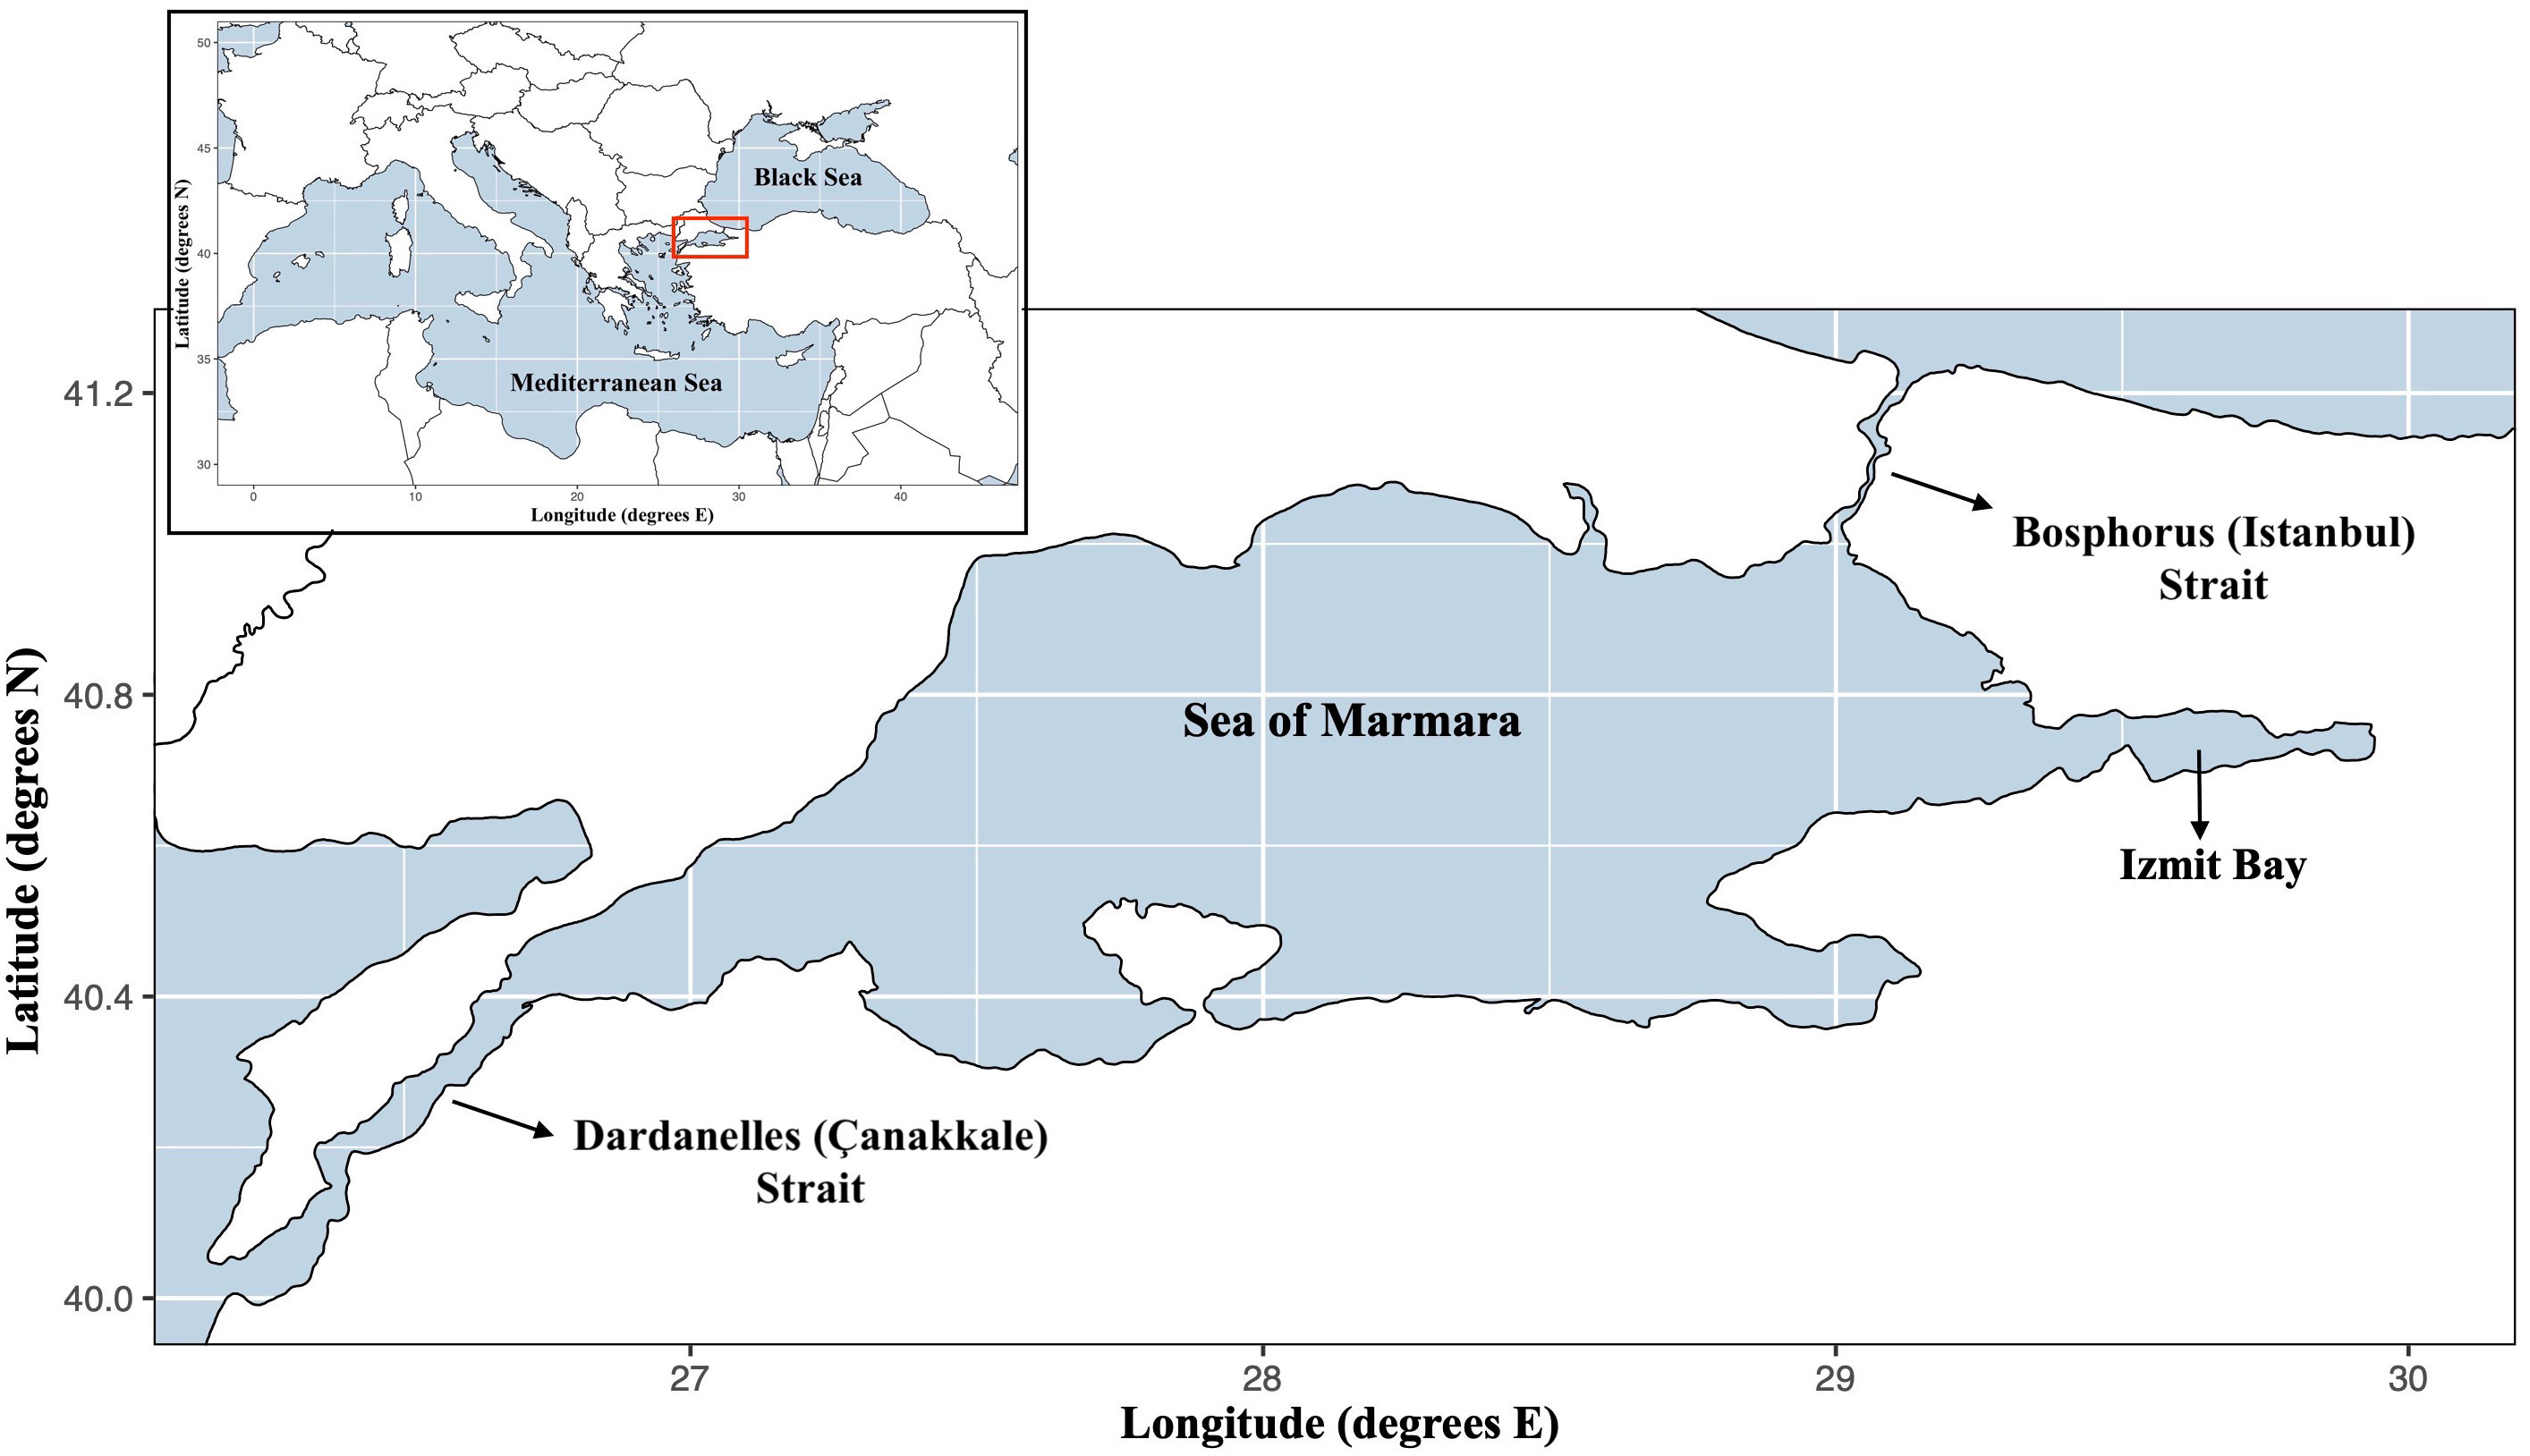
Figure 1 Modelling area: Sea of Marmara. The model area is limited by excluding the two strait systems of the Sea of Marmara.
The total fish production of the SoM increased by 39% in the 1980s compared to the 1970s (Supplementary Figure A1) due to the development of the fishing fleet by subsidies provided to the fishers and the increased demand by the establishment of fish oil factories during high industrialization era (Zengin et al., 2017). The annual total catch in the SoM dropped from approximately 45,000 tons during the 1980s to just over 30,000 tons in the 2010s (FAO, 2022). The fisheries characteristic is mainly coastal for benthic/demersal species by beam trawling and rest is pelagic fishery by gillnets and purse-seines during seasonal migrations of the target species (Yıldız et al., 2020). Although an average of 64 fish and 28 invertebrate species are subject to fisheries, up to 79% of the total catch consisted of anchovy, horse mackerel, and deep water rose shrimp and 10% percent of sardine, bluefish, bonito, whiting, and hake in 2020. The catches of medium pelagic and demersal fish dramatically decreased from a maximum of 20,000 tons in the 2000s to approximately 10,000 tons in the second half of the 2010s. Overall, the decrease in total catch has not greatly fluctuated since 2008 because the fishery in the SoM depends on small pelagics, mainly anchovy (Demirel et al., 2020). Therefore, ecological groups contributing to fisheries catches are mainly small pelagic fish, followed by benthic invertebrates, and small amount of medium pelagic and demersal fish (Supplementary Figure A1).
The Ecopath modelling approach
Three mass-balanced food-web models representing the average state of the SoM for 1993-97 (1990s), 2003-07 (2000s), and 2013-17 (2010s) were developed using Ecopath with Ecosim (EwE) version 6.6.7 (Christensen et al., 2005). In Ecopath modelling, two master equations constitute the energy and mass balances (Christensen and Walters, 2004):
Consumption = production + respiration + unassimilated food
Production = catches + predation mortality + net migration + biomass accumulation + other mortality
The latter equation can be re-expressed as:
where, for group i, Pi is the total production, Yi is the total catch rate, Bi is the biomass, M2i is the total predation rate per year; Ei is the net migration rate per year (emigration - immigration); BAi is the biomass accumulation rate per year and EEi is the ecotrophic efficiency and M0i=Pi*(1−EEi) is the annual ‘other mortality’ rate due to old age, diseases and starvation. Biomass (B), Production/Biomass (P/B), Consumption/Biomass (Q/B) or Production/Consumption (P/Q), and Ecotrophic Efficiency (EE) are the four basic input parameters and three of them need to be provided and then the remaining parameter can be estimated by the model. If gross growth efficiency; i.e., Production/Consumption (P/Q) ratio, is entered, then Q/B or P/B ratio can be omitted and is estimated by Ecopath. In addition, a matrix of relative diet compositions by weight is required as input.
The food web topology (number of compartments, links between compartments, etc.) and methodology of construction for the Ecopath models were identical in all three models allowing their outputs to be directly compared (Heymans et al., 2014; Heymans et al., 2016). All models were balanced using the same diet matrix to ensure similar topology (Supplementary Table A5), with the differences being the biomasses and the catches estimated for the different periods.
We followed best practice guidelines presented by Heymans et al. (2016) to balance the models. Pre-balance (PREBAL) diagnostics (Supplementary Figures A2–A4) were used to check the slopes of B, P/B and Q/B across trophic levels before the model was balanced (Link, 2010; Heymans et al., 2016). Further, the pedigree routine, which assigns a different uncertainty range to each data used to parameterize an Ecopath model based on its source; e.g., from surveys, published literature, guesstimates or similar species/ecosystems, was used to calculate the pedigree index to assess the quality of the input data used in the models.
Default procedures were used to ensure mass-balance for the three models. The models were considered balanced when ecotrophic efficiencies were smaller than unity (EE<1), gross growth efficiencies (P/Q ratios) ranged between 0.1 and 0.3 as per the 2nd law of thermodynamics, respiration to assimilation (R/A) and production to respiration (P/R) ratios were lower than unity, and respiration to biomass (R/B) ratios were in the range of 1-10 year-1 for fish groups (Christensen and Walters, 2004; Darwall et al., 2010; Heymans et al., 2016).
Input parameters and functional groups
The Sea of Marmara was represented with a total of seventeen functional groups (FGs) and species, from primary producers to top predators including two planktonic groups, one invertebrate group, one invertebrate and eleven fish species, and one detritus group as well as dolphins (Table 1). We defined functional groups mainly based on their commercial importance as well as considering trophic diversity of the SoM ecosystem. Specifically, modeled main target species were anchovy (Engraulis encrasicolus), sardine (Sardina pilchardus), Mediterranean horse mackerel (Trachurus mediterraneus), Atlantic bonito (Sarda sarda), bluefish (Pomatomus saltatrix), European hake (Merluccius merluccius), whiting (Merlangius merlangus), turbot (Scophthalmus maximus), mullets (Mullus spp.) thornback ray (Raja clavata), picked dogfish (Squalus acanthias), and deep water rose shrimp (Parapenaeus longirostris). In addition, three fishing fleets, purse seiners, beam trawlers and gillnetters were included in the model. Since there was no regional statistical data describing species-specific catch by fishing fleet, purse seiners, beam trawlers and gillnetters are considered majorly responsible for fish removals based on the questionnaire survey that was carried out amongst local fishermen by Akyol and Perçin (2006) and field study on by-catch amounts by fishing gear in the Marmara Sea by Yazıcı et al. (2006). Purse seiners were the main fishing fleet catching European anchovy and pilchard. Both purse seiners and gillnetters targeted horse mackerel, bluefish and Atlantic bonito. Beam trawlers, on the other hand, was responsible for catching mainly deep water rose shrimp, and by-catching whiting, European hake, mullets and thornback rays. European hake, turbot, mullets, thornback ray and picked dogfish were largely caught by gillnets.
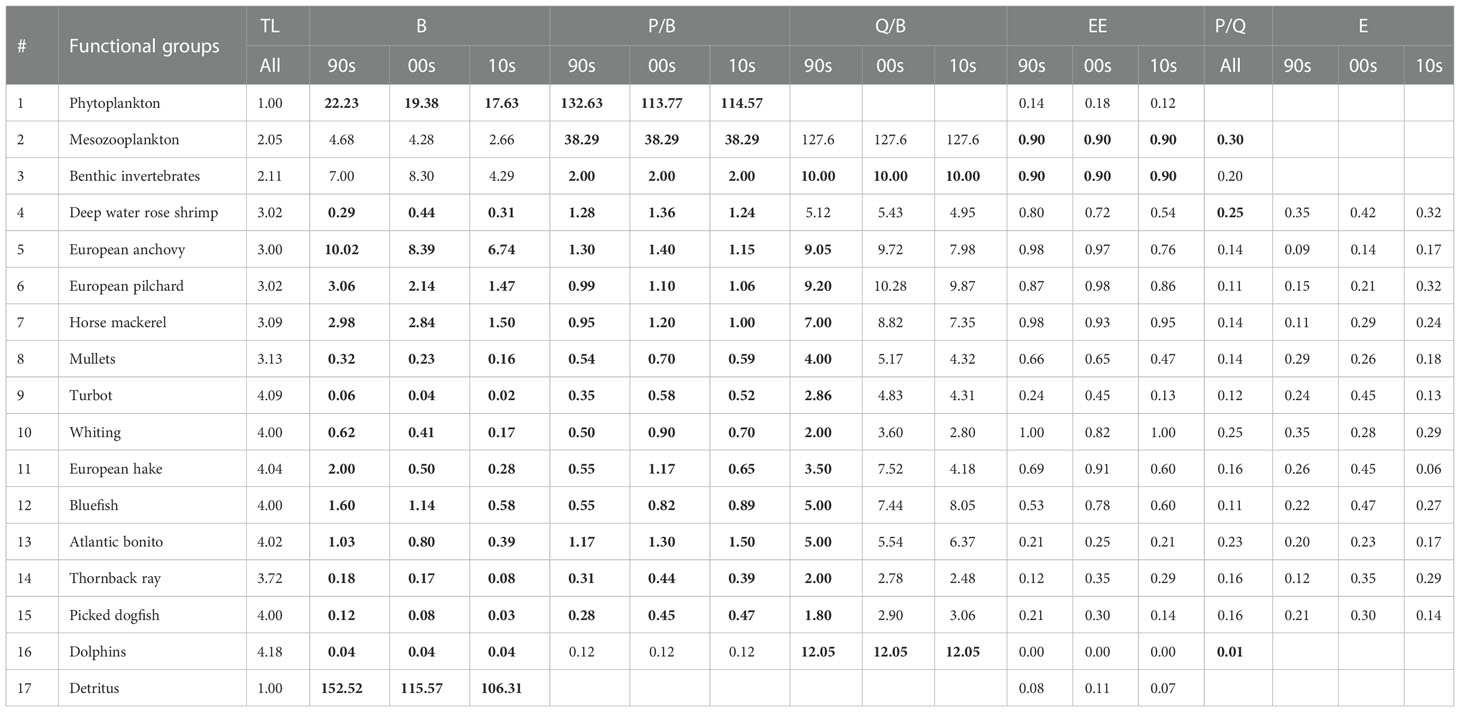
Table 1 Inputs (bold) and outputs of the Sea of Marmara (SoM) models by functional groups: Trophic level (TL); biomass (B, t km-2); production/biomass (P/B, y-1); consumption/biomass (Q/B, y-1); ecotrophic efficiency (EE); production/consumption (P/Q); exploitation rate (E=F/Z); SoM 1990s model (90s); SoM 2000s model (00s); SoM 2010s model (10s).
Input parameters for the species and functional groups were mainly obtained from published literature and unpublished information in the study area such as national reports and dissertations. For fished groups, biomass (B, tonnes) and fishing mortality (F, y-1) values were obtained from the only stock assessment study based on catch-based analysis in the SoM (Demirel et al., 2020). Many countries such as Turkey lack detailed long-term data sets for fish stocks which are needed for the evaluation of proper stock assessment practice, and SoM stocks are defined in the “data-poor stocks” category (FAO, 2022). Existing data are mostly limited to 2/3-year data sets which themselves are not planned properly to provide what is needed to understand trends easily. Demirel et al. (2020) provided the first stock assessment study to the commercial fish stocks of the SoM between the years 1967-2020 through implementation of the catch-based data-limited CMSY method (Froese et al., 2017). The annual landings (tonnes) of the species were extracted from the General Fisheries Commission for the Mediterranean (GFCM) database of United Nations Food and Agriculture Organization (FAO) for the study period (FAO, 2022). The P/B ratios were calculated for each model assuming that the P/B ratio is equivalent to the total mortality (Z, y-1) under steady-state conditions (Allen, 1971) and Z is equal to the sum of fishing mortality (F, y-1) and natural mortality (M, y-1). Therefore, P/B ratios for fishes were calculated by adding fishing mortality values from the CMSY analysis to the estimated natural mortality values using empirical equation by Pauly (1980). The Q/B ratios were calculated following Palomares and Pauly (1998) for fish groups and for other groups details are provided in Supplementary Table A1. Production/Consumption (P/Q) ratios were obtained from the 1990s Ecopath model and were assumed not to be time-dependent, and therefore, used to estimate the Q/B ratios in the 2000s and 2010s models. Functional group-specific descriptions of the input data, including B, P/B, Q/B, EE, P/Q, and catch were given in the Supplementary Table A2. Diet composition data were extracted from published studies preferably from the SoM or adjacent areas, western Black Sea and/or northern Aegean Sea (Supplementary Table A3).
Ecological indices for ecosystem structure
The trophic flows in the food web were investigated using discrete trophic levels (TL) and integrated trophic flows by TL. The flows were demonstrated using Lindeman spine graphs (Lindeman, 1942; Ulanowicz, 1986).
The food web characteristics were investigated using synthetic ecological indicators. We classified the indicators under four categories, ecosystem theory indicators, fishery indicators, cycling indicators, and information indicators. Ecosystem theory indicators describe ecosystem structure and characteristics. Total system throughput (TST) is the sum of all flows in the food web and composed of total consumption, total export, total respiration, and total flows into detritus (Finn, 1976). In our models, total export only included total catch. Transfer efficiency (TE) is the efficiency of energy flow that passed from a trophic level to the next level (Lindeman, 1942). Its geometric mean for TLII – TLIV is the mean transfer efficiency (Christensen et al., 2005). In addition, sum of all production, calculated total net primary production, net system production, total biomass, total primary production/total respiration, total primary production/total biomass and total biomass/total throughput, mean trophic level of the community (mTLco), system omnivory index (SOI) that shows the breadth of feeding interactions in the food web (Christensen et al., 2005), and Shannon diversity index (Clarke and Warwick, 2001) were used.
Fishery indices are related to the exploitation status of the ecosystem and included total catch, gross efficiency (catch/net p.p.), the exploitation rates (E) of the functional groups (E=F/Z), the relative primary production required (%PPRc) to sustain the catches (Christensen and Pauly, 1993; Pauly and Christensen, 1995), cumulative exploitation rate (CumE) (Agnetta et al., 2019), and mean TL of the catch (mTLc) (Pauly et al., 1998). Further, ratios of predatory and demersal fishes to forage fish species, which are expected to decrease in time with exploitation, were calculated to investigate the fishing down the food web effect (Shannon et al., 2009).
The throughput cycled, predatory cycling index (PCI, % throughput excluding detritus), Finn’s cycling index (FCI), and Finn’s mean path length were calculated to investigate the degree and efficiency of material and energy cycling in the food web. FCI is the recycled part of the TST in an ecosystem and Finn’s mean path length (PL) is the average number of groups through which a unit of flow travels. FCI and PL are desired to have higher values in a healthy ecosystem. Further, FCI and Finn’s mean path length are related to the recovery time of an ecosystem after perturbations (Finn, 1976).
Ascendency (A), development capacity (C, upper limit of ascendency) and overhead (resilience) (O=C-A) were calculated as information indices. Ascendency shows the organizational status of the network of energy flows in food web. Highly organized food webs would have high ascendency. Ascendency is also linked with resilience of the ecosystem, the ability to withstand perturbations/stress (Ulanowicz, 2004; Heymans and Tomczak, 2016). The sum of ascendency and resilience is the development capacity of an ecosystem. Ascendency can be defined as the ability of a system to recover from stress. In a healthy ecosystem, a balanced degree of ascendency and resilience is desired because a healthy ecosystem is the one that is resilient to stress and has the potential to recover quickly after stress (Costanza and Mageau, 1999).
Mixed trophic impact (MTI) analysis was performed to relatively quantify both direct and indirect impacts of functional groups, including fisheries, on other groups (Ulanowicz and Puccia, 1990). In addition, the index of keystoneness (Power et al., 1996) was used to define important functional groups in maintaining ecosystem structure and function. Keystone groups/species are groups/species that have structuring role in the ecosystem although they have relatively low biomasses (Libralato et al., 2006).
Results
The SoM model was defined with 17 FGs (Table 1) from primary producer and detritus to dolphins. Trophic levels (TL) ranged from 1.0 for the primary producers and detritus group to 4.18 for the dolphins and the fishes with TLs above 4 were turbot (4.09), hake (4.04), bluefish (4.00) and Atlantic bonito (4.02). Among other species, anchovy had the lowest TL (3.00) in relation to its diet that consisted of phytoplankton and zooplankton. The deep-water rose shrimp had the same trophic level with sardine (3.02) (Table 1).
The pedigree index calculated by the model was 0.41 (Table 2). Our functional groups are mostly around the slope line in the PREBAL plots of B, P/B and Q/B and therefore indicated integrity; however, B, P/B and Q/B values of mullets, deep water rose shrimp, thornback ray and picked dogfish may potentially be underestimated and biomass and P/B values of bluefish, Atlantic bonito and European hake and Q/B value of dolphins may potentially be overestimated (Supplementary Figures A2–A4).
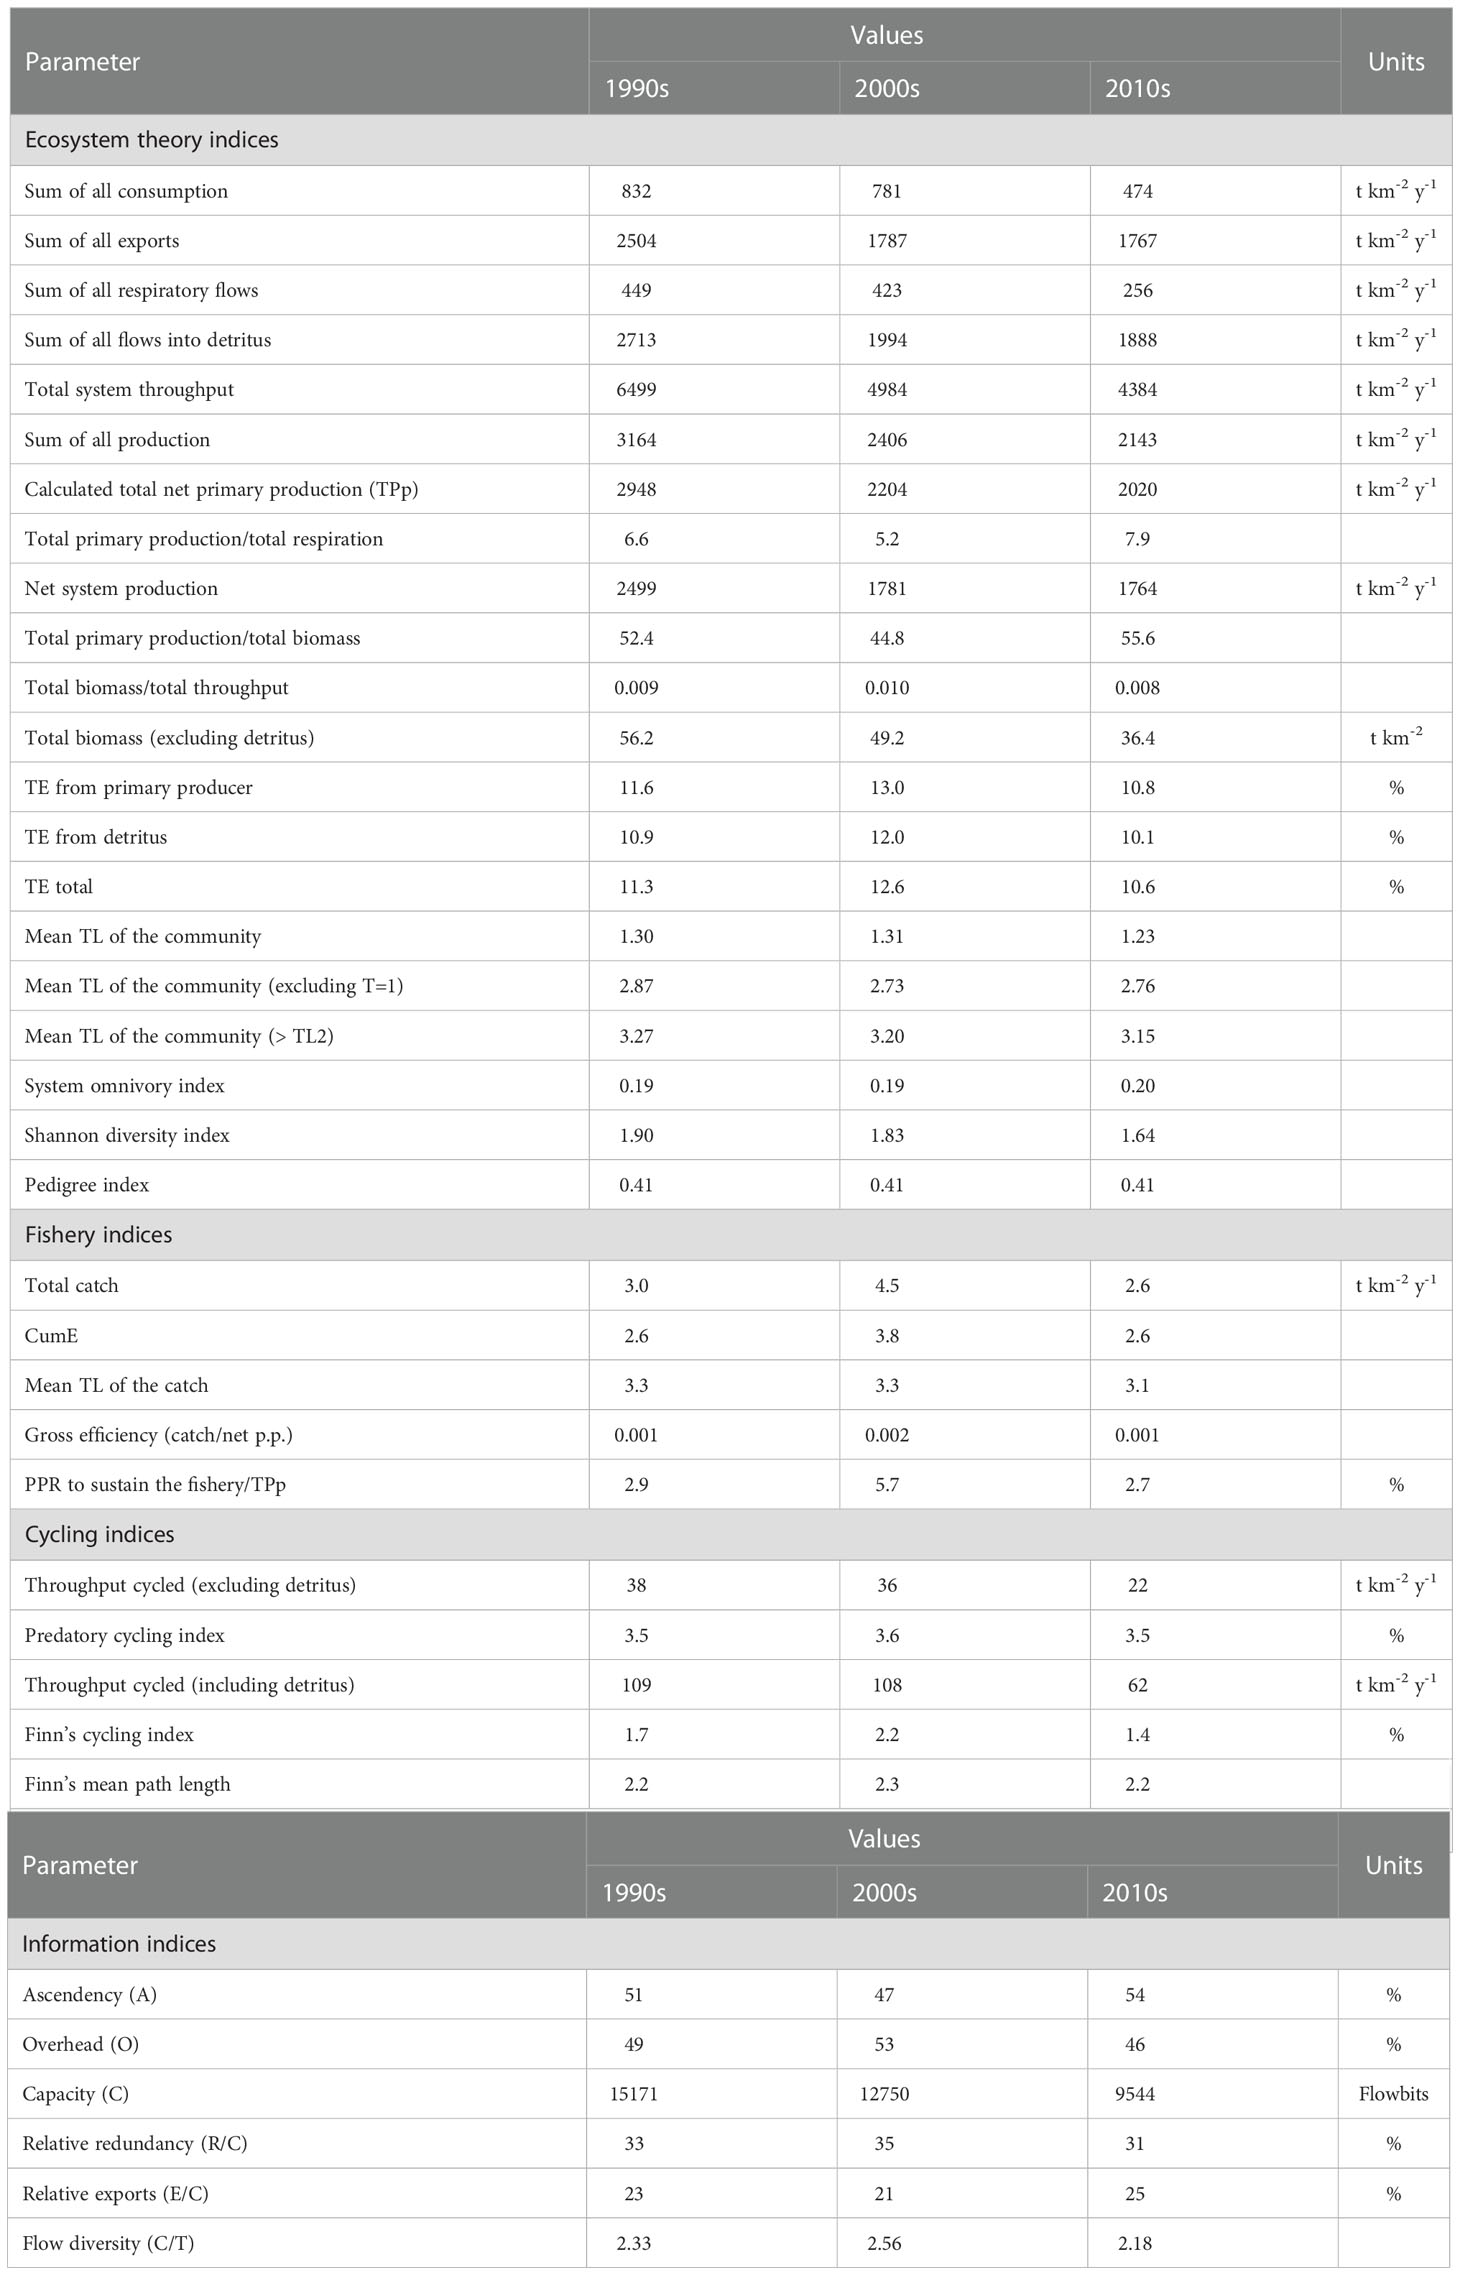
Table 2 Ecosystem and fishery indicators for the models.
Ecosystem description
The food web structure was characterized via flow diagrams demonstrating trophic positions and relations between functional groups (Figure 2).
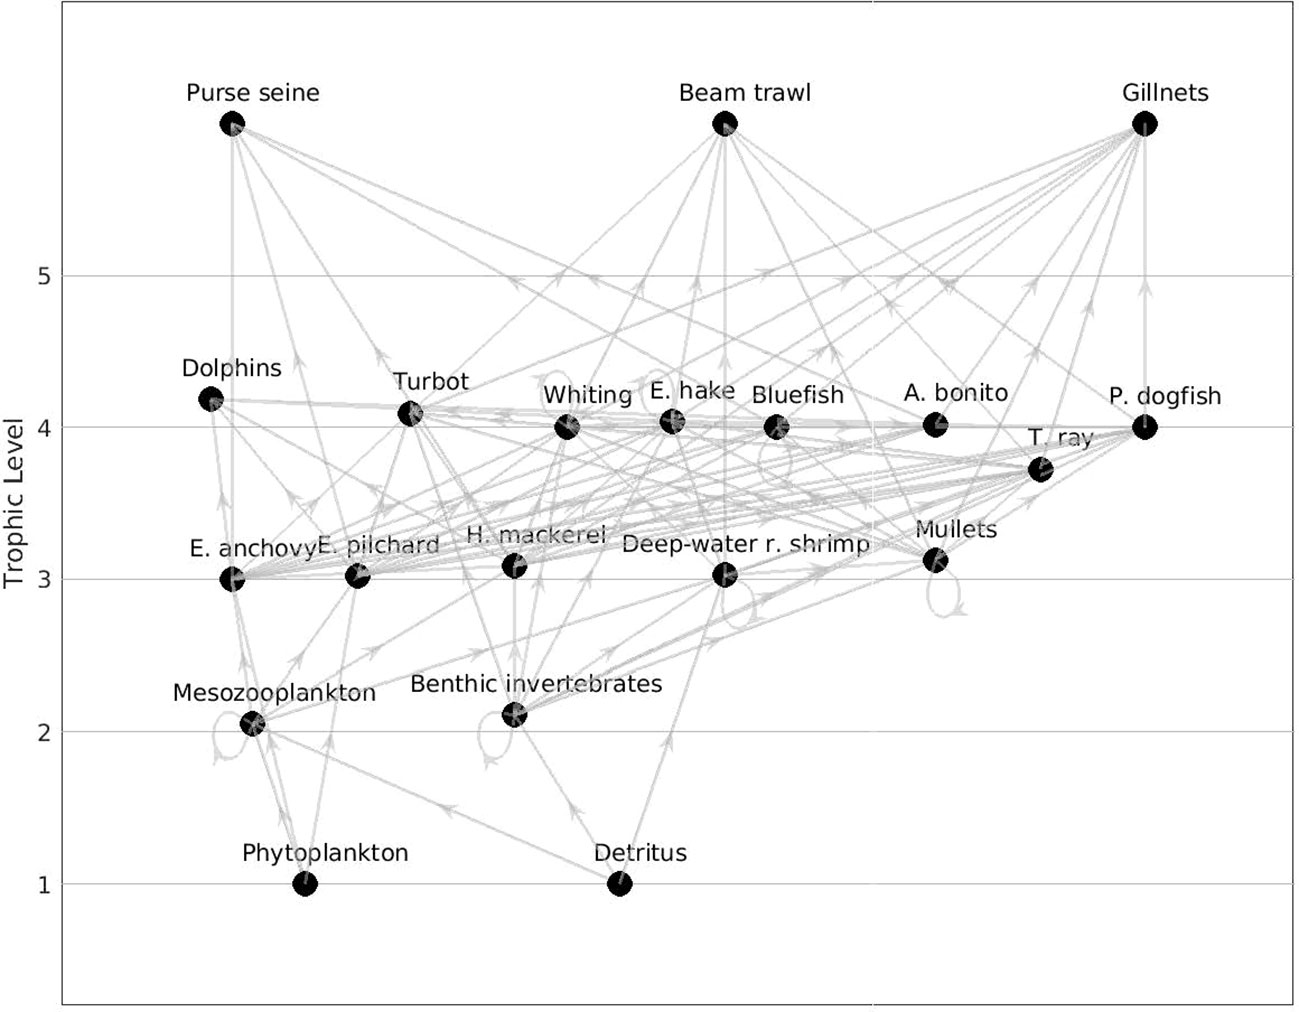
Figure 2 Flow diagram of the Sea of Marmara food web model representing the time period 1993 – 1997 (1990s).
The total system throughput (TST) was 6499 t km-2 y-1 in the 1990s model and consisted of 42% flows into detritus, 38% exports, 13% consumption, and 7% respiration. Although TST decreased to 4984 t km-2 y-1 in the 2000s and 4384 t km-2 y-1 in the 2010s, the proportions of the flows were similar as in the 1990s model (Table 2). From the 1990s to 2010s the relative ratio of system’s ascendency increased from 51% to 54% while its overhead (resilience) decreased from 49% down to 46%. Total system biomass (excluding detritus) decreased from 56.2 t km-2 in the 1990s to 49.2 in the 2000s (13%) and 36.4 in the 2010s (35%). The mean trophic level of the community (> 2) was 3.27 in the 1990s, 3.20 in the 2000s, and 3.15 in the 2010s (Table 2). The mean TE of the system was highest in the 2000s with 12.6% and 11.3% in the 1990s and 10.6% in the 2010s. The relative throughput cycled considering the parts excluding and including detritus decreased more than 40% from the 1990s to the 2010s. PCI and FCI also decreased throughout the decades indicating a degradation in the material recycling in the ecosystem (Table 2).
The biomass of benthic invertebrates and deep-water rose shrimp increased in the 2000s before declining in the 2010s, the biomass of dolphins have remained constant, and the biomass of all other functional groups decreased over the decades (Table 1). The changes in the biomasses from the 1990s to the 2010s were remarkable in all other functional groups. The highest decrease was observed in hake with 75% from the 1990s to the 2000s and 86% from the 1990s to the 2010s. The decrease from the 2000s to the 2010s was 44% for hake. The cumulative biomass of small pelagic fishes (anchovy, pilchard and horse mackerel), demersal predator fishes (turbot, whiting and hake), medium pelagic predator fishes (bluefish and Atlantic bonito), and shark and skate (picked dogfish + thornback ray) decreased by 17%, 65%, 26% and 18% from the 1990s to the 2000s and 40%, 83%, 63% and 64% from the 1990s to the 2010s, respectively. These results highlighted that significant decreases occurred in the biomasses of the predator fishes. The biomass ratio of medium pelagic predator fishes to small pelagic (forage) fishes decreased from 16% in the 1990s to 10% in the 2010s. Further, the ratio of demersal predator fish to forage fish decreased from 17% to 5% in the 2010s.
The SoM food web was integrated into five integer trophic levels and the energy flows through the trophic levels are shown using Lindeman Spine (Figure 3). Excluding TL I, the highest TST (%), biomass, respiration and flow to detritus were estimated for TL II and TL III where energy was also transferred most efficiently. The grazing flows from primary producers to TL II decreased significantly from 423.1 t km-2 y-1 in the 1990s to 240.7 t km-2 y-1in the 2010s and the primary productivity of the ecosystem decreased significantly from 2948 t km-2 y-1 in the 1990s to 2204 t km-2 y-1and 2020 t km-2 y-1 in the 2000s and the 2010s, respectively. In addition, flow from detritus to TLII remarkably decreased from the 1990s to the 2010s. However, the proportion of the flows from primary producers (grazing food chain) to flows from detritus (detrital food chain) was around 66% in all three periods indicating the dominance of the grazing food chain in the SoM. Results showed that biomasses and the energy, respiratory and detrital flows corresponding to each TL decreased throughout the periods. The energy transfer efficiencies between trophic levels gradually decreased; however, did not change significantly from the 1990s to the 2010s. A slight decrease from 13% in the 1990s to 11% in the 2010s occurred in the transfer efficiencies of flows from TL III to TL IV. The highest total export by fisheries occurred in TL III and followed by TL IV in all models and the total export in the 2000s model were higher than the other models.
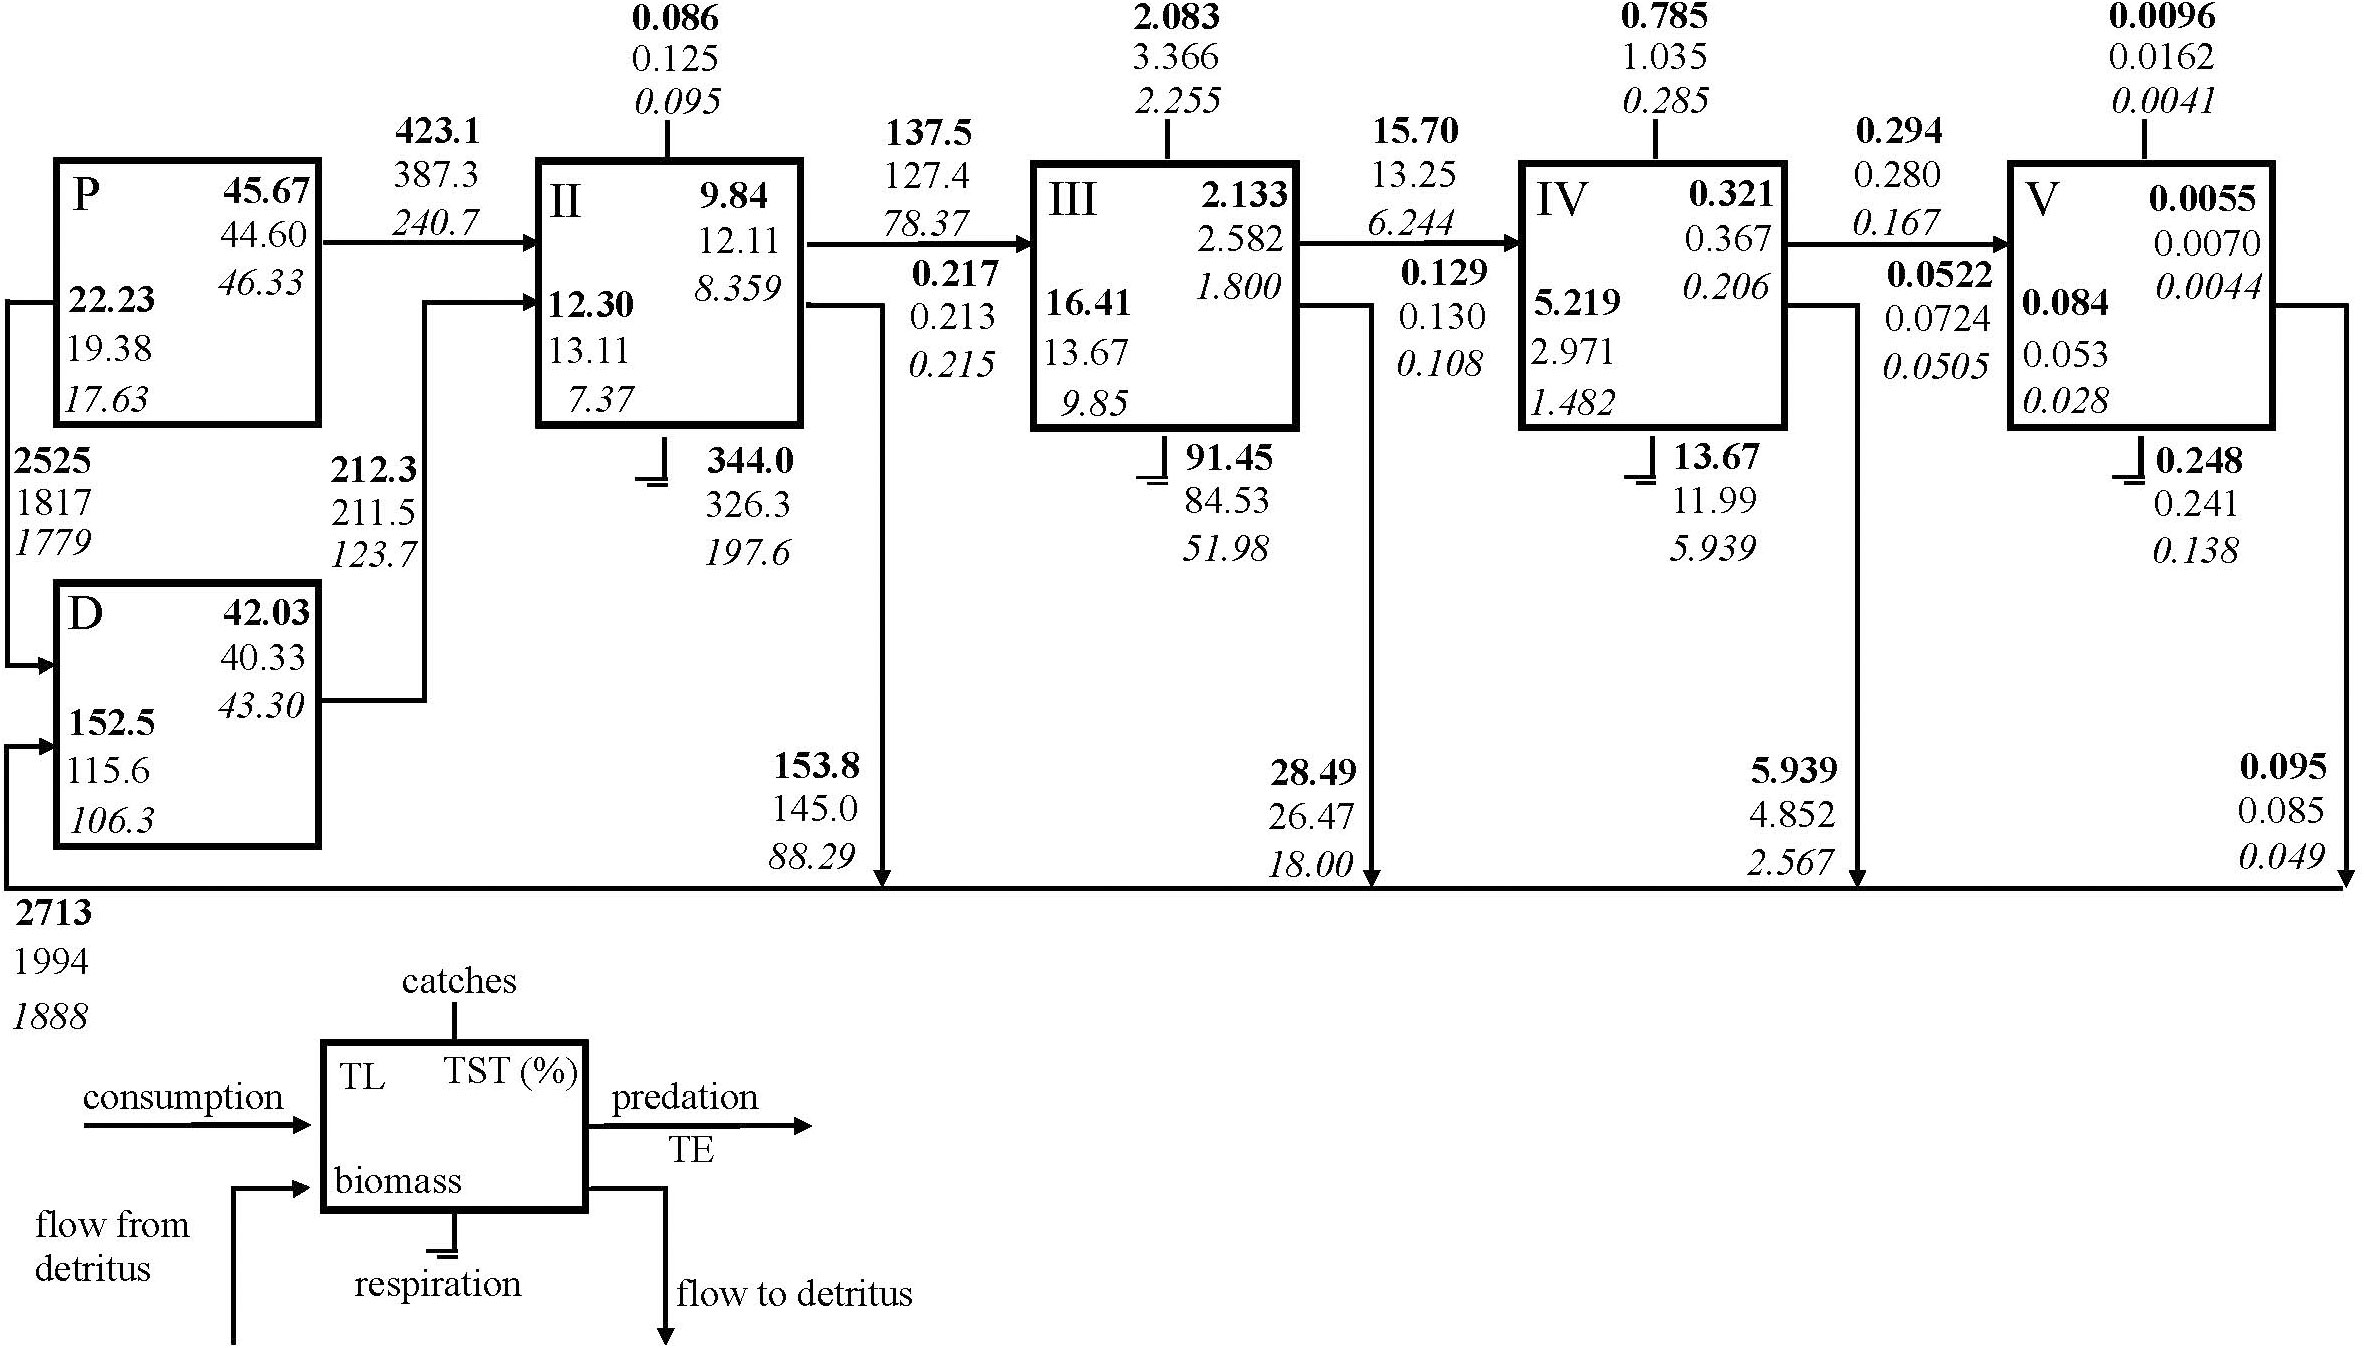
Figure 3 Lindeman spine showing trophic flows among integer trophic levels (TL). Primary producer (P); detritus (D); Total system throughput (TST); Transfer efficiency (TE); SoM 1990s model (bold); SoM 2000s model (normal); SoM 2010s model (italic).
Ecological roles of functional groups
Mesozooplankton and benthic invertebrates, small pelagic fishes, particularly anchovy, and top predator fishes, particularly hake and bluefish, had significant direct and indirect impacts throughout the food web (Figure 4). Mesozooplankton had the highest relative total impact and was the keystone species in the 1990s and was followed by anchovy both in terms of keystoneness and relative total impact (Figure 5). Benthic invertebrates came third in the 1990s in terms of keystoneness and relative total impact. However, the trophic dynamics started to change after this decade. In particular, relative total impact of mesozooplankton decreased from 1.0 in the initial decade to 0.93 in the 2000s and 0.9 in the 2010s (Figure 5) and anchovy had the highest relative total impact in the 2010s. However, in all periods mesozooplankton was the keystone group in the ecosystem and followed by anchovy. The keystoneness (and also relative total impact) of bluefish from the 1990s to the 2010s increased significantly from -0.515 to -0.385.
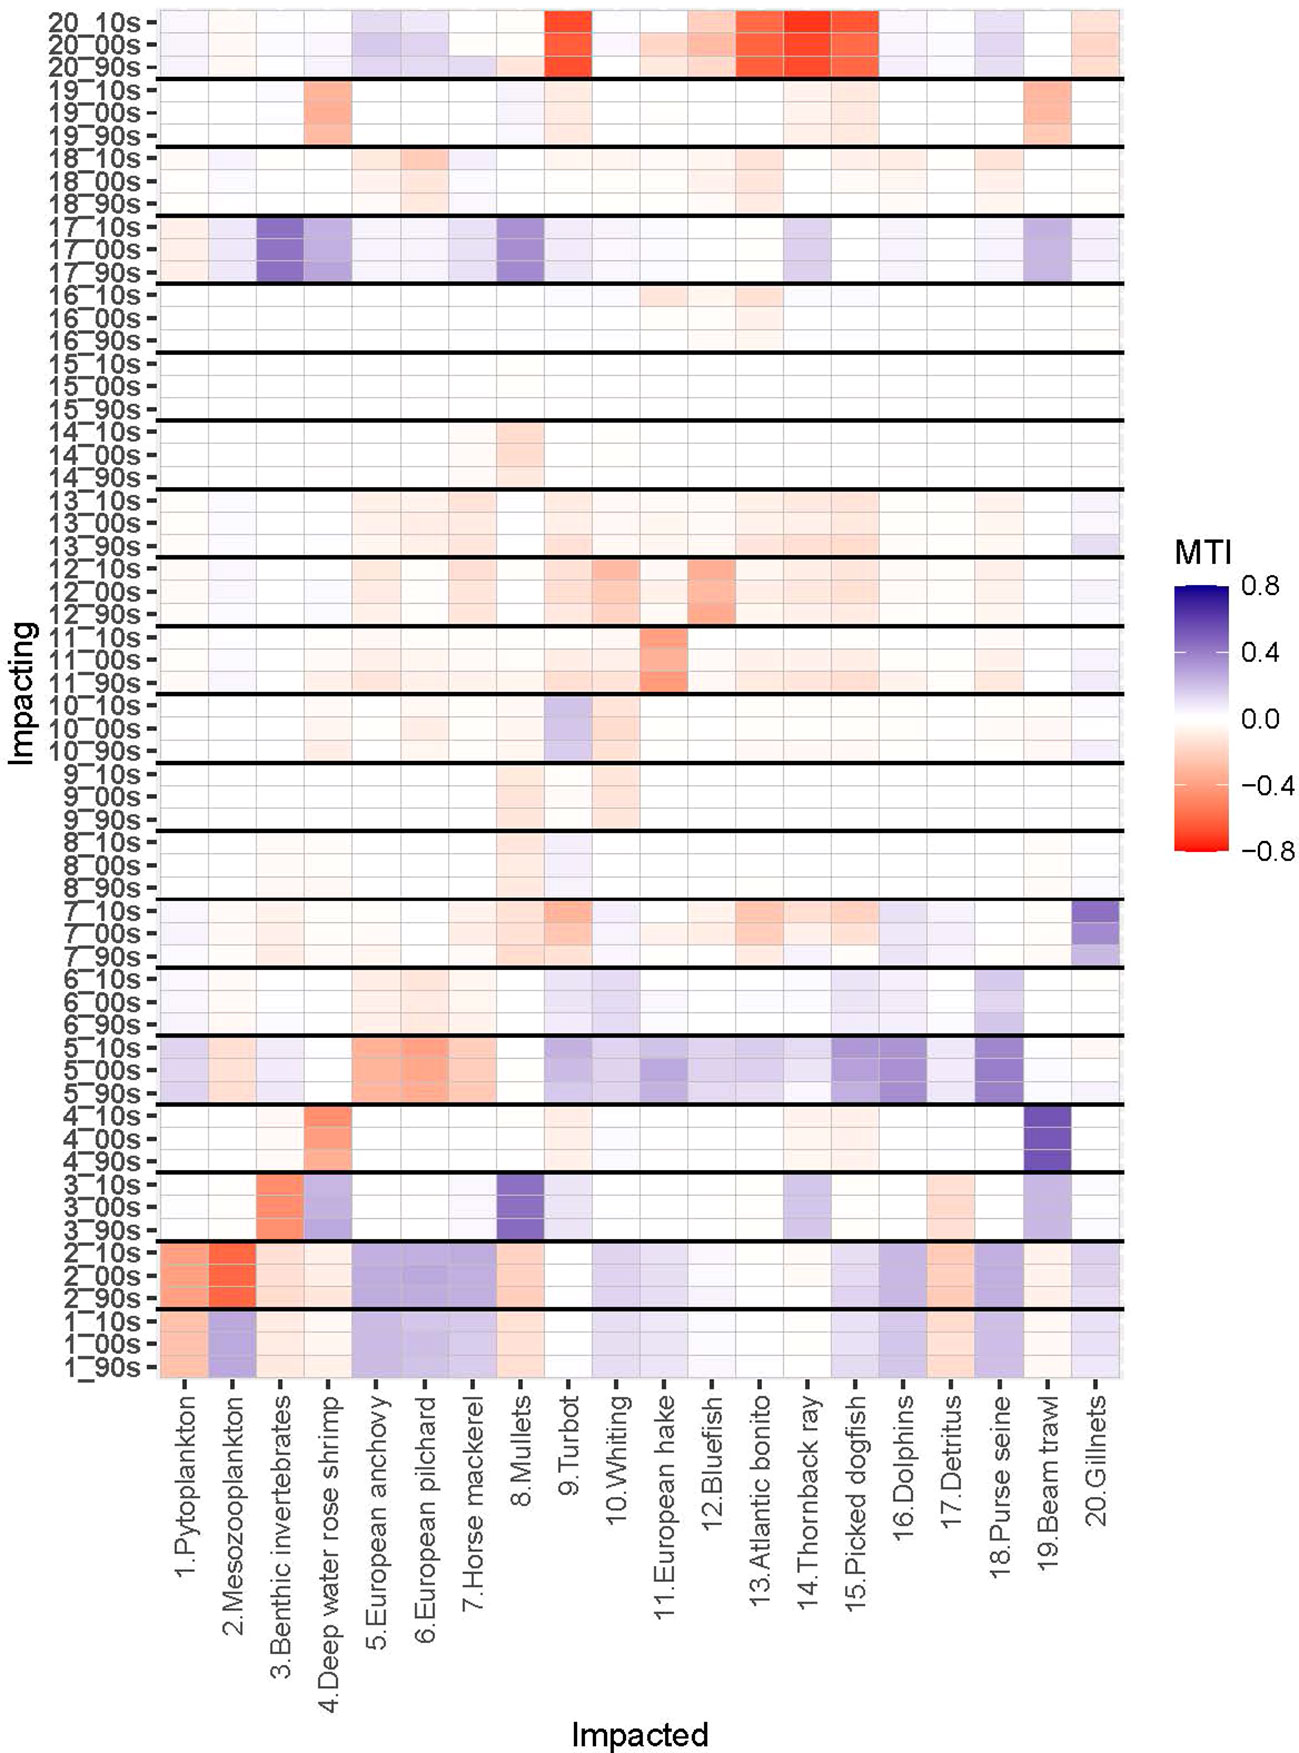
Figure 4 Mixed Trophic Impact (MTI) analysis of Sea of Marmara (SoM) food web for the periods of 1993-97 (1990s), 2003-07 (2000s) and 2013-17 (2010s). X-axis shows impacted groups (functional group numbers and names) and Y-axis shows impacting groups (functional group numbers and model periods). SoM 1990s model (90s); SoM 2000s model (00s); SoM 2010s model (10s). Red and blue colours indicate negative and positive impacts, respectively.
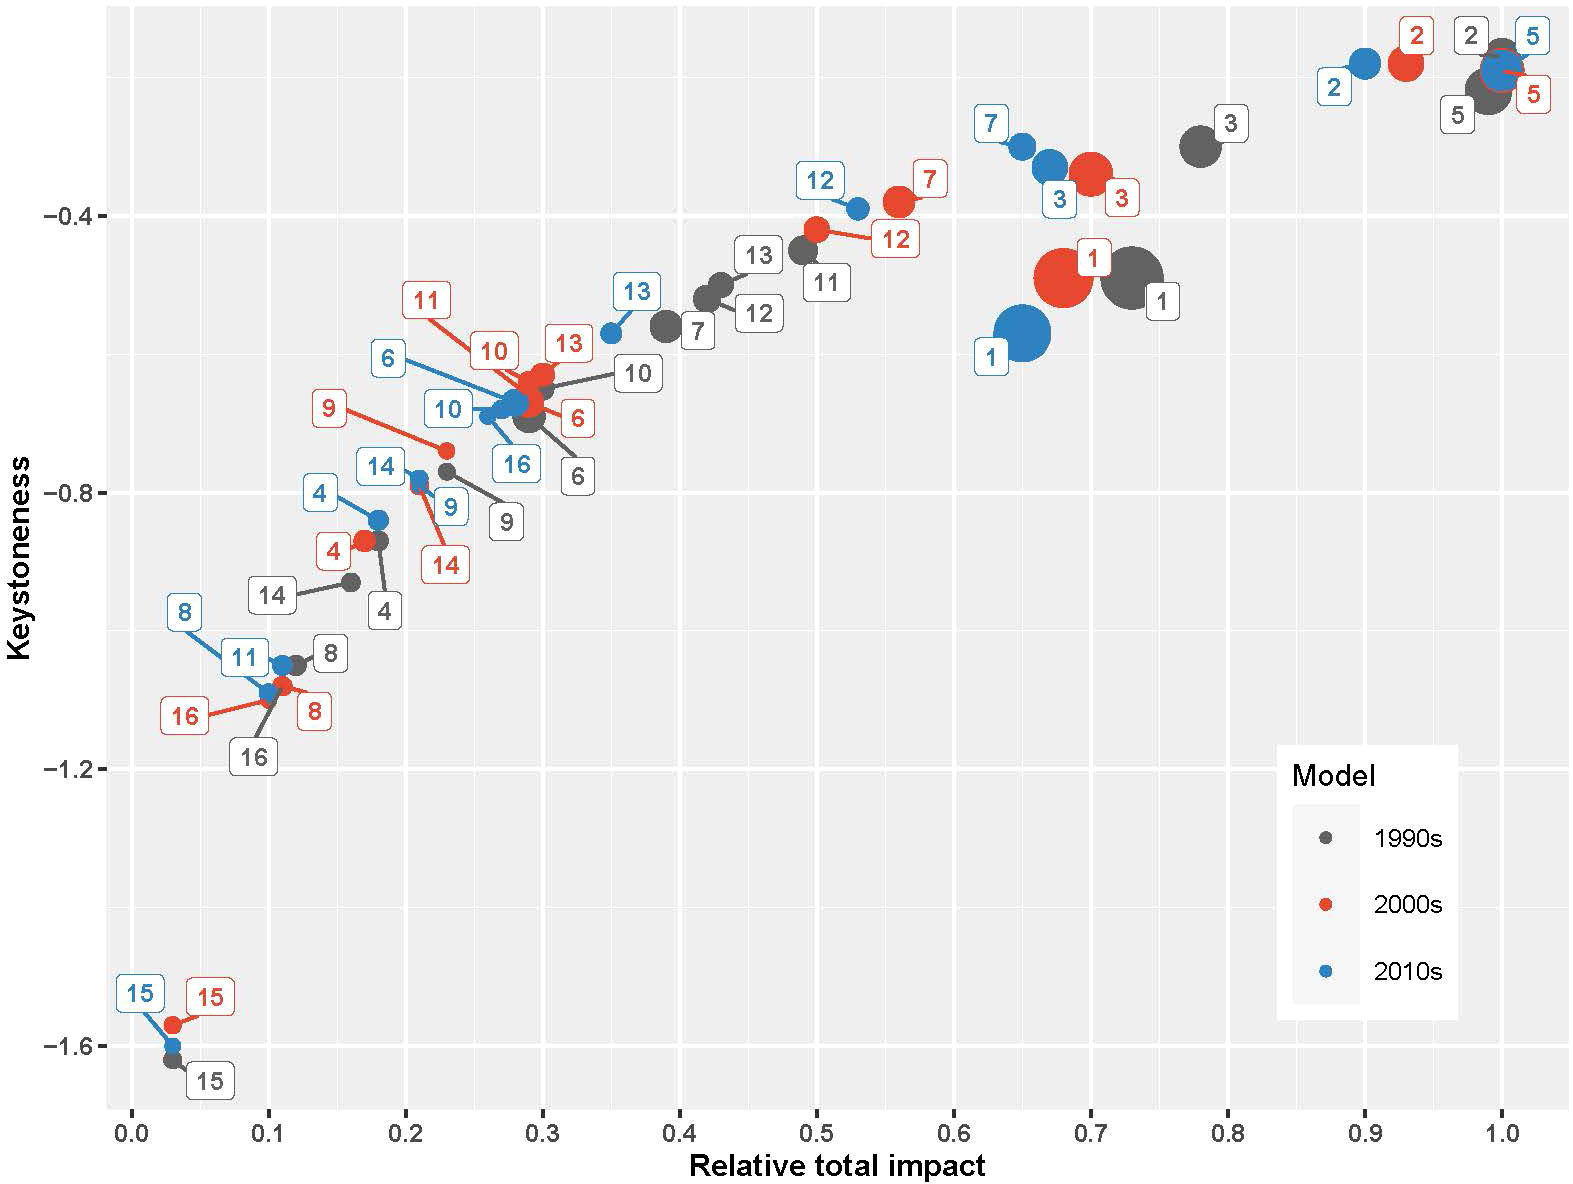
Figure 5 The keystoneness and the relative total impact of the functional groups in the SoM models. The size of the circles are proportional to the groups’ biomasses. Functional groups correspond to: (1) Phytoplankton, (2) Mesozooplankton, (3) Benthic invertebrates, (4) Deep water rose shrimp, (5) European anchovy, (6) European pilchard, (7) Horse mackerel, (8) Mullets, (9) Turbot, (10) Whiting, (11) European hake, (12) Bluefish, (13) Atlantic bonito, (14) Thornback ray, (15) Picked dogfish, (16) Dolphins, and (17) Detritus.
Fishing impacts
The total catch increased from 3 t km-2 y-1 in the 1990s to 4.5 t km-2 y-1 in the 2000s and decreased back to 2.6 in the 2010s and therefore the 2000s model produced the highest CumE (3.8), gross efficiency (0.002) and PPRc/TPp (%5.7) that is related to overfishing risk in an ecosystem (Table 2). The exploitation rates of functional groups were also highest in the 2000s, excluding mullets and whiting which reached the highest values in the 1990s and anchovy and pilchard in 2010s (Table 1).
The gillnet fishery had positive mixed trophic impact on whiting in the 2000s (0.049) and 2010s (0.023) due to indirect effects outcompeting the direct negative effect of exploitation, i.e., exploiting whiting’s predators, turbot, thornback ray and picked dogfish. Further, purse seine fishery had negative impact on anchovy in all periods, -0.039 in the 1990s, 0.068 in the 2000s and -0.106 in the 2010s, respectively. Gillnetters had strong negative impacts on bluefish, bonito, turbot, thornback ray, dogfish in all periods (Figure 4). Beam trawlers had negative impacts on thornback ray, picked dogfish and turbot and strong negative impact on deep water rose shrimp in all periods. Gillnetters had indirect positive impact on mullets due to their negative impacts on predators of the group.
Discussion
In this study mass-balance Ecopath models for three consecutive time periods were set up to delineate the ecosystem structure and functioning of the Sea of Marmara since the 1990s using statistical metrics and synthetic ecological indicators. Hence, our study presents the first comprehensive model description of its food web and its transition over three decades. The SoM is an internal sea between Black and the Mediterranean Seas, off the Istanbul metropolitan area with a very intense urbanization and industrialization, as well as with very high ecological and socio-economic importance since centuries. As a nearly enclosed sea with a permanent stratification due to its natural hydrography (Beşiktepe et al., 1994), our modelling study for the SoM ecosystem can be used to demonstrate localized climate change impacts and how stratification in the water body can limit the coupling between the benthic and pelagic environments by preventing nutrients and small particles from crossing these boundaries (Imberger and Patterson, 1989). Benthic-pelagic coupling is defined as the biological processes linking the pelagic environment and deep sediment bottoms below the euphotic zone (Hedberg, 2021). Hence, the permanently-stratified SoM can be an example for similar ecosystems in other parts of the Mediterranean Sea, where changes such as synergistic impacts of fishing and extended or stable stratification in water column (Li et al., 2020) are impending.
State of the SoM ecosystem
The ecosystem theory indices indicated that the SoM is an immature ecosystem at a stage of autotrophic succession, with a very high total primary production, much more above unity that greatly exceeds total respiration (Table 2). SoM has very high primary productivity similar to the Black Sea, because the Black Sea inputs supply most of the nutrients and organic matter via its upper layer, and also form a nutricline located at depths of 25-30 m (Ediger and Yilmaz, 1996), coinciding with the permanent halocline (Beşiktepe et al., 1994). Very high flow to detritus from primary producers, low material cycling (FCI and PCI), and sharp decrease of TE from TL III to higher TLs showed that there was a high proportion of production which was not utilized within the system and ended up in the detritus compartment. Thus, we concluded that the depth-limited primary productivity cannot reach upper trophic levels efficiently due to intense fishery exploitation of pelagic fishes by industrial fishery, and weak benthic-pelagic coupling due to strong water stratification. Overall, the SoM ecosystem has been dominated by the pelagic compartment, mainly in terms of plankton and one small pelagic fish, anchovy.
Although comparison of ecosystem indices by Ecopath models with different topologies across ecosystems is not recommended (Heymans et al., 2014; Heymans et al., 2016), considering similarities for FGs and aggregations of TLs, some indices that are not affected by the model topology can provide insightful information (Heymans et al., 2016). Therefore, because the SoM is a lesser known part of the Mediterranean basin, some contrasting peculiarities among ecosystems in the Black Sea (Akoglu et al., 2014) and the Mediterranean Sea are worth discussing (Papantoniou et al., 2021; Dimarchopoulou et al., 2022). The total biomass/total throughput ratio was similar to the Black Sea and other parts of the Mediterranean Sea (Akoglu et al., 2014; Papantoniou et al., 2021; Dimarchopoulou et al., 2022). In comparison to the Mediterranean and North Sea ecosystems, the SoM was the largest system after the North Sea in terms of flows (TST~ 4384-6499 t km-2 y-1) with an omnivory index of 0.19-0.20 that is comparable to the Mediterranean and North Seas (Mackinson, 2014; Piroddi et al., 2015), indicating complex food web interactions. The SoM had a greatly higher total primary production/total respiration ratio (5.2-7.9) that is suggestive of autotrophic succession sensu Odum (1969), while its net system production was almost double (1764-2499 t km-2 y-1) as a sign of its developing ecosystem.
Ecosystem structure and functioning within decades
The comparison among mass-balance Ecopath models for three consecutive time periods of the SoM showed that the energetic capacity (TST) of the ecosystem decreased significantly over the three decades and the decreasing cycling indices indicated an ecosystem continuously becoming fragile to anthropogenic disturbances. Our results highlighted that the size of the entire ecosystem in terms of energy flows and total biomass decreased since the 1990s.
The deterioration of the ecosystem as shown by the ecosystem theory indices has incessantly continued over decades. Under the impact of disturbance, ecosystems react with increased redundancy and flow diversity increases during such transitional periods (Ulanowicz, 1980). As shown by flow diversity (C/T) and relative redundancy (R/C) (Table 2), the 2000s indicated a stress on the ecosystem and could be characterized as a transition period. After this period, in the 2010s, these ratios decreased. Further, the relative ascendency of the system increased and the relative resilience decreased in the 2010s and could be considered an indicator of the fragility of the SoM against stressors. As ecosystems develop into maturity, they tend to increase biomass supported per unit of energy (Christensen, 1995). However, the SoM ecosystem degraded in terms of total biomass supported by its throughput as a further indication of stressed or disturbed conditions in the ecosystem (total biomass/total throughput, Table 2). The decrease in system’s throughput by ~33% from the 1990s to the 2010s suggested that some trophodynamic links in the food web did not perform optimally, indicating a deficiency in the energy transfers in the food web. This deficiency was caused by the selective extraction by fisheries, and hence, reduced material/energy cycling (Finn, 1980).
The low throughput cycled and FCI as well as a low overhead in the 2010s model suggested that ecosystem maturity, resilience and stability have been eroded over time (Finn, 1976; Ulanowicz, 1986). A considerable decrease in the grazing flows from TL I to TL II may indicate a decreasing carrying capacity of the ecosystem due to decreased primary productivity that was possibly related to the increasing sea surface temperatures (Akoğlu, 2021). Further, the decreased energy transfers from detritus to TL II indicated a degradation in the ecosystem’s maturity sensu Odum (1969), as in mature ecosystem there is greater cycling through detritus and the detrital compartments play an important role in nutrient regeneration (Ulanowicz, 1980). The transfer efficiency from TL III to TL IV decreased significantly in the 2010s. This inefficient transfer was mostly attributable to the exploitation of small pelagics and top predators via fisheries, thus top predators’ biomass was significantly reduced.
Changes in ecological roles of functional groups
The change in mixed trophic interactions and keystone species in the ecosystem represented a strong interplay between bottom-up and wasp-waist controls on the dynamics of the SoM food web. Particularly, mesozooplankton indicated the bottom-up, resource-driven nature of the food web dynamics (Heath et al., 2014); however, anchovy played a bottleneck role in the distribution of energy from lower trophic levels to higher ones by exerting a wasp-waist control on the food web (Bakun, 2006). This is in line with the keystoneness analysis, which showed that the SoM has been under a mixture of two major food web control dynamics, bottom-up and wasp-waist. In all three periods, mesozooplankton was the keystone group and had the highest relative total impact in the 1990s, followed by anchovy. In the 2000s and 2010s, anchovy had the highest relative total impact. Hence, bottom-up controls are dominant in the SoM food web; however, anchovy is a bottleneck in terms of energy transfers from lower trophic levels to higher trophic levels. A collapse of anchovy stocks may bring about a reverse cascading impact up to higher trophic level fish species that may lead to their commercial extinction; hence, collapse of their fisheries. A similar situation occurred in the Black Sea over the second half of the 20th century; however, with major differences. In the Black Sea, first the top-down control by predator species were removed due to the overexploitation of bluefish, bonito and Atlantic mackerel in the 1950s and the 1960s; then later with the onset of eutrophication in the 1970s, and in the 1980s, zooplankton and anchovy gained structuring roles in the Black Sea’s food web by exerting bottom-up and wasp-waist controls, respectively (Akoglu et al., 2014). Following the collapse of anchovy stocks in the late 1980s, predatory species also suffered significant decreases in their stocks (Oguz et al., 2012) and a similar situation could be imminent for the SoM ecosystem.
The negative mixed trophic impacts of hake on turbot, thornback ray and picked dogfish in the 1990s and the 2000s were related to indirect effects, i.e. resource competition; however, these negative impacts decreased in the 2010s with the significantly decreased biomass of hake. Bluefish and Atlantic bonito had also negative impacts on the demersal fish species, turbot, whiting, hake, thornback ray and picked dogfish, due to their positive impacts on the gillnetter fleet that targeted these demersal species. Anchovy had an indirect negative mixed trophic impact on European pilchard due to competition. The negative impact of anchovy on horse mackerel, although being its prey, was indirect and due to the direct positive impacts of anchovy on the predators of horse mackerel, namely whiting, hake, thornback ray, picked dogfish, bluefish and Atlantic bonito and dolphins, that outcompeted its direct positive impact; i.e. as prey, of anchovy on horse mackerel. The negative impact of horse mackerel on bluefish and bonito were due to the positive impact of horse mackerel on dolphins, the predators of these two fishes. Dolphins had direct negative impacts on bluefish and bonito as predators.
Fishing impacts on the food web
The cumulative impacts of multiple factors on marine ecosystems have been described using ecosystem modelling (Bentley et al., 2017; Corrales et al., 2017; Salihoglu et al., 2017; Serpetti et al., 2017). It is also suggested that delineation of cumulative impacts can help to build recommendations in the future management options (Corrales et al., 2018). In our study, we identified 30 years of fishing impact that changed ecosystem structure and functioning. The highest fishing pressure was in the 2000s according to fisheries indices. The most significant impact of fisheries was the reduction of higher-trophic-level fish species from the ecosystem, initiating a fishing down the food web impact as indicated by the decreasing biomass ratios of predatory and demersal fish species to forage fish. Further, the increased fisheries exploitation over the decades, i.e., relative exports, decreased the cycling in the food web (E/C and FCI in Table 2).
Model results showed that fisheries’ selective extraction of species in the food web decreased the fish biomass in the SoM significantly over three decades. The MTI analysis showed the negative impact of fisheries on the majority of exploited groups. Purse seiners and gillnetters negatively impacted hake and due to heavy exploitation of this species since the 1990s, its biomass decreased significantly. Purse seiners and gillnetters had strong negative impacts on the pelagic predator and demersal predator species, respectively. The degree of negative impacts of beam trawlers and gillnetters on thornback ray and picked dogfish were also alarming as these species have relatively long lifespan and low fecundity. Further, strong negative impact of fishing fleets on turbot, thornback ray and dogfish put the population dynamics of these species at risk and could have pushed their populations towards to the brink of commercial extinction. The eradication of these two top predators from the SoM would be inevitable if the current level of exploitation continues. A similar dire consequence could also be anticipated for turbot. High exploitation levels exerted by fisheries as shown by fishery indices and the decreasing ratios of pelagic and demersal predator fish biomasses to the forage fish biomass, and the decrease in the mean trophic level of the catch from 3.3 in the 1990s to 3.1 in the 2010s indicated a fishing down the food web effect (Pauly et al., 1998; Shannon et al., 2009) in the SoM.
In the Mediterranean and the Black Seas, large predatory fishes were the first to be subject to overfishing, followed by medium-pelagics, demersals, and finally small pelagics (Daskalov, 2008; Froese et al., 2018). The healthy state of small pelagic stocks is of vital importance for the recovery of their predators as the demersal whiting, turbot and rays need large food supplies to ensure population growth (Peck et al., 2021). Making sure that there is sufficient prey biomass left in the system, along with continuous reduction of fishing pressure, is needed in order to ensure the future survival of the predatory fishes in the SoM. Fisheries exploitation had significant responsibility on these changes; however, the effects of other factors that were not explicitly represented in our models such as impacts of pollution, increase in jellyfish biomass and number of new species and changes in primary production dynamics, as indicated by the decreasing primary productivity and phytoplankton biomass in our models, should not be ruled out and future modelling work should consider representing these aspects.
Model skill and data limitations
The Pedigree index calculated by the model pointed out that the SoM model was of medium quality and the inputs used were moderately satisfying (Morissette, 2007). Although most of the diet compositions data were collected at local level and; therefore, had a low degree of uncertainty, the major source of uncertainty in our model was associated with the modeled biomass and fishing mortality estimations for commercial fish groups using the CMSY algorithm (Froese et al., 2017). Since SoM is a data-poor region for fisheries, we best capitalized on results from CMSY as a catch-based stock assessment method to estimate time-series of biomass and fishing mortality values for commercial species. This approach is very helpful to get a ‘big picture’ view of fisheries, and give an opportunity to estimate necessary inputs in the ecosystem modelling approach for data-poor areas. Although performance analyses on catch-based methods indicate that CMSY performance was more accurate in estimating biomass (Zhou et al., 2018), and produce slightly similar results among other data-limited surplus production method, only a few results were compatible with official stock estimates (Bouch et al., 2021), and its results were strictly dependent on the quality of the prior information which bears a potentially high risk of over- or underestimating stock size (Pons et al., 2020; Sharma et al., 2021). We suggest that biomass and fishing mortality data based on CMSY can now be used in Ecopath modelling and its time dynamic module, Ecosim.
Although published and unpublished biomass data for zooplankton and macrobenthic epi/infaunal groups were available (e.g., Çinar et al., 2020), we avoided using these data as their temporal and spatial coverage were severely limited and would introduce significant uncertainty if used as initial conditions for these groups in the models because of the impossibility of capitalizing on statistical approaches to derive representative values for the whole SoM. This is probably because of the stratified nature of the SoM that creates a substantial barrier between pelagic-benthic ecosystems and hinders to produce data representing the whole ecosystem. Therefore, we relied on Ecopath estimations for their biomasses assuming an EE value of 0.9 for both groups.
Trophic levels of functional groups were equal in the three models, because the models were balanced using the same diet matrix to ensure similar topology. We had to rely on data from adjacent areas and similar ecosystems to parameterize the model when no such information was available from the SoM ecosystem. However, most of the information used to complement missing data was from nearby areas in the Black Sea or Northern Aegean Sea ecosystems and assumed to be representative of the overall characteristics of the populations in the Sea of Marmara because i) some stocks are migratory and shared between the Marmara and the Black Seas, and ii) the SoM is a two-layer stratified system forming a passage between these two seas and could be considered to be formed with the amalgamation of the characteristics of the Black Sea and the Aegean Sea ecosystems to a significant extent.
In the late 2000s, frequent observation of jellyfish blooms together with increases in jellyfish abundances and new species arrivals to the SoM were hypothesized to have significant impacts on the plankton community (Isinibilir et al., 2015) that could also cascade up to the fish community. Our models did not include jellyfishes due to the lack of regional biomass estimation. Jellyfish can affect the pelagic (Colin et al., 2005) and benthic (Sweetman and Chapman, 2015) ecosystems via their life history. They are directly related to zooplankton and anchovy in the food web with their wide range of prey (Purcell, 2009) and may have structural roles in the SoM similar to the Black Sea ecosystem (Akoglu et al., 2014). Therefore, the lack of such data is one of the important limitations for current and possibly future SoM models. Another major limitation is to understand the interactions of functional groups with fisheries due to the lack of species and fleet-specific landing and discard data. Such data should be collected and included in the future modelling studies. Our study also highlighted the data needs and the necessity to extend modelling efforts for a better understanding of the changes in the SoM using dynamic temporal modelling, like Ecosim, considering multiple stressors such as climate change, deoxygenation, invasive species and fisheries.
Conclusion
In this study three mass-balance Ecopath models were set up to delineate the ecosystem structure and function of the SoM from the 1990s to the 2010s. The comparison of the models showed that the energetic capacity (total system throughput) of the ecosystem decreased significantly over the three decades and the cycling indices indicated an ecosystem continuously becoming fragile to disturbances, notably fishing that is explicitly considered in this approach. The mixed trophic interactions and keystone species in the ecosystem showed an interplay between bottom-up and wasp-waist controls in the dynamics of the SoM food web. Further, strong negative impacts of fishing fleets on turbot, thornback ray and dogfish put the population dynamics of these species at risk and could push their populations to the brink of commercial extinction in the near future. Fisheries exploitation had significant responsibility on these changes; however, impacts of other factors that were not explicitly represented in our models such as impacts of pollution, sea warming, jellyfish species and changes in primary production dynamics, as indicated by the decreasing primary productivity and phytoplankton biomass in our models, should not be ruled out and future modelling work should consider these aspects.
Data availability statement
The original contributions presented in the study are included in the article/Supplementary Material. Further inquiries can be directed to the corresponding author.
Author contributions
IS, EA, ND: Formal analysis, Visualization, Writing- Original draft preparation. IS, GG, DB: Data curation, Investigation. ND: Supervision, Funding. All authors: Writing- Reviewing and Editing. All authors contributed to the article and approved the submitted version.
Funding
The authors acknowledge the Scientific Research Projects Coordination Unit of Istanbul University, Türkiye. This study is a contribution to the projects supported by The Scientific and Technological Research Council of Türkiye [TUBITAK - Project No: 119Y294], Scientific Research Projects Coordination Unit of Istanbul University, Türkiye [FDP-2020-36673], and Turkish Ministry of Environment, Urbanization and Climate Change [Project acronym: MARMOD Phase II].
Acknowledgments
Authors would like to thank Dr. Taner Yıldız for his valuable comment on fishing characterization and gear allocation of the SoM.
Conflict of interest
The authors declare that the research was conducted in the absence of any commercial or financial relationships that could be construed as a potential conflict of interest.
Publisher’s note
All claims expressed in this article are solely those of the authors and do not necessarily represent those of their affiliated organizations, or those of the publisher, the editors and the reviewers. Any product that may be evaluated in this article, or claim that may be made by its manufacturer, is not guaranteed or endorsed by the publisher.
Supplementary material
The Supplementary Material for this article can be found online at: https://www.frontiersin.org/articles/10.3389/fmars.2022.1076399/full#supplementary-material
References
Agnetta D., Badalamenti F., Colloca F., D’Anna G., Di Lorenzo M., Fiorentino F., et al. (2019). Benthic-pelagic coupling mediates interactions in Mediterranean mixed fisheries: An ecosystem modeling approach. PloS One 14, e0210659. doi: 10.1371/JOURNAL.PONE.0210659
Akoğlu E. (2021). Exploring the dynamics of small pelagic fish catches in the Marmara Sea in relation tochanging environmental and bio-optical parameters. Turk. J. Zool. 45, 257–265. doi: 10.3906/zoo-2012-23
Akoglu E., Salihoglu B., Libralato S., Oguz T., Solidoro C. (2014). An indicator-based evaluation of Black Sea food web dynamics during 1960–2000. J. Mar. Syst. 134, 113–125. doi: 10.1016/J.JMARSYS.2014.02.010
Akyol O., Perçin F. (2006) Tekirdağ İli (Marmara Denizi) Kıyı Balıkçılığı ve Sorunları [The coastal fisheries and problems in Tekirdağ Province (Marmara Sea)] E.U. J. Fish. Aquat. Sci 23, 423–426.
Alheit J., Licandro P., Coombs S., Garcia A., Giráldez A., Santamaría M. T. G., et al (2014) Reprint of “Atlantic multidecadal oscillation (AMO) modulates dynamics of small pelagic fishes and ecosystem regime shifts in the eastern north and central atlantic.” J. Mar. Syst. 133, 88–102 doi: 10.1016/J.JMARSYS.2014.02.005
Allen K. R. (1971). Relation between production and biomass. J. Fish. Res. Board. Can. 28, 1573–1581. doi: 10.1139/f71-236
Altıok H., Aslan A., Övez S., Demirel N., Yüksek A., Kıratlı N., et al. (2014). Influence of the extreme conditions on the water quality and material exchange flux in the strait of Istanbul. J. Mar. Syst. 139, 204–216. doi: 10.1016/j.jmarsys.2014.06.005
Audzijonyte A., Kuparinen A. (2016). The role of life histories and trophic interactions in population recovery. Conservation Biology 30 (4), 734–743.
Bakun A. (2006). Wasp-waist populations and marine ecosystem dynamics: Navigating the “predator pit”. topograph. Prog. oceanogr. 68 (2-4), 271–288. doi: 10.1016/j.pocean.2006.02.004
Bentley J. W., Serpetti N., Heymans J. J. (2017). Investigating the potential impacts of ocean warming on the Norwegian and barents seas ecosystem using a time-dynamic food-web model. Ecol. Modell. 360, 94–107. doi: 10.1016/J.ECOLMODEL.2017.07.002
Beşiktepe Ş. T., Sur H. I., Özsoy E., Latif M. A., Ouml;ĝuz T., Ünlüata Ü. (1994). The circulation and hydrography of the Marmara Sea. Prog. Oceanogr. 34, 285–334. doi: 10.1016/0079-6611(94)90018-3
Beverton R. J. H., Holt S. J. (1957). On the dynamics of exploited fish populations fishery investigations (London: Springer-Science-Business-Media B.V).
Bouch P., Minto C., Reid D. G. (2021). Comparative performance of data-poor CMSY and data-moderate SPiCT stock assessment methods when applied to data-rich, real-world stocks. ICES J. Mar. Sci. 78, 264–276. doi: 10.1093/ICESJMS/FSAA220
Christensen V. (1995). Ecosystem maturity–towards quantification. Ecol. Model. 77 (1), 3–32. doi: 10.1016/0304-3800(93)E0073-C
Christensen V., Pauly D. (1993). Flow characteristics of aquatic ecosystems. Trophic models of aquatic ecosystems. ICLARM Conf. Proc. 26, 38–352.
Christensen V., Walters C. J. (2004). Ecopath with ecosim: Methods, capabilities and limitations. Ecol. Modell. 172, 109–139. doi: 10.1016/j.ecolmodel.2003.09.003
Christensen V., Walters C. J., Pauly D. (2005). Ecopath with ecosim: A user’s guide (Vancouver, BC: University of British Columbia, 154).
Çinar M. E., Bakir K., Öztürk B., Doğan A., Açik Ş., Kirkim F., et al. (2020). Spatial distribution pattern of macroinvertebrates associated with the black mussel Mytilus galloprovincialis (Mollusca: Bivalvia) in the Sea of marmara. J. Mar. Syst. 211, 103402. doi: 10.1016/j.jmarsys.2020.103402
Clarke K. R., Warwick R. M. (2001). Change in marine communities. approach to Stat. Anal. interpret. 2, 1–68.
Colin S. P., Costello J. H., Graham W. M., Higgins J. (2005). Omnivory by the small cosmopolitan hydromedusa aglaura hemistoma. Limnol. Oceanogr. 50, 1264–1268. doi: 10.4319/LO.2005.50.4.1264
Corrales X., Coll M., Ofir E., Heymans J. J., Steenbeek J., Goren M., et al. (2018). Future scenarios of marine resources and ecosystem conditions in the Eastern Mediterranean under the impacts of fishing, alien species and sea warming. Sci. Rep. 8, 1–16. doi: 10.1038/s41598-018-32666-x
Corrales X., Coll M., Ofir E., Piroddi C., Goren M., Edelist D., et al. (2017). Hindcasting the dynamics of an Eastern Mediterranean marine ecosystem under the impacts of multiple stressors. Mar. Ecol. Prog. Ser. 580, 17–36. doi: 10.3354/MEPS12271
Costanza R., Mageau M. (1999). What is a healthy ecosystem? Aquat. Ecol. 31, 105–115. doi: 10.1023/A:1009930313242
Darwall W. R. T., Allison E. H., Turner G. F., Irvine K. (2010). Lake of flies, or lake of fish? A trophic model of lake Malawi. Ecol. Modell. 221, 713–727. doi: 10.1016/J.ECOLMODEL.2009.11.001
Daskalov G. M. (2002). Overfishing drives a trophic cascade in the Black Sea. Mar. Ecol. Prog. Ser. 225, 53–63. doi: 10.3354/MEPS225053
Daskalov G. M. (2008). Overfishing affects more than fish populations: trophic cascades and regime shifts in the Black Sea (Oxford, UK: Blackwell Publishing Ltd).
Demirel N., Akoglu E., Ulman A., Ertör-Akyazı P., Gül G., Bedikoğlu D., et al. (2023). Uncovering ecological regime shifts in the Sea of marmara and reconsidering management strategies. Mar. Environ. Res. 183, 105794. doi: 10.1016/j.marenvres.2022.105794
Demirel N., Zengin M., Ulman A. (2020). First Large-scale Eastern Mediterranean and Black Sea stock assessment reveals a dramatic decline. Front. Mar. Sci. 7. doi: 10.3389/FMARS.2020.00103/BIBTEX
Dimarchopoulou D., Tsagarakis K., Sylaios G., Tsikliras A. C. (2022). Ecosystem trophic structure and fishing effort simulations of a major fishing ground in the northeastern Mediterranean Sea (Thermaikos gulf). Estuar. Coast. Shelf Sci. 264, 107667. doi: 10.1016/J.ECSS.2021.107667
Ediger D., Yilmaz A. (1996). Characteristics of deep chlorphyll maximum in the northeastern Mediterranean with respect to environmental conditions. J. Mar. Syst. 9, 291–303. doi: 10.1016/S0924-7963(96)00044-9
Ergin M., Bodur M. N., Ediger D., Ediger V., Yilmaz A. (1993). Organic carbon distribution in the surface sediments of the Sea of marmara and its control by the inflows from adjacent water masses. Mar. Chem. 41, 311–326. doi: 10.1016/0304-4203(93)90263-N
FAO (2022). The state of Mediterranean and Black Sea fisheries 2020. (Rome: General Fisheries Commission for the Mediterranean).
Finn J. T. (1976). Measures of ecosystem structure and function derived from analysis of flows. J. Theor. Biol. 56, 363–380. doi: 10.1016/S0022-5193(76)80080-X
Finn J. T. (1980). Flow analysis of models of the Hubbard brook ecosystem. Ecology 61 (3), 562–571. doi: 10.2307/1937422
Froese R., Demirel N., Coro G., Kleisner K. M., Winker H. (2017). Estimating fisheries reference points from catch and resilience. Fish. Fish. 18, 506–526. doi: 10.1111/FAF.12190
Froese R., Winker H., Coro G., Demirel N., Tsikliras A. C., Dimarchopoulou D., et al. (2018). Status and rebuilding of European fisheries. Mar. Policy 93, 159–170. doi: 10.1016/J.MARPOL.2018.04.018
Halpern B. S., Frazier M., Potapenko J., Casey K. S., Koenig K., Longo C., et al. (2015). Spatial and temporal changes in cumulative human impacts on the world’s ocean. Nat. Commun. 6, 1–7. doi: 10.1038/ncomms8615
Heath M. R., Speirs D. C., Steele J. H. (2014). Understanding patterns and processes in models of trophic cascades. Ecol. Lett. 17 (1), 101–114. doi: 10.1111/ele.12200
Hedberg P. (2021). Responses of benthic-pelagic coupling to environmental change. [dissertation]. (Stockholm, Sweden: Stockholm University).
Heymans J. J., Coll M., Libralato S., Morissette L., Christensen V. (2014). Global patterns in ecological indicators of marine food webs: A modelling approach. PloS One 9, e95845. doi: 10.1371/JOURNAL.PONE.0095845
Heymans J. J., Coll M., Link J. S., Mackinson S., Steenbeek J., Walters C., et al. (2016). Best practice in ecopath with ecosim food-web models for ecosystem-based management. Ecol. Modell. 331, 173–184. doi: 10.1016/J.ECOLMODEL.2015.12.007
Heymans J. J., Tomczak M. T. (2016). Regime shifts in the northern benguela ecosystem: Challenges for management. Ecol. Modell. 331, 151–159. doi: 10.1016/J.ECOLMODEL.2015.10.027
Hiddink J. G., Moranta J., Balestrini S., Sciberras M., Cendrier M., Bowyer R., et al. (2016). Bottom trawling affects fish condition through changes in the ratio of prey availability to density of competitors. J. Appl. Ecol. 53, 1500–1510. doi: 10.1111/1365-2664.12697
Horbowy J., Luzeńczyk A. (2017). Effects of multispecies and density-dependent factors on MSY reference points: Example of the Baltic Sea sprat. Can. J. Fish. Aquat. Sci. 74, 864–870. doi: 10.1139/CJFAS-2016-0220
Hutchings J. A. (2000). Collapse and recovery of marine fishes. Nature 406, 882–885. doi: 10.1038/35022565
Hutchings J. A., Reynolds J. D. (2004). Marine fish population collapses: consequences for recovery and extinction risk. Bioscience 54, 297–309. doi: 10.1641/0006-3568(2004)054[0297:MFPCCF]2.0.CO;2
Imberger J., Patterson J. C. (1989). Physical limnology. Adv. Appl. Mech. 27, 303–475. doi: 10.1016/S0065-2156(08)70199-6
Isinibilir M., Yilmaz I. N., Demirel N. (2015). New records of jellyfish species in the Marmara Sea. Ital. J. Zool. 82, 425–429. doi: 10.1080/11250003.2015.1040858
İşinibilir M., Yılmaz İ. N. (2016). “Jellyfish species of the Sea of marmara,” in The Sea of marmara; marine biodiversity, fisheries, conservation and governance. Eds. Özsoy E., Çağatay M. N., Balkıs N., Balkıs N., Öztürk B. (Turkish Marine Research Foundation Press), 390–400.
Libralato S., Christensen V., Pauly D. (2006). A method for identifying keystone species in food web models. Ecol. Modell. 195, 153–171. doi: 10.1016/J.ECOLMODEL.2005.11.029
Li G., Cheng L., Zhu J., Trenberth K. E., Mann M. E., Abraham J. P. (2020). Increasing ocean stratification over the past half-century. Nat. Clim. Change 10, 1116–1123. doi: 10.1038/s41558-020-00918-2
Lindeman R. L. (1942). The trophic-dynamic aspect of ecology. Ecol 23, 399–417. doi: 10.2307/1930126
Link J. S. (2010). Adding rigor to ecological network models by evaluating a set of pre-balance diagnostics: A plea for PREBAL. Ecol. Modell. 221, 1580–1591. doi: 10.1016/J.ECOLMODEL.2010.03.012
Lynam C. P., Llope M., Möllmann C., Helaouët P., Bayliss-Brown G. A., Stenseth N. C. (2017). Interaction between top-down and bottom-up control in marine food webs. Proc. Natl. Acad. Sci. U.S.A. 114, 1952–1957. doi: 10.1073/pnas.1621037114
Mackinson S. (2014). Combined analyses reveal environmentally driven changes in the North Sea ecosystem and raise questions regarding what makes an ecosystem model’s performance credible? Canadian Journal of Fisheries and Aquatic Sciences 71 (1)31–46. doi: 10.1139/cjfas-2013-0173
McGarvey R., Punt A. E., Matthews J. M., Feenstra J. E., Gardner C., Burch P., et al. (2015). Comparing size-limit and quota policies to increase economicyield in a lobster fishery. Can. J. Fish. Aquat. Sci. 72, 1–14. doi: 10.1139/cjfas-2014-0405
Morissette L. (2007). Complexity, cost and quality of ecosystem models and their impact on resilience : A comparative analysis, with emphasis on marine mammals and the gulf of st. Lawrence (Vancouver: University of British Columbia). doi: 10.14288/1.0074903
Neubauer P., Jensen O. P., Hutchings J. A., Baum J. K. (2013). Resilience and recovery of overexploited marine populations. Science 340, 347–349. doi: 10.1126/science.1230441
Odum E. P. (1969). The strategy of ecosystem development. Science 164, 262–270. doi: 10.1126/science.164.3877.262
Oguz T., Akoglu E., Salihoglu B. (2012). Current state of overfishing and its regional differences in the Black Sea. Ocean. Coast. Manage. 58, 47–56. doi: 10.1016/J.OCECOAMAN.2011.12.013
Palomares M. L. D., Froese R., Derrick B., Meeuwig J. J., Noel S.-L., Tsui G., et al. (2020). Fishery biomass trends of exploited fish populations in marine ecoregions, climatic zones and ocean basins. Estuar. Coast. Shelf. Sci. 243, 106896. doi: 10.1016/j.ecss.2020.106896
Palomares M. L. D., Pauly D. (1998). Predicting food consumption of fish populations as functions of mortality, food type, morphometrics, temperature and salinity. Mar. Freshw. Res. 49, 447–453. doi: 10.1071/MF98015
Papantoniou G., Giannoulaki M., Stoumboudi M. T., Lefkaditou E., Tsagarakis K. (2021). Food web interactions in a human dominated Mediterranean coastal ecosystem. Mar. Environ. Res. 172, 105507. doi: 10.1016/j.marenvres.2021.105507
Pauly D. (1980). On the interrelationships between natural mortality, growth parameters, and mean environmental temperature in 175 fish stocks. ICES J. Mar. Sci. 39, 175–192. doi: 10.1093/icesjms/39.2.175
Pauly D., Christensen V. (1995). Primary production required to sustain global fisheries. Nature 374, 255–257. doi: 10.1038/374255a0
Pauly D., Christensen V., Dalsgaard J., Froese R., Torres J. F. (1998). Fishing down marine food webs. Science 279, 860–863. doi: 10.1126/science.279.5352.860
Pauly D., Froese R. (2021). MSY needs no epitaph–but it was abused. ICES J. Mar. Sci. 78 (6), 2204–2210. doi: 10.1093/icesjms/fsaa224
Pauly D., Zeller D. (2016). Catch reconstructions reveal that global marine fisheries catches are higher than reported and declining. Nat. Commun. 7, 1–9. doi: 10.1038/ncomms10244
Peck M. A., Alheit J., Bertrand A., Catalán I. A., Garrido S., Moyano M., et al. (2021). Small pelagic fish in the new millennium: A bottom-up view of global research effort. Prog. Oceanogr. 191, 102494. doi: 10.1016/j.pocean.2020.102494
Piroddi C., Teixeira H., Lynam C. P., Smith C., Alvarez M. C., Mazik K., et al. (2015). Using ecological models to assess ecosystem status in support of the European marine strategy framework directive. Ecol. Indic. 58, 175–191. doi: 10.1016/j.ecolind.2015.05.037
Pons M., Cope J. M., Kell L. T. (2020). Comparing performance of catch-based and length-based stock assessment methods in data-limited fisheries. Can. J. Fish. Aquat. Sci. 77, 1026–1037. doi: 10.1139/cjfas-2019-0276
Power M. E., Tilman D., Estes J. A., Menge B. A., Bond W. J., Mills L. S., et al. (1996). Challenges in the quest for keystones: Identifying keystone species is difficult-but essential to understanding how loss of species will affect ecosystems. Bioscience 46, 609–620. doi: 10.2307/1312990
Purcell J. E. (2009). Extension of methods for jellyfish and ctenophore trophic ecology to large-scale research. Hydrobiologia 616, 23–50. doi: 10.1007/s10750-008-9585-8
Salihoglu B., Arkin S. S., Akoglu E., Fach B. A. (2017). Evolution of future Black Sea fish stocks under changing environmental and climatic conditions. Front. Mar. Sci. 4. doi: 10.3389/fmars.2017.00339
Serpetti N., Baudron A. R., Burrows M. T., Payne B. L., Helaouët P., Fernandes P. G., et al. (2017). Impact of ocean warming on sustainable fisheries management informs the ecosystem approach to fisheries. Sci. Rep. 7, 1–15. doi: 10.1038/s41598-017-13220-7
Shannon L. J., Coll M., Neira S. (2009). Exploring the dynamics of ecological indicators using food web models fitted to time series of abundance and catch data. Ecol. Indic. 9, 1078–1095. doi: 10.1016/j.ecolind.2008.12.007
Sharma R., Winker H., Levontin P., Kell L., Ovando D., Palomares M. L. D., et al. (2021). Assessing the potential of catch-only models to inform on the state of global fisheries and the UN’s SDGs. Sustainability 13, 6101. doi: 10.3390/su13116101
Sweetman A. K., Chapman A. (2015). First assessment of flux rates of jellyfish carcasses (jelly-falls) to the benthos reveals the importance of gelatinous material for biological c-cycling in jellyfish-dominated ecosystems. Front. Mar. Sci. 2. doi: 10.3389/fmars.2015.00047
Tas S., Kus D., Yilmaz I. N. (2020). Temporal variations in phytoplankton composition in the northeastern Sea of marmara: Potentially toxic species and mucilage event. Mediterr. Mar. Sci. 21, 668–683. doi: 10.12681/mms.22562
Tsikliras A. C., Froese R. (2019). “Maximum sustainable yield,” in Encyclopedia of ecology, 2nd, vol. 1 . Ed. Fath B. D. (Oxford: Elsevier), 108–115.
Tu C. Y., Chen K. T., Hsieh C. H. (2018). Fishing and temperature effects on the size structure of exploited fish stocks. Sci. Rep. 8, 1–10. doi: 10.1038/s41598-018-25403-x
Ulanowicz R. E. (1980). An hypothesis on the development of natural communities. J. Theor. Biol. 85, 223–245. doi: 10.1016/0022-5193(80)90019-3
Ulanowicz R. E. (1986). Growth and development ecosystems phenomenology (New York: Springer-Verlag).
Ulanowicz R. E. (2004). Quantitative methods for ecological network analysis. Comput. Biol. Chem. 28, 321–339. doi: 10.1016/j.compbiolchem.2004.09.001
Ulman A., Zengin M., Demirel N., Pauly D. (2020). The lost fish of Turkey: A recent history of disappeared species and commercial fishery extinctions for the Turkish marmara and Black Seas. Front. Mar. Sci. 7. doi: 10.3389/fmars.2020.00650
Walters C., Kitchell J. F. (2001). Cultivation/depensation effects on juvenile survival and recruitment: Implications for the theory of fishing. Can. J. @ Fish. Aqua. Sci. 58, 39–50. doi: 10.1139/f00-160
Watson R. A., Cheung W. W. L., Anticamara J. A., Sumaila R. U., Zeller D., Pauly D. (2013). Global marine yield halved as fishing intensity redoubles. Fish. Fish. 14, 493–503. doi: 10.1111/J.1467-2979.2012.00483.X
Worm B., Hilborn R., Baum J. K., Branch T. A., Collie J. S., Costello C., et al. (2009). Rebuilding global fisheries. Science 325, 578–585. doi: 10.1126/science.1173146
Yazıcı F. M., İşmen A., Altınağaç U., Ayaz A. (2006). Marmara Denizi’nde karides algarnasının av kompozisyonu ve hedeflenmeyen av üzerine bir çalışma [A study on the catch composition and bycatch of shrimp beam trawl in the Sea of Marmara]. E.U. J. Fish. Aquat. Sci. 23, 269–275.
Yıldız T., Ulman A., Demirel N. (2020). A comparison of market landings during fish spawning seasons to better understand the effectiveness of the temporal fishery closure in Turkey. Ocean. Coast. Manage. 198, 105353. doi: 10.1016/j.ocecoaman.2020.105353
Zengin M., Güngör H., Güngör G., Demirkol C., İnceoğlu H., Düz G., et al. (2017). Socio-economic structure of Marmara Sea fishery and determination of management strategies (MARBAL) (Central Fisheries Research Institute), 224. Project No: TAGEM HAYSÜD/2008/09/04/01. Final report
Keywords: Ecopath, ecological network analyses, food web, trophic flow, ecosystem approach to fisheries (EAF), data-poor region
Citation: Saygu İ, Akoglu E, Gül G, Bedikoğlu D and Demirel N (2023) Fisheries impact on the Sea of Marmara ecosystem structure and functioning during the last three decades. Front. Mar. Sci. 9:1076399. doi: 10.3389/fmars.2022.1076399
Received: 21 October 2022; Accepted: 19 December 2022;
Published: 13 January 2023.
Edited by:
Georgios Sylaios, Democritus University of Thrace, GreeceReviewed by:
Donna Dimarchopoulou, Dalhousie University, CanadaSukran Yalcin Ozdilek, Çanakkale Onsekiz Mart University, Türkiye
Mustafa Zengin, Central Fisheries Research Institute (CFRI), Türkiye
Copyright © 2023 Saygu, Akoglu, Gül, Bedikoğlu and Demirel. This is an open-access article distributed under the terms of the Creative Commons Attribution License (CC BY). The use, distribution or reproduction in other forums is permitted, provided the original author(s) and the copyright owner(s) are credited and that the original publication in this journal is cited, in accordance with accepted academic practice. No use, distribution or reproduction is permitted which does not comply with these terms.
*Correspondence: Nazli Demirel, bmRlbWlyZWxAaXN0YW5idWwuZWR1LnRy