 Shinnosuke Nakayama1*
 WenXin Dong1Richard G. Correro1Elizabeth R. Selig1Colette C.C. Wabnitz1,2Trevor J. Hastie3,4Jim Leape1Serena Yeung4
 Fiorenza Micheli1,5,6
- 1Stanford Center for Ocean Solutions, Stanford University, Stanford, CA, United States
- 2Institute for the Oceans and Fisheries, The University of British Columbia, Vancouver, BC, Canada
- 3Department of Statistics, Stanford University, Stanford, CA, United States
- 4Department of Biomedical Data Science, Stanford University, Stanford, CA, United States
- 5Hopkins Marine Station, Stanford University, Pacific Grove, CA, United States
- 6Oceans Department, Stanford University, Stanford, CA, United States
Monitoring marine use is essential to effective management but is extremely challenging, particularly where capacity and resources are limited. To overcome these limitations, satellite imagery has emerged as a promising tool for monitoring marine vessel activities that are difficult to observe through publicly available vessel-tracking data. However, the broader use of satellite imagery is hindered by the lack of a clear understanding of where and when it would bring novel information to existing vessel-tracking data. Here, we outline an analytical framework to (1) automatically detect marine vessels in optical satellite imagery using deep learning and (2) statistically contrast geospatial distributions of vessels with the vessel-tracking data. As a proof of concept, we applied our framework to the coastal regions of Peru, where vessels without the Automatic Information System (AIS) are prevalent. Quantifying differences in spatial information between disparate datasets—satellite imagery and vessel-tracking data—offers insight into the biases of each dataset and the potential for additional knowledge through data integration. Our study lays the foundation for understanding how satellite imagery can complement existing vessel-tracking data to improve marine oversight and due diligence.
Introduction
Geospatial information on marine vessels offers powerful insights that can be used for marine surveillance to strengthen national security, at-sea safety, fisheries management, and biological monitoring. A widely available source for such information is satellite-based vessel-tracking data collected through the Automatic Identification System (AIS). Originally designed to avoid vessel collisions, vessels larger than specific sizes (for example, about 20 m in the U.S. and 15 m in the EU) engaging on international voyages are required to transmit their geolocations to AIS (International Maritime Organization, 2015). Thanks to their extensive spatial and temporal coverages, AIS data are successfully applied to various aspects of marine monitoring, such as global fishing activities on the high seas (Kroodsma et al., 2018), anomaly detection of vessel behavior (Zhen et al., 2017), and animal conservation (Guzman et al., 2013; Queiroz et al., 2019; Womersley et al., 2022).
Despite their popularity, AIS data have critical limitations for marine surveillance. First, AIS suffers from drastic signal interference when too many vessels transmit signals in one location (Eriksen et al., 2006), making it impossible to distinguish high-density areas from low-density ones. Second, vessels on domestic voyages or of small sizes are not required to transmit AIS signals, biasing our knowledge of marine use towards large vessels on the high seas. Despite the significant contribution of small-scale fisheries to seafood catches (Mills et al., 2011), their importance to livelihoods and nutrition (Short et al., 2021), and their potential for ecological impacts through bycatch or overfishing (Peckham et al., 2007), the size selectivity of AIS data largely excludes small-scale fisheries, limiting our understanding of their effort at a global scale. Finally, vessels can cheat the system by turning off AIS transmitters onboard (Welch et al., 2022) or by spoofing their positions or identities (Katsilieris et al., 2013), making AIS less suitable for detecting illicit behavior (see Balduzzi et al., 2014 for more details of the threats to AIS). For commercial fishing vessels, many countries mandate the Vessel Monitoring System (VMS) to track geolocations of vessels registered to their countries via satellite, but national governments curate the data and often do not make them publicly available. The limitations of these data suggest that additional data are needed to supplement vessel-tracking data for a more complete understanding of vessel dynamics.
The desire to overcome current data limitations has led to a greater exploration of the possibilities offered by satellite imagery. The most commonly used is Synthetic Aperture Radar (SAR) imagery (Pichel and Clemente-Colón, 2000; Bovenga et al., 2014; Snapir et al., 2019), which uses beam-scanning radar to capture images independent of light and cloud coverage. Optical imagery has been emerging as an alternative to SAR imagery thanks to its higher resolution, more frequent updating, broader geospatial coverage, and easier accessibility compared to SAR data (Kanjir et al., 2018). Although optical satellite imagery could complement existing vessel-tracking data by providing additional information, its use for marine surveillance is challenged by two major limitations. One is the difficulty in classifying vessel types (such as fishing vessels, leisure boats, passenger vessels, cargo ships, and tankers) at typical image resolutions (for example, 3 m per pixel), hindering applications to specific research domains. Another limitation is the inability to track vessel movement and infer their activities given low update rates (for example, once a day).
Limitations of both vessel-tracking data and satellite imagery could be alleviated through data integration. In imagery-based vessel detection, data integration is often used to enhance geospatial coverage and detection accuracy by cross-matching vessels with vessel-tracking data through interpolation (Brekke et al., 2008; Jubelin and Khenchaf, 2014; Mazzarella et al., 2015). This approach contributes to estimating the pervasiveness of “dark” vessels operating without AIS signals (Hsu et al., 2019; Kurekin et al., 2019), or identifying fishing vessels operating illegally within foreign EEZs (Park et al., 2020a). In contrast to the gaining popularity of data integration, however, satellite imagery has not been used to complement geospatial information to include detection of small vessels that do not transmit AIS signals, or to quantify interactions (e.g., spatial overlap on fishing grounds) between industrial fleets and small-scale fisheries, for example. To enable broader use of satellite imagery for marine surveillance, it is important to understand what information satellite imagery could add to existing vessel-tracking data.
In this study, we present an analytical framework to evaluate the possibilities of satellite imagery to complement existing vessel-tracking data. Specifically, we illustrate (1) a deep learning approach for detecting vessels in optical satellite imagery and (2) a statistical method to compare vessel distributions detected in satellite imagery with AIS data towards assessing the added value of satellite imagery. As a proof of concept, we applied this analytical framework to two ports in Peru and explored the new insights generated through data integration.
Methods
Satellite imagery data
Images taken by PlanetScope satellites were sourced from Planet (www.planet.com). We downloaded satellite scenes from more than 40 locations on the Peruvian shoreline from 2016 to 2021. Each scene is an RGB-NIR image at a resolution of 3 m per pixel, having a cloud coverage rate lower than 3%. We processed the data by manually cropping off land area and gridding each scene into a set of 299 × 299 × 3 RGB images. Then, we created our own dataset to train and test the model described below by manually labeling vessel bounding boxes. Although several datasets of vessel images exist in the public domain (Gallego et al., 2018; Kaggle, 2018), the images we worked with were at a lower resolution, less well lit, and contained smaller vessels. Therefore, we opted to create our own dataset to improve the model performance (Quinonero-Candela et al., 2008). We ended up with 308 images containing at least one vessel and 11,538 images containing no vessels. In total, there were 3,046 vessel instances in the dataset.
Automated vessel detection model
To automatically locate vessels in satellite imagery, we used Faster R-CNN (Ren et al., 2015) with ResNet-50 (He et al., 2016) backbone pretrained on the COCO image dataset (Lin et al., 2014). We opted for Faster R-CNN as it is one of the state-of-the-art deep learning models for object detection. There are other deep learning models with different architectures for object detection, such as U-Net (Ronneberger et al., 2015) and YOLO (Redmon et al., 2016), which could be equally suitable. Our Faster R-CNN model was trained end-to-end using SGD optimizer with a learning rate of 0.001, momentum of 0.9, weight decay of 0.0005, and batch size of 16. The Faster R-CNN model was trained for 20 epochs, as determined by the best validation F-1 score. To improve detection accuracy and speed, we first ran the image through a binary classifier to determine whether there were any vessels present in the image. The classifier model is a ResNet-50 model pretrained on ImageNet1k and fine-tuned on the same dataset as the Faster R-CNN detector model. The classifier model was trained for 4 epochs, as determined by the best validation F-1 score. To address dataset imbalance, we sampled an equal number of images containing vessels and images without vessels for each mini-batch when training both models. To augment our dataset, each training image was first randomly flipped horizontally with a probability of 0.5, then vertically with a probability of 0.5. Validation and test splits are each sourced from a location along the shore not contained in the training dataset. The model was implemented in the Python package torchvision ver. 0.13.0.
The model was evaluated on the hold-out test set consisting of 41 vessels and 269 images without vessels at IoU (Intersection over Union) = 0.1. If one needs a more reliable estimate for model performance, K-fold cross-validation is preferrable to hold-out, although it requires more computational resources and time.
Comparing satellite imagery with AIS data
To assess whether our approach provides additional information relative to existing vessel-tracking data, we explored the similarity of vessel distributions detected in satellite imagery and the AIS data using a log-Gaussian Cox process (LGCP) model (Møller et al., 1998). The utility of this spatial model lies in the parametric characterization of the underlying process of point patterns for interpretations. Thanks to its flexibility, LGCP is widely used to model spatial point patterns in various fields, including ecology (Conn et al., 2014; Waagepetersen et al., 2016), epidemiology (Li et al., 2012; Giorgi et al., 2016), and seismology (D’Angelo et al., 2022), but has not been applied to marine vessels yet. In this paper, we introduce the LGCP model as a powerful instrument to compare vessel distributions between AIS data and satellite imagery. The model could readily be extended to ask more complex questions by incorporating covariates, such as fish distributions and ocean climate data. If flexibility of the process-based approach is not required, one can compare two point patterns using simpler distance-based methods, such as nearest neighbor distance and Ripley’s K function (Diggle, 2013).
LGCP characterizes spatial point patterns as a Poisson point process that is conditionally dependent on a spatially varying intensity field modeled as a Gaussian process. That is, for a set of locations s in a region of interest D, we represent the Poisson intensity function λ(s) by log λ(s) = z(s), where z(s) is a realization of a Gaussian process for s ∈ D. The univariate LGCP can be naturally extended to model two datasets as point processes over D (Møller et al., 1998; Gelfand and Schliep, 2018). Assuming that each dataset follows an independent Poisson process with intensity λ1(s) and λ2(s), respectively, they can be modeled together as LGCP with log intensity z(s) = (z1(s), z2(s))T, where z(s) is a vector of Gaussian process with μ = (μ1, μ2)T and covariance functions c(s, s′) = cov(z1(s), z2(s′)) for s ∈ D and s′ ∈ D (Gelfand and Schliep, 2018).
Using a linear model of coregionalization (Gelfand et al., 2004), we can rewrite the log intensity as z(s) = β + AV(s), where β = (β1, β2)T is a vector of intercepts, A is a lower triangular matrix with element aij, and V(s) = (V1(s), V2(s))T is a vector of independent Gaussian processes V1(s) and V2(s) with mean 0 and variance 1, respectively (Gelfand and Schliep, 2018). Here, coefficient a21 of the lower triangular matrix A indicates the magnitude of dependence between the two intensity fields, where positive and negative values indicate spatial clustering and inhibition of points of the two datasets, respectively. When there is no local spatial dependence between the intensity fields, we expect a21 to be close to zero.
This model can also accommodate covariates that may explain vessel distributions. We can easily do so by extending the log intensity as z(s) = X(s)γ + AV(s), where γ is a vector consisting of an intercept and slopes of variables of interest corresponding to a design matrix X(s).
Applying the framework
As a proof of concept, we applied our framework of detecting vessels in satellite imagery and comparing vessel distributions with vessel-tracking data to areas off the ports of Talara and Paita in northern Peru (Figure 1). We selected these locations because vessels on the images were likely to consist of fishing vessels and differ from the AIS data, considering that both ports are located in the Piura region, where small-scale fisheries are predominant (Alfaro-Shigueto et al., 2010). Although large commercial fishing vessels are not allowed to operate near the coast of Peru, the port of Talara experiences heavy traffic by AIS-carrying vessels (mostly passengers and tankers), whereas the port of Paita is less used by them. For each area, we aggregated vessel locations (10 × 10 km2) from January 1 to December 31, 2020. To explore whether the information of vessel distribution was different from that from the AIS data, we obtained the AIS data pre-processed by Global Fishing Watch (https://globalfishingwatch.org). For each vessel on the days when the satellite images were taken, we subsampled the AIS data by selecting one vessel location around 10 am at a local time (time when the satellite images were taken) within a 1-hour buffer to mirror the frequency of the satellite imagery data.
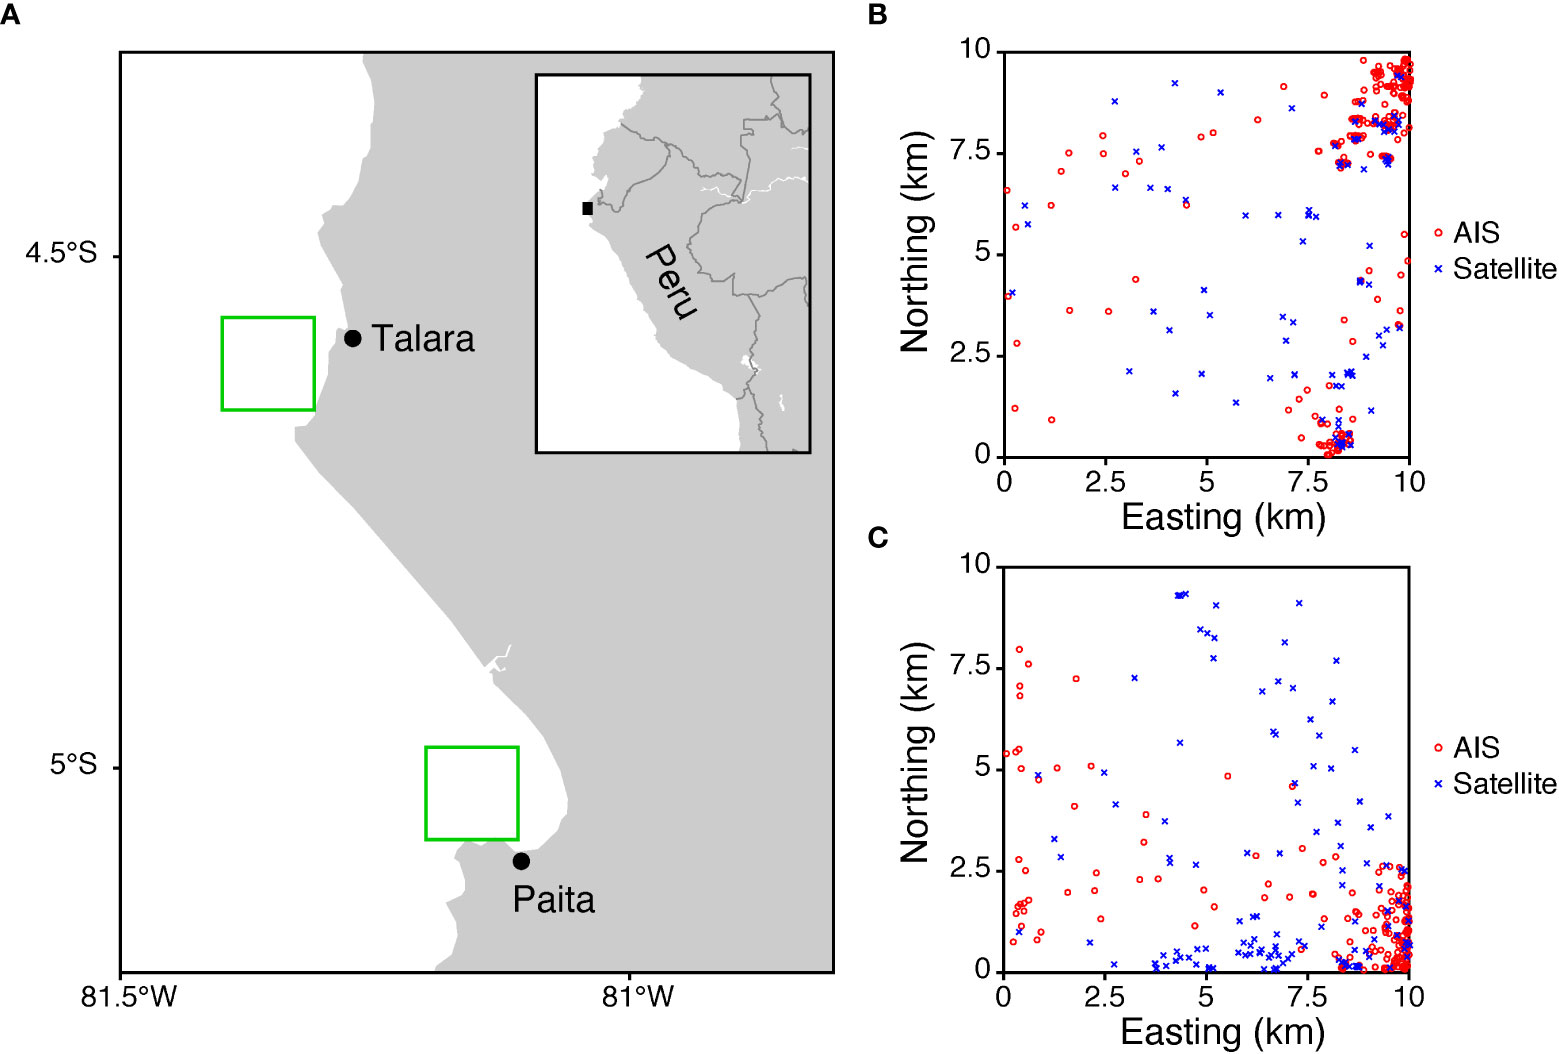
Figure 1 Study sites and vessel distributions. (A) Green squares near Talara and Paita in Peru indicate the areas where we applied the automated vessel detection model. (B) Locations of vessels from the AIS data and the optical satellite imagery near Talara. (C) Locations of vessels near Paita. AIS data is displayed in red circles, satellite in blue crosses. Data were collected from January 1 to December 31, 2020. For the AIS data, one vessel location was subsampled to mirror the sampling frequency of the satellite imagery data.
To apply the bivariate LGCP model, we divided each area into 10 × 10 grid cells and summed the number of vessels in each cell (1 × 1 km2) for each point type (AIS or satellite imagery). We fitted a bivariate LGCP model to the vessel counts using an exponentiated quadratic kernel as a covariance function of Gaussian process V1(s) and V2(s). For priors, we used a uniform distribution between 100 and 5,000 for length scale l of the kernel. For the elements of matrix A, we used an exponential distribution with λ = 1 for a11 and a22 and a normal distribution with μ = 0 and σ = 10 for a21. For the intercepts β1 and β2, we used a normal distribution with μ = 0 and σ = 10. We checked the adequateness of the model structure and priors by diagnosing the trace plots and posterior predictive distribution. The posteriors were obtained over 2 chains, with 1,000 draws after 1,000 burn-ins each, using the No-U-Turn Sampler (Hoffman and Gelman 2014). The model was fitted in the Python package PyMC ver. 4.4.0. The script and the model performance checks can be found in the GitHub repository (https://github.com/stanford-cos/lgcp).
Results
Our framework started with automatically detecting marine vessels in optical satellite imagery. For the performance of the vessel detection model, we report F1 score, precision, recall, and AP (Average Precision) following standard convention. AP measures the area under the precision-recall curve by changing the model confidence score from 0 to 1. Our ResNet-50 classifier and Faster R-CNN detector pipeline performs at F1 = 0.84, precision = 0.87, recall = 0.80, and AP = 0.72. F1, precision, and recall are measured using a classifier confidence threshold of 0.1 and detector confidence threshold of 0.5 (see Figure 2 for example).
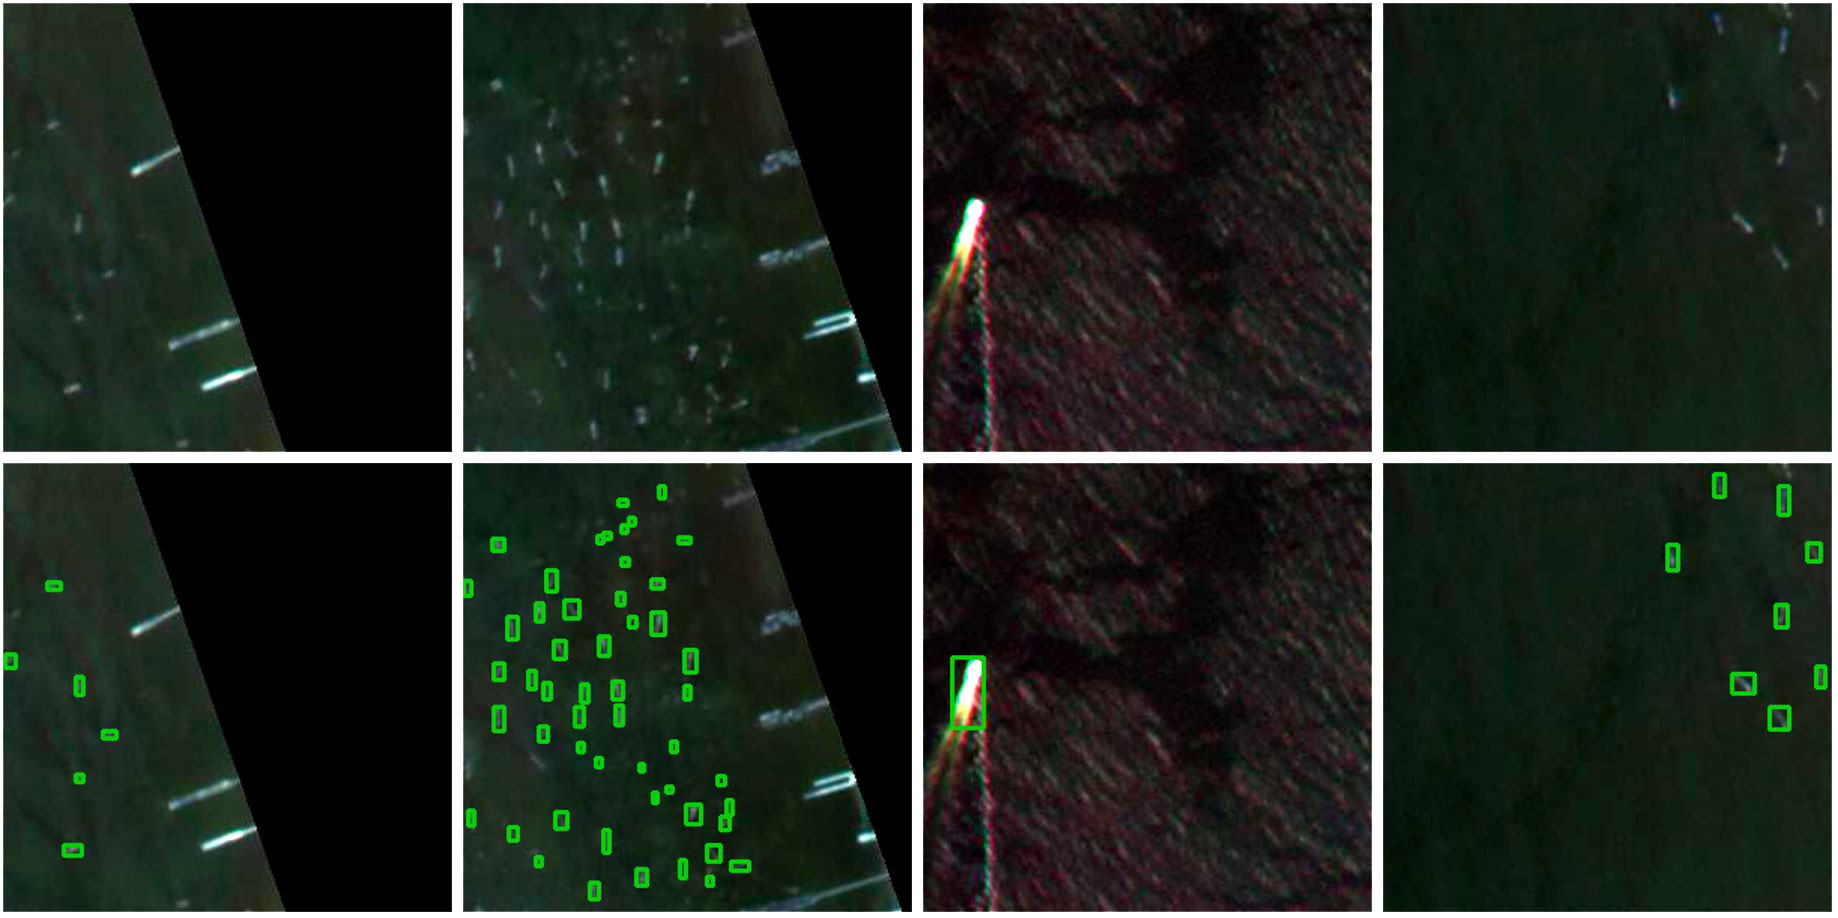
Figure 2 Example of vessel detection. Top: original images. Bottom: vessel detection algorithm applied to the corresponding images. Boxes indicate the vessels detected by our algorithm.
The model detected 118 vessels in Talara and 151 vessels in Paita (Figure 1). In Talara, vessels were concentrated in the northeastern part of the focal region near the port entrance, as well as the southeastern part. We observed a similar distribution in the AIS vessels. By contrast, in Paita, the distribution of vessels detected in satellite imagery were different from that of the AIS data. In the satellite imagery, a high concentration of vessels was detected in the southern part of the focal region outside the Port of Paita, whereas AIS vessels were aggregated in the southeastern part of the focal region near the port entrance (Figure 1).
The point pattern analysis showed that differences in vessel distributions between satellite imagery and AIS data depended on locations. In the bivariate LGCP model fitted to the point data in Talara, the positive value of a21 indicates that the vessel distributions from the AIS data and the satellite imagery partly share the common underlying process (Table 1). That is, the vessel distributions obtained from the satellite imagery and the AIS data show relatively similar patterns. In Paita, by contrast, the small value of a21 with 94% HDI overlapping zero indicates little dependence between the two distributions (Table 1). That is, the spatial point patterns in the two samples were likely to be underpinned by different processes in this region, which was characterized by a11 and a22.
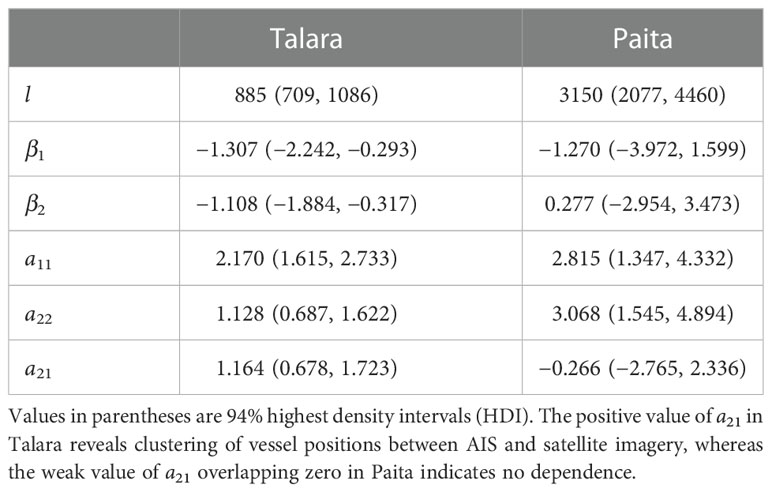
Table 1 Posterior estimates for the bivariate log-Gaussian Cox process (LGCP) model fitted to vessel distributions in two locations in Peru.
Visualization of the estimated model parameters illuminated contrasting differences in the processes that underpinned the vessel distributions (Figure 3). When the posterior predictive distributions of the estimated intensities λ1(s) and λ2(s) were resampled for the 0.2 × 0.2 km2 cells in Talara, we see dense vessel distributions in the northeast corner of the focal region and relatively low densities elsewhere in both the AIS data and satellite imagery. In Paita, we see a high density of AIS-carrying vessels near the port entry in the southeast corner of the focal region, but vessels detected in the satellite imagery are concentrated outside the port (Figure 3).
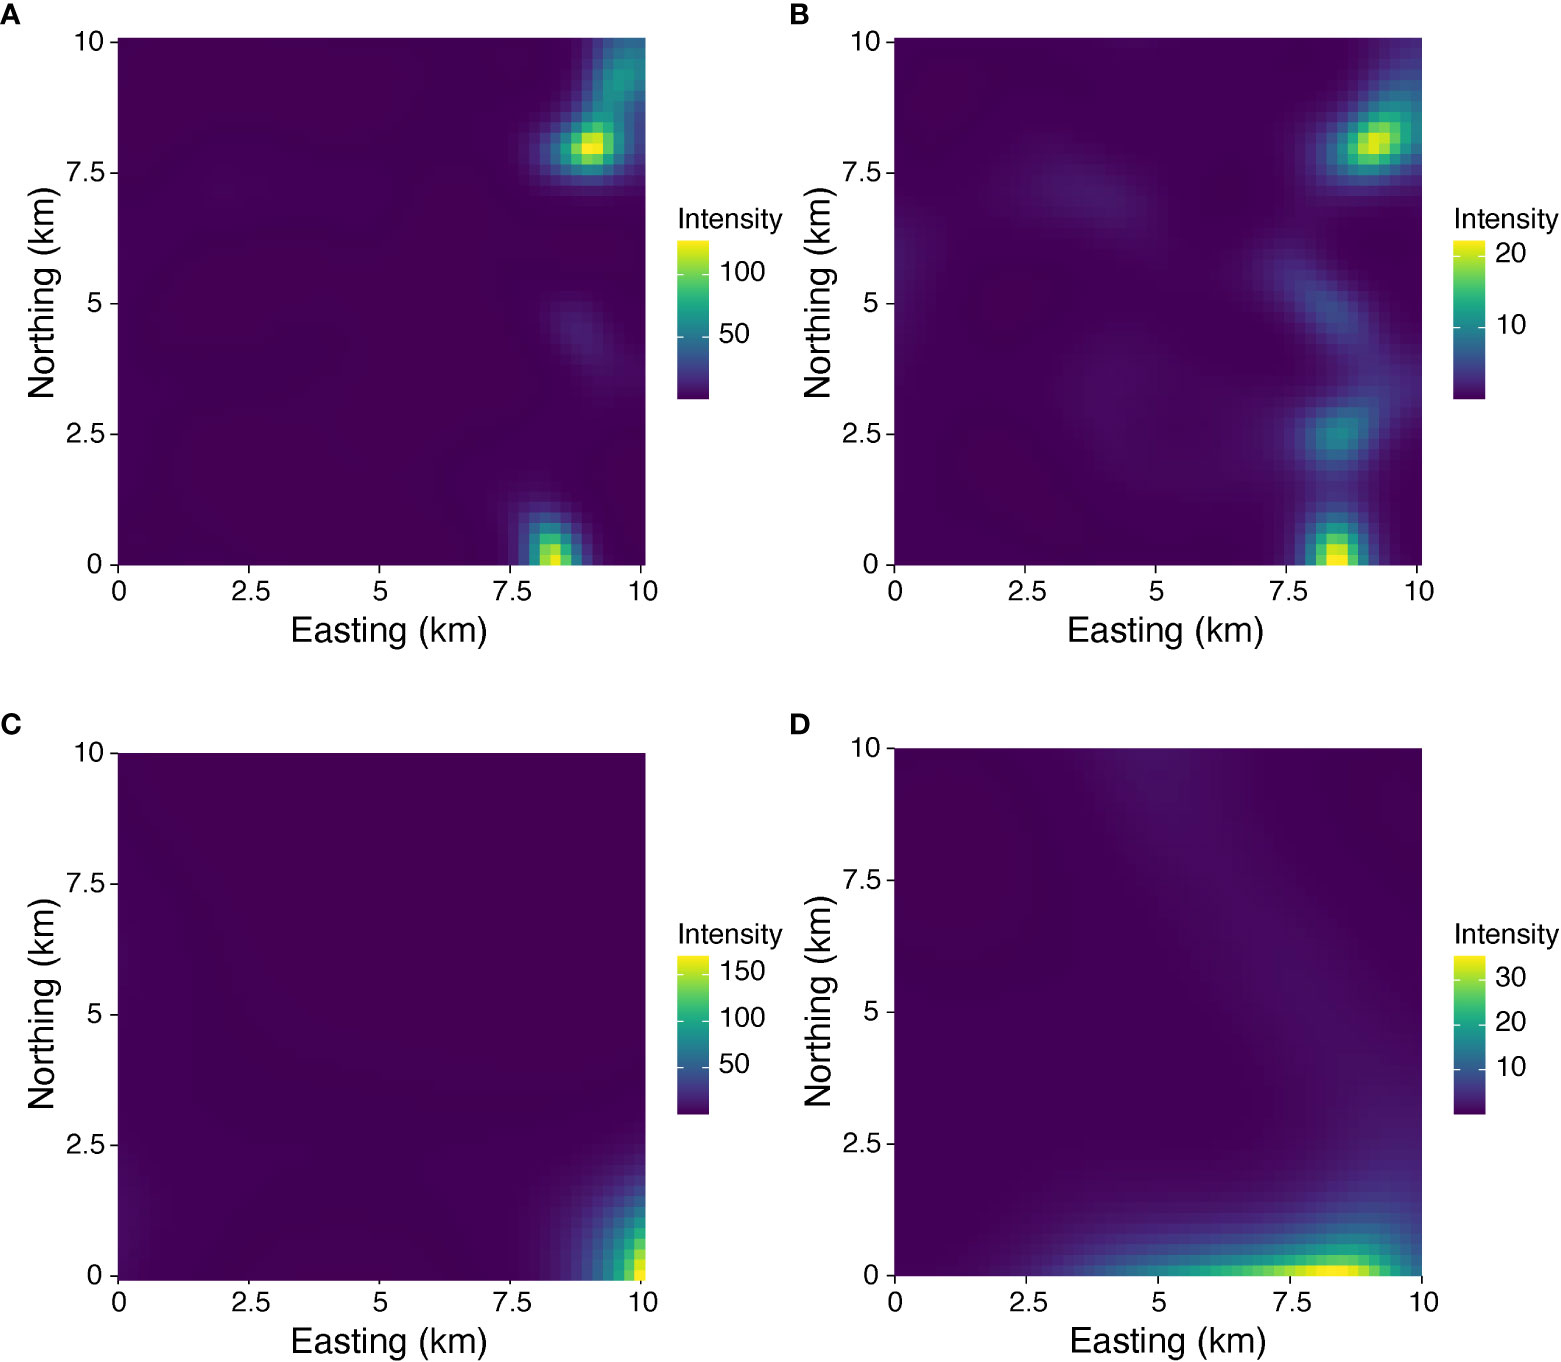
Figure 3 Model estimates of vessel distributions. (A) AIS data in Talara, (B) satellite imagery in Talara, (C) AIS data in Paita, and (D) satellite imagery in Paita. Values are the sample means of the posterior predictive distributions corresponding to 0.2 × 0.2 km2 cells. For all images the warmer (yellow) the color the higher the number of vessels detected. Note that the intensity scales vary across the 4 images.
Discussion
This study demonstrates a potential application of satellite imagery to complement publicly available vessel-tracking data. Specifically, we show that satellite imagery could provide additional information to AIS datasets on vessel distribution. In our proof of concept, we found that the vessel distribution in the satellite imagery was independent of that in the AIS data in Paita. Considering the prevalence of small-scale fisheries in the area (Alfaro-Shigueto et al., 2010), it is possible that the satellite imagery detected small vessels without AIS devices. By contrast, in Talara, we found that vessel distributions were more similar between AIS and satellite imagery. This indicates that vessels detected in satellite imagery would likely be AIS vessels or non-AIS vessels that show a geospatial distribution similar to AIS vessels. The differences in AIS and satellite imagery vessel distributions could depend on many factors, including location, time, and spatial and temporal resolutions of interest, and our framework allows systematic investigation to test such factors. These new insights could then be used to strengthen marine surveillance under limited resources. For example, it could help identify and prioritize areas heavily utilized by small-scale fishing fleets for additional surveillance methods.
The analytical framework we introduced here can also be used as a robust foundation to investigate factors that bring about differences in vessel distributions between data sources. For example, we could learn the dynamics of vessels that do not transmit AIS signals and explore the potential factors that underpin differences in distribution by systematically comparing geospatial patterns of vessels between AIS data and satellite imagery across locations and over time. Such an approach is particularly useful when trying to glean a comprehensive picture of vessel dynamics for a given area. In addition, the LGCP model can easily be extended to include covariates, such as water temperature, chlorophyll-a, bathymetric features, and distance to marine protected areas, to explore factors that drive realized geospatial distributions of marine vessels.
The research field of automated vessel detection has been rapidly advancing, with the improvement of deep learning techniques for object detection (Cheng et al., 2016; Kang et al., 2017; Liu et al., 2021a) and the adoption of novel approaches, such as use of wakes behind moving vessels (Graziano and Renga, 2021; Liu et al., 2021b) and multispectral imagery (Wang et al., 2021). The field of vessel detection will further advance with the increasing accessibility to super high-resolution imagery (Jérôme, 2019), which could allow the classification of vessel types and fishing gears in the near future. These advances in technology and data quality will accelerate the possibilities of the applications of satellite imagery, and this study exemplifies one direction to embrace unprecedented opportunities, in addition to the traditional cross-matching with vessel-tracking data.
Ocean problems are often complex and multifaceted, making it challenging to address with a single data source. Data integration offers a powerful framework that could highlight where due diligence is needed. Quantification of information differences illuminates the biases of each dataset. A clear understanding of such biases supports the effective integration of similar data types, such as VIIRS (Hsu et al., 2019), over-the-horizon radar (Ponsford et al., 2017; Yang et al., 2022), and hyperspectral imagery (Park et al., 2018; Park et al., 2020b). Ultimately, knowing the uniqueness of each data source will help gauge the likelihood of generating new knowledge beyond the original scope of each dataset to address specific questions through data integration. By looking through multiple lenses, we can triangulate the problems, shed light on different aspects, and discover novel insights. At the same time, our study echoes the importance of a multi-data approach and data sharing in marine surveillance (Dupont et al., 2020).
Data availability statement
The datasets presented in this study can be found in online repositories https://github.com/stanford-cos/lgcp.
Author contributions
All authors helped design the study. WD and RC led the satellite imagery analysis and performance assessment. SN performed spatial data analysis and drafted the manuscript. SY, TH, CW, ES and FM supervised the analysis. All authors contributed to the article and approved the submitted version.
Funding
This research was funded by National Science Foundation (OAC #1934578) and the Stanford Institute for Human-Centered Artificial Intelligence (HAI) Seed Grant. RC was financially supported by the Undergraduate Summer Research Program by the Department of Statistics at Stanford University.
Conflict of interest
The authors declare that the research was conducted in the absence of any commercial or financial relationships that could be construed as a potential conflict of interest.
Publisher’s note
All claims expressed in this article are solely those of the authors and do not necessarily represent those of their affiliated organizations, or those of the publisher, the editors and the reviewers. Any product that may be evaluated in this article, or claim that may be made by its manufacturer, is not guaranteed or endorsed by the publisher.
Supplementary material
The Supplementary Material for this article can be found online at: https://www.frontiersin.org/articles/10.3389/fmars.2022.1076775/full#supplementary-material
References
Alfaro-Shigueto J., Mangel J. C., Pajuelo M., Dutton P. H., Seminoff J. A., Godley B. J. (2010). Where small can have a large impact: Structure and characterization of small-scale fisheries in Peru. Fish Res. 106, 8–17. doi: 10.1016/j.fishres.2010.06.004
Balduzzi M., Pasta A., Wilhoit K. (2014). “A security evaluation of AIS automated identification system,” in Proceedings of the 30th annual computer security applications conference Association for Computing Machinery. 436–445. doi: 10.1145/2664243.2664257
Bovenga F., Derauw D., Rana F. M., Barbier C., Refice A., Veneziani N., et al. (2014). Multi-chromatic analysis of SAR images for coherent target detection. Remote Sens 6, 8822–8843. doi: 10.3390/rs6098822
Brekke C., Weydahl D. J., Helleren Ø., Olsen R. (2008). “Ship traffic monitoring using multi-polarisation satellite SAR images combined with AIS reports,” in 7th European Conference on Synthetic Aperture Radar (VDE) (VDE). https://ieeexplore.ieee.org/document/5757165
Cheng G., Zhou P., Han J. (2016). Learning rotation-invariant convolutional neural networks for object detection in VHR optical remote sensing images. IEEE Trans. Geosci. Remote Sens 54, 7405–7415. doi: 10.1109/TGRS.2016.2601622
Conn P. B., Ver Hoef J. M., McClintock B. T., Moreland E. E., London J. M., Cameron M. F., et al. (2014). Estimating multispecies abundance using automated detection systems: Ice-associated seals in the Bering Sea. Methods Ecol. Evol. 5, 1280–1293. doi: 10.1111/2041-210X.12127
D’Angelo N., Siino M., D’Alessandro A., Adelfio G. (2022). Local spatial log-Gaussian cox processes for seismic data. AStA Adv. Stat. Anal., 106, 633-671. doi: 10.1007/s10182-022-00444-w
Diggle P. J. (2013). Statistical analysis of spatial and spatio-temporal point patterns (Boca Raton, FL, USA: CRC press).
Dupont C., Gourmelon F., Meur-Ferec C., Herpers F., Le Visage C. (2020). Exploring uses of maritime surveillance data for marine spatial planning: A review of scientific literature. Mar. Policy 117, 103930. doi: 10.1016/j.marpol.2020.103930
Eriksen T., Høye G., Narheim B., Meland B. J. (2006). Maritime traffic monitoring using a space-based AIS receiver. Acta Astronaut 58, 537–549. doi: 10.1016/j.actaastro.2005.12.016
Gallego A.-J., Pertusa A., Gil P. (2018). Automatic ship classification from optical aerial images with convolutional neural networks. Remote Sens 10, 511. doi: 10.3390/rs10040511
Gelfand A. E., Schliep E. M. (2018). “Special topics in point pattern analysis,”. Bayesian Inference Computing Spatial Point Patterns (Institute Math. Statistics) 83–111, 83–111. doi: 10.1214/cbms/1530065039
Gelfand A. E., Schmidt A. M., Banerjee S., Sirmans C. F. (2004). Nonstationary multivariate process modeling through spatially varying coregionalization. Test 13 (2), 263–312.
Giorgi E., Kreppel K., Diggle P. J., Caminade C., Ratsitorahina M., Rajerison M., et al. (2016). Modeling of spatio-temporal variation in plague incidence in Madagascar from 1980 to 2007. Spat Spatio-Temporal Epidemiol 19, 125–135. doi: 10.1016/j.sste.2016.10.001
Graziano M. D., Renga A. (2021). Towards automatic recognition of wakes generated by dark vessels in sentinel-1 images. Remote Sens 13, 1955. doi: 10.3390/rs13101955
Guzman H. M., Gomez C. G., Guevara C. A., Kleivane L. (2013). Potential vessel collisions with southern hemisphere humpback whales wintering off pacific Panama. Mar. Mammal Sci. 29, 629–642. doi: 10.1111/j.1748-7692.2012.00605.x
He K., Zhang X., Ren S., Sun J. (2016). “Deep residual learning for image recognition,” in Proceedings of the IEEE conference on computer vision and pattern recognition (IEEE). 770–778. https://ieeexplore.ieee.org/document/7780459
Hsu F.-C., Elvidge C. D., Baugh K., Zhizhin M., Ghosh T., Kroodsma D., et al. (2019). Cross-matching VIIRS boat detections with vessel monitoring system tracks in Indonesia. Remote Sens 11, 995. doi: 10.3390/rs11090995
Hoffman M. D., Gelman A. (2014). The no-U-Turn sampler: Adaptively setting path lengths in Hamiltonian Monte Carlo. J. Mach. Learn. Res. 15 (1), 1593–1623.
International Maritime Organization (2015). Revised guidelines for the onboard operational use of shipborne automatic identification systems (AIS).
Jérôme S. (2019). “Shaping the future of earth observation with pléiades neo,” in 2019 9th International Conference on Recent Advances in Space Technologies (RAST), IEEE. 399–401. doi: 10.1109/RAST.2019.8767438
Jubelin G., Khenchaf A. (2014). “A unified algorithm for ship detection on optical and SAR spaceborne images,” in Image and signal processing for remote sensing XX (SPIE Press), 318–326. doi: 10.1117/12.2067154
Kaggle (2018) Dataset for Airbus ship dectection challenge. Available at: https://www.kaggle.com/c/airbus-ship-detection/data.
Kang M., Ji K., Leng X., Lin Z. (2017). Contextual region-based convolutional neural network with multilayer fusion for SAR ship detection. Remote Sens 9, 860. doi: 10.3390/rs9080860
Kanjir U., Greidanus H., Oštir K. (2018). Vessel detection and classification from spaceborne optical images: A literature survey. Remote Sens Environ. 207, 1–26. doi: 10.1016/j.rse.2017.12.033
Katsilieris F., Braca P., Coraluppi S. (2013). “Detection of malicious AIS position spoofing by exploiting radar information,” in proceedings of the 16th international conference on information fusion. 1196–1203 (IEEE). https://ieeexplore.ieee.org/document/6641132
Kroodsma D. A., Mayorga J., Hochberg T., Miller N. A., Boerder K., Ferretti F., et al. (2018). Tracking the global footprint of fisheries. Science 359, 904–908. doi: 10.1126/science.aao5646
Kurekin A. A., Loveday B. R., Clements O., Quartly G. D., Miller P. I., Wiafe G., et al. (2019). Operational monitoring of illegal fishing in Ghana through exploitation of satellite earth observation and AIS data. Remote Sens 11, 293. doi: 10.3390/rs11030293
Li Y., Brown P., Gesink D. C., Rue H. (2012). Log Gaussian cox processes and spatially aggregated disease incidence data. Stat. Methods Med. Res. 21, 479–507. doi: 10.1177/0962280212446326
Lin T.-Y., Maire M., Belongie S., Hays J., Perona P., Ramanan D., et al. (2014). “Microsoft COCO: Common objects in context,” in European conference on computer vision. 740–755 (Springer). doi: 10.1007/978-3-319-10602-1_48
Liu R. W., Yuan W., Chen X., Lu Y. (2021a). An enhanced CNN-enabled learning method for promoting ship detection in maritime surveillance system. Ocean Eng 235, 109435. doi: 10.1016/j.oceaneng.2021.109435
Liu Y., Zhao J., Qin Y. (2021b). A novel technique for ship wake detection from optical images. Remote Sens Environ. 258, 112375. doi: 10.1016/j.rse.2021.112375
Mazzarella F., Vespe M., Santamaria C. (2015). SAR ship detection and self-reporting data fusion based on traffic knowledge. IEEE Geosci. Remote Sens Lett. 12, 1685–1689. doi: 10.1109/LGRS.2015.2419371
Møller J., Syversveen A. R., Waagepetersen R. P. (1998). Log Gaussian cox processes. Scand. J. Stat. 25, 451–482. doi: 10.1111/1467-9469.00115
Mills D. J., Westlund L., de Graaf G., Kura Y., Willman R., Kelleher K. (2011). Under-reported and undervalued: Small-scale fisheries in the developing world. Small-Scale Fish Manage. Framew Approaches Dev. World 1, 1–15. doi: 10.1079/9781845936075.0001
Park J.-J., Kim T.-S., Park K.-A., Oh S., Lee M., Foucher P.-Y. (2020b). Application of spectral mixture analysis to vessel monitoring using airborne hyperspectral data. Remote Sens 12, 2968. doi: 10.3390/rs12182968
Park J., Lee J., Seto K., Hochberg T., Wong B. A., Miller N. A., et al. (2020a). Illuminating dark fishing fleets in north Korea. Sci. Adv. 6, eabb1197. doi: 10.1126/sciadv.abb1197
Park K.-A., Park J.-J., Jang J.-C., Lee J.-H., Oh S., Lee M. (2018). Multi-spectral ship detection using optical, hyperspectral, and microwave SAR remote sensing data in coastal regions. Sustainability 10, 4064. doi: 10.3390/su10114064
Peckham S. H., Díaz D. M., Walli A., Ruiz G., Crowder L. B., Nichols W. J. (2007). Small-scale fisheries bycatch jeopardizes endangered pacific loggerhead turtles. PloS One 2, e1041. doi: 10.1371/journal.pone.0001041
Pichel W. G., Clemente-Colón P. (2000). NOAA CoastWatch SAR applications and demonstration. Johns Hopkins APL Tech Dig 21, 49–57.
Ponsford A., McKerracher R., Ding Z., Moo P., Yee D. (2017). Towards a cognitive radar: Canada’s third-generation high frequency surface wave radar (HFSWR) for surveillance of the 200 nautical mile exclusive economic zone. Sensors 17, 1588. doi: 10.3390/s17071588
Queiroz N., Humphries N. E., Couto A., Vedor M., Da Costa I., Sequeira A. M., et al. (2019). Global spatial risk assessment of sharks under the footprint of fisheries. Nature 572, 461–466. doi: 10.1038/s41586-019-1444-4
Quinonero-Candela J., Sugiyama M., Schwaighofer A., Lawrence N. D. (2008). Dataset shift in machine learning (Cambridge, MA, USA: MIT Press).
Redmon J., Divvala S., Girshick R., Farhadi A. (2016). “You only look once: Unified, real-time object detection,” in Proceedings of the IEEE conference on computer vision and pattern recognition (IEEE). 779–788. doi: 10.1109/CVPR.2016.91
Ren S., He K., Girshick R., Sun J. (2015). Faster r-CNN: Towards real-time object detection with region proposal networks. Adv. Neural Inf. Process Syst. 28.
Ronneberger O., Fischer P., Brox T. (2015). “U-Net: Convolutional networks for biomedical image segmentation,” in International Conference on Medical image computing and computer-assisted intervention. 234–241 (Springer). doi: 10.1007/978-3-319-24574-4_28
Short R. E., Gelcich S., Little D. C., Micheli F., Allison E. H., Basurto X., et al. (2021). Harnessing the diversity of small-scale actors is key to the future of aquatic food systems. Nat. Food 2, 733–741. doi: 10.1038/s43016-021-00363-0
Snapir B., Waine T. W., Biermann L. (2019). Maritime vessel classification to monitor fisheries with SAR: Demonstration in the north Sea. Remote Sens 11, 353. doi: 10.3390/rs11030353
Waagepetersen R., Guan Y., Jalilian A., Mateu J. (2016). Analysis of multispecies point patterns by using multivariate log-Gaussian cox processes. J. R. Stat. Soc Ser. C Appl. Stat. 65, 77–96. doi: 10.1111/rssc.12108
Wang W., Ren J., Su C., Huang M. (2021). Ship detection in multispectral remote sensing images via saliency analysis. Appl. Ocean Res. 106, 102448.
Welch H., Clavelle T., White T. D., Cimino M. A., Van Osdel J., Hochberg T., et al. (2022). Hot spots of unseen fishing vessels. Sci. Adv. 8, eabq2109. doi: 10.1126/sciadv.abq2109
Womersley F. C., Humphries N. E., Queiroz N., Vedor M., da Costa I., Furtado M., et al. (2022). Global collision-risk hotspots of marine traffic and the world’s largest fish, the whale shark. Proc. Natl. Acad. Sci. 119, e2117440119. doi: 10.1073/pnas.2117440119
Yang L., Zhang H., Zhou M. (2022). Identification of ships moving in formation by HFSWR using an ISAR cross-range imaging algorithm. Remote Sens Lett. 13, 76–86. doi: 10.1080/2150704X.2021.1985739
Keywords: automatic information system (AIS), automated vessel detection, data integration, deep learning, fisheries management, log-Gaussian Cox process, satellite imagery, spatial statistics
Citation: Nakayama S, Dong W, Correro RG, Selig ER, Wabnitz CCC, Hastie TJ, Leape J, Yeung S and Micheli F (2023) Comparing spatial patterns of marine vessels between vessel-tracking data and satellite imagery. Front. Mar. Sci. 9:1076775. doi: 10.3389/fmars.2022.1076775
Received: 21 October 2022; Accepted: 19 December 2022;
Published: 20 January 2023.
Edited by:
Simone Marini, National Research Council (CNR), ItalyReviewed by:
Qiqi Zhu, China University of Geosciences Wuhan, ChinaValmik Nikam, Veermata Jijabai Technological Institute, India
Copyright © 2023 Nakayama, Dong, Correro, Selig, Wabnitz, Hastie, Leape, Yeung and Micheli. This is an open-access article distributed under the terms of the Creative Commons Attribution License (CC BY). The use, distribution or reproduction in other forums is permitted, provided the original author(s) and the copyright owner(s) are credited and that the original publication in this journal is cited, in accordance with accepted academic practice. No use, distribution or reproduction is permitted which does not comply with these terms.
*Correspondence: Shinnosuke Nakayama, c2hpbm4xQHN0YW5mb3JkLmVkdQ==