 Mauricio J. Carter1*†
 M. Roberto García-Huidobro2†
 Marcela Aldana2†
 Enrico L. Rezende3†
 Francisco Bozinovic3†
 Cristóbal Galbán-Malagón4†
 José M. Pulgar1†
- 1Departamento de Ecología y Biodiversidad, Facultad de Ciencias de la Vida, Universidad Andrés Bello, Santiago, Chile
- 2Centro de investigación e Innovación para el Cambio Climático, Facultad de Ciencias, Universidad Santo Tomás, Santiago, Chile
- 3Departamento de Ecología, Center of Applied Ecology and Sustainability (CAPES), Facultad de Ciencias Biológicas, Pontificia Universidad Católica de Chile, Santiago, Chile
- 4Center for Genomics, Ecology & Environments (GEMA), Universidad Mayor, Santiago, Chile
Antarctic marine animals face one of the most extreme thermal environments, characterized by a stable and narrow range of low seawater temperatures. At the same time, the Antarctic marine ecosystems are threatened by accelerated global warming. Determining the upper thermal limits (CTmax) is crucial to project the persistence and distribution areas of the Antarctic marine species. Using thermal death time curves (TDT), we estimated CTmax at different temporal scales from 1 minute to daily and seasonal, the predict vulnerability to the current thermal variation and two potential heatwave scenarios. Our results revealed that CTmax at 1 min are far from the temperature present in the marine intertidal area where our study species, showing Echinoderm species higher CTmax than the Chordata and Arthropods species. Simulations indicated that seasonal thermal variation from the intertidal zone contributed to basal mortality, which increased after considering moderate scenarios of heatwaves (+2°C) in the Shetland Archipelago intertidal zone. Our finding highlighted the relevance of including exposure time explicitly on the CTmax estimates, which deliver closer and more realistic parameters according to the species that may be experiencing in the field.
Introduction
Global warming (GW) poses one of the greatest threats to biodiversity (Pecl et al., 2017), leading by anthropogenic activities that are likely to increase the frequency of mean temperatures and extreme heatwaves in regions such as the Antarctic continent (Robinson et al., 2020; González-Herrero et al., 2022; Turner et al., 2022). Polar areas such as Antarctica Peninsula have experienced the increasing effect of GW due to anthropogenic activities worldwide affecting surface seawater temperature variation in the last 50 years to about ~ 2°C (Meredith and King, 2005; Cook et al., 2016; Morley et al., 2020). These extreme zones are also characterized by marine species adapted to relatively stable and isolated conditions, which are harmed due to the increased temperature associated with GW (Peck, 2018). The increased seawater temperature and their impact on Antarctic animals, represent an ideal scenery to understand the impact of increased GW on habitats and species adapted to low temperatures.
Because the shape of thermal performance is determined by multiple sensitive biological rates (Lefevre et al., 2021), this biological phenomenon is ultimately linked with the thermal limits for life and death in ectotherms experience. Also, thermal windows that a species can successfully tolerate providing a good insight into the thermal niche of taxa (Rezende et al., 2014), helping determine species distribution modeling and predict response to GW (Sunday et al., 2012; Liao et al., 2021; Ørsted et al., 2022). Determining the consequences of GW on Antarctic marine communities is crucial to building a detailed description of the organismal performance in challenger thermal conditions, which aids in predicting the thermal tolerance responses from species under thermal stress (Sinclair et al., 2016). Based on the intimate nature of intensity and time of exposition that thermal stress had, Thermal Death Time curves (TDTs) have been explicitly formalized to evaluate the impact of time on the critical response to thermal stress (Rezende et al., 2014; Jørgensen et al., 2021). Recently, a detailed description of upper thermal limits from 39 ectotherm marine species belonging to the Antarctic ecosystem has revealed differences in thermal sensitivity among taxa (Molina et al., 2022). This approach using TDTs explicitly considers exposure time to thermal stress on an ecological scale. This remarkable methodological tool allows for specifying relevant temporal windows of thermal stress. Then, the risk of extirpation due to the temperature increment in bounded time, such as extreme heatwave events, may be determined (Hobday et al., 2016; Hobday et al., 2018). For animals that inhabit outer regions, thermal sensitivity is an urgent need due to assessing the magnitude of time effects to obtain a precise estimate of CTmax (Peralta-Maraver and Rezende, 2021), which is valuable information to predict temperature mortality in field conditions (Rezende et al., 2020).
Southern ocean species inhabitant constantly cold environments characterized by thermal stenothermality (Peck, 2005), and slight differences in thermal environment can be enough to cause differences between species (Bilyk and DeVries, 2011; Sandersfeld et al., 2017), populations (Morley et al., 2009), and spatial distribution (Morley et al., 2010). Several phenomena, such as interspecific differences, trophic levels position, and body size variation, significantly affect thermal limits (Peck et al., 2009). The mismatch with the upper thermal limits and the temperature that Antarctic animals experience in the field (Peck et al., 2009; Beers and Jayasundara, 2015) may be attributable to sub-estimated the effect of exposure time in the experimental trial (Molina et al., 2022). According to the evidence above, this work aims to evaluate the upper thermal limits of seven marine ectotherm Antarctic species (Chordata 3 spp., Arthropoda 2 spp., and Echinodermata 2 spp.), standardizing by the exposition time (Tko 1 min) making the measures comparable among experimental trial and species (Rezende et al., 2014). Thus, based on in situ records of seawater intertidal temperature variation (Kuklinski and Balazy, 2014), and an analytic approach to evaluate risk of mortality to Antarctic marine species (Molina et al., 2022), we quantify vulnerability to the current condition of thermal variation and two scenarios (+2°C 10 days and 30 days) of moderate heatwaves (Hobday et al., 2016) that those ectotherm species may experience in field conditions.
Methods
Animal collection
Fieldwork was carried out in January 2020 in the lower intertidal zone off the South Shetland Island, Fildes Bay, King George Island (62°11’S, 58°59’W). A total of 20 Antarctic juvenile fishes were collected from three species Harpagifer antarcticus (12), Trematomus newnesi (6) and Lepidonotothem nudifrons (2), and 14 arthropods individuals from two species Bovallia gigantea (4), and Glyptonotus antarcticus (10), and 19 echinoderms from two species Odontaster validus (9) and Sterechinus neumayeri (10). All animals were caught using a 12-inch aquarium fish net and hands turning over rocks off the intertidal zone. After, animals were immediately deposited in coolers with constant aeration and carried alive to the laboratories infrastructures of Instituto Antártico Chileno (INACH) in Escudero Antarctic Scientific Station. This laboratory facility includes several 50 L tanks with circulating and filtered, aerated seawater. The animals were transferred to aquariums with seawater at a controlled temperature (1 ± 0.3°C), salinity of 33 (± 0.5) psu, under natural photoperiod, and no feeding. These conditions were maintained for at least 48 hours to allow them to be acclimated to captivity conditions before undergoing the thermal trials. All animals were kept in separated 50 L aquariums during captivity before the thermal trials.
TDT curves to CTmax
All animals individually were subjected to a temperature ramp, to fishes and arthropods with an increment of 0.07°C min-1 and echinoderms, a ramp of 0.08°C min-1. The experimental trial stopped when animals presented signals of thermic stress such as loss of equilibrium, defined as the inability of fish and arthropods to maintain dorso-ventral orientation for at least 1 min (Beitinger et al., 2000), and to echinoderms loss of adhesion to the surface of the metabolic chamber or showed lack of evident movement of tube feet or spines (Peck et al., 2009). These procedures were repeated until all individuals were measured during the experiment time. At the end of trail routines, all individuals were euthanized using an overdose of BZ20, following bioethics protocols of Universidad Andres Bello, and body mass and length were recorded using a caliper and analytical balance.
To obtain a proper estimate that reflects both upper thermal critic temperature and exposition time, we combine the CTmax observation (i.e., the temperature that would result in knockdown or death) from the ramping experiment with the respective recorded time (t). Using these two parameters (CTmax and t), we build the thermal death time (TDT) curves (eq. 1) (Rezende et al., 2014) to estimates Standardized Tko ranges.
To thermal sensitivity parameter (z), which describes how thermal tolerance decays with the duration of the heat challenge (i.e., the net reduction in Tko resulting from a tenfold increase in exposure time), we used the z estimates from Antarctic ectotherm marine species nearly related with the species studied here (Molina et al., 2022).Then, we mapped this slope back onto the experimental estimated of Tko and standardized t to estimate the expected tolerance temperature at t = 1 minute, 10 days, and 30 days (eq. 1) on a species-specific basis. Then we built a single TDT per individual per the seven species considered in this study, obtained a total of 53 curves (Figure 1B).
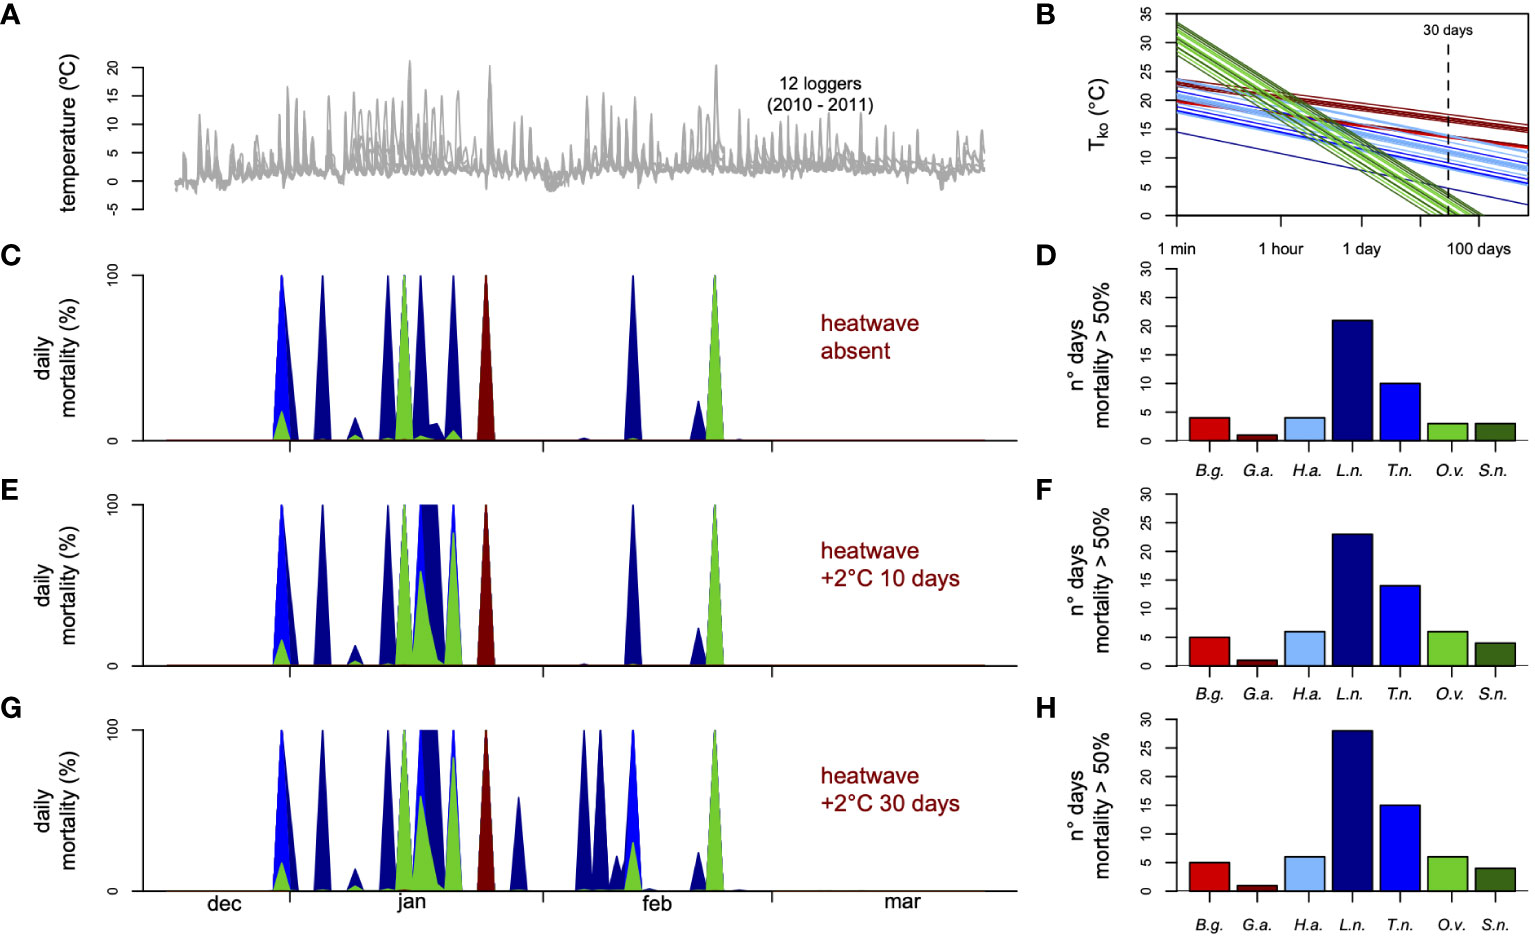
Figure 1 Simulated mortality combining the thermal tolerance landscape reconstructed for the seven species and high-resolution environmental temperatures recorded in the (A) intertidal zone, (B) using the thermal-death time (TDT) curves obtained with these CTmax and z parameters from three mayor taxa (Chordata, Arthropods and Echinoderms) (Molina et al., 2022). Note that values crossing the TDT curves at 1 min and 30 days correspond to standardized Tko. Simulated mortality procedure by Rezende et al. (Rezende et al., 2020) assumed that organisms could recover every 24 h from an acute heat stress in the intertidal (C) and two scenarios of heatwaves event (E, G). Bar plots show sum of days which mortality overpassed 50% to the daily basis of (D) current intertidal thermal condition and the two scenarios of heatwave events (F, H). B.g., Bovallia gigantea (red); G.a., Bovallia gigantea (dark red); H.a., Harpagifer antarcticus (light blue); L.n., Lepidonotothem nudifrons (dark blue); T.n., Trematomus newnesi (blue); O.v., Odontaster validus (green); S.n., Sterechinus neumayeri (dark green).
Predicting thermal mortality
Combining standardized Tko from the experimental essay with thermal sensitivity reported in literature and field temperatures in Antarctica, we were able to determine if these organisms could be experiencing thermal mortality under the current condition as well as two moderate marine heatwaves episodes scenarios (Hobday et al., 2016).
Thermal scenarios were built using temperature data obtained temperatures with a 1-min resolution from these datasets via interpolation and calculated the ‘instantaneous mortality’ associated with these temperatures as described in (Rezende et al., 2020). Intertidal temperature records were obtained from 12 dataloggers covering the whole tidal range of Admiralty Bay, King George Island, with a resolution of 5 min between December 2010 and March 2011 (Kuklinski and Balazy, 2014). Because the main goal of this analysis is to determine if current recorded temperatures can lead to thermal mortality in Antarctica, we selected these locations as they are representative of warmer waters within the Western Antarctic Peninsula (Barnes and Peck, 2008) and used records from the austral summer between December and March in subsequent analyses. With the interpolated temperature data with a 1-min resolution at hand, we estimated the predicted thermal mortality for an ‘average’ individual organism belonging to each of seven species of chordate, arthropod, and echinoderm. As explained in detail elsewhere (Rezende et al., 2020), this procedure involved (1) using the mean CTmax and z to obtain a generic TDT for each species, (2) simulating the tolerance landscape from these TDTs assuming that knockdown times at each measurement temperature are normally distributed with CV = 0.25 (CV = standard deviation [SD]/mean) [see Supplementary Information in (Rezende et al., 2020)], and then (3) running the dynamic.landscape function combines the tolerance landscapes with the ambient temperature records to estimate the predicted mortality under these field conditions. We performed simulations for all species under three contrasting scenarios. First, under the highly variable thermal conditions, with the temperature data from the 12 data loggers deployed in the intertidal zone and assuming that animals recover when the temperatures drop at night (this is accomplished by calculating daily survival iteratively and resetting the survival curve at 00:00). Second, under two scenarios of a moderate marine heatwave as is described in (Hobday et al., 2016), with an average increment of seawater of +2° C for a period of 10 days and 30 days. As vulnerability indices, we calculated each species’ average mortality across days along loggers for the intertidal records (n = 12 loggers per species). All analyses were performed in R environment (R Development Core Team, 2019)
Results
Thermal tolerance and TDTs estimates
Body sizes (fresh weight) of animals collected ranged between 0.88 - 37.1 g. Echinoderms (Odontaster validus and Sterechinus neumayeri) were the bigger animals measured with a body size mean of 18.34 ± 8.84SD and ranged between 5.49 – 37.1 g., followed by Chordata (Harpagifer antarcticus, Trematomus newnesi and Lepidonotothem nudifrons) animals with a body size mean of 8.84 ± 5.22SD and ranged between 2.38 – 25.25 g., and Arthropoda (Bovallia gigantea, and Glyptonotus antarcticus) with a body size mean of 3.58 ± 1.54SD and ranged between 0.88 – 6.049 g. Having a rough estimate of upper thermal limits with the dynamic essay and the thermal sensitivity obtained from Molina et al. (Molina et al., 2022), we then proceeded to calculate expected Tko following 1 min exposure to compare among the major taxa which species belong at the same temporal scale. The mixed model ANOVA with phylum as a random effect revealed significant differences among Echinoderms, Chordata, and Arthropod species (F2,4 = 57.95, p = 0.011). Pairwise comparison indicated differences between Echinoderms and Chordata (t = -10.291, p = 0.0011) and Arthropods species (t = -5.766, p = 0.0011), and absence of differences between Arthropods and Chordata (t = 2.787, p = 0.1024). The Echinoderm species showed higher Tko 1 min with S. neumayeri 31.18 ± 2.10SD and O. validus 30.65 ± 1.29SD, followed by Arthropods species G. antarticus with 22.42 ± 1.21 and B. gigantea 19.81 ± 0.14SD, and Chordata species H. antarticus 21.04 ± 1.86SD, L. nudifrons 17.57 ± 4.33SD and T. newnesi 19.08 ± 1.59SD.
Predicted mortality in the field
We estimated predicted daily mortalities over 100 days during the Austral summer for the intertidal zones. Our simulations suggest that current temperatures can elicit some thermal mortality depending on the TDT profiles of different species. In our field thermal stress scenario (Figure 1A), mortality surpassed 50% on five occasions for arthropods B. gigantea (4) and G. antarticus (1), 35 occasions for chordates L. nudifrons (4), H. antarticus (21), T. newnesi (10), and 6 for echinoderms O. validus (3) and S. neumayeri (3) and all these instances involved primarily loggers at higher tide locations (Figures 1C, D). Accordingly, the mean daily mortality estimated per logger differed significantly across species based on regular analysis of variance (F6,77 = 6.45, p = 6.34 x 10⁻⁶), suggesting that one arthropod (B. gigantea) and chordates are more susceptible to high-temperature fluctuations than other species. Note that, even though pairwise differences between species were not always statistically significant (Figure 1), the inclusion of loggers with less extreme temperatures decreases the statistical power of this analysis as mortality in these circumstances is nearly zero for all groups. For simulations assuming heatwaves with sea water warming of +2°C by a duration of at 10 days and 30 day the increment in days when mortality surpassed 50% was over of 29% and 42% respectively (Figures 1E, G), in both cases mainly driven by increment in mortality to B. gigantea (1 day both scenarios), L. nudifrons (2 days both scenarios), H. antarticus (2 days and 7 days respectively), T. newnesi (4 days and 5 days respectively), O. validus (3 days both scenarios) and S. neumayeri (2 days both scenarios) (Figures 1G, H). Similarly, mean predicted daily mortality differed significantly between species (F6,77 = 6.475, p = 1.47 × 10⁻⁵), once again supporting differences in susceptibility to warm waters between groups (Figure 1).
Discussion
Precise estimates of upper thermal limits are essential to determine the impact of GW on Antarctic species, either because they have evolved in habitant characterized by narrow and extreme thermal environments or because their habitats are changing rapidly (Morley et al., 2020). Here, we combined an experimental essay on Antarctic organisms with thermal sensitivity to build an accurate and comparable estimate of upper thermal limits through the taxa. Our results evidence a clear difference in thermal tolerance among Arthropods Chordata and Echinoderms, as well as the relevance of distinguishing the time effect (i.e., Tko 1 min, Tko 1 day and 30 days) on the vulnerability to warming conditions (Richard et al., 2012; Molina et al., 2022). In addition, under the tolerance landscape framework (Rezende et al., 2020), we showed that temperature variation from the intertidal area did affect the predicted mortality to the studied species, though in different intensities depending on the taxa. Also, conservative scenarios of extreme marine warming events (heatwaves) during an Austral summer at the Antarctic archipelago did impact predicted mortality (Figure 1A), showing the vulnerability of the Antarctic marine species to GW on an ecological scale.
According to previous evidence about thermal tolerance to Antarctic species (Peck et al., 2009), we found that estimators of thermal limits such as CTmax are above the temperature these animals experience in natural conditions. Our approach explicitly followed a correction by time exposure and used estimates of thermal sensitivity to Antarctic species (Molina et al., 2022). It is one step forward because TDT curves allow building an estimate of time scale with ecological significance, either daily, monthly, or seasonally temporal window (Figure 1B). That is important because the role of exposure time in determining temperature tolerance is a perspective little studied in the literature (Lefevre et al., 2021), but essential if we want to evaluate the impact of GW on Antarctic species (Morley et al., 2020). For instance, our study is the first to show evidence of upper thermal limits to Malacostraca Arthropods such as the amphipodan Bovallia gigantea and the isopoda Glyptonotus antarticus. Despite the interspecific difference among Antarctic arthropods, our findings cover the wide range of thermal limits reported in the literature, from 32.5°C to 6.7°C (Lahdes et al., 1993; Peck, 2004; Peck et al., 2009; Peck et al., 2010; Toullec et al., 2020). Also, our results on Chordata animals such as Harpafiger antarcticus, Lepidonotothen nudriforns, and Trematomus newnesi are according to the wide range of upper thermal limits Antarctic nototenids from 21.58°C to 5°C (Somero and DeVries, 1967; Peck et al., 2009; Beers and Sidell, 2011; Bilyk and DeVries, 2011; Joyce et al., 2018). Likewise, the Echinoderms Odontaster validus and Sterechinus neumayeri showed upper thermal limits, as reported previously, in a range of 24.7°C to 10.9°C (Peck et al., 2009; Peck et al., 2010; Morley et al., 2012). Undoubtedly, species comparison allows us to visualize the diversity of the thermal tolerance capacity that Antarctic species must possess, which underpins different physiological architectures. However, discrepancies in methodological approaches and traits evaluated may obscure another phenomenon in the variation in thermal tolerance limits (Williams et al., 2016), making it difficult to build proper interspecific comparisons. Comparison among species that inhabit the same environments may differ in physiological strategies to cope with environmental thermal stress, constrained to a specific ecological scale (Peck, 2011; Byers, 2020). Therefore, physiological and genetic mechanisms are needed to understand the variation in thermal tolerance and distinguish phenotypic thermal strategy from adapting to extreme and cold Antarctic habitats, including physiological, molecular mechanisms (González-Aravena et al., 2021; Saravia et al., 2021), and behavioral responses influenced changes in distribution ranges (Morley et al., 2010).
Predicting ectotherm species’ response to GW is key to understanding the global anthropic effect on biodiversity (Pecl et al., 2017). Identified as an anthropic global driver affecting the polar marine ecosystem, such as in the Antarctic peninsula, where increments until 2°C on the current pattern of temperatures are expected shortly (Hellmer et al., 2017; Moffat and Meredith, 2018). Here, the higher variation in temperature records to the intertidal zone may be linked with a daily higher sensibility to the tidal pattern experienced in this coastal area (Figure 1), which has been described as an extended pattern along the marine coast (Byers, 2020; Liao et al., 2021). As an atmospheric event to date, heatwaves have been related to the Antarctic continent (Robinson et al., 2020; González-Herrero et al., 2022; Turner et al., 2022), and the recurrence of extreme marine heatwaves worldwide (Hobday et al., 2018) makes it possible to expect those events around Antarctica. Due to that, GW heatwaves in marine ecosystems affect the biological communities (Paganini et al., 2014; Hobday et al., 2016; Roberts et al., 2019; Magel et al., 2020), and exposure time is urgently needed to quantify the effect of thermal stress on organismal performance (Williams et al., 2016; Lefevre et al., 2021). We used TDT curves that use the exposure time linked with thermal limits (Rezende et al., 2014), which combine real-time scales to thermal stress, allowing us to predict the effect of thermal variation in the ecological scale (Rezende et al., 2020). We modeled mortality in a window of 24 hours along with the 100 days considered from the Austral summer, then the relevant time scale of Tko built from TDTs curve was from 1 to 1440 minutes to estimate mortality. The cumulated effect on a daily scale was enough to produce mortality, and this rise when moderate heatwaves (Hobday et al., 2018) were considered into de daily variation (Figure 1). Based on the higher thermal sensitivity (z) of the echinoderm O.validatus (Tko 1 min = 30.65; Tko 1 day = 10.41) and S. neumayeri (Tko 1 min = 31.18; Tko 1 day = 10.93), this mayor taxa seems to be better adapted to future warming events, which may be linked with the sessile condition and less capabilities to escape to local thermal stress (Sunday et al., 2011; Molina et al., 2022). Although lower thermal sensitivity may impact long-term response from the three Chordata L. nudrifrons (Tko 1 min = 17.57; Tko 1 day = 10.91), H.antarticus (Tko 1 min = 21.04; Tko 1 day = 14.39), T. newnesi (Tko 1 min = 19.81; Tko 1 day = 13.15) and the two Arthropods B. gigantea (Tko 1 min = 19.81; Tko 1 day = 15.61) and G. antarticus (Tko 1 min = 22.41; Tko 1 day = 18.20), the lower temperature which those species responded to the experimental thermal challenge, determine higher vulnerability to increment of temperature in a daily scale and its cumulative effect on the entire Austral summer intertidal area as well as the effects of the moderate heatwave.
In overview, precise predictions of the Antarctic fauna responses to global warming are a priority to conservation and decision-makers because of the pristine condition of the continent and the evolutionary and ecological process that has built its unique biological diversity. Our finding reveals that Antarctic marine species may be under thermal stress under less temperature but on a more extended time scale, such heatwaves events, indeed, temperatures that may be organisms experienced at the current time in the wild. In line, differences among species are influenced by the thermal sensitivity parameter (Rezende et al., 2014), which summary the phenotypic response to the thermal difference in a specific time (minutes). We interpreted these interspecific differences as a consequence of the morphological, physiological, and behavioral adaptations that distinguish the species studied to face thermal stress in the Antarctic marine ecosystem as consequences of global warming due to human activities worldwide.
Data availability statement
The datasets presented in this study can be found in online repositories. The names of the repository/repositories and accession number(s) can be found below: https://datadryad.org/stash/share/CdFIhwoocjOslligf5dzjb9OjJa2V7EzLtiqxyuPokw.
Ethics statement
The animal study was reviewed and approved by Comité de Bioética, Universidad Andrés Bello.
Author contributions
MC: Conceptualization, Investigation, Writing – original draft, Writing – review & editing, Visualization, Data curation. MRG-H: Investigation, Writing – review & editing. MA: Writing- Reviewing and Editing. ER: Writing- Reviewing and Editing, Funding acquisition. FB: Writing- Reviewing and Editing. CG-M: Writing- Reviewing and Editing, Funding acquisition. JP: Supervision, Writing- Reviewing and Editing, Resources, Funding acquisition. All authors contributed to the article and approved the submitted version.
Funding
MC thanks the support of UNAB DI 10.20/Reg grants. MRG-H acknowledges the support of ANID Grand No. PAI77190031 and FONDECYT 11220593 grants. MA acknowledges the support of FONDECYT 1220866 grants. FB acknowledge ANID PIA/BASAL FB0002. CG-M thanks the support of FONDECYT 11150548 and 1210946, INACH RT12-17 and ANID PIA/INACH ACT192057 grants. JP thanks the support by INACH RT09-18 and FONDECYT 1200813 grants.
Conflict of interest
The authors declare that the research was conducted in the absence of any commercial or financial relationships that could be construed as a potential conflict of interest.
Publisher’s note
All claims expressed in this article are solely those of the authors and do not necessarily represent those of their affiliated organizations, or those of the publisher, the editors and the reviewers. Any product that may be evaluated in this article, or claim that may be made by its manufacturer, is not guaranteed or endorsed by the publisher.
References
Barnes D. K. A., Peck L. S. (2008). Vulnerability of Antarctic shelf biodiversity to predicted regional warming. Clim. Res. 37, 149–163. doi: 10.3354/cr00760
Beers J. M., Jayasundara N. (2015). Antarctic Notothenioid fish: What are the future consequences of “losses“ and “gains” acquired during long-term evolution at cold and stable temperatures? J. Exp. Biol. 218, 1834–1845. doi: 10.1242/jeb.116129
Beers J. M., Sidell B. D. (2011). Thermal tolerance of Antarctic notothenioid fishes correlates with level of circulating hemoglobin. Physiol. Biochem. Zool. 84, 353–362. doi: 10.1086/660191
Beitinger T. L., Bennett W. A., McCauley R. W. (2000). Temperature tolerances of north American freshwater fishes exposed to dynamic changes in temperature. Environ. Biol. Fishes 58, 237–275. doi: 10.1023/A:1007676325825
Bilyk K. T., DeVries A. L. (2011). Heat tolerance and its plasticity in Antarctic fishes. Comp. Biochem. Physiol. - A Mol. Integr. Physiol. 158, 382–390. doi: 10.1016/j.cbpa.2010.12.010
Byers J. E. (2020). Effects of climate change on parasites and disease in estuarine and nearshore environments. PloS Biol. 18, 1–12. doi: 10.1371/journal.pbio.3000743
Cook A. J., Holland P. R., Meredith M. P., Murray T., Luckman A., Vaughan D. G. (2016). Ocean forcing of glacier retreat in the western Antarctic peninsula. Science 353, 283–286. doi: 10.1126/science.aae0017
González-Aravena M., Rondon R., Font A., Cárdenas C. A., Toullec J. Y., Corre E., et al. (2021). Low transcriptomic plasticity of Antarctic giant isopod glyptonotus antarcticus juveniles exposed to acute thermal stress. Front. Mar. Sci. 8. doi: 10.3389/fmars.2021.761866
González-Herrero S., Barriopedro D., Trigo R. M., López-Bustins J. A., Oliva M. (2022). Climate warming amplified the 2020 record-breaking heatwave in the Antarctic peninsula. Commun. Earth Environ. 3, 1–9. doi: 10.1038/s43247-022-00450-5
Hellmer H. H., Kauker F., Timmermann R., Hattermann T. (2017). The fate of the southern weddell sea continental shelf in a warming climate. J. Clim. 30, 4337–4350. doi: 10.1175/JCLI-D-16-0420.1
Hobday A. J., Alexander L. V., Perkins S. E., Smale D. A., Straub S. C., Oliver E. C. J., et al. (2016). A hierarchical approach to defining marine heatwaves. Prog. Oceanogr. 141, 227–238. doi: 10.1016/j.pocean.2015.12.014
Hobday A. J., Oliver E. C. J., Sen Gupta A., Benthuysen J. A., Burrows M. T., Donat M. G., et al. (2018). Categorizing and naming marine heatwaves. Oceanography 31, 162–173. doi: 10.5670/oceanog.2018.205
Jørgensen L. B., Malte H., Ørsted M., Klahn N. A., Overgaard J. (2021). A unifying model to estimate thermal tolerance limits in ectotherms across static, dynamic and fluctuating exposures to thermal stress. Sci. Rep. 11, 1–14. doi: 10.1038/s41598-021-92004-6
Joyce W., Axelsson M., Egginton S., Farrell A. P., Crockett E. L., O’Brien K. M. (2018). The effects of thermal acclimation on cardio-respiratory performance in an Antarctic fish (Notothenia coriiceps). Conserv. Physiol. 6, 1–12. doi: 10.1093/conphys/coy069
Kuklinski P., Balazy P. (2014). Scale of temperature variability in the maritime Antarctic intertidal zone. J. Sea Res. 85, 542–546. doi: 10.1016/j.seares.2013.09.002
Lahdes E. O., Kivivuori L. A., Lehti-Koivunen S. M. (1993). Thermal tolerance and fluidity of neuronal and branchial membranes of an antarctic amphipod (Orchomene plebs); a comparison with a baltic isopod (Saduria entomon). Comp. Biochem. Physiol. – Part A Physiol. 105, 463–470. doi: 10.1016/0300-9629(93)90420-9
Lefevre S., Wang T., McKenzie D. J. (2021). The role of mechanistic physiology in investigating impacts of global warming on fishes. J. Exp. Biol. 224, jeb238840. doi: 10.1242/jeb.238840
Liao M., Li G., Wang J., Marshall D. J., Hui T. Y., Ma S., et al. (2021). Physiological determinants of biogeography: The importance of metabolic depression to heat tolerance. Glob. Change Biol. 27, 2561–2579. doi: 10.1111/gcb.15578
Magel J. M. T., Dimoff S. A., Baum J. K. (2020). Direct and indirect effects of climate change-amplified pulse heat stress events on coral reef fish communities. Ecol. Appl. 30, 1–15. doi: 10.1002/eap.2124
Meredith M. P., King J. C. (2005). Rapid climate change in the ocean west of the Antarctic peninsula during the second half of the 20th century. Geophys. Res. Lett. 32, 1–5. doi: 10.1029/2005GL024042
Moffat C., Meredith M. (2018). Shelf-ocean exchange and hydrography west of the Antarctic peninsula: A review. Philos. Trans. R. Soc A Math. Phys. Eng. Sci. 376, 20170164. doi: 10.1098/rsta.2017.0164
Molina A. N., Pulgar J. M., Rezende E. L., Carter M. J. (2023). Heat tolerance of marine ectotherms in a warming Antarctica. Glob. Change Biol. 29, 179–88. doi: 10.1111/gcb.16402
Morley S. A., Abele D., Barnes D. K. A., Cárdenas C. A., Cotté C., Gutt J., et al. (2020). Global drivers on southern ocean ecosystems: Changing physical environments and anthropogenic pressures in an earth system. Front. Mar. Sci. 7. doi: 10.3389/fmars.2020.547188
Morley S. A., Griffiths H. J., Barnes D. K. A., Peck L. S. (2010). South Georgia: A key location for linking physiological capacity to distributional changes in response to climate change. Antarct. Sci. 22, 774–781. doi: 10.1017/S0954102010000465
Morley S. A., Hirse T., Pörtner H. O., Peck L. S. (2009). Geographical variation in thermal tolerance within southern ocean marine ectotherms. Comp. Biochem. Physiol. - A Mol. Integr. Physiol. 153, 154–161. doi: 10.1016/j.cbpa.2009.02.001
Morley S. A., Martin S. M., Bates A. E., Clark M. S., Ericson J., Lamare M., et al. (2012). Spatial and temporal variation in the heat tolerance limits of two abundant southern ocean invertebrates. Mar. Ecol. Prog. Ser. 450, 81–92. doi: 10.3354/meps09577
Ørsted M., Jørgensen L. B., Overgaard J. (2022). Finding the right thermal limit: a framework to reconcile ecological, physiological and methodological aspects of CTmax in ectotherms. J. Exp. Biol. 225, jeb244514. doi: 10.1242/jeb.244514
Paganini A. W., Miller N. A., Stillman J. H. (2014). Temperature and acidification variability reduce physiological performance in the intertidal zone porcelain crab petrolisthes cinctipes. J. Exp. Biol. 217, 3974–3980. doi: 10.1242/jeb.109801
Peck L. S. (2004). Physiological flexibility: The key to success and survival for Antarctic fairy shrimps in highly fluctuating extreme environments. Freshw. Biol. 49, 1195–1205. doi: 10.1111/j.1365-2427.2004.01264.x
Peck L. S. (2005). Prospects for survival in the southern ocean: Vulnerability of benthic species to temperature change. Antarct. Sci. 17, 497–507. doi: 10.1017/S0954102005002920
Peck L. S. (2011). Organisms and responses to environmental change. Mar. Genomics 4, 237–243. doi: 10.1016/j.margen.2011.07.001
Peck L. S. (2018). Antarctic Marine biodiversity: Adaptations, environments and responses to change. Oceanogr. Mar. Biol. 56, 105–236. doi: 10.1201/9780429454455-3
Peck L. S., Clark M. S., Morley S. A., Massey A., Rossetti H. (2009). Animal temperature limits and ecological relevance: Effects of size, activity and rates of change. Funct. Ecol. 23, 248–256. doi: 10.1111/j.1365-2435.2008.01537.x
Peck L. S., Morley S. A., Clark M. S. (2010). Poor acclimation capacities in Antarctic marine ectotherms. Mar. Biol. 157, 2051–2059. doi: 10.1007/s00227-010-1473-x
Pecl G. T., Araújo M. B., Bell J. D., Blanchard J., Bonebrake T. C., Chen I. C., et al. (2017). Biodiversity redistribution under climate change: Impacts on ecosystems and human well-being. Science 355, eaai9214. doi: 10.1126/science.aai9214
Peralta-Maraver I., Rezende E. L. (2021). Heat tolerance in ectotherms scales predictably with body size. Nat. Clim. Change 11, 58–63. doi: 10.1038/s41558-020-00938-y
R Development Core Team (2019). R: a language and environment for statistical computing (Vienna, Austria: R Foundation for Statistical Computing). Available at: http://www.rproject.org.
Rezende E. L., Bozinovic F., Szilágyi A., Santos M. (2020). Predicting temperature mortality and selection in natural drosophila populations. Science 369, 1242–1245. doi: 10.1126/science.aba9287
Rezende E. L., Castañeda L. E., Santos M. (2014). Tolerance landscapes in thermal ecology. Funct. Ecol. 28, 799–809. doi: 10.1111/1365-2435.12268
Richard J., Morley S. A., Thorne M. A. S., Peck L. S. (2012). Estimating long-term survival temperatures at the assemblage level in the marine environment: Towards macrophysiology. PloS One 7, e34655. doi: 10.1371/journal.pone.0034655
Roberts S. D., Van Ruth P. D., Wilkinson C., Bastianello S. S., Bansemer M. S. (2019). Marine heatwave, harmful algae blooms and an extensive fish kill event during 2013 in south Australia. Front. Mar. Sci. 6. doi: 10.3389/fmars.2019.00610
Robinson S. A., Klekociuk A. R., King D. H., Pizarro Rojas M., Zúñiga G. E., Bergstrom D. M. (2020). The 2019/2020 summer of Antarctic heatwaves. Glob. Change Biol. 26, 3178–3180. doi: 10.1111/gcb.15083
Sandersfeld T., Mark F. C., Knust R. (2017). Temperature-dependent metabolism in Antarctic fish: Do habitat temperature conditions affect thermal tolerance ranges? Polar Biol. 40, 141–149. doi: 10.1007/s00300-016-1934-x
Saravia J., Paschke K., Oyarzún-Salazar R., Cheng C. H. C., Navarro J. M., Vargas-Chacoff L. (2021). Effects of warming rates on physiological and molecular components of response to CTMax heat stress in the Antarctic fish harpagifer antarcticus. J. Therm. Biol. 99, 103021. doi: 10.1016/j.jtherbio.2021.103021
Sinclair B. J., Marshall K. E., Sewell M. A., Levesque D. L., Willett C. S., Slotsbo S., et al. (2016). Can we predict ectotherm responses to climate change using thermal performance curves and body temperatures? Ecol. Lett. 19, 1372–1385. doi: 10.1111/ele.12686
Somero G. N., DeVries A. L. (1967). Temperature tolerance of some Antarctic fishes. Science 156, 257–258. doi: 10.1126/science.156.3772.258
Sunday J. M., Bates A. E., Dulvy N. K. (2011). Global analysis of thermal tolerance and latitude in ectotherms. Proc. R. Soc B Biol. Sci. 278, 1823–1830. doi: 10.1098/rspb.2010.1295
Sunday J. M., Bates A. E., Dulvy N. K. (2012). Thermal tolerance and the global redistribution of animals. Nat. Clim. Change 2, 686–690. doi: 10.1038/nclimate1539
Toullec J. Y., Cascella K., Ruault S., Geffroy A., Lorieux D., Montagné N., et al. (2020). Antarctic Krill (Euphausia superba) in a warming ocean: thermotolerance and deciphering Hsp70 responses. Cell Stress Chaperones 25, 519–531. doi: 10.1007/s12192-020-01103-2
Turner J., Lu H., King J. C., Carpentier S., Lazzara M., Phillips T., et al. (2022). An extreme high temperature event in coastal East Antarctica associated with an atmospheric river and record summer downslope winds. Geophys. Res. Lett. 49, 1–11. doi: 10.1029/2021GL097108
Keywords: upper thermal limits, heatwave, Antarctic peninsula, marine ectotherms, temperature mortality
Citation: Carter MJ, García-Huidobro MR, Aldana M, Rezende EL, Bozinovic F, Galbán-Malagón C and Pulgar JM (2023) Upper thermal limits and risk of mortality of coastal Antarctic ectotherms. Front. Mar. Sci. 9:1108330. doi: 10.3389/fmars.2022.1108330
Received: 25 November 2022; Accepted: 30 December 2022;
Published: 13 January 2023.
Edited by:
Hongsheng Yang, Institute of Oceanology (CAS), ChinaReviewed by:
Yunwei Dong, Ocean University of China, ChinaLiqiang Zhao, Guangdong Ocean University, China
Copyright © 2023 Carter, García-Huidobro, Aldana, Rezende, Bozinovic, Galbán-Malagón and Pulgar. This is an open-access article distributed under the terms of the Creative Commons Attribution License (CC BY). The use, distribution or reproduction in other forums is permitted, provided the original author(s) and the copyright owner(s) are credited and that the original publication in this journal is cited, in accordance with accepted academic practice. No use, distribution or reproduction is permitted which does not comply with these terms.
*Correspondence: Mauricio J. Carter, bWF1cmljaW8uY2FydGVyQHVuYWIuY2w=
†ORCID: Mauricio J. Carter, orcid.org/0000-0002-5351-8108
M. Roberto García-Huidobro, orcid.org/0000-0003-2859-2370
Enrico L. Rezende, orcid.org/0000-0002-6245-9605
Francisco Bozinovic, orcid.org/0000-0003-3870-9624
José M. Pulgar, orcid.org/0000-0002-8816-7790
Cristobal Galban-Malagon, orcid.org/0000-0001-8397-5804
Marcela Aldana, orcid.org/0000-0001-7371-9663