 Fernanda Andreoli Rolim1,2,3*
 Tim Langlois4
 Fábio dos Santos Motta3
 Guilherme Malagutti de Castro5
 Emily Lester4
 Maria Luiza Abieri5
 Otto Bismarck Fazzano Gadig1,2†
 Rodrigo Leão de Moura5†
- 1Instituto de Biociências, Câmpus de Rio Claro, Rio Claro, Brazil
- 2Laboratório de Pesquisa de Elasmobrânquios, Instituto de Biociências, UNESP, Câmpus do Litoral Paulista, São Vicente, Brazil
- 3Laboratório de Ecologia e Conservação Marinha, Instituto do Mar, Universidade Federal de São Paulo (UNIFESP), Santos, Brazil
- 4UWA Oceans Institute and School of Biological Sciences, The University of Western Australia (UWA), Perth, WA, Australia
- 5Instituto de Biologia and SAGE/COPPE, Universidade Federal do Rio de Janeiro (UFRJ), Rio de Janeiro, Brazil
The effects of fishing have been documented across coral reefs worldwide. No-take marine reserves do not only act as a conservation tool but also allow an opportunity to study impacts of fishing, by acting as control sites. In addition, well-planned and well-managed no-take marine reserves (NTRs) provide conservation benefits that are essential to marine biodiversity and ecosystem-based management. The Abrolhos Marine National Park, off the tropical Brazilian coast, protects part of the largest coral reef system in the South Atlantic. To investigate the effects of fishing on reef fish richness, abundance, biomass, and functional diversity of the fish assemblage, we compared sites across two protection levels considering the variation in habitats (Fringing Reefs—Protected; Pinnacles Reefs—Protected; and Coastal Reefs—Open Access), using Baited Remote Underwater Stereo-Video systems (stereo-BRUVs). We adjusted generalized additive mixed models of fish assemblage characteristics with protection levels and environmental variables, such as topographic complexity (mean relief and relief variation), visibility, and benthic cover percentage. Inside NTRs, we found higher total biomass and biomass of fishery target species and carnivores, specifically for the Carcharhinidae (sharks) and Epinephelidae (groupers) families, indicating direct fisheries effects on these groups. In contrast, the ecological parameters of non-target fish were positively correlated with habitat characteristics, including mean relief and variance of relief. Moreover, fish functional diversity was higher within NTRs, demonstrating an even distribution of functional entities. The presence of large mobile predators and the overall higher biomass of carnivores inside the NTR indicate the effect of fishing exclusion. Our results point to the value of NTRs to study the effects of fishing and achieve biodiversity conservation and suggest the importance of using remote sampling methods to assess large mobile predators.
Introduction
Since the mid-1980s, fisheries remove more than 100 million tons of biomass from the ocean each year (Pauly et al., 2020) and therefore play an important role in shaping the structure of marine communities through both direct and indirect effects (Crowder et al., 2008; Watson et al., 2009; Babcock et al., 2010; Rolim et al., 2019). Direct effects include the decrease in biomass, abundance, and size of target species and bycatch (Myers and Worm, 2003; Crowder et al., 2008), while cascading effects through the food web indirectly affect prey populations and benthic assemblages (Sala et al., 1998; Claudet et al., 2011). Understanding these processes helps determine and predict the impact of fisheries to ecosystem structure and function and therefore inform management measures to buffer against such impacts.
No-take marine reserves (NTRs) have been established worldwide aiming to protect biodiversity and critical habitats and consequently provide experimental controls to study the effects of fishing (Agardy, 1994; Hyrenbach et al., 2000; Roberts et al., 2003; Claudet et al., 2011). When adequately planned and well managed, NTRs promote the recovery of exploited marine populations, habitats, and food webs and may ultimately improve ecosystem services, such as recreational activities and fisheries resources availability (Claudet et al., 2011; Leenhardt et al., 2015). Despite few temporally and spatially controlled experiments targeting investigations into the NTRs effects (e.g., Francini-Filho and Moura, 2008a), higher fish abundance, richness, and biomass have been recorded within and around NTRs, indicating that they can mitigate fisheries effects and contribute to surrounding areas through biomass and larval spillover (Abesamis and Russ, 2005; Francini-Filho and Moura, 2008b; Halpern et al., 2009; Di Lorenzo et al., 2016; Ohayon et al., 2021).
Besides protection effects, different physical and biological environmental characteristics have been demonstrated to affect coral reef fish communities (Friedlander et al., 2003; Messmer et al., 2011; Komyakova et al., 2013; McClure et al., 2021; Russ et al., 2021). On a local scale, conditions such as wave exposure, depth, distance from the coast, and topographic complexity have shown to be the most influential physical factors to reef fish assemblage structure. For example, distance from the coast, depth, and topographic complexity have been shown to increase richness, abundance, and biomass of reef fish (Friedlander et al., 2003; Graham and Nash, 2013; Komyakova et al., 2013; Morais et al., 2017; McClure et al., 2021). Moreover, coral richness and complexity have influenced both small reef attached fish species richness (Messmer et al., 2011; Komyakova et al., 2013) and fisheries-targeted species (Graham, 2014; Rogers et al., 2014). Therefore, it is relevant for any investigation of fishing effects to control for covariates across NTRs and open areas.
Abundance and biomass of target species are the most frequent metrics used to assess NTR effectiveness (Lester et al., 2009; Rolim et al., 2019; Goetze et al., 2021). Trait-based approaches, including body-size (Bosch et al., 2021), have been used to explore other dimensions of NTR effects (Coleman et al., 2015; D’Agata et al., 2016). Functional diversity is measured through a combination of behavioral, physiological, and morphological attributes that are connected with the role that each species plays in the ecosystem (Tilman, 2001). Additionally, trait-based approaches may reveal changes that are not detected by traditional metrics such as the relative abundance of different fish species in the assemblage. For example, Coleman et al. (2015) recorded higher values of community mean functional traits within NTRs but no differences in fish taxonomic diversity (species diversity and richness) that could be associated with protection levels.
Functional diversity is not always linearly associated with species diversity (Micheli and Halpern, 2005), and trait-based approaches can be pivotal to measure ecosystem dynamics and functioning (e.g., productivity and consumption) (Tilman, 2001), vulnerability and resilience, and the potential provision of ecosystem services (Nyström and Folke, 2001; Villéger et al., 2008). Reef fish functional diversity has been explored along the Southwestern Atlantic (e.g., Halpern and Floeter, 2008; Bender et al., 2017; Quimbayo et al., 2018; Lopes-da-Silva et al., 2021; Medeiros et al., 2021; Waechter et al., 2021), but the direct and indirect effects of fisheries on reef fish functional diversity is still comparatively poorly studied (e.g., Rincón-Díaz et al., 2021).
The region’s reefs are relatively isolated and encompass high endemism levels within species-poor assemblages (Moura, 2000; Rocha, 2003; Pinheiro et al., 2018; Soares et al., 2021). Despite meeting international area targets for protected areas’ declaration (Silva, 2019), the Brazilian Exclusive Economic Zone (EEZ) is subjected to multiple impacts, including high levels of fishing pressure in coralline reefs (Francini-Filho and Moura, 2008a; Freitas et al., 2011). The largest and richest Southwestern Atlantic coralline reefs are located in the Abrolhos Bank, a 46,000 km2 shallow water area between 17°S and 20°S. The Abrolhos Bank comprises mangroves, seagrass, macroalgae, rhodolith beds, and coralline reefs. The coral reef complex covers approximately 8,800 km2 and includes fringing reefs around a small archipelago and emergent and quasi-emergent mushroom-shaped reef formations that are unique to the region (Leão et al., 2003; Moura et al., 2013). The region has been negatively affected by overfishing (Francini-Filho and Moura, 2008a; Freitas et al., 2011), coastal development (Teixeira et al., 2021), coral bleaching and diseases (Francini-Filho et al., 2008; Teixeira et al., 2019; Duarte et al., 2020), and decreasing water quality (Bruce et al., 2012). The Abrolhos Marine National Park was established in 1983 as Brazil’s first National Marine Park, covering ~880 km2 of NTR.
Previous research in the Abrolhos Bank with underwater visual census (UVC) showed higher biomass of small carnivorous fishes that are targeted by fisheries inside the NTR than in areas open to fishing (Francini-Filho and Moura, 2008a). However, UVC can bias abundance and biomass estimates of some fish groups, such as large mobile carnivores (underestimation) and small carnivores (overestimation) (Chapman et al., 1974; Watson and Harvey, 2007; Goetze et al., 2015). With this, some fisheries effects, especially in higher trophic groups, may have not yet been detected. Large carnivores tend to be the group more rapidly depleted by fisheries, and this functional group plays an important role in the ecosystem being responsible for the top–down control of fish assemblages. Therefore, other methods need to be applied to truly assess fisheries effects to this functional group.
Baited Remote Underwater Stereo-Video systems (stereo-BRUVs) are becoming increasingly popular to assess the effects of NTRs on different dimensions of fish assemblages, especially fisheries target species, including changes in the functional diversity (Lester et al., 2009; Coleman et al., 2015; Whitmarsh et al., 2017). The typical stereo-BRUV setup consists of two cameras installed in a baited structure that is laid in the seabed or in the water column, allowing for accurate measurements of organisms through photogrammetry (Harvey and Shortis, 1996). Stereo-BRUVs sample a wide range of species, including herbivores (Harvey et al., 2021), and can be applied across a wide variety of habitats and depths (Whitmarsh et al., 2017). In addition, as a remote sensing technique, it detects large and mobile animals that usually avoid divers and active fishing gears (Cappo et al., 2006; Goetze et al., 2015). Although stereo-BRUVs are subject to caveats, such as difficulties in determining study area, variable bait plume dispersal in currents, and underestimation of cryptic species (Watson et al., 2005), this method is suited to sampling predatory fish assemblages that are often the target of fishing. For this reason, stereo-BRUVs have been widely used and can accurately sample fish abundance over reef-wide and global scales (e.g., MacNeil et al., 2020). Moreover, the images produced by this method can provide valuable information of the environment and have been used to categorize the habitat type and determine reef structural complexity (Cappo et al., 2011; Wilson et al., 2012; Bennett et al., 2016; Rolim et al., 2019).
The present study aims to explore the ecological protection effects of the Abrolhos Marine National Park using stereo-BRUVs, comparing fish assemblage characteristics (abundance, richness, biomass, and fish length), and the functional diversity, among areas subjected to different management regimes (Protected and Open Access areas). We hypothesize that (1) abundance, biomass, and body size of target species will be higher in NTR, (2) non-target species distribution will be explained by habitat variables, and (3) fish functional diversity will also be higher within NTRs.
Material and Methods
Study Area
The Abrolhos Marine National Park (Figure 1) comprises two separate areas: the largest southern and more offshore area encompasses the Abrolhos Archipelago and Parcel dos Abrolhos reef, while the northern and more coastal area encompasses the Timbebas reef. The NTR areas sampled by the study focused only on the southern portion of the park. The Abrolhos archipelago is composed of shallow coral formations and rocky reefs surrounding the islands (fringing reefs), while the Abrolhos parcels region is characterized by isolated mushroom-shaped reefs (pinnacles) that can reach 25 m in height, surrounded by unconsolidated sediments. The areas open to fishing activities, Pedra de Leste e Sebastião Gomes, in the nearshore arc present emerging shallow-reef formations where pinnacles often coalesce as larger continuous banks. Fishing activity, mainly large- and small-scale fisheries, such as hook-and-line (hand lines and longlines), gillnets, and spearfishing, are frequent in these areas, supplying the local and regional market (Ferreira, 2005; Francini-Filho and Moura, 2008a; Freitas, 2009; Giglio et al., 2015; Previero and Gasalla, 2018).
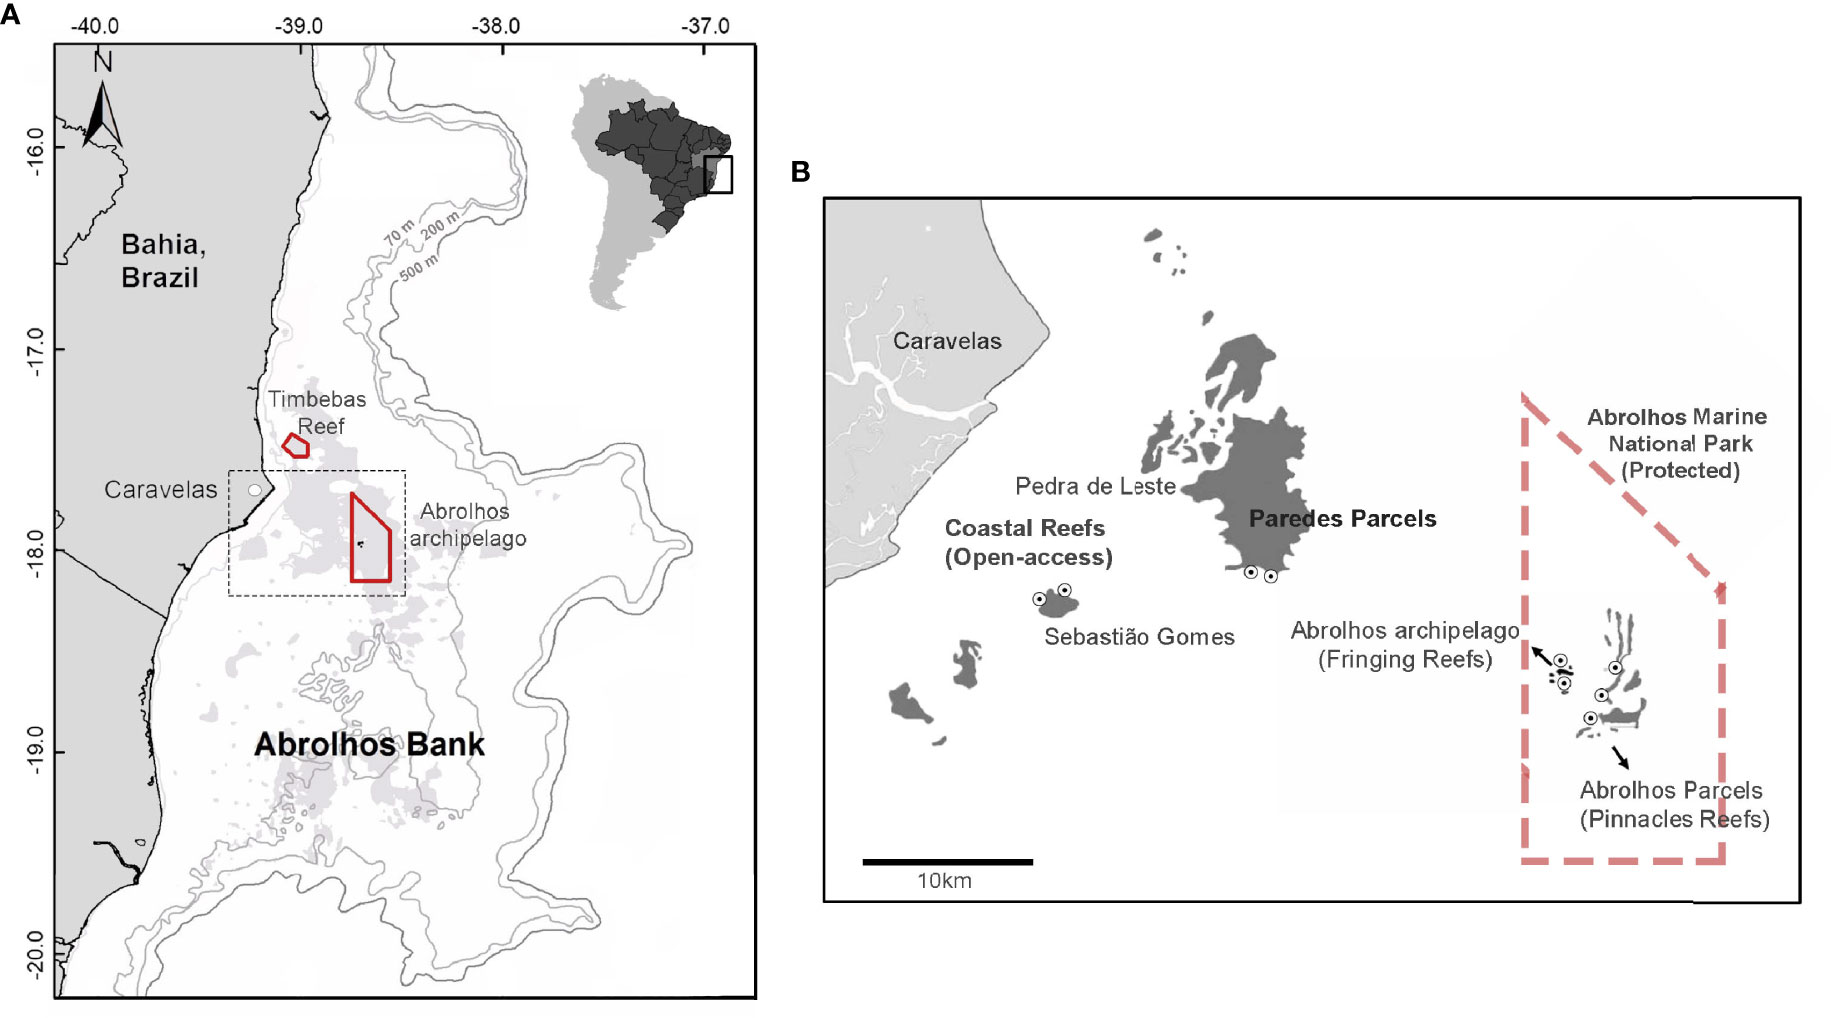
Figure 1 The study area (dotted rectangle) within the Abrolhos bank with the bathymetry data, highlighting the Abrolhos Marine National Park (no-take marine reserve) in red (north portion—Timbebas; south portion—Abrolhos archipelago) and the reef area (shallow and mesophotic) in light gray (A). The study area in detail with the shallow submerged coral reefs in dark gray and with the sample sites inside (Pinnacles and Fringing Reefs—Protected) and outside the no-take reserve (Coastal Reefs—Open Access) (black and white dots) (B). More information on Supplementary Material (Supplementary Figure S1 and Supplementary Table S1).
The Marine National Park is an NTR belonging to the Category II of the International Union for the Conservation of Nature (IUCN) (Dudley, 2008). In this category, no direct exploitation of natural resources is allowed, and the main aim of the NTR is to develop education and tourism activities. Within the Marine Park, the Abrolhos parcels region was classified as “Pinnacles Reefs—Protected” and the Abrolhos archipelago as “Fringing Reefs—Protected”. The control areas open to fisheries activity to test protection effects were located in the inshore arc (Sebastião Gomes and Pedra de Leste), classified as “Open Access” areas (Figure 1).
Sampling
Sampling was conducted in March 2017 using stereo-BRUVs. The stereo equipment consists of two cameras (GoPro Hero3+) that converge approximately 8°C inwardly, with a bait arm placed 1.5 m from the cameras to attract fish. The calibration process and equipment are described in detail in Harvey and Shortis (1996, 1998). This process was performed before each field trip. Stereo-BRUV samples (here referred as deployments) were deployed for 30 min, during daylight (between 7:00 a.m. and 4:00 p.m.), using 800 g of a mix of crushed fresh and salted sardines (Sardinella brasiliensis) as bait. Deployments of 30 min have been demonstrated to be sufficient for sampling a wide range of species of finfish on shallow reefs (Bernard and Götz, 2012; Harasti et al., 2015), and oily baits, such as sardines, are recommended (Dorman et al., 2012) due to the odor plume dispersion. Deployments with <30 min, with very low visibility (<2 m) and limited field of view were excluded from the analysis, resulting in 73 stereo-BRUV deployments, of which 16 were in the Fringing Reefs—Protected (Archipelago), 30 at the Pinnacles Reefs—Protected (two different locations in the Abrolhos parcels region), and 27 in Coastal Reefs—Open Access (10 at Pedra de Leste reef and 17 at Sebastião Gomes reef) (more details in Supplementary Figure S1 and Supplementary Table S1). Between BRUV deployments, a minimum distance of 250 m was adopted, which is indicated for 30-min deployments (Cappo et al., 2001). The equipment was positioned above the reef or in the interface with the sandy bottom to avoid large variations in the deployment depths, which ranged from 2 to 14 m (however, precise depth at each deployment was not measured).
Video Analysis
From each video, we recorded the abundance of each species using MaxN, which is defined as the maximum number of individuals appearing in the video in the same frame within 7 m from the cameras (Priede et al., 1994; Langlois et al., 2020). MaxN is a conservative approach in order to avoid counting and measuring the same individual more than once (Schobernd et al., 2014). Fish were identified to species according to Moura and Francini-Filho (2005). The fork length of individuals was measured at the MaxN using EventMeasure software, which was subsequently used to calculate biomass using growth parameters available from the Fishbase database (Froese and Pauly, 2018). The length was measured when the fish was straight and no more than 45°C perpendicular to the cameras, and only lengths with <20 residuals mean square (RMS) of precision were considered in EventMeasure software, also following all others length rules recommended for configuring stereo measurements detailed in Langlois et al. (2020). When the parameters for fork length were not available, length/length conversions were made from total and standard length.
Fish were classified into trophic groups based on the main diet components according to the literature (Ferreira et al., 2001; Gibran and de Moura, 2012; Froese and Pauly, 2018; Pinheiro et al., 2018; Quimbayo et al., 2021), resulting in carnivores, mobile invertebrate feeders, sessile invertebrate feeders, omnivores, roving herbivores, territorial herbivores, and planktivores. Fish were also divided into fisheries target and non-target according to the economic value in the region (Carvalho-Filho, 1999; Francini-Filho and Moura, 2008a).
To categorize the habitat type of each sample, a 5 × 4 grid was overlaid on a single high-definition image obtained from each stereo-BRUV deployment following Langlois et al. (2020). This method has shown to be effective to determine reef structural complexity (Cappo et al., 2011; Wilson et al., 2012; Bennett et al., 2016; Rolim et al., 2019). Images were analyzed in TransectMeasure software (www.seagis.com.au) (examples in Supplementary Figure S2). Within each grid rectangle, the dominant habitat type was characterized using the CATAMI classification scheme (Althaus et al., 2015) and topographic complexity on (Wilson et al. 2007). This resulted in the coverage percentage for each deployment of broad habitat types, relief levels (topographic complexity), and field of view (Table 1). The complexity of each deployment was then determined by the average number and standard deviation estimate of the relief levels. The field of view of the cameras (facing up, facing down, and open) and water transparency was also estimated for each sample (deployment) from the footages, in which the distance from the cameras of the farthest individual observed in meters, measured on EventMeasure software, was determined as water transparency.
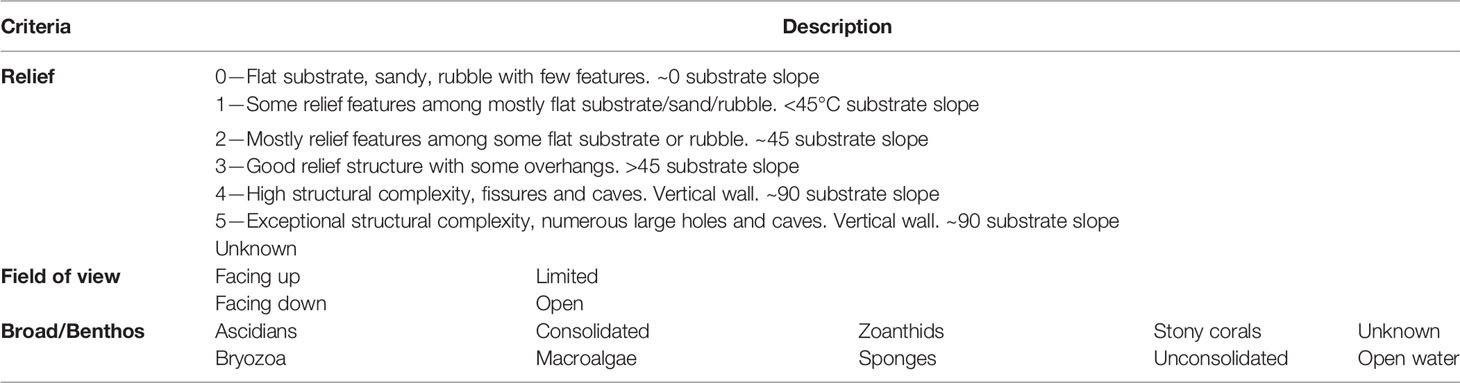
Table 1 Habitat classification based on broad CATAMI Classification scheme in Althaus et al. (2015) and Wilson et al. (2007).
Fish functional diversity was classified according to biological functions using the following traits based on Halpern and Floeter (2008), Pinheiro et al. (2018), and Quimbayo et al. (2021): size category (small: <10, medium small: 10–25, medium: 25–50, and large: >50 cm), maximum depth (very shallow: <10 m, shallow: 10–25 m, medium: 25–50 m, deep: 50–100 m, very deep: >100 m), trophic category (omnivore, herbivores, mobile invertivore feeder, sessile invertivore feeder, planktivore, carnivore), and mobility (sedentary, roving and highly mobile). In addition to these categories, we added schooling behavior (solitary, pairing, small groups of 3–20 individuals, medium groups of 20–50 individuals, or large groups of >50 individuals) and trophic level [values ranging from 2 to 4.7, from Froese and Pauly (2018). The lists of the fish species found and their respective traits are in Supplementary Tables S4, S5. The combination of traits for each species resulted in functional entities (FEs).
Statistical Analysis
To explore overall fish assemblage characteristics (abundance, richness, and biomass) in relation to environmental variables, we used Generalized Additive Mixed Models (GAMMs) with a full-subsets model selection approach (Fisher et al., 2018). We chose generalized additives models for our analysis because many ecological relationships are inherently non-linear (Zuur et al., 2007). Using a GAMM allowed us to explore potentially non-linear predictors using smoothing splines to estimate non-parametric additive functions, allowing for overdispersion and correlation in the data (Lin and Zhang, 1999; Zuur et al., 2007), without the need to define the exact functional form of the relationships between the predictors and response. The use of the mixed approach allowed us to analyze nested data (hierarchical data—area and sites), including fixed and random effects to the models. For each response variable of interest, we ran this subset GAMM function to develop, fit, and compare a complete model set of possible ecological or environmental predictors, starting from a generalized additive (mixed) model fit. The main advantages are that it does not require a complete model to be fit as the starting point for candidate model set construction, which means that a greater number of predictors can be explored, and the function handles interactions between predictors (Fisher et al., 2018). This analysis was run separately, i.e., for each variable of interest, for target and non-target species, for functional groups, and for the most conspicuous economically important families (Carcharhinidae—sharks; and Carangidae, Haemulidae, Epinephelidae, and Labridae—bony fishes). Exploratory analyses revealed levels of high correlation (r > 0.7) between environmental variables. As a result, reef, rock, octocoral, zoanthids, and depth were removed from the analysis, and mean relief, relief variation, hard corals, sand, and macroalgae were maintained as continuous factors. Random factors included water transparency (m) and field of view, and the fixed factor was Habitat/Protection (three levels: 1, Fringing Reefs—Protected; 2, Pinnacles Reefs—Protected; and 3, Coastal Reefs—Open Access).
Model selection was based on the second-order variant of Akaike’s Information Criterion suited for small samples (AICc) (Akaike, 1973) and on AICc weights (ωAICc). We selected models within two delta AICc (ΔAICc < 2), i.e., the difference between the AICc of the best model (lower AICc) and AICc from the other models. Models were then ranked according to parsimony, in which the models with desired level of explanation or prediction with as few predictor variables as possible were placed in the top. The most parsimonious models with >10% variance explained were chosen to be plotted. Model validation was performed to verify the assumptions of homogeneity and normality (Zuur et al., 2007), and the plots are presented in the Supplementary Material.
Kernel Density Estimation (KDE) was used to estimate and graphically compare the probability density of individual fish lengths for key families among habitat/protection levels. The distribution of fish lengths was also compared among protection levels for these families using Kruskal–Wallis test, and post-hoc test Multiple Comparisons Kruskal (KruskalMC), considering a significant difference as p-values <0.05.
For functional diversity analysis, for each habitat/protection level, the number of FEs (functional entities, i.e., the combination of traits) present in the assemblage relative to the number from the global pool (FE richness) and the volume inside the convex hull surrounding the FEs present (functional richness) were calculated. The number of species, number of FEs, and functional volume filled by each assemblage (4D) were expressed as a relative percentage of the global pool. The Gower’s Distance (Gower, 1971) was used to calculate pairwise functional distances between species pairs based on the six functional traits and build a functional space accounting for trait values of FEs. This metric was selected because it permits mixing different types of variables while giving them equivalent weight. Then, a multidimensional functional space was built using the first four principal axes of the principal coordinates analysis (PCoA) computed on the functional distance matrix, in which the position of FEs represents their disparities. The number of axes needed to build a functional space was selected according to the mean squared deviation (mSD) index computed between initial functional distance among FEs and final Euclidean distance in the functional space. The functional space built with four dimensions presented a low mSD (0.0024) and demonstrated an optimal capacity to represent functional differences between species while keeping computational time reasonable for functional β-diversity analyses. Routine of the analysis and R script was based on Teixidó et al. (2018).
All analyses were performed using R Language for Statistical Computing (R Core Team, 2020), with the packages FSSgam (Fisher et al., 2018), gamm4 (Wood and Scheipl, 2017), mgcv (Wood, 2011), MuMIn (Barton, 2018), doParallel (Microsoft-Corporation and Weston, 2017), dplyr (Wickham et al., 2018) for tidying data, and ggplot2 (Wickham, 2016) for plotting.
Results
A total of 3,109 fish individuals belonging to 27 families and 74 species were identified across all stereo-BRUV deployments (Supplementary Table S2). Of these, the most abundant species were yellowtail snapper (Ocyurus chrysurus = 32.1% of the individuals recorded), tomtate grunt (Haemulon aurolineatum = 14.1%), greenbeak parrotfish (Scarus trispinosus = 6.8%), sergeant-major (Abudefduf saxatilis = 6.3%), ocean surgeon (Acanthurus bahianus = 6.8%), and blue tang surgeon (Acanthurus coeruleus = 3.4%). The most conspicuous species were Ocyurus chrysurus (occurred in 93.1% of the footages), white grunt (Haemulon plumieri, in 47.9%), Abudefduf saxatilis (in 46.6%), Acanthurus bahianus (in 46.6%), S. trispinosus (in 46.8%), and black grouper (Mycteroperca bonaci, in 43.8%). Carnivores were the most abundant functional group, representing 39.8% of the individuals, followed by mobile invertebrate feeders (22.2%), roving herbivores (20.4%), omnivores (9.8%), planktivores (4.8%), and sessile invertebrate feeders (1%).
The GAMMs top models for each variable of interest are listed in Supplementary Table S3. In a broader view, differences in fish assemblage (biomass, abundance, and richness) were predicted mostly by relief variation, followed by mean relief, habitat/protection, macroalgae, sandy bottom, and hard corals cover (Supplementary Table S3 and Supplementary Figure 2). Protection was important to predict biomass of the total sample, explaining 25% of total variance, and for biomass of target species (22%), carnivores (25%), and for the fish families Carcharhinidae (9%) and Epinephelidae (9%) (Supplementary Table S3; Figures 2, 3F, 4A, 5A, B). For omnivores abundance, protection was also in the most parsimonious model but with a negative correlation, explaining 13% of total variance, showing higher abundance at fished sites than in protected zones (Figure 4D).
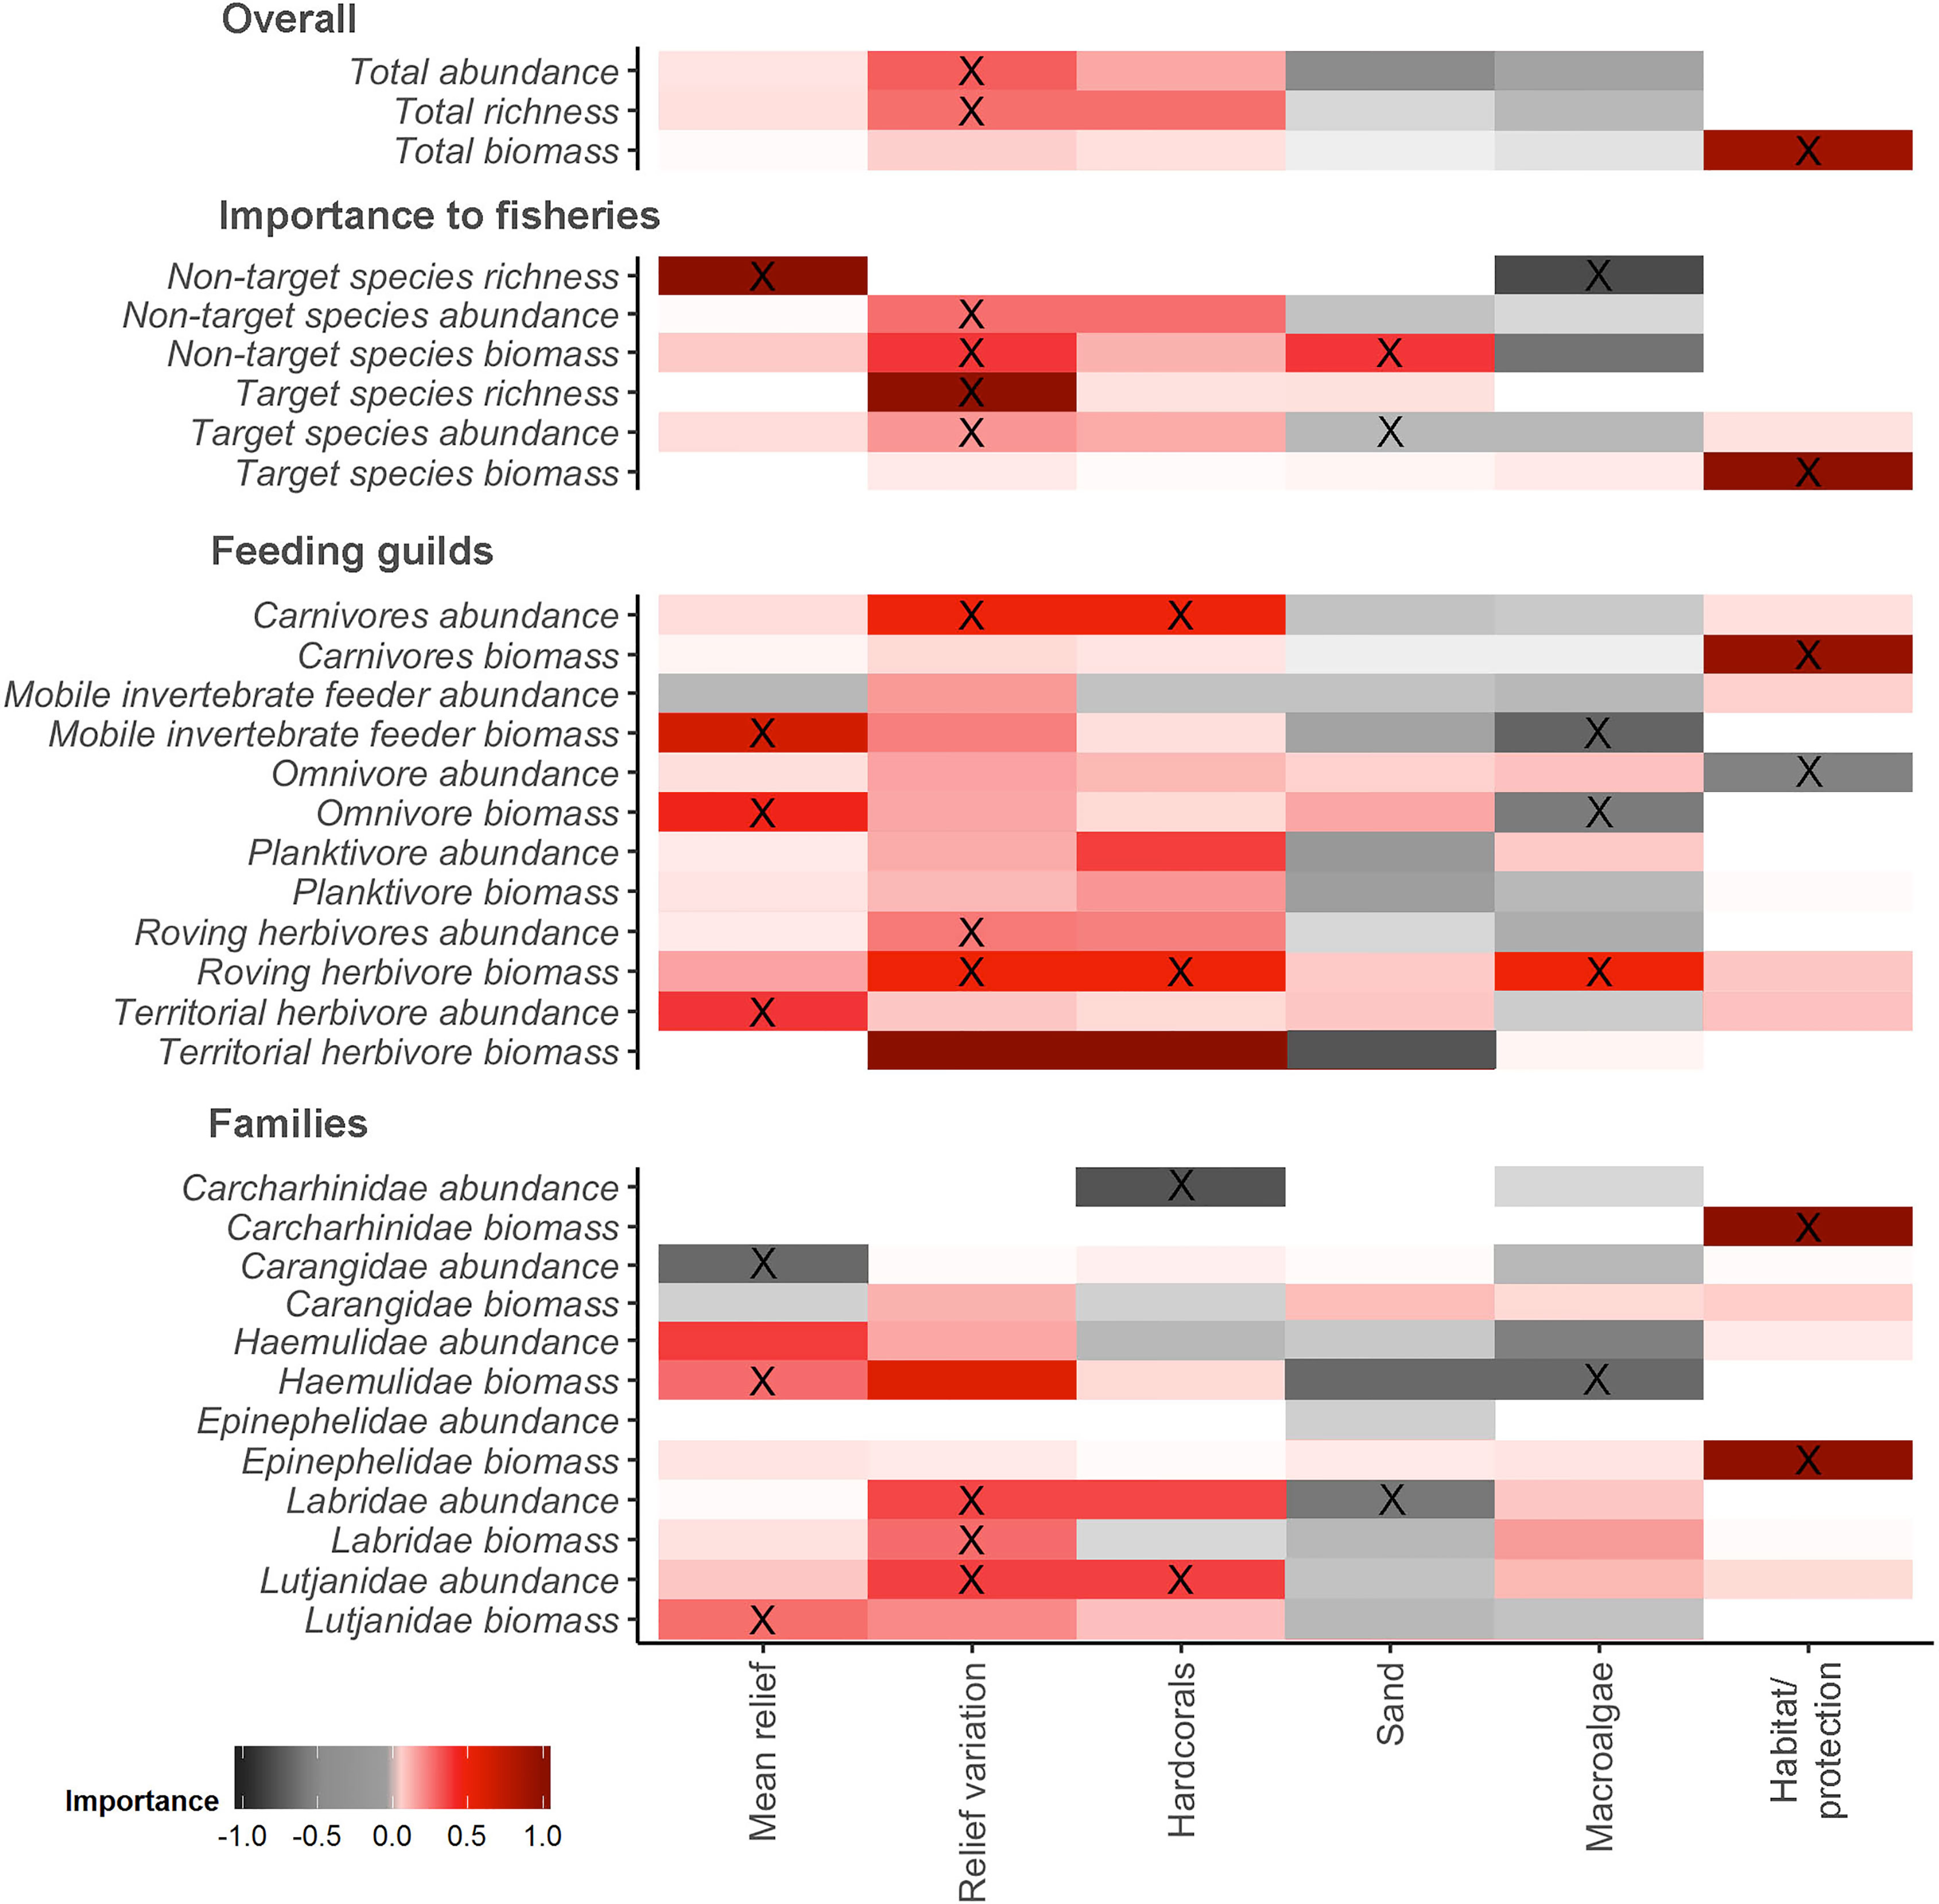
Figure 2 Variable importance scores from full-subset generalized additive mixed models’ analysis. X= Predictor variables within the most parsimonious model for each response variable.
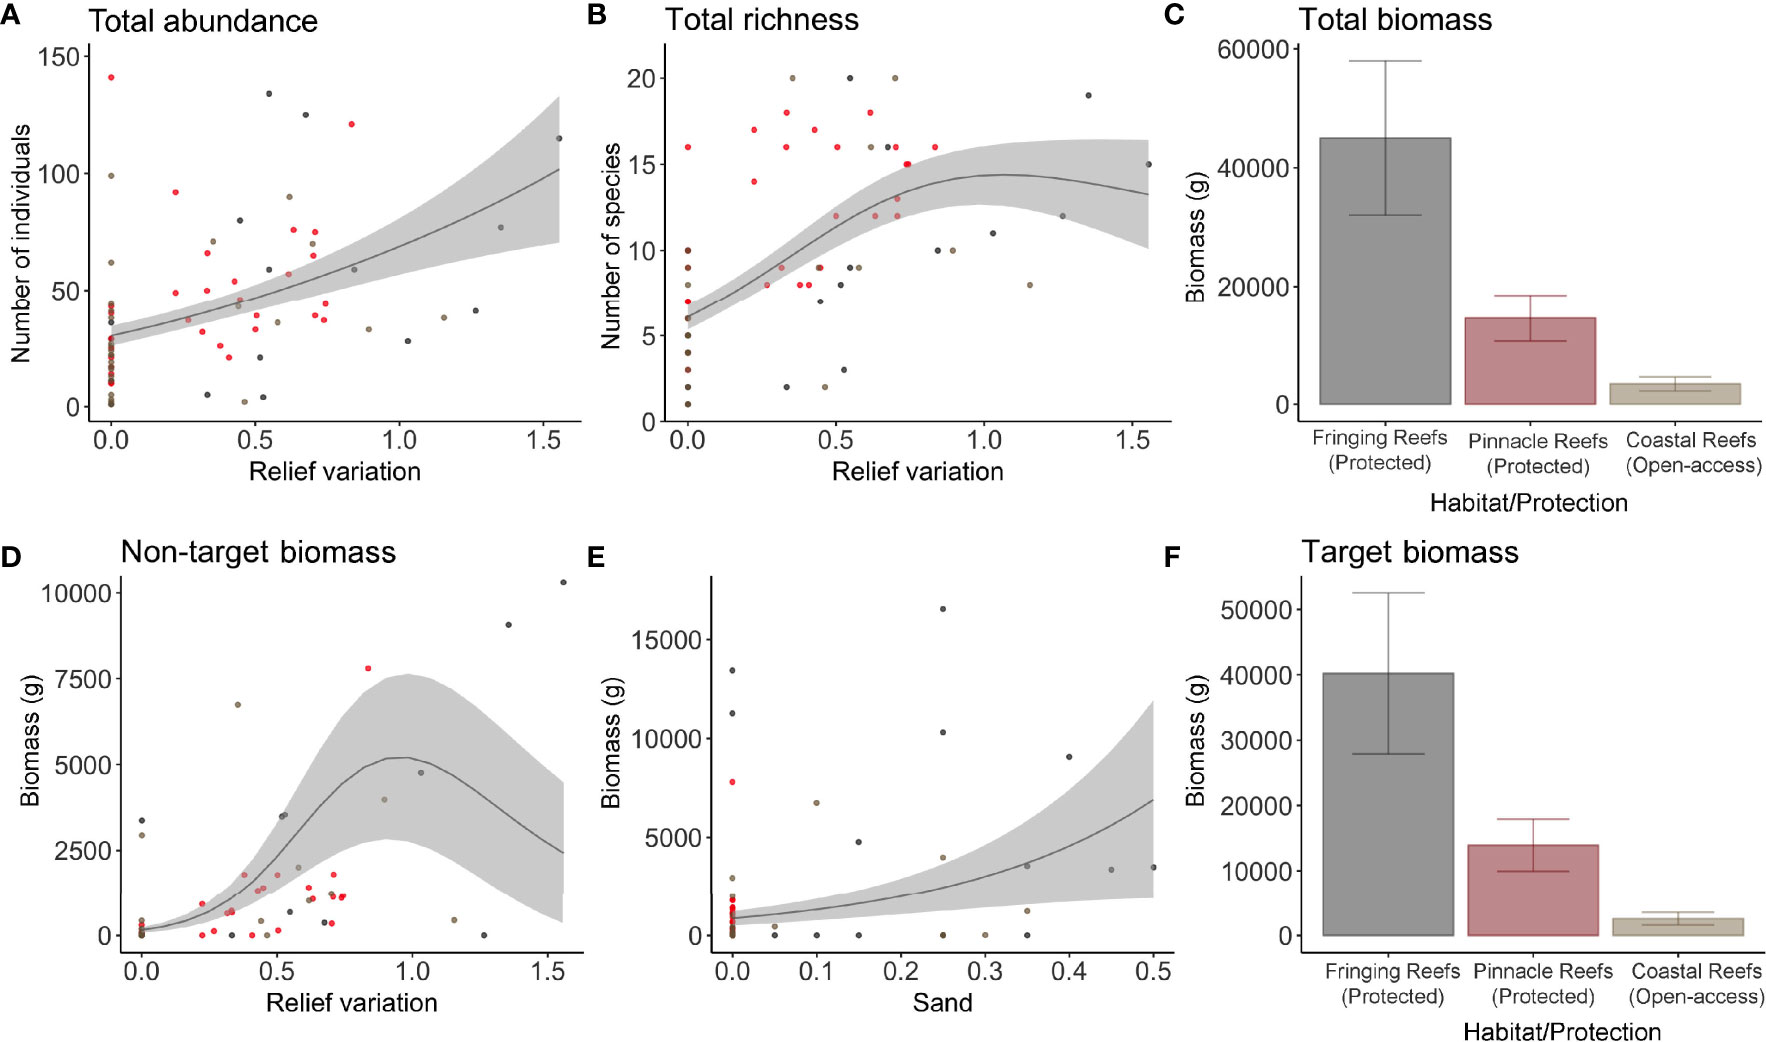
Figure 3 Most parsimonious models for the overall characteristics of the fish assemblage, total abundance (A), total richness (B), and total biomass (grams) (C). Plots of the most parsimonious models selected for biomass (grams) of fisheries non-target (D, E) and (F) target fish species. Each dot represents a sample, in which the gray dots represent the Fringing Reefs, red dots the Pinnacles Reefs, and beige the Coastal Reefs.
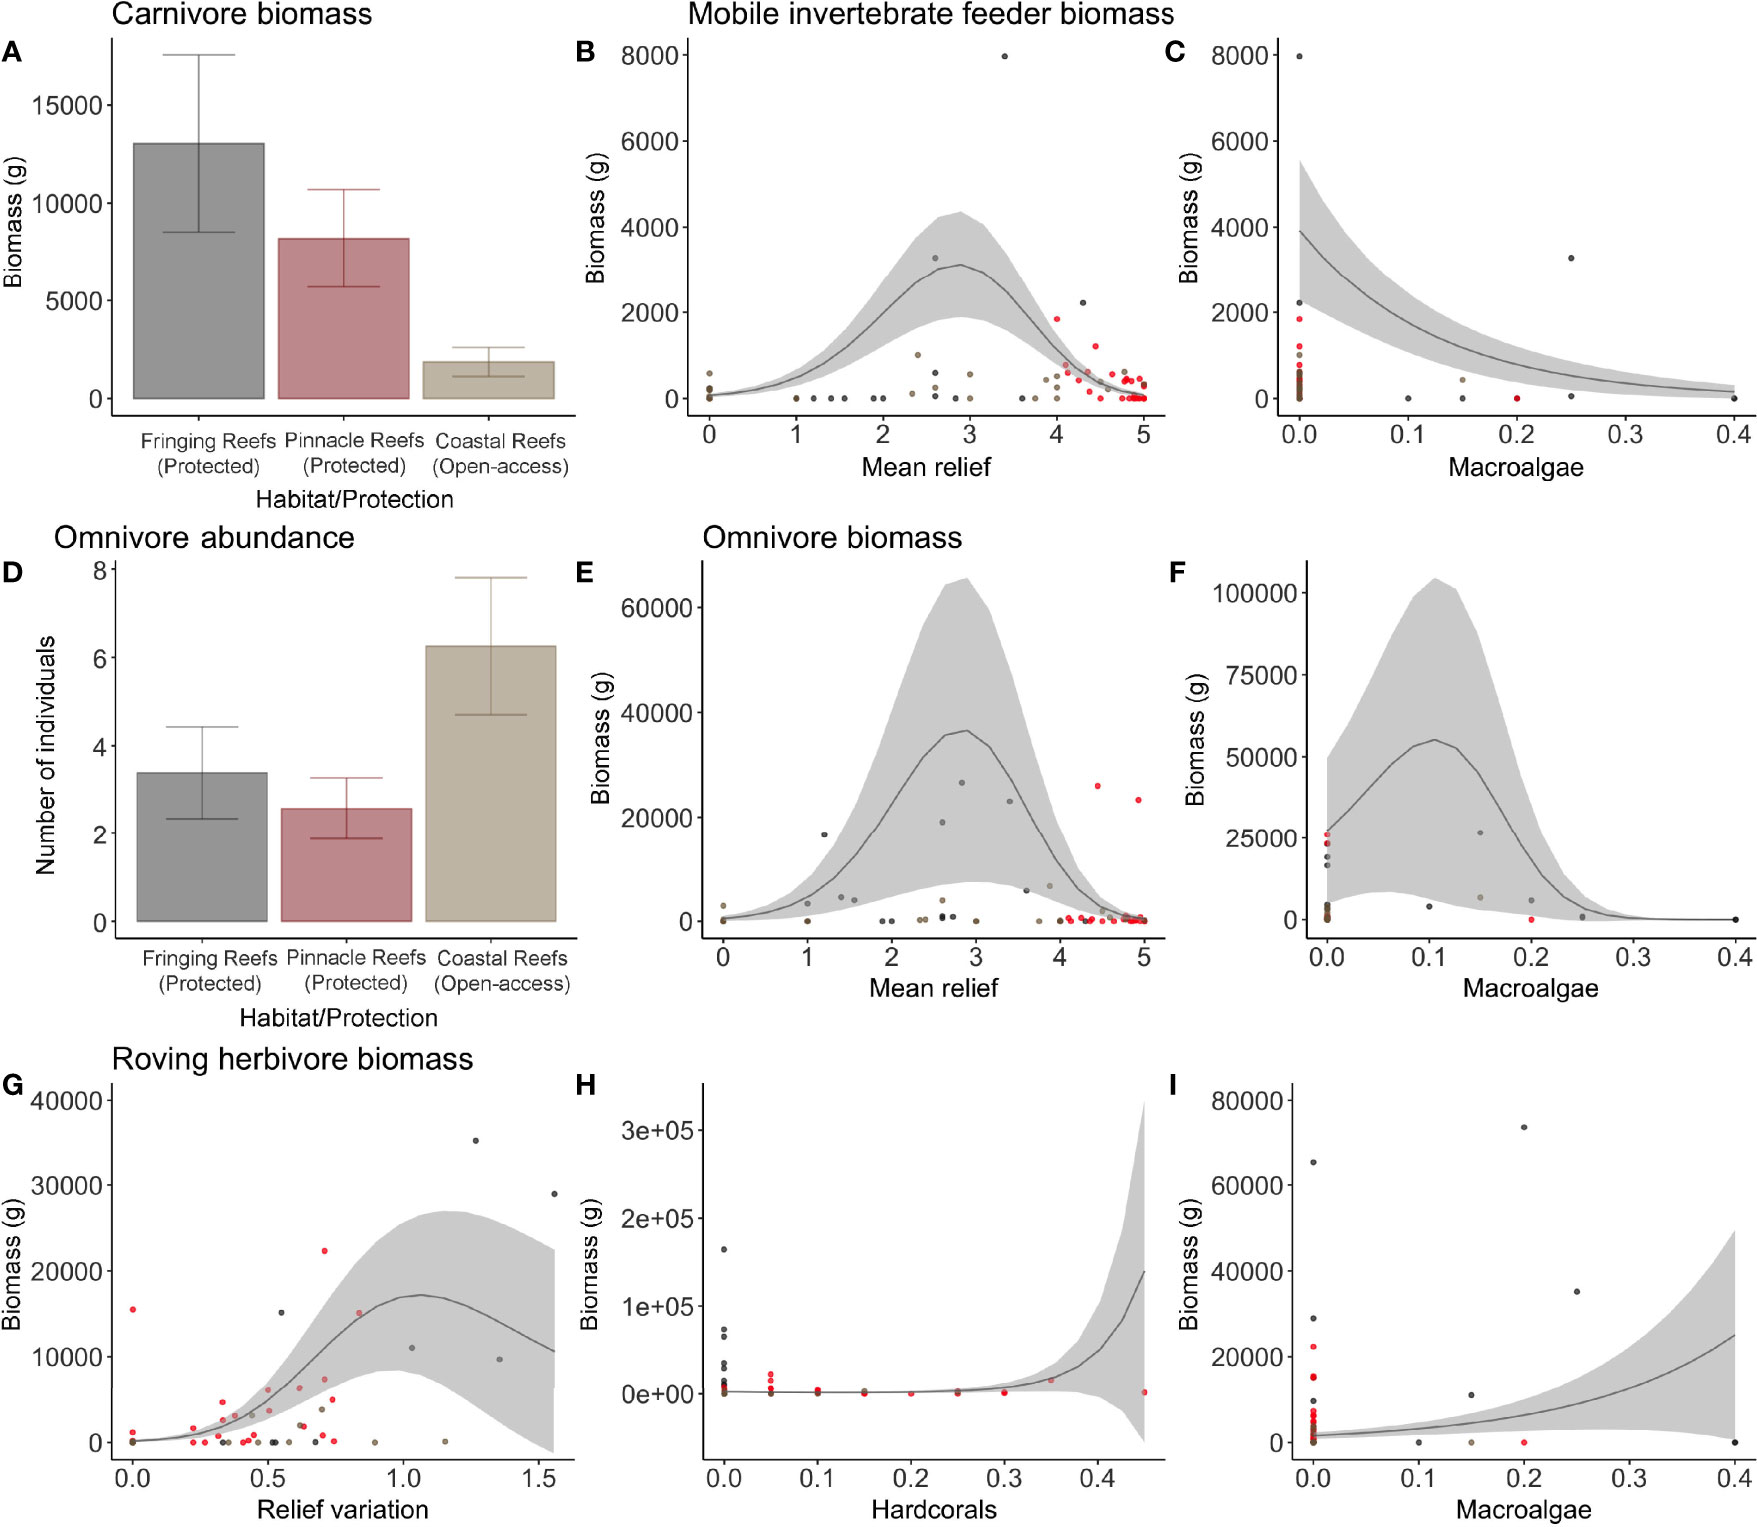
Figure 4 Plots of the most parsimonious models for the biomass (grams) of carnivores (A), mobile invertebrate feeders (B, C), omnivores (E, F), and roving herbivores (G–I), and abundance of omnivores (D). Each dot represents a sample: the gray dots represent the Fringing Reefs, red dots the Pinnacles Reefs, and beige the Coastal Reefs.
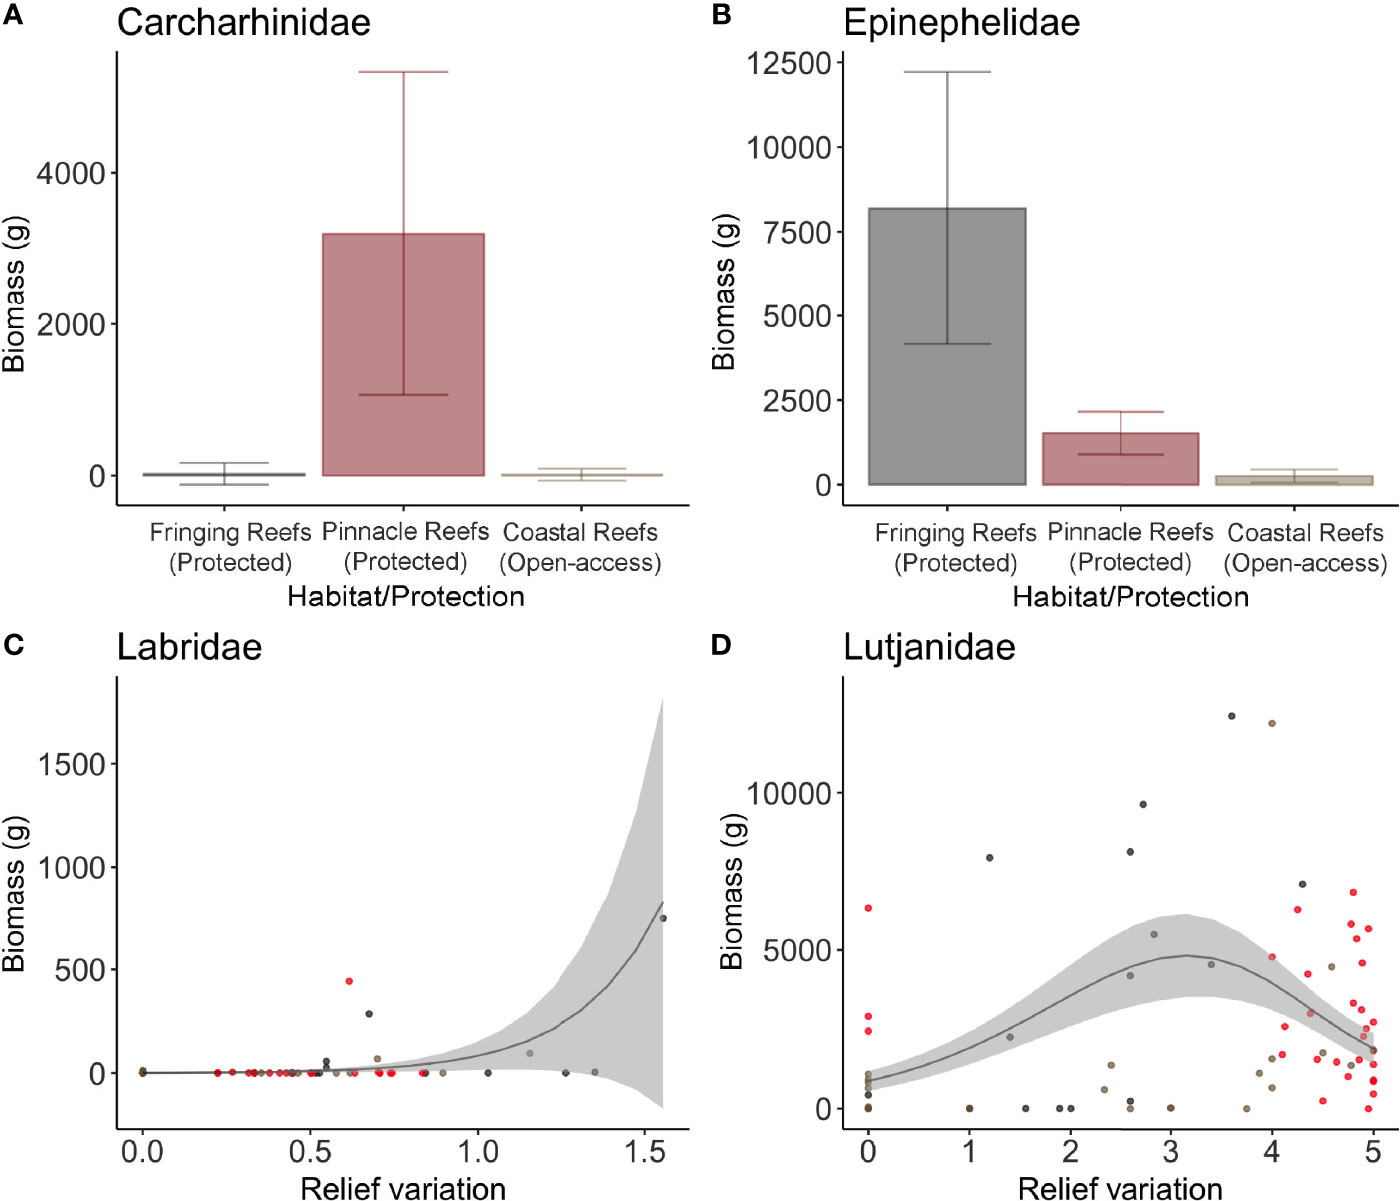
Figure 5 Most parsimonious models for the biomass (grams) of fish families with high economic value in the region: Carcharhinidae (A), Epinephelidae (B), Labridae (C) and Lutjanidae (D). Each dot represents a sample, in which the gray dots represent the Fringing Reefs, red dots the Pinnacles Reefs, and beige the Coastal Reefs.
Total abundance and richness were positively correlated with increased relief variation (Figures 3A, B), explaining 22% and 52% of the variance, respectively, and for non-target species abundance (35%) (Figure 2; Supplementary Table S3). A positive correlation with relief variation and negative with sandy bottom was the most parsimonious model that predicted target species abundance (13%) (Figure 2; Supplementary Table S3). Relief variation and sandy bottom were important predictors positively correlated with non-target species biomass (27%) (Figures 2, 3D, E). Concerning richness, non-target species were positively explained by mean relief and negatively with macroalgae (40%), while target species were positively explained only by relief variation (54%) (Supplementary Table S3; Figures 2, 3).
Carnivores and Lutjanidae family abundance were positively explained by relief variation and hard corals coverage, with 29% and 26%, respectively, of variance explained by the model (Supplementary Table S3; Figure 2). Roving herbivore abundance and biomass were also related to relief variation and to hard corals and macroalgae coverage (31% and 13%, respectively) (Figures 2, 4G–I). The most parsimonious model explained 11% of the distribution and indicated a positive correlation between both mobile invertebrate feeder biomass and omnivore biomass in reefs with higher levels of mean relief (Figures 2, 4B, E). This model also showed a negative correlation between macroalgae cover and the biomass of both mobile invertebrates and omnivores (Figures 4C, F).
The most parsimonious model for Lutjanidae biomass was mean relief, with 22% of variance explained (Supplementary Table S3, Figures 2, 5D). Labridae abundance and biomass were higher in deployments in areas with larger variation in relief, with abundance being also explained by sandy bottom (31% and 16%, respectively) (Supplementary Table S3; Figures 2, 5C).
In comparison to models of other groups of species, there were no strong predictors across all possible models for mobile invertebrate feeder, Haemulidae and Epinephelidae abundance, territorial herbivores and Carangidae biomass, and for planktivore abundance and biomass.
The economically important species greenbeak parrotfish (S. trispinosus) presented the highest total biomass recorded (25.8%), followed by black grouper (11.9%), Caribbean reef shark (Carcharhinus perezi) (11.4%), yellowtail snapper (10.1%), queen triggerfish (Balistes vetula) (7.8%), and sea chub (Kyphosus spp.) (6.6%). The functional groups that presented highest biomass were carnivores (43%), followed by roving herbivores (36.7%), omnivores (15.1%), mobile invertebrate feeders (4.5%), planktivores (0.4%), sessile invertebrate feeders (0.1%), and territorial herbivores (0.01%). Within the carnivores’ functional group, the Carcharhinidae family presented the highest biomass and was only found in the Pinnacles Reefs (Protected), while Dasyatidae stingrays’ family was only found in the Fringing Reefs (Protected).
Individuals from the economically important families Lutjanidae and Carangidae showed significantly higher proportions within both NTRs (p<0.001, H=190.19; p<0.001, H=48.24, respectively) when compared to open-access areas. However, Epinephelidae (p<0.001, H=19.31), Labridae (p=0.001, H=13.53), and Haemulidae (p<0.001, H=27.79) presented individuals with larger sizes only for the Fringing Reefs (Protected) (Figure 6). Fish communities in NTRs filled a larger volume of functional diversity, corresponding to a larger breadth of functional roles, than fish communities in open-access areas (Figure 7; Supplementary S3).
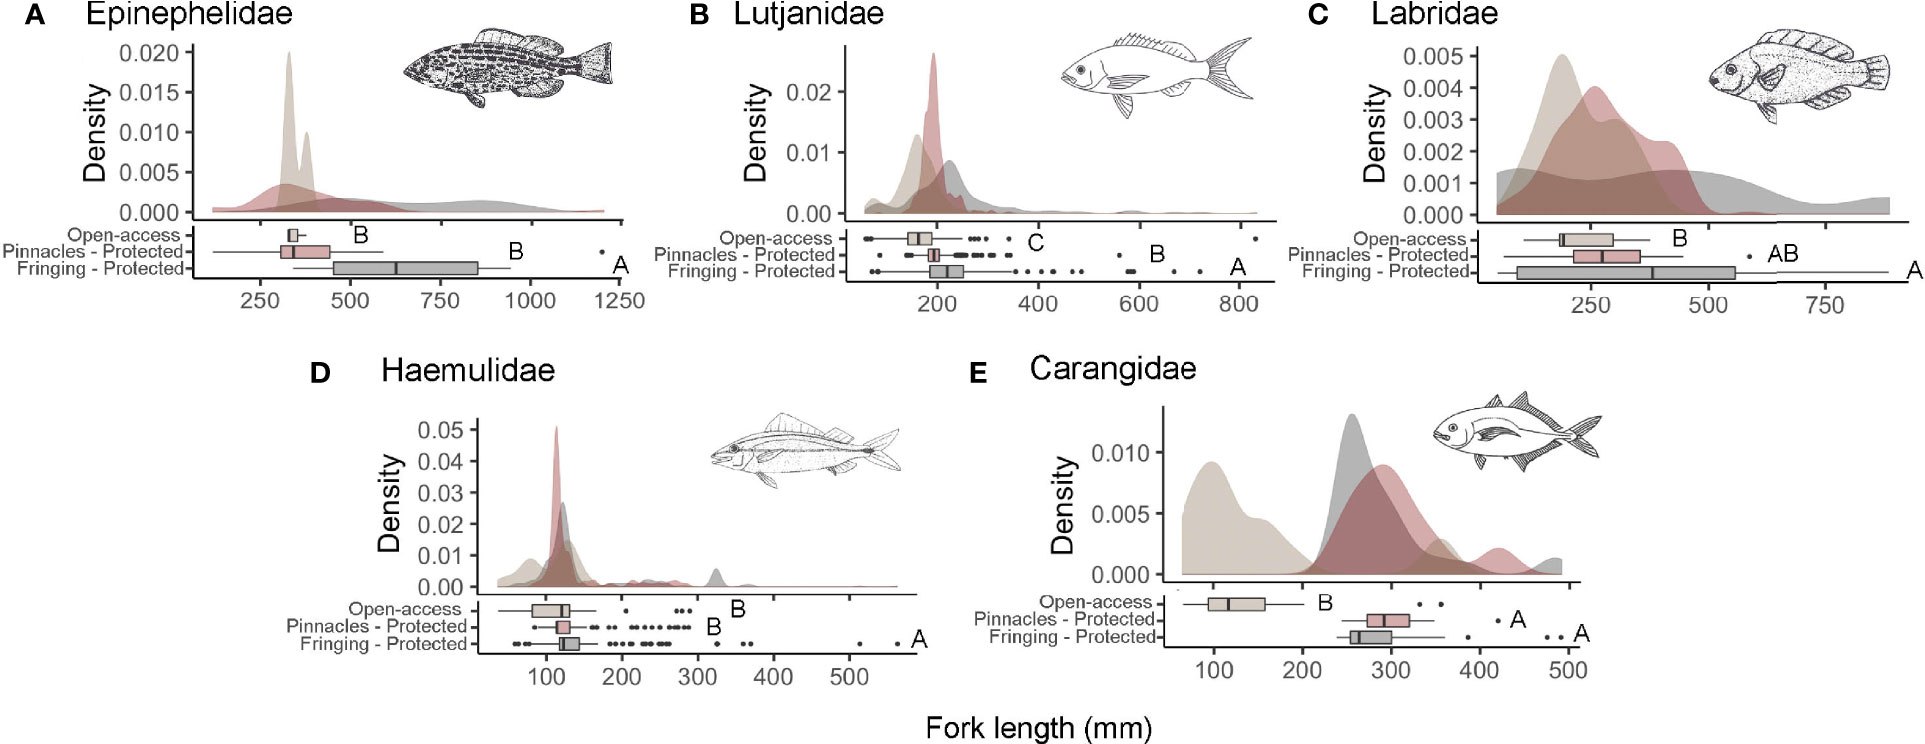
Figure 6 Kernel density plots and boxplots with Kruskal–Wallis post-hoc test results (p-values < 0.05) for fish fork length (mm) (letters) for important fisheries target families: Epinephelidae (A), Lutjanidae (B), Labridae (C), Haemulidae (D) and Carangidae (E). In the kernel density plots, the gray color represents the Fringing Reefs, red the Pinnacles Reefs, and beige Coastal Reefs. Fish drawings based on Carvalho-Filho et al. (1999).
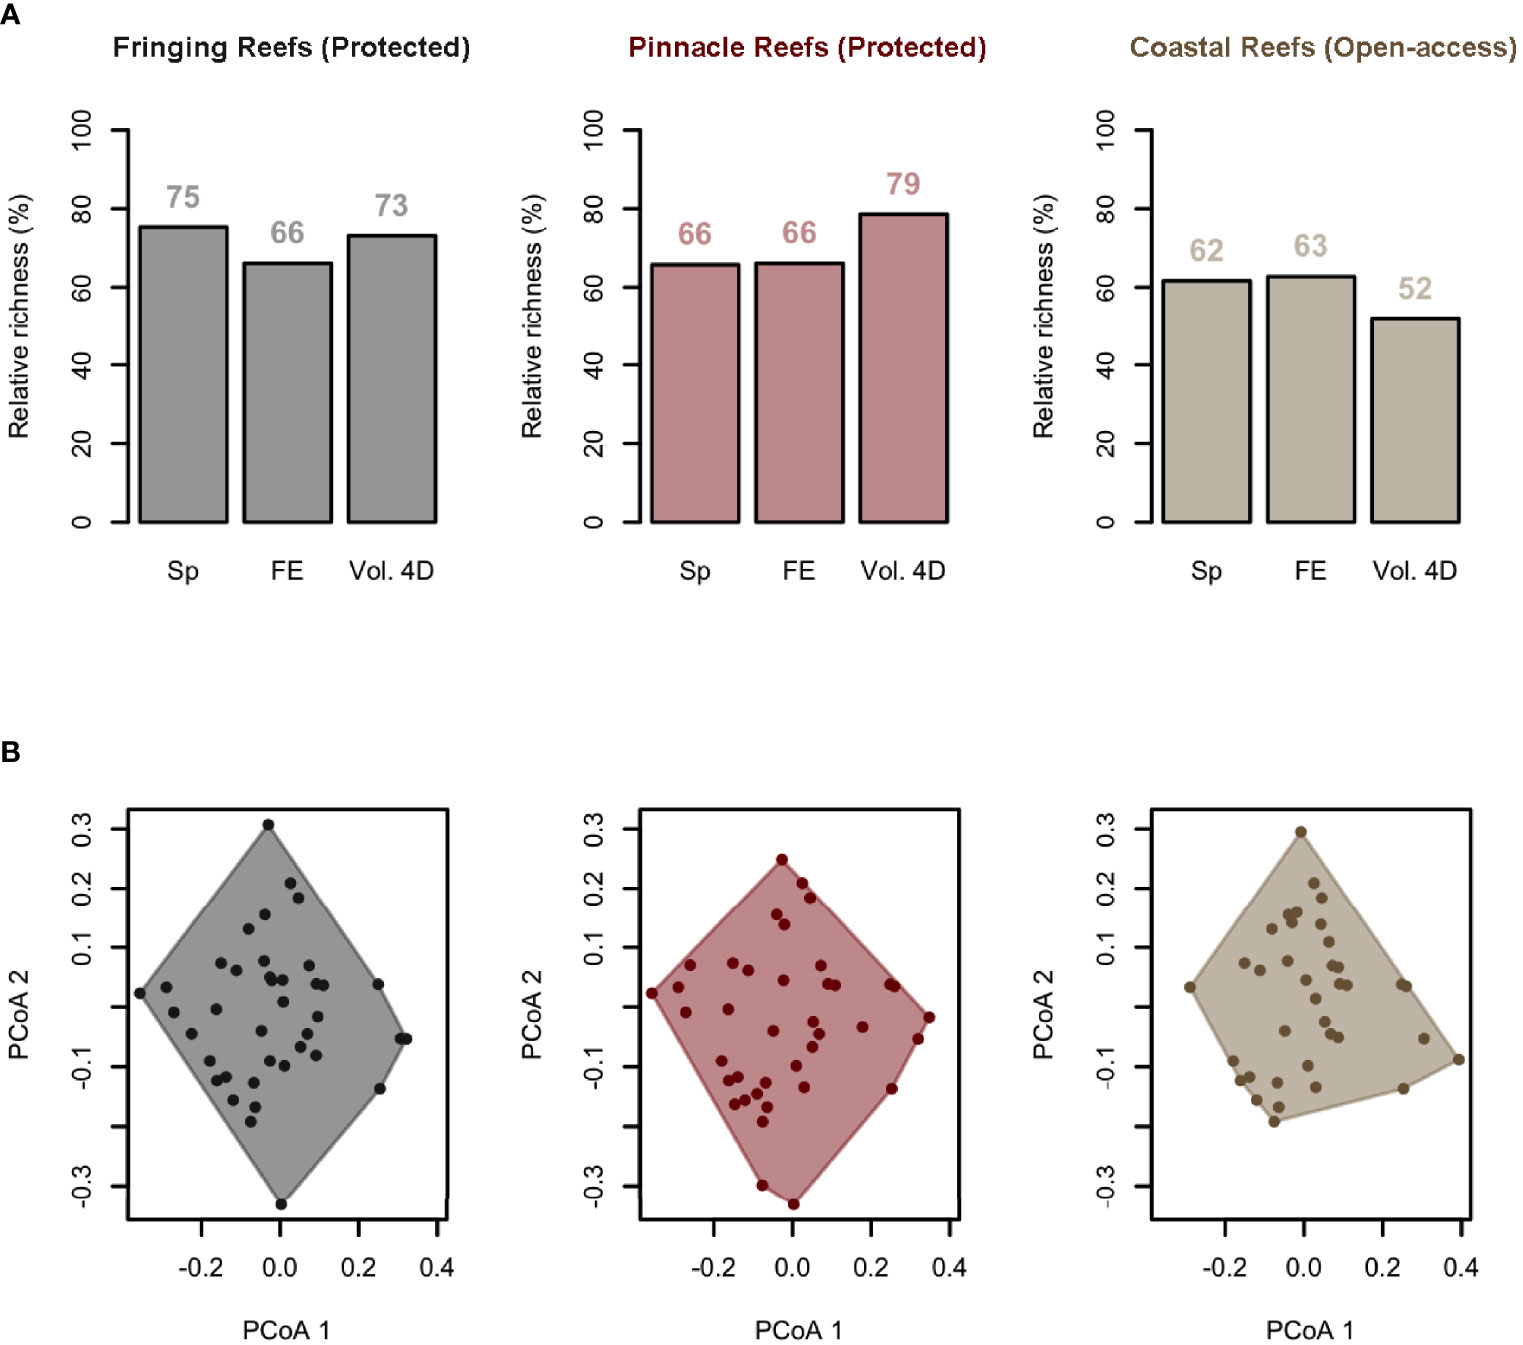
Figure 7 Functional space filled by fish communities in areas with Fringing Reefs—Protected (gray), areas with Pinnacles Reefs—Protected (red), and Open Access areas to fisheries (beige). Species and functional diversity changes among zones with different zones. (A) Barplots show species richness (Sp), number of functional entities (unique trait combinations, FE), and functional richness, i.e., the volume filled by each assemblage in the four dimensions of the functional space (Vol. 4D). Values are expressed as a relative percentage of the value for the total pool and are displayed above the bars. (B) Functional space filled by the functional entities (FEs) present in species assemblages from each pH condition. Axes (PCoA1 and PCoA2) represent the first two dimensions of the 4D functional space. Principal coordinate analysis (PCoA) was computed on functional-trait values.
Protected areas (both Pinnacles and Fringing) showed higher taxonomic diversity and functional diversity when compared to open-access areas (Figure 7), with Fringing Reefs (Protected) areas with a larger representation of species (75%) and the same percentage of FE as the Pinnacles Reefs (Protected) area (66%), occupying a similar area in the 4D space (73% and 79%, respectively). The difference in functional diversity between protected areas and open-access areas was more evident than the taxonomic difference, with Fringing Reefs (Protected) areas presenting 73% of the 4D functional space; Pinnacles Reefs (Protected), 79%; and Open Access areas 52% (Figure 7).
Concerning the distribution of functional entities within the functional space, the PCoAs showed that Fringing Reefs (Protected) areas were more evenly distributed along the functional space, showing higher representation of the different FEs, while Open Access areas are concentrated in fewer FEs. Pinnacles Reefs (Protected) areas also showed an even distribution of FEs, however with a high concentration of certain FEs (Figure 8, more information in Supplementary Figures S4, S5; Supplementary Table S4).
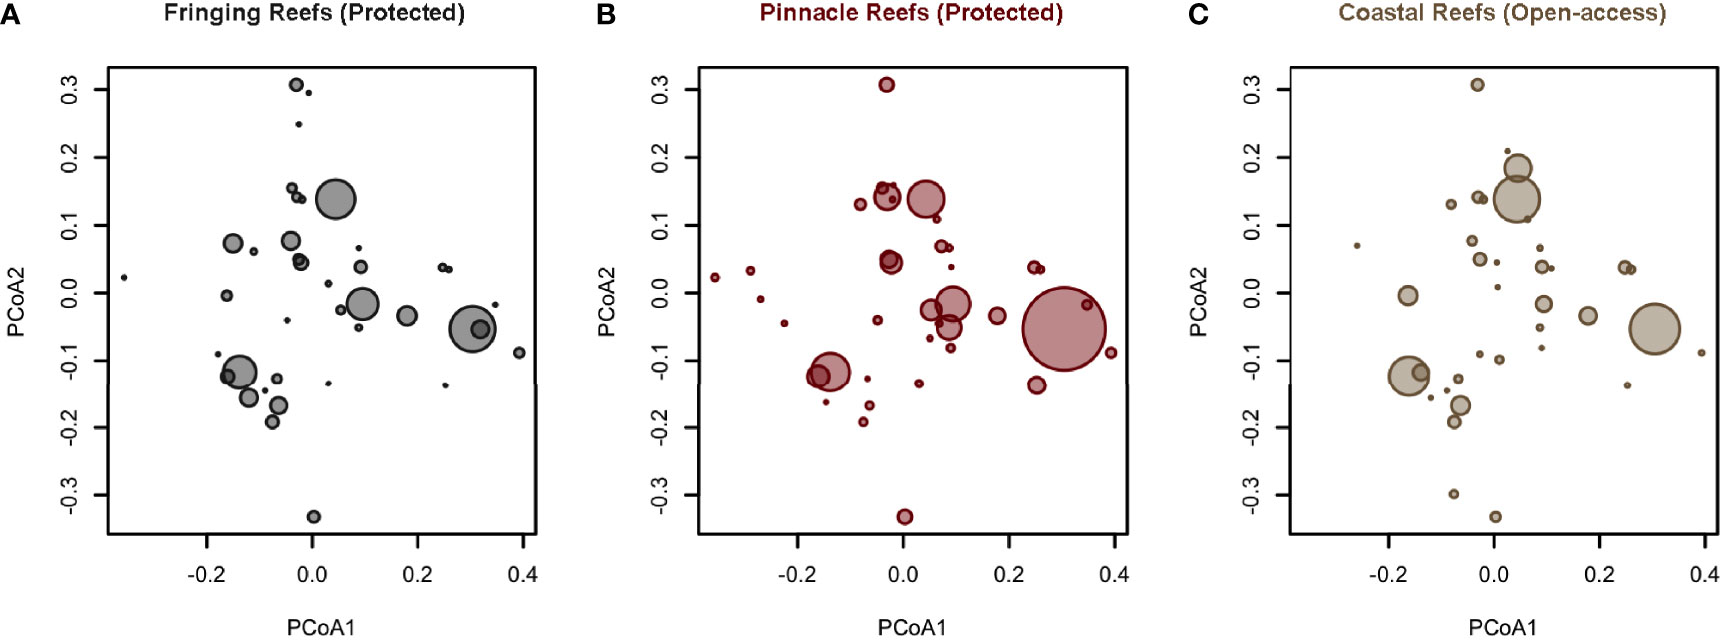
Figure 8 Overall distribution of functional entities (unique trait combinations, FE) abundance across the functional space for areas with Fringing Reefs—Protected (A), areas with Pinnacles Reefs—Protected (B), and areas open to fisheries (C). Each point represents an FE, and the size of the circles is proportional to the relative cover of the species belonging to a certain functional entity. Number of species = 86; number of FEs = 59.
Discussion
Our study found evidence for larger biomass of total fish, targeted species, and economically important carnivore families, such as Carcharhinidae and Epinephelidae, inside the NTR at the Abrolhos reefs, Brazil. We have also found a higher functional diversity of the fish assemblage and a more even distribution of functional entities within NTR. This indicates that the protection provided is attenuating the direct effect of fisheries in the region and allowing the growth of target species, resulting in larger fish within the marine park boundaries. Despite existing evidence on how no-take zones could recover reef fish populations at SWA, our study adds knowledge concerning fish functional diversity, showing that fisheries can decrease ecosystem functionality by removing whole functional entities and, therefore, changing the entire fish assemblage.
In contrast to carnivores, omnivore abundance was negatively correlated with protection, where these species occurred in higher abundances in areas open to fisheries. There are some possible scenarios that may be driving this relationship. The first is that the species belonging to this functional group is not highly targeted in the region compared to carnivores and roving herbivores (Carvalho-Filho, 1999; Francini-Filho and Moura, 2008a). Second, this could be an indication of an indirect effect of fisheries. Although the role of omnivores in the food web within coral reefs is the subject of debate, some studies have indicated that this trophic group is important to reduce the likelihood of trophic cascades once top predators are removed (Bascompte et al., 2005), especially as a consequence of fisheries activities. Moreover, in an evolutionary view, omnivory indeed appears to represent a transient state between high and low trophic levels (Siqueira et al., 2021). These facts could indicate a buffer reaction of highly fished reefs where the abundance of omnivores has increased following predator removal. Finally, omnivores are generalist feeders with plastic diets, which may confer resistance to degraded environments compared to more specialist species, such as herbivores or mobile invertebrate feeders—e.g., Bellwood et al. (2006) and Pratchett et al. (2011). As these scenarios have yet to be evaluated in the region, more investigation is required to describe the role that omnivores play in the Abrolhos reefs.
Even considering habitat differences, the effects of fishing were detected for some fish groups, especially for biomass estimates of fisheries target species (Carcharhinidae and Epinephelidae). Similar patterns were also observed for coral reef fish assemblages in McClure et al. (2021) and Castro-Sanguino et al. (2017), in which protection status affected only fishes targeted by fishers, while the other groups of fishes had more influence of habitat variables, such as structural complexity and coral coverage. Indeed, a higher biomass of target species within NTRs has been registered worldwide (Lester et al., 2009) and was also found in coral reefs in the Great Barrier Reef (Evans and Russ, 2004; Castro-Sanguino et al., 2017) and in rocky reefs in the Southwestern Atlantic, especially for groupers (Rolim et al., 2019; Motta et al., 2021). This indicates that the effect of fisheries in Abrolhos is also being manifested through a decrease in biomass by direct removal of larger bodied individuals targeted by fisheries.
Most of the abundance and richness estimates of the fish assemblage explored here were driven by habitat characteristics and were not influenced by protection from fishing. Indeed, habitat complexity has been shown to play an important role in influencing different aspects of coral reef fish assemblage (Friedlander et al., 2003; Messmer et al., 2011; Komyakova et al., 2013; McClure et al., 2021; Russ et al., 2021). In the present study, mean relief and relief variation explained positively most of the abundance, richness, and biomass estimates, especially for groups not targeted by fisheries. In fact, a higher structural complexity has been related to a higher fish richness, abundance, and biomass, especially for non-targeted fish (McClure et al., 2021), mostly likely due to a reduced competition (food and space) and predation (predator–prey encounters and availability of refuges) (Macarthur and Levins, 1964; Holt, 1987; Hixon and Menge, 1991). As fisheries are not directly removing biomass of these groups, it is therefore expected that the main factors influencing the assemblage is related to habitat characteristics (McClure et al., 2021; Russ et al., 2021).
The influence of habitat characteristics on the fish assemblage is scale dependent (Komyakova et al., 2018), in which fine scales characteristics, such as coral species or shape (Messmer et al., 2011; Komyakova et al., 2013; Castro-Sanguino et al., 2017), are more likely to influence small fish species associated with the reef, while larger-scale rugosity is indicated to have more influence on mobile species, including fisheries-targeted species (Graham, 2014; Rogers et al., 2014). In the present study, medium-scale topographic complexity, measured here as mean relief, was an important predictor to mobile invertebrate feeders biomass. Species of this trophic group are both closely associated with the reef and mobile around the reef (Quimbayo et al., 2021), especially due to their diet and reef functional role, which therefore explains the higher biomass in topographic complex reefs.
For some fisheries target groups, habitat characteristics, such as mean relief and macroalgae coverage, were more determinant than protection (e.g., Haemulidae and Lutjanidae biomass). As fisheries effects were primarily expected to influence these groups, we could attribute this result to the high variation in the habitats sampled, which could be masking fisheries effects, and/or the low abundance of top predators in open-access areas, allowing prey population to increase and indicating an indirect effect of fisheries. Even though protection did not explain variation in biomass and abundance of these targeted families, we could observe fisheries effects for these groups related to fish length, in which higher densities of larger individuals were registered inside the NTRs. Similar results have been previously found for target reef fish (Bianchi et al., 2000; DeMartini et al., 2008; Watson et al., 2009; Harasti et al., 2018; Rolim et al., 2019), representing also a positive effect of protection allowing individuals to grow inside its boundaries.
Although in the present study, the greenbeak parrotfish (S. trispinosus) presented the highest biomass and was also highly abundant and frequent in the footages within the NTR, protection was not an important factor to predict biomass of the correspondent functional group (roving herbivores). Instead, a combination of relief variation, hard corals, and macroalgae coverage was correlated with their abundance and biomass. This was not our primary hypothesis for this functional group, as most species within this group are highly targeted by fisheries (Ferreira, 2005; Francini-Filho and Moura, 2008a; Previero, 2014; Freitas et al., 2019). However, this result is likely due to the greater availability of refuge and food resources in topographic complex places mostly composed of macroalgae (Ferreira and Gonçalves, 2006) both inside and outside the NTR. The open-access areas assessed in this study are close to the mainland, which has been shown to be preferable to the group (Hoey and Bellwood, 2008; Roos et al., 2019). Moreover, coastal areas in the region have an increased influx of sediments and nutrients, and this probably leads to a high macroalgae cover in some deployments in shallow coastal reefs and explains the biomass outside the boundaries even with high fisheries activity (Francini-Filho and Moura, 2008a; Bruce et al., 2012; Francini-Filho et al., 2013). The influence of the rivers’ influx in the areas is being represented in the models through the environmental variables considered, such as topographic complexity (relief and relief variation), visibility, and benthic cover (ascidians, consolidated bottom, stony corals, bryozoa, macroalgae, sponges, unconsolidated bottom, zoanthids). Allied with that, it could be related to the lack of top predators in fished areas as well, indicating an indirect effect of fisheries. Finally, as a high biomass of these species is frequently removed by fisheries in the region (Ferreira, 2005; Previero, 2014; Roos et al., 2020), it could be a consequence of fisheries acting both illegally within NTR’s boundaries and outside (Francini-Filho and Moura, 2008a). Therefore, as environmental variables and illegal fisheries of the species could be masking protection effects, we recommend a more refined analysis focused on this species, and also on the whole functional group, to detect the influence of the park.
Our study showed an increased biomass of Carcharhinids inside Pinnacle reefs, which are areas protected from fishing. Even though environmental variables were considered in the analyses (coral cover, topographic complexity, visibility, among others), protection was the most important factor explaining biomass of this family. This could either suggest direct fishing effects on this group, by the direct removal of biomass, and/or an indirect effect of protection. This means that the protected area may be enabling a more conserved reef (Claudet et al., 2011) and therefore probably providing a higher availability of refuge and food resources in those areas. Pinnacle reefs are the furthest area from the continent that were assessed in the present study; therefore, another possible explanation is the distance from the coast. As we were not able to have a before–after control assessment with baselines before the establishment of the NTR, we suggest more investigation concerning fisheries effects in this family for the region.
This assessment of mobile predators was enabled by the use of diver-less sampling methods, which overcame behavioral biases that are common to other sampling methods, such as UVC (Ferreira, 2005). Furthermore, the presence of large predators only within both protected regions (Pinnacles Reefs and Fringing Reefs) found in the present study, such as Caribbean reef shark (Carcharhinus perezi) and nurse shark (Ginglymostoma cirratum), indicates that they may be responding positively to the protection. The dominance of carnivores was also registered in the region by Moura and Francini-Filho (2005)and points to a healthier ecosystem, since top predators can both be benefitted by healthy ecosystems (Espinoza et al., 2014), as they can maintain it not only by controlling the abundance but also the diet, genetics, movement, condition, behavior, and morphology of their prey (Ruppert et al., 2013; Ruppert et al., 2016). On a global scale, a recent analysis of shark abundance using BRUVs detected low abundances of reef sharks within protected areas on Brazilian reefs, in comparison with reefs around the globe, and considered this group to be depleted in the region (MacNeil et al., 2020). This highlights the importance of obtaining benchmarks to effectively manage the already highly exploited reef shark populations present in these areas. To maximize any protection afforded by NTRs to shark species, it is also important to consider the species-specific movement traits of more mobile species (e.g., nurse shark mean dispersal distance, 8.02 ± 5.03 km) compared to more site-attached species (e.g., Caribbean reef shark mean dispersal distance 3.97 ± 4.35 km), as more mobile species will require larger NTRs to encompass their home range (Bryars et al., 2012; Dwyer et al., 2020; Bonnin et al., 2021). As a result, NTRs are required to encompass 20 km of continuous habitat to conserve 50% of Caribbean reef shark movements, whereas 50 km of continuous reef habitat is required to encompass the same proportion of nurse shark movements (Dwyer et al., 2020). Not considering the mesophotic reefs at the Abrolhos Bank, the emergent or quasi-emergent reef formations within the Abrolhos Marine National Park encompasses at least 30 km of continuous reef, and therefore, it is likely to protect most of Caribbean reef sharks’ home range, but not as much of nurse sharks’. Therefore, compliance with Brazilian legislation that prohibits the capture of the species must be encouraged in the vicinity of the park.
The present study showed a higher density of larger individuals of target species, such as for the families Lutjanidae, Haemulidae, Labridae, Epinephelidae, and Carangidae, within protected areas. The effect of fisheries on the size distribution of fisheries target fish have been well documented, where targeted species reach larger sizes within NTRs (Bianchi et al., 2000; DeMartini et al., 2008; Watson et al., 2009; Harasti et al., 2018; Rolim et al., 2019). Similar results were also previously found for the Abrolhos region (Ferreira and Gonçalves, 1999; Ferreira, 2005). This can also indicate a likely decrease in reproduction capacity in fished areas, once larger individuals usually present higher fecundity (Jennings et al., 2009). As within the Abrolhos Marine Park, there were larger bodied fish (fork length); this increases the probability of exporting larvae and juveniles to adjacent areas (Francini-Filho and Moura, 2008a), repopulating fished reefs, and consequently ensuring fishing activity in the area.
Functional diversity differences between open-access and protected areas were also indicated by our study. Fish trait entities were more diversified and more evenly distributed within protected areas, indicating that these areas present higher chances of ensuring ecosystem functionalities, i.e., ecosystem dynamics, stability, productivity, nutrient balances, and other aspects (Tilman, 2001). Although it is not possible to relate these solely to the effect of protection because of differences in habitat, the lower functional diversity in open-access areas could indicate a fisheries pressure, mainly because of the lack of larger bodied target species functional entities. Indeed, fishing activity has the potential to remove whole functional groups from marine ecosystems (Micheli and Halpern, 2005), with a preference for predatory species (Myers and Worm, 2003) and species that grow larger (Genner et al., 2010). More importantly, a lower and uneven functional diversity can indicate also a lower resilience to environmental changes, both of natural or anthropogenic causes (Nyström and Folke, 2001; Raymundo et al., 2009; Naeem et al., 2012). Therefore, it highlights the importance of these NTRs in terms of maintenance of natural ecological processes and buffering of impacts, and allied with the other results presented in this study, it supports the need to maintain the protection.
Conclusions
The present study showed effects of management regimes and habitat variation in the reef fish assemblage using baited stereo-video in the Abrolhos bank, generating important information about fisheries effects in the region. Although our results showed a strong effect of habitat variation on diverse aspects of fish assemblage, we also found clear, direct effects responses to fisheries activities in the region. These effects included an increase in the biomass and size (fish fork length) of commercially important species. Collectively, our results indicate a positive response to the protection and importance of this NTR for reef fish biodiversity in a region that is home to the largest coral reef in the South Atlantic.
Data Availability Statement
The data presented in the study are included in the article/Supplementary Material and also compiled using the GlobalArchive data portal (globalarchive.org), funded by the Australian Research Data Commons’ Data Partnerships project.
Ethics Statement
The national agency Chico Mendes Institute for Biodiversity Conservation (ICMBio) issued the permits to develop the project, to access the protected area and to collect the images (SISBIO 48259-3).
Author Contributions
FR, FM, OG, and RM: original idea. FR, TL, FM, GC, MA and RM: data curation. FR, TL, GC and EL: formal analysis. FR, TL, FM, OG, and RM: funding acquisition. FR, TL, FM, OG, and RM: methodology. OG and TL: supervision. FR: writing—original draft. FR, TL, FM, GC, EL, MA, OG, and RM: writing—review and editing.
Funding
This study was financed by the Brazil’s National Council for Scientific and Technological Development (Conselho Nacional de Desenvolvimento Científico e Tecnológico - CNPq) through its Long-Term Ecological Research program (PELD), as well as by the Boticario Foundation for Nature Protection (OG, FR, Project #1043_20151), and Linha D'água Institute. This research was also supported by “GlobalArchive: Harnessing fish and shark image data for powerful biodiversity reporting” (https://doi.org/10.47486/DP761) received investment from the Australian Research Data Commons (ARDC) (https://ardc.edu.au/), funded by the National Collaborative Research Infrastructure Strategy, their motivation is to make fish imagery annotation data more FAIR (https://ardc.edu.au/resources/aboutdata/fair-data/). TL and EL were supported by the Australian Government’s National Environmental Science Program Marine and Coastal Hub (https://nespmarinecoastal.edu.au/). RM acknowledges individual grants from CNPq, CAPES/IODP, FAPERJ and FAPES. FR thanks CNPq for the PhD scholarship (CNPq 141799/2016-1) and OG for the research productivity grant (CNPq 308430/2015-8).
Conflict of Interest
The authors declare that the research was conducted in the absence of any commercial or financial relationships that could be construed as a potential conflict of interest.
Publisher’s Note
All claims expressed in this article are solely those of the authors and do not necessarily represent those of their affiliated organizations, or those of the publisher, the editors and the reviewers. Any product that may be evaluated in this article, or claim that may be made by its manufacturer, is not guaranteed or endorsed by the publisher.
Acknowledgments
The authors would like to thank the Chico Mendes Institute for Biodiversity Conservation (ICMBio) for the permits (SISBIO 48259-3). We are also thankful to Caroline S. P. Santana and Pedro F. C. Rodrigues for the assistance in video analysis, to Dr. Fernando C. Moraes for the technical support onboard, as well as to the whole crew from the boat “Oceano” from Abrolhos Embarcações and Dilson Cajueiro for the support in the field trips.
Supplementary Material
The Supplementary Material for this article can be found online at: https://www.frontiersin.org/articles/10.3389/fmars.2022.701244/full#supplementary-material
Supplementary Data Sheet 1 | Supplementary Tables S1-S4 and Supplementary Figures S1-S5.
Supplementary Data Sheet 2 | Rscript_Analysis_FishSize_Abrolhos.pdf.
Supplementary Data Sheet 3 | Rscript_Analysis_GAMMs_Abrolhos.pdf.
Supplementary Data Sheet 4 | Rscript_Analysis_FunctionalDiversity_Abrolhos.pdf.
Supplementary Figure 1 | GAMM_Models_validation_plots.pdf.
References
Abesamis R. A., Russ G. R. (2005). Density-Dependent Spillover From a Marine Reserve: Long-Term Evidence. Ecol. Appl. 15, 1798–1812. doi: 10.1890/05-0174
Agardy M. T. (1994). Advances in Marine Conservation: The Role of Marine Protected Areas. Trends Ecol. Evol. 9, 267–270. doi: 10.1016/0169-5347(94)90297-6
Akaike H. (1973). “Information Theory and an Extension of the Maximum Likelihood Principle”, in International Symposium on Information Theory, 2nd. Eds. Petrov B. N., Csaki F. (Budapest, Hungary: Akadémiai Kiadó), 267–281.
Althaus F., Hill N., Ferrari R., Edwards L., Przesławski R., Schönberg C. H. L., et al. (2015). A Standardised Vocabulary for Identifying Benthic Biota and Substrata From Underwater Imagery: The CATAMI Classification Scheme. PloS One 10, e0141039. doi: 10.1371/journal.pone.0141039
Babcock R. C., Shears N. T., Alcala A. C., Barrett N. S., Edgar G. J., Lafferty K. D., et al. (2010). Decadal Trends in Marine Reserves Reveal Differential Rates of Change in Direct and Indirect Effects. Proc. Natl. Acad. Sci. U.S.A. 107, 18256–18261. doi: 10.1073/pnas.0908012107
Barton K. (2018) MuMIn: Multi-Model Inference. Available at: https://CRAN.R-project.org/package=MuMIn (Accessed 27, 2018).
Bascompte J., Melián C. J., Sala E. (2005). Interaction Strength Combinations and the Overfishing of a Marine Food Web. Proc. Natl. Acad. Sci. U. S. A. 102, 5443–5447. doi: 10.1073/pnas.0501562102
Bellwood D. R., Hoey A. S., Ackerman J. L., Depczynski M. (2006). Coral Bleaching, Reef Fish Community Phase Shifts and the Resilience of Coral Reefs. Glob. Change Biol. 12, 1587–1594. doi: 10.1111/j.1365-2486.2006.01204.x
Bender M. G., Leprieur F., Mouillot D., Kulbicki M., Parravicini V., Pie M. R., et al. (2017). Isolation Drives Taxonomic and Functional Nestedness in Tropical Reef Fish Faunas. Ecography 40, 425–435. doi: 10.1111/ecog.02293
Bennett K., Wilson S. K., Shedrawi G., McLean D. L., Langlois T. J. (2016). Can Diver Operated Stereo-Video Surveys for Fish be Used to Collect Meaningful Data on Benthic Coral Reef Communities?: Comparing Benthos From Video Methods. Limnol. Oceanogr. Methods 14, 874–885. doi: 10.1002/lom3.10141
Bernard A. T. F., Götz A. (2012). Bait Increases the Precision in Count Data From Remote Underwater Video for Most Subtidal Reef Fish in the Warm-Temperate Agulhas Bioregion. Mar. Ecol. Prog. Ser. 471, 235–252. doi: 10.3354/meps10039
Bianchi G., Gislason H., Graham K., Hill L., Jin X., Koranteng K., et al. (2000). Impact of Fishing on Size Composition and Diversity of Demersal Fish Communities. ICES J. Mar. Sci. 57, 558–571. doi: 10.1006/jmsc.2000.0727
Bonnin L., Mouillot D., Boussarie G., Robbins W. D., Kiszka J. J., Dagorn L., et al. (2021). Recent Expansion of Marine Protected Areas Matches With Home Range of Grey Reef Sharks. Sci. Rep. 11, 14221. doi: 10.1038/s41598-021-93426-y
Bosch N. E., Jacquomo M., Jordan G., Shaun W., Babcock R. C., Neville B., et al. (2021). Effects of Human Footprint and Biophysical Factors on the Body-Size Structure of Fished Marine Species. Conservation Biology: The Journal of the Society for Conservation Biology 7, e36687. doi: 10.1111/cobi.13807
Bruce T., Meirelles P. M., Garcia G., Paranhos R., Rezende C. E., Moura R. L., et al. (2012). Abrolhos Bank Reef Health Evaluated by Means of Water Quality, Microbial Diversity, Benthic Cover, and Fish Biomass Data. PloS One 7, e36687. doi: 10.1371/journal.pone.0036687
Bryars S., Rogers P., Huveneers C., Payne N., Smith I., McDonald B. (2012). Small Home Range in Southern Australia’s Largest Resident Reef Fish, the Western Blue Groper (Achoerodus Gouldii): Implications for Adequacy of No-Take Marine Protected Areas. Mar. Freshwater Res. 63, 552–563. doi: 10.1071/MF12016
Cappo M., Harvey E., Shortis M. (2006). “Counting and Measuring Fish With Baited Video Techniques—an Overview,” in Australian Society for Fish Biology Workshop Proceedings. Eds. Lyle J. M., Furlani D. M., Buxton C. D. (Tasmania: Australian Society for Fish Biology), 101–114.
Cappo M., Speare P., Wassenberg T., Harvey E., Rees M., Heyward A., et al. (2001). “The Use of Baited Remote Underwater Video Stations (BRUVS) to Survey Demersal Fish Stocks - How Deep and Meaningful?” in Direct Sensing of the Size Frequency and Abundance of Target and Non-Target Fauna in Australian Fisheries-a National Workshop (Rottnest Island, WA, Australia: Fisheries Research Development Corporation), 63–71.
Cappo M., Stowar M., Syms C., Johansson C., Cooper T. (2011). Fish-Habitat Associations in the Region Offshore From James Price Point-A Rapid Assessment Using Baited Remote Underwater Video Stations (BRUVS). J. R. Soc West. Aust. 94, 303–321.
Castro-Sanguino C., Bozec Y.-M., Dempsey A., Samaniego B. R., Lubarsky K., Andrews S., et al. (2017). Detecting Conservation Benefits of Marine Reserves on Remote Reefs of the Northern GBR. PloS One 12, e0186146. doi: 10.1371/journal.pone.0186146
Chapman C. J., Johnstone A. D. F., Dunn J. R., Creasey D. J. (1974). Reactions of Fish to Sound Generated by Divers’ Open-Circuit Underwater Breathing Apparatus. Mar. Biol. 27, 357–366. doi: 10.1007/BF00394372
Claudet J., Guidetti P., Mouillot D., Shears N. T., Micheli F. (2011). “Ecological Effects of Marine Protected Areas: Conservation, Restoration, and Functioning”, in Marine Protected Areas: A Multidisciplinary Approach. Ed. Claudet J. (Cambridge, United Kingdom: Cambridge University Press), 37–71.
Coleman M. A., Bates A. E., Stuart-Smith R. D., Malcolm H. A., Harasti D., Jordan A., et al. (2015). Functional Traits Reveal Early Responses in Marine Reserves Following Protection From Fishing. Divers. Distrib. 21, 876–887. doi: 10.1111/ddi.12309
Crowder L. B., Hazen E. L., Avissar N., Bjorkland R., Latanich C., Ogburn M. B. (2008). The Impacts of Fisheries on Marine Ecosystems and the Transition to Ecosystem-Based Management. Annu. Rev. Ecol. Evol. Syst. 39, 259–278. doi: 10.1146/annurev.ecolsys.39.110707.173406
D’Agata S., Mouillot D., Wantiez L., Friedlander A. M., Kulbicki M., Vigliola L. (2016). Marine Reserves Lag Behind Wilderness in the Conservation of Key Functional Roles. Nat. Commun. 7, 12000. doi: 10.1038/ncomms12000
DeMartini E. E., Friedlander A. M., Sandin S. A., Sala E. (2008). Differences in Fish-Assemblage Structure Between Fished and Unfished Atolls in the Northern Line Islands, Central Pacific. Mar. Ecol. Prog. Ser. 365, 199–215. doi: 10.3354/meps07501
Di Lorenzo M., Claudet J., Guidetti P. (2016). Spillover From Marine Protected Areas to Adjacent Fisheries has an Ecological and a Fishery Component. J. Nat. Conserv. 32, 62–66. doi: 10.1016/j.jnc.2016.04.004
Dorman S. R., Harvey E. S., Newman S. J. (2012). Bait Effects in Sampling Coral Reef Fish Assemblages With Stereo-BRUVs. PloS One 7, e41538. doi: 10.1371/journal.pone.0041538
Duarte G. A. S., Villela H. D. M., Deocleciano M., Silva D., Barno A., Cardoso P. M., et al. (2020). Heat Waves are a Major Threat to Turbid Coral Reefs in Brazil. Front. Marine Sci. 7, 179. doi: 10.3389/fmars.2020.00179
Dudley N. (Ed.) (2008). Guidelines for Applying Protected Area Management Categories (Gland, Switzerland: International Union for the Conservation of Nature (IUCN).
Dwyer R. G., Krueck N. C., Udyawer V., Heupel M. R., Chapman D., Pratt H. L., et al. (2020). Individual and Population Benefits of Marine Reserves for Reef Sharks. Curr. Biol. 30, 480–489.e5. doi: 10.1016/j.cub.2019.12.005
Espinoza M., Cappo M., Heupel M. R., Tobin A. J., Simpfendorfer C. A. (2014). Quantifying Shark Distribution Patterns and Species-Habitat Associations: Implications of Marine Park Zoning. PloS One 9, e106885. doi: 10.1371/journal.pone.0106885
Evans R. D., Russ G. R. (2004). Larger Biomass of Targeted Reef Fish in No-Take Marine Reserves on the Great Barrier Reef, Australia. Aquat. Conserv. 14, 505–519. doi: 10.1002/aqc.631
Ferreira C. E. L. (2005). “The Status of Target Reef Fishes”, in A Rapid Marine Biodiversity Assessment of the Abrolhos Bank, Bahia, Brazil RAP Bulletin of Biological Assessment. Eds. Dutra G. F., Allen G. R., Werner T., McKenna S. A. (Washington, DC: Conservation International), 56–66.
Ferreira C. E. L., Gonçalves J. (1999). The Unique Abrolhos Reef Formation (Brazil): Need for Specific Management Strategies. Coral Reefs 18, 352–352. doi: 10.1007/s003380050211
Ferreira C. E. L., Gonçalves J. E. A. (2006). Community Structure and Diet of Roving Herbivorous Reef Fishes in the Abrolhos Archipelago, South-Western Atlantic. J. Fish Biol. 69, 1533–1551. doi: 10.1111/j.1095-8649.2006.01220.x
Ferreira C. E. L., Gonçalves J. E. A., Coutinho R. (2001). Community Structure of Fishes and Habitat Complexity on a Tropical Rocky Shore. Environ. Biol. Fishes 61, 353–369. doi: 10.1023/A:1011609617330
Fisher R., Wilson S. K., Sin T. M., Lee A. C., Langlois T. J. (2018). A Simple Function for Full-Subsets Multiple Regression in Ecology With R. Ecol. Evol 8, 6104–6113. doi: 10.1002/ece3.4134
Francini-Filho R. B., Coni E. O. C., Meirelles P. M., Amado-Filho G. M., Thompson F. L., Pereira-Filho G. H., et al. (2013). Dynamics of Coral Reef Benthic Assemblages of the Abrolhos Bank, Eastern Brazil: Inferences on Natural and Anthropogenic Drivers. PloS One 8, e54260. doi: 10.1371/journal.pone.0054260
Francini-Filho R. B., Moura R. L. (2008a). Dynamics of Fish Assemblages on Coral Reefs Subjected to Different Management Regimes in the Abrolhos Bank, Eastern Brazil. Aquat. Conserv. 18, 1166–1179. doi: 10.1002/aqc.966
Francini-Filho R. B., Moura R. L. (2008b). Evidence for Spillover of Reef Fishes From a No-Take Marine Reserve: An Evaluation Using the Before-After Control-Impact (BACI) Approach. Fish. Res. 93, 346–356. doi: 10.1016/j.fishres.2008.06.011
Francini-Filho R. B., Moura R. L., Thompson F. L., Reis R. M., Kaufman L., Kikuchi R. K. P., et al. (2008). Diseases Leading to Accelerated Decline of Reef Corals in the Largest South Atlantic Reef Complex (Abrolhos Bank, Eastern Brazil). Mar. Pollut. Bull. 56, 1008–1014. doi: 10.1016/j.marpolbul.2008.02.013
Freitas M. O. (2009). Pesca Artesanal E Biologia Reprodutiva do Ariocó Lutjanus Synagris (Lutjanidae) No Banco Dos Abrolhos (Ilhéus: Unpublished M.Sc. Dissertation. Universidade Estadual de Santa Cruz), 126p.
Freitas M. O., de Moura R. L., Francini-Filho R. B., Minte-Vera C. V. (2011). Spawning Patterns of Commercially Important Reef Fish (Lutjanidae and Serranidae) in the Tropical Western South Atlantic. Sci. Mar. 75, 135–146. doi: 10.3989/scimar.2011.75n1135
Freitas M. O., Previero M., Leite J. R., Francini-Filho R. B., Minte-Vera C. V., Moura R. L. (2019). Age, Growth, Reproduction and Management of Southwestern Atlantic’s Largest and Endangered Herbivorous Reef Fish, Scarus Trispinosus Valenciennes 1840. Peer J. 7, e7459. doi: 10.7717/peerj.7459
Friedlander A. M., Brown E. K., Jokiel P. L., Smith W. R., Rodgers K. S. (2003). Effects of Habitat, Wave Exposure, and Marine Protected Area Status on Coral Reef Fish Assemblages in the Hawaiian Archipelago. Coral Reefs 22, 291–305. doi: 10.1007/s00338-003-0317-2
Froese R., Pauly D. (2018) FishBase. Available at: www.fishbase.org (Accessed August 27, 2018).
Genner M. J., Sims D. W., Southward A. J., Budd G. C., Masterson P., Mchugh M., et al. (2010). Body Size-Dependent Responses of a Marine Fish Assemblage to Climate Change and Fishing Over a Century-Long Scale. Glob. Change Biol. 16, 517–527. doi: 10.1111/j.1365-2486.2009.02027.x
Gibran F. Z., de Moura R. L. (2012). The Structure of Rocky Reef Fish Assemblages Across a Nearshore to Coastal Islands’ Gradient in Southeastern Brazil. Neotrop. Ichthyol. 10, 369–382. doi: 10.1590/S1679-62252012005000013
Giglio V. J., Luiz O. J., Gerhardinger L. C. (2015). Depletion of Marine Megafauna and Shifting Baselines Among Artisanal Fishers in Eastern Brazil. Anim. Conserv. 18, 348–358. doi: 10.1111/acv.12178
Goetze J. S., Jupiter S. D., Langlois T. J., Wilson S. K., Harvey E. S., Bond T., et al. (2015). Diver Operated Video Most Accurately Detects the Impacts of Fishing Within Periodically Harvested Closures. J. Exp. Mar. Bio. Ecol. 462, 74–82. doi: 10.1016/j.jembe.2014.10.004
Goetze J. S., Wilson S., Radford B., Fisher R., Langlois T. J., Monk J., et al. (2021). Increased Connectivity and Depth Improve the Effectiveness of Marine Reserves. Glob. Change Biol. 27, 3432–3447. doi: 10.1111/gcb.15635
Gower J. C. (1971). A General Coefficient of Similarity and Some of its Properties. Biometrics 27, 857. doi: 10.2307/2528823
Graham N. A. J. (2014). Habitat Complexity: Coral Structural Loss Leads to Fisheries Declines. Curr. Biol. 24, R359–R361. doi: 10.1016/j.cub.2014.03.069
Graham N. A. J., Nash K. L. (2013). The Importance of Structural Complexity in Coral Reef Ecosystems. Coral Reefs 32, 315–326. doi: 10.1007/s00338-012-0984-y
Halpern B. S., Floeter S. R. (2008). Functional Diversity Responses to Changing Species Richness in Reef Fish Communities. Mar. Ecol. Prog. Ser. 364, 147–156. doi: 10.3354/meps07553
Halpern B. S., Lester S. E., Kellner J. B. (2009). Spillover From Marine Reserves and the Replenishment of Fished Stocks. Environ. Conserv. 36, 268–276. doi: 10.1017/S0376892910000032
Harasti D., Malcolm H., Gallen C., Coleman M. A., Jordan A., Knott N. A. (2015). Appropriate Set Times to Represent Patterns of Rocky Reef Fishes Using Baited Video. J. Exp. Mar. Bio. Ecol. 463, 173–180. doi: 10.1016/j.jembe.2014.12.003
Harasti D., Williams J., Mitchell E., Lindfield S., Jordan A. (2018). Increase in Relative Abundance and Size of Snapper Chrysophrys Auratus Within Partially-Protected and No-Take Areas in a Temperate Marine Protected Area. Front. Marine Sci. 5, 208. doi: 10.3389/fmars.2018.00208
Harvey E. S., McLean D. L., Goetze J. S., Saunders B. J., Langlois T. J., Monk J., et al. (2021). The BRUVs Workshop – An Australia-Wide Synthesis of Baited Remote Underwater Video Data to Answer Broad-Scale Ecological Questions About Fish, Sharks and Rays. Mar. Policy 127, 104430. doi: 10.1016/j.marpol.2021.104430
Harvey E., Shortis M. (1996). A System for Stereo-Video Measurement of Sub-Tidal Organisms. Mar. Technol. Soc J. 29, 10–22.
Harvey E. S., Shortis M. R. (1998). Calibration Stability of an Underwater Stereo-Video System: Implications for Measurement Accuracy and Precision. Mar. Technol. Soc J. 32, 3–17.
Hixon M. A., Menge B. A. (1991). Species Diversity: Prey Refuges Modify the Interactive Effects of Predation and Competition. Theor. Popul. Biol. 39, 178–200. doi: 10.1016/0040-5809(91)90035-E
Hoey A. S., Bellwood D. R. (2008). Cross-Shelf Variation in the Role of Parrotfishes on the Great Barrier Reef. Coral Reefs 27, 37–47. doi: 10.1007/s00338-007-0287-x
Hyrenbach K. D., David Hyrenbach K., Forney K. A., Dayton P. K. (2000). Marine Protected Areas and Ocean Basin Management. Aquat. Conserv. 10, 437–458. doi: 10.1002/1099-0755(200011/12)10:6<437::AID-AQC425>3.0.CO;2-Q
Jennings S., Kaiser M., Reynolds J. D. (2009). Marine Fisheries Ecology (Oxford, United Kingdom: John Wiley & Sons).
Komyakova V., Munday P. L., Jones G. P. (2013). Relative Importance of Coral Cover, Habitat Complexity and Diversity in Determining the Structure of Reef Fish Communities. PloS One 8, e83178. doi: 10.1371/journal.pone.0083178
Komyakova V., Jones G. P., Munday P. L. (2018). Strong Effects of Coral Species on the Diversity and Structure of Reef Fish Communities: A Multi-Scale Analysis. PloS One 13, e0202206. doi: 10.1371/journal.pone.0202206
Langlois T., Goetze J., Bond T., Monk J., Abesamis R. A., Asher J., et al. (2020). A Field and Video Annotation Guide for Baited Remote Underwater Stereo-Video Surveys of Demersal Fish Assemblages. Methods Ecol. Evol. 11, 1401–1409. doi: 10.1111/2041-210X.13470
Leão Z. M. A. N., Kikuchi R. K. P., Testa V. (2003). ““Corals and Coral Reefs of Brazil,”,” in Latin American Coral Reefs. Ed. Cortés J. (Amsterdam: Elsevier Science), 9–52.
Leenhardt P., Low N., Pascal N., Micheli F., Claudet J. (2015). “The Role of Marine Protected Areas in Providing Ecosystem Services,” in Aquatic Functional Biodiversity: An Ecological and Evolutionary Perspective. Eds. Belgrano A., Woodward G., Jacob U. (London, United Kingdom: Elsevier), 211–239.
Lester S., Halpern B., Grorud-Colvert K., Lubchenco J., Ruttenberg B., Gaines S., et al. (2009). Biological Effects Within No-Take Marine Reserves: A Global Synthesis. Mar. Ecol. Prog. Ser. 384, 33–46. doi: 10.3354/meps08029
Lin X., Zhang D. (1999). Inference in Generalized Additive Mixed Models by Using Smoothing Splines. J. R. Stat. Soc Ser. B Stat. Methodol. 61, 381–400. doi: 10.1111/1467-9868.00183
Lopes-da-Silva V. E., Dolbeth M., Fabré N. N. (2021). Assessing Tropical Coastal Dynamics Across Habitats and Seasons Through Different Dimensions of Fish Diversity. Mar. Environ. Res. 171, 105458. doi: 10.1016/j.marenvres.2021.105458
Macarthur R., Levins R. (1964). Competition, Habitat Selection, and Character Displacement in a Patchy Environment. Proc. Natl. Acad. Sci. U. S. A. 51, 1207–1210. doi: 10.1073/pnas.51.6.1207
MacNeil M. A., Chapman D. D., Heupel M., Simpfendorfer C. A., Heithaus M., Meekan M., et al. (2020). Global Status and Conservation Potential of Reef Sharks. Nature 583, 801–806. doi: 10.1038/s41586-020-2519-y
McClure E. C., Hoey A. S., Sievers K. T., Abesamis R. A., Russ G. R. (2021). Relative Influence of Environmental Factors and Fishing on Coral Reef Fish Assemblages. Conserv. Biol. 35, 976–990. doi: 10.1111/cobi.13636
Medeiros A. P. M., Ferreira B. P., Alvarado F., Betancur-R R., Soares M. O., Santos B. A. (2021). Deep Reefs are Not Refugium for Shallow-Water Fish Communities in the Southwestern Atlantic. Ecol. Evol. 11, 4413–4427. doi: 10.1002/ece3.7336
Messmer V., Jones G. P., Munday P. L., Holbrook S. J., Schmitt R. J., Brooks A. J. (2011). Habitat Biodiversity as a Determinant of Fish Community Structure on Coral Reefs. Ecology 92, 2285–2298. doi: 10.1890/11-0037.1
Micheli F., Halpern B. S. (2005). Low Functional Redundancy in Coastal Marine Assemblages. Ecol. Lett. 8, 391–400. doi: 10.1111/j.1461-0248.2005.00731.x
Microsoft-Corporation, Weston S. (2017) Doparallel: Foreach Parallel Adaptor for the “Parallel” Package. Available at: https://CRAN.R-project.org/package=doParallel.
Morais R. A., Ferreira C. E. L., Floeter S. R. (2017). Spatial Patterns of Fish Standing Biomass Across Brazilian Reefs. J. Fish Biol. 91, 1642–1667. doi: 10.1111/jfb.13482
Motta F. S., Moura R. L., Neves L. M., Souza G. R. S., Gibran F. Z., Francini C. L., et al. (2021). Effects of Marine Protected Areas Under Different Management Regimes in a Hot Spot of Biodiversity and Cumulative Impacts From SW Atlantic. Reg. Stud. Mar. Sci. 47, 101951. doi: 10.1016/j.rsma.2021.101951
Moura R. L. (2000). “Brazilian Reefs as Priority Areas for Biodiversity Conservation in the Atlantic Ocean,” in Proceeding of the 9th International Coral Reef Symposium. (Bali, Indonesia: International Coral Reef Society) pp 917–920.
Moura R. L., Francini-Filho R. B. (2005). “Reef and Shore Fishes of the Abrolhos Region, Brazil,” in A Rapid Marine Biodiversity Assessment of the Abrolhos Bank, Bahia, Brazil. Eds. Dutra G. F., Allen G. R., Werner T., McKenna S. A. (Washington, DC, USA: Conservation International), 40–55.
Moura R. L., Secchin N. A., Amado-Filho G. M., Francini-Filho R. B., Freitas M. O., Minte-Vera C. V., et al. (2013). Spatial Patterns of Benthic Megahabitats and Conservation Planning in the Abrolhos Bank. Cont. Shelf Res. 70, 109–117. doi: 10.1016/j.csr.2013.04.036
Myers R. A., Worm B. (2003). Rapid Worldwide Depletion of Predatory Fish Communities. Nature 423, 280–283. doi: 10.1038/nature01610
Naeem S., Duffy J. E., Zavaleta E. (2012). The Functions of Biological Diversity in an Age of Extinction. Science 336, 1401–1406. doi: 10.1126/science.1215855
Nyström M., Folke C. (2001). Spatial Resilience of Coral Reefs. Ecosystems 4, 406–417. doi: 10.1007/s10021-001-0019-y
Ohayon S., Granot I., Belmaker J. (2021). A Meta-Analysis Reveals Edge Effects Within Marine Protected Areas. Nat. Ecol. Evol. 5, 1301–1308. doi: 10.1038/s41559-021-01502-3
Pauly D., Zeller D., Palomares M. D. (2020) Sea Around Us Concepts, Design and Data. Available at: https://www.seaaroundus.org/.
Pinheiro H. T., Rocha L. A., Macieira R. M., Carvalho-Filho A., Anderson A. B., Bender M. G., et al. (2018). South-Western Atlantic Reef Fishes: Zoogeographical Patterns and Ecological Drivers Reveal a Secondary Biodiversity Centre in the Atlantic Ocean. Divers. Distrib. 24, 951–965. doi: 10.1111/ddi.12729
Pratchett M. S., Hoey A. S., Wilson S. K., Messmer V., Graham N. A. J. (2011). Changes in Biodiversity and Functioning of Reef Fish Assemblages Following Coral Bleaching and Coral Loss. Diversity 3, 424–452. doi: 10.3390/d3030424
Previero M. (2014). “The Fishing of Greenback Parrotfish (Scarus Trispinosus Valenciennes 1980),” in The Largest Coral Reefs of South Atlantic. Unpublished Ph.D. Thesis (Paraná, Brazil: Universidade Estadual de Maringá), 72p.
Previero M., Gasalla M. A. (2018). Mapping Fishing Grounds, Resource and Fleet Patterns to Enhance Management Units in Data-Poor Fisheries: The Case of Snappers and Groupers in the Abrolhos Bank Coral-Reefs (South Atlantic). Ocean Coast. Manage. 154, 83–95. doi: 10.1016/j.ocecoaman.2018.01.007
Priede I. G., Bagley P. M., Smith A., Creasey S., Merrett N. R. (1994). Scavenging Deep Demersal Fishes of the Porcupine Seabight, North-East Atlantic: Observations by Baited Camera, Trap and Trawl. J. Mar. Biol. Assoc. U. K. 74, 481–498. doi: 10.1017/S0025315400047615
Quimbayo J. P., Dias M. S., Kulbicki M., Mendes T. C., Lamb R. W., Johnson A. F., et al. (2018). Determinants of Reef Fish Assemblages in Tropical Oceanic Islands. Ecography 42, 77–87. doi: 10.1111/ecog.03506
Quimbayo J. P., Silva F. C., Mendes T. C., Ferrari D. S., Danielski S. L., Bender M. G., et al. (2021). Life-History Traits, Geographical Range, and Conservation Aspects of Reef Fishes From the Atlantic and Eastern Pacific. Ecology 102, e03298. doi: 10.1002/ecy.3298
Raymundo L. J., Halford A. R., Maypa A. P., Kerr A. M. (2009). Functionally Diverse Reef-Fish Communities Ameliorate Coral Disease. Proc. Natl. Acad. Sci. U. S. A. 106, 17067–17070. doi: 10.1073/pnas.0900365106
R Core Team (2020) R Language for Statistical Computing. R: A Language and Environment for Statistical Computing. Available at: https://www.R-project.org/ (Accessed March 8, 2020).
Rincón-Díaz M. P., Bovcon N. D., Cochia P. D., Góngora M. E., Galván D. E. (2021). Fish Functional Diversity as an Indicator of Resilience to Industrial Fishing in Patagonia Argentina. J. Fish Biol. 99, 1650–1667. doi: 10.1111/jfb.14873
Roberts C. M., Bustamante R. H., Dugan J., Ruckelshaus M., Warner R. R., Branch G., et al. (2003). Application of Ecological Criteria in Selecting Marine Reserves and Developing Reserve Networks. Ecol. Appl. 14, S215–S228. doi: 10.1890/1051-0761(2003)013[0215:AOECIS]2.0.CO;2
Rocha L. A. (2003). Patterns of Distribution and Processes of Speciation in Brazilian Reef Fishes. J. Biogeogr. 30, 1161–1171. doi: 10.1046/j.1365-2699.2003.00900.x
Rogers A., Blanchard J. L., Mumby P. J. (2014). Vulnerability of Coral Reef Fisheries to a Loss of Structural Complexity. Curr. Biol. 24, 1000–1005. doi: 10.1016/j.cub.2014.03.026
Rolim F. A., Langlois T., Rodrigues P. F. C., Bond T., Motta F. S., Neves L. M., et al. (2019). Network of Small No-Take Marine Reserves Reveals Greater Abundance and Body Size of Fisheries Target Species. PloS One 14, e0204970. doi: 10.1371/journal.pone.0204970
Roos N. C., Longo G. O., Pennino M. G., Francini-Filho R. B., Carvalho A. R. (2020). Protecting Nursery Areas Without Fisheries Management is Not Enough to Conserve the Most Endangered Parrotfish of the Atlantic Ocean. Sci. Rep. 10, 19143. doi: 10.1038/s41598-020-76207-x
Roos N. C., Pennino M. G., Carvalho A. R., Longo G. O. (2019). Drivers of Abundance and Biomass of Brazilian Parrotfishes. Mar. Ecol. Prog. Ser. 623, 117–130. doi: 10.3354/meps13005
Ruppert J. L. W., Fortin M.-J., Meekan M. G. (2016). The Ecological Role of Sharks on Coral Reefs: Response to Roff Et Al. Trends Ecol. Evolution. 8, 586–587. doi: 10.1016/j.tree.2016.05.003
Ruppert J. L. W., Travers M. J., Smith L. L., Fortin M.-J., Meekan M. G. (2013). Caught in the Middle: Combined Impacts of Shark Removal and Coral Loss on the Fish Communities of Coral Reefs. PloS One 8, e74648. doi: 10.1371/journal.pone.0074648
Russ G. R., Rizzari J. R., Abesamis R. A., Alcala A. C. (2021). Coral Cover a Stronger Driver of Reef Fish Trophic Biomass Than Fishing. Ecol. Appl. 31, e02224. doi: 10.1002/eap.2224
Sala E., Boudouresque C. F., Harmelin-Vivien M. (1998). Fishing, Trophic Cascades, and the Structure of Algal Assemblages: Evaluation of an Old But Untested Paradigm. Oikos 82, 425–439. doi: 10.2307/3546364
Schobernd Z. H., Bacheler N. M., Conn P. B. (2014). Examining the Utility of Alternative Video Monitoring Metrics for Indexing Reef Fish Abundance. Can. J. Fish. Aquat. Sci. 71, 464–471. doi: 10.1139/cjfas-2013-0086
Silva A. P. (2019). Brazilian Large-Scale Marine Protected Areas: Other “Paper Parks”? Ocean Coast. Manage. 169, 104–112. 10.1016/j.ocecoaman.2018.12.012
Siqueira A. C., Morais R. A., Bellwood D. R., Cowman P. F. (2021). Planktivores as Trophic Drivers of Global Coral Reef Fish Diversity Patterns. Proc. Natl. Acad. Sci. U. S. A. 118, e2019404118. doi: 10.1073/pnas.2019404118
Soares M. O., Rossi S., Gurgel A. R., Lucas C. C., Tavares T. C. L., Diniz B., et al. (2021). Impacts of a Changing Environment on Marginal Coral Reefs in the Tropical Southwestern Atlantic. Ocean Coast. Manage. 210, 105692. doi: 10.1016/j.ocecoaman.2021.105692
Teixeira C. D., Chiroque-Solano P. M., Ribeiro F. V., Carlos-Júnior L. A., Neves L. M., Salomon P. S., et al. (2021). Decadal, (2006-2018) Dynamics of Southwestern Atlantic’s Largest Turbid Zone Reefs. PloS One 16, e0247111. doi: 10.1371/journal.pone.0247111
Teixeira C. D., Leitão R. L. L., Ribeiro F. V., Moraes F., Moura R. L. (2019). Sustained Mass Coral Bleaching, (2016–2017) in Brazilian Turbid-Zone Reefs: Taxonomic, Cross-Shelf and Habitat-Related Trends. Coral Reefs 38, 801–813. doi: 10.1007/s00338-019-01789-6
Teixidó N., Gambi M. C., Parravacini V., Kroeker K., Micheli F., Villéger S., et al. (2018). Functional Biodiversity Loss Along Natural CO2 Gradients. Nat. Commun. 9, 5149. doi: 10.1038/s41467-018-07592-1
Tilman D. (2001). Functional Diversity. Encyclopedia Biodiversity 3, 109–120. doi: 10.1016/B0-12-226865-2/00132-2
Villéger S., Mason N. W. H., Mouillot D. (2008). New Multidimensional Functional Diversity Indices for a Multifaceted Framework in Functional Ecology. Ecology 89, 2290–2301. doi: 10.1890/07-1206.1
Waechter L. S., Luiz O. J., Leprieur F., Bender M. G. (2021). Functional Biogeography of Marine Vertebrates in Atlantic Ocean Reefs. Divers. Distrib 24, 1–14. doi: 10.1111/ddi.13430
Watson D. L., Anderson M. J., Kendrick G. A., Nardi K., Harvey E. S. (2009). Effects of Protection From Fishing on the Lengths of Targeted and Non-Targeted Fish Species at the Houtman Abrolhos Islands, Western Australia. Mar. Ecol. Prog. Ser. 384, 241–249. doi: 10.3354/meps08009
Watson D. L., Harvey E. S. (2007). Behaviour of Temperate and Sub-Tropical Reef Fishes Towards a Stationary SCUBA Diver. Mar. Freshw. Behav. Physiol. 40, 85–103. doi: 10.1080/10236240701393263
Watson D. L., Harvey E. S., Anderson M. J., Kendrick G. A. (2005). A Comparison of Temperate Reef Fish Assemblages Recorded by Three Underwater Stereo-Video Techniques. Mar. Biol. 148, 415–425. doi: 10.1007/s00227-005-0090-6
Whitmarsh S. K., Fairweather P. G., Huveneers C. (2017). What is Big BRUVver Up to? Methods and Uses of Baited Underwater Video. Rev. Fish Biol. Fish. 27, 53–73. doi: 10.1007/s11160-016-9450-1
Wickham H. (2016) Ggplot2: Elegant Graphics for Data Analysis. Available at: https://cran.r-project.org/web/packages/ggplot2/index.html (Accessed August 27, 2018).
Wickham H., François R., Henry L., Müller K. (2018)Dplyr: A Grammar of Data Manipulation (Accessed August 27, 2018).
Wilson S. K., Babcock R. C., Fisher R., Holmes T. H., Moore J. A. Y., Thomson D. P. (2012). Relative and Combined Effects of Habitat and Fishing on Reef Fish Communities Across a Limited Fishing Gradient at Ningaloo. Mar. Environ. Res. 81, 1–11. doi: 10.1016/j.marenvres.2012.08.002
Wilson S. K., Graham N. A. J., Polunin N. V. C. (2007). Appraisal of Visual Assessments of Habitat Complexity and Benthic Composition on Coral Reefs. Mar. Biol. 151, 1069–1076. doi: 10.1007/s00227-006-0538-3
Wood S. N. (2011). Fast Stable Restricted Maximum Likelihood and Marginal Likelihood Estimation of Semiparametric Generalized Linear Models. J. R. Stat. Soc. (B) 73, 3–36. doi: 10.1111/j.1467-9868.2010.00749.x
Wood S., Scheipl F. (2017) Gamm4: Generalized Additive Mixed Models Using “Mgcv” and “Lme4.” Available at: https://CRAN.R-project.org/package=gamm4 (Accessed August 27, 2018).
Keywords: marine protected area, MPA, stereo-BRUVs, South Atlantic, Chondrichthyes, Actinopterygii, reef ecology, reef fish
Citation: Rolim FA, Langlois T, Motta FS, Castro GM, Lester E, Abieri ML, Gadig OBF and Moura RL (2022) Habitat and Marine Reserve Status Drive Reef Fish Biomass and Functional Diversity in the Largest South Atlantic Coral Reef System (Abrolhos, Brazil). Front. Mar. Sci. 9:701244. doi: 10.3389/fmars.2022.701244
Received: 27 April 2021; Accepted: 12 April 2022;
Published: 19 May 2022.
Edited by:
Donald Behringer, University of Florida, United StatesReviewed by:
Pedro Henrique Pereira, Federal Institute of Pernambuco, BrazilChristian T. K.-H. Stadtlander, Independent researcher, Destin, Florida, United States
Nicolas Moity, Charles Darwin Foundation, Ecuador
Valeriya Komyakova, Norwegian Institute of Marine Research (IMR), Norway
Copyright © 2022 Rolim, Langlois, Motta, Castro, Lester, Abieri, Gadig and Moura. This is an open-access article distributed under the terms of the Creative Commons Attribution License (CC BY). The use, distribution or reproduction in other forums is permitted, provided the original author(s) and the copyright owner(s) are credited and that the original publication in this journal is cited, in accordance with accepted academic practice. No use, distribution or reproduction is permitted which does not comply with these terms.
*Correspondence: Fernanda Andreoli Rolim, ZmVybmFuZGFyb2xpbTJAZ21haWwuY29t
†These authors share last authorship