Abstract
Comparative patterns in thermal performance between populations have fundamental implications for a species thermal sensitivity to warming and extreme events. Despite this, within-species variation in thermal performance is seldom measured. Here we compare thermal performance both within-species and between-species, for two species of seagrass (Posidonia oceanica and Cymodocea nodosa) and two species of seaweed (Padina pavonica and Cystoseira compressa) across the Mediterranean Sea. Experimental populations from four locations representing between 75 and 99% of each species thermal distribution and a 6°C gradient in summer temperatures, were exposed to 10 temperature treatments between 15 and 36°C. Experimental thermal performance displayed the greatest variability between species, with optimal temperatures differing by over 10°C within the same location. Within-species differences in thermal performance were also important for P. oceanica which displayed large thermal safety margins within cool and warm-edge populations and small safety margins within central populations. Our findings suggest patterns of thermal performance in Mediterranean seagrasses and seaweeds retain deep “pre-Mediterranean” evolutionary legacies, suggesting marked differences in sensitivity to warming within and between benthic marine communities.
Introduction
Ocean warming is altering the distribution and abundance of species across the globe (Hoegh-Guldberg and Bruno, 2010). Benthic foundation species of seaweeds and seagrasses can be particularly sensitive to warm temperatures and have undergone extensive thermal stress, mortality and range contraction in recent decades (Marba and Duarte, 2010; Wernberg et al., 2016; Strydom et al., 2020). While many of these impacts have been concentrated in warm edge populations (Wernberg et al., 2016), cooler, central populations can also be highly sensitive to extirpation (Marba and Duarte, 2010; Bennett et al., 2015), highlighting that not all species or locations are equally susceptible to warming. The difference in temperature between an organism’s upper thermal limits and its upper environmental temperatures (herein, thermal safety margin), can vary considerably both within a species and between species due to differences in thermal physiology and through geographic differences in thermal regimes (Bennett et al., 2019). This variation presents a taxonomically and geographically diverse range of responses to warming and raises fundamental questions about the ecological and evolutionary drivers of thermal performance patterns.
Comparative measurements of thermal performance (e.g., metabolism, growth, motor function, survival) across a species range are critical to test established ecological theories about thermal sensitivity and identify potential hotspots or refuges from climate warming. For example, if individuals display similar thermal limits irrespective of range position, then thermal safety margins will decrease toward the warm edge of a species range, creating a gradient of increasing thermal sensitivity from cool to warm edge populations (Bennett et al., 2019). This is a common assumption used in many species distribution models, for example, that rely on the realised distribution of species to predict the likelihood of extirpation or range shifts under climate change (Araújo and Peterson, 2012; but see Martínez et al., 2014; Valladares et al., 2014). If, on the other hand, thermal limits differ between populations – through local adaptation or phenotypic plasticity – then thermal sensitivity may not reflect geography or remain constant across a species range (Bennett et al., 2015, 2021). Furthermore, maximum growth rates and physiological performance can be higher among populations that are adapted to warmer temperatures (e.g., hotter-is-better hypothesis), as rate depressing effects of cool temperatures on biochemical reactions are not overcome by phenotypic plasticity or genetic adaptation (Bennett, 1987; Knies et al., 2009). For the vast majority of species, within-species patterns of thermal sensitivity remain unknown, forcing climate change predictions to rely on measurements of thermal performance from a single location (Pinsky et al., 2019) or the realised thermal distribution of a species (Stuart-Smith et al., 2015). Understanding the variability in thermal performance between populations and verifying the extent to which thermal performance reflects local environmental conditions, realised species distributions, or other factors, is crucial to accurately predict climate change impacts and adaptively manage ecosystems in the Anthropocene.
The Mediterranean Sea presents a fascinating region to study within-species and between-species patterns in thermal performance and sensitivity. Seaweeds and seagrasses are the dominant habitat forming species throughout the region, where they harbour high biodiversity and provide essential ecosystem services (Bianchi et al., 2012). Many of the species that characterise rocky reefs (e.g., Padina pavonica) and seagrass meadows (e.g., Posidonia oceanica) in the Mediterranean Sea today, have deep evolutionary histories in the region dating back over 65 million years (Aires et al., 2011; Silberfeld et al., 2013). What’s more, these species have survived a remarkably dynamic climatic history, spanning from tropical origins during the Cretaceous, drying out of the basin during the Messinian salinity crisis (6 Mya; Hsü et al., 1977), to repeated glaciations during the Pleistocene (2.6–0.012 Mya). These upheavals have shaped the regions unique biodiversity to include species with tropical and boreal phylogeographic origins (Por, 2009; Bianchi et al., 2012). The Mediterranean Sea settled to its current climatic conditions approximately 2000 years ago (Bianchi et al., 2012), characterised by a steep 6°C climatic gradient from west to east. Despite their evolutionary resilience, seaweeds and seagrasses are susceptible to contemporary warming in the Mediterranean. Marine heatwaves, for example, have caused severe impacts to central populations of seagrass (P. oceanica;Diaz-Almela et al., 2009; Marba and Duarte, 2010), leading to predictions that the species will face functional extinction by 2100 (Jordà et al., 2012; Chefaoui et al., 2018). By comparing populations in a field translocation study, however, Bennett et al. (2021) found cool-edge and warm-edge populations demonstrated higher survivorship and growth than central populations in response to thermal stress, highlighting that performance does not necessarily reflect thermal geography and P. oceanica may have greater resilience to warming than previously recognised. The study by Bennett et al. (2021) does not, however, identify the upper thermal limits of cool- and warm-edge populations of P. oceanica, or whether such geographical differences in thermal sensitivity reflects a more general phenomenon among primary producers in the region.
In this study we compare the thermal performance of four pan-Mediterranean species of seagrasses and seaweed from four locations each, spanning 8° in latitude and 30° in longitude across the Mediterranean Sea. Specifically, we ask: (1) Do growth rates within a species differ between locations across a 6°C gradient in ocean temperatures? (2) Do species with similar realised thermal distributions display similar thermal optima and upper thermal limits? (3) How do experimentally derived thermal performance metrics for each population compare to (a) local environmental temperatures at each location and (b) the realised thermal distribution of species?
Our study examines how experimentally derived growth metrics of thermal performance reflect expectations of thermal sensitivity based on a species thermal geography. This work addresses underlying differences in thermal sensitivity predictions that arise from scaling issues in climate change ecology and contributes toward more nuanced, scalable links between geography and thermal physiology.
Materials and Methods
Field Collections
Thermal tolerance experiments were conducted on two seagrass species (P. oceanica and Cymodocea nodosa) and two brown seaweed species (Cystoseira compressa and P. pavonica) from four locations spanning 8° in latitude and 30° in longitude across the Mediterranean (Figure 1 and Supplementary Table 1). These four species were chosen as they are dominant foundation species and cosmopolitan across the Mediterranean Sea. Thermal performance experiments from Catalonia and Mallorca were conducted simultaneously in June 2016 for seaweeds (P. pavonica and C. compressa) and in August 2016 for seagrasses (P. oceanica and C. nodosa). Experiments for all four species were conducted in July 2017 for Crete and in September 2017 for Cyprus.
FIGURE 1
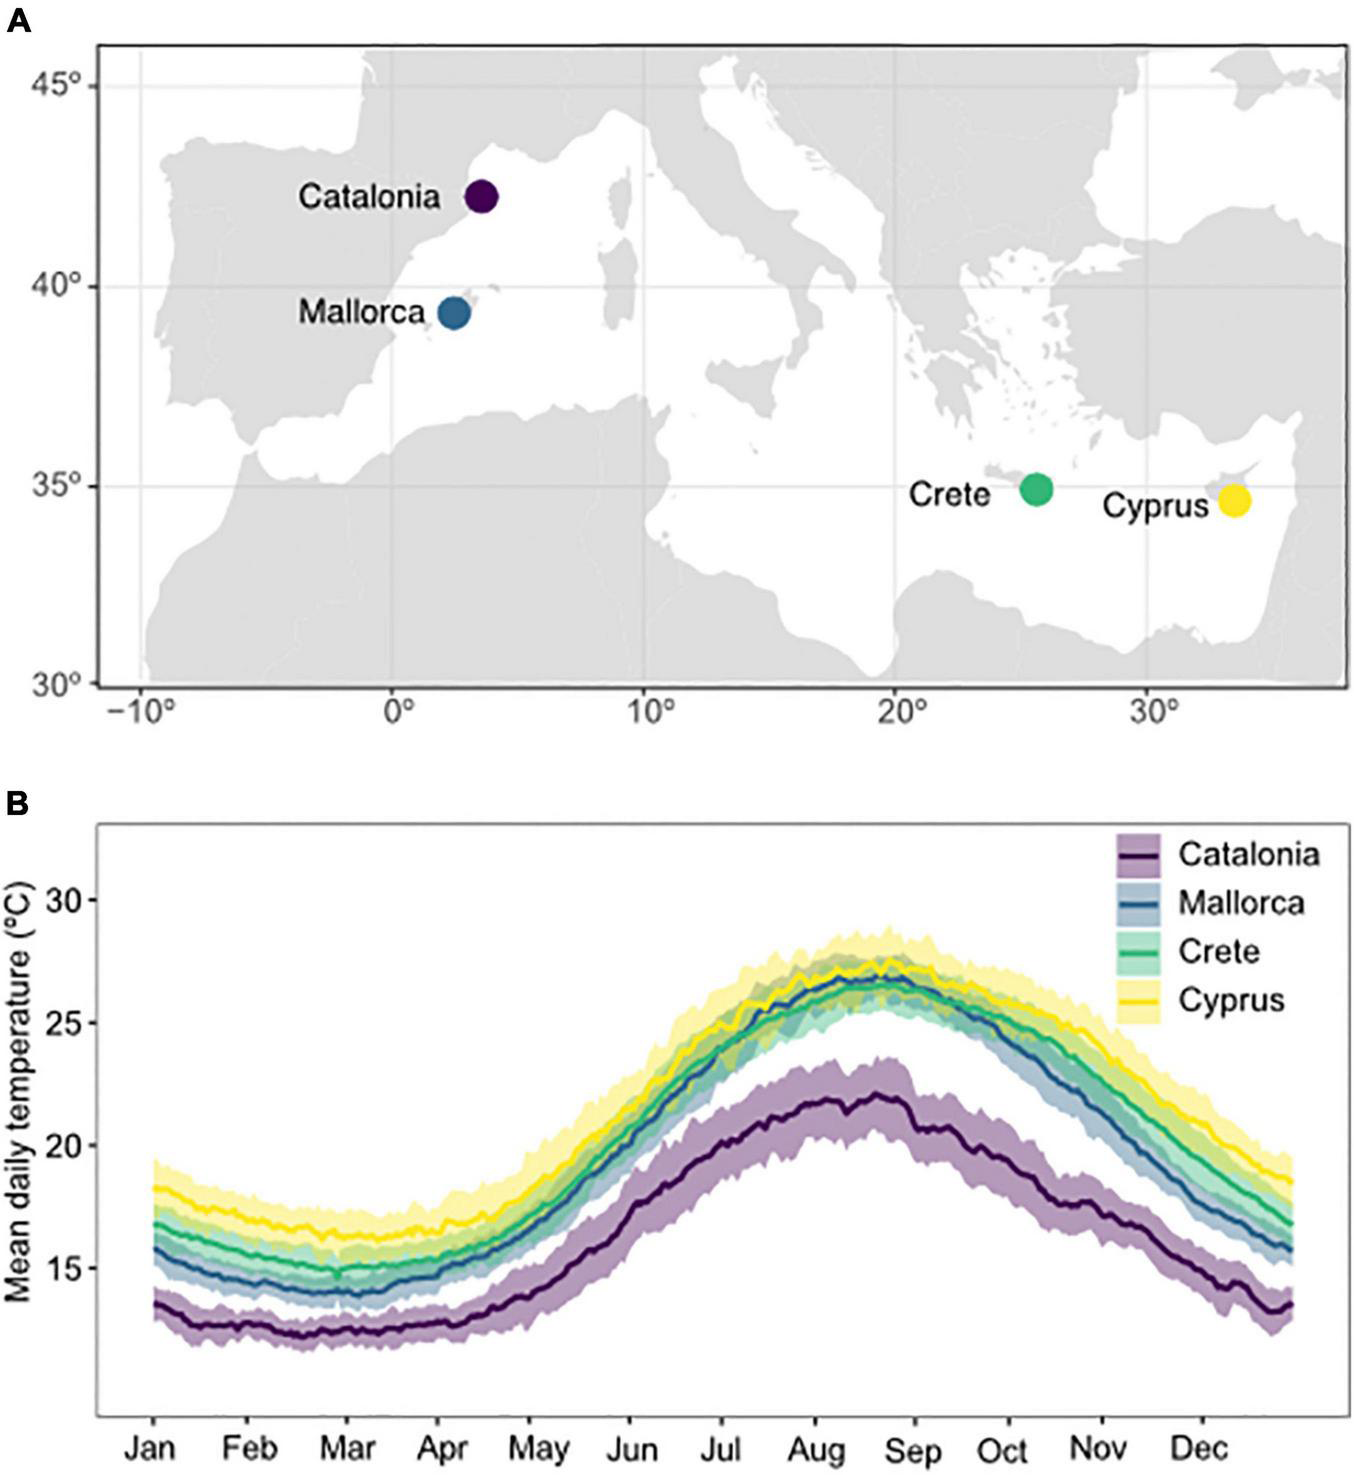
Map of experimental collection sites (A) and daily temperature profiles (B) in Catalonia, Mallorca, Crete, and Cyprus. Temperatures represent mean daily temperatures averaged over the period 1981–2019. Shaded areas represent the standard deviation in daily temperatures between years.
Sea Temperature Measurements and Reconstruction
Sea surface temperature data for each collection site were based on daily SST maps with a spatial resolution of 1/4°, obtained from the National Centers for Environmental Information (NCEI; Reynolds et al., 2007)1. These maps have been generated through the optimal interpolation of Advanced Very High Resolution Radiometer (AVHRR) data for the period 1981–2019. Underwater temperature loggers (ONSET Hobo pro v2 Data logger) were deployed at each site and recorded hourly temperatures throughout 1 year. In order to obtain an extended time series of temperature at each collection site, a calibration procedure was performed comparing logger data with sea surface temperature from the nearest point on SST maps. In particular, SST data were linearly fitted to logger data for the common period. Then, the calibration coefficients were applied to the whole SST time series to obtain corrected-SST data and reconstruct daily habitat temperatures from 1981 to 2019.
Species Description and Distribution
The species used in this study are all common species throughout the Mediterranean Sea, although differ in their biological traits, evolutionary histories and thermo-geographic affinities (Supplementary Figure 1). P. oceanica is endemic to the Mediterranean Sea with the all other Posidonia species found in temperate Australia (Aires et al., 2011). The distribution of P. oceanica is restricted to the Mediterranean, spanning from Gibraltar in the west to Cyprus in the east and north into the Aegean and Adriatic seas (Telesca et al., 2015; Supplementary Figure 1A).
Cymodocea nodosa distribution extends across the Mediterranean Sea and eastern Atlantic Ocean, where it is found from south west Portugal, down the African coast to Mauritania and west to Macaronesia (Alberto et al., 2008; Supplementary Figure 1B). Congeneric species of C. nodosa are found in tropical waters of the Red Sea and Indo-Pacific, suggesting origins in the region at least prior to the closure of the Suez Isthmus, approximately 10 Mya.
Like C. nodosa, Cystoseira compressa has a distribution that extends across the Mediterranean and into the eastern Atlantic, where it is found west to Macaronesia and south to northwest Africa (Supplementary Figure 1C). The genus Cystoseira has recently been reclassified to include just four species with all congeneric Cystoseira spp. having warm-temperate distributions from the Mediterranean to the eastern Atlantic (Orellana et al., 2019).
The distribution of Padina pavonica is conservatively considered to resemble C. nodosa and C. compressa, spanning throughout the Mediterranean and into the eastern Atlantic. We considered the poleward distribution limit of P. pavonica to be the British Isles 50°N (Herbert et al., 2016). P. pavonica was previously thought to have a global distribution, but molecular analysis of the genus has found no evidence to support this (Silberfeld et al., 2013). Instead it has been suggested that P. pavonica was potentially misclassified outside of the Mediterranean, due to morphological similarity with congeneric species (Silberfeld et al., 2013). Padina is a monophyletic genus with a worldwide distribution from tropical to cold temperate waters (Silberfeld et al., 2013). Most species have a regional distribution, with few confirmed examples of species spanning beyond a single marine realm (sensu Spalding et al., 2007).
Sample Collection
Sample collections were conducted at two sites, separated by approximately 1 km, within each location. Collections were conducted at the same depth (1–3 m) at each location and were spaced across the reef or meadow to try and minimise relatedness between shoots or fragments. Upon collection, fragments were placed into a mesh bag and transported back to holding tanks in cool, damp, dark conditions (following Bennett et al., 2021). Fragments were kept in aerated holding tanks in the collection sites at ambient seawater temperature and maintained under a 14:10 light-dark cycle until transport back to Mallorca, where experiments were performed. Prior to transport, P. oceanica shoots were clipped to 25 cm length (from meristem to tip), to standardise initial conditions and remove old tissue for transport. For transport back to Mallorca, fragments were packed in layers within cool-boxes. Cool-packs were wrapped in damp tea towels (rinsed in seawater) and placed between layers of samples. Samples from Catalonia, Crete, and Cyprus experienced approximately 12 h of transit time. On arrival at the destination, samples were returned to holding tanks with aerated seawater and a 14:10 light-dark cycle.
Experimental Design: Thermal Performance Experiments
All experiments were run in climate-controlled incubation facilities of the Institut Mediterrani d’Estudis Avançats (Mallorca, Spain). Following 48 h under ambient (collection site) conditions, samples were transferred to individual experimental aquaria, which consisted of a double layered transparent plastic bag filled with 2 L of filtered seawater (60 μm) (following Savva et al., 2018). Sixteen experimental bags were suspended within 80 L temperature-controlled baths. In total, ten baths were used, one for each experimental temperature treatment. Bath temperatures were initially set to the acclimatization temperature (i.e., in situ temperatures) and were subsequently increased or decreased by 1°C every 24 h until the desired experimental temperature was achieved. Experimental temperatures were: 15, 18, 21, 24, 26, 28, 30, 32, 34, and 36°C (Supplementary Table 2). For each species, four replicate aquarium bags were used for each temperature treatment with three individually marked seagrass shoots or three algal fragments placed into each bag. For P. oceanica, each marked plant was a single shoot including leaves, vertical rhizome and roots. For C. nodosa, each marked individual consisted of a 10 cm fragment of horizontal rhizome containing three vertical shoots. Individually marked seaweeds contained the holdfast, and 4–5 fronds of P. pavonica (0.98 ± 0.06 g FW; mean ± SE) or a standardised 5–8 cm fragment with meristematic tip for C. compressa (3.67 ± 0.1 g FW; mean ± SE). Experimental plants were cleaned of conspicuous epiphytes. Once the targeted temperatures were reached in all of the baths, experiments ran for 14 days for the algal species and 21 days for seagrasses to allow for measurable growth in all species at the end of the experiment. Experiments were conducted inside a temperature-controlled chamber at constant humidity and air temperature (15°C). Bags were arranged in a 4 × 4 grid within each bath, enabling four species/population treatments to be run simultaneously. Bags were mixed within each bath so that one replicate bag was in each row and column of the grid, to minimise any potential within bath effects of bag position. Replicate bags were suspended with their surface kept open to allow gas exchange and were illuminated with a 14 h light:10 h dark photoperiod through fluorescent aquarium growth lamps. The water within the bags were mixed with aquaria pumps. The light intensity within each bag was measured via a photometric bulb sensor (LI-COR) and ranged between 180 and 258 μmol m–2 s–1. Light intensity was constant between experiments and did not significantly differ between experimental treatments (p > 0.05). The temperature in the baths was controlled and recorded with an IKS-AQUASTAR system, which was connected to heaters and thermometers. The seawater within the bags was renewed every 72 h and salinity was monitored daily with an YSI multi-parameter meter. Distilled water was added when necessary to ensure salinity levels remained within the range of 36–39 PSU, typical of the study region. Carbon and Nitrogen concentrations in the leaf tissue were measured at the end of the experiment for triplicates of the 24°C treatment for each species and location (Supplementary Figure 2) at Unidade de Técnicas Instrumentais de Análise (University of A Coruña, Spain) with an elemental analyser FlashEA 112 (Thermo Finnigan).
Growth Measurements and Statistical Analyses
Net growth rate of seagrass shoots was measured using leaf piercing-technique (Short and Duarte, 2001). At the beginning of the experiment seagrass shoots were pierced just below the ligule with a syringe needle and shoot growth rate was estimated as the elongation of leaf tissue in between the ligule and the mark position of all leaves in a shoot at the end of the experiment, divided by the experimental duration. Net growth rate of macroalgae individuals was measured as the difference in wet weight at the end of the experiment from the beginning of the experiment divided by the duration of the experiment. Moisture on macroalgae specimens was carefully removed before weighing them. Patterns of growth in response to temperature were examined for each experimental population using a Gaussian function:
g=ke[−0.5(TMA−μ)2/σ2], where k = amplitude, μ = mean, and σ = standard deviation of the curve. Best fit values for each parameter were determined using a non-linear least squares regression using the “nlstools” package (Baty et al., 2015) in R (R Core Team, 2020). 95% CI for each of the parameters were calculated using non-parametric bootstrapping of the mean centred residuals. The relationship between growth metrics and the best-fit model was determined by comparing the sum of squared deviations (SS) of the observed data from the model, to the SS of 104 randomly resampled datasets. Growth metrics were considered to display a significant relationship to the best-fit model if the observed SS was smaller than the 5th percentile of randomised SS. Upper thermal limits were defined as the optimal temperature + 2 standard deviations (95th percentile of curve) or where net growth = 0. Samples that had lost all pigment or structural integrity by the end of the experiment were considered dead and any positive growth was treated as zero.
Metabolic Rates
Net production (NP), gross primary production (GPP), and respiration (R) were measured for all species from the four sites for five different experimental temperatures containing the in situ temperature during sampling up to a 6°C warming (see Supplementary Table 3 for details). Individuals of the different species were moved to methacrylate cylinders containing seawater treated with UV radiation to remove bacteria and phytoplankton, in incubation tanks at the five selected temperatures. Cylinders were closed using gas-tight lids that prevent gas exchange with the atmosphere, containing an optical dissolved oxygen sensor (ODOS® IKS), with a measuring range from 0 to 200% saturation and accuracy at 25°C of 1% saturation, and magnetic stirrers inserted to ensure mixing along the height of the core. Triplicates were measured for each species and location, along with controls consisting in cylinders filled with the UV-treated seawater, in order to account for any residual production or respiration derived from microorganisms (changes in oxygen in controls was subtracted from treatments). Oxygen was measured continuously and recorded every 15 min for 24 h.
Changes in the dissolved oxygen (DO) were assumed to result from the biological metabolic processes and represent NP. During the night, changes in DO are assumed to be driven by R, as in the absence of light, no photosynthetic production can occur. R was calculated from the rate of change in oxygen at night, from half an hour after lights went off to half an hour before light went on (NP in darkness equalled R). NP was calculated from the rate of change in DO, at 15 min intervals, accumulated over each 24 h period. Assuming that daytime R equals that during the night, GPP was estimated as the sum of NP and R. To derive daily metabolic rates, we accumulated individual estimates of GPP, NP, and R resolved at 15 min intervals over each 24 h period during experiments and reported them in mmol O2 m–3 day–1. A detailed description of calculation of metabolic rates can be found at Vaquer-Sunyer et al. (2015).
Thermal Distribution and Thermal Safety Margins
We estimated the realised thermal distribution for the four experimental species by downloading occurrence records from the Global Biodiversity Information Facility [GBIF.org (11/03/2020) GBIF Occurrence Download]. Occurrence records from GBIF were screened for outliers and distributions were verified from the primary literature (Alberto et al., 2008; Draisma et al., 2010; Win et al., 2010; Silberfeld et al., 2013; Telesca et al., 2015; Orellana et al., 2019) and Enrique Ballesteros (pers. comms.) (Supplementary Figure 1). Mean, 1st and 99th percentiles of daily SST’s were downloaded for each occurrence site for the period between 1981 and 2019 using the SST products described above (Supplementary Table 4). Thermal range position of species at each experimental site were standardised by their global distribution using a Range Index (RI; Sagarin and Gaines, 2002). Median SST at the experimental collection sites were standardized relative to the thermal range observed across a species realized distribution, using the equation: RI = 2 (SM−DM)/DB where SM = the median temperature at the experimental collection site, DM = the thermal midpoint of the species global thermal distribution, and DB = range of median temperatures (°C) that a species experiences across its distribution. The RI scales from −1 to 1, whereby “−1” represents the cool, leading edge of a species distribution, “0” represents the thermal midpoint of a species distribution and “1” represents the warm, trailing edge of a species distribution (Sagarin and Gaines, 2002). Thermal safety margins for each population were calculated as the difference between empirically derived upper thermal limits for each population and the maximum long term habitat temperatures recorded at collection sites. Each population’s thermal safety margin was plotted against its range position to examine patterns in thermal sensitivity across a species distribution.
Results
Thermal Profiles of Experimental Sites and Global Distribution
Annual temperatures at experimental sites ranged from 10.8 ± 0.1°C to 24.4 ± 0.18°C (mean ± SE, averaged from 1981 to 2019) in Catalonia, 13.15 ± 0.12°C to 27.79 ± 0.14°C in Mallorca, 13.91 ± 0.14°C to 27.52 ± 0.16°C in Crete, and 14.0 ± 0.18°C to 29.17 ± 0.15°C in Cyprus (Figure 1 and Supplementary Table 1). Combining all experimental sites, this represents the 1st – 99th percentile of the global thermal distribution of P. oceanica, 12th – 96th percentile for C. nodosa, 20th – 97th percentile for C. compressa, and 12th – 99th percentile of the global thermal distribution for P. pavonica.
Thermal Performance: Growth
Optimal and critical upper temperature limits of Mediterranean macrophytes varied both between populations and species (Figure 2). Overall, 11/15 experimental populations displayed significant normal growth distributions in response to temperature. Of these, 10/11 significant distributions were recorded in experiments from Catalonia, Mallorca and Crete, whereas experimental populations from Cyprus displayed variable growth responses to temperature (Figure 2 and Supplementary Table 5). For P. oceanica, optimal growth temperatures were recorded at 19 ± 1°C for Catalonia and 20 ± 0.7°C for Mallorca and Crete, while upper limits were recorded at 30°C for Catalonia, Mallorca, and Crete. Growth patterns in Cyprus samples displayed a non-significant relationship with temperature when all data was included. By removing 28 and 32°C outliers, the growth relationship with temperature improved (p = 0.055) and was characterised by a 27 ± 13°C optimal temperature (Figure 2 and Supplementary Table 5). P. oceanica from Cyprus also recorded the highest growth rates of any location during the experiments, averaging 0.2–0.4 cm day–1 including in the warmest treatments 30–36°C.
FIGURE 2
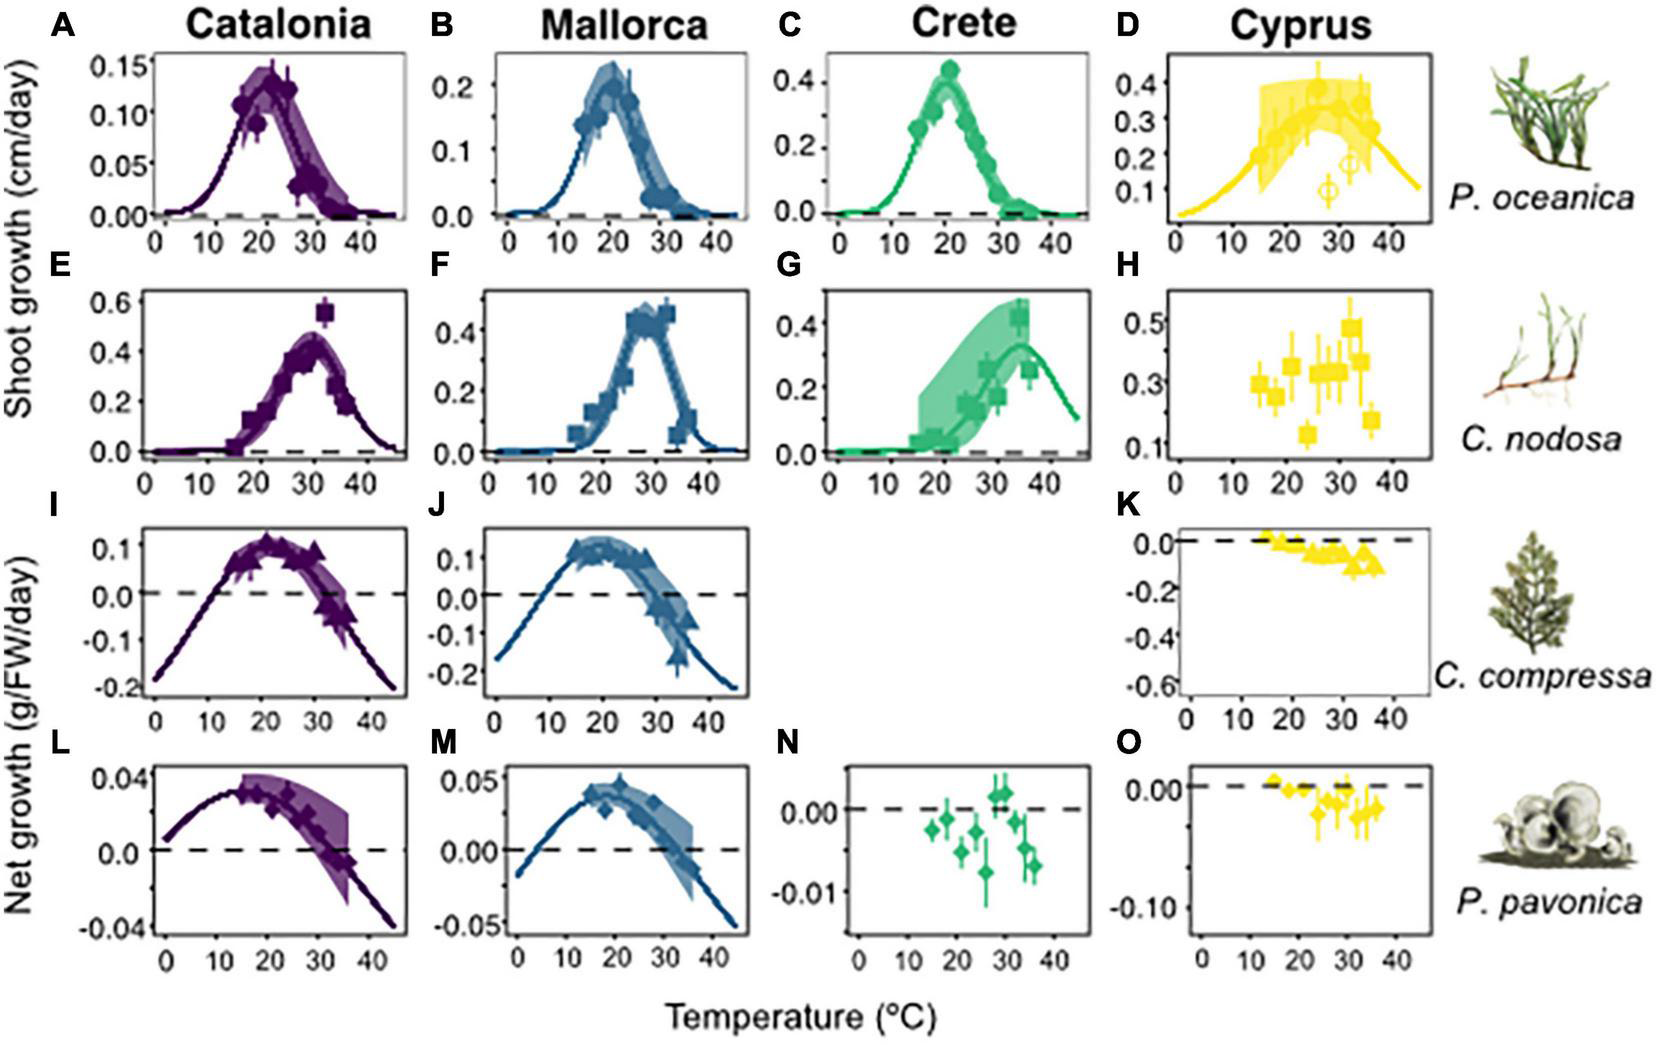
Growth rates of experimental populations from Catalonia, Mallorca, Crete, and Cyprus, in response to temperatures from 15 to 36°C. Rows represent Posidonia oceanica (circles), Cymodocea nodosa (squares), Cystoseira compressa (triangles), and Padina pavonica (diamonds), respectively. Species illustrations and names displayed at end of each row columns represent Catalonia (purple), Mallorca (blue), Crete (green), and Cyprus (yellow). Line of best fit for P. oceanica from Cyprus, displays model without 28 and 32°C outliers. C. compressa from Crete was removed from the analysis due to poor condition of the plants at the commencement of the experiment. Shaded envelopes show 95% confidence intervals.
Cymodocea nodosa recorded higher optimal and lethal temperature limits than P. oceanica in all locations, except Cyprus. Optimal growth temperatures were 29 ± 0.5°C, 28 ± 0.4°C, and 34 ± 5°C in Catalonia, Mallorca, and Crete, respectively (Figures 2E–G). Critical upper limits were estimated at 41, 37.5, and 48°C for Catalonia, Mallorca, and Crete, respectively, based on best-fit growth models. C. nodosa in Cyprus displayed a non-significant growth relationship with temperature, despite recording relatively high growth rates across all temperature treatments. C. compressa and P. pavonica displayed wider growth curves than P. oceanica and C. nodosa. Optimal growth temperatures were 21 ± 1°C and 19 ± 1.5°C for C. compressa and 15.5 ± 0.5°C and 18 ± 0.4°C for P. pavonica, in Catalonia and Mallorca, respectively. Upper thermal limits for C. compressa and P. pavonica were recorded at 32°C in Catalonia, and 30°C for C. compressa and 32°C for P. pavonica in Mallorca. Growth curves for C. compressa and P. pavonica in Crete and Cyprus were non-significant (Supplementary Table 5).
Metabolic Rates
At the population level, patterns in gross primary productivity (GPP) and respiration (R) were relatively flat or variable for 8/15 and 11/15 populations, respectively, meaning that a peak in metabolic rates could not be defined. Among the populations where maximum GPP could be defined, temperatures ranged between 28 ± 4°C for Mallorca and Cyprus populations of C. nodosa and C. compressa and 32 ± 8°C for Crete and Cyprus populations of P. pavonica (Supplementary Figure 3 and Supplementary Table 6). Metabolic rates were primarily heterotrophic (i.e., GPP < R) across temperatures in the upper portion of each populations thermal range. NP significantly decreased with increasing temperature for all species except C. nodosa when populations were pooled together (Supplementary Figure 4). C. compressa reduced its NP by 4.72 ± 1.65 μmol O2/ g FW per Celsius degree (R2 = 0.13, p < 0.007), P. pavonica reduced NP by 3.33 ± 0.84 μmol O2/ g FW per Celsius degree (R2 = 0.23, p < 0.001), and P. oceanica reduced NP by 0.58 ± 0.14 μmol O2/ g FW per Celsius degree (R2 = 0.26, p < 0.001). The temperature at which NP became negative, changing from net autotrophy to net heterotrophy was 22.2 ± 0.4°C for P. oceanica, 23.7 ± 0.5°C for C. compressa, and 26.2 ± 0.4°C for P. pavonica.
Patterns in Thermal Safety Margins Across Species Range
Thermal safety margins between experimental upper thermal limits and maximum temperatures at collection sites declined from cooler to warmer sites in accordance with expectation of thermal niche conservatism in 7 out of 12 populations (Figure 3). Consistent upper thermal limits for P. oceanica in Catalonia, Mallorca, and Crete, for example, resulted in declining thermal safety margins from 6.5 to 2.4°C from cooler to warmer locations and on average, 1 ± 0.16°C above the maximum realised habitat temperatures for the species. P. oceanica in Cyprus was a notable exception to this pattern, whereby thermal safety margins were >6°C as a result of higher thermal tolerance at the warm range edge. Thermal safety margins of C. nodosa varied between 16.8°C in the cooler Catalonia population, to 9.7 and 20.6°C in warmer Mallorca and Crete populations, respectively. All locations displayed larger thermal safety margins than predicted based on the realised thermal distribution of the species (Figure 3). Similar thermal limits in C. compressa and P. pavonica populations in both Catalonia and Mallorca, resulted in declining thermal safety margins from 7 to 2°C in the cooler and warmer location, respectively. Upper thermal limits were 1.9°C higher than the maximum realised habitat temperatures for C. compressa and 2.1°C higher than the maximum realised temperatures across P. pavonica’s range. No experimental populations displayed upper thermal limits lower than the corresponding species distribution limit.
FIGURE 3
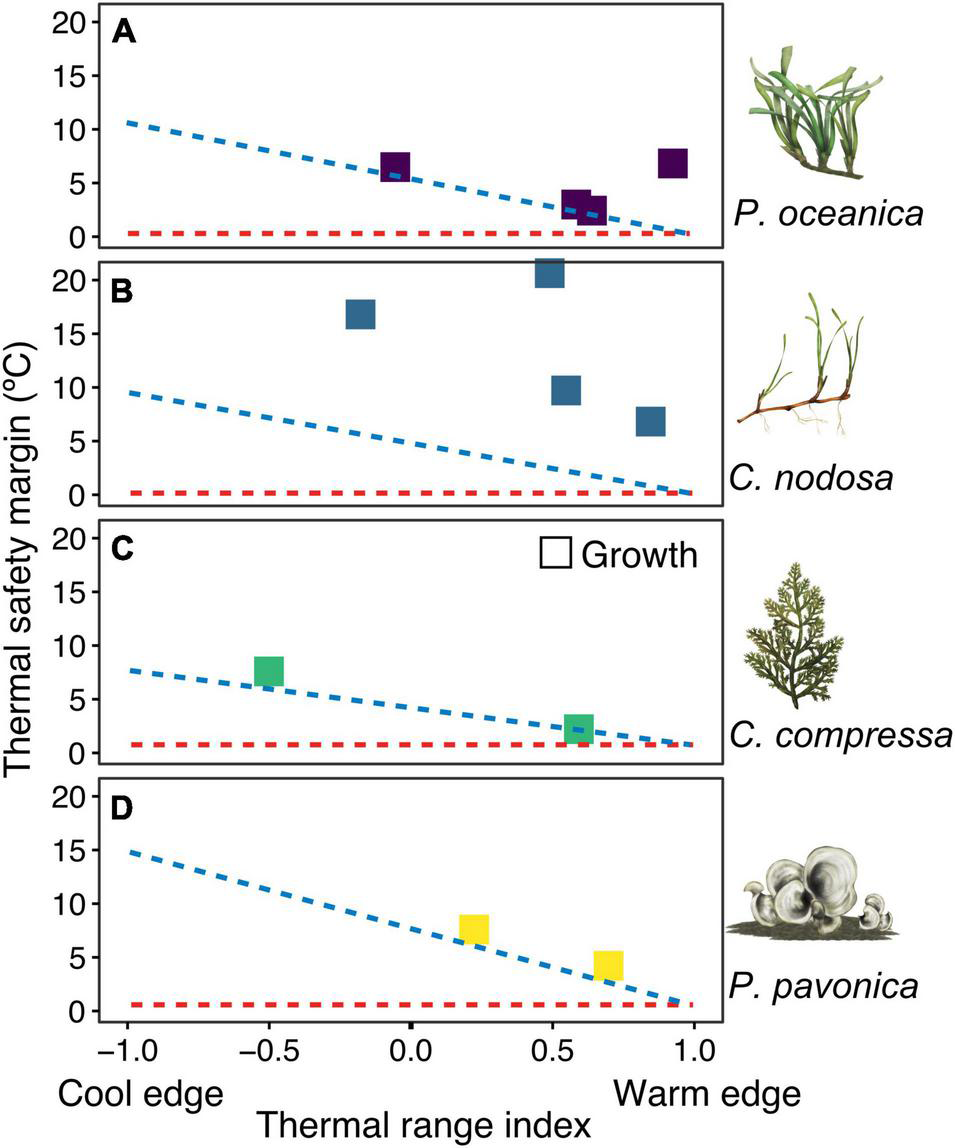
Thermal safety margins (TSM) of experimental populations in relation to the range position. Panels (A–D) represent the four species. Each species name and illustration is displayed next to corresponding panel. TSMs represent the difference between experimental upper thermal limits and maximum temperatures at the collection site. Thermal range index illustrates where the maximum habitat temperatures lie in relation to the range of maximum temperatures observed across a species thermal distribution. The blue diagonal line represents expected TSM if a species fundamental (i.e., experimental) and realised thermal distribution limits were the same. The red horizontal line illustrates the TSM if fundamental thermal limits and maximum local temperatures were the same (TSM = 0). TSM estimates are based on growth rates. Upper thermal limit estimates for P. oceanica and C. nodosa in Cyprus are conservatively considered here to be 36°C, based on observed growth and survival rates in experiments.
Discussion
Quantifying spatial and taxonomic variability in thermal performance is critically important to identify potential hotspots and refuges from thermal stress in response to climate change. Here we quantified the thermal performance of four dominant habitat forming species of seaweed and seagrass, from four locations across the Mediterranean Sea. We found major differences in thermal performance between species as well as subtle, albeit important differences between populations within species. Most notably, thermal optima and upper limits in the seagrass C. nodosa, were over 10°C higher than the seagrass P. oceanica, highlighting potential differences in response to warming between species. One exception to this finding was the high thermal tolerance of P. oceanica in Cyprus. Cyprus represents the warm distribution edge of P. oceanica and experimental plants displayed high upper thermal limits resulting in larger thermal safety margin than cooler locations. Observed differences in thermal performance between species and within species provide important context about the potential vulnerability of benthic marine ecosystems to warming and contributes to a general understanding about the underlying drivers of thermal sensitivity.
Major differences in thermal performance between species was the standout finding from this study. This finding is significant, because of the close similarities these species share in their realised thermal distributions. Realised thermal limits are a commonly used metric of thermal sensitivity (Araújo and Peterson, 2012). Yet, despite all species having realised upper thermal limits between 29 and 30°C, under experimental conditions thermal limits ranged from 30°C in P. oceanica to over 40°C in C. nodosa. Interestingly, these differences in experimental thermal performance were broadly consistent with the contrasting genus-level thermal distributions of Posidonia and Cymodocea. Posidonia and Cymodocea both have Indo-Pacific distributions outside of the Mediterranean, reflecting the historical connection between the Mediterranean and Indian Ocean prior to the closure of Suez Isthmus, approximately 10 Mya. The contemporary distribution of Posidonia genus is bi-temperate, with all other Posidonia species found in temperate Australia, following their separation around 65 Mya (Aires et al., 2011). By contrast, with the exception of C. nodosa, all congeneric species of Cymodocea, have a tropical distribution throughout the Indo-Pacific (Short et al., 2007). Previous experiments on congeneric species found that Cymodocea serrulata displayed severe loss of biomass at temperatures >40°C (George et al., 2018), consistent with estimated upper limits of C. nodosa in the current study. We are not aware of comparable thermal performance experiments on congeneric Posidonia spp. However, following an extreme marine heatwave in 2011, warm-edge populations of Phragmites australis were tolerant of temperatures up to 29°C (Strydom et al., 2020), 3.8°C above the long term average (Fraser et al., 2014). The experimental thermal performance of P. pavonica was also consistent with the distribution of Padina spp. globally. Padina spp. is distributed globally, from the equator to cool-temperate regions (Silberfeld et al., 2013). The broad thermal distribution of Padina spp (−1.8 to 31°C), parallels with the broad thermal niche breadth of P. pavonica observed in experiments, relative to other species. Contrasting patterns in the global thermal distribution of congeneric species parallel the differences in the thermal limits of Mediterranean species, suggesting that these differences may reflect deep evolutionary differences in thermal affinity between species.
The differences in thermal tolerance between species is also remarkable given the shared selection pressures that have acted on these species. Following the final closure of the Suez Isthmus, the Mediterranean Sea underwent repeated climatic disturbances that fundamentally affected biodiversity in the basin (Taviani, 2002; Por, 2009). At the beginning of the Pleistocene (2.6 Mya) the Mediterranean Sea underwent rapid cooling, leading to mass extinction of much of its tropical-affiliated biota (Bianchi et al., 2012). Glacial and interglacial periods then resulted in alternating waves of cool-affiliated and tropical species colonizing the Mediterranean from the Atlantic, only to become extinct or have their distribution restricted during the subsequent cool or warm cycle (e.g., Sparisoma cretense). Despite these profound climatic disturbances, P. oceanica, C. nodosa, C. compressa, and P. pavonica remain dominant throughout the Mediterranean, suggesting a high degree of plasticity in all four species. Moreover, differences in thermal tolerance between species persist despite strong thermal selection pressures over several million years.
While species-level differences in thermal performance were most conspicuous, more subtle differences in thermal performance were also observable between some populations. Most notably was the thermal performance of P. oceanica in Cyprus, which displayed the highest growth rates of any populations and did not display a decline in growth at higher temperatures as observed in other populations. This finding contrasts with the prevailing paradigm that thermal sensitivity will be highest in warm edge populations. Warm edge populations, face the highest habitat temperatures of any population across a species range by definition, which if thermal limits are conserved between populations, mean they also have the highest sensitivity to warming. Instead the high growth rates and high thermal tolerance of P. oceanica within warm edge populations was consistent with the “hotter-is-better” hypothesis of thermal adaptation (Knies et al., 2009). The short-term nature of these experiments limits interpretation of the specific role of phenotypic plasticity or genetic adaptation in driving these results. Nevertheless, our findings indicate a u-shaped pattern in thermal safety margins, with central populations living closest to their upper thermal limit and cool and warm range edge displaying the highest thermal safety margins.
This finding provides context for the paradigm that P. oceanica is highly sensitive to warming (Marba and Duarte, 2010; Jordà et al., 2012) and supports the emerging idea that edge populations of P. oceanica may provide a hope-spot for P. oceanica in response to climate change (Bennett et al., 2021). The idea of high thermal sensitivity in P. oceanica emerged through studies conducted in the western Mediterranean, specifically Mallorca, where temperatures above 28°C have driven severe declines in shoot density of P. oceanica (Diaz-Almela et al., 2009; Marba and Duarte, 2010). Our findings support this previous work insofar as thermal limits of P. oceanica in Mallorca were estimated to be 30°C, very close to the maximum temperatures that previously led to population declines. However, our findings also help to explain how P. oceanica can thrive at its warm distribution limit in Cyprus where average daily summer temperatures are already 29°C and peak daily summer temperatures frequently exceed 30°C.
For metabolic rates, increasing temperatures resulted in a reduction of net production in all species except for C. nodosa. A decrease of NP with temperature suggests that warming could result in a change to heterotrophic metabolism. A net reduction of NP owing to a steeper increase in respiration rates than in gross primary production has been predicted by the Metabolic Theory of Ecology (Brown et al., 2004) owing to the fact that activation energies for autotrophs are half that of heterotrophs (Harris et al., 2006; Sarmento et al., 2010). Previous studies have shown a higher increase of respiration than primary production for planktonic communities in response to warming (Müren et al., 2005; Harris et al., 2006; Sarmento et al., 2010; Vaquer-Sunyer et al., 2010; Yvon-Durocher et al., 2010; Regaudie-de-Gioux and Duarte, 2012), whereas for benthic-dominated communities this prediction has been questioned (Vaquer-Sunyer and Duarte, 2013). Our results demonstrate that macrophyte species can also increase their respiration rates faster than primary production with warming, resulting in heterotrophic metabolic rates at high temperatures.
Finally, experimental artefacts need to be considered in relation to the variable thermal performance results. Thermal performance under experimental conditions is contingent on the experimental conditions (e.g., light intensity, nutrient levels of seawater), acclimation rates and seasonality, among other factors (Bates and Morley, 2020). As such, thermal performance measured under experimental conditions needs to be considered as a relative, not absolute estimate of the ecological reality that might occur in a natural ecosystem. For example, light conditions were kept constant during daylight hours under experimental conditions, but fluctuate under natural conditions due to shading, weather conditions, water clarity and latitude – all of which can influence growth rates. While experimental conditions were simplifications of natural conditions, standardised methodologies of collection, transportation, acclimation, and experimentation minimised methodological variation and enabled comparability in thermal performance results between experiments.
Seasonal timing was one potential source of variation that may have influenced results of experiments. While all experiments took place around summer, timing of experiments ranged between June and September. For seaweeds, poor condition of C. compressa from Crete at the time of collection (July) was likely due to seasonal senescence and resulted in it being removed from the analysis. For P. oceanica, it is unlikely that seasonality was responsible for the poor growth relationship to temperature in Cyprus. Growth rates of P. oceanica from Cyprus were the highest recorded in any experiments, suggesting that the poor growth relationship was not an artefact of poor performance. Performance of seagrasses may, however, have been influenced by experimental conditions as a result of their clonal growth physiology. Seagrasses are clonal plants connected by rhizomes and are dependent on the connectivity between ramets for nutrient translocation (Marbà et al., 2002). Growth rates observed in the current experiment were lower than growth rates reported for natural meadows from the same populations, but were similar to growth rates observed in a field translocation study, where fragments were transplanted into natural substrate adjacent to meadows (Bennett et al., 2021). These patterns suggest that seagrasses are less suited to growing in fragments under experimental conditions than seaweeds which source their nutrients from the water column.
Our findings reveal the thermal performance of four dominant habitat forming species across their geographical range in the Mediterranean Sea. Between species differences in optimal and upper thermal limits were pronounced despite all species sharing similar geographical distributions. Within species thermal performance was relatively conserved between populations across a 6°C climate gradient in the Mediterranean, with the clear exception of P. oceanica at its warm range edge. Our findings highlight nuanced inter and intra-specific patterns in thermal performance that would be overlooked through a reliance on realised distributions or measurements from a single population. Contemporary patterns in thermal performance for Mediterranean macrophytes potentially reflect deep evolutionary legacies of species and local differences in the historical and contemporary marine climates. Population-specific patterns in thermal performance have important implications for the distribution, abundance and conservation of Mediterranean benthic habitats in response to climate change.
Publisher’s Note
All claims expressed in this article are solely those of the authors and do not necessarily represent those of their affiliated organizations, or those of the publisher, the editors and the reviewers. Any product that may be evaluated in this article, or claim that may be made by its manufacturer, is not guaranteed or endorsed by the publisher.
Statements
Data availability statement
The datasets presented in this study can be found in online repositories. The names of the repository/repositories and accession number(s) can be found below: https://doi.org/10.5061/dryad.d2547d81r.
Ethics statement
Collections of plant material for this project were conducted in accordance with institutional, national, and international guidelines and legislation. Permissions for collections of plant material were obtained from local governing bodies.
Author contributions
SB, NM, and RV-S conceived and designed the study. SB, NM, GR, and RV-S conducted the field work. SB, RV-S, NM, GR, and MF conducted the experiments. GJ provided all temperature data. SB wrote the manuscript with contributions from all authors. All authors contributed to the article and approved the submitted version.
Funding
SB received funding from the European Union’s Horizon 2020 Research and Innovation Programme under grant agreement No. 659246 and Juan de la Cierva Formación (FJCI-2016-30728). RV-S was funded by Juan de la Cierva – Incorporación (IJCI-2015-23163), NM, SB, and RV-S received funding from the Spanish Ministry of Economy, Industry and Competitiveness (MedShift, CGL2015-71809-P). NM received funding from the Spanish Ministry of Science, Innovation and Universities (SUMAECO, RTI2018-095441-B-C21).
Acknowledgments
We thank Demetris Kletou, Ioannis Savva, Perikilis Kleitou, and Charalampos Antoniou in Limassol for logistical support. Eugenia Apostolaki in Crete and Teresa Alcoverro from Catalonia facilitated experimental collections. Carlos Alejandro Morell, Elvira Álvarez, Mika Noguera, Olga Sánchez, and Daniel Salom helped to conducting the experiments. Marlene Wesselmann assisted in fieldwork. Enrique Ballesteros provided advice about taxonomy and species distributions. Species illustrations were drawn by Helena Twose.
Conflict of interest
The authors declare that the research was conducted in the absence of any commercial or financial relationships that could be construed as a potential conflict of interest.
Supplementary material
The Supplementary Material for this article can be found online at: https://www.frontiersin.org/articles/10.3389/fmars.2022.733315/full#supplementary-material
Footnotes
References
1
Aires T. Marba N. Cunha R. L. Kendrick G. A. Walker D. I. Serrao E. A. et al (2011). Evolutionary history of the seagrass genus Posidonia.Mar. Ecol. Prog. Ser.421117–130. 10.3354/meps08879
2
Alberto F. Massa S. Manent P. Diaz-Almela E. Arnaud-Haond S. Duarte C. M. et al (2008). Genetic differentiation and secondary contact zone in the seagrass Cymodocea nodosa across the Mediterranean–Atlantic transition region.J. Biogeogr.351279–1294. 10.1111/j.1365-2699.2007.01876.x
3
Araújo M. B. Peterson A. T. (2012). Uses and misuses of bioclimatic envelope modeling.Ecology931527–1539. 10.1890/11-1930.1
4
Bates A. E. Morley S. A. (2020). Interpreting empirical estimates of experimentally derived physiological and biological thermal limits in ectotherms.Can. J. Zool.98237–244. 10.1139/cjz-2018-0276
5
Baty F. Ritz C. Charles S. Brutsche M. Flandrois J.-P. Delignette-Muller M.-L. (2015). A toolbox for nonlinear regression in R: the package nlstools.J. Stat. Softw.661–21. 10.18637/jss.v066.i05
6
Bennett A. F. (1987). “Evolution of the control of body temperature: is warmer better,” in Comparative Physiology: Life in Water and on Land, edsDejourP.et al (Padova: Liviana Prass), 421–431.
7
Bennett S. Alcoverro T. Kletou D. Antoniou C. Boada J. Buñuel X. et al (2021). Resilience of seagrass populations to thermal stress does not reflect regional differences in ocean climate.New Phytol. Online ahead of print 10.1111/nph.17885
8
Bennett S. Duarte C. M. Marbà N. Wernberg T. (2019). Integrating within-species variation in thermal physiology into climate change ecology.Philos. Trans. R Soc. Lond. B Biol. Sci.37420180550. 10.1098/rstb.2018.0550
9
Bennett S. Wernberg T. Joy B. A. de Bettignies T. Campbell A. H. (2015). Central and rear-edge populations can be equally vulnerable to warming.Nat. Commun.610280. 10.1038/ncomms10280
10
Bianchi C. N. Morri C. Chiantore M. Montefalcone M. Parravicini V. Rovere A. (2012). “Mediterranean Sea biodiversity between the legacy from the past and a future of change,” in Life in the Mediterranean Sea: a Look at Habitat Changes, ed.StamblerN. (New York, NY: Nova Science Publishers Inc).
11
Brown J. H. Gillooly J. F. Allen A. P. Savage V. M. West G. B. (2004). Toward a metabolic theory of ecology.Ecology851771–1789. 10.1890/03-9000
12
Chefaoui R. M. Duarte C. M. Serrão E. A. (2018). Dramatic loss of seagrass habitat under projected climate change in the Mediterranean Sea.Glob. Change biol.244919–4928. 10.1111/gcb.14401
13
Diaz-Almela E. Marba N. Martinez R. Santiago R. Duarte C. M. (2009). Seasonal dynamics of Posidonia oceanica in Magalluf Bay (Mallorca, Spain): temperature effects on seagrass mortality.Limnol. Oceanogr.542170–2182. 10.4319/lo.2009.54.6.2170
14
Draisma S. G. Ballesteros E. Rousseau F. Thibaut T. (2010). DNA sequence data demonstrate the polyphyly of the genus cystoseira and other sargassaceae genera (Phaeophyceae) 1.J. Phycol.461329–1345. 10.1111/j.1529-8817.2010.00891.x
15
Fraser M. W. Kendrick G. A. Statton J. Hovey R. K. Zavala-Perez A. Walker D. I. (2014). Extreme climate events lower resilience of foundation seagrass at edge of biogeographical range.J. Ecol.1021528–1536. 10.1111/1365-2745.12300
16
George R. Gullström M. Mangora M. M. Mtolera M. S. Björk M. (2018). High midday temperature stress has stronger effects on biomass than on photosynthesis: a mesocosm experiment on four tropical seagrass species.Ecol. Evol.84508–4517. 10.1002/ece3.3952
17
Harris L. A. Duarte C. M. Nixon S. W. (2006). Allometric laws and prediction in estuarine and coastal ecology.Estuaries Coasts29340–344. 10.1007/bf02782002
18
Herbert R. J. Ma L. Marston A. Farnham W. F. Tittley I. Cornes R. C. (2016). The calcareous brown alga Padina pavonica in southern Britain: population change and tenacity over 300 years.Mar. Biol.16346. 10.1007/s00227-015-2805-7
19
Hoegh-Guldberg O. Bruno J. F. (2010). The impact of climate change on the world’s marine ecosystems.Science3281523–1528. 10.1126/science.1189930
20
Hsü K. J. Montadert L. Bernoulli D. Cita M. B. Erickson A. Garrison R. E. et al (1977). History of the Mediterranean salinity crisis.Nature267399. 10.1038/267399a0
21
Jordà G. Marbà N. Duarte C. M. (2012). Mediterranean seagrass vulnerable to regional climate warming.Nat. Clim. Change2821–824. 10.1038/nclimate1533
22
Knies J. L. Kingsolver J. G. Burch C. L. (2009). Hotter is better and broader: thermal sensitivity of fitness in a population of bacteriophages.Am. Nat.173419–430. 10.1086/597224
23
Marba N. Duarte C. M. (2010). Mediterranean warming triggers seagrass (Posidonia oceanica) shoot mortality.Sea. Glob. Change biol.162366–2375. 10.1111/j.1365-2486.2009.02130.x
24
Marbà N. Hemminga M. A. Mateo M. A. Duarte C. M. Mass Y. E. Terrados J. et al (2002). Carbon and nitrogen translocation between seagrass ramets.Mar. Ecol. Prog. Ser.226287–300. 10.3354/meps226287
25
Martínez B. Arenas F. Trilla A. Viejo R. M. Carreño F. (2014). Combining physiological threshold knowledge to species distribution models is key to improving forecasts of the future niche for macroalgae.Glob. Change Biol.211422–1433. 10.1111/gcb.12655
26
Müren U. Berglund J. Samuelsson K. Andersson A. (2005). Potential effects of elevated sea-water temperature on pelagic food webs.Hydrobiologia545153–166. 10.1007/s10750-005-2742-4
27
Orellana S. Hernández M. Sansón M. (2019). Diversity of Cystoseira sensu lato (Fucales, Phaeophyceae) in the eastern Atlantic and Mediterranean based on morphological and DNA evidence, including Carpodesmia gen. emend. and Treptacantha gen. emend.Eur. J. Phycol.54447–465. 10.1080/09670262.2019.1590862
28
Pinsky M. L. Eikeset A. M. McCauley D. J. Payne J. L. Sunday J. M. (2019). Greater vulnerability to warming of marine versus terrestrial ectotherms.Nature569108. 10.1038/s41586-019-1132-4
29
Por F. (2009). Tethys returns to the Mediterranean: success and limits of tropical re-colonization.BioRisk35. 10.3897/biorisk.3.30
30
R Core Team. (2020). R: A Language and Environment for Statistical Computing.Vienna: R Foundation for Statistical Computing.
31
Regaudie-de-Gioux A. Duarte C. M. (2012). Temperature dependence of planktonic metabolism in the ocean.Glob. Biogeochem. Cycles26GB1015. 10.1029/2010GB003907
32
Reynolds R. W. Smith T. M. Liu C. Chelton D. B. Casey K. S. Schlax M. G. (2007). Daily high-resolution-blended analyses for sea surface temperature.J. Clim.205473–5496. 10.1175/2007JCLI1824.1
33
Sagarin R. D. Gaines S. D. (2002). Geographical abundance distributions of coastal invertebrates: using one-dimensional ranges to test biogeographic hypotheses.J. Biogeogr.29985–997. 10.1046/j.1365-2699.2002.00705.x
34
Sarmento H. Montoya J. M. Vázquez-Domínguez E. Vaqué D. Gasol J. M. (2010). Warming effects on marine microbial food web processes: how far can we go when it comes to predictions?Philos. Trans. R. Soc. B Biol. Sci.3652137–2149. 10.1098/rstb.2010.0045
35
Savva I. Bennett S. Roca G. Jordà G. Marbà N. (2018). Thermal tolerance of Mediterranean marine macrophytes: vulnerability to global warming.Ecol. Evol.812032–12043. 10.1002/ece3.4663
36
Short F. T. Duarte C. M. (2001). Methods for the measurement of seagrass growth and production.Glob. Seagrass Res. Methods2001155–198. 10.1016/B978-044450891-1/50009-8
37
Short F. Carruthers T. Dennison W. Waycott M. (2007). Global seagrass distribution and diversity: a bioregional model.J. Exp. Mar. Biol. Ecol.3503–20. 10.1016/j.jembe.2007.06.012
38
Silberfeld T. Bittner L. Fernández-García C. Cruaud C. Rousseau F. de Reviers B. et al (2013). Species diversity, phylogeny and large scale biogeographic patterns of the genus Padina (Phaeophyceae, Dictyotales).J. Phycol.49130–142. 10.1111/jpy.12027
39
Spalding M. D. Fox H. E. Allen G. R. Davidson N. Ferdaña Z. A. Finlayson M. et al (2007). Marine ecoregions of the world: a bioregionalization of coastal and shelf areas.BioScience57573–583. 10.1641/B570707
40
Strydom S. Murray K. Wilson S. Huntley B. Rule M. Heithaus M. et al (2020). Too hot to handle: unprecedented seagrass death driven by marine heatwave in a World Heritage Area.Sea. Glob. Change Biol.263525–3538. 10.1111/gcb.15065
41
Stuart-Smith R. D. Edgar G. J. Barrett N. S. Kininmonth S. J. Bates A. E. (2015). Thermal biases and vulnerability to warming in the world’s marine fauna.Nature52888–92. 10.1038/nature16144
42
Taviani M. (2002). The Mediterranean benthos from late Miocene up to present: ten million years of dramatic climatic and geologic vicissitudes.Biol. Mar. Mediterr.9445–463.
43
Telesca L. Belluscio A. Criscoli A. Ardizzone G. Apostolaki E. T. Fraschetti S. et al (2015). Seagrass meadows (Posidonia oceanica) distribution and trajectories of change.Sci. Rep.512505. 10.1038/srep12505
44
Valladares F. Matesanz S. Guilhaumon F. Araújo M. B. Balaguer L. Benito-Garzón M. et al (2014). The effects of phenotypic plasticity and local adaptation on forecasts of species range shifts under climate change.Ecol. Lett.171351–1364. 10.1111/ele.12348
45
Vaquer-Sunyer R. Duarte C. M. (2013). Experimental evaluation of the response of coastal Mediterranean planktonic and benthic metabolism to warming.Estuaries Coasts36697–707. 10.1007/s12237-013-9595-2
46
Vaquer-Sunyer R. Conley D. J. Muthusamy S. Lindh M. V. Pinhassi J. Kritzberg E. S. (2015). Dissolved organic nitrogen inputs from wastewater treatment plant effluents increase responses of planktonic metabolic rates to warming.Environ. Sci. Technol.4911411–11420. 10.1021/acs.est.5b00674
47
Vaquer-Sunyer R. Duarte C. M. Santiago R. Wassmann P. Reigstad M. (2010). Experimental evaluation of planktonic respiration response to warming in the European Arctic Sector.Pol. Biol.331661–1671. 10.1007/s00300-010-0788-x
48
Wernberg T. Bennett S. Babcock R. C. de Bettignies T. Cure K. Depczynski M. et al (2016). Climate-driven regime shift of a temperate marine ecosystem.Science353169–172. 10.1126/science.aad8745
49
Win N. N. Hanyuda T. Arai S. Uchimura M. Prathep A. Draisma S. G. et al (2010). Four new species of Padina (Dictyotales, Phaeophyceae) from the western Pacific Ocean, and reinstatement of Padina japonica.Phycologia49136–153. 10.2216/09-54.1
50
Yvon-Durocher G. Jones J. I. Trimmer M. Woodward G. Montoya J. M. (2010). Warming alters the metabolic balance of ecosystems.Philos. Trans. R. Soc. B Biol. Sci.3652117–2126. 10.1098/rstb.2010.0038
Summary
Keywords
macroalgae, local adaptation, phenotypic plasticity, niche conservatism, climate change
Citation
Bennett S, Vaquer-Sunyer R, Jordá G, Forteza M, Roca G and Marbà N (2022) Thermal Performance of Seaweeds and Seagrasses Across a Regional Climate Gradient. Front. Mar. Sci. 9:733315. doi: 10.3389/fmars.2022.733315
Received
30 June 2021
Accepted
13 January 2022
Published
25 February 2022
Volume
9 - 2022
Edited by
Jennifer Marie Donelson, James Cook University, Australia
Reviewed by
Juan D. Gaitan-Espitia, The University of Hong Kong, Hong Kong SAR, China; Mat Vanderklift, Commonwealth Scientific and Industrial Research Organisation (CSIRO), Australia
Updates
Copyright
© 2022 Bennett, Vaquer-Sunyer, Jordá, Forteza, Roca and Marbà.
This is an open-access article distributed under the terms of the Creative Commons Attribution License (CC BY). The use, distribution or reproduction in other forums is permitted, provided the original author(s) and the copyright owner(s) are credited and that the original publication in this journal is cited, in accordance with accepted academic practice. No use, distribution or reproduction is permitted which does not comply with these terms.
*Correspondence: Scott Bennett, scott.bennett0@utas.edu.au
This article was submitted to Global Change and the Future Ocean, a section of the journal Frontiers in Marine Science
Disclaimer
All claims expressed in this article are solely those of the authors and do not necessarily represent those of their affiliated organizations, or those of the publisher, the editors and the reviewers. Any product that may be evaluated in this article or claim that may be made by its manufacturer is not guaranteed or endorsed by the publisher.