 Michael Bedington
 Luz María García-García
 Marc Sourisseau
 Manuel Ruiz-Villarreal
- 1Plymouth Marine Laboratory (PML), Plymouth, United Kingdom
- 2Instituto Español de Oceanografía (IEO, CSIC), Centro Oceanográfico da Coruña, A Coruña, Spain
- 3IFREMER, French Research Institute for Exploitation of the Sea, DYNECO PELAGOS, Plouzané, France
Availability of operational regional hydrodynamic models and near real time Harmful Algal Bloom (HAB) alerts from monitoring stations and remote sensing products have allowed the proliferation of short term advective HAB forecasts. However, their predictive ability in simulating HAB transport needs to be continuously evaluated in events of different HAB species to assess their applicability to different domains and the impacts of the choices made in model setup. Here we review the performance of three different modelling systems which were part of the PRIMROSE project against historical bloom events in different regions in the European Atlantic Area. The objectives are to understand their predictive ability and to demonstrate some aspects of Lagrangian model setup that are relevant to HAB early warning systems; in particular the use of advection-diffusion only models (without a biological component) and the effects of model configuration, especially model resolution. Hindcast and forecast simulations have been run in examples of high biomass blooms detected in satellite imagery; in the western English Channel, several events of potentially toxic species like Karenia mikimotoi and Prorocentrum cordatum (minimum) were simulated and in Western France a bloom of Mesodinium rubrum, prey of the toxic Dinophysis spp. Additionally, some simulations for studying the evolution of low biomass Dinophysis spp. blooms in Galicia-North Portugal were undertaken with models of different setup. Several metrics have been used to quantify the model performance and to compare the results of the different model configurations, showing that differences in hydrodynamical model configuration (initiation, resolution, forcing, and simulation domain) result in differences in the predicted transport of HABs. We find that advection only is a reasonable approximation but that it may do worse in an early (onset) phase than later on, and we find transport is generally increases with increasing resolution. Our results confirm that Lagrangian particle tracking tools can be integrated operationally in HAB early warning systems providing useful information on potential HAB evolution to users.
1 Introduction
HABs occur seasonally in shelf seas due to favourable conditions promoting local growth or as a result of advection from other areas. When this happens, shell and fin aquaculture might be damaged either indirectly, in case of high biomass HABs which cause oxygen depletion events (O’Boyle et al., 2016) or fish kills (Lee and Qu, 2004), or directly from the toxins, which might result in a food security hazard. The current economic impact of HABs is considerable; one estimate for Scottish aquaculture alone is £1.2 million per year out of a turnover of £12 million (Martino et al., 2020), and the incidence is considered likely to increase with climate change (Paerl and Huisman 2008; Elliott 2012; Wells et al. 2020), making the problem even more important. Beyond aquaculture, HAB forecasts may be of interest for beaches, where they impact human health (Anderson et al., 2016) and provision of ecosystem services.
Monitoring for HABs now encompasses routine in situ measurements, field campaigns, and detection from remote sensing, which uses algorithms based on reflectance and other parameters to determine the likelihood that harmful species are present (Kutser et al., 2006; Kurekin et al., 2014; Sourisseau et al., 2016). However, these provide snapshots in the present or recent past. Forecasts for the likelihood of algal bloom incursions on sites of interest in the future provide the most value to end-users since they can allow mitigation actions to be taken. The critical time frame for these predictions depends on the needs of the end-user, but can be on the order of days (Cusack et al., 2016).
HAB forecasting is complex since, whilst the mechanism of triggering a bloom might be understood, e.g. from upwelling variability (Pitcher et al.,2010; Ruiz-Villarreal et al., 2016), the onset of thermal stratification (Simpson and Sharples, 2012; Hartman et al., 2014), or stratification in river plumes (Glibert et al., 2010; Velo-Suárez et al., 2010), diagnosing when these are likely to occur and particularly whether a particular bloom will comprise harmful species, is very uncertain. Once initiated, advection is a significant driver in bloom evolution (Lee and Qu, 2004; Davidson et al., 2009; Velo-Suárez et al., 2010; Aoki et al., 2012; Gillibrand et al., 2016) but continued development, with either more cells growing or dying off, can be as significant, leaving a process which is neither fully physically or biologically determined.
Here we restrict our focus to short term forecasts from operational physics models using Lagrangian drift approaches only. Different reviews of HAB early warning systems (Davidson et al., 2016; Maguire et al., 2016; Ralston and Moore, 2020; Fernandes-Salvador et al., 2021, this issue) cover the range of other approaches, including statistical and machine learning approaches. The increase in availability of regional scale operational models has made near term operational advection-only forecasts feasible in a wide range of areas. These hydrodynamic forecast models typically have a forecast window of 2-7 days and the outputs are used to drive a Lagrangian drift model representing the HAB (e.g. Aleynik et al., 2016; Pinto et al., 2016; Ruiz-Villarreal et al., 2016; Silva et al., 2016). Despite being broadly similar in the size of the region they cover and the length of forecasts, there is considerable heterogeneity of setups.
During the EU funded project ASIMUTH, it was demonstrated that HAB forecast systems showed skill in predicting HAB transport and in assessing the area affected by the blooms (Maguire et al., 2016). The hydrodynamic model configurations developed and demonstrated during the project provided information on the variability of cross-shore and along-shore flows that move HAB populations towards (or away from) harvesting places. The hydrodynamical model runs combined with Lagrangian particle tracking simulations showed skill in predicting along-shore transport of HABs (Gillibrand et al., 2016; Pinto et al., 2016; Ruiz-Villarreal et al., 2016; Silva et al., 2016) as well as cross-shelf transport in and out of harvesting areas (Aleynik et al., 2016; Cusack et al., 2016; Ruiz-Villarreal et al., 2016).
The physical models used for the HAB forecasts are run at different scales, both spatially and temporally, and on either regular (e.g. Ruiz-Villarreal et al., 2016) or unstructured or telescopic grids (e.g. Aleynik et al., 2016), which are becoming more popular in bathymetrically complex areas. Short term HAB predictions usually use these models to force a Lagrangian drift model that is generally run offline (using current velocities stored from a previously run hydrodynamic model) since this allows faster computation and the possibility of re-using the hydrodynamic fields. However, the frequency at which the forcing is saved is a balance between space needed for the forcing files and temporally resolving the most relevant features of the flow.
In this paper we describe three different operational coastal HAB drift forecast systems in operation under the Interreg Atlantic Area Predicting Risk and Impact of Harmful Events on the Aquaculture Sector (PRIMROSE) project (2018-2021), which brought together partners from across the European Atlantic seaboard to improve capacity and tools for HAB prediction (Mateus et al., 2019). In this contribution, we compare these models to several bloom events, both historical and during the project period, to understand the efficacy of advection-only models for short term forecasts and to show the impact of different model choices on the results. We also discuss how their performance impacts on how they might provide value for forecast users, what considerations are important for implementing such a system, and where there is scope for future improvement.
2 Methods
2.1 Models
The three demonstrated HAB modelling systems are from three different partners in PRIMROSE : Plymouth Marine Laboratory (PML), Institut Français de Recherche pour l’Exploitation de la Mer (IFREMER), and Instituto Español de Oceanografia (IEO), and will be referred to by the respective institute initials throughout. Whilst the domains of these models intersect, they are primarily focused on different areas: the Western Channel and Celtic Sea (PML), the Western Channel and the eastern Bay of Biscay (IFREMER) and NW and N Iberia (IEO) (Figure 1). All the model systems are formed of an operational hydrodynamic model with a separate particle tracking model which is run offline utilising the output from the hydrodynamic model. None of the particle tracking models include explicit biological behaviours (e.g. diurnal migration, life cycle, nutrient limitation) and are purely passively advecting particles.
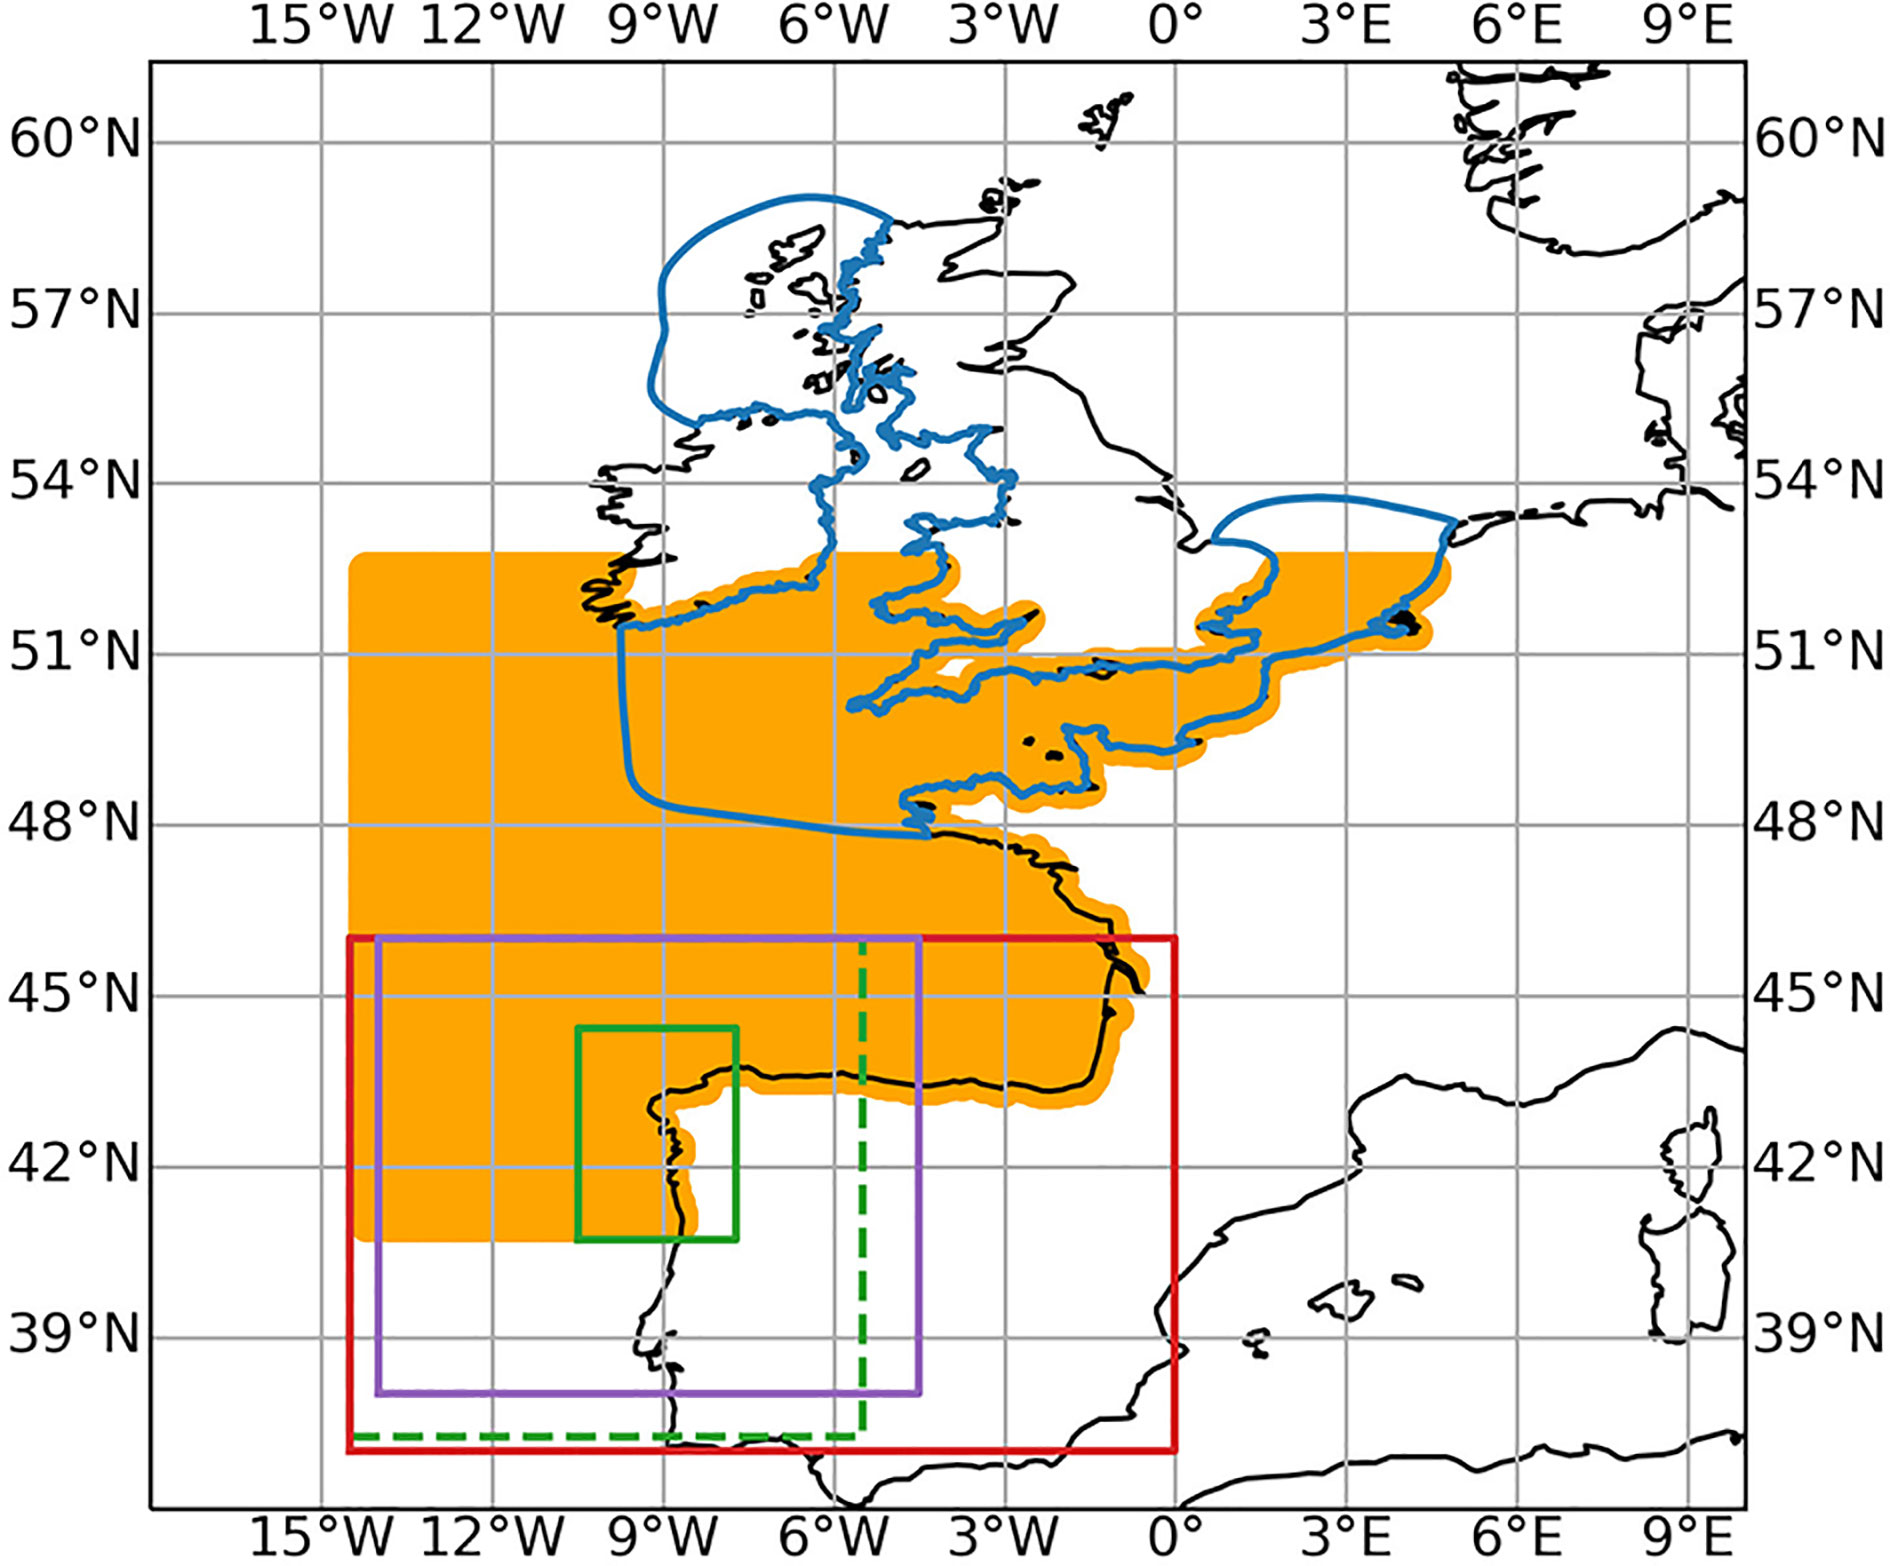
Figure 1 The model domains of the models in the study PML (blue), IFREMER (orange), MeteoGalicia (purple), IEO BIO (red) and IEO RAIA (green) which has a parent grid (dashed line) and nested high resolution grid (solid line).
2.1.1 South West UK Model - PML
An unstructured grid hydrodynamic model FVCOM; (Chen et al. 2003) is run operationally for a domain covering the SW of the UK, producing 3-day forecasts. An operational atmospheric downscaling model [Weather Research and Forecasting model (WRF)] is also run to provide high resolution surface forcing, downscaling the NCEP GFS model (Lien et al. 2016). Lateral boundary data for the hydrodynamic model comes from CMEMS AMM15 model [1.5 km horizontal resolution, (Tonani et al. 2019)], and river input is modelled from the WRF temperature and precipitation using regression and deep-learning models, respectively. The Lagrangian model PyLAG; (Uncles et al. 2020) is run offline on saved hourly outputs from the hydrodynamic model. The Lagrangian model uses a Milstein scheme for advection and diffusion, with the diffusivities provided directly from the hydrodynamic model.
In the operational product, particles are seeded based on output from a HAB-risk product which uses ocean colour (Kurekin et al. 2014). This product uses the multiple bands of ocean colour [6 for MODIS (412, 443, 488, 531, 547 and 667 nm)] with a Linear Discriminant Analysis classifier which was trained on an image set identified by in-situ sampling or feature identification. It was assessed to have an 88% accuracy rate for Karenia mikimotoi blooms in the Western English Channel; full details are in (Kurekin et al. 2014). Particles are released in a 200 m radius area around the identified high risk locations with 10,000 particles per location. Particles are advected using only the surface layer currents until the end of the forecast period. The results of the model are served both as a gridded particle density and as a probability field, which takes into consideration uncertainty both from the identification algorithm and from the drifting particles.
2.1.2 Bay of Biscay and Western Channel - IFREMER
The Lagrangian Particle tracking model Ichthyop (Lett et al. 2008) is forced using hourly, or daily (de-tided with a Demerliac filter) velocity fields from the hydrodynamic model MARS3D [finite difference, mode splitting model in a sigma-coordinate framework (Lazure and Dumas 2008). It runs on grids of differing resolution (4 km, 2.5 km and 1 km) in an operational way (MARC project: http://marc.ifremer.fr/en/) and produces 4-day forecasts. Wind forcing is Meteo- France product (ARPEGE or AROME according to the configuration and period considered, resolution of 30 km and 1.3 km, respectively). River discharges of the at least 5 main rivers are provided on a daily frequency by River Basin Agencies through the Operational Data Center (http://en.data.ifremer.fr/). Some flow rates of additional rivers are deduced from the measured flow rate of the nearest main river by linear regression.
The Lagrangian model is run only on an ad-hoc basis in response to individual events of concern. Most of the time, the model is used to define the bloom advection for some biological reanalysis. HAB cells are represented as passive particles and are introduced in the mixed surface layer. For the two selected events in the English Channel (2003 and 2020), 100,000 and 91, 200 particles were respectively released over the first ten and twenty meters. The horizontal resolution of velocity field was 4 km at hourly temporal resolution. For the Mesodinium event in the Bay of Biscay in June 2020, a total of 115,000 particles were released within the first ten meters. Daily velocity fields with a horizontal resolution of 2.5 km were used. Only the vertical dispersion was considered in all simulations and advection equations were solved with a fourth order Runge-Kutta numerical scheme.
2.1.3 Western Iberian Shelf: North Portugal and Galicia - IEO
The Lagrangian particle tracking model Ichthyop (Lett et al. 2008) is forced offline by the saved hourly results of different ROMS hindcast, nowcast and forecast model configurations in the area run by IEO and MeteoGalicia.
MeteoGalicia is a regional meteorological agency that runs meteorological and oceanographic forecasts to support the government and stakeholders in Galicia (NW Spain), a region where the marine sector is of large socioeconomic importance. The MeteoGalicia ROMS model forecast configuration runs on a 2 km resolution grid covering Galicia and is forced at the surface by the operational configuration of the WRF model and at the open boundary by CMEMS (Copernicus Marine Environment Monitoring Service) global model output (horizontal resolution of 1/12°) (Mercator 2016). Tides and the input of several rivers are included. River discharges consist of daily averaged flow and temperature of the main rivers in Galicia obtained from runs of a configuration of the river basin-scale model Soil Water Assessment Tool (SWAT). Further details of the model configuration and validation can be found in (Costa et al. 2012; Venâncio et al. 2019).
Two IEO hydrodynamic model configurations were used in this study: IEO RAIA and IEO BIO. IEO RAIA is based on the ROMS-Agrif realistic model configuration developed during the RAIA Interreg POCTEP Galicia-Portugal project and has a resolution of 4 km in a parent grid (IEO RAIA) and of 1.3 km in a child grid (IEO RAIA nested) centered on Galicia-North Portugal. IEO RAIA is forced by the atmospheric model WRF operationally run by MeteoGalicia (12 km resolution with hourly output). Open boundaries are obtained from the results of a previous climatological run covering the northeast Atlantic. The effect of tides and rivers (11 rivers in the model domain) are included. This configuration has been compared to different in situ and satellite data sets and has shown skill in simulating the relevant oceanographic processes in the area (river plumes, shelf and slope current, surface circulation) and their spatial and temporal variability (Otero and Ruiz-Villarreal, 2008; Otero et al., 2008; Otero et al., 2009; Otero et al., 2013). It has been run coupled to dispersion models to demonstrate marine services such as HAB early warning (Ruiz-Villarreal et al., 2016) or pollution dispersion (Marta-Almeida et al., 2013; Otero et al., 2014).
The IEO BIO configuration, described in (García-García et al. 2016), was set up with the ROMS Rutgers version in a domain enlarged to the east to cover the whole northern Iberian shelf. This configuration is similar to the IEO RAIA, but open boundary conditions are taken from the operational MyOcean forecasting and analysis system for the North Atlantic running at Mercator Ocean at the time of the simulations (Lellouche et al., 2013), and additional rivers are included. The IEO BIO configuration has been used coupled to particle-tracking models for simulations of along-shore transport of D. acuta for several autumns in Galicia (Ruiz-Villarreal et al., 2016) and in a coupled hydrodynamical-biochemical model configuration to force an Individual Based Model of Early Life Stages of sardine in the Atlantic stock (García-García et al., 2016).
In the Lagrangian model HAB cells are treated as passive particles. Horizontal dispersion is considered, with a fixed dissipation rate of 10-9 m2 s-3. A fourth order Runge-Kutta numerical scheme is used to solve the advection equations. For the operational model run of the early warning system demonstrated in PRIMROSE and previously in ASIMUTH (Ruiz-Villarreal et al., 2016), daily forecasts (3-day window) are run and particles are randomly released in the first 20m of the water column at six locations/configurations. These have been selected to assess the eventual alongshore transport from the northern Portuguese shelf to the Galician Rías Baixas (Vigo, Pontevedra, Arousa and Muros), where the harvesting areas are located, and to explore water exchange between the rías and the across-shore transport to the adjacent shelf.
2.2 Events and Observations
We have identified various bloom events of different HAB species to understand factors involved in the design of a HAB forecast system (see Table 1). When different model configurations with different spatial and temporal resolutions were available, i.e. blooms in the Western Channel in 2003 and 2020 and in Dinophysis spp. bloom in Iberia in autumn 2013, different particle tracking simulations were run forced by those models and compared. Two events in the Western Channel in 2010 and 2015 had remote sensing data available over a period of weeks, and this allowed the investigation of the period over which an advection-only forecast might be applicable, and how the location of the triggering area affects the results. Examples from 2013 and 2020 of Iberian Dinophysis spp. blooms demonstrate the integration with in-situ measurements of HAB species, biotoxins and closures at aquaculture monitoring sites. Finally, an event in 2020 in the Channel shows the factors to consider in a nearshore advection event and the importance of wind forcing, which is also discussed in the other events in the Western Channel.
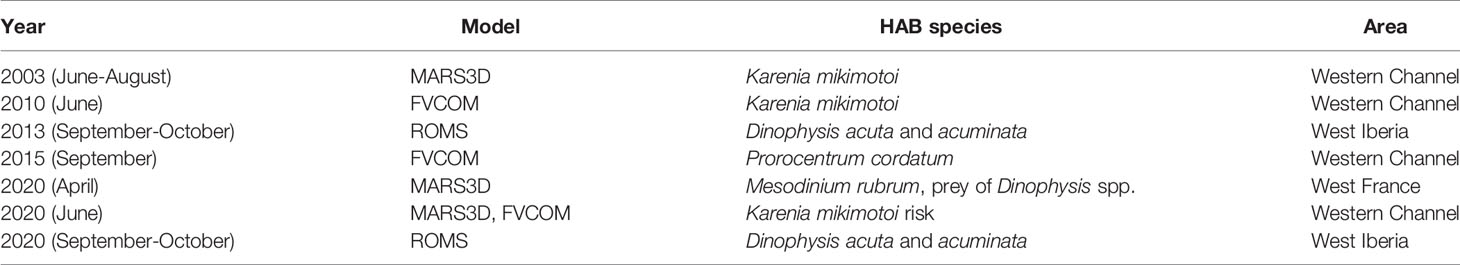
Table 1 Summary of the simulations.
To understand the spatial development of high biomass blooms in the Channel we have used remote sensing measurements of chlorophyll-a, in particular, daily composites retrieved from the Ocean Colour component of the European Space Agency (ESA) Climate Change Initiative (CCI) project (Sathyendranath et al. 2019). The remote sensing product has a spatial resolution of 4 km and combines observations from multiple sensors (MERIS, MODIS Aqua, SeaWiFS LAC & GAC, VIIRS, OLCI). These have been compared with the particles advected in the Lagrangian models to understand the change in spatial extent and location of the blooms. In-situ plankton observations from various sources have been included to allow species identification for the chosen blooms.
2.3 Metrics
Several metrics have been used to quantify the model performance with respect to the satellite observations (in the case of high biomass blooms), and to compare the results of the different model configurations.
For the high biomass blooms that can be identified from satellite observations, the polygons representing the blooms have been automatically identified as the areas above a threshold of 5 mg/l, corresponding to the threshold used in Mishra and Mishra (2012) to define a ‘severe bloom’ on their index: all points on the grid of remote sensed data were determined whether they were above or below the threshold, and those above were connected to form polygons outlining the areas which were entirely above the threshold. The same has been performed on gridded data of particle counts obtained from the Lagrangian model for purposes of comparison with the satellite data, using a threshold number of particles scaled to the total number of particles run. In all cases, days with high cloud cover (>30%) were omitted, and for the days the calculations were performed, the model data was masked to omit data corresponding to areas covered by clouds in the observations. The centre of mass is defined as the mean longitude and latitude, weighted by chlorophyll concentration (particle count) of the observations (model). These centres of mass were compared to the centroids of the observed and modelled polygons and found to give very similar results, so centroids are not shown. Another metric is the percentage of model particles which lie within the observation polygons for a particular day. The dispersion is calculated for both the observed and modelled polygons by taking the change in total polygon area between two snapshots and dividing by the time (the time spacing between snapshots varies depending on which days have been omitted due to cloud cover). The final metric is the percentage overlap between the two polygons, defined as the percentage of the observed polygon which intersects with the modelled polygon.
The D. acuta and D. acuminata blooms that occurred in Portugal and Galicia in 2013 were not high biomass blooms that could be detected from remote sensing. In this case, we compared the results of the different model configurations by using as metric some of the Dispersal Kernel indices described in (Woillez et al. 2009). In particular, the Centre of Gravity (CG), which represents the mean location of the particles at a certain time; the Positive Area (PA), which is the sum of the area units that contain, at least, one particle; the Equivalent Area (EA), which is the area that the particles would occupy if they were distributed at homogeneous densities; the Coefficient of Variation (CV) defined as CV=PA/EA and the mean distance between the mean start and mean end particle positions. These indices, among others, have been used in previous studies to estimate dispersion patterns associated with Lagrangian models e.g. (Huret et al. 2010; García-García et al. 2016).
3 Results
3.1 Western Channel Hindcasts: PML Model
The PML setup was compared to two historical blooms which occurred in the Western Channel region in 2010 and 2015. The blooms were selected on the following criteria: blooms within the available model period, availability of recorded HAB species from in-situ sampling and with enough cloud free remote sensing data to be able to compare the model predictions to the development apparent in the observations. The model setup was identical to the operational setup, with underlying currents and diffusion coefficients from the FVCOM hydrodynamic model, the only change being the lateral boundary forcing came from the reanalysis version of prior lower resolution CMEMS model (AMM7 - O’Dea et al. 2012), since historical forecasts for AMM15 were not available.
A bloom of K. mikimotoi in the Western Channel, identified from FerryBox data (Smythe-Wright et al. 2014; Barnes et al. 2015) occurred in summer 2010. The bloom was evident on satellite chlorophyll data (Figure 2, column A) for a considerable period (July 5th - August 4th). Regions of high chlorophyll (threshold 5mg/l as above) in the remote sensing were identified to define the start locations for the model runs. Since the bloom was long lived, and to disentangle advection from evolution, two separate start times 2010-07-05 (Figure 2, column B) and 2010-07-15 (Figure 2, column C) were used, which correspond to points of clear remote sensing images. The second release was chosen for the 15th of July because at this date the particles released during the initial seeding (the 5th of July) had significantly diverged from the observed bloom.
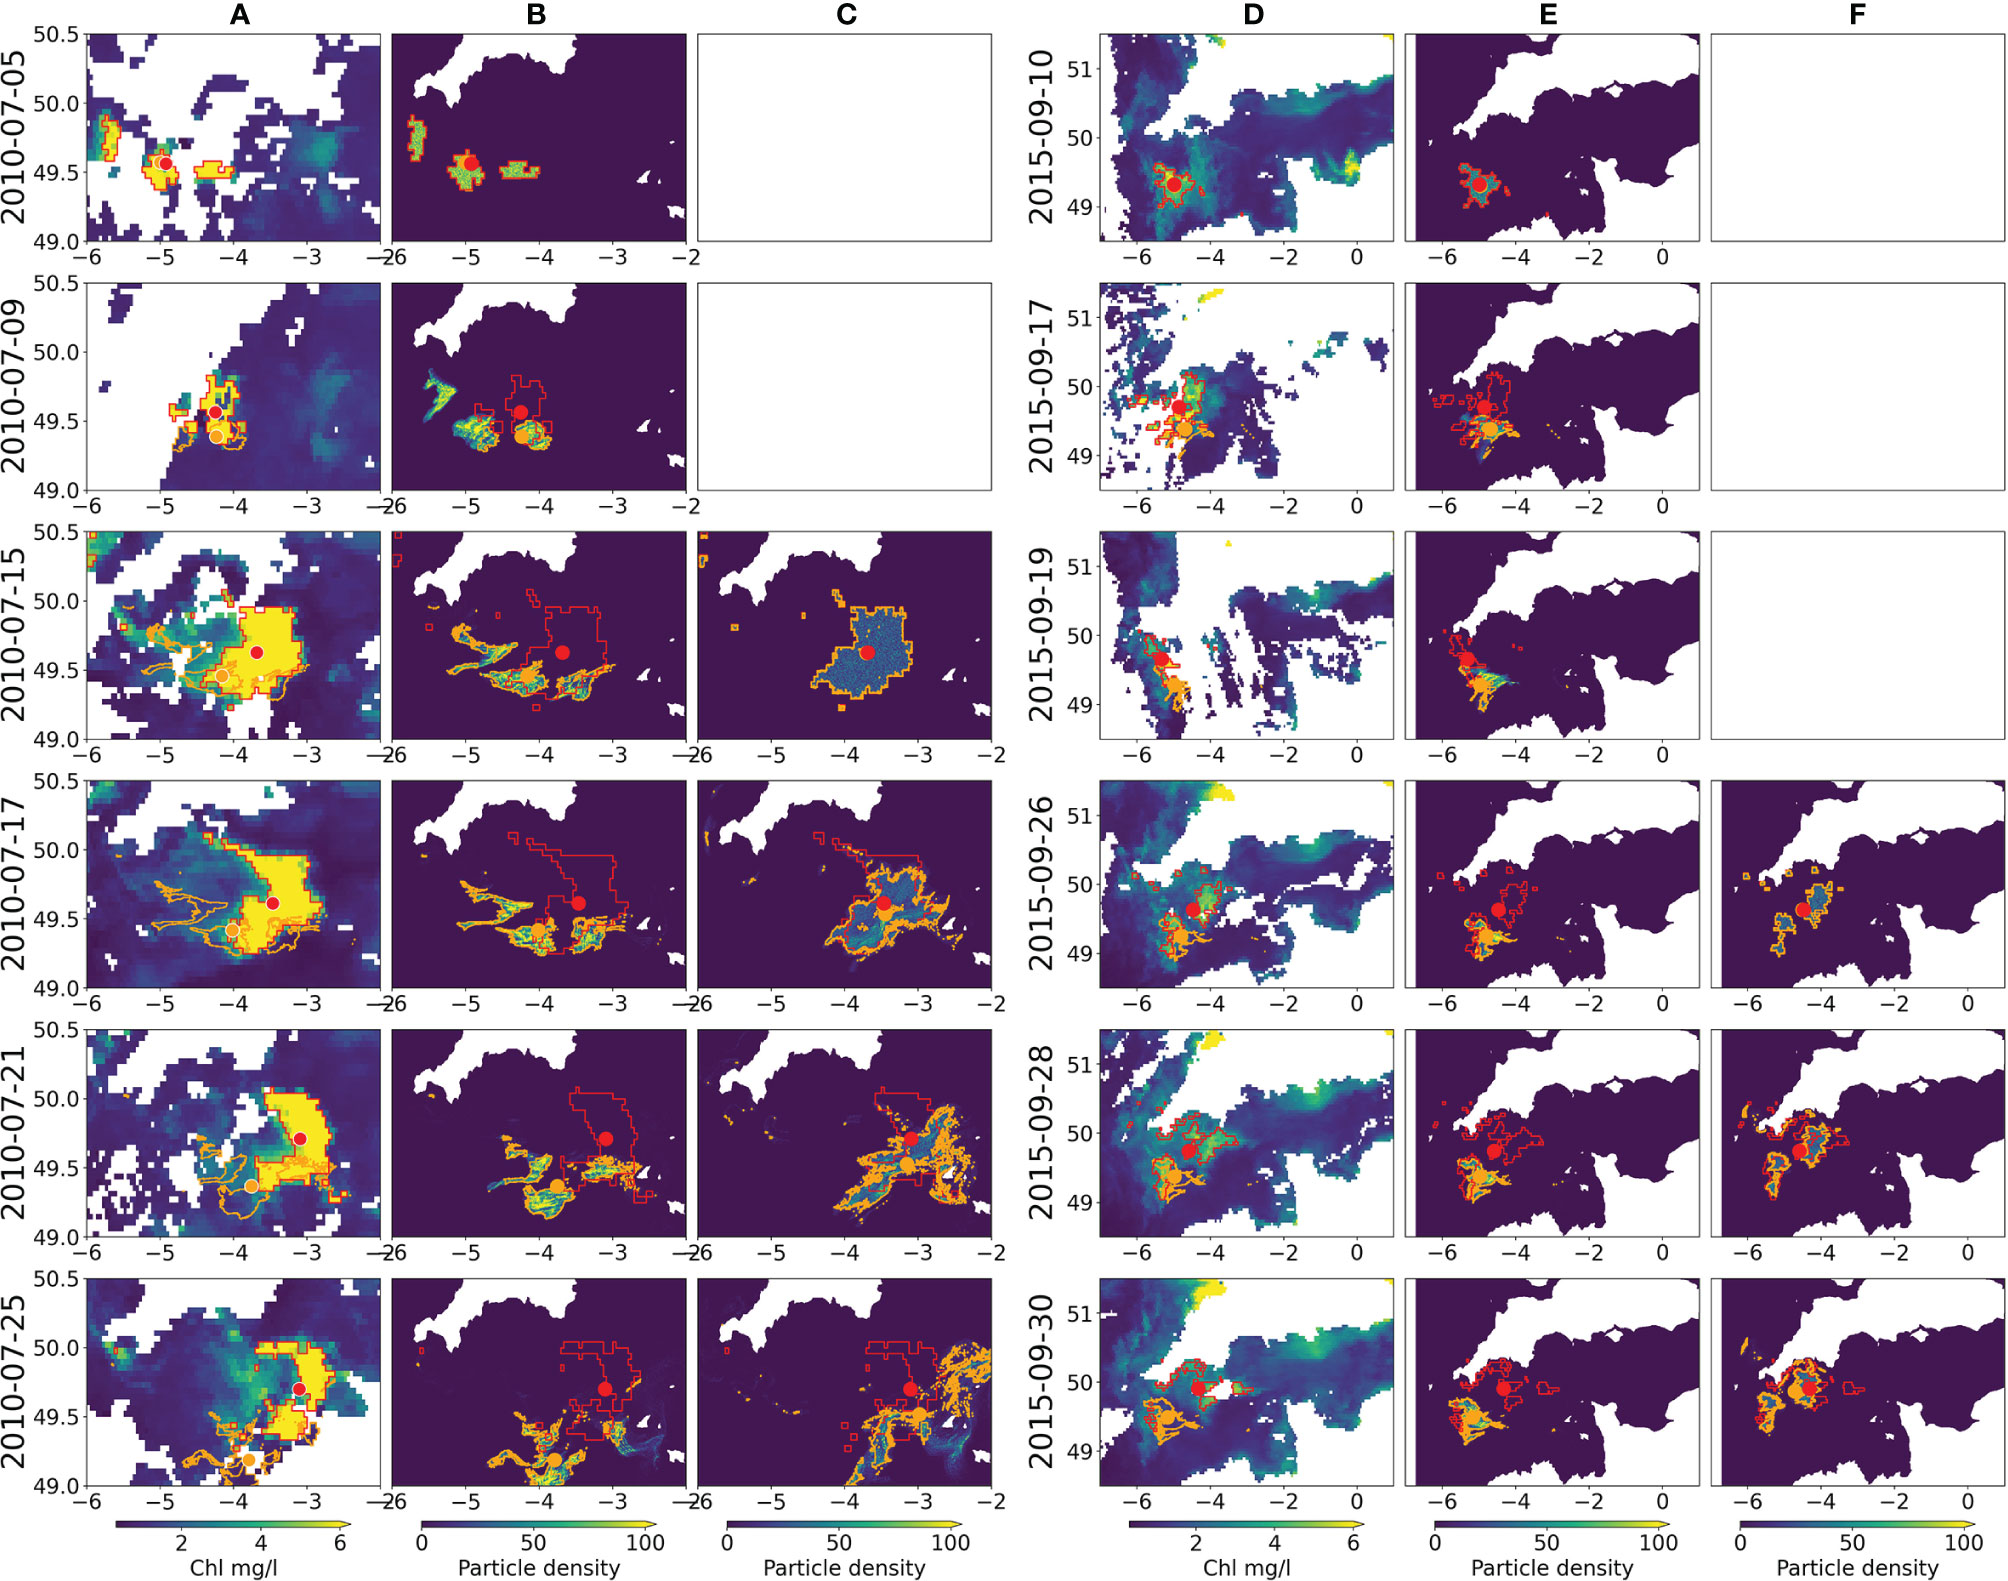
Figure 2 Remote sensing Chl (A, D), and particle densities from the first release (B) and re-release (C) in the July 2010 (A–C) and September 2015 (D–F) events. The selected images, which show the progression of each bloom, are chosen for being the clearest remote sensing data, hence the uneven date distribution. Identified areas of high Chl from the remote sensing are marked inside red polygons with the centre of mass marked by a red spot. Areas of high particle density are shown in orange with the corresponding centre of mass shown by orange spots.
The model shows limited ability in representing the evolution of the bloom at the early stages; particles move southwards in the model and this only matches one part of the observed bloom, since it extends considerably further to the east and north. This is reflected in the rapid drop in particles in polygon and polygon overlap metrics (Figure 3), though the spatial split means the centres of mass diverge in a more linear manner. Initiating a second release 10 days later results in a better performance for the first 5 days (improved across all statistics, Figure 3) after which the model shows faster nearshore advection than the observations close to Brittany (Figure 2). In this latter part of the second release the model is no better than the original release, with observed and model polygons having low overlaps and increasing centre of mass separations. Dispersion for both runs is similar to the observations, but with considerable variability (Supplementary Material: Figure 1). Sensitivity to initial release time on shorter time scales was also studied by running experiments at hourly intervals across a six hour period but found not to significantly affect the results (Supplementary Material: Figure 2).
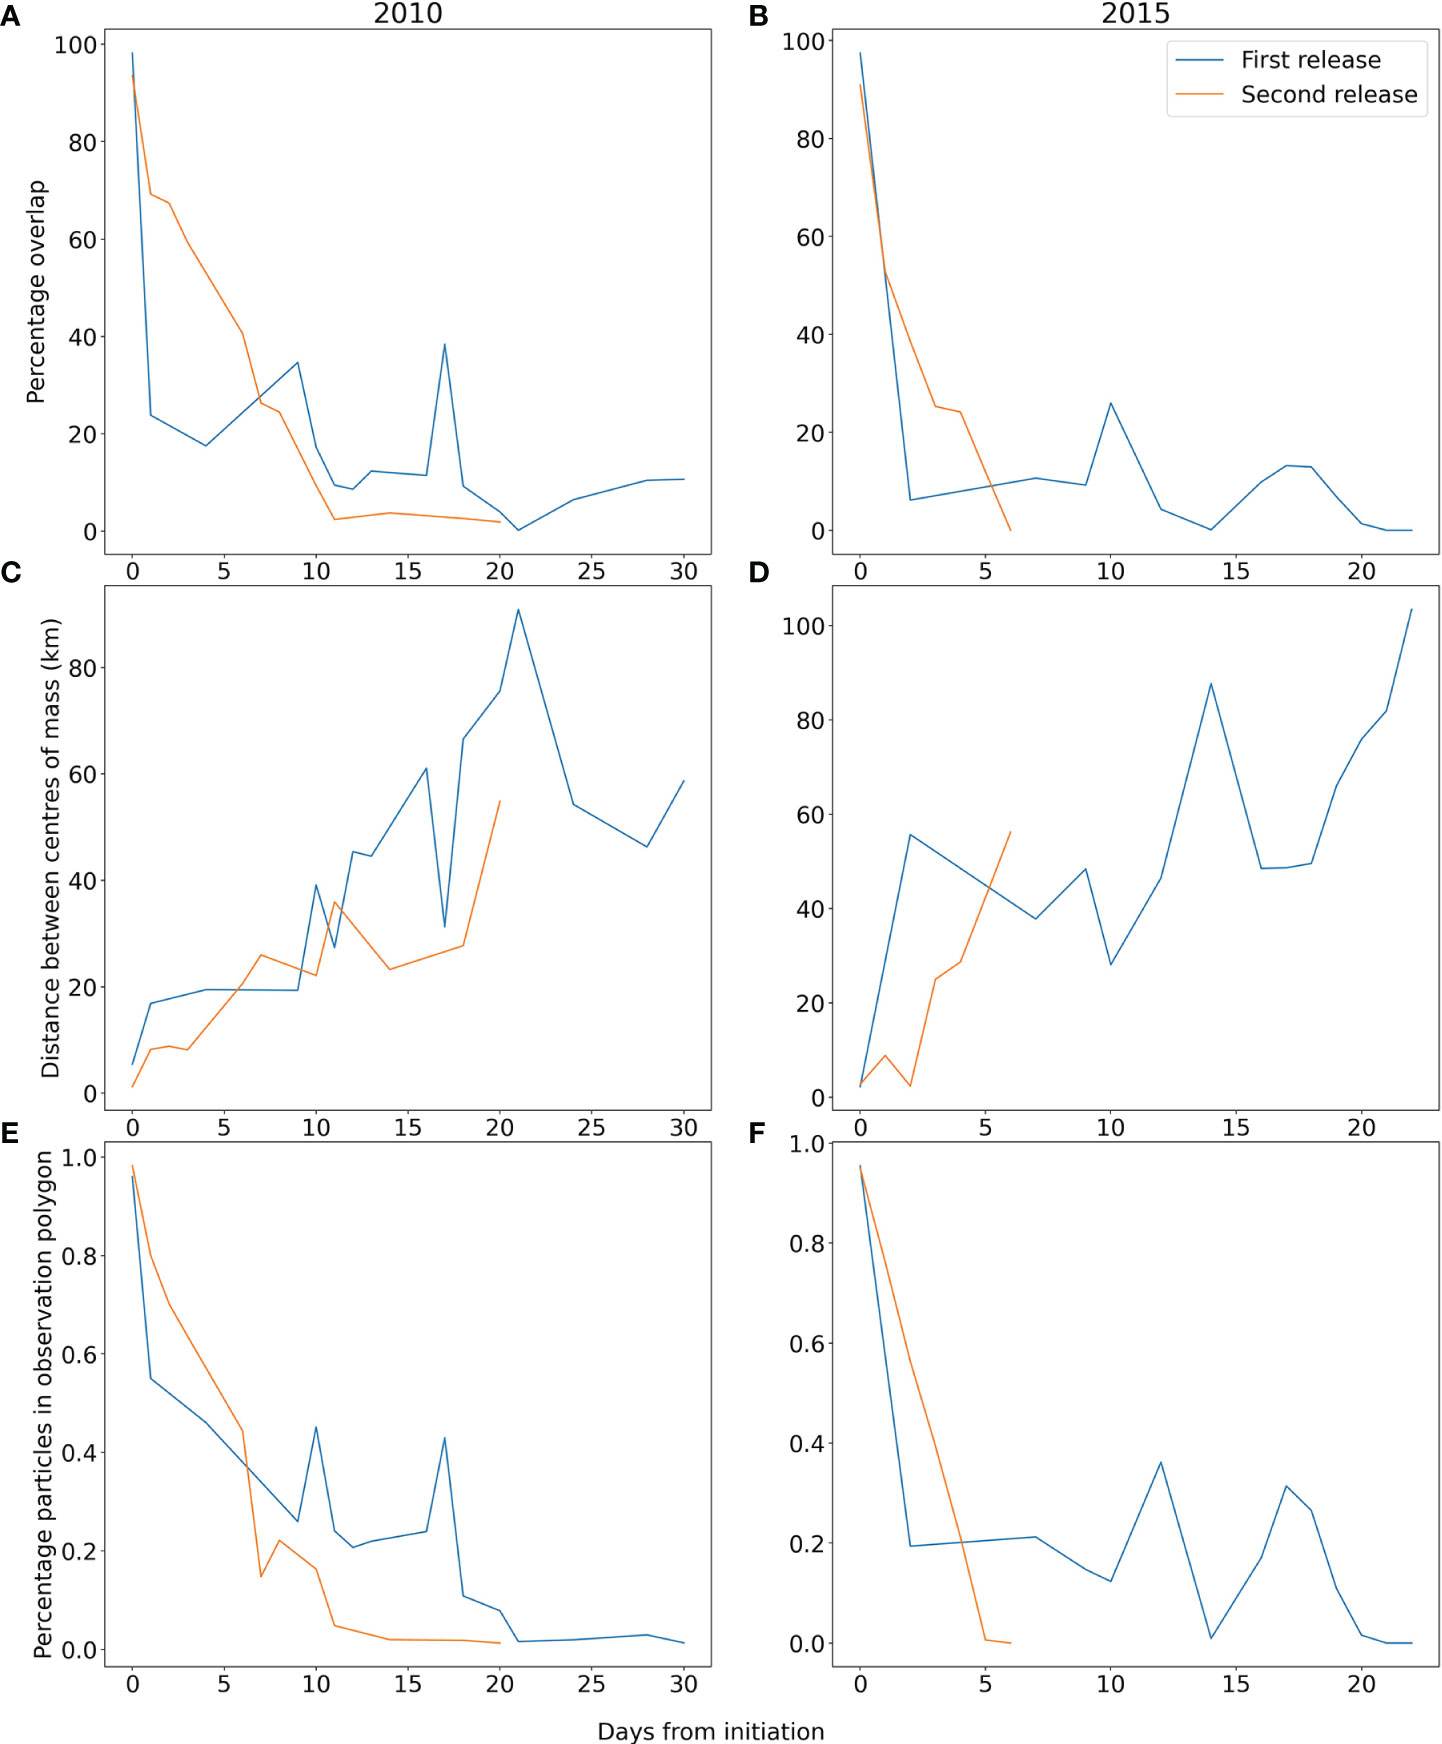
Figure 3 Percentage overlap of polygons (A, B), Distance between centres of mass (C, D), and percentage of modelled particles within observation polygon (E, F) for each day after initiation for first (blue) and second release (orange) in 2010 (A, C, E) and 2015 (B, D, F).
The second event considered is a bloom in September 2015 of the small HAB dinoflagellate Prorocentrum cordatum (minimum) that can form extremely dense blooms. P. cordatum is detected quite commonly in some monitoring areas along the southern coast of England, but with variable cell densities from year to year (Turner et al. 2017), data available in (UK Food Standards Agency 2020) and it is also commonly found in the summer in the western English Channel at the L4 time series station (Widdicombe et al. 2010). Observations from the Western Channel Observatory (WCO) in September 2015 report concentrations of >5,000,000 cells per litre (Hiscock et al. 2016). The bloom is clearly visible on the remote sensing data as a high chlorophyll-a patch between the 10th of September and the 3rd of October (Figure 2, column D) and our particle tracking simulations of the evolution of a potential HAB were run. Again, two separate starting points based on a high chlorophyll threshold in the remote sensing were used to initiate the particle tracking model: 2015-09-10 (Figure 2, column E) and 2015-09-26 (Figure 2, column F). The performance of the model in the 2015 event was broadly similar to the 2010 event. The initial seeding failed to recreate the north and eastward evolution of the bloom, leading to swift drops in the overlap metrics and a separation in the centre of mass too (Figure 3). The model was also reseeded later in the bloom (26th September) and showed better agreement with the advection over the first few days (reduced centre of mass separation and less steep decline in particles in polygon percentage). However, by the fifth day the statistics were similar for both runs. The simulations show that particles reach the English southern coast, and this is in accordance with in situ observations: P. cordatum cells were measured in HAB monitoring samples taken along the southern coast of England in late summer 2015 (Turner et al. 2017), and high numbers (>1,000,000 cells per litre) were recorded at the end of September in St. Austell Bay, Cornwall (Hiscock et al. 2016; UK Food Standards Agency 2020).
3.2 Western Channel Hindcast: IFREMER Model
The IFREMER model was used to simulate two events: one historical (2013) described in this section and one during the PRIMROSE project in 2020 (see section 3.6). A well documented bloom of K. mikimotoi occurred in the Channel in 2003, which resulted in mortality of many wild fish species. (Vanhoutte-Brunier et al. 2008) used an Eulerian passive tracer model to simulate this event with an older MARS3D configuration and concluded that apparent transport towards the coast must have been driven by progressive occurrence of favourable conditions for growth, and not by advection (since the tracer took a northward path). In this work, the new operational IFREMER model is used, which is an upgrade of the MARS3D system with several key improvements: increase in spatial resolution, thirty vertical layers (instead of twelve), a wider geographical domain and more rivers. Tracer transport is simulated with a Lagrangian instead of an Eulerian approach. The IFREMER model was initiated from and compared to the tracers released in (Vanhoutte-Brunier et al. 2008) (Figure 4A) In the IFREMER model (Figure 4B), from the initial release on 23 June, particles are transported westwards (see particle positions on the 7th of July) and then eastwards (see position of the particles on the 21st of July). The remote sensing data for the period shows the westward extension of the bloom matched by the particles (Figure 4C), but also bloom activity to the east. Unfortunately, cloud cover after the 13th of July hampered satellite imagery, which therefore could not provide information on the subsequent transport of the bloom. Comparing the overlap with the bloom area and the distance between the centroids of the shapes, the new model demonstrates that the separation between the centroids was much less than the estimate for the (Vanhoutte-Brunier et al. 2008) model (Figure 4 and Supplementary Material: Figure 3), since it captures the western movement, but the overlap of the polygons is not much greater since it does not capture the expansion to the east. The new run is also not able to reproduce the bloom reaching the French coast of Brittany by the beginning of August. The French Phytoplankton and Phycotoxin Monitoring Network (REPHY) counted 405 000 cells l-1 in the Saint-Brieuc Bay on the 15th of August 2003 (REPHY 2021). As suggested by (Vanhoutte-Brunier et al. 2008), our simulation also indicates that the Karenia cells found at Saint-Brieuc result from a coastal event related to local growth and not to the advection of the bloom observed offshore.
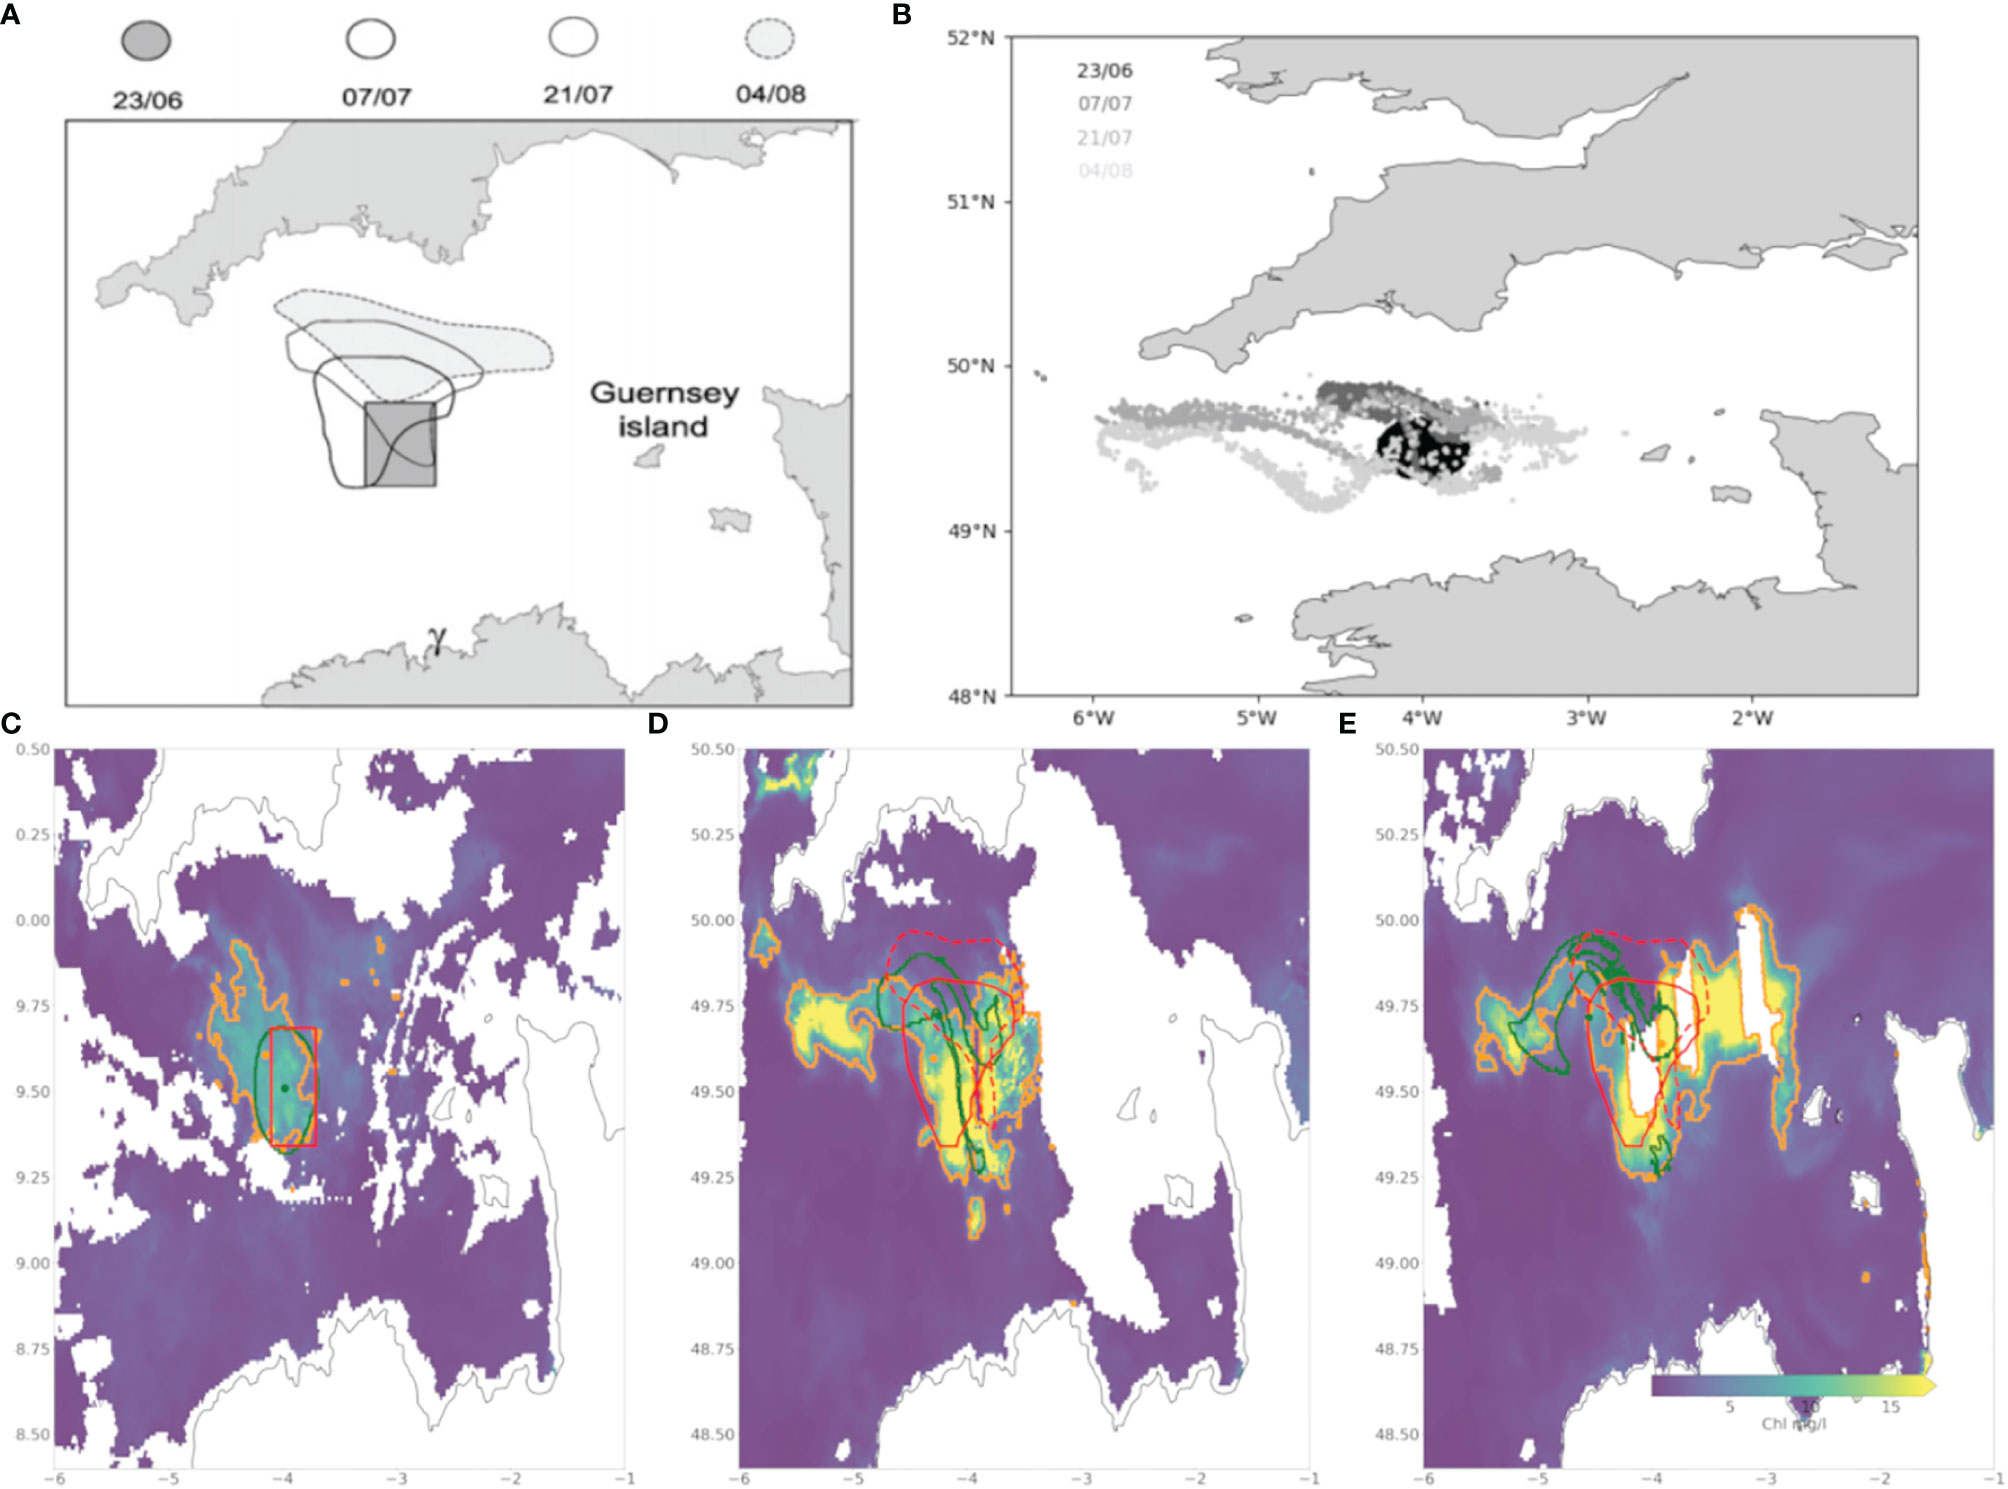
Figure 4 Advection of passive tracer in the 2003 K. mikimotoi bloom (A) represented with isolines of modelled tracer concentration plotted every two weeks (reproduced from (Vanhoutte-Brunier et al. (2008)). The MARS3D model configuration had a 4x4 km resolution and 12 sigma levels from the south of Brittany (47.5N, 5.6W) to north of the Rhine river plume (52.5N, 5.0W). Lagrangian advection from the same period B) observed with a configuration using a larger geographical domain and a higher vertical resolution (30 sigma layers). CCI remote sensing chlorophyll from the same period, showing three days when cloud cover was least (C - 2003/06/23, D - 2003/07/09, E - 2003/07/13). The positive area for the particle run is shown in green, tracer from (Vanhoutte-Brunier et al. (2008) are shown in red for 07/07 (solid) and 21/07 (dashed).
3.3 PRIMROSE Western France Hindcast: IFREMER Model
In the second event explored with the IFREMER model, a bloom of Mesodinium rubrum occurred in the Bay of Biscay during PRIMROSE. Mesodinium spp. is associated with blooms nearshore, in estuaries and embayments (Johnson et al. 2013; Trowbridge et al. 2017) and can persist for considerable periods (Crawford et al. 1997). A bloom was observed in spring 2020 at two local harbours (Oleron and Sables, Figures 5A, B respectively) and created considerable public concern due to water discolouration during the period of confinement due to COVID. The presence of M. rubrum was confirmed by the French HAB monitoring system REPHY, and this bloom was followed by the detection of Dinophysis spp. The ad-hoc operational model was run during this event to investigate the potential connection between the two sites. Particles were released at two locations on two different start dates: at Sables harbour where discolored waters were observed first to assess if there was an advective connection to the later observation at Oleron (05/04/2020 12:00). The second drift was initiated from Oleron, to estimate displacement of the bloom. Locations of particle release at Oleron were estimated from a satellite index of bloom (Normalized Difference Chlorophyll Index, NDCI as defined by (Mishra and Mishra 2012), values over 0.5 are considered as a blooming area) computed from a satellite product (Copernicus Sentinel 1A, 18/04/2020 10:56) (Figure 5D). Hydrodynamics were provided by a MARS3D configuration (horizontal resolution of 2.5 km) forced by ARPEGE-HR solutions (hourly, 0.1°, Meteo France).
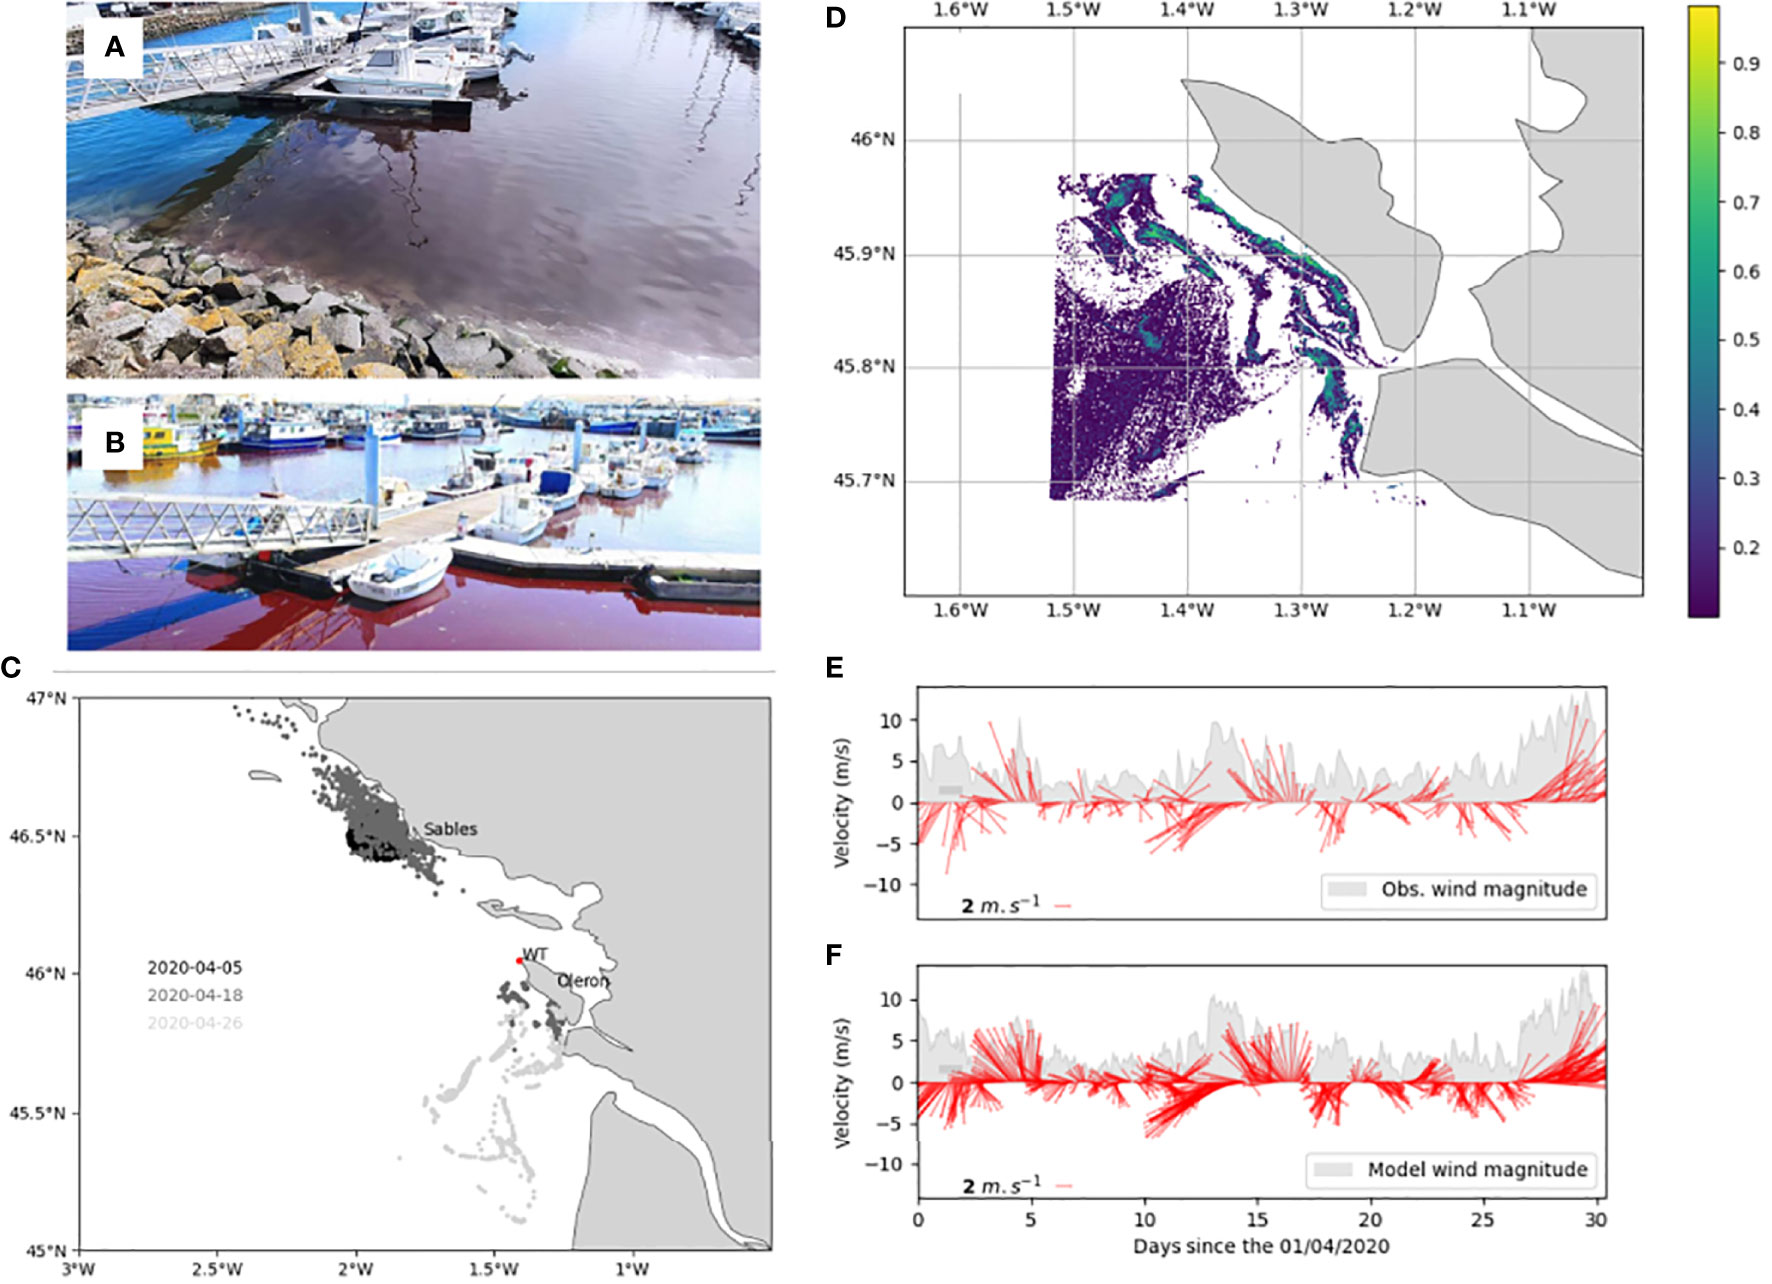
Figure 5 Mesodinium rubrum observed in the harbours at Sables (A) and Oleron (B) on 05/04/2020 and 11/04/2020 respectively. The simulated advection (C) from each of these start locations and dates is shown. The first release was from a point source in front of the Sables d’Olonne harbour (05/04) to see if there was a connective pathway between the events, and the second release (18/04 10:56) was based on a satellite index of bloom (D) Observed winds from the meteorological station Chassiron (WT) [10 min average, (E)] are compared to forcing winds [minute frequency, (F)] for the same location. Forcing winds were interpolated from ARPEGE-HR solutions (hourly frequency).
Particles released at Sables were not advected to Oleron area (Figure 5C), which suggests the bloom was spread over a larger area. In the same figure panel, we can see that particles released from Oleron strongly drifted offshore after 8 days, possibly driven by a short period of strong offshore winds after the 18th of March (Figures 5E, F).
3.4 West Iberia Hindcast: IEO Model
The autumn 2013 Dinophysis acuta event on the northern Portuguese coast and Galician rías was the most intense since 2005 (Díaz et al. 2016), and D. acuta appeared together with D. acuminata. The HAB caused the closures of most of the harvesting polygons in the area for several months including the Christmas period, one of the most profitable of the year. The along-shore transport of D. acuta from the Portuguese shelf to the Galician rías has been described as the cause of sudden autumn blooms (Escalera et al., 2010; Pitcher et al., 2010; Díaz et al., 2016). D. acuta blooms usually occur in the summer in the shelf off Aveiro and get transported northwards. Several events of D. acuta autumn transport to the Galician Rías have been described, particularly those in 2005 and 2013 (Díaz et al., 2016). Table 2 summarizes the timeline of the sequence of closures from Portugal to the Galician bivalve harvesting polygons in 2013.
Lagrangian modelling studies of the 2013 event have been previously carried out (Ruiz-Villarreal et al. 2016; Silva et al. 2016; Moita et al. 2016) to try to elucidate if advection could explain the transport of D. acuta and the timing of closures from Portugal to the Galician rías. All model exercises predicted northwards transport, although no detailed analysis of the impact of the model configuration in the predicted particle transport was performed. In this paper we revisit this HAB event to evaluate the impact of using hydrodynamic models of different resolutions and configurations to force the Lagrangian model. We used four different model configurations: the IEO RAIA in the parent 4 km grid (IEO RAIA) and the child 1 km grid (IEO RAIA nested); the IEO BIO 3.5 km grid and the MeteoGalicia 2 km operational forecast configurations. Model set ups differ in the extent of the model domain (see Figure 1) and also in forcing at the open boundary (RAIA is forced with a climatology and IEO BIO and MeteoGalicia with Mercator), and river input.
Figure 6B shows the release of particles at the Portuguese polygon close to Aveiro the 17 th of September 2013 (blue particles), the date for which the maximum concentration of D. acuta was detected at Aveiro (Table 2). One week later (the 24 th of September 2013), the particles were mostly located to the south and offshore the initial release position (red dots), due to the dominant upwelling winds (Figure 6A). This dispersion to the south is higher in the coarser resolution models (Figure 6B, IEO BIO and IEO RAIA). Note that in the case of the finest model resolution (Figure 6B, IEO RAIA nested) the particles did not displace further south because of the size of the model domain (see Figure 1).
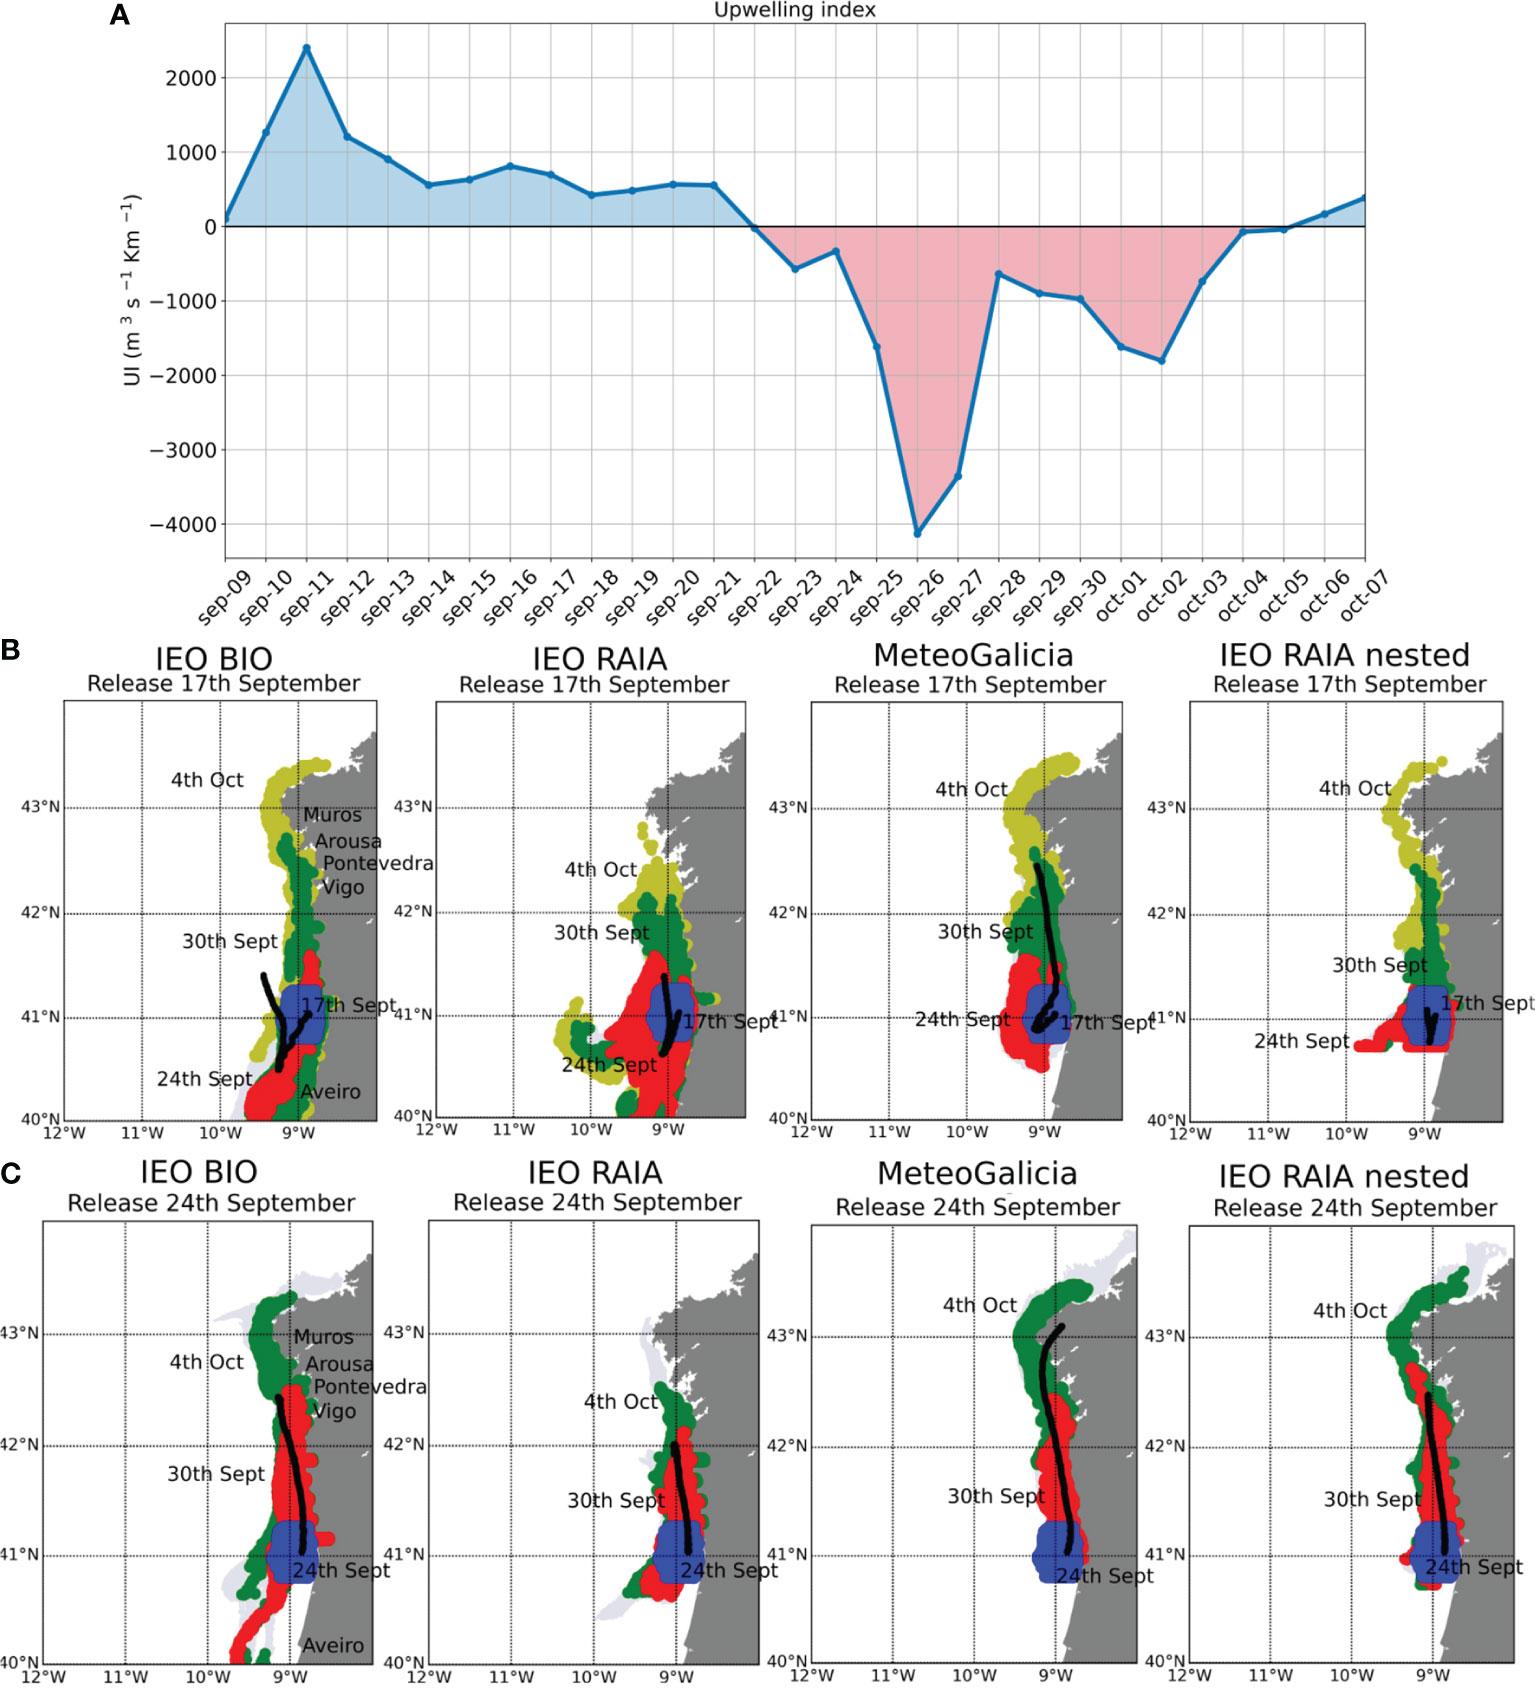
Figure 6 Upwelling index for the September 2013 hindcast (A). Particle positions at different dates after being released in different areas on the 17th of September (B) and on the 24th of September (C). Black lines mark the trajectories of the Center of Gravity (CG). Column 1: IEO BIO model, 3.5 km resolution; Column 2: IEO RAIA model, 4 km resolution; Column 3: MeteoGalicia model, 2 km resolution and Column 4: IEO RAIA nested model, 1 km resolution.
After the 24th of September 2013, strong downwelling conditions prevailed in the area (Figure 6A), which explains the northward transport of particles that reached the south of Ría de Vigo on the 30th of September 2013 (green particles in Figure 6B) in the case of the IEO RAIA configuration, and further north in the case of the IEO BIO, MeteoGalicia and the high-resolution configuration (IEO RAIA nested). The average transport northward is higher in the case of the mid-resolution model MeteoGalicia (as shown by the trajectory of the CG (black line) in 6B) because the transport to the south under upwelling conditions the previous week was less intense than in the coarse resolution models IEO RAIA and IEO BIO. The same happened in the case of the high-resolution model IEO RAIA nested, but in this case it was affected by the limits of the model domain.
Finally, on the 4th of October, when the polygons started to close in the north of Portugal and the southern Galician Rias, we can see that all the models show particles (yellow in Figure 6) located at the mouth of every ria and even further northwards in the case of the IEO BIO, MeteoGalicia and IEO RAIA nested models. Hence, the results shown here are compatible with the sequence of events compiled in Table 2.
Figure 6C illustrates the position of the particles in the first and second weeks after their release close to Aveiro the 24th of September (blue particles). In this case, downwelling conditions were dominant (Figure 6A), and just one week later (30th of September, red particles), the particles are close to the mouth of the ria de Vigo for the IEO RAIA model (Figure 6C, second column), up to ria de Arousa for the IEO BIO and the MeteoGalicia models (Figure 6C, first and third columns) and up to ria de Muros in the case of the IEO RAIA nested domain (Figure 6C, fourth column). The 4th of October (two weeks later, green particles), the particles are occupying the mouths of all the rías, except Muros, when using the IEO RAIA model as forcing. With the IEO BIO configuration, particles move further north (up to Malpica) and, in the case of the MeteoGalicia and IEO RAIA nested models, the particles reach up to the Artabro Gulf. These results are also compatible with the sequence of events described in Table 2 and do not differ much from those for the 30th of September and 4th of October in Figure 6B, although in the latter case, the density of particles reaching the Galician Rías would be higher, since the transport was always in the same direction and confined onshore. This is clear in the trajectory of the CG (black line), which shows a northward transport for all the configurations, with the MeteoGalicia model showing the longest transport and the IEO RAIA the shortest. Figure 6 illustrates that the mechanism of northward transport from Portugal persisted over several weeks.
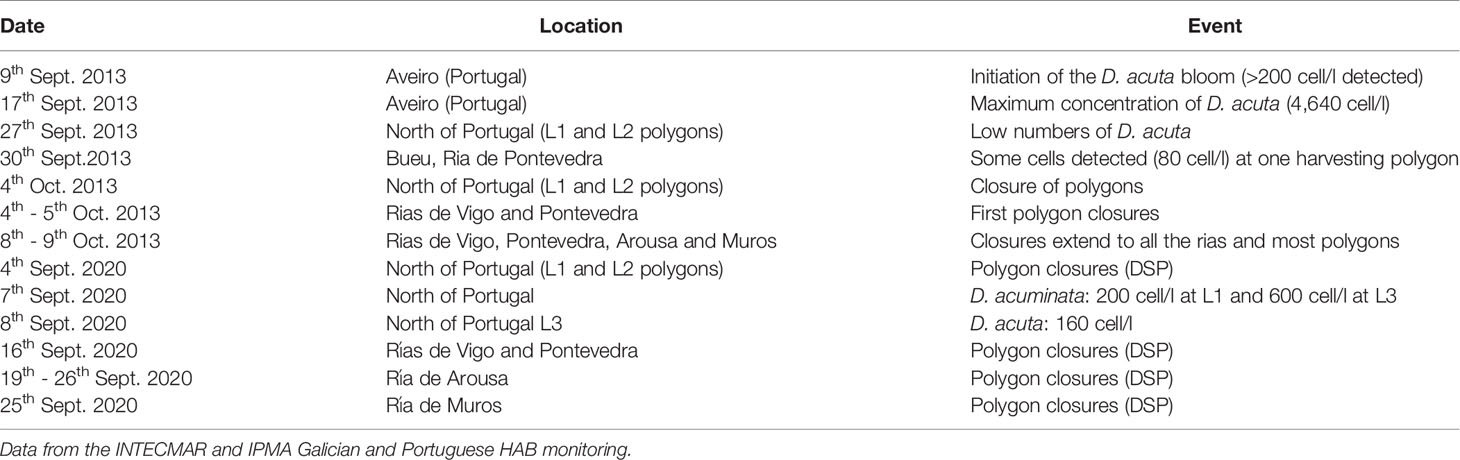
Table 2 Sequence of events: D. acuta event 2013 and D. acuta and D. acuminata event 2020 at Portugal and Galician Rias.
The effect of the different hydrodynamic model configurations on the particle transport is summarized by means of some Dispersal Kernel indices in Table 3 for the 17th and the 24th of September 2013 releases. These indices give an idea of the particle dispersion. For instance, if we consider the simulations starting the 17th of September, we see that the IEO RAIA configuration is the one producing the highest dispersion of particles (highest PA=13,750 km2), followed by the IEO BIO (PA=13,575 km2) and the IEO RAIA nested (PA= 6,850 km2) and MeteoGalicia (PA= 6,800 km2) models. This is clearly reflected in Figure 6B, where we can see that the IEO BIO and IEO RAIA configurations produce a southward transport of particles first, followed by a northward transport, which results in a larger area occupied by the particles. The MeteoGalicia configuration, which is run in a model domain as large as IEO RAIA (Figure 1), does not produce the initial movement of particles southwards, which results in a smaller occupied area and an overall transport further away from the mean initial location in the northward direction (compare the trajectories of the CG, black lines in Figure 6). The particles are also more homogeneously distributed when using the IEO RAIA configuration (highest EA). The CV indicates the existence of more homogeneous densities (lower values) or aggregates (higher values), meaning that the IEO BIO configuration produced more aggregates (CV=6.1), followed by the IEO RAIA (CV=4.51) and the MeteoGalicia (CV=3.94) configurations. In terms of mean distance between the mean particle origin and the mean particle end, it is the MeteoGalicia model the one that shows higher values (159.8 km), followed by the IEO BIO (65 km) and the IEO RAIA (42.5 km). The indices for the IEO RAIA nested model are influenced by the fact that the particles get accumulated in the southern limit of its domain (see Figure 1) during the first days of the simulation, which results in a PA similar to the MeteoGalicia model, but with much higher aggregation (CV=10.34).
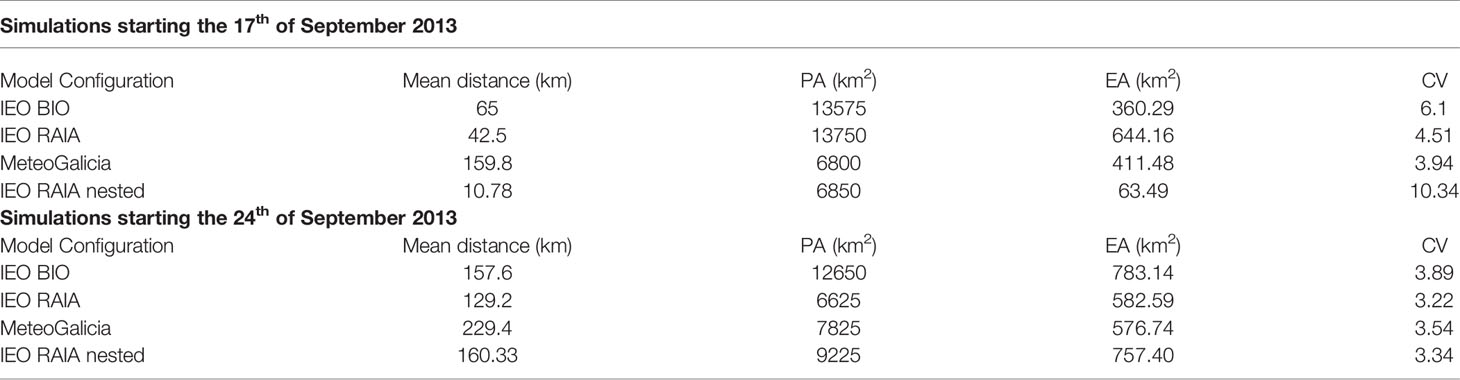
Table 3 Dispersal Kernel indices [Mean Distance, Positive Area (PA), Equivalent Area (EA) and Coefficient of Variation (CV)] for the different model configurations run in the 2013 HAB event in W Iberia.
For the simulations starting the 24th of September 2013, the IEO BIO shows the highest dispersion (PA=12,650 km2) due to a number of particles being transported southwards. In the remaining configurations, this southward transport is minimal (IEO RAIA, IEO RAIA nested) or non-existent (MeteoGalicia) and the dispersion area increases with resolution. The degree of aggregation is similar in all the configurations (CV around 3), although slightly higher for IEO BIO. The longest mean transport (229.4 km) corresponded to the MeteoGalicia configuration (which did not show southward transport at all), followed by the highest resolution model (IEO RAIA nested, 160.33 km), for which the mean distance was similar to the IEO BIO model (157.63 km).
3.5 PRIMROSE Forecasts in Galicia
During PRIMROSE, a transboundary event involving a proliferation of Dinophysis acuta and Dinophysis acuminata that lead to harvesting polygon closures in North Portugal and the Galician Rías in September 2020 was investigated using the IEO early warning system, forced by the ROMS MeteoGalicia forecast model. Table 2 summarizes the time sequence of toxic phytoplankton and biotoxin measurements during this event, together with the dates when closures were enforced by the regulatory authorities. Figures 7A, B show the evolution of the concentration of D. acuminata and D. acuta, respectively, during the month of September 2020, and Figure 7C depicts the concentration of DSP biotoxin. The DSP toxin was already above regulatory threshold permissible level (160 μg/kg) in the first week of September in Portugal (caused by D. acuminata), as well as in some polygons in Ría de Pontevedra, which were already affected for several weeks due to the presence of both species of Dinophysis (Table 2). The second week of September (second column Figure 7), some polygons at the mouth of Ría de Vigo exceeded the DSP threshold, but it is during the third week (third column) when high concentrations were measured inside the ría causing most of the polygon to be closed due to the accumulation of both species. In the following week (fourth column), D. acuminata and D. acuta blooms closed polygons in the Rías de Arousa and Muros.
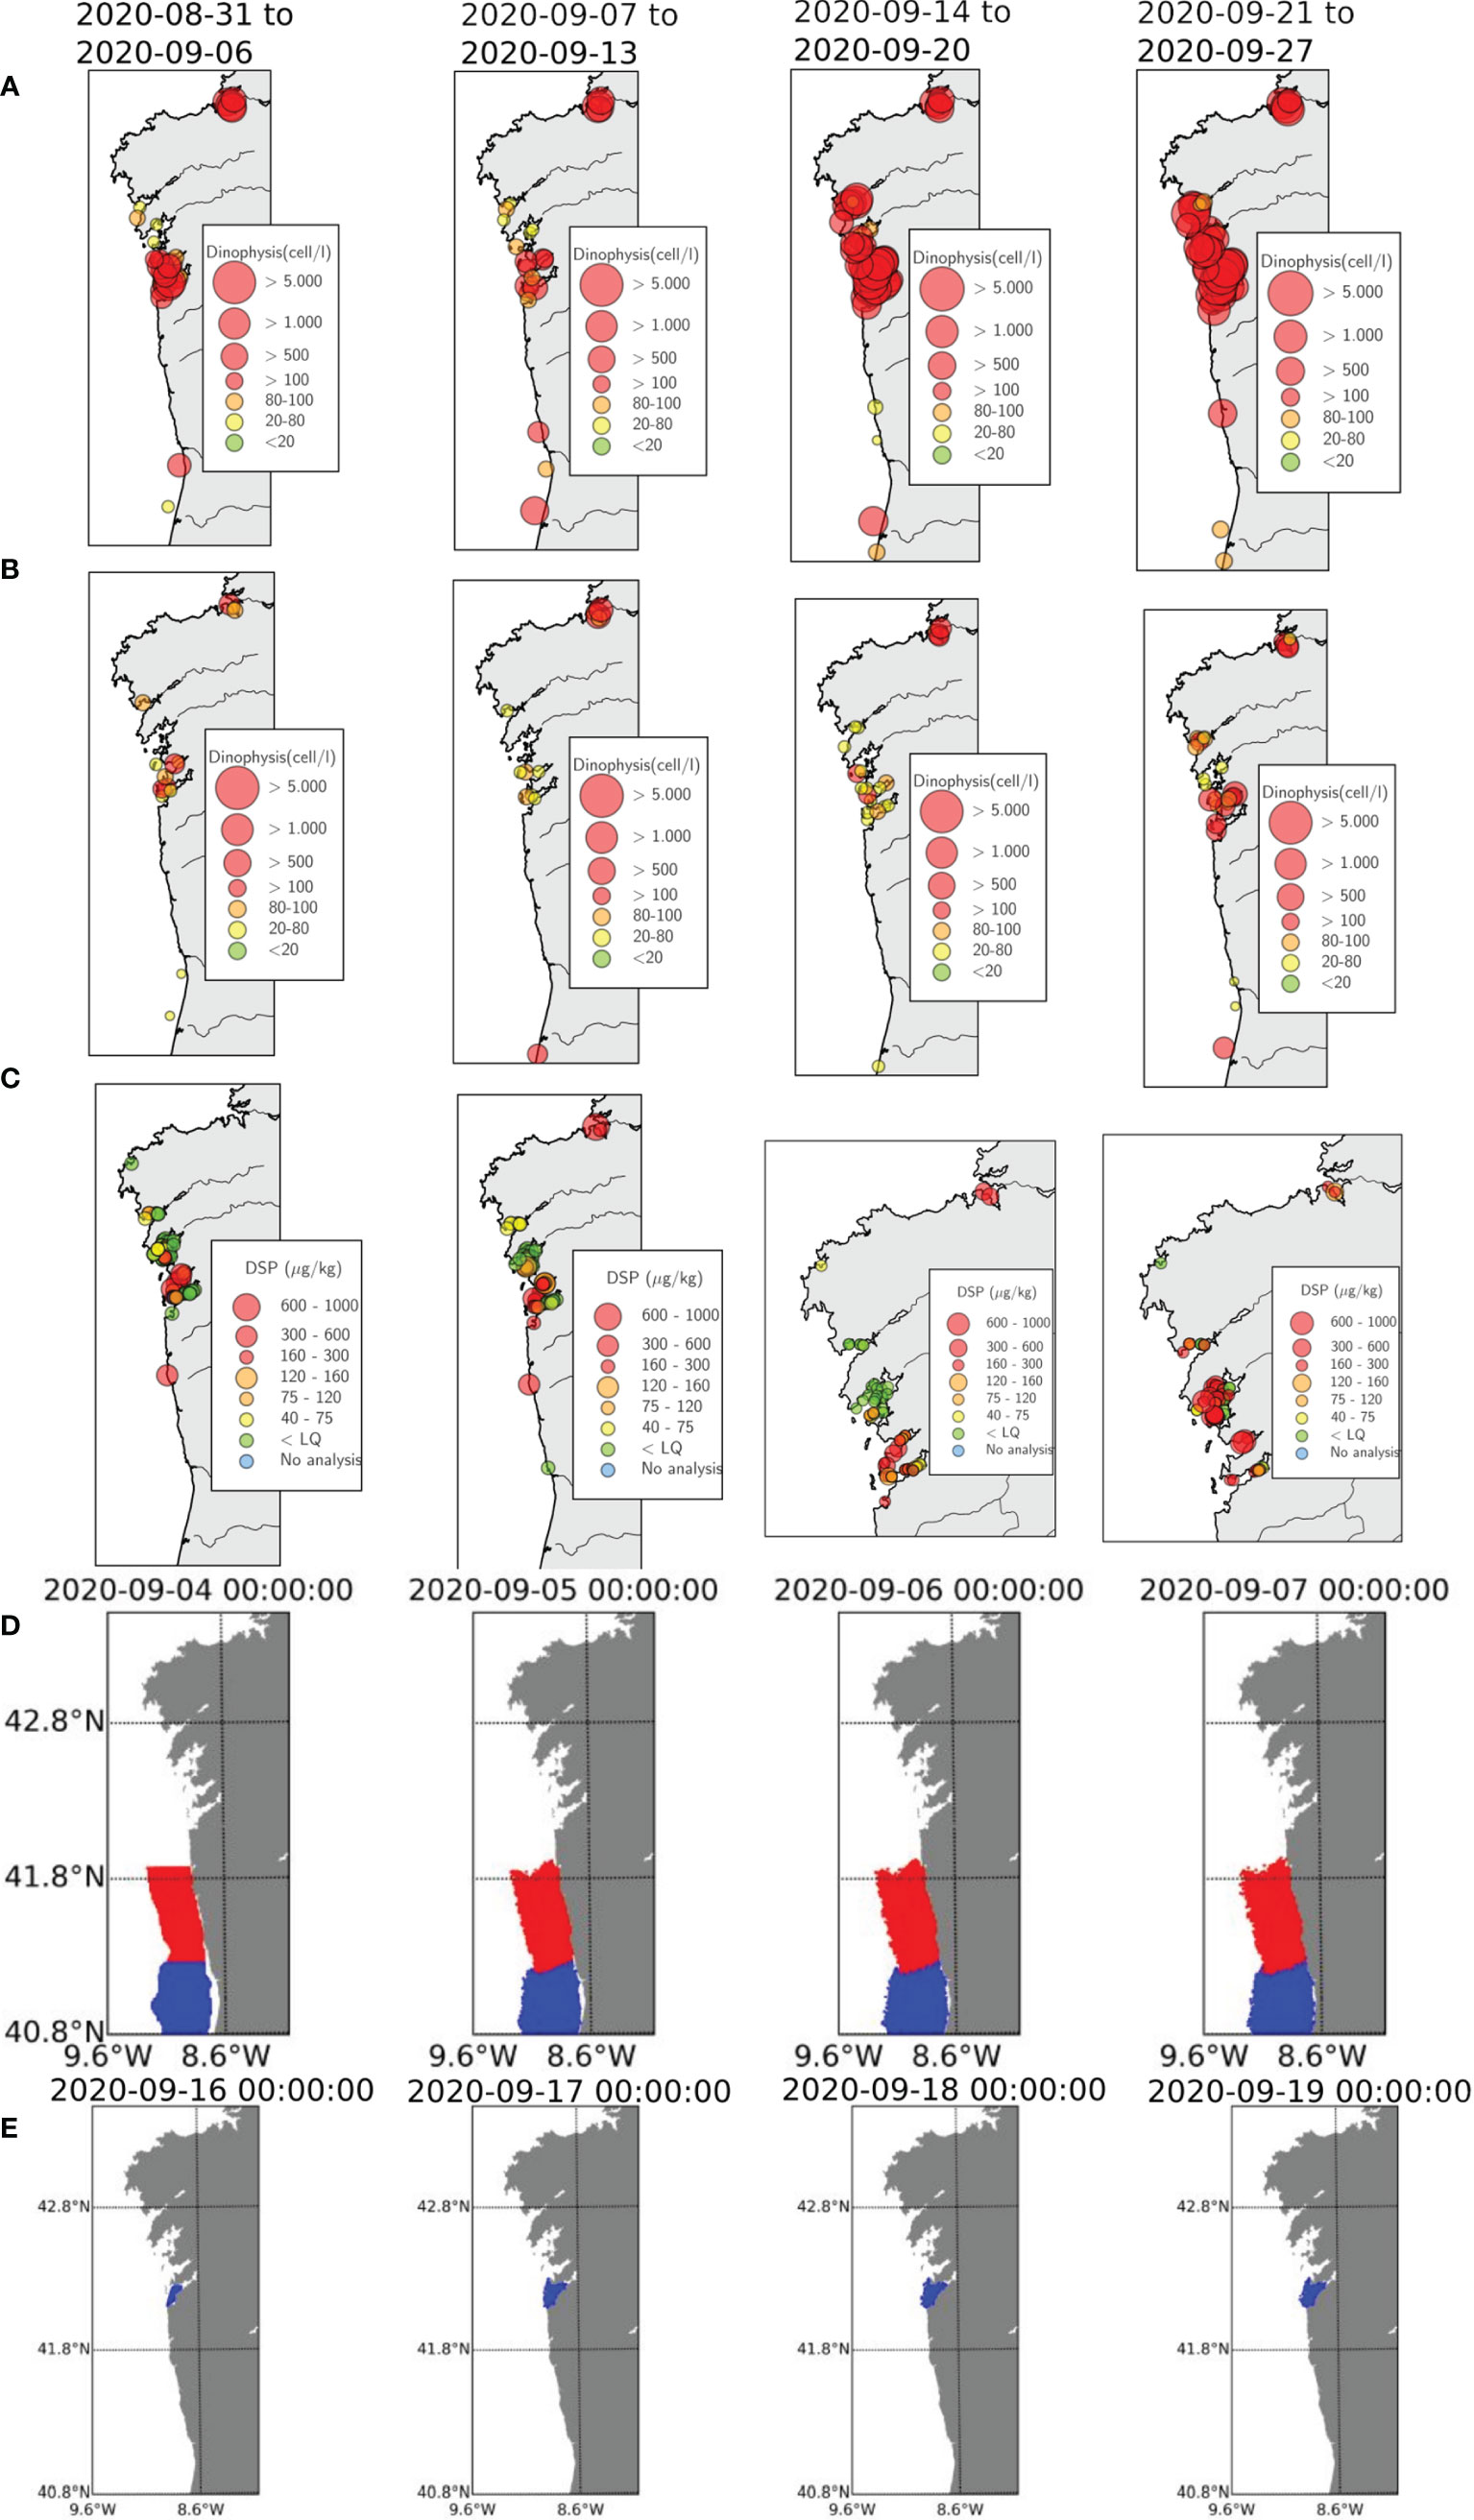
Figure 7 Results of the PRIMROSE forecast and data from the weekly Galician and Portuguese monitoring programs in September 2020: (A) Dinophysis acuminata (B) Dinophysis acuta and (C) DSP toxins (no data available in Portugal during the last two weeks). (D) Particles released in Portuguese areas from 4-7 September (E) Particles released in the Ria de Vigo from 16-19 September.
The IEO early warning system was used to investigate whether: a) there was a potential transport from the Portuguese shelf to the Galician Rías and this caused the closures of harvesting areas and b) the sequence of closures from south to north in the Galician Rías was caused by exchange between adjacent rías.
The upwelling index evolution from the 4th of September, when the first polygons were closed in North Portugal, shows that winds were upwelling favourable and relaxed around the 8th of September (Figure 8B) during neap tides (Figure 8A). The Lagrangian model forecasts for the 4th of September do not suggest northward transport on the Portuguese shelf (Figure 7D), and neither do the forecasts for the subsequent days before the closures in Ria de Vigo after the 16th of September (not shown), probably due to the rather calm wind conditions. Polygon closures extended from Vigo to Arousa from the 16th of September onward, just a few days after the occurrence of neap tides and still under rather calm wind conditions (Figures 8A, B). The results of the Lagrangian forecasts for the 16th of September at Ría de Vigo (Figure 7E) show that particles mostly remained confined inside the ría, and that the exchange with Ría de Pontevedra and the rías further northwards was unlikely, based on the model results.
Just a few weeks after the polygon closures, conditions changed and most of the closed polygons in Rías de Vigo, Arousa and Muros reopened between the 9th and the 17th of October. Figures 8A, B show that this was a period of neap tides under strong upwelling conditions. Upwelling conditions are favourable for the offshore transport, and hence the outflow and exportation of toxic cells, which would produce a “cleaning effect”. Figures 8C, D show that D. acuminata and D. acuta concentrations reduced during that period, except for Ría de Pontevedra, where D. acuminata persisted. The reduction in the DSP biotoxin throughout October is clear in Figure 8E for all the rías, except Pontevedra. The IEO early warning system predicted conditions of transport outside the rías (see Figure 8F for Ría de Vigo), and concluded that polygon re-openings were likely. Forecasts of trends to open/close of harvesting areas are another service provided by the forecasting system, already demonstrated in ASIMUTH project (Maguire et al., 2016; Ruiz-Villarreal et al., 2016; Silva et al., 2016).
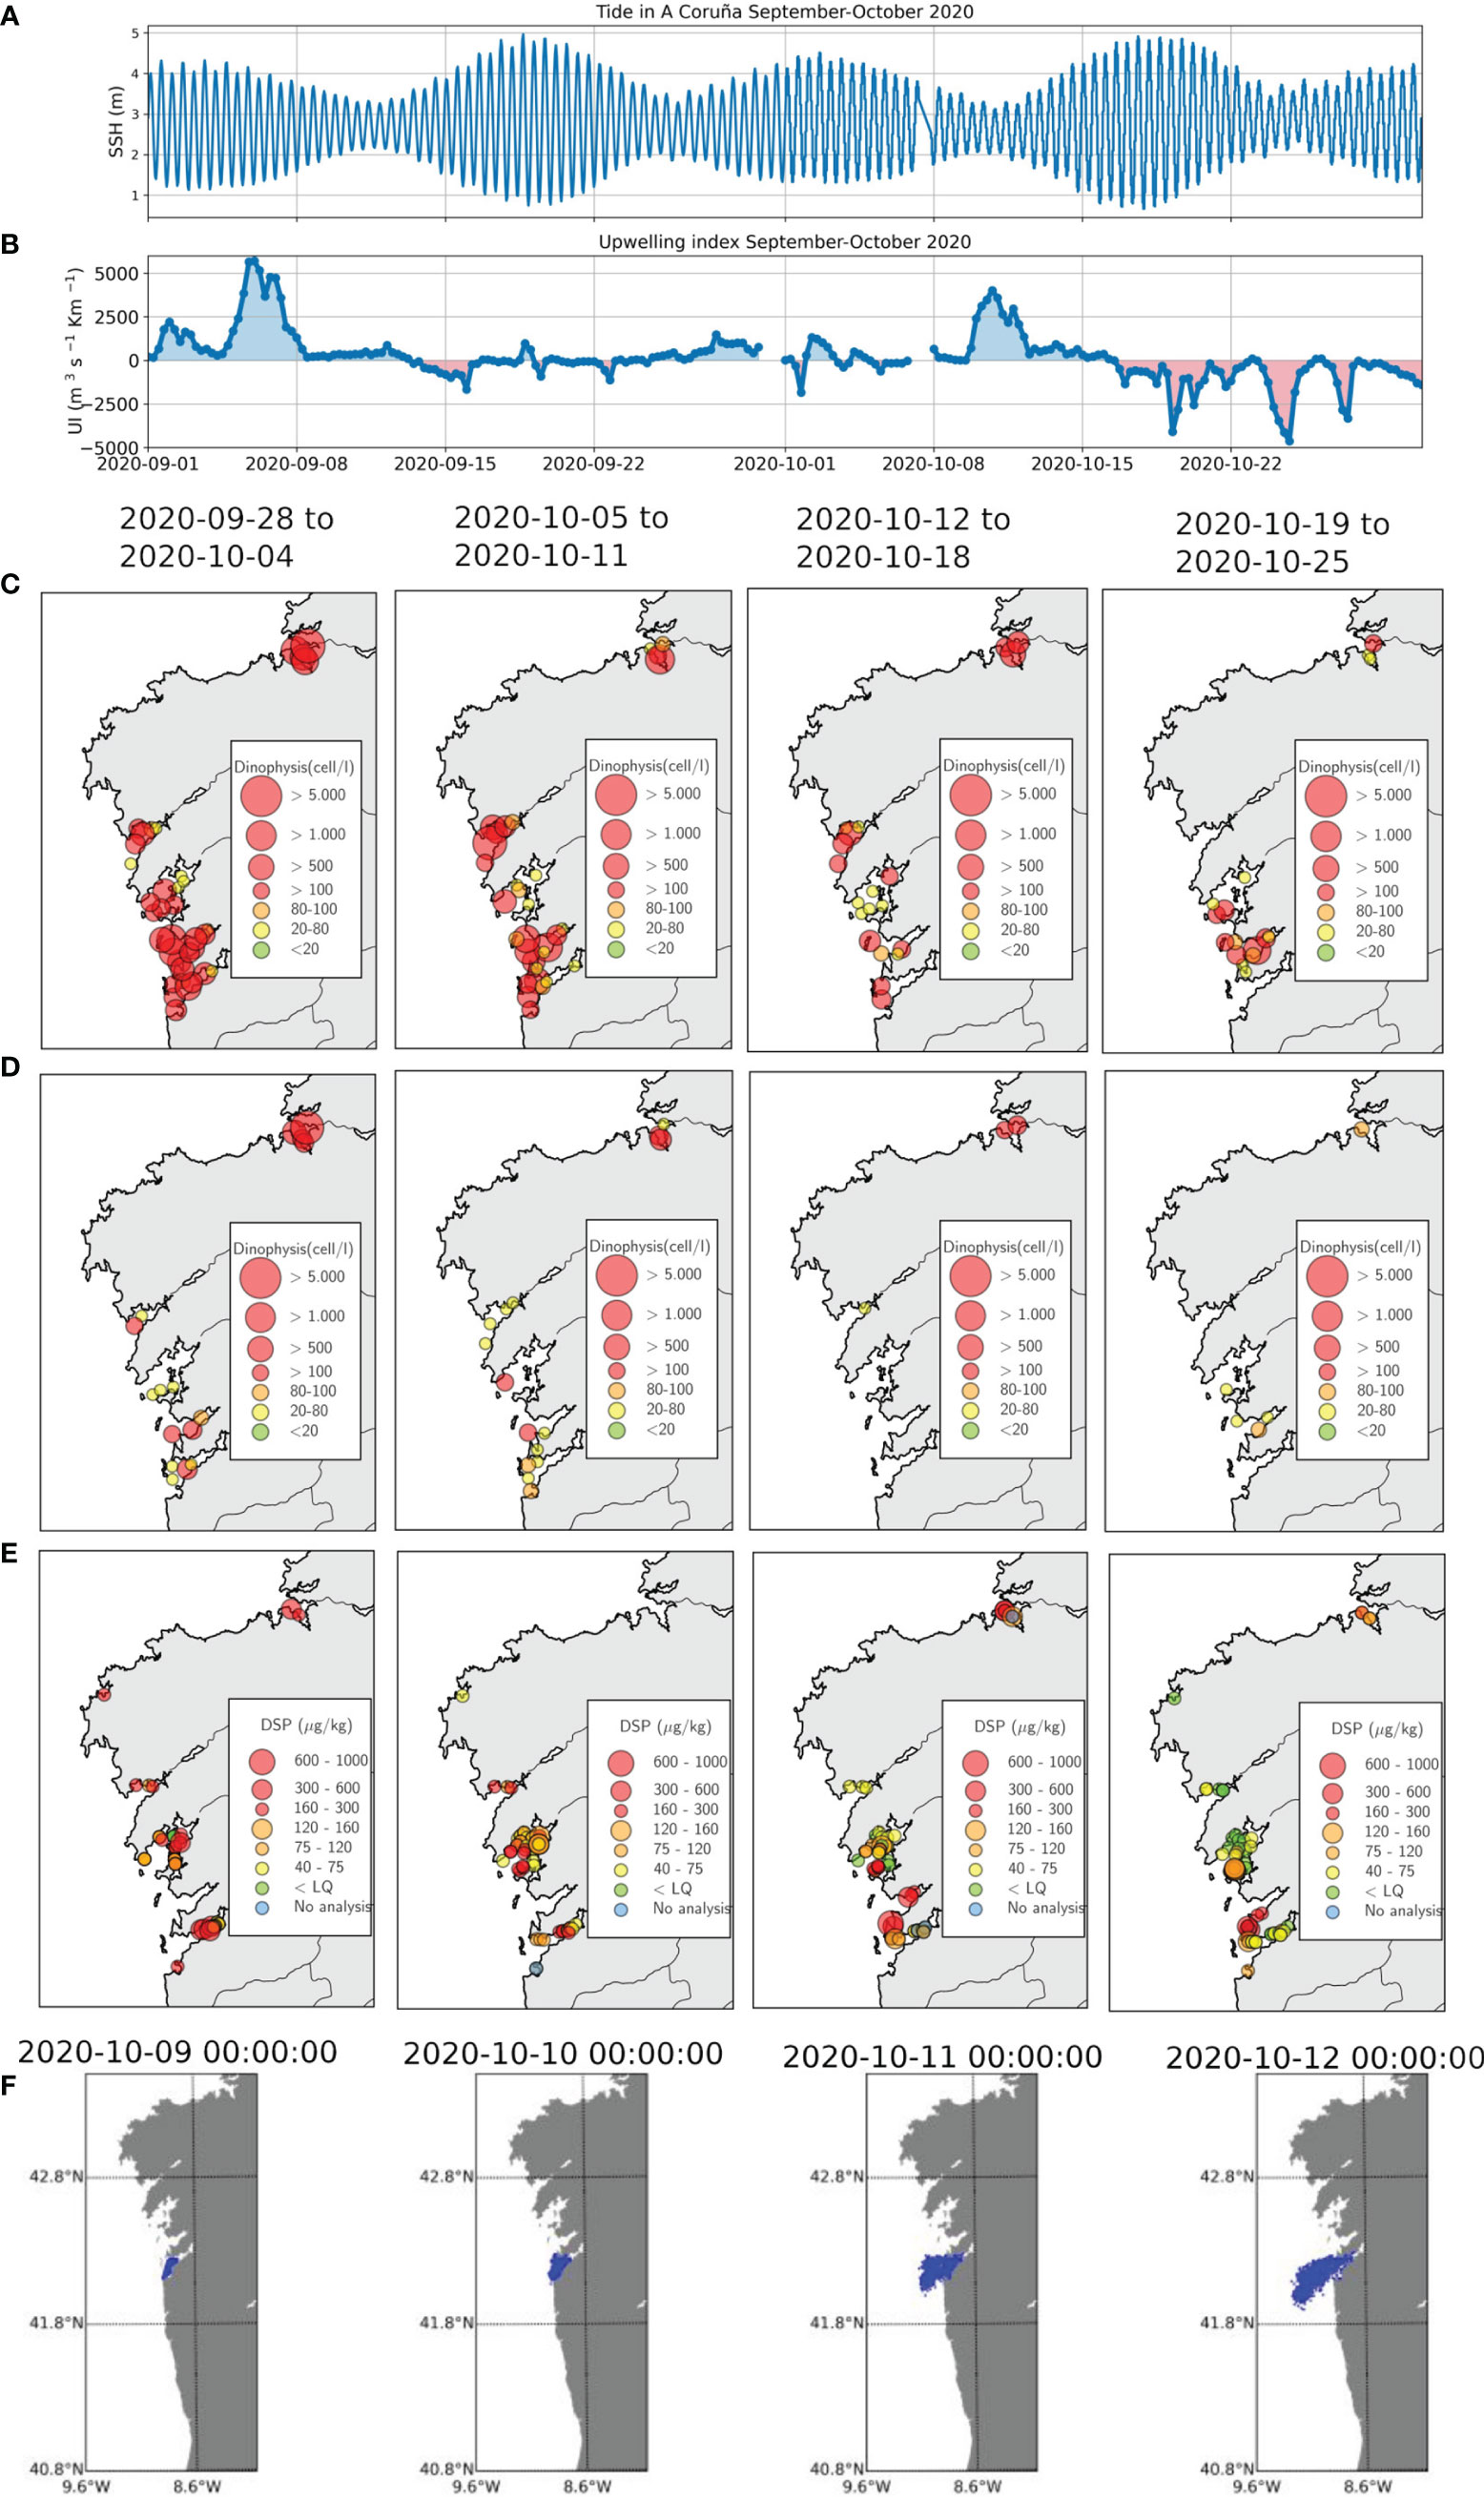
Figure 8 Results of the PRIMROSE forecasts and data from the weekly Galician monitoring program in October 2020: (A) Tides at A Coruña in September-October 2020, (B) Upwelling index in September-October 2020 (C) Dinophysis acuminata (D) Dinophysis acuta and (E) DSP toxins (F) Particles released in the Ria de Vigo from 9-12 October.
3.6 PRIMROSE Forecasts in the Channel: PML-IFREMER Model Comparison
A potential large bloom was spotted in the Channel region in June 2020 during PRIMROSE and since it incurred on both PML and IFREMER model domains, model runs using both the PML and IFREMER (2.5 km) model frameworks were undertaken. The full operational setups as described in section 2.1 were used. The identification of the bloom came from the algorithmic Karenia spp. risk identification from satellite images based on algorithm by (Kurekin et al. 2014) introduced in the section 2.1.1. The HAB risk map in the PML HAB Risk portal1 shows the composite image over several days. However, for sensible comparison to the higher time frequency involved with advection, the respective model runs were compared to the algorithm output from individual passes of the satellite products (Figure 9). Unfortunately, whilst the initial satellite images were clear and the algorithm was able to identify a HAB, the following days were affected by cloud coverage. In any case, the eastern part of the bloom remained in the visible part of the images and thus, the satellite could be used to assess the skill of the two models.
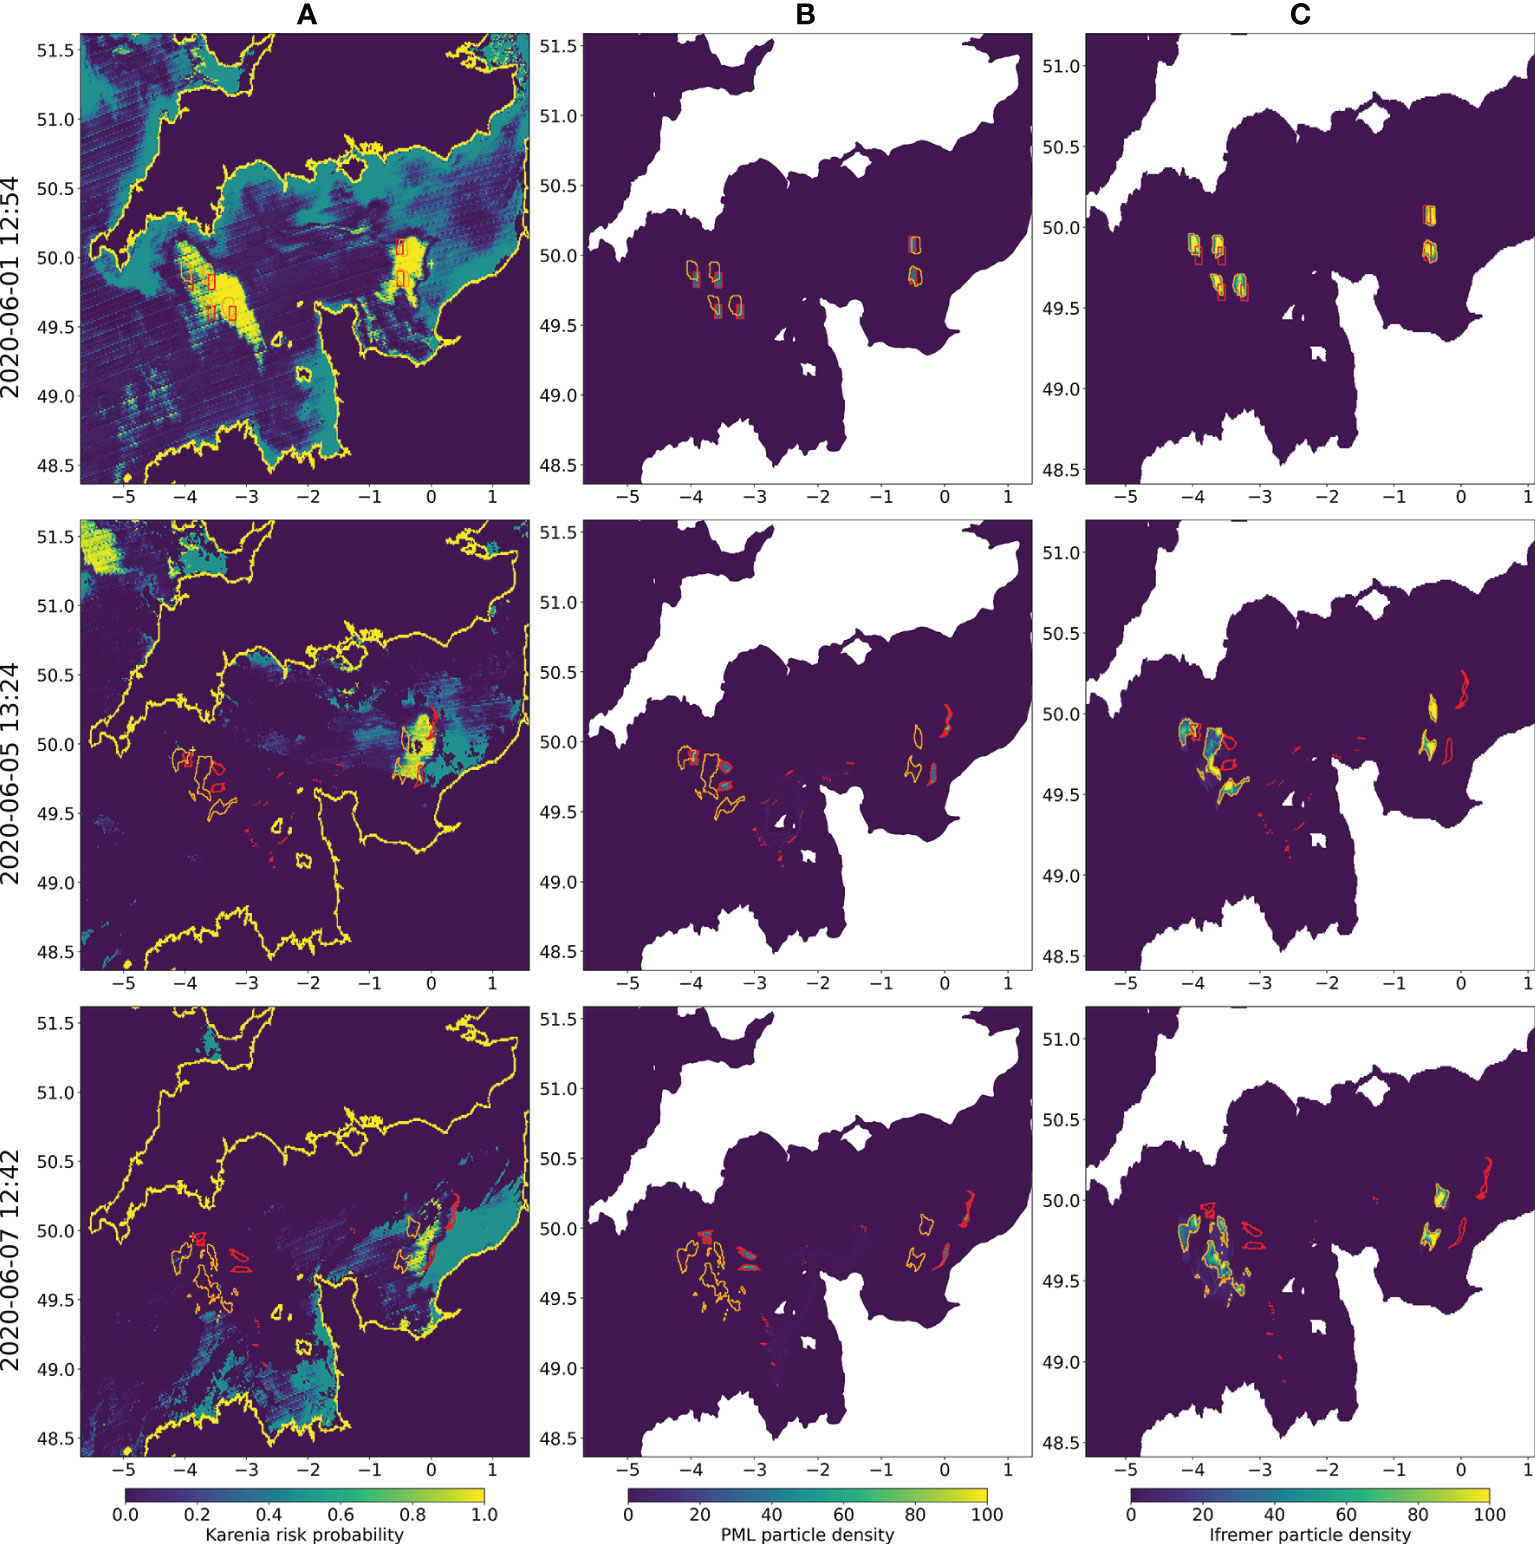
Figure 9 Comparison of HAB risk from remote sensing (A) and particle densities for PML model (B) and IFREMER (C), on selected days with clearer satellite image of Karenia risk (2020/06/01 12:54, 2020/06/05, 2020/06/07). The polygons of high particle density for PML model (red) and IFREMER (orange) are shown in each panel.
Both models were started from points the operational HAB risk algorithm deemed as high risk. The PML model shows a much greater spread of particles from the western starting positions, where they reach the higher velocity currents around the Channel Islands, and also a closer incursion towards the coast from the eastern starting points. The significant difference driving this is that the offline forcing of the IFREMER Lagrangian model in this case is saved at a daily resolution, so tidal frequency is not resolved (though will include underlying tidal features in the hydrodynamical model).
4 Discussion
The Lagrangian drift models presented here attempt to fulfill the need of short term forecasting of HAB blooms primarily aimed at aquaculture users (Cusack et al., 2016; Ruiz-Villarreal et al., 2016; Silva et al., 2016). We have looked at operational HAB models from the PRIMROSE project and compared them to observed blooms, in particular to see how applicable advection alone is to the short term prediction of HAB movement and how model setup might impact on the results of transport models.
4.1 Advection of High Biomass Blooms Simulated With Lagrangian Particle Tracking Models: Strengths and Uncertainties
Several case studies were focused on high biomass blooms such as those of K. mikimotoi in the Western Channel with the objective of evaluating how a short term advective only forecast performs. K. mikimotoi is frequently present in the summer phytoplankton community in the Channel (Widdicombe et al., 2010) and it is thought to be responsible for occasional mass finfish and benthic mortalities (Barnes et al., 2015). In sections 3.1, 3.2 and 3.6, Lagrangian particle trajectories were compared to satellite imagery following the metrics described in section 2.3.1.
Remote sensing products have several challenges for direct use in model comparison. Firstly, remote sensing is not a perfect measure of a bloom, especially for toxic species. K. mikimotoi for example is known to produce a thin layer which may not show up on satellite imagery (McManus et al. 2008; Brand et al. 2012), and nearshore chlorophyll measurements will be affected by sediments (Le et al. 2013). Also, Karenia species cell colouring imply that they have reduced reflectance, which makes it hard to identify species and will likely under count concentrations, especially once cell concentrations are above 104 cells 1-1 (Hu et al. 2005; Cannizzaro et al. 2008). Whilst studies have used chlorophyll products to study K. brevis blooms e.g. (Redalje et al. 2008), the Normalized Fluorescence Line Height (NFLH) product was shown to give better results (Hu et al. 2005; Cannizzaro et al. 2008; Tomlinson et al. 2009). In a review of various different approaches, (Soto et al. 2015) found further improvements when combined with other products, determining the Rrs - NFLH method using NFLH and the 555nm reflectance to perform best for identifying Karenia blooms. However, for these events coverage with chlorophyll-a products was better than the NFLH and 555nm product, and when comparing to available scenes from NFLH and Rrs - NFLH (Supplementary Material: Figures 4, 5), the chlorophyll product shows a very similar bloom evolution. In this study, since we have identified the species from available in-situ observations and we are concerned with the bloom shape and movement rather than absolute concentrations, the use of a chlorophyll product is less problematic.
Another issue related to remote sensing is that data availability is variable due to cloud cover. This can be mitigated with the use of composites of several days together or interpolation between days of data availability. Here we are concerned with short time scale advection and hence, products composited over a longer period of time will average out this movement. Interpolated products should not have this problem, but must use some extra technique to fill in the gaps, for example using a hydrodynamic model [(Lin et al. 2021), this issue] or machine learning (Vandal and Nemani 2019) to produce intermediate images, which may itself introduce spurious movement. Here we decided to be conservative and only use products which are either daily composites or individual scenes, omitting days with high cloud cover (>30%), to ensure we are comparing to actual bloom development.
Despite these concerns, remote sensing products provide a spatial and temporal coverage of potential HAB events that cannot be achieved by alternative methods. For example, in-situ sampling requires structured field campaigns e.g. (Velo-Suárez et al. 2010) and has to be fortunate enough to coincide with a bloom [e.g. Jordan et al. 2021, this issue]. Opportunistic measurements, such as FerryBoxes provide only limited spatial resolution (Qurban 2009; Hartman et al. 2014), which is not sufficient to understand the advective component of mid-channel blooms. In future it is possible these limitations will be overcome by responsive sampling by unmanned platforms [e.g. as demonstrated by Ruiz-Villarreal et al. 2022, this issue].
If we assume that the remote sensing data provided an accurate representation of bloom development, then in both examples from the PML model (sections 3.1 and 3.6) the latter part of the bloom evolution was better forecast than the initial movement. In both cases the efficacy of the forecast dropped rapidly in the first five days after initialisation, as demonstrated by the various metrics applied for comparing particle model results and satellite data. The difference between the initial and latter movement could represent a period of rapid growth followed by advection, which would fit with rapid onset in the order of a few days followed by a maintenance phase that has been observed in some HAB species (Redalje et al. 2008; Aoki et al. 2012), and with the apparent change in surface area of the bloom during this period, though the latter could also be a consequence of diffusive processes. Onset here refers to onset visible on the remote sensing data; there may be prior activity at the subsurface or with a low chlorophyll content and hence not detected by the satellite, but this would be beyond the scope of a remote sensing triggered forecast system. If this scenario of growth during the early stage of a bloom followed by advection was the case, it would suggest that a forecast system based only on the advection of passive particles such as the one described here would not account for all the processes involved, and that adding some biological behaviour to the particles would improve the representation of the bloom evolution. In this respect, the individual-based modelling of the development and transport of the strong 2006 K. mikimotoi bloom in Scotland reported in (Gillibrand et al. 2016) showed the potential benefit from better parameterisation of temperature dependence of both growth and mortality, albeit over a longer time frame. Their simulations clearly also showed the importance of advection in HAB transport and they conclude that their results would be improved by improvement of spatial and temporal resolution of the underlying hydrodynamical model, which agrees with our conclusions. Additionally, models aimed at predicting the onset of blooms using sea surface temperature and wind indices (Cusack et al. 2015; Karki et al. 2018) could be included to indicate the reliability of a short term advective forecast at a particular time.
Another possibility is that the advection was poorly forecast in the initial stages compared to the latter, due to some change in the physical conditions. Wind conditions can play an important role both for onset - for mid channel blooms low wind speeds are a factor in K. mikimotoi bloom formation (Gentien et al. 2007) - but also for its impact on advection itself. Direct and indirect wind forcing (the latter via wind waves) are key to predict surface advection (Röhrs et al. 2021). The PML model does not account for the Stokes drift, the resultant Lagrangian transport from surface waves, and this can be a significant component of drift. The highest frequency components drive the largest drift effect at the surface of the water, and are often wind waves (Röhrs et al. 2014; Tamtare et al. 2021). The wind speeds during both years were modest, though in the latter portion of both years after the second release, wind speeds were lower than during the initial period (Figure 10), which could suggest that either the advection is less well predicted during higher wind or the bloom dynamics are different.

Figure 10 Wind velocities during the PML model drifts in 2010 (A) and 2015 (B). In both years the red line indicates the first particle release and the blue the second.
4.2 Impact of Hydrodynamic Model Configuration in Particle Transport
We have presented several examples in which differences in model resolution and in other details of model configuration strongly influence particle dispersion and consequently HAB transport forecasts. The analysis of the autumn 2013 D. acuta event (section 3.4) clearly illustrates that different model configurations result in different trajectories of Lagrangian particles. We were able to compare four different model set-ups that differ in spatial resolution, model domain and model forcing (river input and open boundary forcing). Although there are some published results of particle tracking simulations of that 2013 event (Moita et al. 2016; Ruiz-Villarreal et al. 2016; Silva et al. 2016), the hydrodynamical conditions driving particle transport are only described in detail in (Ruiz-Villarreal et al. 2016), who report a northwards current on the shelf coinciding with the relaxation of upwelling winds around neap tides, which can be responsible of the along-shore transport of D. acuta from Portugal to Galicia. Surface currents and surface salinity at relevant dates during this event in our four different model configurations are plotted in Figure 11, where it is noticeable that shelf circulation off the rias and representation of rivers differs. Shelf currents are directed northwards in all configurations although there are differences in speed and current location on the shelf, note especially the strong northwards velocities in the MeteoGalicia results. These differences in model configurations result in the differences in particle transport evident in Figure 6 and in Dispersal kernel indices, which we have seen in section 3.4. It is interesting to note that, in general, particles get advected more often to the north coast (longer mean transport) in the higher resolution configurations (MeteoGalicia and IEO RAIA nested), and this is especially clear when comparing IEO RAIA (4 km resolution) and IEO RAIA nested (1 km resolution). It is difficult to evaluate against observations the extent of the northwards transport in this event. The only available information is that D. acuta was not observed in the north coast HAB monitoring stations in the Ria de Ares, which could suggest that northwards advection was not so strong. The dependence on the resolution of the forcing hydrodynamic model has already been recognised in the literature, e.g. (Kvile et al. 2018; Nooteboom et al. 2020), who also report higher resolution appears to lead to greater transport, possibly from smaller scale effects being represented rather than diffused out. The impact of changing model resolution is also clear in the IFREMER 2003 model run (section 3.2), although the use of Eulerian and Lagrangian transport models in the two simulations does not allow us to isolate the impact of resolution in those results.
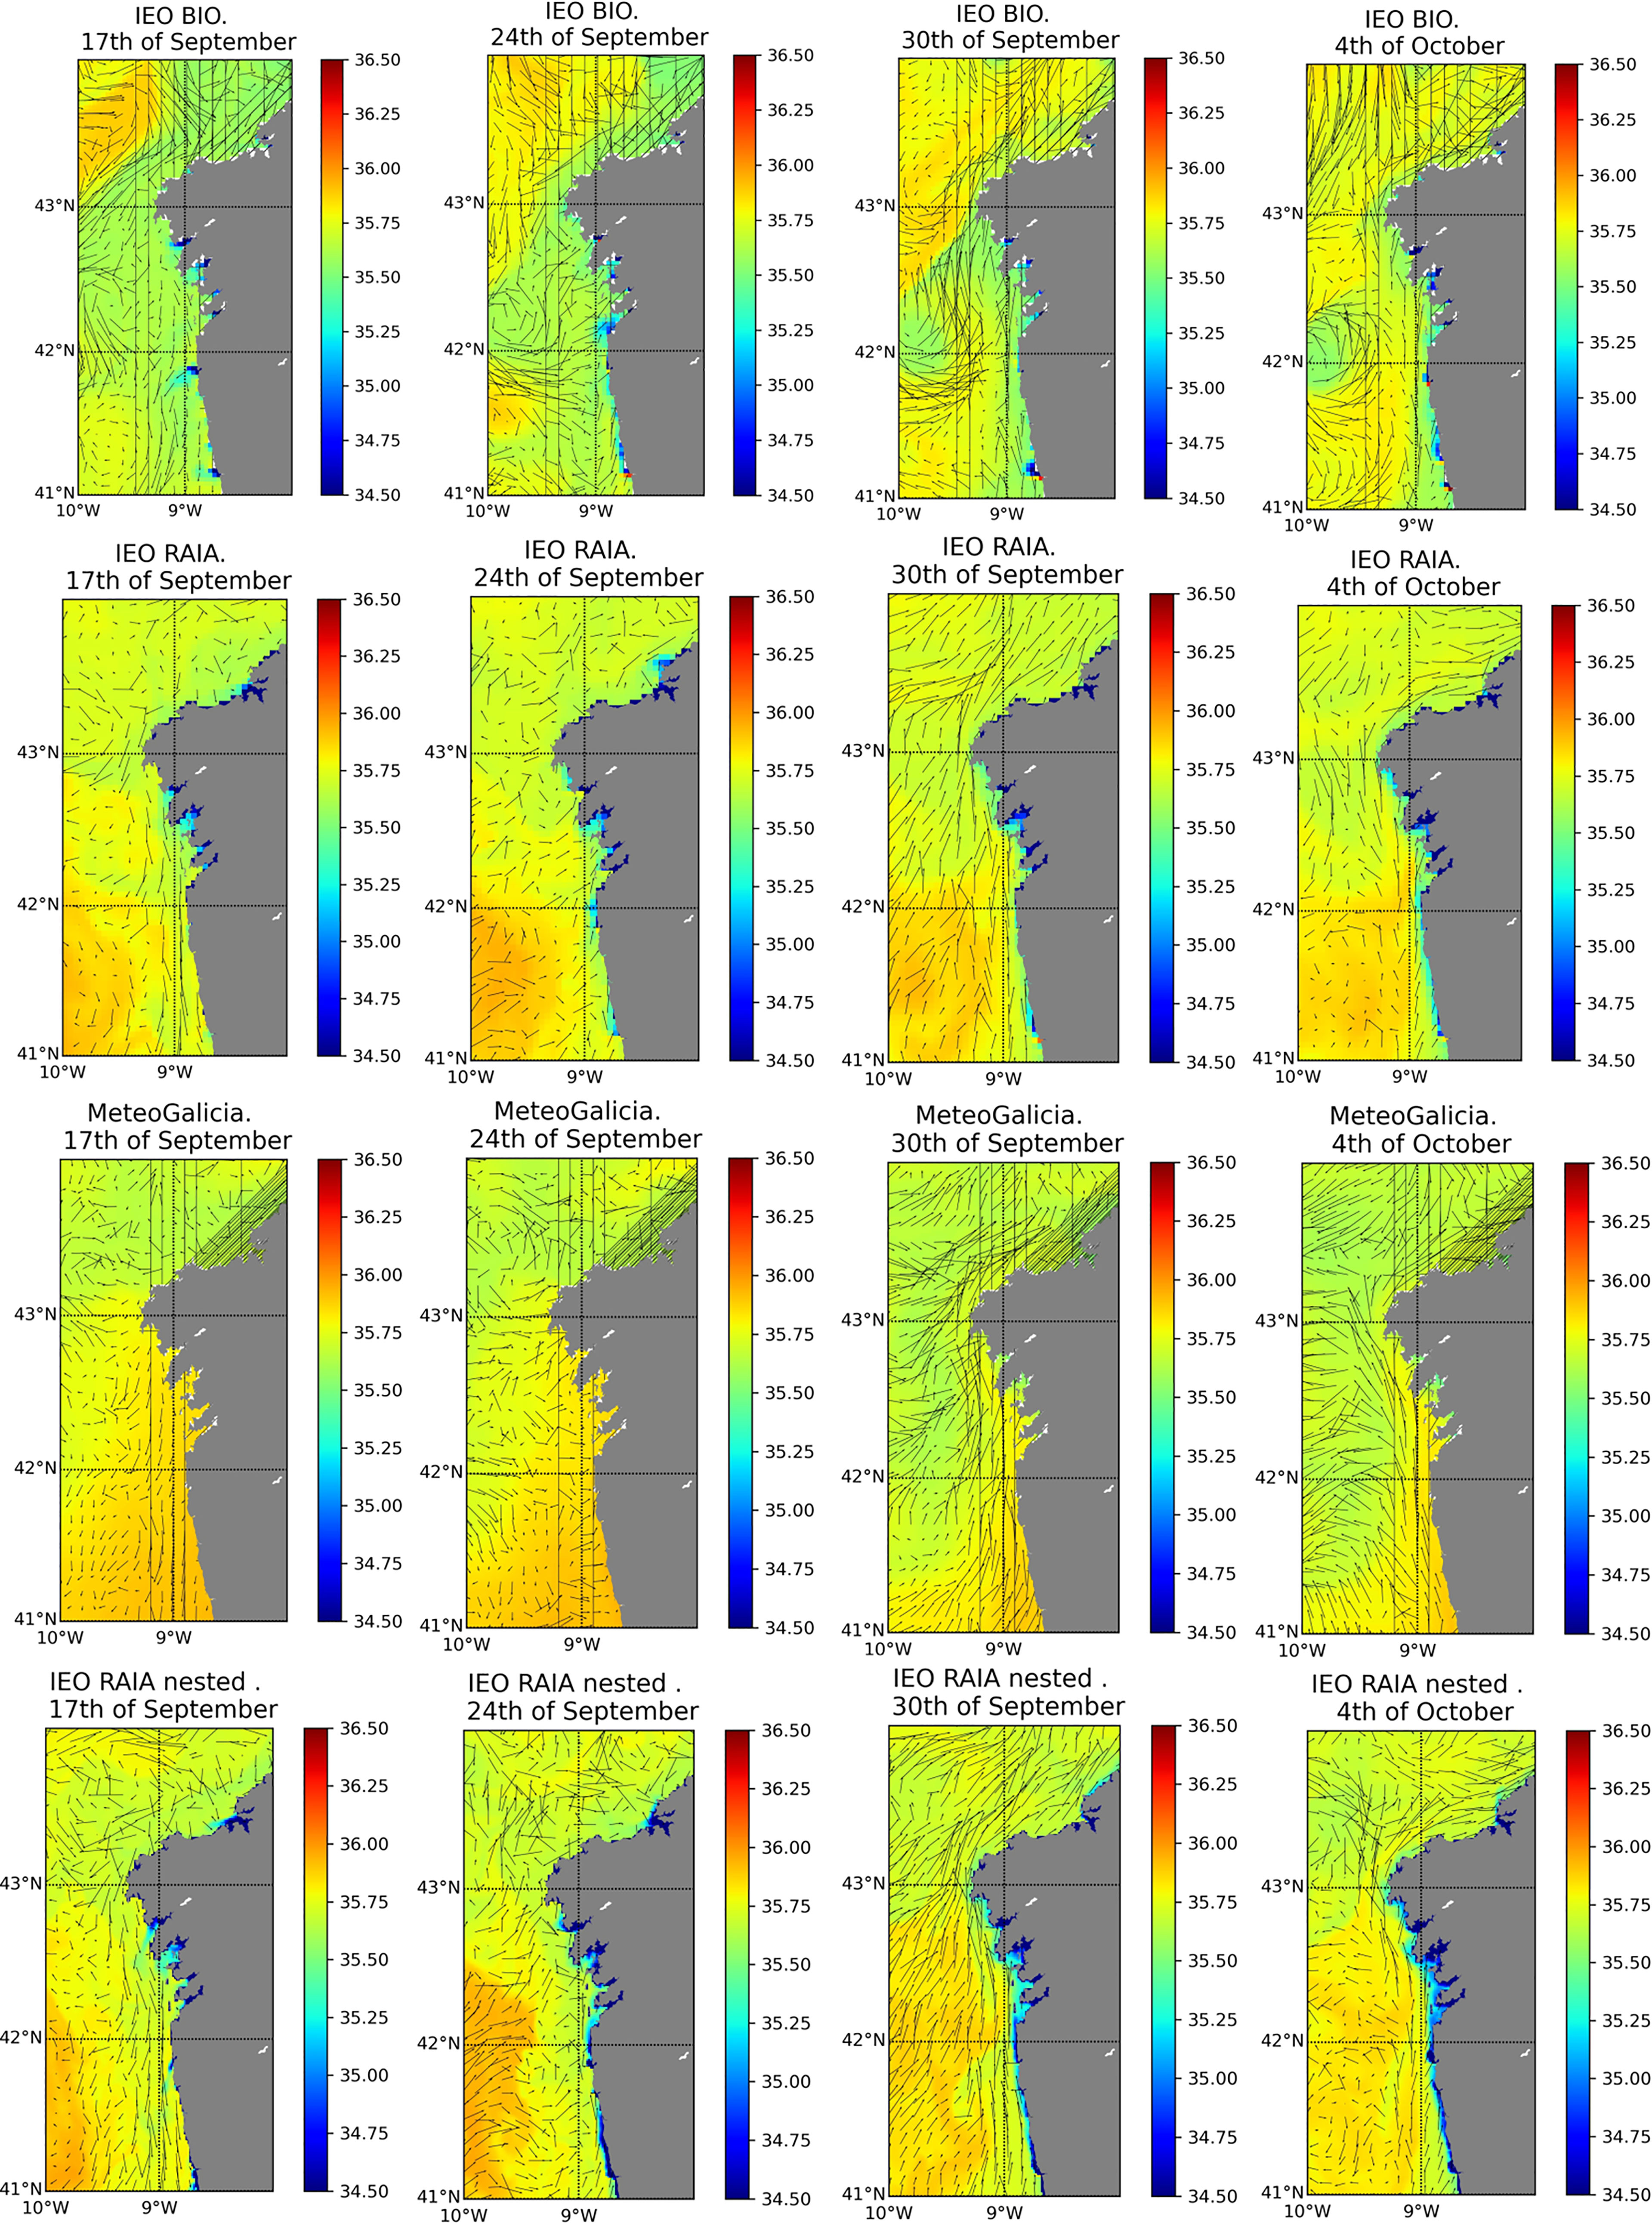
Figure 11 Surface current velocities and surface salinities at relevant dates during the 2013 HAB event for the model configurations: IEO BIO, IEO RAIA, MeteoGalicia and IEO RAIA nested.
Differences in shelf circulation and dispersion of particles off the rias among the different IEO/MeteoGalicia model configurations could be partly attributable to the differences in river input, which are evident in surface salinity (Figure 11). IEO RAIA and IEO BIO configurations consider river run off from all rivers in Galicia and in the Portuguese shelf. MeteoGalicia configuration is forced by model predictions from SWAT for Galician rivers including Miño, but on the northern Portuguese shelf it only includes a climatological monthly average run-off from Douro river. Moreover, in these hindcast simulations, IEO RAIA and IEO BIO configurations are forced by real daily river run-off data, while MeteoGalicia includes river run-offs from the SWAT forecasts, which tends to underestimate peak flows (Venâncio et al., 2019). In addition, IEO RAIA and IEO BIO configurations are free runs, resulting in the freshwater budget on the shelf being well represented, while in MeteoGalicia configuration, the re-initialization with MyOcean model (Costa et al., 2012) implies that the freshwater budget at scales longer than the forecast cycle comes only from the rivers considered in the MyOcean model (Minho and Douro). The lower influence of river plumes in the dynamics could explain the fact that the higher resolution MeteoGalicia (2km) configuration, run in a model domain similar to IEO RAIA and with open boundaries from an operational model (as IEO BIO), seems to favour the underestimation of southwards transport of particles and the overestimation of northwards currents as seen in Figure 11, with the consequence that particles are mainly transported northwards in that model configuration.
The comparison of the IFREMER to PML model in the summer 2020 event (section 3.6) suggests that temporal resolution of the underlying hydrodynamic model used to force the Lagrangian model also has an effect. Whilst other studies have found temporal resolution to be potentially less important than spatial resolution (Qin et al. 2014; Kvile et al. 2018), here it meant that tidal currents were not included in the IFREMER Lagrangian simulations, and hence the physical forcing of the particle tracking was not represented equally. In spite of this, the limited evidence from the remote sensing suggests that the IFREMER model has done a better job in this case, at least on the eastern portion of the bloom, which was not advected onshore. This could indicate that tides were not the most relevant driver of particle transport in this particular case. There is also a difference in approach to diffusion, with the IFREMER model using an advective only setup in the horizontal and the PML model having spatially varying diffusion based on the underlying hydrodynamic model. However, for the short term forecasts, which are the aim of these operational systems, it is not expected that diffusion will have a great impact.
Our results showing divergence between models highlight the importance of the spatial and temporal variability of the model that forces the particle transport model. All these forcing models have lateral boundary conditions provided by coarser resolution models, the setup of which has an impact on the forecasts. In the September 2013 event in NW Iberia, we used different model set-ups and we could show that differences in model resolution, domain and river input impacted the transport model. Forcing at the open boundary was also different in models (climatology, one-way nesting or a larger operational model) and the comparison of IEO BIO and IEO RAIA results, showing that IEO BIO demonstrating higher variability offshore, indicates that forcing with an operational larger scale model impacts the resultant transport. A detailed sensitivity study of the impact of changes in lateral forcing in forecast models and in the associated particle transport is beyond the scope of this paper, since setting up operational boundary conditions for different upstream models is a complex process. Our results confirm however that it is necessary to evaluate the differences that model-set up (including resolution, freshwater input, and open boundary conditions) may induce in the dynamics predicted by the different hydrodynamic models, since the description of currents, frontal structures and well mixed/stratified areas may differ between circulation model setups and consequently have an impact on particle transport.
4.3 Use of Lagrangian Particle Tracking Simulations Within HAB Alert Systems
Early warning of the presence, location and subsequent evolution of HABs is the objective of a HAB alert system. A Lagrangian model based HAB alert system comprises three components: an initial detection component, for example from in-situ measurements or remote sensing; a Lagrangian model component to turn this into a forecast, the efficacy of which has been the focus of this study; and a dissemination component, to inform aquaculture producers and managers in charge of protection of human health of the risk that a HAB may affect aquaculture areas.
For HAB alert systems of high biomass species such as Karenia spp., which usually appear offshore in areas not routinely sampled by existing in-situ monitoring (concentrated in aquaculture production areas on the coast), detection of HAB risk to initiate the Lagrangian model comes from satellite imagery. The approach of Karenia spp. risk detection from remote sensing and then execution of particle tracking simulations is in use in the eastern Gulf of Mexico (Stumpf et al., 2009), and was demonstrated in the Scottish coast during ASIMUTH (Gillibrand et al., 2016). In this manuscript, we have illustrated in Section 3.6 that this approach has utility for assessing the advection of potential HAB species in the English Channel, especially K. mikimotoi, which appears frequently in the summer (Widdicombe et al., 2010; Barnes et al., 2015). This HAB forecast method is affected by the accuracy of the satellite products to detect a bloom and discriminate the particular species, which can be harmful or not. In the example in Section 3.6 although the alert was activated by the Karenia spp. risk and models were run to provide forecast of an eventual HAB, no bloom of Karenia spp. at the in situ monitoring sites were observed see (Atkinson et al. 2021). HAB detection algorithms are being constantly improved to distinguish harmful from non-harmful high chlorophyll blooms (Cannizzaro et al. 2008; Tomlinson et al. 2009; Sourisseau et al. 2016), but there are still considerable challenges in species discrimination (Kurekin et al. 2014; Feng et al. 2022) and in distinguishing high turbidity from high chlorophyll concentrations of HAB species (Martinez-Vicente et al. 2020), this issue, and this will remain a source of error independent of the errors from the Lagrangian model.
We have also shown in this study (Sections 3.1) that remote sensing combined with Lagrangian particle modelling is useful to follow blooms of other potential HAB species like Prorocentrum cordatum (minimum), which can form highly dense monospecific blooms. Blooms of P. cordatum (minimum) have been associated with anoxic/hypoxic events causing fish kills (Heil et al., 2005). Although there is debate about its toxicity (Heil et al., 2005; Turner et al., 2017), P. cordatum is currently monitored in bivalve aquaculture areas in Europe. Interestingly the HAB risk map aimed at Karenia spp. also indicated high likelihood of a bloom during this event2, this could indicate a misidentification of species in this case and work discriminating the two, as has been done for K. mikimotoi and another Prorocentrum species (P. donghaiense) in (Feng et al. 2022), might be valuable for future HAB prediction. Finally, we have also demonstrated in section 3.3 that the Lagrangian particle simulations are a tool for tracking the evolution of high biomass blooms of the non-toxic Mesodinium rubrum, prey of Dinophysis spp.
For low biomass blooms like those of Dinophysis spp., initiation in the alert system relies only on the observations of the monitoring systems. If the monitoring systems detect the presence of the toxic species, it is an indication of the risk that a HAB could affect aquaculture sites. However, the monitoring only takes measurements of toxic species and toxins in aquaculture sites (located near the coast), but the bloom might be developing offshore, and then be transported to the sites. Therefore, the strategy chosen for HAB alerts of these species in the Galician early warning system is the constant release of particles in selected areas in Galicia as well as in Portugal as described in section 2.1.3. Our evaluation of the Galician system in September 2020 (section 3.5) confirmed that the Lagrangian-hydrodynamical coupled simulations provide predictions of favorable conditions of along-shore advection, exchanges between rías or flows in and out of the rías, and this is useful for characterising Dinophysis spp. HAB transport, confirming (Ruiz-Villarreal et al. 2016) conclusions. However, the results of the coupled hydrodynamical-Lagrangian simulations did not explain fully the sequence of events, which might be attributed to model uncertainties (misrepresentation of shelf dynamics, i.e river plumes, resolution not being high enough to resolve rías and fluxes between them, etc.), but also to the possibility of the HAB event being caused by local growth of D. acuminata and D. acuta and not by advective alongshore transport of D. acuta like in other autumns. The analysis of this HAB event clearly shows that although models are an important element of the early warning system, a HAB alert can only be issued in light of the measurements of the HAB monitoring system. When transnational alongshore transport is relevant, as in the presented simulations of Dinophysis spp. in Galicia and N Portugal (sections 3.4 and 3.5), transboundary exchange of information on HAB species and toxins between different HAB monitoring systems is crucial.
The final part of a HAB alert system is the dissemination to end-users. Hydrodynamic model simulations in the different areas are currently distributed via THREDDS (Thematic Realtime Environmental Distributed Data Services), a web data server that provides metadata and data access for scientific datasets using different remote data access protocols including Open Geospatial Consortium (OGC) standard protocols. The availability of model output in the THREDDS server allows us to obtain data via OPENDAP, HTTPserver or NetcdfSubset, but also via OGC Web Map Service (WMS) or Web Coverage Service (WCS) Interface Standards. However, a THREDDS server is not the best option for distributing non-gridded data, such as the Lagrangian model outputs. At IEO, the Lagrangian particle output files are transformed into shapefiles in order to be served through a GeoServer, which serves data using standard OGC protocols. In the GeoServer, the latest Lagrangian particle output from the daily run of the Lagrangian particle tracking simulations is served for visualization in viewers and data portals, including PRIMROSE data viewer. A similar approach is followed at IFREMER for distributing Lagrangian particle trajectories.
Presentation is a part of dissemination. Two differing presentations of Lagrangian trajectories for use in HAB forecast systems are shown in Figure 12. The IEO model runs regularly using the same starting locations, which have been identified as possible sources (see section 2.1.3). These are presented in a portal with the individual tracks shown, which allows rapid visualization of trajectories (Figure 12A). The PML model is initiated from remote sensing HAB algorithms, which as above come with an associated uncertainty (Kurekin et al. 2014). Also, all the advection models include a diffusion term which adds an element of stochasticity to the results which represents sub-grid scale processes. The PML output combines both sources of uncertainty (from the detection algorithm and from the diffusion of the particles). In this way, each particle is associated with the probability from the detection algorithm, then kernel density estimates are fitted to each particle release to give the probability distribution from advection component. These two probabilities are combined using a simple Bayesian approach to produce a single map of HAB probability (Figure 12B). Whilst this attempts to include the available information on uncertainty from all inputs to the model, the result is less clearly a drift product, which makes it less easily interpretable, possibly resulting in less uptake by, and thus value, to end users. However, given the uncertainties of the drift, either presentation is improved by an accompanying interpretation. These forecasts are not usually presented in isolation; they more often form part of HAB bulletins or HAB report web sites, such as those produced in ASIMUTH (Cusack et al. 2016; Maguire et al. 2016; Ruiz-Villarreal et al. 2016; Silva et al. 2016) and PRIMROSE projects (Davidson et al. 2021; Fernandes-Salvador et al. 2021), this issue. HAB early warning system presentations add in local measurements, general oceanographic conditions and expert advice, along with advective forecasts, which help to mitigate the problems of interpretation and user uptake identified above.
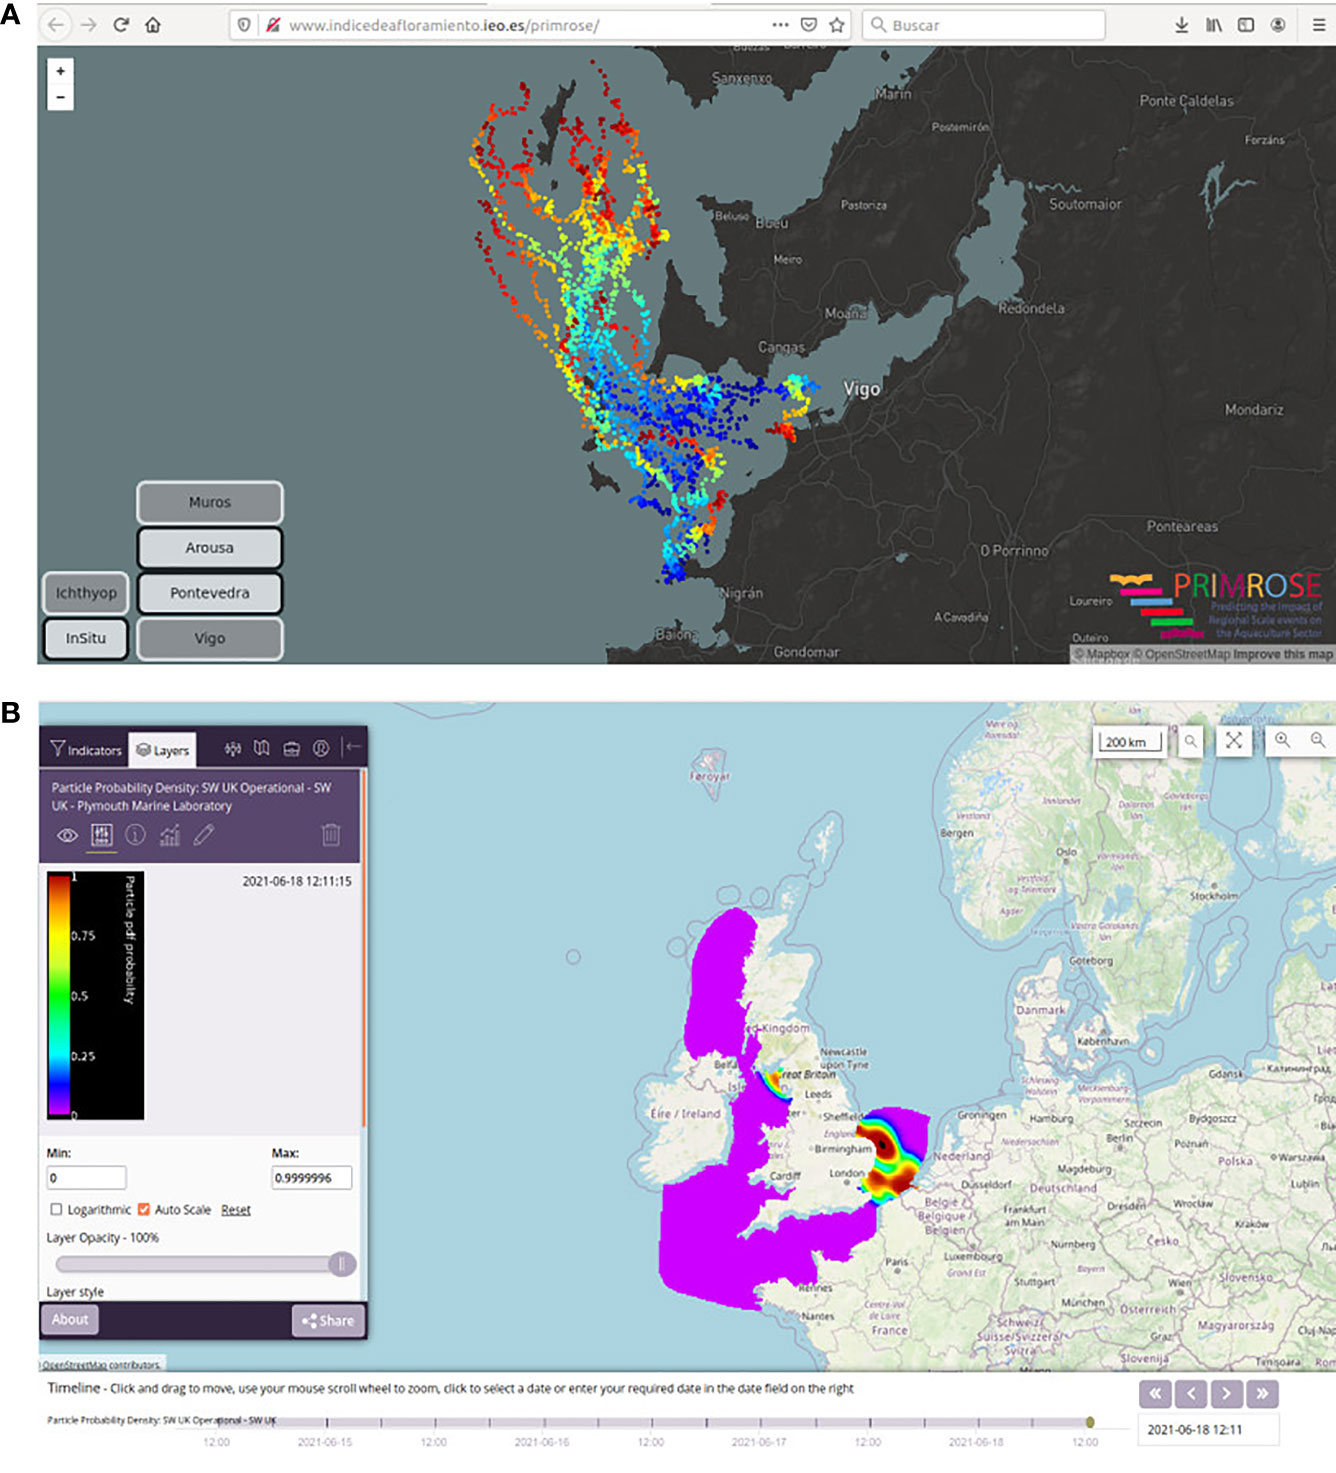
Figure 12 Presentation of Lagrangian particle tracking operational results demonstrated during the PRIMROSE project. (A) Lagrangian particle forecast for Ría de Vigo corresponding to 29th September 2020 run as served by the IEO data viewer (http://www.indicedeafloramiento.ieo.es/primrose), also available at the PRIMROSE portal (https://primrose.eofrom.space/?state=ae63b8). Time is represented in the plot as colour for the particle positions, from blue at the start through to red three days after. (B) Lagrangian particle forecast from PML model corresponding to 18th June 2021 as served by the PRIMROSE portal (http://primrose.eofrom.space). The probability density field shows the probability of a bloom incurring on a particular location at a particular time step, considering both the probability of an accurate identification from the remote sensing algorithm and from the uncertainty in the predicted particle tracks.
5 Summary and Conclusions
● Particle tracking models have shown utility within an alert system to track movement of identified HABs between and around coastal areas over short timescales even when run with advection only, with models being easily run “offline” on saved hydrodynamic fields
● HAB early warning systems are based on the availability of information about the presence of HAB and on tools that predict the transport. The availability of routine forecasts is paramount for an early warning system, but our results clearly show that differences and limitations of the hydrodynamic model configurations strongly affect the simulated transport. Several metrics have been used to quantify the model performance with respect to satellite observations (in the case of high biomass blooms) and to compare the results of different model configurations run for the same event. We have illustrated in several events how differences in resolution, forcing and simulation domain cause differences in the predicted transport of HABs.
● For high biomass HAB blooms of K. mikimotoi and P. cordatum (minimum) such as those identified and simulated in the Western Channel, there appeared to be distinct periods of growth and advection with the forecast model performing well only in the latter period. Reseeding and rerunning a forecast model during the initial period of a bloom is therefore of importance to provide forecasts of HAB advection.
● The analysis of Dinophysis spp. HAB events in West Iberia clearly shows that models are an important element of the early warning system, since Lagrangian-hydrodynamical coupled simulations provide predictions of favorable conditions of along-shore advection, exchanges between rías or flows in and out of the rías, and this is useful for characterising Dinophysis spp. HAB transport. However, HAB alert and evaluation of the forecast rely on the measurements of HAB monitoring systems. In areas like Galicia and N Portugal where transnational alongshore transport can be relevant, we have seen that transboundary exchange of information between different HAB monitoring systems is crucial.
● In future, short-term advective forecasts might be improved by adding a biological model or machine learning component to improve the prediction during the onset of blooms. Another direction for which these advective models might be important is the cross boundary, to alert between different currently discrete regional modelling systems (Maguire et al., 2016; Anderson et al., 2019). Nevertheless our results have shown that the choices underlying the hydrodynamic model setup also have a significant effect on the results and improvements to the understanding and implementation of these models is as important as adding extra features.
● Further improvement of HAB transport tools requires continuous improvements in hydrodynamic coastal models and further effort in analysing past events in order to improve the alert systems and of our understanding of HAB transport.
Data Availability Statement
The raw data supporting the conclusions of this article will be made available by the authors, without undue reservation.
Author Contributions
Each author ran their respective institutes models and initially collated the observations and supporting data relevant to their own model runs. All authors contributed to the analysis and discussion of the results and to manuscript preparation and writing.
Funding
This work has been funded by European Union Interreg Atlantic Area project PRIMROSE (EAPA182_2016). The development and execution of forecast model configurations as well as the distribution of model results in web services has received support from Interreg Atlantic Area project MyCoast (EAPA285_2016). IEO acknowledges complementary support for the development of a HAB early warning system in Galicia from project MarRISK (Interreg POCTEP Spain Portugal, 0262_MARRISK_1_E) and from Axencia Galega de Innovación (GAIN, Xunta de Galicia, Spain).
Conflict of Interest
The authors declare that the research was conducted in the absence of any commercial or financial relationships that could be construed as a potential conflict of interest.
Publisher’s Note
All claims expressed in this article are solely those of the authors and do not necessarily represent those of their affiliated organizations, or those of the publisher, the editors and the reviewers. Any product that may be evaluated in this article, or claim that may be made by its manufacturer, is not guaranteed or endorsed by the publisher.
Acknowledgments
Computations presented by IEO were performed at CESGA – Centro de Supercomputación de Galicia. We thank MeteoGalicia, especially Pedro Costa and Anabela Venâncio, for their assistance in efficiently accessing MeteoGalicia model output. We thank Alexandra Silva (IPMA) for providing D. acuta and D. acuminata data of N Portugal monitoring stations for September 2020. We thank Andrey Kurekin for provision of the raw HAB risk data for model comparison.
Supplementary Material
The Supplementary Material for this article can be found online at: https://www.frontiersin.org/articles/10.3389/fmars.2022.749071/full#supplementary-material
Footnotes
- ^ https://www.s3eurohab.eu/portal/?state=cf0d81 - retrieved 2022/03/15
- ^ https://www.s3eurohab.eu/portal/?state=cf0d81 - accessed 2022/03/15.
References
Aleynik D., Dale A. C., Porter M., Davidson K. (2016). A High Resolution Hydrodynamic Model System Suitable for Novel Harmful Algal Bloom Modelling in Areas of Complex Coastline and Topography. Harmful Algae 53, 102–117. doi: 10.1016/j.hal.2015.11.012
Anderson C. R., Berdalet E., Kudela R. M., Cusack C. K., Silke J., O’Rourke E., et al. (2019). Scaling Up From Regional Case Studies to a Global Harmful Algal Bloom Observing System. Front. Mar. Sci. 6. doi: 10.3389/fmars.2019.00250
Anderson C. R., Kudela R. M., Kahru M., Chao Y., Rosenfeld L. K., Bahr F. L., et al. (2016). Initial Skill Assessment of the California Harmful Algae Risk Mapping (C-HARM) System. Harmful Algae 59, 1–18. doi: 10.1016/j.hal.2016.08.006
Aoki K., Onitsuka G., Shimizu M., Kuroda H., Matsuyama Y., Kimoto K., et al. (2012). Factors Controlling the Spatio-Temporal Distribution of the 2009 Chattonella Antiqua Bloom in the Yatsushiro Sea, Japan. Estuarine Coast. Shelf Sci. 114, 148–155. doi: 10.1016/j.ecss.2012.08.028
Atkinson A., McEvoy A., Widdicombe C., Hiscock K. (2021). “Plankton Observations,” in South-West Marine Ecosystems Report for 2020. Eds. Hiscock K., Earll B. (Plymouth, UK: Marine Biological Association of the UK), 12–18. doi: 10.17031/p2hc-rg17
Davidson K., Whyte C., Aleynik D., Dale A., Gontarek S., Kurekin A. A., et al. (2021). HAB Reports: Online Early Warning of Harmful Algal and Biotoxin Risk for the Scottish Shellfish and Finfish Aquaculture Industries. Front. Mar. Sci. 8, 631732. doi: 10.3389/fmars.2021.631732
Barnes M. K., Tilstone G. H., Smyth T. J., Widdicombe C. E., Gloël J., Robinson C., et al. (2015). Drivers and Effects of Karenia Mikimotoi Blooms in the Western English Channel. Prog. Oceanography 137, 456–469. doi: 10.1016/j.pocean.2015.04.018
Brand L. E., Campbell L., Bresnan E. (2012). Karenia: The Biology and Ecology of a Toxic Genus. Harmful Algae 14, 156–178. doi: 10.1016/j.hal.2011.10.020
Cannizzaro J. P., Carder K. L., Chen F. R., Heil C. A., Vargo G. A. (2008). A Novel Technique for Detection of the Toxic Dinoflagellate, Karenia Brevis, in the Gulf of Mexico From Remotely Sensed Ocean Color Data. Continental Shelf Res. 28, 137–158. doi: 10.1016/j.csr.2004.04.007
Chen C., Liu H., Beardsley R. (2003). An Unstructured Grid, Finite-Volume, Three-Dimensional, Primitive Equations Ocean Model: Application to Coastal Ocean and Estuaries. J. Atmospheric Oceanic Technol. 20, 159–186. doi: 10.1175/1520-0426(2003)020<0159:AUGFVT>2.0.CO;2
Costa P., Gómez B., Venâncio A., Pérez E., Pérez-Muñuzuri V. (2012). Using the Regional Ocean Modelling System (ROMS) to Improve the Sea Surface Temperature Predictions of the MERCATOR Ocean System. Scientia Marina 76, 165–175. doi: 10.3989/scimar.03614.19E
Crawford D., Purdie D., Lockwood A., Weissman P. (1997). Recurrent Red-Tides in the Southampton Water Estuary Caused by the Phototrophic Ciliate Mesodinium Rubrum. Estuarine Coast. Shelf Sci. 45, 799–812. doi: 10.1006/ecss.1997.0242
Cusack C., Dabrowski T., Lyons K., Berry A., Westbrook G., Salas R., et al. (2016). Harmful Algal Bloom Forecast System for SW Ireland. Part II: Are Operational Oceanographic Models Useful in a HAB Warning System. Harmful Algae 53, 86–101. doi: 10.1016/j.hal.2015.11.013
Cusack C., Mouriño H., Moita M. T., Silke J. (2015). Modelling Pseudo-Nitzschia Events Off Southwest Ireland. J. Sea Res. 105, 30–41. doi: 10.1016/j.seares.2015.06.012
Davidson K., Anderson D. M., Mateus M., Reguera B., Silke J., Sourisseau M., et al. (2016). Forecasting the Risk of Harmful Algal Blooms. Harmful Algae 53, 1–7. doi: 10.1016/j.hal.2015.11.005
Davidson K., Miller P., Wilding T. A., Shutler J., Bresnan E., Kennington K., et al. (2009). A Large and Prolonged Bloom of Karenia Mikimotoi in Scottish Waters in 2006. Harmful Algae 8, 349–361. doi: 10.1016/j.hal.2008.07.007
Díaz P. A., Ruiz-Villarreal M., Pazos Y., Moita T., Reguera B. (2016). Climate Variability and Dinophysis Acuta Blooms in an Upwelling System. Harmful Algae 53, 145–159. doi: 10.1016/j.hal.2015.11.007
Elliott J. A. (2012). Is the Future Blue-Green? A Review of the Current Model Predictions of How Climate Change Could Affect Pelagic Freshwater Cyanobacteria. Water Res. 46, 1364–1371. doi: 10.1016/j.watres.2011.12.018
Escalera L., Reguera B., Moita T., Pazos Y., Cerejo M., Cabanas J., et al. (2010). Bloom Dynamics of Dinophysis Acuta in an Upwelling System: In Situ Growth Versus Transport. Harmful Algae 9, 312–322. doi: 10.1016/j.hal.2009.12.002
Feng C., Ishizaka J., Wang S. (2022). A Simple Method for Algal Species Discrimination in East China Sea, Using Multiple Satellite Imagery. Geosci. Lett. 9, 1–9. doi: 10.1186/s40562-022-00222-1
Fernandes-Salvador J. A., Davidson K., Sourisseau M., Revilla M., Schmidt W., Clarke D., et al. (2021). Current Status of Forecasting Toxic Harmful Algae for the North-East Atlantic Shellfish Aquaculture Industry. Front. Mar. Sci. 8. doi: 10.3389/fmars.2021.666583
García-García L. M., Ruiz-Villarreal M., Bernal M. (2016). A Biophysical Model for Simulating Early Life Stages of Sardine in the Iberian Atlantic Stock. Fisheries Res. 173, 250–272. doi: 10.1016/j.fishres.2015.10.002
Gentien P., Lunven M., Lazure P., Youenou A., Crassous M.-P. (2007). Motility and Autotoxicity in Karenia Mikimotoi (Dinophyceae). Philos. Trans. R. Soc. B: Biol. Sci. 362, 1937–1946. doi: 10.1098/rstb.2007.2079
Gillibrand P., Siemering B., Miller P., Davidson K. (2016). Individual-Based Modelling of the Development and Transport of a Karenia Mikimotoi Bloom on the North-West European Continental Shelf. Harmful Algae 53, 118–134. doi: 10.1016/j.hal.2015.11.011
Glibert P. M., Allen J. I., Bouwman A., Brown C. W., Flynn K. J., Lewitus A. J., et al. (2010). Modeling of HABs and Eutrophication: Status, Advances, Challenges. J. Mar. Syst. 83, 262–275. doi: 10.1016/j.jmarsys.2010.05.004
Hartman S., Hartman M., Hydes D., Smythe-Wright D., Gohin F., Lazure P. (2014). The Role of Hydrographic Parameters, Measured From a Ship of Opportunity, in Bloom Formation of Karenia Mikimotoi in the English Channel. J. Mar. Syst. 140, 39–49. doi: 10.1016/j.jmarsys.2014.07.001
Heil C. A., Glibert P. M., Fan C. (2005). Prorocentrum Minimum (Pavillard) Schiller: A Review of a Harmful Algal Bloom Species of Growing Worldwide Importance. Harmful Algae 4, 449–470. doi: 10.1016/j.hal.2004.08.003
Hiscock K., Earll B., Smyth T., Atkinson A., Hiscock K., Herdson D., et al. (2016) South-West Marine Ecosystems in 2015. Available at: https://swmecosystems.co.uk/wp-content/uploads/2016/02/SWME-2015-collated_reports_final_December.pdf.
Hu C., Muller-Karger F. E., Taylor C. J., Carder K. L., Kelble C., Johns E., et al. (2005). Red Tide Detection and Tracing Using MODIS Fluorescence Data: A Regional Example in SW Florida Coastal Waters. Remote Sens. Environ. 97, 311–321. doi: 10.1016/j.rse.2005.05.013
Huret M., Petitgas P., Woillez M. (2010). Dispersal Kernels and Their Drivers Captured With a Hydrodynamic Model and Spatial Indices: A Case Study on Anchovy (Engraulis Encrasicolus) Early Life Stages in the Bay of Biscay. Prog. Oceanogr. 87, 6–17. doi: 10.1016/j.pocean.2010.09.023
Johnson M. D., Stoecker D. K., Marshall H. G. (2013). Seasonal Dynamics of Mesodinium Rubrum in Chesapeake Bay. J. Plankton Res. 35, 877–893. doi: 10.1093/plankt/fbt028
Jordan C., Cusack C., Tomlinson M. C., Meredith A., McGeady R., Salas R., et al. (2021). Using the Red Band Difference Algorithm to Detect and Monitor a Karenia Spp. Bloom Off the South Coast of Ireland, June 2019. Front. Mar. Sci. 8. doi: 10.3389/fmars.2021.638889
Karki S., Sultan M., Elkadiri R., Elbayoumi T. (2018). Mapping and Forecasting Onsets of Harmful Algal Blooms Using MODIS Data Over Coastal Waters Surrounding Charlotte County, Florida. Remote Sens. 10, 1656. doi: 10.3390/rs10101656
Kurekin A., Miller P., van der Woerd H. (2014). Satellite Discrimination of Karenia Mikimotoi and Phaeocystis Harmful Algal Blooms in European Coastal Waters: Merged Classification of Ocean Colour Data. Harmful Algae 31, 163–176. doi: 10.1016/j.hal.2013.11.003
Kutser T., Metsamaa L., Vahtmäe E., Strömbeck N. (2006). Suitability of MODIS 250 M Resolution Band Data for Quantitative Mapping of Cyanobacterial Blooms. Proceedings of the Estonian Academy of Sciences. Biology. Ecology 55, 318–328. doi: 10.3176/biol.ecol.2006.4.04
Kvile K.Ø., Romagnoni G., Dagestad K.-F., Langangen Ø., Kristiansen T. (2018). Sensitivity of Modelled North Sea Cod Larvae Transport to Vertical Behaviour, Ocean Model Resolution and Interannual Variation in Ocean Dynamics. ICES J. Mar. Sci. 75, 2413–2424. doi: 10.1093/icesjms/fsy039
Lazure P., Dumas F. (2008). An External–Internal Mode Coupling for a 3d Hydrodynamical Model for Applications at Regional Scale (MARS). Adv. Water Resour. 31, 233–250. doi: 10.1016/j.advwatres.2007.06.010
Lee J. H., Qu B. (2004). Hydrodynamic Tracking of the Massive Spring 1998 Red Tide in Hong Kong. J. Environ. Eng. 130, 535–550. doi: 10.1061/(ASCE)0733-9372(2004)130:5(535
Le C., Hu C., Cannizzaro J., English D., Muller-Karger F., Lee Z. (2013). Evaluation of Chlorophyll-a Remote Sensing Algorithms for an Optically Complex Estuary. Remote Sens. Environ. 129, 75–89. doi: 10.1016/j.rse.2012.11.001
Lellouche J.-M., Le Galloudec O., Drévillon M., Régnier C., Greiner E., Garric G., et al. (2013). Evaluation of Global Monitoring and Forecasting Systems at Mercator Océan. Ocean Sci. 9, 57–81. doi: 10.5194/os-9-57-2013
Lett C., Verley P., Mullon C., Parada C., Brochier T., Penven P., et al. (2008). A Lagrangian Tool for Modelling Ichthyoplankton Dynamics. Environ. Model. Software 23, 1210–1214. doi: 10.1016/j.envsoft.2008.02.005
Lien G.-Y., Kalnay E., Miyoshi T., Huffman G. J. (2016). Statistical Properties of Global Precipitation in the NCEP GFS Model and TMPA Observations for Data Assimilation. Monthly Weather Rev. 144, 663–679. doi: 10.1175/MWR-D-15-0150.1
Lin J., Miller P. I., Jönsson B. F., Bedington M. (2021). Early Warning of Harmful Algal Bloom Risk Using Satellite Ocean Color and Lagrangian Particle Trajectories. Front. Mar. Sci. 8. doi: 10.3389/fmars.2021.736262
Maguire J., Cusack C., Ruiz-Villarreal M., Silke J., McElligott D., Davidson K. (2016). Applied Simulations and Integrated Modelling for the Understanding of Toxic and Harmful Algal Blooms (ASIMUTH): Integrated HAB Forecast Systems for Europe’s Atlantic Arc. Harmful Algae 53, 160–166. doi: 10.1016/j.hal.2015.11.006
Marta-Almeida M., Ruiz-Villarreal M., Pereira J., Otero P., Cirano M., Zhang X., et al. (2013). Efficient Tools for Marine Operational Forecast and Oil Spill Tracking. Mar. pollut. Bull. 71, 139–151. doi: 10.1016/j.marpolbul.2013.03.022
Martinez-Vicente V., Kurekin A., Sá C., Brotas V., Amorim A., Veloso V., et al. (2020). Sensitivity of a Satellite Algorithm for Harmful Algal Bloom Discrimination to the Use of Laboratory Bio-Optical Data for Training. Front. Mar. Sci. 7. doi: 10.3389/fmars.2020.582960
Martino S., Gianella F., Davidson K. (2020). An Approach for Evaluating the Economic Impacts of Harmful Algal Blooms: The Effects of Blooms of Toxic Dinophysis Spp. On the Productivity of Scottish Shellfish Farms. Harmful Algae 99, 101912. doi: 10.1016/j.hal.2020.101912
Mateus M., Fernandes J., Revilla M., Ferrer L., Villarreal M. R., Miller P., et al. (2019). “Early Warning Systems for Shellfish Safety: The Pivotal Role of Computational Science,” in Computational Science – ICCS 2019. Eds. Rodrigues J. M. F., Cardoso P. J. S., Monteiro J., Lam R., Krzhizhanovskaya V. V., Lees M. H., Dongarra J. J., Sloot P. M. (Cham: Springer International Publishing), 361–375. doi: 10.1007/978-3-030-22747-0_28
McManus M. A., Kudela R. M., Silver M. W., Steward G. F., Donaghay P. L., Sullivan J. M. (2008). Cryptic Blooms: Are Thin Layers the Missing Connection? Estuaries and Coasts 31, 396–401. doi: 10.1007/s12237-007-9025-4
Mercator (2016). Global Ocean 1/12° Physics Analysis and Forecast Updated Dail. (Mercator Ocean, France: Copernicus Marine Service). doi: 10.48670/MOI-00016
Mishra S., Mishra D. R. (2012). Normalized Difference Chlorophyll Index: A Novel Model for Remote Estimation of Chlorophyll-a Concentration in Turbid Productive Waters. Remote Sens. Environ. 117, 394–406. doi: 10.1016/j.rse.2011.10.016
Moita M. T., Pazos Y., Rocha C., Nolasco R., Oliveira P. B. (2016). Toward Predicting Dinophysis Blooms Off NW Iberia: A Decade of Events. Harmful Algae 53, 17–32. doi: 10.1016/j.hal.2015.12.002
Nooteboom P. D., Delandmeter P., van Sebille E., Bijl P. K., Dijkstra H. A., von der Heydt A. S. (2020). Resolution Dependency of Sinking Lagrangian Particles in Ocean General Circulation Models. PLoS One 15, e0238650. doi: 10.1371/journal.pone.0238650
O’Boyle S., McDermott G., Silke J., Cusack C. (2016). Potential Impact of an Exceptional Bloom of Karenia Mikimotoi on Dissolved Oxygen Levels in Waters Off Western Ireland. Harmful Algae 53, 77–85. doi: 10.1016/j.hal.2015.11.014
O’Dea E., Arnold A., Edwards K., Furner R., Hyder P., Martin M., et al. (2012). An Operational Ocean Forecast System Incorporating NEMO and SST Data Assimilation for the Tidally Driven European North-West Shelf. J. Operational Oceanography 5, 3–17. doi: 10.1080/1755876X.2012.11020128
Otero P., Ruiz-Villarreal M. (2008). Wind Forcing of the Coastal Circulation Off North and Northwest Iberia: Comparison of Atmospheric Models. J. Geophysical Research-Oceans 113, C10019. doi: 10.1029/2008JC004740
Otero P., Ruiz-Villarreal M., Allen-Perkins S., Vila B., Cabanas J. (2014). Coastal Exposure to Oil Spill Impacts From the Finisterre Traffic Separation Scheme. Mar. Pollut. Bull. 85, 67–77. doi: 10.1016/j.marpolbul.2014.06.020
Otero P., Ruiz-Villarreal M., García-García L., González-Nuevo G., Cabanas J. M. (2013). Coastal Dynamics Off Northwest Iberia During a Stormy Winter Period. Ocean Dynamics 63, 115–129. doi: 10.1007/s10236-012-0585-x
Otero P., Ruiz-Villarreal M., Peliz A. (2008). Variability of River Plumes Off Northwest Iberia in Response to Wind Events. J. Mar. Syst. 72, 238–255. doi: 10.1016/j.jmarsys.2007.05.016
Otero P., Ruiz-Villarreal M., Peliz A. (2009). River Plume Fronts Off NW Iberia From Satellite Observations and Model Data. ICES J. Mar. Sci. 66 (9), 1853–64. doi: 10.1093/icesjms/fsp156
Paerl H. W., Huisman J. (2008). CLIMATE: Blooms Like It Hot. Science 320, 57–58. doi: 10.1126/science.1155398
Pinto L., Mateus M., Silva A. (2016). Modeling the Transport Pathways of Harmful Algal Blooms in the Iberian Coast. Harmful Algae 53, 8–16. doi: 10.1016/j.hal.2015.12.001
Pitcher G., Figueiras F., Hickey B., Moita M. (2010). The Physical Oceanography of Upwelling Systems and the Development of Harmful Algal Blooms. Prog. Oceanogr. 85, 5–32. doi: 10.1016/j.pocean.2010.02.002
Qin X., van Sebille E., Gupta A. S. (2014). Quantification of Errors Induced by Temporal Resolution on Lagrangian Particles in an Eddy-Resolving Model. Ocean Model. 76, 20–30. doi: 10.1016/j.ocemod.2014.02.002
Qurban M. A. B. (2009). An Investigation of Factors Influencing the Spatial and Temporal Distribution of Surface Phytoplankton in the English Channel and Bay of Biscay in 2003 and 2004 (Doctoral dissertation, University of Southampton).
Ralston D. K., Moore S. K. (2020). Modeling Harmful Algal Blooms in a Changing Climate. Harmful Algae 91, 101729. doi: 10.1016/j.hal.2019.101729
Redalje D. G., Lohrenz S. E., Natter M., Tuel M., Kirkpatrick G., Millie D., et al. (2008). The Growth Dynamics of Karenia Brevis Within Discrete Blooms on the West Florida Shelf. Continental Shelf Res. 28, 24–44. doi: 10.1016/j.csr.2007.04.011
REPHY (2021). REPHY Dataset - French Observation and Monitoring Program for Phytoplankton and Hydrology in Coastal Waters. Metropolitan data. SEANOE. doi: 10.17882/47248
Röhrs J., Christensen K. H., Vikebø F., Sundby S., Saetra Ø., Broström G. (2014). Wave-Induced Transport and Vertical Mixing of Pelagic Eggs and Larvae. Limnology Oceanography 59, 1213–1227. doi: 10.4319/lo.2014.59.4.1213
Röhrs J., Sutherland G., Jeans G., Bedington M., Sperrevik A. K., Dagestad K.-F., et al. (2021). Surface Currents in Operational Oceanography: Key Applications, Mechanisms, and Methods. J. Operational Oceanogr. 0, 1–29. doi: 10.1080/1755876X.2021.1903221
Ruiz-Villarreal M., García-García L. M., Cobas M., Díaz P. A., Reguera B. (2016). Modelling the Hydrodynamic Conditions Associated With Dinophysis Blooms in Galicia (NW Spain). Harmful Algae 53, 40–52. doi: 10.1016/j.hal.2015.12.003
Ruiz-Villarreal M., Sourisseau M., Anderson P., Cusack C., Neira P., Silke J., et al. (2022). Novel Methodologies for Providing in Situ Data to HAB Early Warning Systems in the European Atlantic Area: The Primrose Experience. Front. Mar. Sci. 9. doi: 10.3389/fmars.2022.791329
Sathyendranath S., Brewin R. J., Brockmann C., Brotas V., Calton B., Chuprin A., et al. (2019). An Ocean-Colour Time Series for Use in Climate Studies: The Experience of the Ocean-Colour Climate Change Initiative (OC-CCI). Sensors 19, 4285. doi: 10.3390/s19194285
Silva A., Pinto L., Rodrigues S., de Pablo H., Santos M., Moita T., et al. (2016). A HAB Warning System for Shellfish Harvesting in Portugal. Harmful Algae 53, 33–39. doi: 10.1016/j.hal.2015.11.017
Simpson J. H., Sharples J. (2012). Introduction to the Physical and Biological Oceanography of Shelf Seas (Cambridge: Cambridge University Press).
Smythe-Wright D., Daniel A., Boswell S., Purcell D., Hartman M., Hartman S., et al. (2014). Phytoplankton and Pigment Studies in the Bay of Biscay and English Channel. Deep Sea Res. Part II: Topical Stud. Oceanography 106, 76–86. doi: 10.1016/j.dsr2.2013.12.015
Soto I. M., Cannizzaro J., Muller-Karger F. E., Hu C., Wolny J., Goldgof D. (2015). Evaluation and Optimization of Remote Sensing Techniques for Detection of Karenia Brevis Blooms on the West Florida Shelf. Remote Sens. Environ. 170, 239–254. doi: 10.1016/j.rse.2015.09.026
Sourisseau M., Jegou K., Lunven M., Quere J., Gohin F., Bryere P. (2016). Distribution and Dynamics of Two Species of Dinophyceae Producing High Biomass Blooms Over the French Atlantic Shelf. Harmful Algae 53, 53–63. doi: 10.1016/j.hal.2015.11.016
Stumpf R. P., Tomlinson M. C., Calkins J. A., Kirkpatrick B., Fisher K., Nierenberg K., et al. (2009). Skill Assessment for an Operational Algal Bloom Forecast System. J. Mar. Syst. 76, 151–161. doi: 10.1016/j.jmarsys.2008.05.016
Tamtare T., Dumont D., Chavanne C. (2021). The Stokes Drift in Ocean Surface Drift Prediction. J. Operational Oceanogr. 0, 1–13. doi: 10.1080/1755876X.2021.1872229
Tomlinson M., Wynne T., Stumpf R. (2009). An Evaluation of Remote Sensing Techniques for Enhanced Detection of the Toxic Dinoflagellate Karenia Brevis. Remote Sens. Environ. 113, 598–609. doi: 10.1016/j.rse.2008.11.003
Tonani M., Sykes P., King R. R., McConnell N., Péquignet A.-C., O’Dea E., et al. (2019). The Impact of a New High-Resolution Ocean Model on the Met Office North-West European Shelf Forecasting System. Ocean Sci. 15, 1133–1158. doi: 10.5194/os-15-1133-2019
Trowbridge C., Davenport J., Plowman C., Harman L., McAllen R. (2017). Marine Aloricate Ciliate Red Tides in a Temperate Irish Sea Lough. Mar. Biodiversity 47, 869–878. doi: 10.1007/s12526-016-0520-3
Turner A. D., Dhanji-Rapkova M., Coates L., Bickerstaff L., Milligan S., O’Neill A., et al. (2017). Detection of Tetrodotoxin Shellfish Poisoning (TSP) Toxins and Causative Factors in Bivalve Molluscs From the UK. Mar. Drugs 15 (9), 277. doi: 10.3390/md15090277
UK Food Standards Agency (2020) Phytoplankton Results for England and Wales. Available at: https://data.gov.uk/dataset/9a86b044-58a3-46d0-8455-5046f5769627/phytoplankton-results-for-england-and-wales.
Uncles R., Clark J., Bedington M., Torres R. (2020). “Chapter 31 - On Sediment Dispersal in the Whitsand Bay Marine Conservation Zone: Neighbour to a Closed Dredge-Spoil Disposal Site,” in Marine Protected Areas. Eds. Humphreys J., Clark R. W. (Amsterdam, Netherlands: Elsevier), 599–629. doi: 10.1016/B978-0-08-102698-4.00031-9
Vandal T., Nemani R. (2019). “Temporal Interpolation of Geostationary Satellite Imagery With Task Specific Optical Flow,” in Arxiv Preprint Arxiv, vol. 1907, 12013. doi: 10.48550/ARXIV.1907.12013
Vanhoutte-Brunier A., Fernand L., Ménesguen A., Lyons S., Gohin F., Cugier P. (2008). Modelling the Karenia Mikimotoi Bloom That Occurred in the Western English Channel During Summer 2003. Ecol. Model. 210, 351–376. doi: 10.1016/j.ecolmodel.2007.08.025
Velo-Suárez L., Reguera B., González-Gil S., Lunven M., Lazure P., Nézan E., et al. (2010). Application of a 3D Lagrangian Model to Explain the Decline of a Dinophysis Acuminata Bloom in the Bay of Biscay. J. Mar. Syst. 83, 242–252. doi: 10.1016/j.jmarsys.2010.05.011
Venâncio A., Montero P., Costa P., Regueiro S., Brands S., Taboada J. (2019). “An Integrated Perspective of the Operational Forecasting System in Rías Baixas (Galicia, Spain) With Observational Data and End-Users,” in Computational Science – ICCS 2019. Eds. Rodrigues J. M. F., Cardoso P. J. S., Monteiro J., Lam R., Krzhizhanovskaya V. V., Lees M. H., Dongarra J. J., Sloot P. M. (Cham: Springer International Publishing). doi: 10.1007/978-3-030-22747-0_18
Wells M. L., Karlson B., Wulff A., Kudela R., Trick C., Asnaghi V., et al. (2020). Future HAB Science: Directions and Challenges in a Changing Climate. Harmful Algae 91, 101632. doi: 10.1016/j.hal.2019.101632
Widdicombe C. E., Eloire D., Harbour D., Harris R. P., Somerfield P. J. (2010). Long-Term Phytoplankton Community Dynamics in the Western English Channel. J. Plankton Res. 32, 643–655. doi: 10.1093/plankt/fbp127
Keywords: harmful algal bloom (HAB), HAB forecast, HAB advection, lagrangian modelling, Dinophysis acuta, Karenia mikimotoi
Citation: Bedington M, García-García LM, Sourisseau M and Ruiz-Villarreal M (2022) Assessing the Performance and Application of Operational Lagrangian Transport HAB Forecasting Systems. Front. Mar. Sci. 9:749071. doi: 10.3389/fmars.2022.749071
Received: 28 July 2021; Accepted: 23 May 2022;
Published: 25 July 2022.
Edited by:
Marcos Mateus, Universidade de Lisboa, PortugalReviewed by:
Clarissa Anderson, University of California, San Diego, United StatesJoe Silke, Marine Institute, Ireland
Copyright © 2022 Bedington, García-García, Sourisseau and Ruiz-Villarreal. This is an open-access article distributed under the terms of the Creative Commons Attribution License (CC BY). The use, distribution or reproduction in other forums is permitted, provided the original author(s) and the copyright owner(s) are credited and that the original publication in this journal is cited, in accordance with accepted academic practice. No use, distribution or reproduction is permitted which does not comply with these terms.
*Correspondence: Michael Bedington, bWJlQHBtbC5hYy51aw==; Manuel Ruiz-Villarreal, bWFudWVsLnJ1aXpAaWVvLmNzaWMuZXM=