 Yin-Zheng Lai
 Chih-Wei Tu
 Chih-hao Hsieh
 Chia-Ying Ko
- 1Institute of Fisheries Science, National Taiwan University, Taipei, Taiwan
- 2Department of Life Science, Institute of Oceanography, Ecology, and Evolutionary Biology, National Taiwan University, Taipei, Taiwan
- 3National Center for Theoretical Sciences, Taipei, Taiwan
- 4Department of Life Science, Biochemical Science and Technology, National Taiwan University, Taipei, Taiwan
Environmental and climatic changes are expected to redistribute species, altering the strengths of species interaction networks; however, long-term and large-scale evaluations remain elusive. One way to infer species interaction networks is by analyzing their geographical overlaps, which provides indices of species interdependence, such as mean spatial robustness (MSR), which represents the geographical impact of a species on other species, and mean spatial sensitivity (MSS), which indicates how a species is influenced by other species. Integrating MSR and MSS further allows us to assess community coexistence stability and structure, with a stronger negative relationship between MSR and MSS (i.e., species are unequally dependent on each other) within a community at a given time suggesting a more stable community. Here, we assessed multidecadal changes in adult marine fish communities using bottom trawl datasets across latitudes from 1982 to 2011 in the Eastern US Continental Shelf, North Sea, and Eastern Bering Sea. Consistent, significant long-term increasing temporal trends of MSR and MSS were found in all three large marine communities. MSR exhibited strong correlations with species’ range sizes, especially in high-latitude communities, while MSS was strongly positively correlated with species’ median proportion of overlap with interacting species. The relationships between MSR and MSS were generally negative, indicating stably coexisting fish communities. However, the negative relationships weakened over time, implying that the coexisting fish communities gradually became unstable. Our findings provide an assessment of changes in spatially geographical aspects of multiple species, for decades and at mid- to high latitudes, to allow the detection of global ecological changes in marine systems by alternative estimation of geographic overlaps of species interaction networks. Such species co-occurrence estimation can help stay vigilant of strategies for accelerating climate change mitigation particularly at coarser spatial scales.
Introduction
Species interactions play an important role in determining both species- and community-level responses to environmental and climatic changes, resulting in compositional changes and reorganization and ultimately leading to a high risk of ecological imbalance and changes in the dynamics of ecosystem functioning (Parmesan and Yohe, 2003; Walther, 2010; Singer et al., 2013; Goldenberg et al., 2018). Increasing numbers of studies have demonstrated impacts of environmental and climatic changes on multiple types of species interactions within communities, particularly in terrestrial (Tylianakis et al., 2008; Lee et al., 2019) and marine microbial ecosystems (Fuhrman et al., 2015). However, long-term and large-scale estimates of such species interaction consequences in higher-trophic-level marine fish communities remain scarce due to limited underwater technology, personpower, and financial requirements (Cazelles et al., 2016; Pulver et al., 2016; Sander et al., 2017; Freilich et al., 2018). An alternative approach for inferring species interactions is constructing possible species co-occurrence networks describing the geographic overlap of co-occurring species, i.e., the higher species interaction would exist if species overlap, despite debates about the relationship between co-occurrences and ecological interactions (Araújo et al., 2011; Blanchet et al., 2020; Münkemüller et al., 2020). Species occurrences have recently been employed to reduce difficulties in assessing the independence of mechanisms underlying single abiotic and biotic or synergistic controls of changes in species interactions, particularly at coarser spatial scales (Araújo et al., 2011; Cazelles et al., 2016; Trivellone et al., 2017; Freilich et al., 2018; Griffith et al., 2018). Moreover, the advantages of such species co-occurrence estimation has revealed its inclusiveness, including the use of presence-absence, abundance, and fishery observational data; its high applicability in testing a range of ecological and evolutionary hypotheses, from individualistic extinction to the degree of connectance by asymmetrical interactions in communities; and its utility as a fishery management tool for choosing multispecies quota allocations (Williams et al., 2014; Freilich et al., 2018; Griffith et al., 2018).
The spatial robustness and sensitivity of species are important proxies recently developed to evaluate the potential geographical interaction networks of species (Bascompte et al., 2006; Araújo et al., 2011). These two indices separately represent a species’ contribution to the community and/or ecosystem, i.e., its importance to the community/ecosystem, and its potential dependence on other species, i.e., the extent to which it is affected by other species, respectively (Bascompte et al., 2006; Araújo et al., 2011). More specifically, by emphasizing the ability of a species to maintain geographical interaction networks after being subjected to environmental and climatic changes, the former examines proportions of the geographical distributions of all other species that overlap with that of a focal species, while the latter measures the proportions of the geographical distribution of the focal species that overlap with those of all other species. Assessing both the robustness and sensitivity of individual species allows the role of each species in a community to be determined and provides information on community coexistence stability and structure. In other words, when a species has high robustness but low sensitivity, it contributes greatly to the community/ecosystem as a keystone species, increasing community strength and coexistence stability, and is not easily influenced by other species. In contrast, when a species shows low robustness and high sensitivity, it makes limited contributions to the community, is easily affected by other species, and is at risk of being eliminated. When a species shows similar performance levels in terms of robustness and sensitivity, i.e., both high or both low, it has the same level of high or low influence on its environment and community. However, few studies have considered species’ spatial robustness and sensitivity in relation to ecological responses to environmental and climatic changes. Additionally, without a long-term database, it is difficult to explore the factors and processes underlying the proximate causes.
To further bridge species interaction networks and community-level influences under environmental and climatic changes, comparing the relationships between spatial robustness and sensitivity across species within a community can reveal the degree of asymmetry among geographically overlapping species in the community, also indicating the overall interdependency between species in the community (Araújo et al., 2011; Griffith et al., 2018). Most community coexistence structures eventually become asymmetrical, thus forming a stable ecosystem (Bascompte et al., 2006; Rooney et al., 2006). In general, a community with many species displaying asymmetrical interaction networks, i.e., a community with negative relationships between species’ spatial robustness and sensitivity, is greatly robust to the random loss of species under environmental and climatic changes because most of its species are poorly connected, but it simultaneously faces a hidden crisis driven by high sensitivity to the loss of keystone species. In contrast, a highly connected community with symmetrical interaction networks among species, i.e., positive relationships between species’ spatial robustness and sensitivity, is susceptible to environmental and climatic changes that, if exacerbated, may facilitate ecosystem collapse. Thus, quantifying the degree of asymmetry between species is crucial for determining community coexistence stability and structure.
Here, we provided a comprehensive, species- to community-level assessment of changes in adult fish geographical interaction networks over three decades (1982–2011) in three large marine communities across latitudes. The three large marine communities are located in the Eastern US Continental Shelf and the North Sea in the Atlantic Ocean and the Eastern Bering Sea in the Pacific Ocean (Figure 1A). Recent observations have shown that these areas have undergone large changes, particularly increases in sea surface temperature, indicating that they are highly vulnerable to climate change, despite a short-term slowdown in the warming in the Eastern Bering Sea after a regional remarked decrease in 2008 (Shearman and Lentz, 2009; Høyer and Karagali, 2016; Siddon and Zador, 2018; Figure 1B). Our goals were (1) to track temporal changes in species’ spatial robustness and sensitivity in the communities, (2) to examine the factors underlying changes in geographical overlap between the species, and (3) to examine the congruence of changes in community existence stability and structure in order to better understand the risks posed to marine fish species by environmental and climatic changes. Significant variation in species richness and turnover rates has been observed in marine assemblages, particularly those located in polar regions, due to the physiological constraints of marine species (Blowes et al., 2019). Therefore, we hypothesized that under environmental and climatic changes, the strength of species geographical interaction networks would exhibit greater changes over time in the high-latitude oceans than in the mid-latitude oceans in our focal study areas. In addition, with the importance of regional variability, such as that in ice melting rates, hydrological cycles, and ocean currents (Wendler et al., 2014; Xie et al., 2015; Lévy et al., 2018), in explaining community-level responses under environmental pressure, marine assemblages may be affected by not only latitudinal temperature gradients but also the regional climate, the latter of which is expected to exert stronger influences than the former. We thus hypothesized that the responses of marine communities, even at similar latitudes, to environmental and climatic changes would vary regionally. The changes in patterns of fish community coexistence structure might be vital indicators for future marine conservation strategies and regional ocean management under continued environmental and climatic changes.
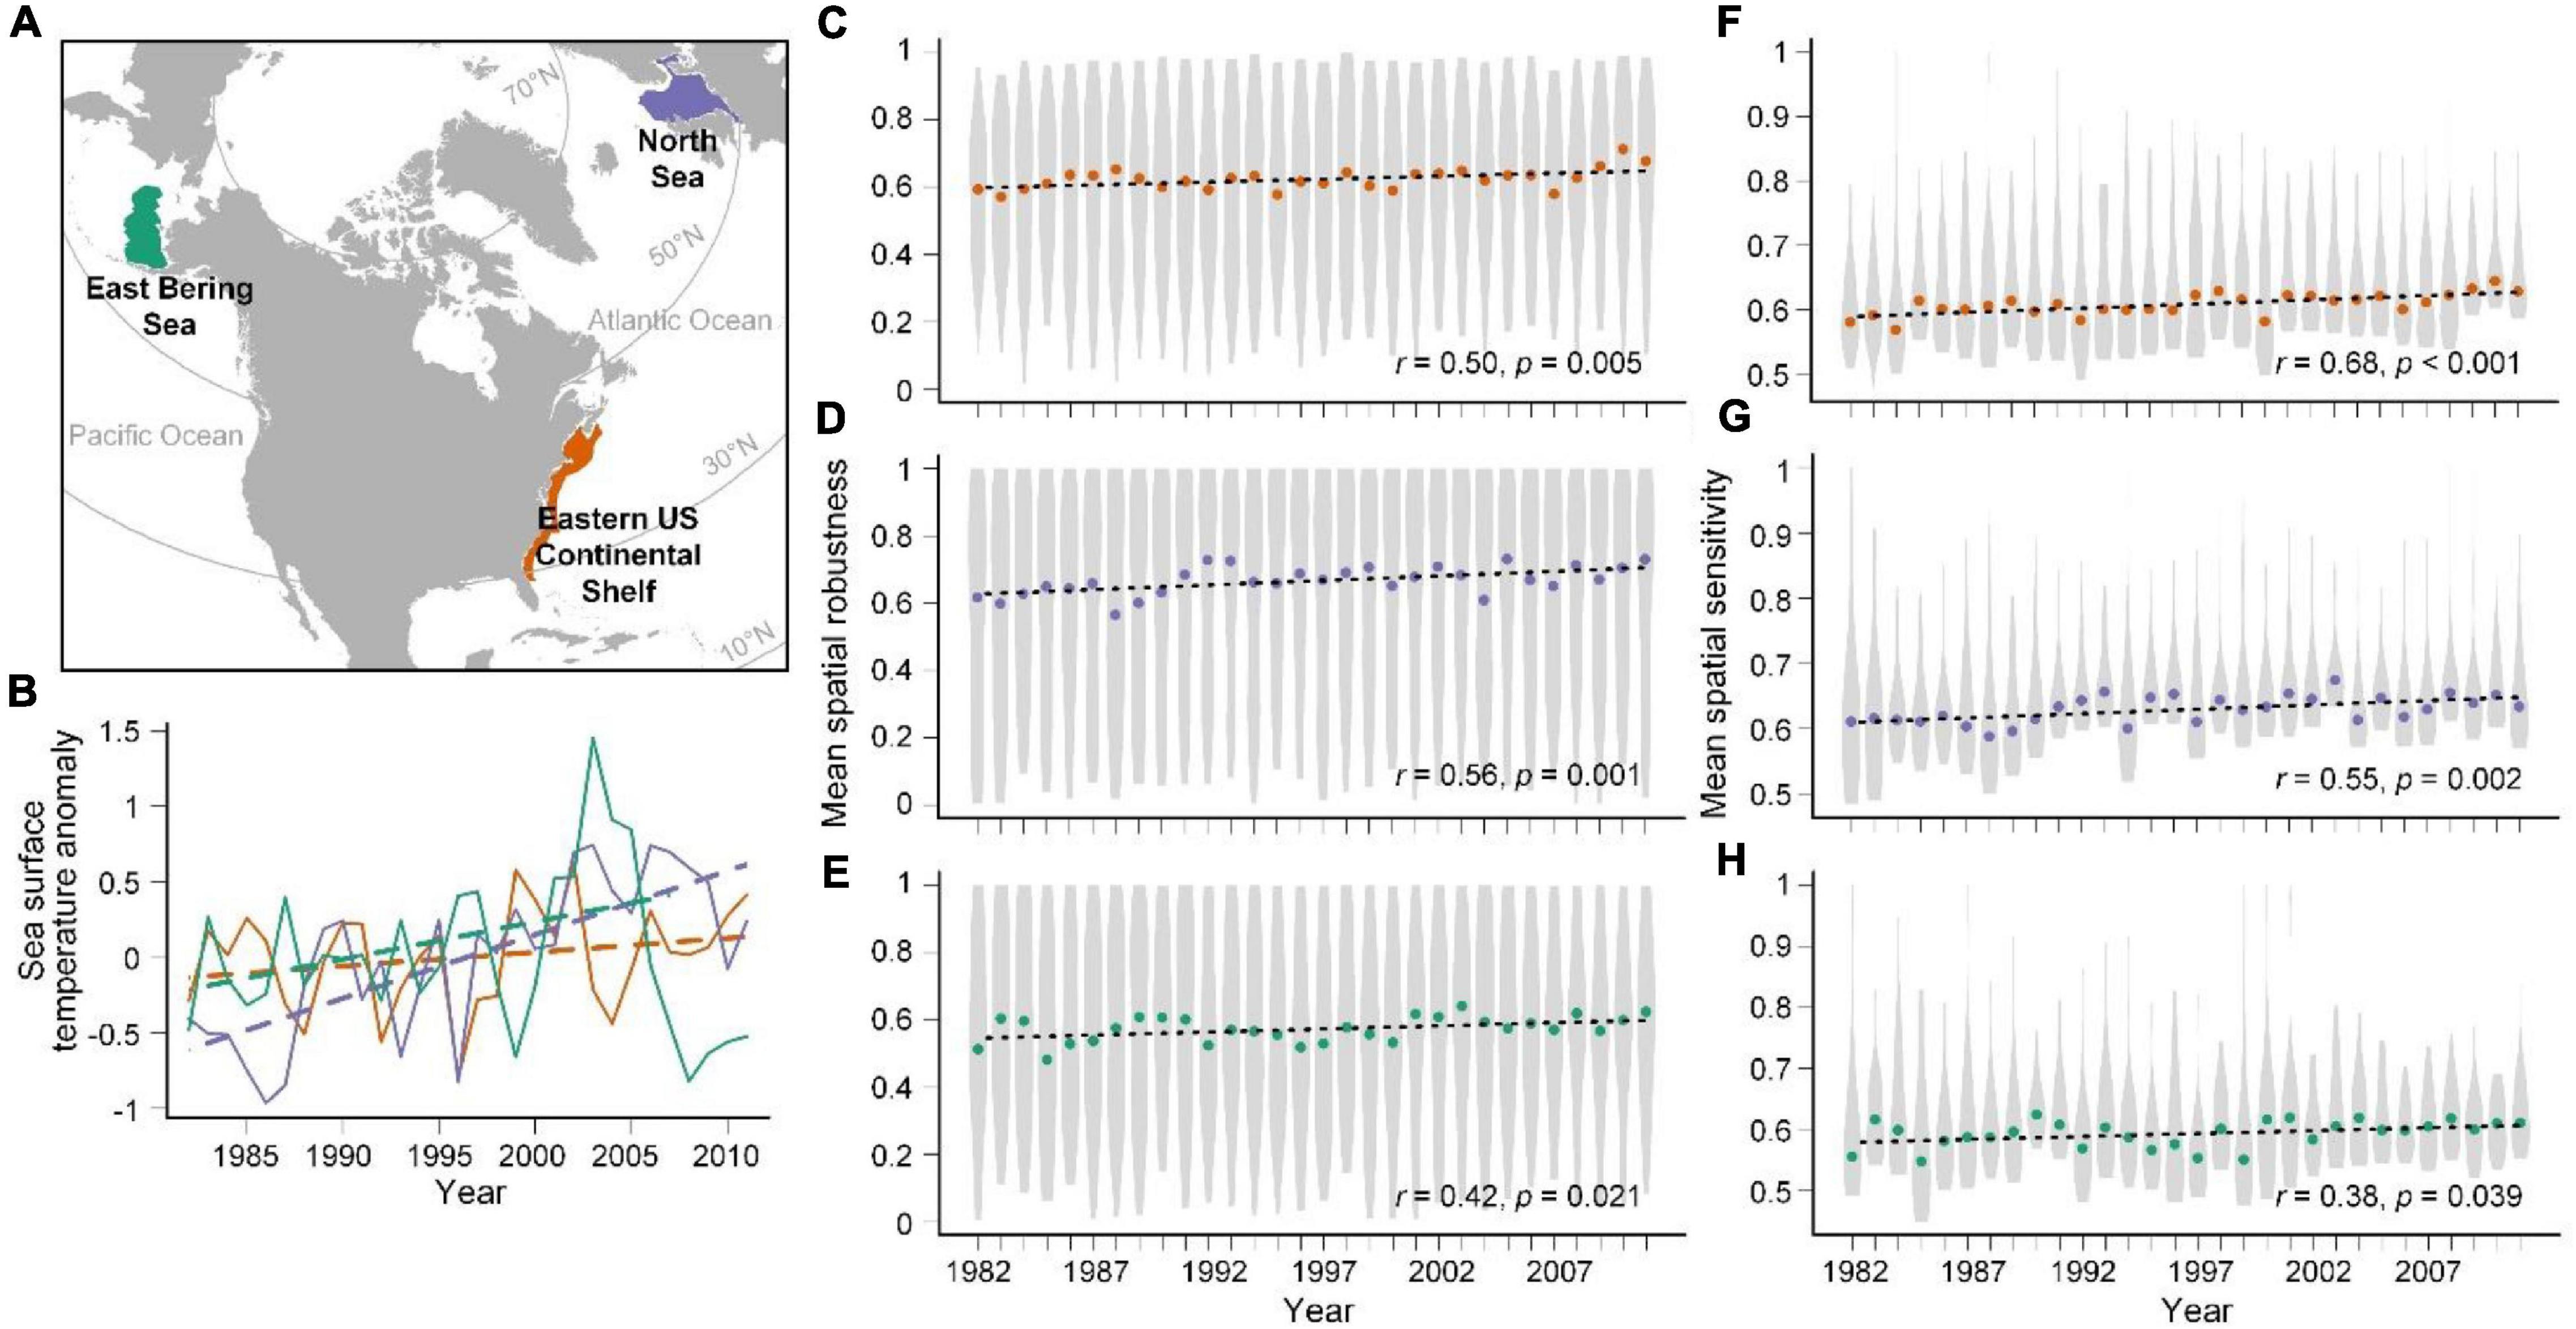
Figure 1. Map of the three large marine communities (A), SST anomalies (B), temporal trends of mean spatial robustness (MSR) (C–E), and mean spatial sensitivity (MSS) (F–H). Annual SST anomalies were calculated with respect to 1982–2011 climatology. SSTs in °C were obtained from 1/4° daily Optimum Interpolation Sea Surface Temperature (OISST) data: AVHRR-Only, which used infrared satellite data from the Advanced Very High Resolution Radiometer (AVHRR) and were downloaded from NOAA’s National Centers for Environmental Information (NCEI). We calculated the mean SST value of each year according to the extracted spatial range of our study regions. A slowly increasing SST trend after 2008 is observed in the Eastern Bering Sea. Violin plots showing MSR (C–E) and MSS (F–H) in each year. Orange, purple, and green represent the results for the Eastern US Continental Shelf, North Sea, and Eastern Bering Sea, respectively. In the violin plots, circles represent median values, and the widths of the gray horizontal regions of the plots represent the density of the data along the Y-axis. The black dashed lines represent linear temporal correlations of MSR and MSS with year. The time-series correlation coefficients and p-values are shown.
Materials and Methods
Species Data
Adult fish species data were compiled from three long-term bottom trawl datasets from 1982 to 2011 provided by the Northeast Fisheries Science Center (NEFSC) Bottom Trawl Project, North Sea International Bottom Trawl Survey (NS-IBTS), and Eastern Bering Sea Continental Shelf (EBSS) Survey. These surveys were conducted in the ocean off the eastern US coast (including regions belonging to the large marine ecosystems of the Northeast US Continental Shelf and the northern part of the Southeast US Continental Shelf, hereafter referred to as the Eastern US Continental Shelf), North Sea, and Eastern Bering Sea (excluding the Aleutian Islands), respectively, in the Atlantic and Pacific Oceans. The depth was less than 200 m in most of the study regions, but it reached a maximum of 500 m in some regions, especially along the Eastern US Continental Shelf and in the North Sea (O’Reilly and Zetlin, 1998; Sündermann and Pohlmann, 2011; Kleisner et al., 2017; Siddon and Zador, 2018).
Fish data from the Eastern US Continental Shelf were collected seasonally in spring and fall. The continental shelf region was stratified according to the major stratum boundaries determined by depth. Large strata were first divided into areas equivalent to 5 min latitude by 10 min longitude. Stations were sampled from large strata and smaller, narrower inshore, and offshore strata with an area of only 2.5 min latitude by 2 min longitude to ensure equal chances of being sampled. Approximately, 440–450 stations dispersed within the project region yielded a complete survey. At each station, a trawl was towed at 3.5 knots relative to the bottom with the tow direction generally toward the next station. Fish surveys in the North Sea have been consistently conducted between January and February since 1965, with enhanced sampling between July and August since 1991. We used only the data collected between January and February in this study to ensure comparability with other large marine community data collected within the same multidecadal timeframe. The division of the survey grids was based on the International Council for the Exploration of the Sea (ICES) statistical rectangles of approximately 30 by 30 nautical miles, i.e., approximately 0.5 degrees latitude by 1 degree longitude. The vessels were free to choose any position in the rectangles as long as the hauls were separated by at least 10 nautical miles wherever possible. Tows in adjacent rectangles were also separated by at least 10 nautical miles. Historically, during the first-quarter survey, the length of sweeps depended on the bottom depth. The sweeps included back-strops and connectors with a total length of 60 m (depths < 70 m) or 110 m (deeper waters). A standard tow was performed for 30 min. For the fish data collected in the Eastern Bering Sea, 356 stations were visited annually, particularly in June and July, and a 30-min trawl was conducted at each station.
We determined species’ geographical distributions in each year by drawing the smallest convex polygon that enclosed the occurrences of each species in ArcGIS version 10.5. The species distributions were then converted to presence-absence information grid cells with a spatial resolution of 0.5 degrees latitude by 0.5 degrees longitude.
Pairs of species with a significant association (<0.05) of their co-occurrence probabilities were considered to have annual co-occurrence patterns (Veech, 2013). Species that were randomly associated with all other species, i.e., without significant associations, were removed to reduce sampling bias (i.e., random appearance in each year) and improve the representation of geographical interaction networks among fish species in each study region. To emphasize internal changes, only non-randomly associated species with 30-year occurrences were analyzed. From 1982 to 2011, the Eastern US Continental Shelf had a total of 54 fish species occupying 187 of the 248 total grid cells, the North Sea had 51 fish species occupying 368 of the 377 total grid cells, and the Eastern Bering Sea had 34 fish species occupying 337 of the 338 total grid cells.
Geographical Overlap Between Species
Species’ spatial robustness and sensitivity were considered as indices of geographical interaction networks in this study (Araújo et al., 2011; Neeson and Mandelik, 2014; Griffith et al., 2018). The annual potential strength of geographical interaction networks between a target species and all other species was estimated according to relative dependency, which was quantified by the proportion of geographical overlap between the species. Mean spatial robustness (MSR) was calculated by normalizing the sum of proportions of geographical distributions of all other species B1…n that overlapped with that of a target species A and then dividing it by the number of all other species n to obtain the average value:
High MSR revealed a large geographical overlap proportion connecting the target species A with all other species, i.e., a strong geographical interaction network of the target species A with other species on average. Target species A was then assumed to make a major contribution to community/ecosystem robustness.
The mean spatial sensitivity (MSS) of an individual species to the loss of potential interaction networks with other species was calculated as the sum of the proportions of the geographical distribution of the target species A overlapping with those of other species B1…n divided by the number of all other species n to obtain the average value:
Here, high MSS implied that a species was highly dependent on other species, whereas a species with low MSS was not.
Although both MSR and MSS were calculated using spatial geographical overlap, their focuses were different. MSR emphasized the impacts of the focal species on the other (non-focal) species, whereas MSS emphasized the influences of the other species on the focal species. Unless the geographical interaction networks between species were totally symmetrical, species would differ in their MSR and MSS indices due to differences in the proportion of geographical overlap and the number of species they had interacted with (Bascompte et al., 2006; Rooney et al., 2006; Araújo et al., 2011; Griffith et al., 2018).
Statistical Analyses
We quantified temporal trends over 30 years in MSR and MSS based on annual medians with Pearson correlations. Regressions between the geographical interaction networks of individual species and sea surface temperature obtained from 1/4° daily Optimum Interpolation Sea Surface Temperature (OISST) data among the three large marine fish communities were assessed and evaluated by the t-test for not equal to 0. To explore the factors underlying changes in species’ geographical interaction networks in each marine fish community over time, the temporal relationships of MSR and MSS with species’ range sizes, the number of interacting species, and the median overlap proportion with interacting species were estimated. We then compared frequency distributions by pairwise testing among the three marine fish communities using a two-sample Kolmogorov-Smirnov test. The size of a species’ range was calculated as the number of presence grid cells in the species’ geographical distribution per year. The number of species whose geographical distributions overlapped with that of a target species was considered the number of interacting species for the target species. We used annual medians to represent the degree of overlap of the target species with all of its interacting species every year. Community coexistence stability was evaluated by the relationships between the annual MSR and MSS of individual species using Pearson correlations. Habitat preference and commercial utilization data for the fish species (Froese and Pauly, 2019) were collected to identify the characteristics of potential keystone species, which were specifically defined by an MSR value > 0.8 in this study (Griffith et al., 2018). The individual species were categorized into seven groups according to their habitat preferences: pelagic-oceanic, pelagic-neritic, demersal, benthopelagic, bathypelagic, bathydemersal, and reef-associated. Species in the first two groups were then defined as pelagic species, those in the following four groups were defined as demersal species, and those in the last group were defined as reef-associated species. Regarding commercial utilization, species with highly commercial, commercial, and slightly commercial records were designated commercial species, whereas the remaining species were designated non-commercial species. All statistical analyses were performed using RStudio version 1.0.153 (RStudio Team, 2016).
Results
Temporal Changes in Mean Spatial Robustness and Mean Spatial Sensitivity
We found significant long-term increasing trends based on the medians over the 30-year period in both MSR and MSS of fish species in the three large marine communities: the Eastern US Continental Shelf, the North Sea, and the Eastern Bering Sea (all r > 0.38, p < 0.05; Figures 1C–H). The increases in both MSR and MSS indicated stronger geographical interaction networks between species and increasing potential species interaction networks in the communities, implying that all large marine fish communities may be currently experiencing changes in coexistence structure in terms of geographical interaction networks. Moreover, MSR showed greater variability than MSS (Figures 1C–H), illustrating uneven contributions of individual species to the communities; i.e., the influences of individual species on other species varied widely, whereas most species were little affected by other species. Investigation of the climate impacts of individual species over time revealed significant changes both in MSR and MSS among the three large marine fish communities across latitudes (all p < 0.05; Figure 2). However, the changes in high-latitude marine communities were not significantly higher than those in mid-latitude communities. The strength of long-term temporal correlations was even slightly lower in the high-latitude Eastern Bering Sea than in the other communities.
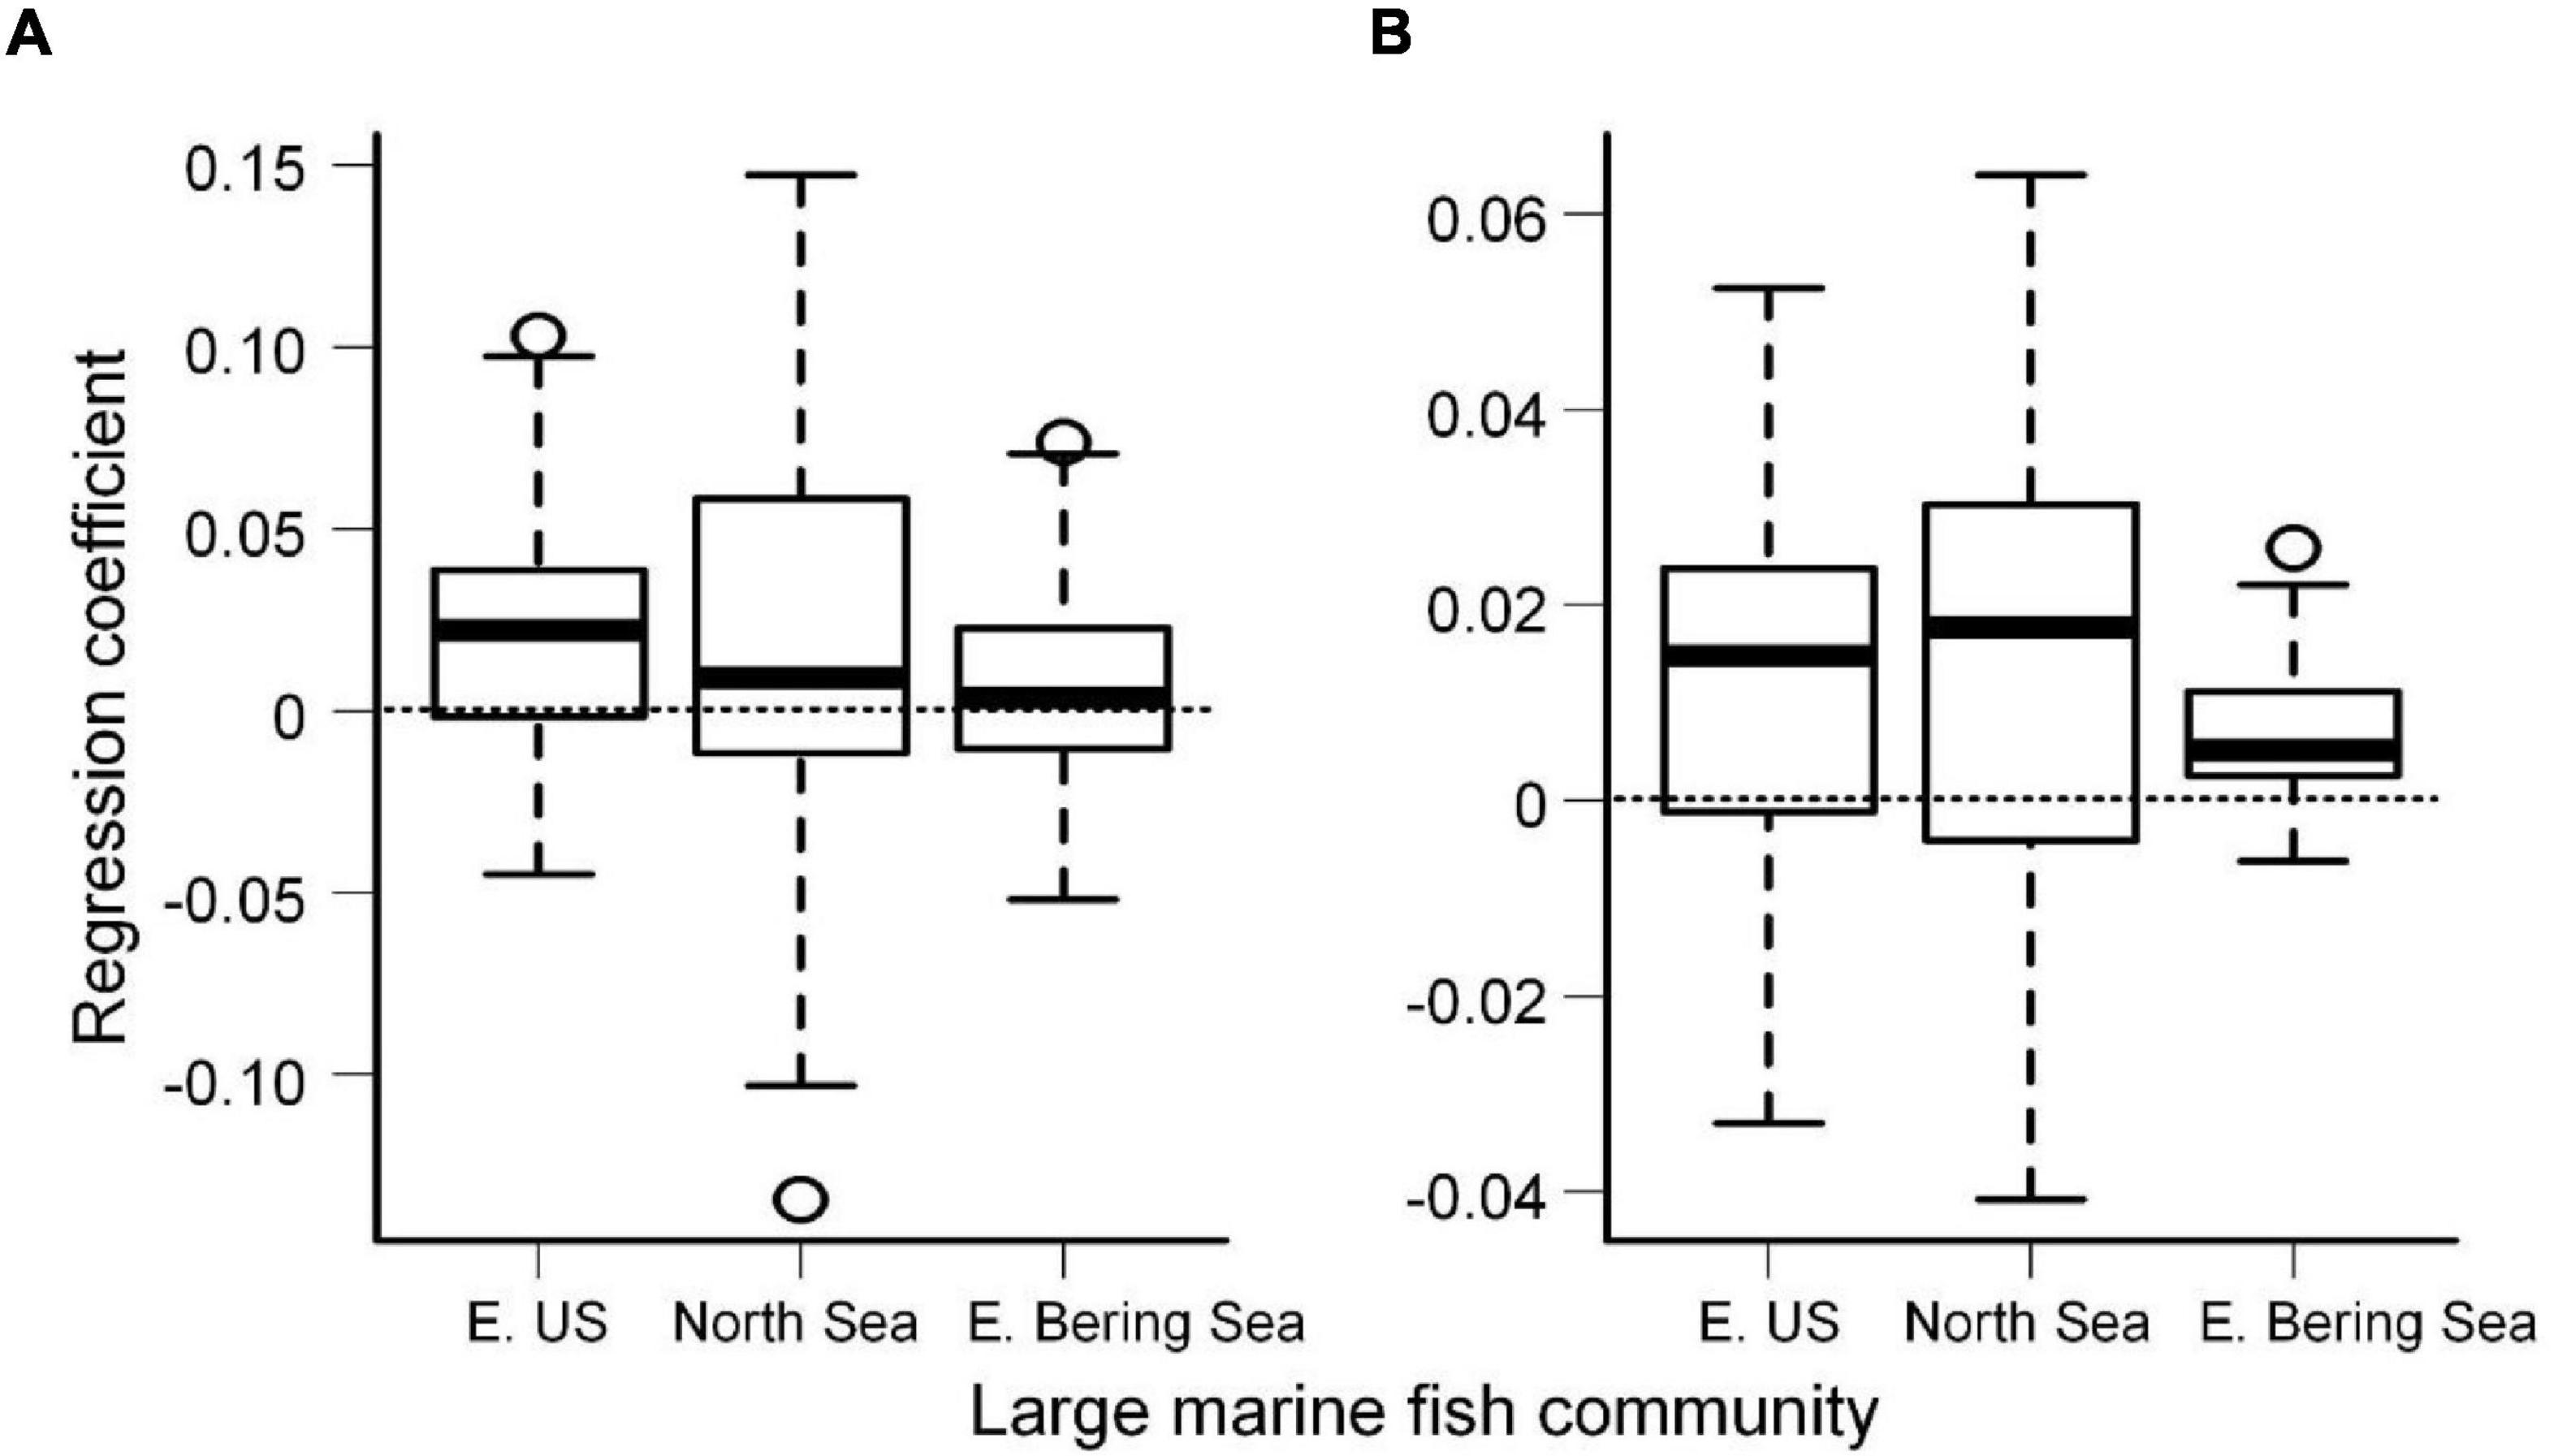
Figure 2. Boxplots illustrating regression trends between mean sea surface temperature and mean spatial robustness (A) and mean spatial sensitivity (B) of individual species over time in the Eastern US Continental Shelf, the North Sea, and the Eastern Bering Sea. The horizontal dashed lines indicate regression coefficients, i.e., slope, equal to 0.
Factors Underlying Species Geographical Interaction Networks
Overall, we observed temporal changes in three underlying factors that contributed to subsequent geographical interaction networks in most species among the communities. A total of 58.8–96.3 % of species exhibited positive temporal correlations for species’ range sizes, the number of interacting species, and median overlap proportion with interacting species among the communities over decades, except for temporal changes in species’ range sizes in the Eastern US Continental Shelf (42.6 %; Table 1). Among these factors, MSR was most strongly correlated with species’ range sizes (medians = 0.87, 0.97, and 0.91 and ranges = −0.01–0.99, −0.32–0.99, and −0.15–0.99 in the Eastern US Continental Shelf, North Sea, and Eastern Bering Sea, respectively), followed by the number of interacting species (medians = 0.51, 0.73, and 0.60 and ranges = −0.41–0.86, −0.14–0.91, and −0.06–0.86), and was weakly correlated with the median overlap proportion with interacting species (medians = 0.001, 0.03, and 0.02 and ranges = −0.60–0.66, −0.77–0.87, and −0.52–0.70; Figures 3A–C). The frequency distributions of correlation coefficient values between MSR and underlying factors in the large marine fish communities did not differ according to pairwise testing (all D = 0.1–0.3, all p > 0.05), although the frequency distributions for the relationships of MSR with species’ range sizes and the number of interacting species in the Eastern US Continental Shelf were slightly left-skewed relative to the others. In contrast, MSS exhibited the strongest correlations with median overlap proportion with interacting species (medians = 0.63, 0.74, and 0.66 and ranges = −0.37–0.86, −0.61–0.88, and −0.45–0.84; Figures 3D–F) but relatively weak correlations with species’ range sizes (medians = −0.41, −0.34, and −0.40 and ranges = −0.86–0.25, −0.85–0.52, and −0.77–0.54) and the number of interacting species (medians = −0.48, −0.33, and −0.61 and ranges = −0.89–0.27, −0.91–0.38, and −0.92–0.23). The correlation coefficient values between MSS and median overlap proportion with interacting species were distributed differently between the mid-latitude Eastern US Continental Shelf and the high-latitude North Sea marine fish communities (D = 0.6, p = 0.05).
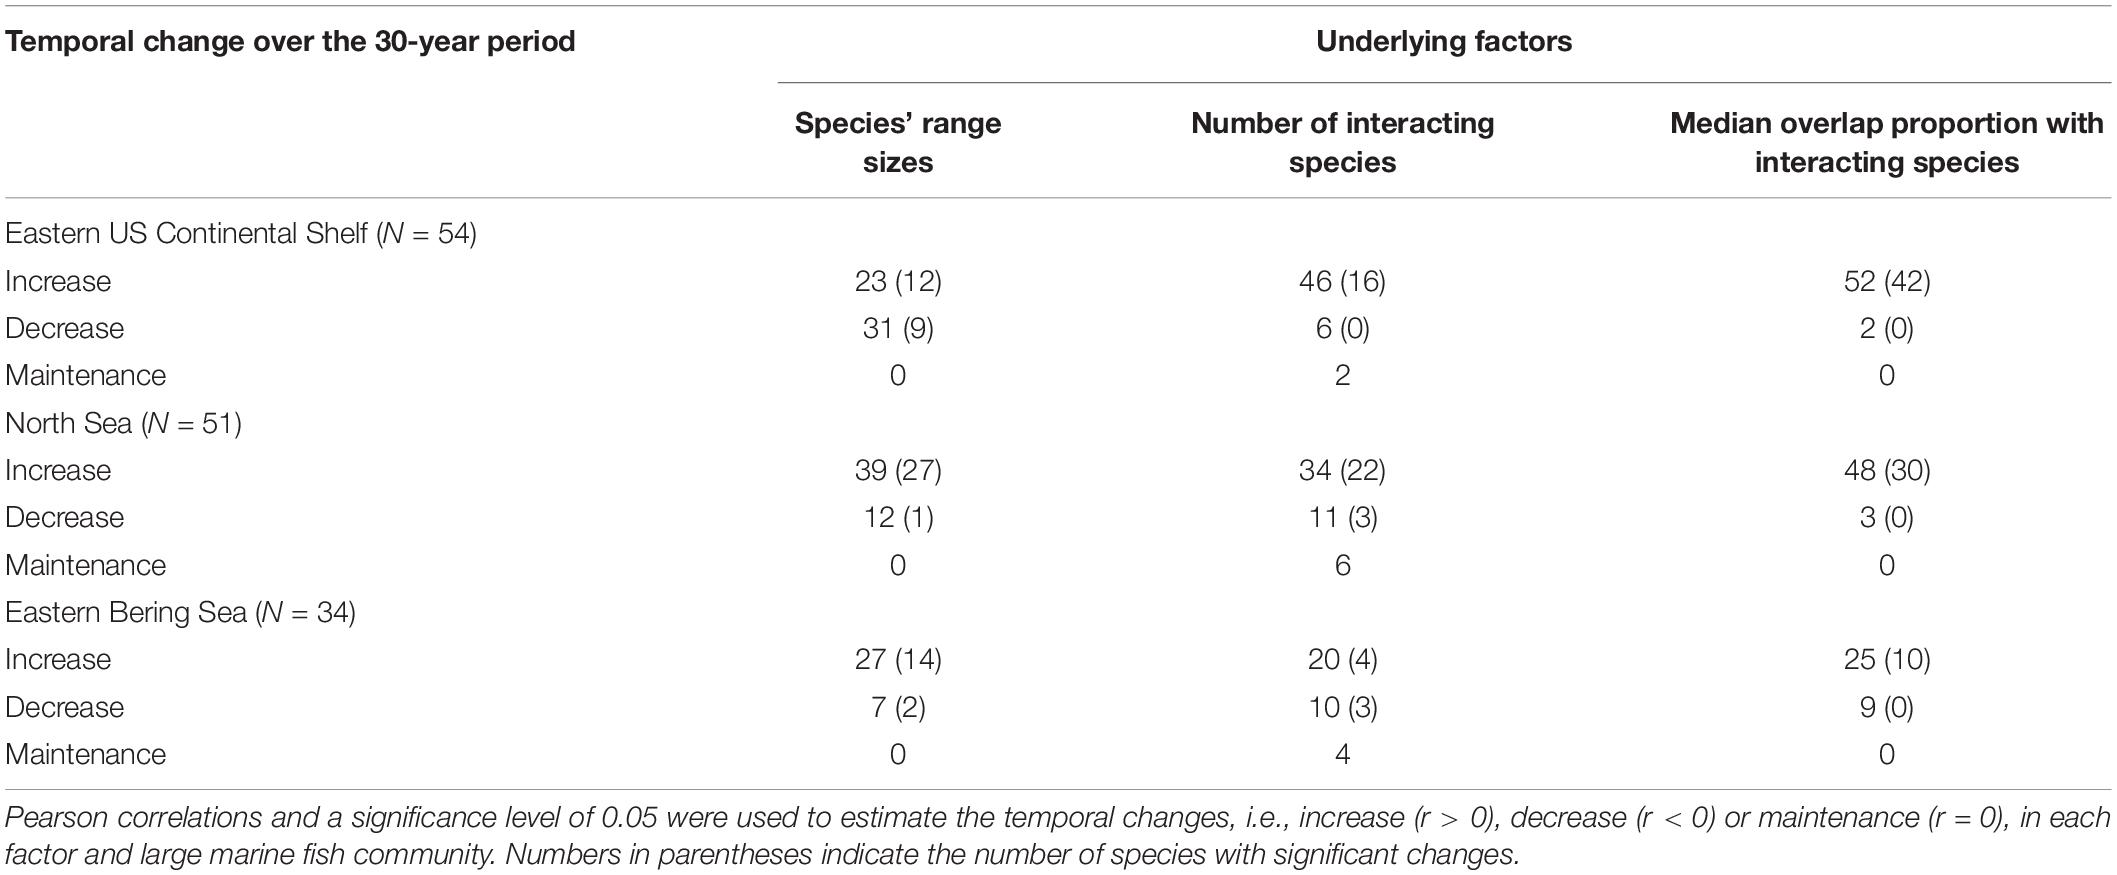
Table 1. Number of species showing different responses to underlying factors with time correlating species geographical interaction networks.
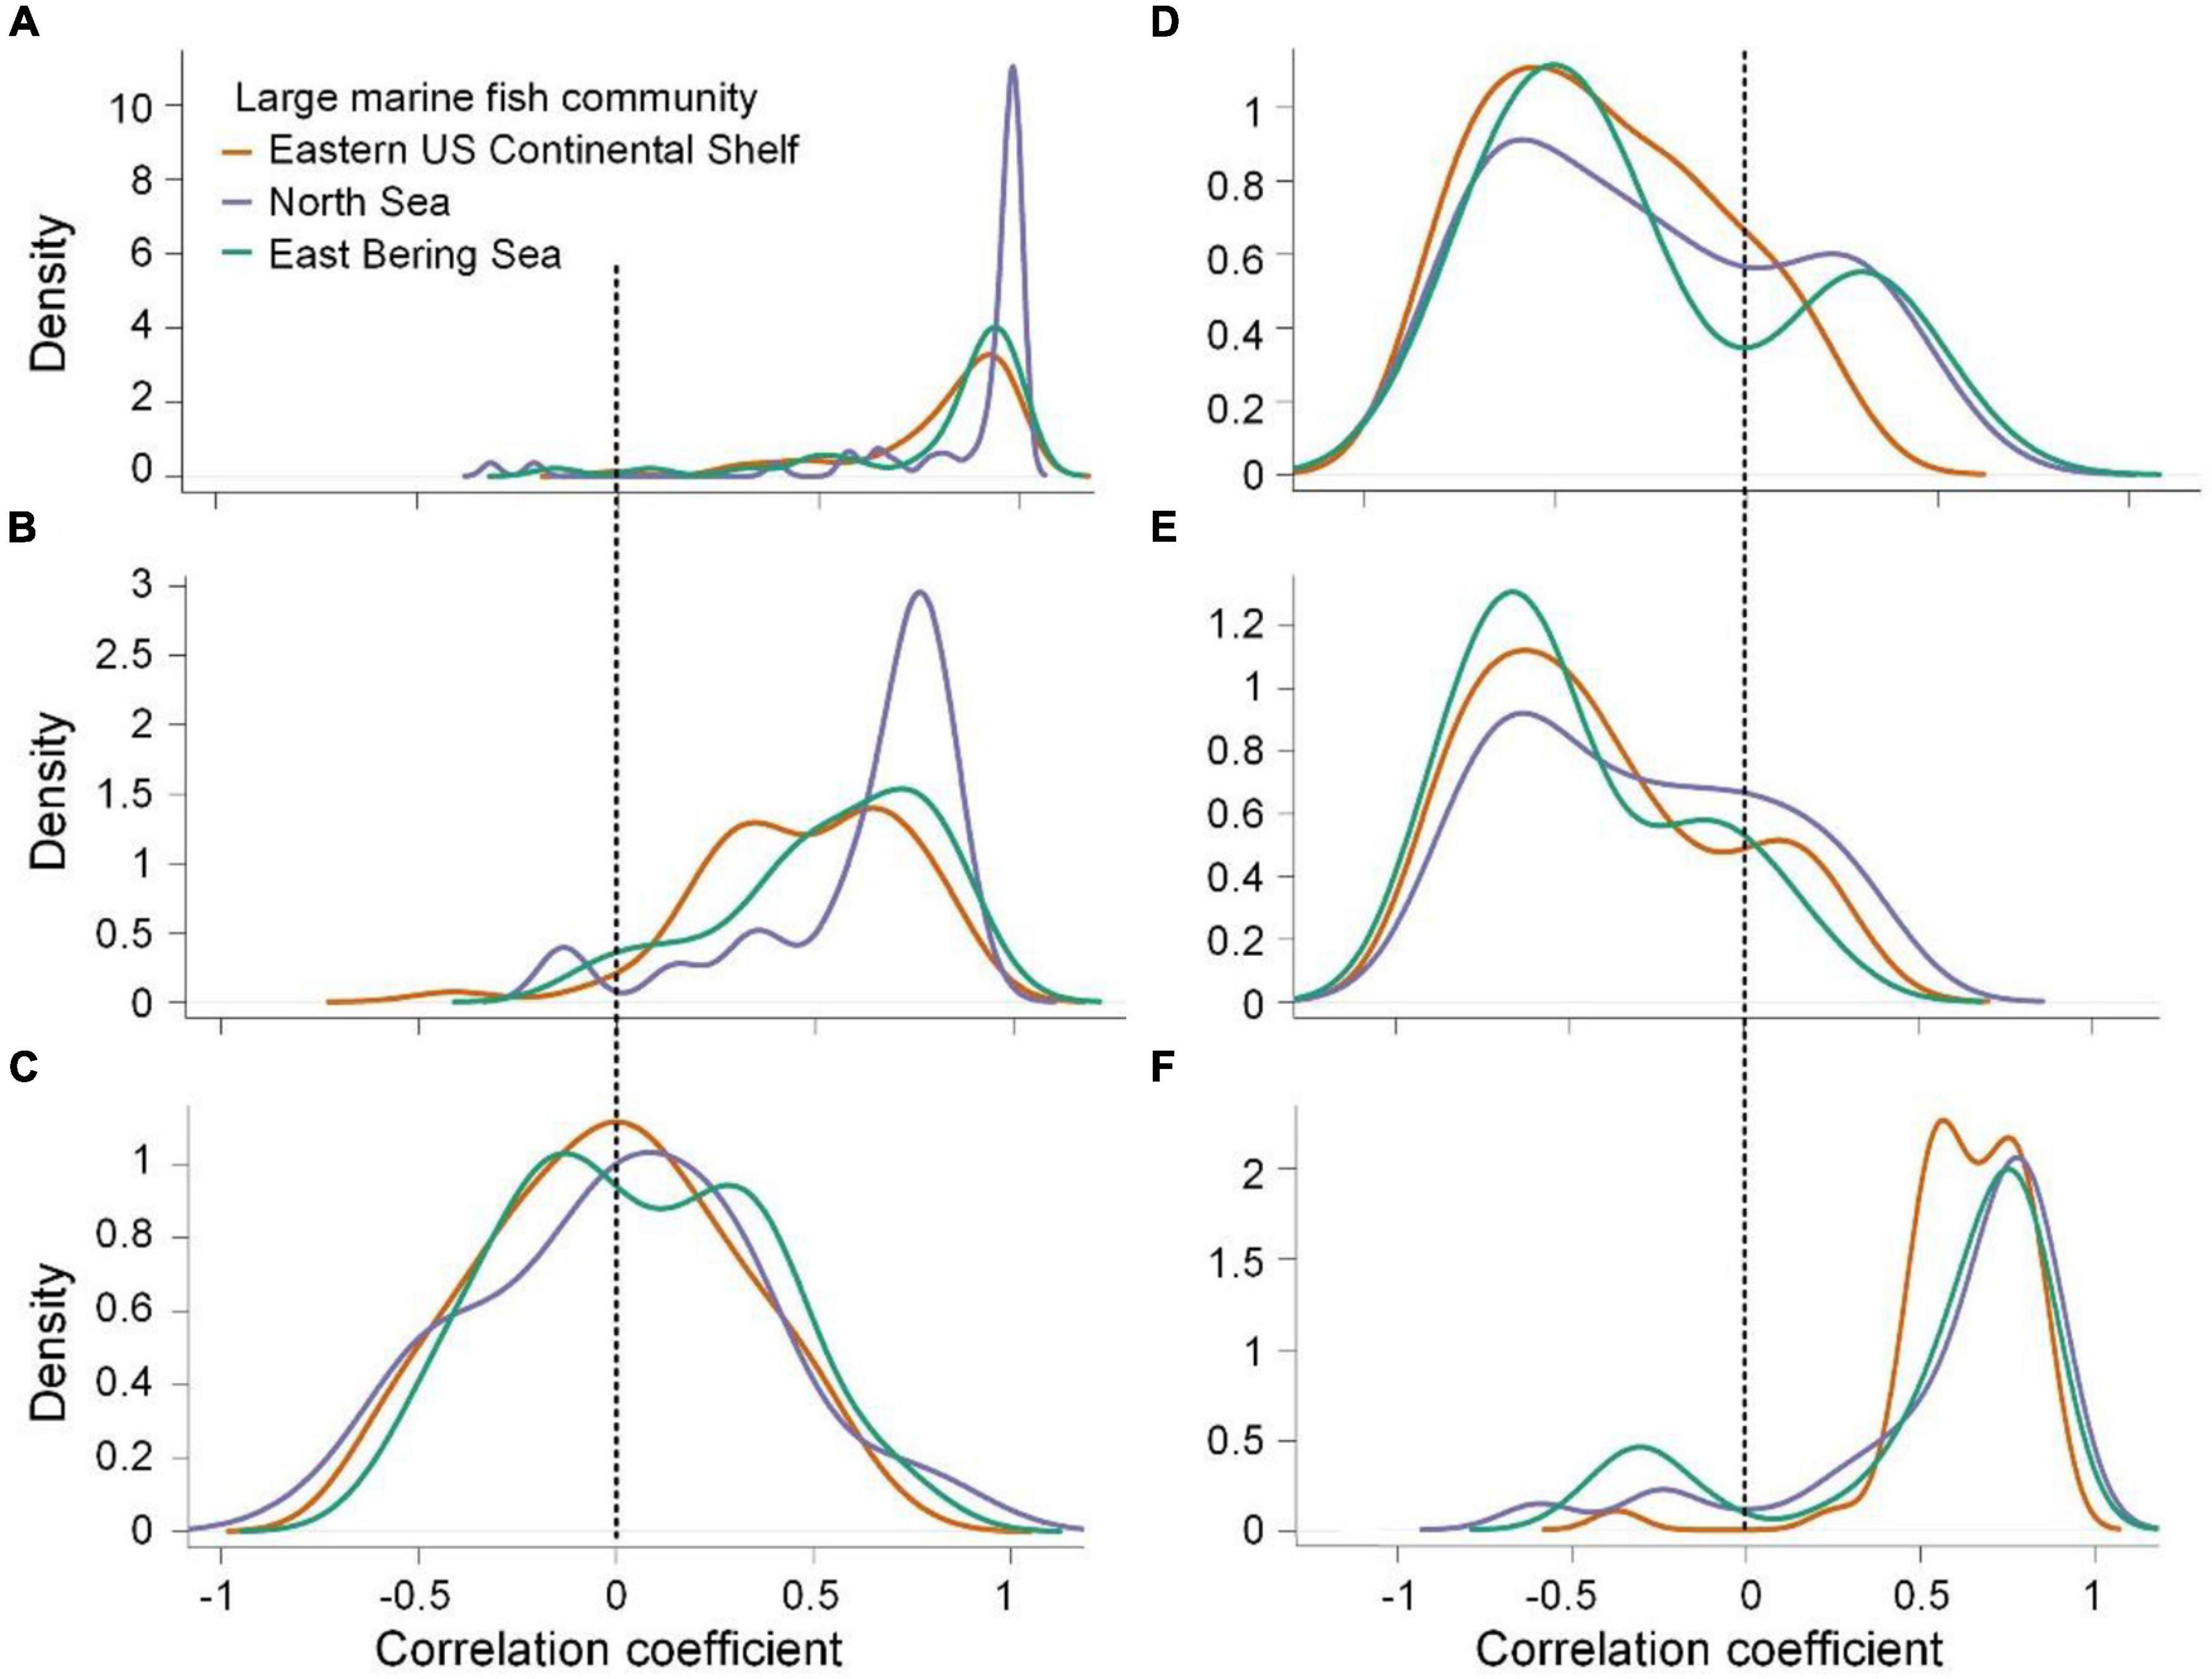
Figure 3. Density distributions of correlation coefficients between species’ mean spatial robustness and species’ range sizes (A), the number of interacting species (B), median overlap proportion with interacting species (C), correlation coefficients between species’ mean spatial sensitivity and species’ range sizes (D), number of interacting species (E), and median overlap proportion with interacting species (F) in the Eastern US Continental Shelf (orange), North Sea (purple), and Eastern Bering Sea (green). The vertical dashed lines indicate correlations equal to 0.
Temporal Changes in Community Coexistence Stability and Structure
Negative correlations were found between MSR and MSS, and there were decreases in correlation strength in all three large communities of marine fishes over the past three decades (Figure 4 and Supplementary Figure 1). This indicated that the large marine fish communities in this study exhibited asymmetrical geographical structures in coexistence that gradually became more symmetrical over time, demonstrating that these communities became unstable under environmental and climatic changes. The decreases in correlation strength were mainly caused by potential keystone species, i.e., the species with MSR values greater than 0.8 specifically defined in this study (Figure 5). The increases in MSS of these potential keystone species showed that these important species might be exposed to increasing risks from climate disturbance, which might trigger extinction cascades in food webs and threaten long-term community network persistence (Christianou and Ebenman, 2005; Gilljam et al., 2015).
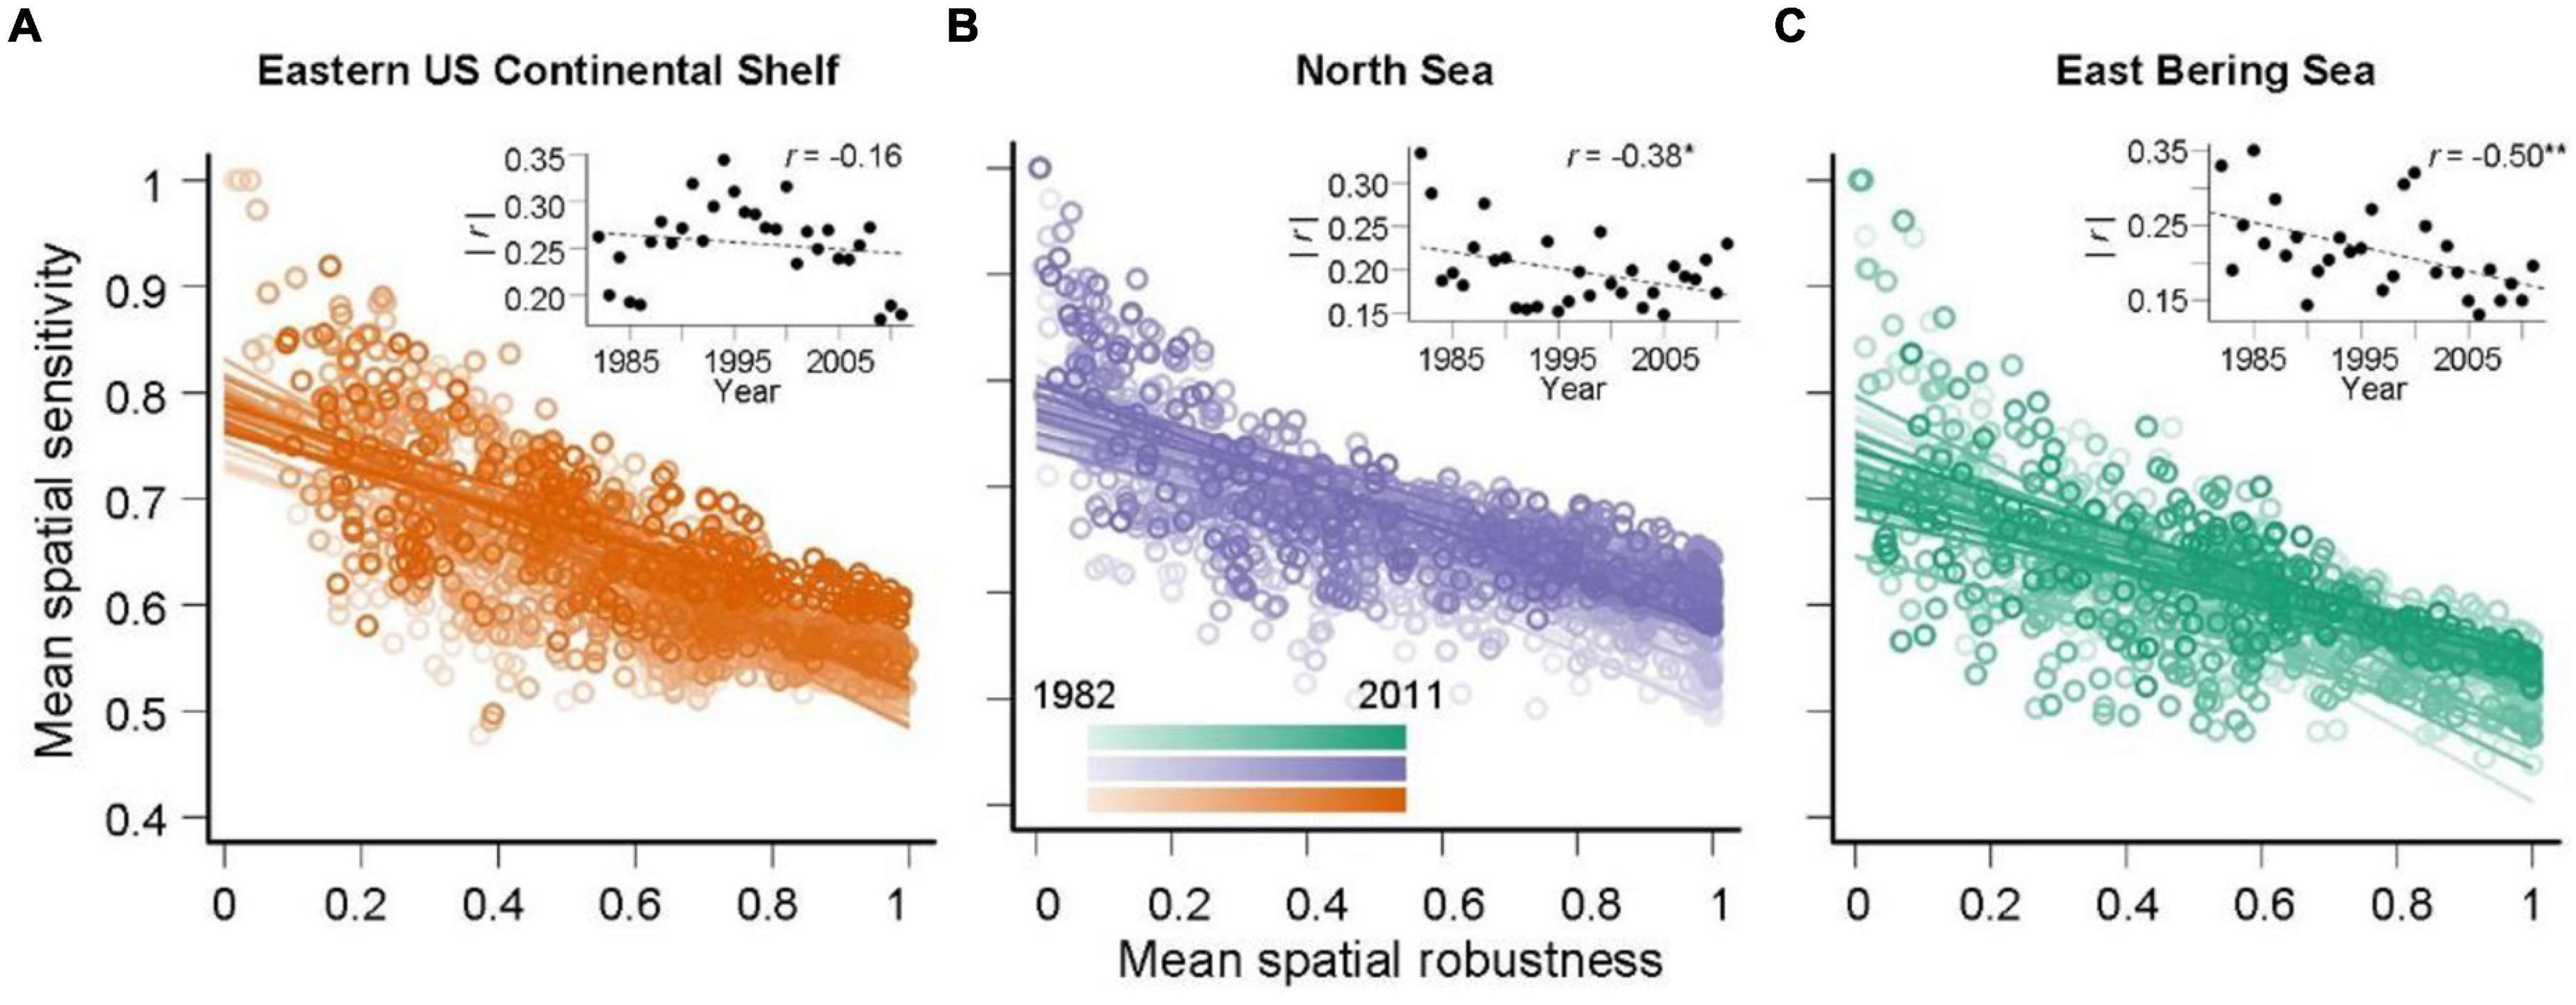
Figure 4. Relationships between species’ mean spatial robustness and sensitivity in the (A) Eastern US Continental Shelf, (B) North Sea, and (C) Eastern Bering Sea large marine fish communities. The linear relationships between species’ mean spatial robustness and sensitivity for each year are plotted to display correlation patterns year-by-year. Darker points and solid lines represent later years. The right-top panels provide linear temporal correlations and asterisks indicate significance (*p < 0.05; **p < 0.01).
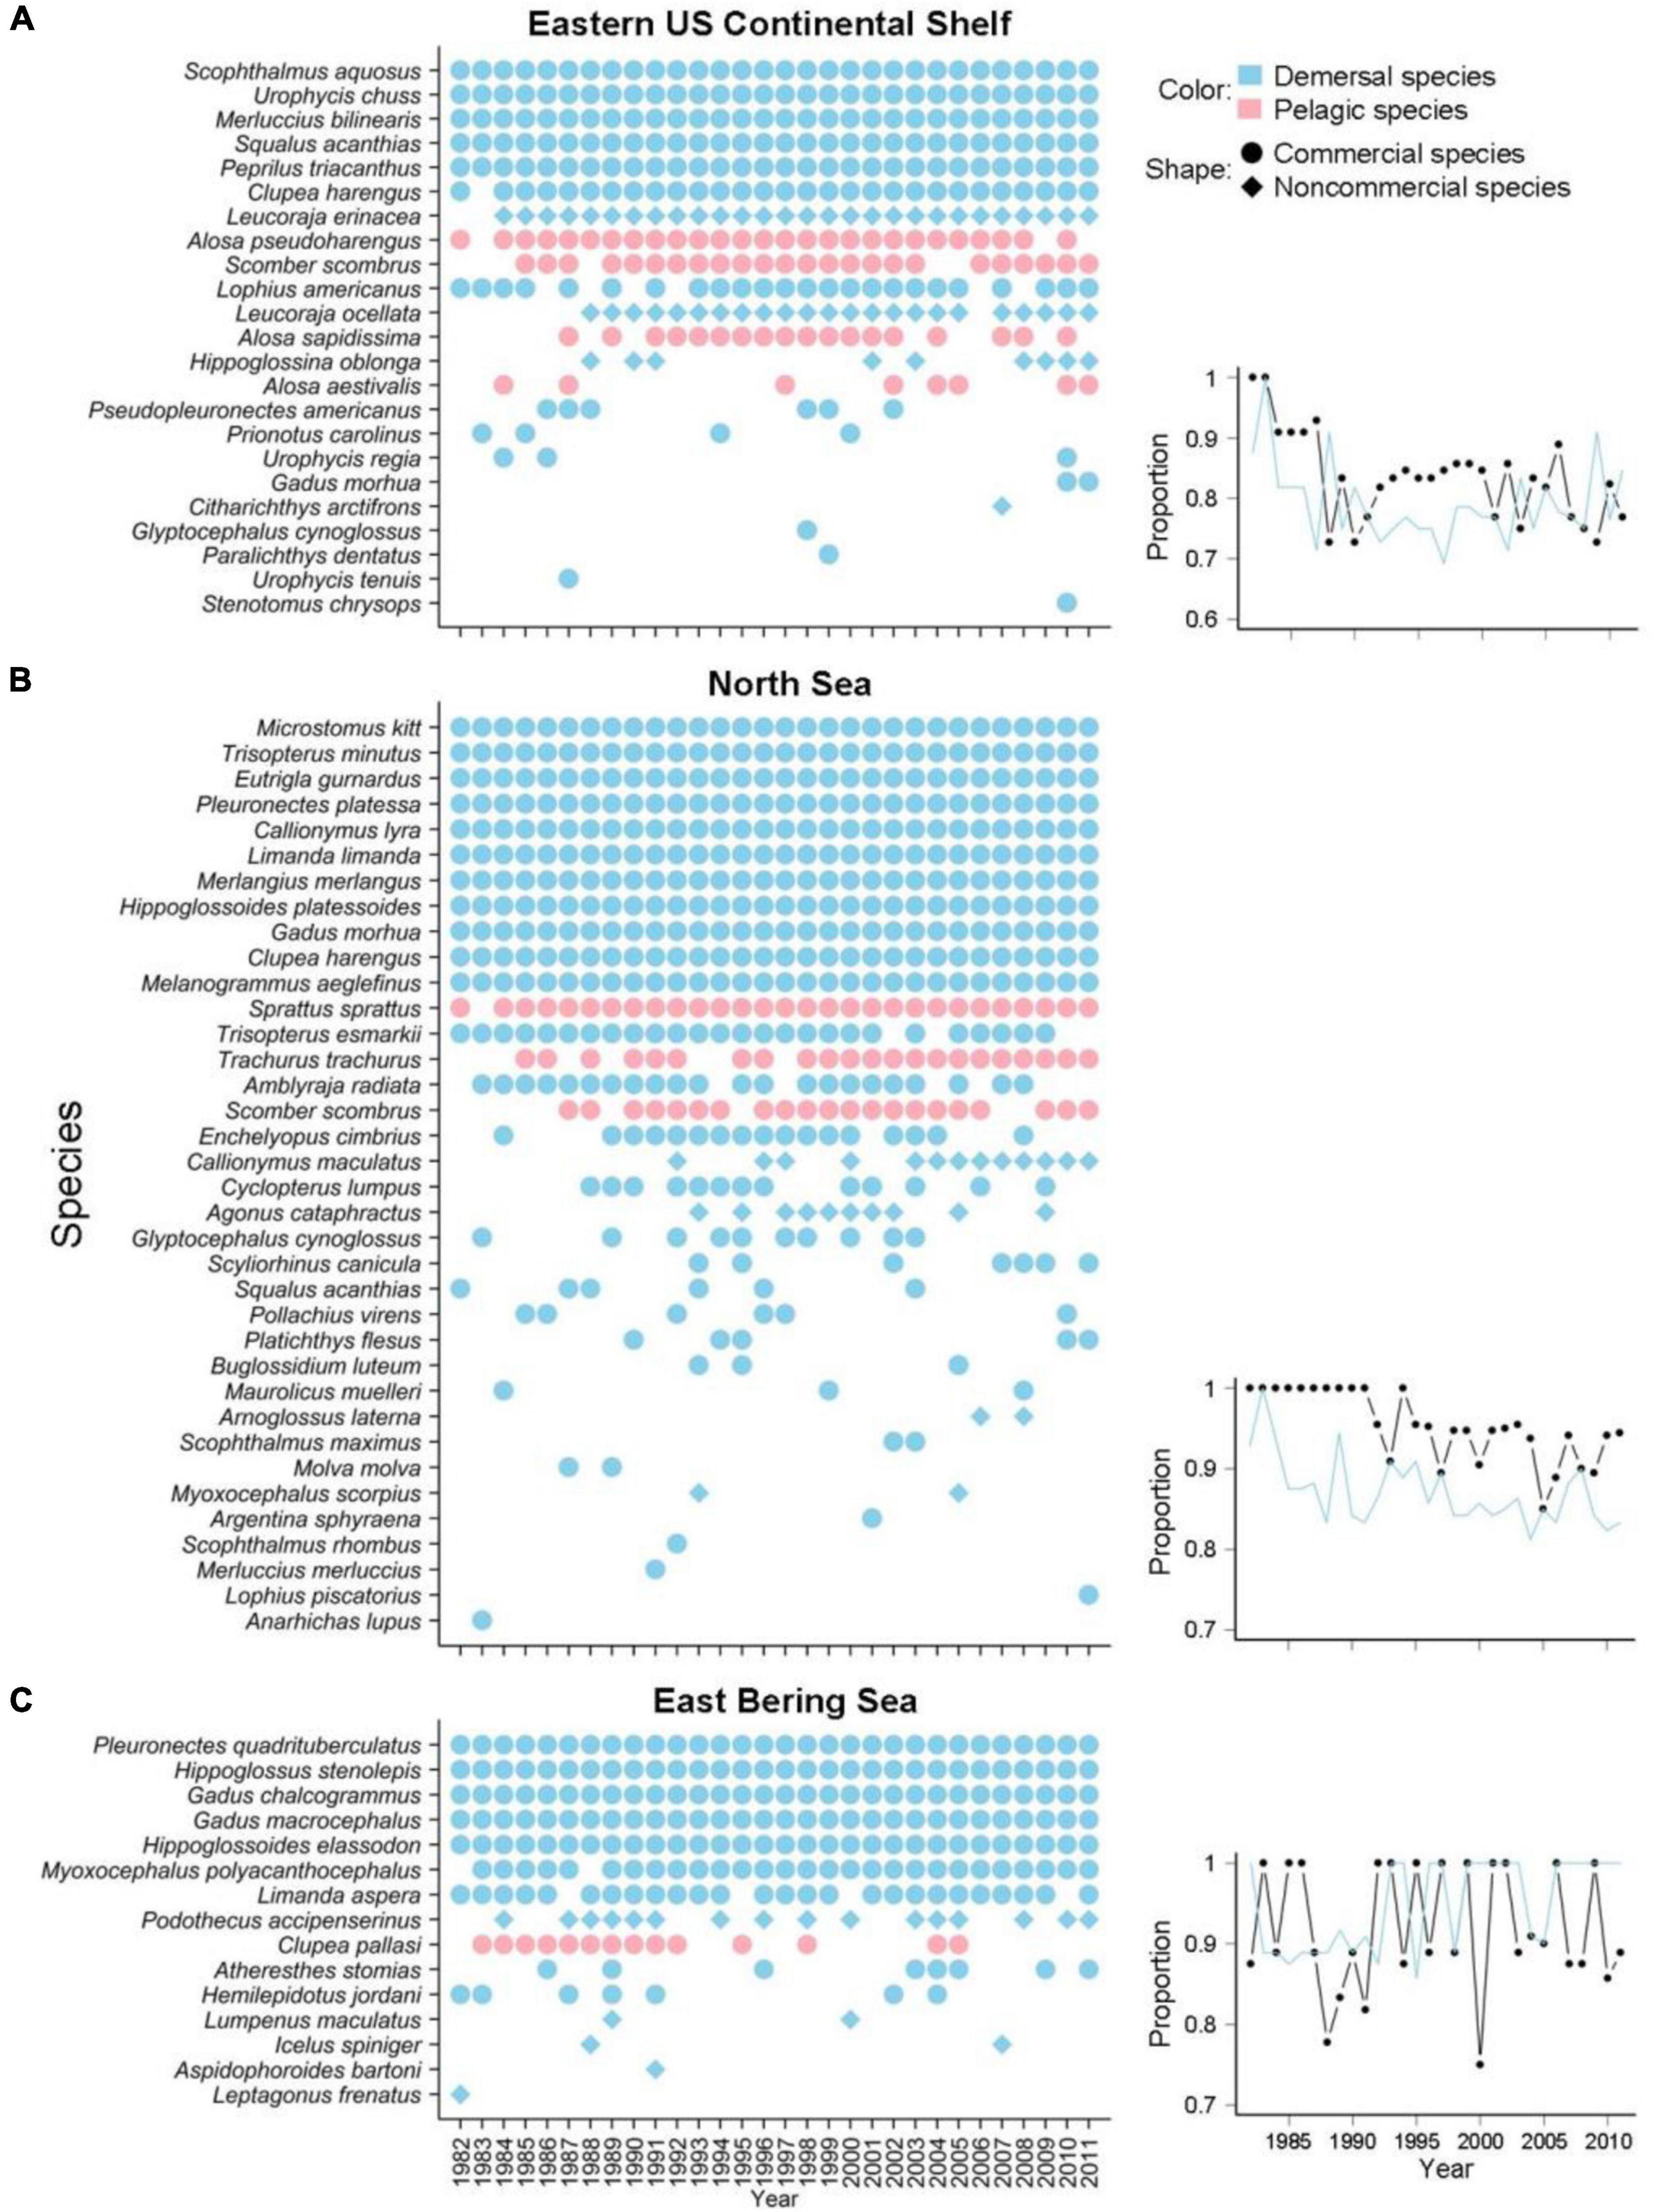
Figure 5. List of potential keystone species defined according to a mean spatial robustness > 0.8 among species in the (A) Eastern US Continental Shelf, (B) North Sea, and (C) Eastern Bering Sea large marine fish communities. Habitat preference (demersal vs. pelagic species) is indicated by color (blue vs. pink, respectively), and commercial utilization (commercial vs. non-commercial species) is indicated by shape (circles vs. diamonds, respectively). The right panels provide the proportions of different guild groups (black: commercial species; blue: demersal species) in species compositions.
Subtropical species, including the scup (Stenotomus chrysops), Gulf Stream flounder (Citharichthys arctifrons), spotted codling (Urophycis regia), and blueback shad (Alosa aestivalis) recorded in the Eastern US Continental Shelf and the Mediterranean scaldfish (Arnoglossus laterna), solenette (Buglossidium luteum), and small-spotted catshark (Scyliorhinus canicula) in the North Sea, became new potential keystone species during the studied decades (Figure 5 and Supplementary Table 1). Decreasing trends in the proportions of both demersal and commercial species in the communities of the Eastern US Continental Shelf and North Sea over time were observed, whereas a largely consistent community composition was found in the Eastern Bering Sea, indicating the decreasing importance of specific guilds of species and shifts in the main influential species in the two former large marine fish communities (Figure 5).
Discussion
Long-term information at large scales would substantially improve the understandings of both the species interaction networks underpinning spatiotemporal species co-occurrences and the consequences of ecological community coexistence, information that is needed to address irreversible threats of environmental and climatic changes to ecosystems. Increasing evidence suggests that the accelerated and comprehensive impacts of environmental and climatic changes on marine ecosystems may be greater than those on terrestrial ecosystems, leading to faster rates of colonization, higher sensitivity and greater vulnerability to warming and more frequent extirpations in marine ecosystems (Blowes et al., 2019; Pinsky et al., 2019). We sought to provide a complete assessment of changes in spatially geographical aspects of multiple species, for three decades and at mid- to high latitudes, to allow the detection of global ecological changes in marine systems by alternative estimation of geographic overlaps of species interaction networks.
We acknowledge that binary presence/absence data of species may merely reflect limited interaction networks between species and cause underestimations of the interaction strength of species in communities where abundance strongly influences guild aggregation and segregation (Ulrich and Gotelli, 2010; Newbold et al., 2013). In addition, characteristics and traits of species may influence the effectiveness of interaction assessments. For example, positive non-trophic interactions appear to be more detectable than either negative non-trophic interactions or trophic interactions when using species co-occurrence methods (Sander et al., 2017; Freilich et al., 2018). However, we believe that the results of this study lend credence to the need for cross-scale integration, at least at the species and community levels, in studies of biodiversity changes through long-term monitoring across latitudes and greater consideration of changes in community composition based on species attributes.
The upward temporal trends of fish species’ MSR and MSS geographical interaction networks corresponded closely to those of sea surface temperature anomalies. This provides important evidence of climate change impacts on species geographical interaction networks, which have not been given much attention to date. The greater strength of geographical interaction networks between species in all three large marine fish communities over the past few decades revealed that the communities may be more sensitive to random removal of species due to the strong associations between species if any species are susceptible to global warming (Kaiser-Bunbury et al., 2010; Araújo et al., 2011). Previous studies also showed that strong contributors to nestedness, i.e., interactions among species, were prone to extinction, although they were more important for the persistence of the entire community network (Almeida-Neto et al., 2008; Saavedra et al., 2011). When more fish species make stronger contributions to the geographical interaction networks of the entire community, the persistence of community coexistence structure and the ecological network could be disturbed and lost under environmental and climatic changes.
Based on our analyses, we suggest that the regional climate may influence species geographical interaction networks more than latitudinal effects. Greatest variation in species richness and turnover rate were observed in polar marine regions (Blowes et al., 2019). The observed patterns of consistently increasing MSR and MSS values for individual species among the three large marine fish communities in this study are likely to challenge the expectations because different latitudinal gradients had been speculated to exist regionally in individual large marine communities (Baumann and Doherty, 2013). Besides, a significant decrease in the correlation over time was observed only in the Eastern Bering Sea fish community, which might have been caused by a sudden steep decrease in sea surface temperature modulated by the Pacific Decadal Oscillation (PDO) since 2003 in the area. The PDO, related to the warm or cold sea surface waters in the North Pacific, changed from having predominantly positive values to having predominantly negative values in the last decade, reflecting the weakening semipermanent Aleutian Low and causing a sudden steep decrease in sea surface temperature beginning in 2008 in the Eastern Bering Sea (Wendler et al., 2014; Figure 1B). This may counteract the negative effects of ocean warming under contemporary environmental and climatic changes and mitigate the increases in MSR and MSS within 30 years in the region. This finding not only indicated the importance of the regional climate, such as ice melting rates and the effects of hydrological cycles and ocean currents, in shaping the regional responses of large marine fish communities but also explained why mild temporal trends in MSR and MSS were observed in the Eastern Bering Sea. Furthermore, importantly, regional climatic gradients allow species to track thermal niches without certain shifts and provide refugia for species without significant ecological consequences (Burrows et al., 2019). As a result, these gradients can moderate the responses of organisms to global macroclimate warming unless losses of food resources or habitat fragmentation occur (Bertrand et al., 2011; Devictor et al., 2012; De Frenne et al., 2013).
Consistent with the importance of regional variability in the Eastern Bering Sea highlighted in this study, regional climate effects have been observed in dense temperate European and North American forests, with cooler forest-floor temperatures attenuating species’ responses to global warming via increased shading during the growing season (De Frenne et al., 2013). Similarly, regional changes in water masses, sea surface temperature, the El Niño-Southern Oscillation (ENSO), and the seasonal Northern Atlantic Oscillation (NAO) have driven phytoplankton variation and bottom-up trophic cascades in marine ecosystems (Liu et al., 2019). However, many other constraints, including biotic mutualism, trophic competition (Araújo et al., 2011) and other abiotic anthropogenic effects, such as habitat destruction (Colorado-Zuluaga, 2015), also regulate the geographically interactive dependency between species. Additional research on the fundamental interactive dependence of species is needed to clarify the roles of these constraints and to understand how changes in species distributions can affect the interactive mechanisms of disassembly and reassembly of community coexistence networks.
Our findings showed that the range expansion of high-latitude fish species in search of more suitable habitats and food resources or opportunities for enemy escape under environmental and climatic changes aggravated the increases in MSR and MSS. With range expansion, the number of interacting species and median overlap proportion with interacting species also increased. These results are consistent with changes in a marine community observed off eastern Australia (Hellmann et al., 2012; Griffith et al., 2018; Platts et al., 2019). However, species might suffer from habitat constraints that instead reinforce species’ range limits and thus be unable to continuously expand their range if disturbances such as climate change and fishing pressure continuously worsen in these marine areas or if range expansion is prevented by limitation of hosts, such as specialized herbivorous species or mutualists (Hellmann et al., 2012).
Unlike the high-latitude large communities of marine fishes, which underwent significant range expansion, the mid-latitude fish species exhibited range shifts, particularly toward slightly north of the central area, i.e., the Gulf of Maine, in the Eastern US Continental Shelf. This explained the lower percentage of species with increasing temporal changes in range size in the Eastern US Continental Shelf than in the North Sea and Eastern Bering Sea, and even more species decreased their range sizes over time. Furthermore, these movements led to geographical interaction networks between formerly allopatric species (i.e., significant increases in the number of interacting species over time) or increases in geographical interaction networks between sympatric species (i.e., significant increases in the median overlap proportion with interaction species over time; Westerbom et al., 2018). Both MSR and MSS in the mid-latitude fish community thus increased. Our observed bimodal distribution of MSR with increasing latitudinal shifts also supported opposing migration directions of fish species seeking more suitable habitats in that area (Supplementary Figure 2; Rogers et al., 2019). We speculate that the richest nutrients being located in the upper layer may be one of the main reasons for species’ range shifts toward the Gulf of Maine (Townsend et al., 2010; Rogers et al., 2019), where the species will also face a non-negligible challenge imposed by great warming of the sea surface over decades within the study region.
Nevertheless, regardless of latitude, several studies have notably suggested that fish species may prefer migrating vertically to deeper habitats over migrating poleward (Pinsky et al., 2013; Rutterford et al., 2015; Kleisner et al., 2017). Depth-associated niches have been predicted to become another primary factor constraining fish species distributions, which may alter the strengths of species geographic interaction networks and cause them to differ from those measured in this study. Therefore, different drivers of fish distributional characteristics would have generated large variation across time or species and thus biases in our inferences and conclusions.
Negative relationships formed structurally asymmetrical but stable coexisting communities, according to empirical estimates of the MSR and MSS of species from real-world networks of communities from arctic to tropical ecosystems as well as from diverse ecological and biogeographical settings (Bascompte et al., 2006). The compositional changes in potential keystone species and/or changes in the strength of geographic interaction networks of potential keystone species observed in the three large marine communities in this study changed community coexistence structures from asymmetrical to symmetrical, resulting in increasing community coexistence instability. One caveat is that these oceanic areas may experience changes in top-down influences on lower trophic levels and monopolization of critical resources (Wagner, 2010). Moreover, some studies have shown that the Eastern US Continental Shelf and North Sea are two of the marine ecosystems most severely impacted by climate and fishing (Kirby and Beaugrand, 2009; Olsen et al., 2011), which may explain the declining importance of demersal and commercial fish species in the two assemblages of large marine fish communities. Our findings suggest that both marine community coexistence structures and functions have been affected and may be significantly depleted across the full ranges of such fish under environmental and climatic changes (Eggers et al., 2014; Flanagan et al., 2019).
Conclusion
Our findings highlight the changes in geographical interaction networks of species and community coexistence stability over the past few decades and the need for a better understanding and monitoring of future changes. In particular, consistent trends across latitudes have been observed, implying a common crisis and challenge among marine fish communities under environmental and climatic changes. Notably, the regional climate is emerging as a critical moderator of changes in marine community interactions. Moreover, despite different latitudes, the underlying factors structuring fish species reflect differences in the resilience of species MSR and MSS in different marine communities under environmental and climatic change. Our findings further demonstrate that demersal and commercial species showed larger changes under environmental and climatic changes than other species and their important roles in stabilizing communities by contributing to asymmetrical species co-occurrences. Ultimately, as higher levels of ecological impacts, e.g., community-level changes, occur, we should be more vigilant of the effects of modern-day global environmental and climatic changes.
Data Availability Statement
Publicly available datasets were analyzed in this study. This data can be found here: The data that support the findings of this study are available in the Northeast Fisheries Science Center (NEFSC) Bottom Trawl project, North Sea International Bottom Trawl Survey (NS-IBTS), and Eastern Bering Sea Continental Shelf (EBSS) Survey.
Ethics Statement
Ethical review and approval was not required for the animal study because the study only focused on data analyses.
Author Contributions
Y-ZL and C-YK conceptualized the study, wrote the original draft, and visual materials. Y-ZL and C-WT curated data and developed the methods. C-HH and C-YK supervised, reviewed, and edited during writing process. All authors contributed to the article and approved the submitted version.
Funding
This work was funded by Taiwan Ministry of Science and Technology (MOST) grant 108-2636-B-002-006 and 109-2636-B-002-006. C-YK was supported by MOST Young Scholar Fellowship Columbus Program.
Conflict of Interest
The authors declare that the research was conducted in the absence of any commercial or financial relationships that could be construed as a potential conflict of interest.
The reviewer CL declared a past co-authorship with one of the author C-YK to the handling editor.
Publisher’s Note
All claims expressed in this article are solely those of the authors and do not necessarily represent those of their affiliated organizations, or those of the publisher, the editors and the reviewers. Any product that may be evaluated in this article, or claim that may be made by its manufacturer, is not guaranteed or endorsed by the publisher.
Acknowledgments
We thank I.-C. Chen, M.-N. Tuanmu, H.-H. Tao, and P.-C. Ho for helpful feedback on earlier versions of this manuscript.
Supplementary Material
The Supplementary Material for this article can be found online at: https://www.frontiersin.org/articles/10.3389/fmars.2022.751094/full#supplementary-material
References
Almeida-Neto, M., Guimarães, P., Guimarães, P. R. Jr., Loyola, R. D., and Ulrich, W. (2008). A consistent metric for nestedness analysis in ecological systems: reconciling concept and measurement. Oikos 117, 1227–1239.
Araújo, M. B., Rozenfeld, A., Rahbek, C., and Marquet, P. A. (2011). Using species co-occurrence networks to assess the impacts of climate change. Ecography 34, 897–908. doi: 10.7717/peerj.3152
Bascompte, J., Jordano, P., and Olesen, J. M. (2006). Asymmetric coevolutionary networks facilitate biodiversity maintenance. Science 312:431.
Baumann, H., and Doherty, O. (2013). Decadal changes in the world’s coastal latitudinal temperature gradients. PLoS One 8:e67596. doi: 10.1371/journal.pone.0067596
Bertrand, R., Lenoir, J., Piedallu, C., Riofrío-Dillon, G., de Ruffray, P., Vidal, C., et al. (2011). Changes in plant community composition lag behind climate warming in lowland forests. Nature 479, 517–520. doi: 10.1038/nature10548
Blanchet, F. G., Cazelles, K., and Gravel, D. (2020). Co-occurrence is not evidence of ecological interactions. Ecol. Lett. 23, 1050–1063. doi: 10.1111/ele.13525
Blowes, S. A., Supp, S. R., Antão, L. H., Bates, A., Bruelheide, H., Chase, J. M., et al. (2019). The geography of biodiversity change in marine and terrestrial assemblages. Science 366:339. doi: 10.1126/science.aaw1620
Burrows, M. T., Bates, A. E., Costello, M. J., Edwards, M., Edgar, G. J., Fox, C. J., et al. (2019). Ocean community warming responses explained by thermal affinities and temperature gradients. Nat. Clim. Chang. 9, 959–963.
Cazelles, K., Araújo, M. B., Mouquet, N., and Gravel, D. (2016). A theory for species co-occurrence in interaction networks. Theoret. Ecol. 9, 39–48. doi: 10.1007/s12080-015-0281-9
Christianou, M., and Ebenman, B. (2005). Keystone species and vulnerable species in ecological communities: strong or weak interactors? J. Theoret. Biol. 235, 95–103. doi: 10.1016/j.jtbi.2004.12.022
Colorado-Zuluaga, G. J. (2015). How ecological communities are structured: a review on cological assembly rules. Rev. EIA 12, 27–53.
De Frenne, P., Rodríguez-Sánchez, F., Coomes, D. A., Baeten, L., Verstraeten, G., Vellend, M., et al. (2013). Microclimate moderates plant responses to macroclimate warming. Proc. Natl. Acad. Sci. U.S.A. 110:18561. doi: 10.1073/pnas.1311190110
Devictor, V., van Swaay, C., Brereton, T., Brotons, L., Chamberlain, D., Heliölä, J., et al. (2012). Differences in the climatic debts of birds and butterflies at a continental scale. Nat. Clim. Chang. 2, 121–124.
Eggers, S. L., Lewandowska, A. M., Barcelos e Ramos, J., Blanco-Ameijeiras, S., Gallo, F., and Matthiessen, B. (2014). Community composition has greater impact on the functioning of marine phytoplankton communities than ocean acidification. Glob. Chang. Biol. 20, 713–723. doi: 10.1111/gcb.12421
Flanagan, P. H., Jensen, O. P., Morley, J. W., and Pinsky, M. L. (2019). Response of marine communities to local temperature changes. Ecography 42, 214–224.
Freilich, M. A., Wieters, E., Broitman, B. R., Marquet, P. A., and Navarrete, S. A. (2018). Species co-occurrence networks: can they reveal trophic and non-trophic interactions in ecological communities? Ecology 99, 690–699. doi: 10.1002/ecy.2142
Froese, R., and Pauly, D eds (2019). FishBase. Washington, DC: World Wide Web Electronic Publication.
Fuhrman, J. A., Cram, J. A., and Needham, D. M. (2015). Marine microbial community dynamics and their ecological interpretation. Nat. Rev. Microbiol. 13, 133–146. doi: 10.1038/nrmicro3417
Gilljam, D., Curtsdotter, A., and Ebenman, B. (2015). Adaptive rewiring aggravates the effects of species loss in ecosystems. Nat. Commun. 6:8412. doi: 10.1038/ncomms9412
Goldenberg, S. U., Nagelkerken, I., Marangon, E., Bonnet, A., Ferreira, C. M., and Connell, S. D. (2018). Ecological complexity buffers the impacts of future climate on marine consumers. Nat. Clim. Chang. 8, 229–233. doi: 10.1038/s41558-018-0086-0
Griffith, G. P., Strutton, P. G., and Semmens, J. M. (2018). Climate change alters stability and species potential interactions in a large marine ecosystem. Glob. Chang. Biol. 24, e90–e100. doi: 10.1111/gcb.13891
Hellmann, J. J., Prior, K. M., and Pelini, S. L. (2012). The influence of species interactions on geographic range change under climate change. Ann. N. Y. Acad. Sci. 1249, 18–28. doi: 10.1111/j.1749-6632.2011.06410.x
Høyer, J. L., and Karagali, I. (2016). Sea surface temperature climate data record for the North Sea and Baltic Sea. J. Clim. 29, 2529–2541.
Kaiser-Bunbury, C. N., Muff, S., Memmott, J., Müller, C. B., and Caflisch, A. (2010). The robustness of pollination networks to the loss of species and interactions: a quantitative approach incorporating pollinator behaviour. Ecol. Lett. 13, 442–452. doi: 10.1111/j.1461-0248.2009.01437.x
Kirby, R. R., and Beaugrand, G. (2009). Trophic amplification of climate warming. Proc. R. Soc. B Biol. Sci. 276, 4095–4103. doi: 10.1098/rspb.2009.1320
Kleisner, K. M., Fogarty, M. J., McGee, S., Hare, J. A., Moret, S., Perretti, C. T., et al. (2017). Marine species distribution shifts on the U.S. Northeast Continental Shelf under continued ocean warming. Progr. Oceanogr. 153, 24–36.
Lee, C. K., Laughlin, D. C., Bottos, E. M., Caruso, T., Joy, K., Barrett, J. E., et al. (2019). Biotic interactions are an unexpected yet critical control on the complexity of an abiotically driven polar ecosystem. Commun. Biol. 2:62. doi: 10.1038/s42003-018-0274-5
Lévy, M., Franks, P. J. S., and Smith, K. S. (2018). The role of submesoscale currents in structuring marine ecosystems. Nat. Commun. 9:4758. doi: 10.1038/s41467-018-07059-3
Liu, C., Sun, Q., Xing, Q., Wang, S., Tang, D., Zhu, D., et al. (2019). Variability in phytoplankton biomass and effects of sea surface temperature based on satellite data from the Yellow Sea, China. PLoS One 14:e0220058. doi: 10.1371/journal.pone.0220058
Münkemüller, T., Gallien, L., Pollock, L. J., Barros, C., Carboni, M., Chalmandrier, L., et al. (2020). Dos and don’ts when inferring assembly rules from diversity patterns. Glob. Ecolol. Biogeogr. 29, 1212–1229. doi: 10.1111/geb.13098
Neeson, T. M., and Mandelik, Y. (2014). Pairwise measures of species co-occurrence for choosing indicator species and quantifying overlap. Ecol. Indic. 45, 721–727.
Newbold, T., Scharlemann, J. P. W., Butchart, S. H. M., Şekercioğlu, ÇH., Alkemade, R., Booth, H., et al. (2013). Ecological traits affect the response of tropical forest bird species to land-use intensity. Proc. R. Soc. B Biol. Sci. 280:20122131. doi: 10.1098/rspb.2012.2131
Olsen, E. M., Ottersen, G., Llope, M., Chan, K.-S., Beaugrand, G., and Stenseth, N. C. (2011). Spawning stock and recruitment in North Sea cod shaped by food and climate. Proc. R. Soc. B Biol. Sci. 278, 504–510. doi: 10.1098/rspb.2010.1465
O’Reilly, J. E., and Zetlin, C. A. (1998). Seasonal, Horizontal, and Vertical Distribution of phytoplankton Chlorophyll a in the Northeast U.S. Continental Shelf Ecosystem. NOAA Technical Report NMFS, 0892-8908. Washington, DC: NOAA.
Parmesan, C., and Yohe, G. (2003). A globally coherent fingerprint of climate change impacts across natural systems. Nature 421, 37–42. doi: 10.1038/nature01286
Pinsky, M. L., Eikeset, A. M., McCauley, D. J., Payne, J. L., and Sunday, J. M. (2019). Greater vulnerability to warming of marine versus terrestrial ectotherms. Nature 569, 108–111. doi: 10.1038/s41586-019-1132-4
Pinsky, M. L., Worm, B., Fogarty, M. J., Sarmiento, J. L., and Levin, S. A. (2013). Marine taxa track local climate velocities. Science 341:1239. doi: 10.1126/science.1239352
Platts, P. J., Mason, S. C., Palmer, G., Hill, J. K., Oliver, T. H., Powney, G. D., et al. (2019). Habitat availability explains variation in climate-driven range shifts across multiple taxonomic groups. Sci. Rep. 9:15039. doi: 10.1038/s41598-019-51582-2
Pulver, J. R., Liu, H., and Scott-Denton, E. (2016). Modelling community structure and species co-occurrence using fishery observer data. ICES J. Mar. Sci. 73, 1750–1763. doi: 10.1093/icesjms/fsw033
Rogers, L. A., Griffin, R., Young, T., Fuller, E., St. Martin, K., and Pinsky, M. L. (2019). Shifting habitats expose fishing communities to risk under climate change. Nat. Clim. Chang. 9, 512–516. doi: 10.1038/s41558-019-0503-z
Rooney, N., McCann, K., Gellner, G., and Moore, J. C. (2006). Structural asymmetry and the stability of diverse food webs. Nature 442, 265–269. doi: 10.1038/nature04887
Rutterford, L. A., Simpson, S. D., Jennings, S., Johnson, M. P., Blanchard, J. L., Schön, P.-J., et al. (2015). Future fish distributions constrained by depth in warming seas. Nat. Clim. Chang. 5:569. doi: 10.1038/nclimate2607
Saavedra, S., Stouffer, D. B., Uzzi, B., and Bascompte, J. (2011). Strong contributors to network persistence are the most vulnerable to extinction. Nature 478, 233–235. doi: 10.1038/nature10433
Sander, E. L., Wootton, J. T., and Allesina, S. (2017). Ecological network inference from long-term presence-absence data. Sci. Rep. 7:7154. doi: 10.1038/s41598-017-07009-x
Shearman, R. K., and Lentz, S. J. (2009). Long-term sea surface temperature variability along the U.S. East Coast. J. Phys. Oceanogr. 40, 1004–1017. doi: 10.1175/2009jpo4300.1
Siddon, E., and Zador, S. (2018). Ecosystem Status Report 2018: Eastern Bering Sea, Stock Assessment and Fishery Evaluation Report. Anchorage, AK: North Pacific Fishery Management Council.
Singer, A., Travis, J. M. J., and Johst, K. (2013). Interspecific interactions affect species and community responses to climate shifts. Oikos 122, 358–366.
Sündermann, J., and Pohlmann, T. (2011). A brief analysis of North Sea physics. Oceanologia 53, 663–689. doi: 10.5697/oc.53-3.663
Townsend, D. W., Rebuck, N. D., Thomas, M. A., Karp-Boss, L., and Gettings, R. M. (2010). A changing nutrient regime in the Gulf of Maine. Cont. Shelf Res. 30, 820–832. doi: 10.1007/s00442-014-2914-x
Trivellone, V., Bougeard, S., Giavi, S., Krebs, P., Balseiro, D., Dray, S., et al. (2017). Factors shaping community assemblages and species co-occurrence of different trophic levels. Ecol. Evol. 7, 4745–4754. doi: 10.1002/ece3.3061
Tylianakis, J. M., Didham, R. K., Bascompte, J., and Wardle, D. A. (2008). Global change and species interactions in terrestrial ecosystems. Ecol. Lett. 11, 1351–1363. doi: 10.1111/j.1461-0248.2008.01250.x
Ulrich, W., and Gotelli, N. J. (2010). Null model analysis of species associations using abundance data. Ecology 91, 3384–3397. doi: 10.1890/09-2157.1
Veech, J. A. (2013). A probabilistic model for analysing species co-occurrence. Glob. Ecol. Biogeogr. 22, 252–260. doi: 10.1111/j.1466-8238.2012.00789.x
Walther, G.-R. (2010). Community and ecosystem responses to recent climate change. Philos.Trans. R. Soc. Lond. Ser. B Biol. Sci. 365, 2019–2024. doi: 10.1098/rstb.2010.0021
Wendler, G., Chen, L., and Moore, B. (2014). Recent sea ice increase and temperature decrease in the Bering Sea area, Alaska. Theoret. Appl. Climatol. 117, 393–398. doi: 10.1007/s00704-013-1014-x
Westerbom, M., Lappalainen, A., Mustonen, O., and Norkko, A. (2018). Trophic overlap between expanding and contracting fish predators in a range margin undergoing change. Sci. Rep. 8:7895. doi: 10.1038/s41598-018-25745-6
Williams, R. J., Howe, A., and Hofmockel, K. S. (2014). Demonstrating microbial co-occurrence pattern analyses within and between ecosystems. Front. Microbiol. 5:358. doi: 10.3389/fmicb.2014.00358
Keywords: adult marine fish, geographical overlap, species interaction network, community coexistence, species distribution, Climate change
Citation: Lai Y-Z, Tu C-W, Hsieh C-h and Ko C-Y (2022) Using Geographical Overlaps to Track Temporal Changes in Species Interactions and Community Coexistence Instability. Front. Mar. Sci. 9:751094. doi: 10.3389/fmars.2022.751094
Received: 31 July 2021; Accepted: 14 January 2022;
Published: 17 February 2022.
Edited by:
Angel Pérez-Ruzafa, University of Murcia, SpainReviewed by:
Gert Van Hoey, Institute for Agricultural, Fisheries and Food Research (ILVO), BelgiumWan-Ling Tseng, Academia Sinica, Taiwan
Chaochen Lai, Academia Sinica, Taiwan
Copyright © 2022 Lai, Tu, Hsieh and Ko. This is an open-access article distributed under the terms of the Creative Commons Attribution License (CC BY). The use, distribution or reproduction in other forums is permitted, provided the original author(s) and the copyright owner(s) are credited and that the original publication in this journal is cited, in accordance with accepted academic practice. No use, distribution or reproduction is permitted which does not comply with these terms.
*Correspondence: Chia-Ying Ko, Y3lrbzIzNUBudHUuZWR1LnR3