 Gonzalo Araujo1,2,3*
 Ariana Agustines1Steffen S. Bach4
 Jesse E. M. Cochran5Emilio de la Parra-Galván6
 Rafael de la Parra-Venegas6Stella Diamant7,8
 Alistair Dove9Steve Fox10
 Rachel T. Graham11
 Sofia M. Green12
 Jonathan R. Green12
 Royale S. Hardenstine5
 Alex Hearn13,14Mahardika R. Himawan15
 Rhys Hobbs16
 Jason Holmberg17Ibrahim Shameel18Mohammed Y. Jaidah4,19Jessica Labaja1Savi Leblond20Christine G. Legaspi1Rossana Maguiño21Kirsty Magson22Stacia D. Marcoux23Travis M. Marcoux23
 Sarah Anne Marley2,24
 Meynard Matalobos25Alejandra Mendoza21Joni A. Miranda1Brad M. Norman26,27
 Cameron T. Perry28
 Simon J. Pierce8
 Alessandro Ponzo1
 Clare E. M. Prebble8
 Dení Ramírez-Macías29Richard Rees18
 Katie E. Reeve-Arnold30
 Samantha D. Reynolds26,31David P. Robinson4,32
 Christoph A. Rohner8David Rowat20
 Sally Snow1Abraham Vázquez-Haikin33Alex M. Watts8,34
- 1Large Marine Vertebrates Research Institute Philippines, Jagna, Philippines
- 2Institute of Marine Sciences, University of Portsmouth, Portsmouth, United Kingdom
- 3Marine Research and Conservation Foundation, Somerset, United Kingdom
- 4Qatar Whale Shark Research Project, Doha, Qatar
- 5Red Sea Research Center, Division of Biological and Environmental Science and Engineering, King Abdullah University of Science and Technology, Thuwal, Saudi Arabia
- 6Ch’ooj Ajauil Asociación Civil (AC), Cancuín, Mexico
- 7Madagascar Whale Shark Project, Nosy Be, Madagascar
- 8Marine Megafauna Foundation, Truckee, CA, United States
- 9Research and Conservation Department, Georgia Aquarium, Atlanta GA, United States
- 10Utila Whale Shark Research, Utila, Honduras
- 11MarAlliance, Ciudad del Saber, Panama City, Panama
- 12Galapagos Whale Shark Project, Galapagos, Ecuador
- 13Galapagos Science Center, Universidad San Francisco de Quito, Quito, Ecuador
- 14MigraMar, Olema, CA, United States
- 15Fisheries and Marine Science Department, Faculty of Agriculture, University of Mataram, Mataram, Indonesia
- 16Foreign Commonwealth Office, St. Helena Government, St. Helena, United Kingdom
- 17Wild Me, Portland, OR, United States
- 18Maldives Whale Shark Research Programme, Yorkshire, United Kingdom
- 19Qatar Ministry of Municipality and Environment, Doha, Qatar
- 20Marine Conservation Society, Victoria, Seychelles
- 21ecOceanica, Lima, Peru
- 22Koh Tao Whale Sharks, Koh Tao, Thailand
- 23Hawai'i Uncharted Research Collective, Kailua-Kona, HI, United States
- 24Scotland’s Rural College (SRUC), Aberdeen, United Kingdom
- 25World Wide Fund for Nature-Philippines, Quezon City, Philippines
- 26ECOCEAN Inc., Perth, WA, Australia
- 27Harry Butler Institute, Murdoch University, Perth, WA, Australia
- 28School of Biological Sciences, Georgia Institute of Technology, Atlanta, GA, United States
- 29Whale Shark Mexico, Conexiones Terramar Asociación Civil (AC), Centro La Paz, La Paz, Mexico
- 30All Out Africa Marine Research Centre, Inhambane, Mozambique
- 31Franklin Ecolab, The University of Queensland, St. Lucia, QLD, Australia
- 32Sundive Research, Byron Bay, NSW, Australia
- 33Grupo de Monitoreo Comunitario Pejesapo, Baja California Sur, Mexico
- 34Ecological Genetics and Conservation Laboratory, Manchester Metropolitan University, Manchester, United Kingdom
The world’s largest extant fish, the whale shark Rhincodon typus, is one of the most-studied species of sharks globally. The discovery of predictable aggregation sites where these animals gather seasonally or are sighted year-round – most of which are coastal and juvenile-dominated – has allowed for a rapid expansion of research on this species. The most common method for studying whale sharks at these sites is photographic identification (photo-ID). This technique allows for long-term individual-based data to be collected which can, in turn, be used to evaluate population structure, build population models, identify long-distance movements, and assess philopatry and other population dynamics. Lagged identification rate (LIR) models have fewer underlying assumptions than more traditional capture mark recapture approaches, making them more broadly applicable to marine taxa, especially far-ranging megafauna species like whale sharks. However, the increased flexibility comes at a cost. Parameter estimations based on LIR can be difficult to interpret and may not be comparable between areas with different sampling regimes. Using a unique data-set from the Philippines with ~8 years of nearly continuous survey effort, we were able to derive a metric for converting LIR residency estimates into more intuitive days-per-year units. We applied this metric to 25 different sites allowing for the first quantitatively-meaningful comparison of sightings-derived residence among the world’s whale shark aggregations. We validated these results against the only three published acoustic residence metrics (falling within the ranges established by these earlier works in all cases). The results were then used to understand residency behaviours exhibited by the sharks at each site. The adjusted residency metric is an improvement to LIR-based population modelling, already one of the most widely used tools for describing whale shark aggregations. The standardised methods presented here can serve as a valuable tool for assessing residency patterns of whale sharks, which is crucial for tailored conservation action, and can cautiously be tested in other taxa.
Introduction
The world’s largest fish, the whale shark Rhincodon typus Smith 1828, is a circumglobal species that lives in tropical and warm temperate oceans (Rowat and Brooks, 2012). The species is capable of long-distance horizontal movements over thousands of kilometres (e.g. Hearn et al., 2016; Reynolds et al., 2017), yet also has year-round residency at certain sites (e.g. Mafia Island, Tanzania, Rohner et al., 2020). The species can dive vertically to at least 1,900 m (Tyminski et al., 2015), though they spend most of their time in the epipelagic zone (Graham et al., 2006; Robinson et al., 2017). The whale shark is a solitary species, but they form seasonal, predictable aggregations at >20 sites globally (Norman et al., 2017a), typically associated with feeding at places with periodic high productivity (e.g. Gulf of Mexico, Motta et al., 2010; Tanzania, Rohner et al., 2015a; Philippines, McCoy et al., 2018). Here, the term aggregation is used to describe sites with >10 individuals in an area <1 km2, in line with Rowat and Brooks (2012). In contrast, whale sharks at oceanic islands are less likely to form aggregations and appear largely transient in the Galapagos Islands (Acuña-Marrero et al., 2014), Tubbataha Reefs Natural Park (TRNP) in the Philippines (Araujo et al., 2018), or at the Revillagigedo Archipelago, Gorda Banks and Espiritu Santo Island off the coast of Pacific Mexico (Ramírez-Macías et al., 2012a). Answering the critical questions of how whale sharks use different habitats, for how long, and how many individuals might be there, is key for managers and conservationists to develop strategic management plans for a species that has lost >60% of its global population over the last 3 generations (Pierce and Norman, 2016).
It is more efficient and cost-effective to study whale sharks at sites where they are reliably, albeit seasonally present, particularly when these locations are coastal. Consequently, we know comparatively little of their behaviour during periods of absence from these sites, or when they stay below the surface for extended periods of time. Whale sharks have unique spot patterns on their bodies that can be used for individual recognition through photographic identification (henceforth photo-ID; Arzoumanian et al., 2005). This characteristic has been globally utilised for whale shark research and, as of 2020, at least 25 sites have a dedicated photo-ID programme for the species. Photo-ID data can be used to examine population demographics including apparent survival (e.g. Lester et al., 2020), residency (e.g. Fox et al., 2013), connectivity between sites (e.g. Araujo et al., 2020), population size (e.g. Graham and Roberts, 2007; Holmberg et al., 2008), lagged identification rate (e.g. Ramírez-Macías et al., 2012a; McKinney et al., 2017), and injury and healing rates (Speed et al., 2008). Photo-ID data can complement other methodologies such as passive acoustic telemetry (e.g. Norman et al., 2017b; Cochran et al., 2019), satellite telemetry (e.g. Perry et al., 2020), or biochemical approaches (e.g. Prebble et al., 2018), to get a better understanding of the habitat use and movement ecology of this species.
Although photo-ID data can be utilised in a multitude of ways to address ecological questions, it requires frequent collection to ensure high temporal coverage. This is particularly true at transiting sites, where whale sharks may spend relatively little time and thus have a lower opportunity of being photographed by scientists. This can present a logistical and economic challenge for researchers. Photo-ID data collection can be maximised through citizen science programmes, in which the general public is engaged to collect whale shark photo-ID images (Norman et al., 2017a). Active participation by tourists is commonplace in, for example, the Maldives (Harvey-Carroll et al., 2021), whilst the use of tour guides to collect photo-ID data is a licensing requirement at Ningaloo Reef in Australia (Lester et al., 2019). Photo-ID data can also be mined from posts on social media platforms (e.g. ©Facebook), and thus complement dedicated photo-ID research programmes (e.g. Araujo et al., 2017). Citizen science has been successfully employed at different sites, for example at Ningaloo Reef in Australia (Davies et al. 2013), the Maldives (Harvey-Carroll et al., 2021) and the Philippines (Araujo et al., 2017), and helps supplement scientific datasets by collecting opportunistic spatiotemporal data of whale sharks encountered globally (Norman et al., 2017a). Indeed, in many locations the interest of tourists to engage in photo-ID programmes specifically fund dedicated researchers to accompany them on trips, either seasonally or year-round. These citizen science-derived data have been used to successfully produce mark-recapture models (Davies et al. 2013), understand residency (Araujo et al., 2017), annual abundance, fidelity and movements between locations (Graham & Roberts, 2007; Ramírez-Macías et al., 2012a), and to assess long-term philopatry (e.g. Norman and Morgan, 2016a; McCoy et al., 2018). It is important to understand the limitations of citizen science and ensure any assumptions are met before employing this method (e.g. Bauder et al., 2021; Jäckel et al., 2021).
Photo-ID data has been used to produce capture-mark-recapture (CMR) models to understand the abundance and survival of whale sharks at different sites. For example, Meekan et al. (2006) and Ramírez-Macías et al. (2012b) applied a Jolly-Seber open population model (Schwarz & Arnason, 1996) using the program MARK (White & Burnham, 1999) to estimate the super-population of whale sharks at Ningaloo Reef and Holbox Island, respectively. CMR models often have strict assumptions that must be met to produce results, often involving restricted survey and effort methods (Whitehead, 2001), not allowing the use of opportunistically collected data (e.g. from citizen science programmes). Maximum likelihood methods developed by Whitehead (2001), based on work by Hilborn (1990) and Turchin (1998), use the photo-ID data to establish the spatiotemporal unit of effort thus facilitating the incorporation of different data sources. A unit of effort is needed to remove bias in capture probability. The methods estimate the lagged identification rate (LIR) – the probability that an individual animal will be re-identified at the study site having been identified at the study site at an earlier time – which can be used to estimate population parameters such as residency, abundance and mortality or permanent emigration. Whitehead (2009) developed the program SOCPROG, which allows for the simple estimation of the LIR to understand the population parameters of given populations. This analysis has been applied to an array of marine taxa, for example, to understand residency times for bottlenose dolphins Tursiops aduncus in Western Australia (Chabanne et al., 2012), movements of reef manta rays Mobula alfredi in Indonesia (Germanov et al., 2019), and to estimate mortality or permanent emigration in green turtles Chelonia mydas in the Philippines (Araujo et al., 2019a, and 2019b).
Estimating whale shark residency through photo-ID can be difficult given its sighting-dependent nature, yet it can accurately shed light on how the species uses certain sites. Residency values estimated through the LIR are based on daily sampling periods, and the residency time out is estimated as the mean time spent outside the study site before returning (Whitehead, 2001; 2008). Whale sharks display extended residency at some sites (e.g. South Ari, Maldives, Harvey-Carroll et al., 2021), yet transit through others (e.g. Galapagos Islands, Acuña-Marrera et al., 2014). Whale shark movements are generally driven by foraging or reproductive opportunities, and the amount of time individual animals reside at a coastal feeding aggregation site is likely linked to prey availability (Rohner et al., 2015a). Whale sharks target high density patches of food (Rohner et al., 2015a; Boldrocchi et al., 2020) which, in a highly oligotrophic environment like the tropics, often means short-lived pulses spread over broad spatial scales. Previous studies using passive acoustic telemetry at Mafia Island, Tanzania (Rohner et al., 2020), Al Lith, Saudi Arabia (Cochran et al., 2019) and at St. Helena Island (Perry et al., 2020), produced estimates of residency based on tag detection at each site. It remains unclear if these metric can be reconciled with sightings-derived data from photo-ID.
The ability to determine population abundance of endangered species is especially crucial when trying to design conservation and management strategies for species like the whale shark, whose populations have declined by >60% in the last three generations (Pierce and Norman, 2016). Estimates of abundance have been produced for whale shark aggregations based on CMR data (e.g. Holmberg et al., 2009; Lester et al., 2020) and on larger-scales using molecular tools (i.e. Castro et al., 2007; Schmidt et al., 2009; Sigsgaard et al., 2016). The latter methods produced abundance estimates for whale sharks in the region of 27,000-476,000 adults. To date, no study has looked at global CMR data to estimate whale shark abundance.
The LIR has been used to understand whale shark demographics across multiple sites to date (Supplementary Table 1), including estimates of daily abundance (Prebble et al., 2018), residency (Fox et al., 2013), apparent survival (Harvey-Carroll et al., 2021), and movement between areas (Ramírez-Macías et al., 2012a; McKinney et al., 2017). In order to gain more detailed insight into whale shark aggregations and site use, here, we use a global data set to (1) model the lagged identification rate at 25 global whale shark sites from the Atlantic, Indian and Pacific Oceans through modified maximum likelihood methods, (2) test the accuracy of model-derived estimates of residency from a site in the Philippines where near complete field coverage was possible and derive an improved residency metric, and (3) examine commonalities between sites based on bio-geographical characteristics.
Materials and methods
Study sites and data standardisation
We collated whale shark identification data from 25 whale shark sites in the Atlantic, Indian and Pacific Oceans (see Figure 1; Table 1). A summary of the data used, and the temporal scale covered at each site is presented in Table 1. Data were collected by photographing the left flank of the whale sharks, behind the gill slits and above the pectoral fin (Arzoumanian et al., 2005). Each image was assigned or matched to an individual whale shark, the latter referring to an individual already within a database. Every time a whale shark was encountered, or ‘identified, this was recorded on a log or spreadsheet with all encounter information within each study site.
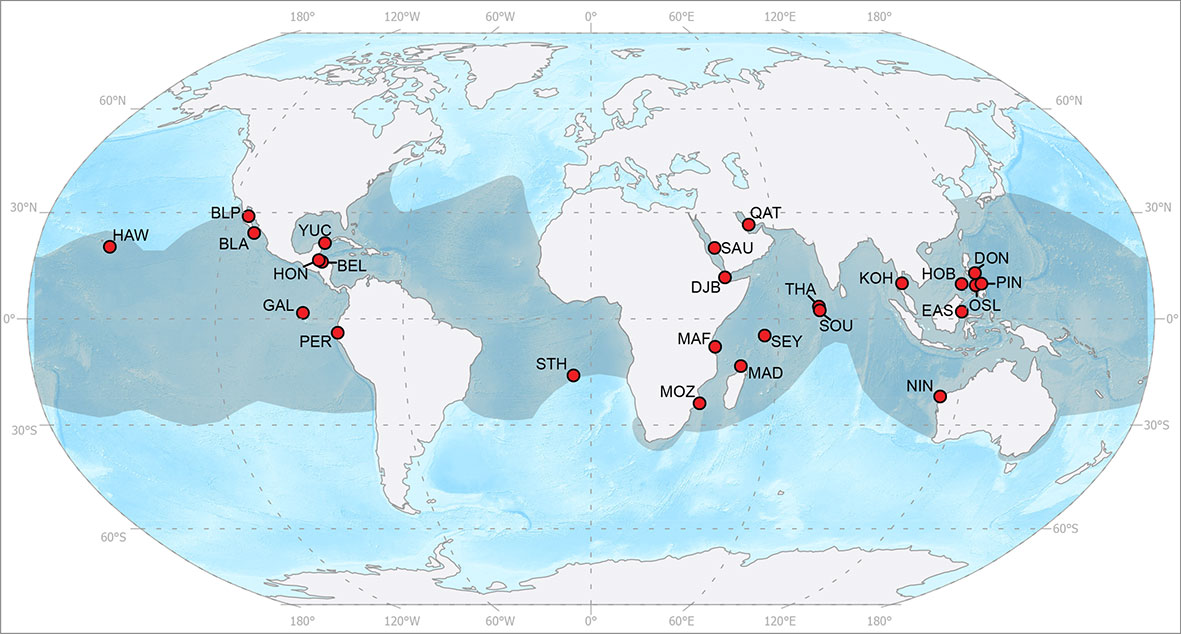
Figure 1 Global whale shark sites used in the present study from west to east on the map: Hawai'i, USA (HAW); Bahía de La Paz, Mexico (BLP); Bahía de Los Angeles, Mexico (BLA); the Galapagos Islands, Ecuador (GAL); Utila, Honduras (HON); Belize (BEL); Yucatan Peninsula, Mexico (YUC); Peru (PER); St. Helena, UK (STH); Tofo, Mozambique (MOZ); Mafia Island, Tanzania (MAF); Al Lith, Saudi Arabia (SAU); Gulf of Tadjoura, Djibouti (DJI); Nosy Be, Madagascar (MAD); Al Shaheen, Qatar (QAT); the Seychelles (SEY); Thaa Atoll, the Maldives (THA); South Ari Atoll, the Maldives (SOU); Koh Tao, Thailand (KOH); Ningaloo Reef, Australia (NIN); East Kalimantan, Indonesia (EAS); Honda Bay, Philippines (HOB); Oslob, Philippines (OSL); Donsol, Philippines (DON); and Pintuyan, Philippines (PIN). The shaded area represents the species range, adapted from the IUCN Red List assessment (Pierce & Norman, 2016). Map produced using ESRI ArcGIS Pro using the 1:50 m Ocean Bottom and the 1:110 m Land datasets from Natural Earth.
Table 1 Data summary for all 25 sites in this study.
Whale shark identification images were collected by researchers and citizen scientists, and collated and curated by in-country researchers (e.g. Figure 2). Identification data were uploaded onto Wildbook for Whale Sharks (WWS) for catalogue matching and validation, with the exception of Djibouti, Seychelles, Peru, Indonesia, Hawai'i, Bahia de La Paz (Mexico), Bahia de Los Angeles (Mexico), Thaa Atoll (Maldives) and South Ari Atoll (Maldives), who used localised catalogues to compare and identify individual animals assisted by program I3S Classic (Van Tienhoven et al., 2007). Both I3S and WWS use machine-automation to match spot patterns against a reference library – user-built by the former, and from global submissions by the latter. Here, we used a single sighting per shark per day across all sites.
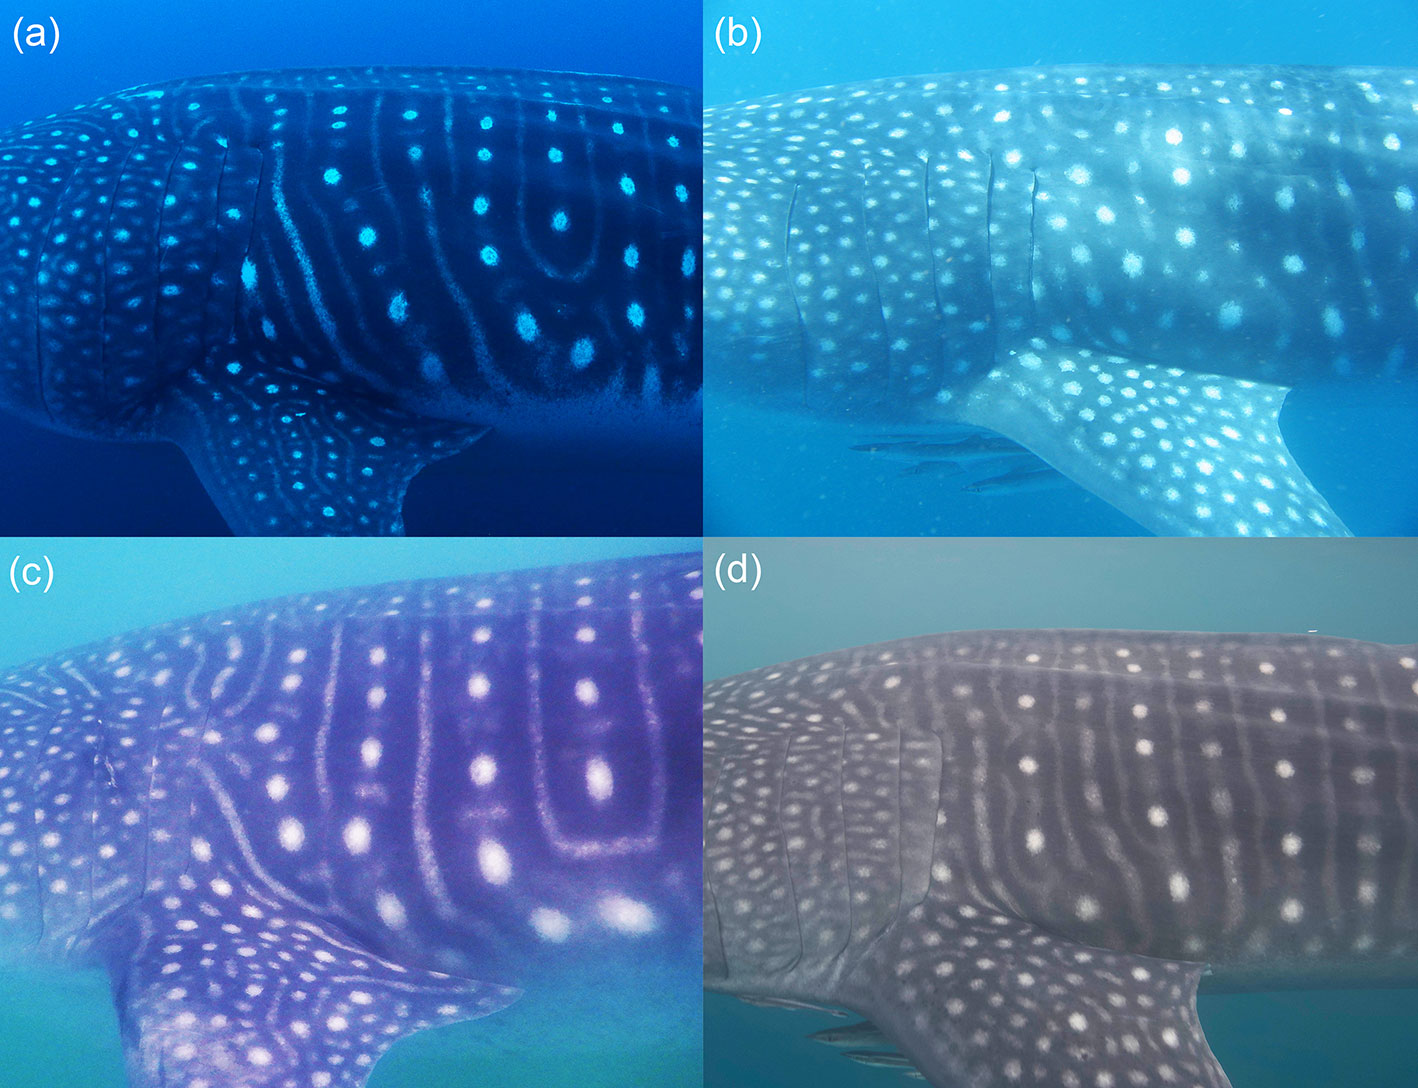
Figure 2 Photo-ID examples from four different study sites, (A) G-270 in the Galapagos Islands, Ecuador; (B) A-001 in Ningaloo Reef, Australia; (C) PE-163 in Cancas, Peru; and (D) P-1197 in Pintuyan, Philippines. The whale shark’s unique spot patterns make it an ideal candidate species for photo-ID studies.
Maximum likelihood methods
We calculated Lagged Identification Rate (LIR) for each site independently, and produced site-specific estimates of abundance, residency and mortality or permanent emigration from the resulting models.
We first prepared the data for input into the program SOCPROG 2.9 (Whitehead, 2009), with each site comprising three columns: date, study site and whale shark id. Data was then inputted into SOCPROG, and we used the ‘Movement’ module in the program to estimate the LIR. We set the sampling period to ‘day’, to establish that each individual whale shark was recorded on a per day basis.
Eight models exploring different population scenarios, as pre-set in the program, including closed and open population with varying combinations of immigration, re-immigration and mortality, were then fitted to each dataset (Table 2). For example, Model H tests that the population is open and that there is emigration, re-immigration and mortality of individual animals within this population between sampling periods (days as set above), and produces estimates of abundance (per day), mean residency inside and outside the study site, and morality rate. Abundance is an estimate of the average number of individuals per sampling occasion (day). Mortality or permanent emigration refers to the probability of an animal dying or leaving the population permanently (Whitehead, 2019) and is used to calculate apparent survival (φ), which is calculated as 1 minus the mortality estimate. The models cannot distinguish between mortality or permanent emigration (Whitehead, 2019). Residency (in days) is estimated as the mean time spent within the study site (residency in), and the mean time spent outside the study site before returning to the site (residency out). Estimates of the latter are imprecise however (H. Whitehead, pers. comm.), which leads to our improved estimates of residency below.
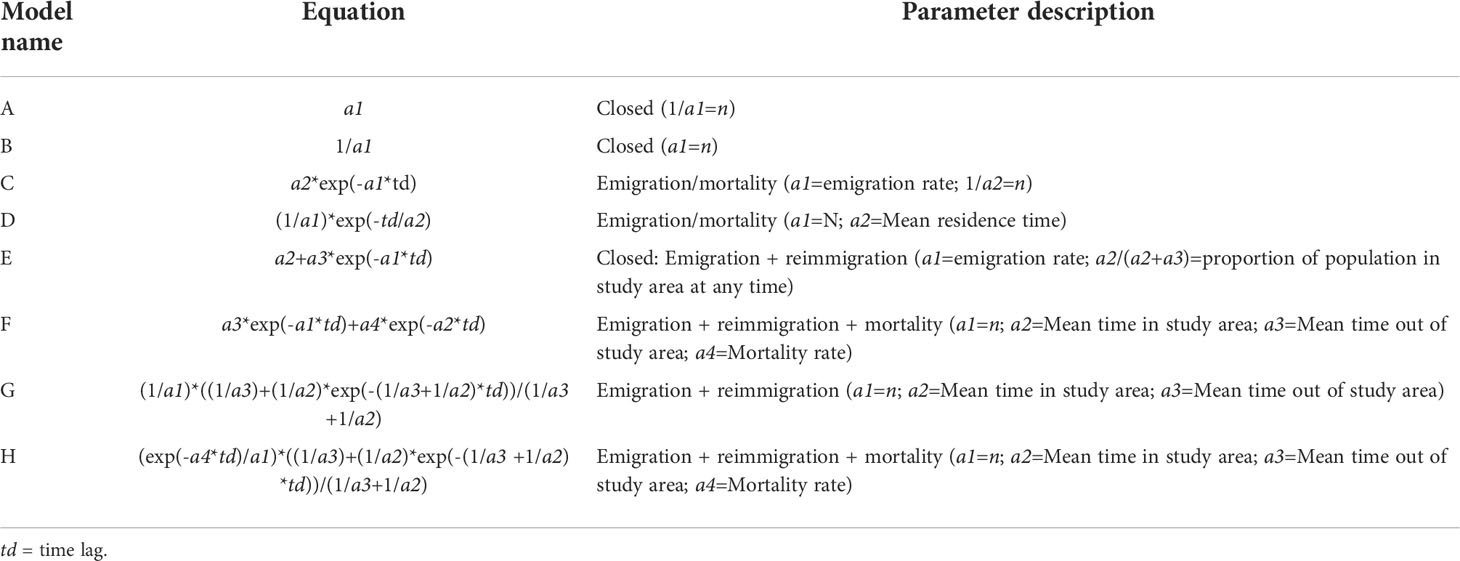
Table 2 Models used to assess scenarios of population closure, mortality or permanent emigration, residency and population size in the study area (n).
We used the quasi-Akaike information criterion (QAIC) for model selection when there was data over-dispersion as determined by SOCPROG, and the Akaike information criterion (AIC) otherwise (Burnham & Anderson, 2002; Whitehead, 2007). All models were run simultaneously, and we selected the models following Whitehead (2019), where a ΔAIC or ΔQAIC value of ≤ 2 indicates substantial support for the model, whilst a value of 4–7 indicates considerably less support, and a value of > 10 indicates essentially no support (Burnham & Anderson, 2002). For the purpose of this study (comparable results and new residency metric) we used Model H for all sites (see Results). The best-fit model was then bootstrapped for 100 repetitions through random resampling with replacement to produce parameter confidence intervals and standard errors (Buckland & Garthwaite, 1991). The LIR was assessed from the plots (Whitehead, 2019), where a falling LIR value indicates individuals leave the site (emigration and mortality), and increases over time indicate individuals return to the site (re-immigration).
Residency
The model estimates of residency described above are influenced by sighting and resighting of individual animals at the study site, and we wanted to test model outputs by comparing them to a known residency value. This was possible because at Oslob, Philippines, (OSL) whale sharks have been monitored daily, year-round since 2012, allowing for near complete coverage. Daily photo-ID surveys (see Araujo et al., 2014 for details) at the site began on 31 Mar 2012 and concluded on 31 Dec 2019. We assume all sharks were counted at the site, given the effort (daily 3 x 1 hr surveys) and the relatively small size of the search area (~480 x 170 m2), but we acknowledge the possibility of missed sharks. Of all global 25 sites, this is the most complete coverage of a site with 2,791 days of sampling effort. Given its accessibility from shore, this was not replicable at any of the other sites.
To improve the residency values obtained from the LIR models described above, we used the empirical daily photo-ID data from Oslob. For example, a shark first identified on 31 Mar 2012, sighted on 299 additional days, and last identified on 31 Dec 2019, would have a residency index of 0.12 (300/2831) or mean 43.8 days per year (d.yr-1). The value (2831) is the number of days between 31 Mar 2012 and 31 Dec 2019. We calculated this for all individual whale sharks at Oslob, except those first identified in 2019 to reflect inter-annual returnees at the site and not add bias to the probability of recapture.
With the empirical residency values from Oslob, we then calculated the ‘LIR residency proportion’ (∝LIR) for all sites, as a2/a3, where a2 is the modelled residency time in, and a3 is the modelled time out of the study site from Model H in Table 2, to understand residency within study sites. We used the following linear equation to derive an adjusted residency time, in d.yr-1, for all sites: residency = (∝LIR * 124.6)/1.97, where 124.6 is the modelled residency time in for OSL (a2) and 1.97 is the ∝LIR for OSL. We used a linear model to understand the relationship between adjusted residency values and LIR values from 1 day to ~1 year.
Data summary and population demographics
All statistical analyses including Chi-squared tests and linear regressions were performed using program R version 4.1.2 (R Core Team, 2021). We identified 8,976 individual whale sharks at 25 global sites, across 11,858 combined sampling days (Table 1). A small number of individuals (270) were identified at more than one site. These movements are reported elsewhere in the literature (summarised in Supplementary Table 3), but briefly, most of these took place within close geographic localities (e.g. within the Gulf of California or along Africa’s eastern coast, Ramírez-Macías et al., 2012b; Andrzejaczek et al., 2016 respectively). The number of individual whale sharks identified at each site ranged from 35 (Thaa Atoll, Maldives) to 1,313 (Yucatan, Mexico) per site, with a mean of 359.0 ± 300.1 S.D. sharks per site (Table 1). Total effort, in sampling days, varied greatly across sites, with an overall mean of 474.3 ± 610.0 d total sampling days, ranging from 68 d (Qatar) to 2,791 d (Oslob, Philippines). The first identification was from Donsol in Apr 1998, and the most recent from Hawai'i in Sep 2020, with an overall mean across sites between first and last identification of 11.1 ± 6.1 yr [range 4.1 (EAS) – 21.2 yr (Donsol, Philippines)].
On average, 5.0 ± 5.4 individual whale sharks were identified per sampling day (range 1.1 – 22.7) across all sites. A significant male bias was detected in the overall sex ratio of sightings, with 72.7% of individuals across all sites being male (Chi-squared test, χ2 = 9.93, p < 0.005). The exceptions were Galapagos (1.2% male), St Helena Island (53% male), and Al Lith, Saudi Arabia (50% male). Most sites were juvenile dominated (assuming maturity at 8-9 m, Norman & Stevens 2007), with an overall mean size of 5.7 ± 1.5 m (range 3.6 – 10.8 m; Table 1).
Results
Lagged identification rate
Model H, that tested for an open population where emigration, re-immigration and mortality of individual animals occurs between sampling occasions, was the best-fit model in 22 of our sites (ΔAIC or ΔQAIC < 2), and within the group of best models (ΔAIC or ΔQAIC < 4) in the remaining 3 sites (Supplementary Table 2). For Peru, the best-fit models with ΔAIC or ΔQAIC < 2 were Models C and E, where emigration and mortality, and emigration and re-immigration, occur respectively between sampling occasions – all which are also tested within Model H. For Thailand and Belize, the best-fit model was Model G which is structurally identical but parameterised differently than Model H. To compare sites using the same model, we therefore continued with model H for all analyses.
All sites followed a similar LIR pattern with a decline from 0 – 100 days following initial identification, and trailing off over time (Figure 3). For some sites, the LIR reached zero between 45 – 75 days (e.g. St Helena Island, Galapagos), indicating the whale sharks completely leave the area following initial identification or are affected by sampling – albeit the LIR increases at yearly intervals suggesting some individuals return seasonally (Figure 3). The LIR across all sites declined between 45.2 (Oslob) – 99.5 (Koh Tao, Thailand) % after ~ 1 year (mean 73.9%; Supplementary Table 4). Notably, the LIR at Mafia Island, Tanzania, Bahia de La Paz, South Ari Atoll and Oslob, displayed a steady, yet not dramatic, decline over time, highlighting longer mean residency periods following initial identification and increased associated probabilities of resighting individuals over time, as well as a lower mortality or permanent emigration (Figure 3). Contrastingly, the LIR at Koh Tao, Hawai'i and Galapagos declined rapidly to near zero, suggesting these animals likely do not reside within these study sites.
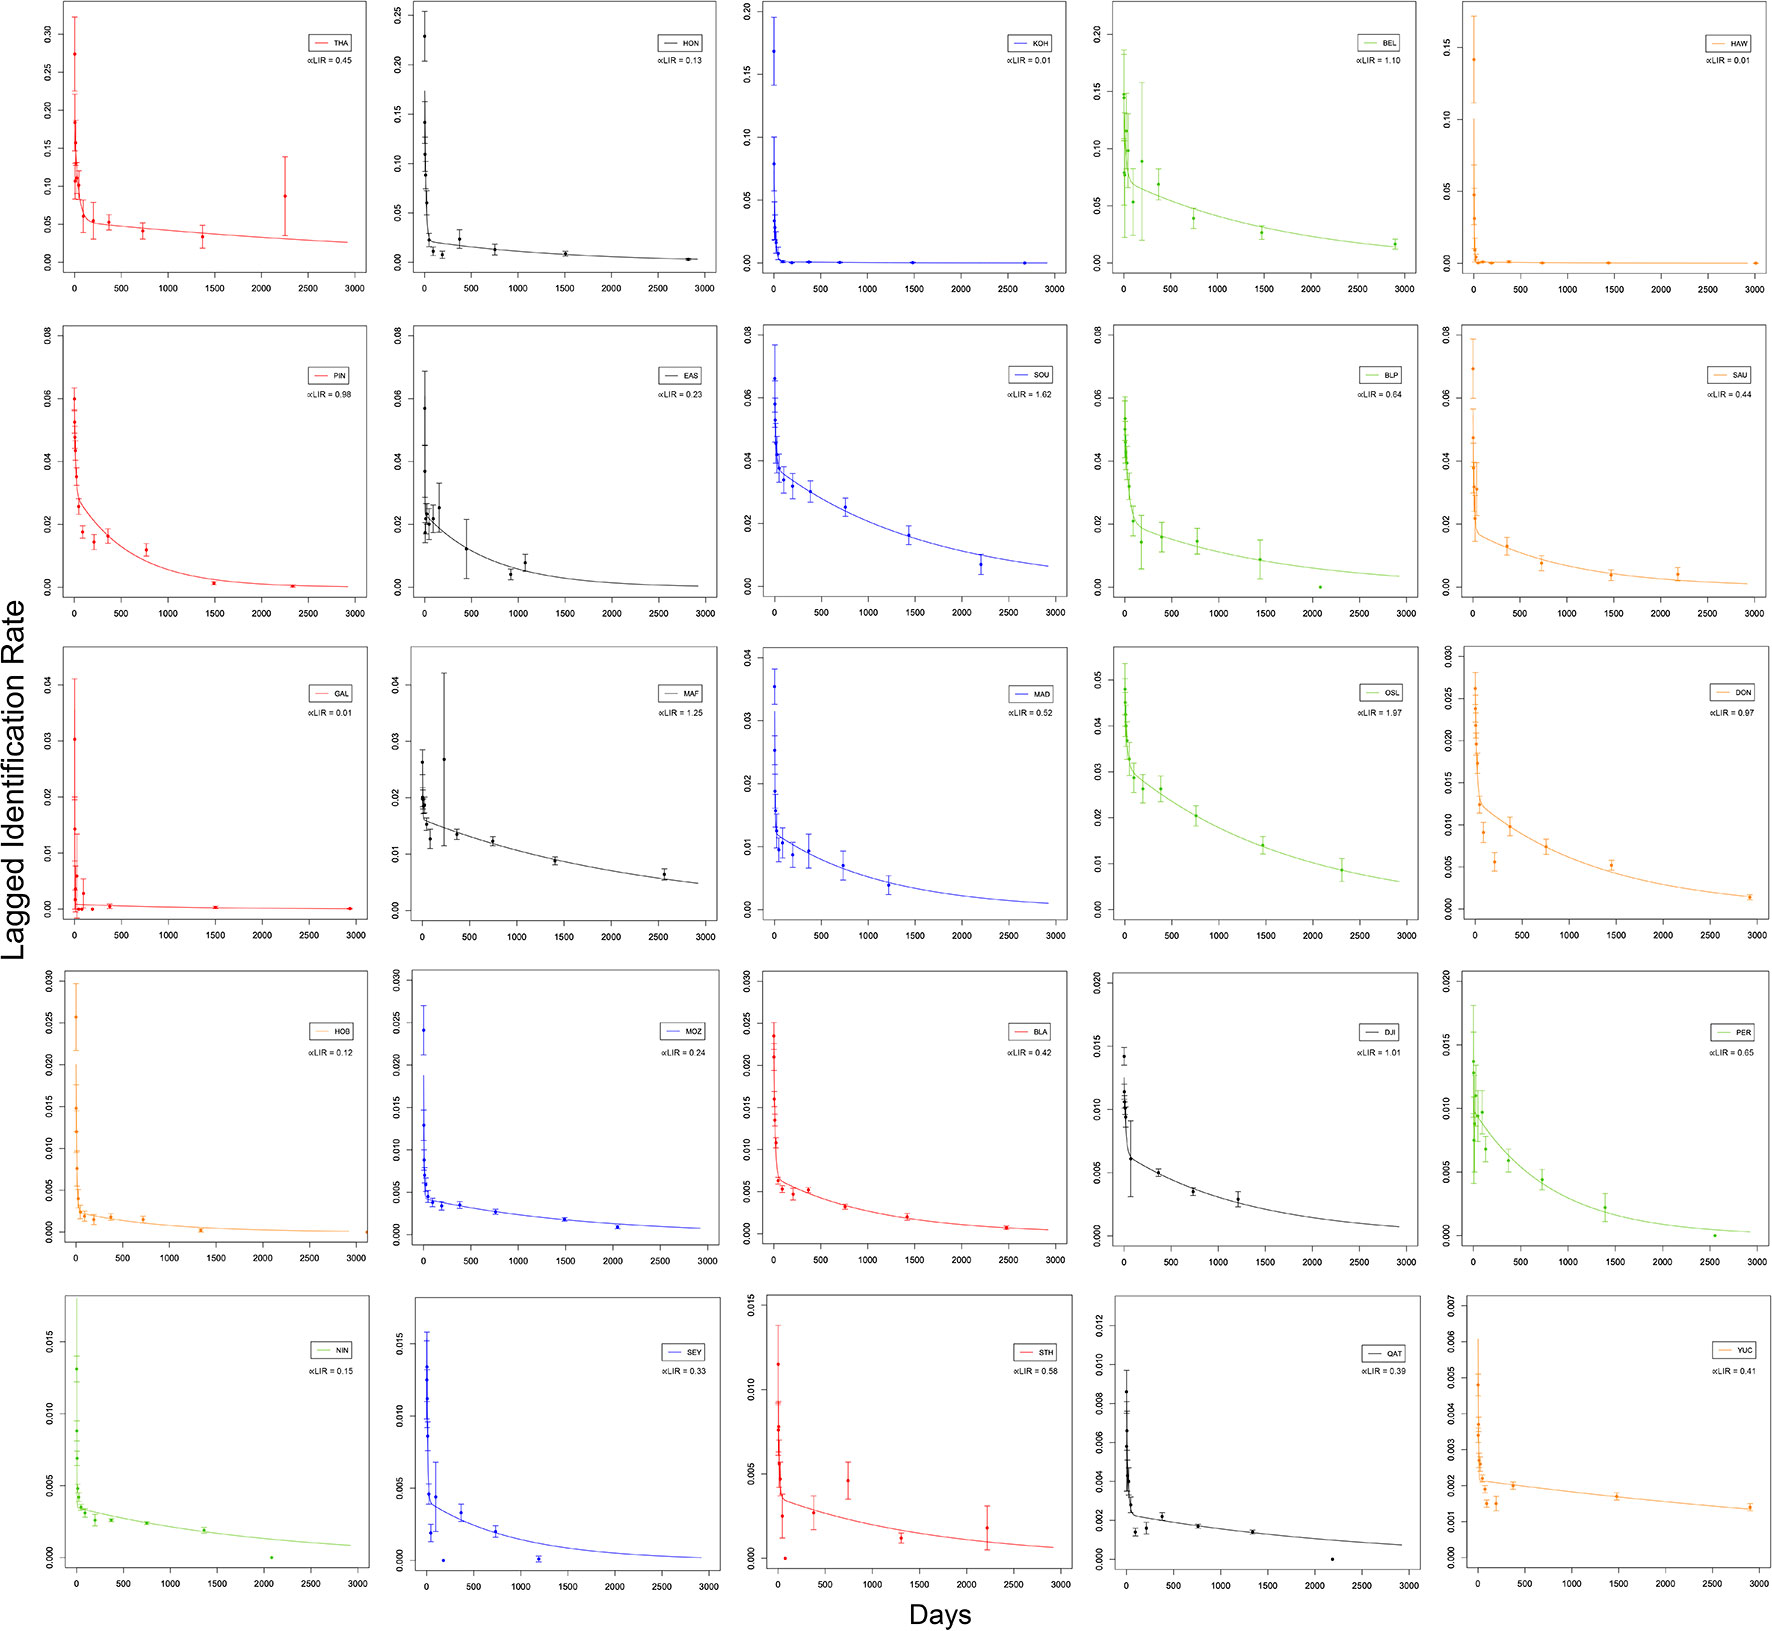
Figure 3 Lagged Identification Rate, the probability of resighting individual whale sharks at the study site after a certain time lag, for all 25 study sites with fitted formula (exp(-a4*td)/a1)*((1/a3)+(1/a2)*exp(-(1/a3 +1/a2)*td))/(1/a3+1/a2) from model H (see Table 3), where a1 = population size, a2 = residency time in, a3 = residency time out, a4 = mortality rate and td = time lag. ∝LIR is the ‘LIR residency proportion’ calculated a2/a3, where a larger value correlates with longer adjusted residency at the study site.
Abundance and mortality
Modelled daily abundance ranged from 5.4 (Honduras) to 135.8 (Yucatan) individuals per day, with an overall average of 38.3 ± 36.1 individual whale sharks on any one day (Table 3). Modelled residency within study sites ranged from 1.0 (Galapagos) to 66.3 (Oslob) days, with a mean of 21.6 ± 20.3 days across all sites. Residency outside the study sites ranged from 2.2 (Peru) to 1140.4 days (Koh Tao) with a mean of 110.3 ± 243.1 days. Estimates of mortality or permanent emigration ranged from 0.06 (Yucatan) to 0.61 (Pintuyan, Philippines) δ.yr-1, with an overall mean of 0.28 ± 0.13 across all sites – representing a mean apparent survival of 0.72 ± 0.13 (Table 3).
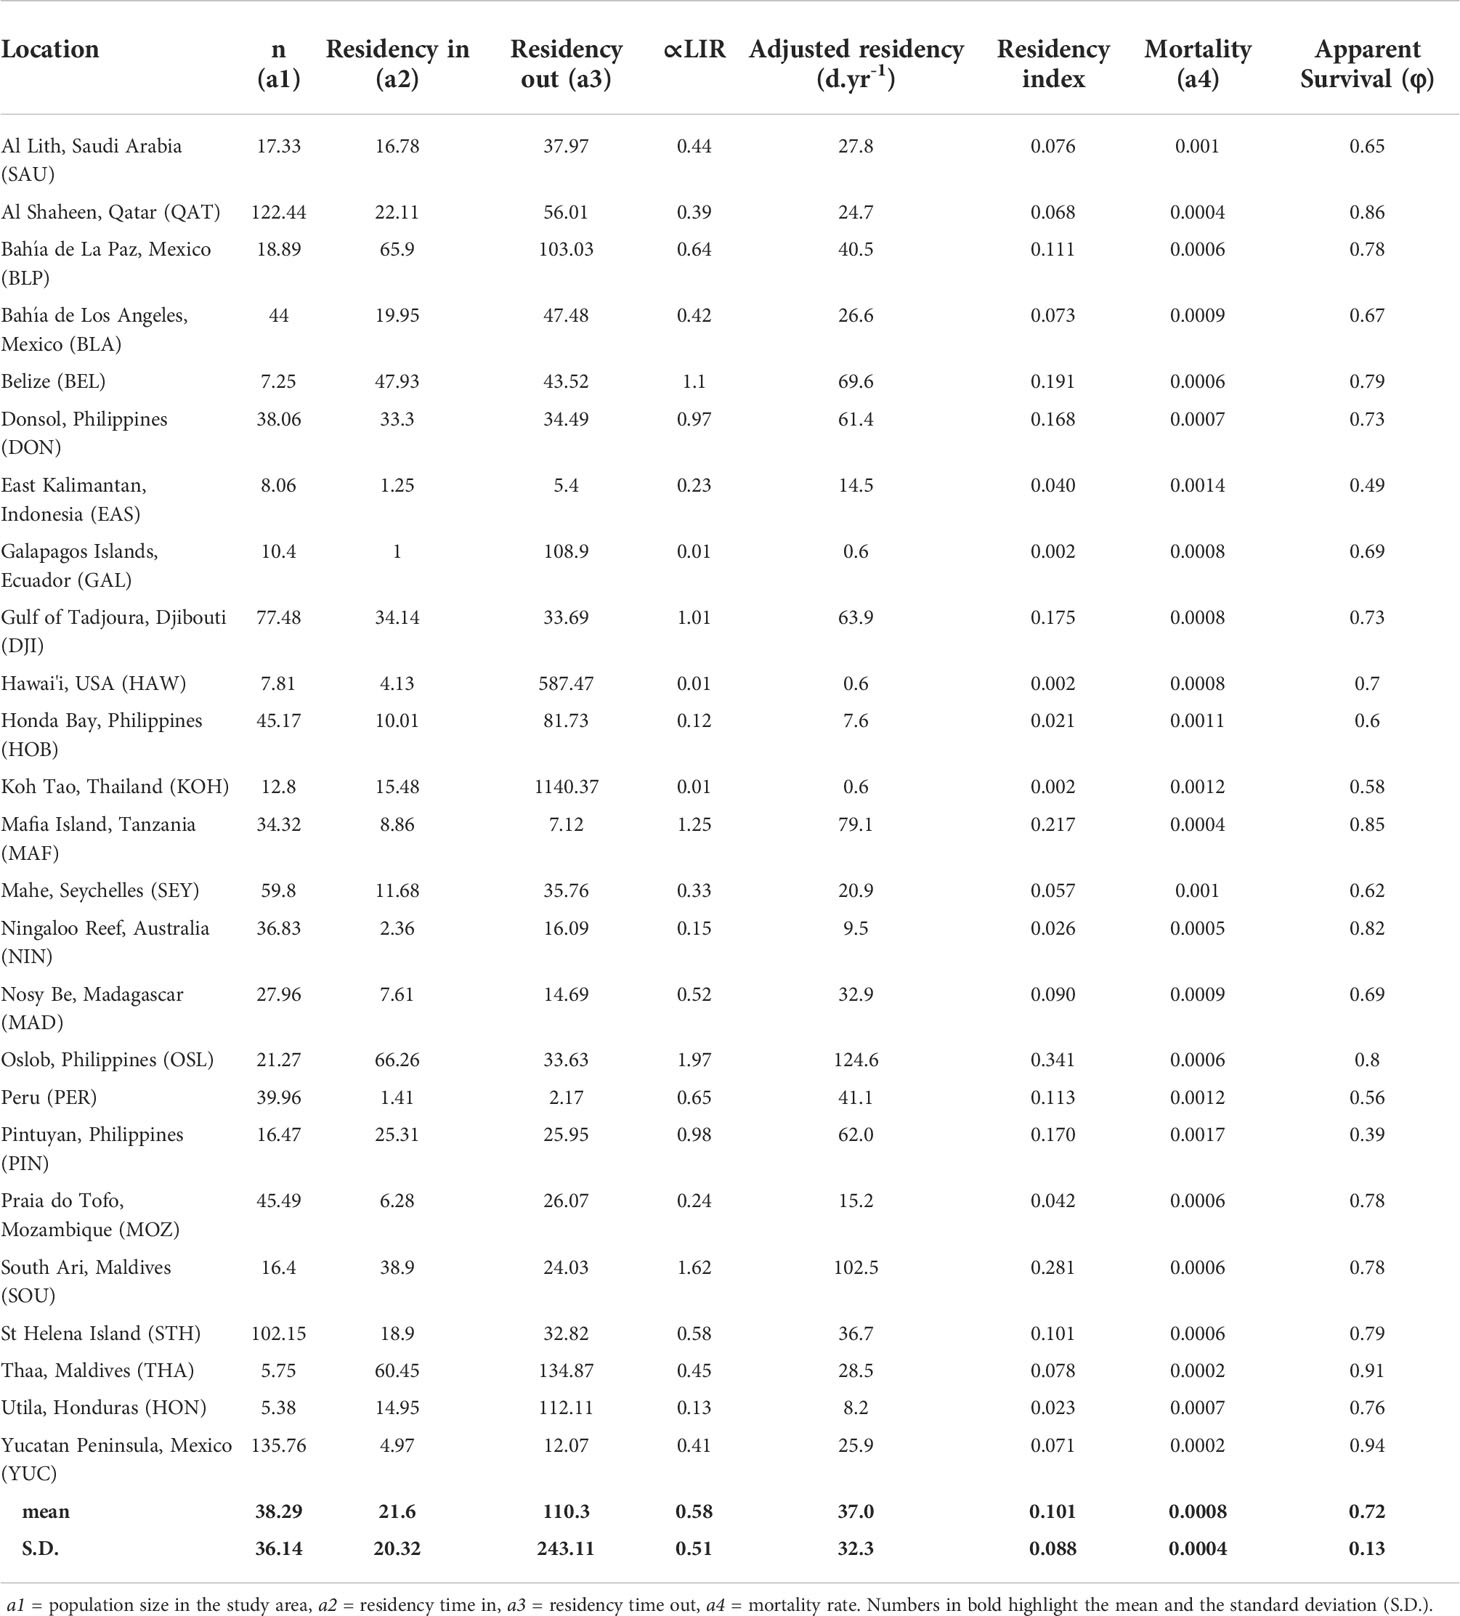
Table 3 Model H outputs (Table 3) for all sites analysed and general aggregation attributes.
Residency
We used a total of 42,357 unique identifications from 382 individual whale sharks at Oslob to adjust model estimates of residency given ~eight years of nearly continuous daily survey effort. Mean residency at Oslob was estimated at 124.6 ± 154.8 d.yr-1 or an equivalent residency index of 0.34 ± 0.42. The ∝LIR for all sites ranged from 0.01 (Hawai'i, Galapagos, Koh Tao) to 1.97 (Oslob), with an overall mean of 0.58 ± 0.49 (Table 3).
Adjusted residency estimates in d.yr-1 varied greatly across all sites, ranging from 0.6 (Hawai'i) to 124.6 (Oslob) d.yr-1, with a mean of 37.0 ± 32.3 d.yr-1 (Table 3; Figure 4). Similarly, residency indices based on adjusted residency estimates ranged from 0.002 (Hawai'i) to 0.341 (Oslob). Declines in LIR over ~ 1 year were significantly correlated with increased adjusted residency values (coefficient = 178.11, adjusted r2 = 0.73, p < 0.001).
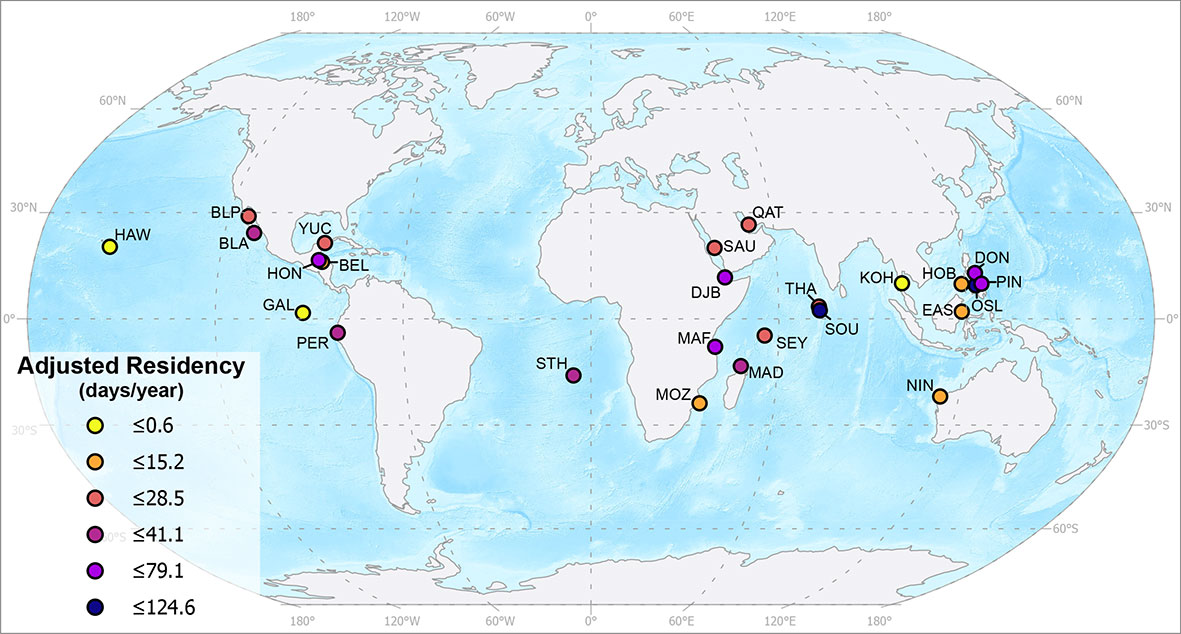
Figure 4 Global map with all 25 whale sharks study sites with their adjusted residency values in days per year. Map produced using ESRI ArcGIS Pro using the 1:50 m Ocean Bottom and the 1:110 m Land datasets from Natural Earth.
Discussion
Whale sharks display divergent residence patterns at different aggregations globally, and our adjusted residency metric provides valuable insight into their behaviour. Aggregations can be dynamic and shift location between seasons (e.g. de la Parra Venegas et al., 2011). Here, we used a collaborative approach to understand their residency behaviour across 25 sites highlighting that whale sharks tend to reside for longer at some sites whilst they might use other sites to navigate through en route to other areas of importance. Using data from a unique site in the Philippines where nearly complete and continuous monitoring was possible for ~8 years, we created a new residency metric using conventional maximum likelihood methods and improved our estimates of residency for all sites. Our results allowed for direct comparison amongst sites and expanded our knowledge of this elusive species.
Abundance and mortality
In this study, we identified 8,976 individual whale sharks across 25 sites. Given the heavy bias observed towards juvenile males, this number is likely to represent only a small portion of the total population. However, based on our modelled average daily abundance of 38 whale sharks, and if we assumed independence between sites, ca. 950 individual whale sharks would be using these sites on any given day. Extrapolated to our adjusted residency of average 37 days per year, this would indicate that ca. 35,000 individual whale sharks use our 25 sites annually. Our average apparent survival of 0.72 suggests there is either high mortality or high emigration to other sites, not covered by our surveys. This means that there are many more whale sharks in the ocean than what we see, and although we cannot apply CMR models to our data, we can infer that global population size is significantly larger than the ~9,000 individuals identified in this study. Further work to estimate population size for the species (globally or within known subpopulations or spatial management units) is paramount to understand the species recovery potential (Akçakaya et al., 2018).
There is evidence of whale shark aggregations with more than 100 individuals on any given day (e.g. off the Yucatan Peninsula, Mexico, de la Parra Venegas et al., 2011), which is of special interest when dealing with an endangered, rare species and requires dedicated management. Our modelled daily whale shark abundance was highly variable across all sites (range 5 – 136 individuals per day), yet it does reflect the empirical knowledge and data from these sites. For example, our largest estimated abundance per day of any site was for Yucatan which is currently the largest known whale shark aggregation globally. Other sites with modelled n of more than 100 include offshore Qatar in the Arabian Gulf and St. Helena in the South Atlantic. The former site is associated with the sharks feeding on mackerel tuna Euthynnus affinis eggs (Robinson et al., 2013; Robinson et al., 2016), similar to the Yucatan site (de la Parra Venegas et al., 2011). The drivers for the latter are not yet fully understood, but St Helena is unique in hosting a mostly adult 1:1 male to female aggregation where courtship and attempted mating behaviours have been reported (Perry et al., 2020).
Apparent survival at these three sites ranged from 0.80 – 0.93, suggesting these animals display philopatric behaviour and return to the site over time (i.e. low permanent emigration or mortality). Interestingly these sites are known to be seasonal for the species, so seasonal emigration is likely (Acuña-Marrero et al., 2014; Perry et al., 2020). In St Helena, for example, average water temperatures fall outside the whale shark’s thermal range (<21°C) for part of the year, which may be why the species is not present. These aggregations are good candidates for dynamic protection, as their occurrence is seasonally predictable and in great numbers, yet not always within the same defined area (see Maxwell et al., 2015). This relatively new management approach might prove useful across different whale shark sites whether they utilise an area to feed or navigate through.
Residency
Our residency index of 0.22 for Mafia Island, Tanzania, falls within previously published values based on passive acoustic telemetry (0.15-0.39; Rohner et al., 2020) suggesting our adjusted residency metric based on sightings-derived presence-only data is valid. Small differences could be explained by the fact that the LIR was modelled for all 201 individuals identified at this site, and that 17% of individuals were only seen once, while the acoustic telemetry study estimated the residency index for 51 tagged sharks. Additionally, there could also be biases on which individual whale sharks were tagged for the passive acoustic study (i.e. more resident sharks are more likely to be encountered and therefore tagged). Similarly, our residency index of 0.08 (corresponding to ~28 days per year) falls within published residency indices for whale shark at Al. Lith, Saudi Arabia (0.05-0.26; Cochran et al., 2019). The relatively low residency estimates from both visual and acoustic data is further supported by satellite telemetry work from the area (Berumen et al., 2014) that shows tagged whale sharks seasonally shifting from coastal (Al Lith) to offshore habitat utilisation (Berumen et al., 2014).
Residency index at St Helena Island was estimated at 0.01-0.24 based on passive acoustic telemetry (Perry et al., 2020), with our adjusted residency index falling within that (0.10). Our adjusted metric therefore works for estimating residency, and can be presented in days per year – an intuitive metric more useful for management. Whale sharks might indeed be present for longer and not be detected by conventional photo-ID methods, and highlights how technical solutions (such as passive acoustic telemetry) can be employed to generate high-quality data (e.g. Cagua et al., 2015). Such methods are often expensive and can be invasive, making non-invasive methods like photo-ID valuable tools, especially in countries where tagging is not allowed (e.g. Maldives, R. Rees, pers. comm.).
The South Ari Marine Protected Area (SAMPA) in the Maldives has year-round sightings of whale sharks (Harvey-Carroll et al., 2021). SAMPA likely plays an important role as a developmental habitat for males given the extended residency of individuals there estimated within this study of mean 102 d.yr-1, their small average size (5.4 m), and the male bias observed there (88%; Perry et al., 2018). It is likely that whale sharks occurrence at SAMPA is linked to feeding opportunities as observed in Oslob and Mafia Island (e.g. Rohner et al., 2015a), also sites with extended residency as per our results. The apparent survival at these three sites is higher than that observed at other sites (0.78 – 0.85), indicating whale sharks might reside for a considerable amount of time before permanently emigrating elsewhere – also consistent with developmental habitat theories (Heupel et al., 2007). Juvenile sharks at other coastal sites also reside for some time, yet not year-round as the aforementioned sites. For example, our adjusted residency values for whale sharks in Donsol and Pintuyan in the Philippines, Belize, and in Djibouti, still suggest they might spend a considerable amount of time at these sites (i.e. 60 – 70 d.yr-1). These aggregations tend to peak during the boreal winter, starting in October (Djibouti) and ending in early June (Donsol). Boldrocchi et al. (2020) highlighted the foraging preference of whale sharks for copepods at DJI, similar to that observed in Pintuyan (Sanabria et al., 2019) and DON (R. Dungog, pers. comm., May 2018). Whale sharks in Djibouti also target swimming crab spawn (D. Rowat, pers. obs.). In Pintuyan, seasons can be highly variable (Araujo et al., 2017), yet the occurrence of whale sharks has been linked to zooplankton abundance and prey availability (Sanabria et al., 2019). In Belize, whale sharks aggregate in Apr-May each year to capitalise on reef snapper spawn (Heyman et al., 2001). These events tend to last for ~2 weeks, and whale sharks residing within the general area are also preying on thimble jellyfish (Linuche unguiculata), copepods and baitfish (R. Graham pers. obs.) and plausibly vertically migrating prey (Graham et al., 2006). Although all these sites have differences in seasonal use, they all show philopatry, with individuals returning at annual or inter-annual intervals, with one individual in Donsol having the longest reported philopatric behaviour herein of 21 years similar to that observed at Ningaloo Reef (Norman & Morgan, 2016a). The lower apparent survival of individual whale sharks in Pintuyan could be explained by the highly variable seasons at the site, with some years yielding few sightings, and 34% of individuals have only been sighted once (Table 1). These two facts point to a high permanent emigration rate from the site which would lower their estimated apparent survival over time (i.e. probability of return to the site). Within season, a mean estimated abundance of 77 individual sharks on any given day at DJI makes it a significant aggregation globally – contrasting with ~16.5 in Pintuyan, 38 in Donsol or ~7 in Belize. Donsol is the longest-running whale shark ecotourism endeavour in Asia (late 1990s) and hosts a considerable number of adults, juveniles (McCoy et al., 2018), and is globally important for the species’ reproductive ecology (Miranda et al., 2020). Basing conservation action on abundance alone might not make be the most effective for the species recovery – rather targeting areas of ecological importance such as nursery, mating and feeding grounds might prove more effective (Pierce et al., 2021).
Contrastingly to the sites above, whale sharks feeding predominantly on small fish in Honda Bay, Philippines, appear to reside for shorter time periods (mean ~8 d). They do however show periodicity at the site over time (Araujo et al., 2019b), suggesting that although feeding opportunities might be short during the low primary productivity months in the region (May-Nov, Cabrera et al., 2011), it is worth returning and capitalising on this feeding opportunity. Similarly, at Honduras, whale sharks feed on baitfish (Fox et al., 2013) and have adjusted residency of ~9 days. Whale sharks identified in Honduras move to and from Belize and Yucatan, indicating that, although some feeding opportunities exist off Utila, they travel to other more productive grounds dominated by other prey sources (e.g. snapper spawn, Graham and Roberts, 2006; sergestids and copepods, Motta et al., 2010; tunny spawn, de la Parra Venegas et al., 2011). In contrast, whale sharks in Madagascar are normally encountered in association with baitfish similar to that observed in Honda Bay (Diamant et al., 2018), but their residency time is around three times that observed in Honda Bay or Belize. This could be because Nosy Be is a big embayment whereas at the aforementioned sites whale sharks are likely feeding on frontal systems passing through (Ryan et al., 2017). Sharks at Nosy Be are also reportedly associated with other filter-feeding megafauna that target krill species, so a combination of both prey sources might provide the whale sharks with longer residency times (Diamant et al., 2018). The Authors showed that whale sharks spent some time at Nosy Be following satellite tag deployment, before moving west or southwest.
An unexpected result among the low-residency aggregations is Ningaloo Reef, where we estimated ~9 days per year – contrasting with previous studies at the site (33 d, Holmberg et al., 2009; ~44 d, Lester et al., 2020). There is evidence that whale sharks use a broad area along Western Australia beyond Ningaloo Reef as shown through satellite telemetry (Norman et al., 2016b), and that whale sharks are found on the Ningaloo Reef year-round (Norman et al., 2017b). Interestingly, apparent survival (0.82) was similar to that modelled by Lester et al. (2020) (~0.85) and Holmberg et al. (2009) (0.48 – 0.89). Both these studies included covariates to their CMR models: scarring by the former as described by Speed et al. (2008) (e.g. bites, abrasions, lacerations, etc.), and size by the latter, whereas we used a different approach altogether (LIR). Further modelling with the same dataset for Ningaloo Reef exploring both LIR and CMR modelling approaches could shed light to these discrepancies. For example, Harvey-Carroll et al. (2021) used scarring as a covariate for whale sharks in SAMPA and obtained similar apparent survival results through both the LIR and CMR approaches.
Some whale shark hotspots appear to be transitional waypoints rather than aggregations. Galapagos, Hawai'i and Koh Tao stand out with adjusted residency estimated values of <1 day. This is not surprising as whale sharks seen at these sites are normally cruising through the area and not commonly resighted within a short time-scale (<6 months; Acuña-Marrera et al., 2014; S Marcoux, pers. obs.; Magson et al. 2022). Satellite telemetry data from Galapagos and Tubbataha in the Philippines support this understanding (Hearn et al., 2016; Araujo et al., 2018). Little is known about the movement of whale sharks in the western South China Sea, including those encountered in KOH and neighbouring islands. To date, no major feeding ground has been identified, though reports of whale sharks off Cambodia’s offshore islands, and encounters off eastern Peninsular Malaysia exist (G Araujo unpub. data). Further investigation in this general area is paramount given the proximity and likely connectivity of whale sharks to China, where the largest single fishery for the species operated until recently (Li et al., 2012). Similarly, little is known about whale sharks in the Central Pacific, and further telemetry work in Hawai'i can help identify their feeding grounds, or connectivity across sites. It is likely that some of these whale sharks encountered along seamounts and offshore islands are foraging on frontal areas offshore (Ryan et al., 2017).
Limitations
There are a number of limitations to using photo-ID data to understand population demographics. Even assuming no changes in the spot pattern of individuals, animals might still be misidentified and wrongly assigned as a new or other individual (Pierce et al., 2018). This is particularly difficult for growing photo-ID catalogues (hundreds of individuals) where visual photo-ID matching becomes infeasible and reliance on automated systems (i.e. I3S or WWS) is necessary. Another common caveat is that whale sharks might be present at the site yet not be encountered and identified during photo-ID survey efforts. Although some models can account for this (e.g. Torres et al., 2008), it is a limitation that other methods (e.g. passive acoustic monitoring, Janik et al., 2013) can account for on vocal marine species for example. In whale sharks, passive acoustic telemetry at one site showed that only few individuals (<5%) were missed by photo-ID during the survey season (Rohner et al., 2020). Detection probability is likely to vary among sites, however, depending on survey area, bathymetry, frequency, number of individuals and their behaviour (e.g. Cagua et al., 2015).
A limitation with the LIR movement models is the inability to deal with heterogeneity within the data, where population data is mostly split between resident (i.e. high resighting rate) and transient (i.e. seen once) individuals (H Whitehead, pers. comm., May 2020). Both behaviours are expected given that ideal whale shark feeding opportunities are seasonal (e.g. Heyman et al., 2001). Estimates of ‘residency time out’ are also imprecise within the LIR approach given the presence-only data used as input, and hence our approach herein to try and further understand residency patterns. In the present study, data for East Kalimantan and Peru followed these patterns and there were several best-fit models (Supplementary Table 2). The data heterogeneity issue has been previously highlighted in other taxa (e.g. marine turtles, Araujo et al., 2019a). These models are, however, indicative, not absolute, and their suitability is determined to a large degree by the ecological question being investigated. However, it is worth noting that given the difficulty of applying standardised methods across different locations (e.g. 25 described here), using methods like LIR to answer important ecological questions and future work to deal with heterogeneity should be encouraged. The ability of the LIR approach to use presence-only data (i.e. no absence or zero data) facilitates its applicability across different sites that might have different survey methods, like that described herein.
It is worth noting that our adjusted residency times in days per year are based on an aggregation of whale sharks whose residency behaviour has been noted to be different due to the provisioning activities (Araujo et al., 2014; Thomson et al., 2017; results herein). Given that the LIR uses the identification data itself as the unit of effort, and that the same methods were applied to all sites, the results obtained should not be biased. Whale sharks in Oslob display higher residency rates than at other sites, however, we used the ∝LIR across all sites and the empirical data from Oslob to interpret the LIR residency values using presence-only data. Our extrapolation of this approach to all sites provided intuitive residency estimates relevant for management and allowed for validation of the results against both current and future acoustic data from each site.
Conclusions
Our study shows that collaborative efforts, and the applicability of an easy-to-use program, can help us understand the ecology of enigmatic species like the whale shark, and can be cautiously tried out on other taxa. We highlight how whale sharks different global sites have different residency patterns, and an overall strong philopatry to aggregation sites as highlighted by increases in the LIR over time and with one individual returning >20 years after initial identification. It is worth noting that most sites were juvenile dominated (n = 23), and male-biased (n = 22), and thus key knowledge gaps remain for other demographics such as adult females and neonates. We present an adjusted residency approach corrected by empirical data from a globally unique site, and how this reflects differences in residency at different aggregations. Our results can help future whale shark work by providing an adjusted equation to estimate residency times based on model outputs. Although some locations are important for the species based on large population sizes, life-stages hosted (juveniles, sub-adult and adults), and site fidelity, residency is an important consideration when added anthropogenic-driven mortality can have quick and negative effects on population size (e.g. Arabian Sea, Dulvy et al., 2017). Identifying hotspots and areas of importance for this endangered species is paramount for conservation efforts, and harmonising methods that can reflect the ecology and habitat use of the species is essential. Our collaborative results from 25 global whale shark sites show that an easy-to-use, open-access software with built-in complex animal behaviour models can help us understand the ecology of a species. Our novel residency metric can guide future management decisions by providing an index of temporal site use by the whale shark and can be cautiously tried out on other taxon.
Data availability statement
The raw data supporting the conclusions of this article will be made available by the authors, without undue reservation.
Ethics statement
No animal was restrained to collect the data used in this study, and photo-ID is inherently non-invasive. Ethics for in-water work with whale sharks followed local guidelines, and authors acquired the necessary permits for research in accordance with local requirements where relevant.
Author contributions
GA conceived the ideas and designed methodology. All authors collected the data. All authors analysed the data. All authors led the writing of the manuscript. All authors contributed critically to the drafts and gave final approval for publication.
Acknowledgments
We would like to thank all the volunteers, staff members, tour guides and tourism operators, management agency staff, fishermen, and citizen scientists who contributed data to the multiple projects in this study. This research has made use of data and software tools provided by Wildbook for Whale Sharks, an online mark-recapture database operated by the non-profit scientific organization Wild Me with support from public donations and the Qatar Whale Shark Research Project.
Conflict of interest
Authors BN and SR were employed by ECOCEAN Inc.
The remaining authors declare that the research was conducted in the absence of any commercial or financial relationships that could be construed as a potential conflict of interest.
The reviewer LH declared a past co-authorship with several of the authors JC and RG to the handling Editor.
Publisher’s note
All claims expressed in this article are solely those of the authors and do not necessarily represent those of their affiliated organizations, or those of the publisher, the editors and the reviewers. Any product that may be evaluated in this article, or claim that may be made by its manufacturer, is not guaranteed or endorsed by the publisher.
Supplementary material
The Supplementary Material for this article can be found online at: https://www.frontiersin.org/articles/10.3389/fmars.2022.775691/full#supplementary-material.
References
Acuña-Marrero D., Jiménez J., Smith F., Doherty P. F. Jr., Hearn A., Green J. R., et al. (2014). Whale shark (Rhincodon typus) seasonal presence, residence time and habitat use at Darwin island, Galapagos marine reserve. PLoS One 9 (12), e115946. doi: 10.1371/journal.pone.0115946
Akçakaya H. R., Bennett E. L., Brooks T. M., Grace M. K., Heath A., Hedges S., et al. (2018). Quantifying species recovery and conservation success to develop an IUCN green list of species. Conserv. Biol. 32 (5), 1128–1138. doi: 10.1111/cobi.13112
Andrzejaczek S., Meeuwig J., Rowat D., Pierce S., Davies T., Fisher R., et al. (2016). The ecological connectivity of whale shark aggregations in the Indian ocean: a photo-identification approach. R. Soc. Open Sci. 3 (11), 160455. doi: 10.1098/rsos.160455
Araujo G., Agustines A., Tracey B., Snow S., Labaja J., Ponzo A. (2019a). Photo-ID and telemetry highlight a global whale shark hotspot in palawan, Philippines. Sci. Rep. 9 (1), 1–12. doi: 10.1038/s41598-019-53718-w
Araujo G., Agustines A., Tracey B., Snow S., Labaja J., Ponzo A., et al (2019b). Photo-ID and telemetry highlight a global whale shark hotspot in palawan, Philippines. Sci. Rep. 9 (1), 1–12. doi: 10.1038/s41598-019-53718-w
Araujo G., Ismail A. R., McCann C., McCann D., Legaspi C. G., Snow S., et al. (2020). Getting the most out of citizen science for endangered species such as whale shark. J. Fish. Biol. 96 (4), 864–867. doi: 10.1111/jfb.14254
Araujo G., Legaspi C. G., Ferber S., Murray R., Burdett K., Grundy S., et al. (2019a). In-water methods reveal population dynamics of a green turtle chelonia mydas foraging aggregation in the Philippines. Endangered. Species. Res. 40, 207–218. doi: 10.3354/esr00989
Araujo G., Legaspi C. G., Ferber S., Murray R., Burdett K., Grundy S., et al. (2019b). In-water methods reveal population dynamics of a green turtle chelonia mydas foraging aggregation in the Philippines. Endangered. Species. Res. 40, 207–218. doi: 10.3354/esr00989
Araujo G., Lucey A., Labaja J., So C. L., Snow S., Ponzo A. (2014). Population structure and residency patterns of whale sharks, rhincodon typus, at a provisioning site in cebu, Philippines. PeerJ 2, e543. doi: 10.7717/peerj.543
Araujo G., Rohner C. A., Labaja J., Conales S. J., Snow S. J., Murray R., et al. (2018). Satellite tracking of juvenile whale sharks in the sulu and bohol seas, Philippines. PeerJ 6, e5231. doi: 10.7717/peerj.5231
Araujo G., Snow S., So C. L., Labaja J., Murray R., Colucci A., et al. (2017). Population structure, residency patterns and movements of whale sharks in southern leyte, Philippines: results from dedicated photo-ID and citizen science. Aquat. Conservation.: Mar. Freshw. Ecosyst. 27 (1), 237–252. doi: 10.1002/aqc.2636
Arzoumanian Z., Holmberg J., Norman B. (2005). An astronomical pattern-matching algorithm for computer-aided identification of whale sharks rhincodon typus. J. Appl. Ecol. 42 (6), 999–1011. doi: 10.1111/j.1365-2664.2005.01117.x
Bauder J. M., Cervantes A. M., Avrin A. C., Whipple L. S., Farmer M. J., Miller C. A., et al. (2021). Mismatched spatial scales can limit the utility of citizen science data for estimating wildlife-habitat relationships. Ecol. Res. 36 (1), 87–96. doi: 10.1111/1440-1703.12173
Berumen M. L., Braun C. D., Cochran J. E., Skomal G. B., Thorrold S. R. (2014). Movement patterns of juvenile whale sharks tagged at an aggregation site in the red Sea. PLoS One 9 (7), e103536. doi: 10.1371/journal.pone.0103536
Boldrocchi G., Omar M., Azzola A., Bettinetti R. (2020). The ecology of the whale shark in Djibouti. Aquat. Ecol. 54 (2), 535–551. doi: 10.1007/s10452-020-09758-w
Buckland S. T., Garthwaite P. H. (1991). Quantifying precision of mark-recapture estimates using the bootstrap and related methods. Biometrics, 255–268. doi: 10.2307/2532510
Burnham K. P., Anderson D. R. (2002). Model selection and multimodel inference: A practical information-theoretic approach (New York: Springer-Verlag).
Cabrera O. C., Villanoy C. L., David L. T., Gordon A. L. (2011). Barrier layer control of entrainment and upwelling in the bohol Sea, Philippines. Oceanography 24 (1), 130–141. doi: 10.5670/oceanog.2011.10
Cagua E. F., Cochran J. E., Rohner C. A., Prebble C. E., Sinclair-Taylor T. H., Pierce S. J., et al. (2015). Acoustic telemetry reveals cryptic residency of whale sharks. Biol. Lett. 11 (4), 20150092. doi: 10.1098/rsbl.2015.0092
Castro A. L. F., Stewart B. S., Wilson S. G., Hueter R. E., Meekan M. G., Motta P. J., et al. (2007). Population genetic structure of earth's largest fish, the whale shark (Rhincodon typus). Mol. Ecol. 16 (24), 5183–5192. doi: 10.1111/j.1365-294X.2007.03597.x
Chabanne D., Finn H., Salgado-Kent C., Bedjer L. (2012). Identification of a resident community of bottlenose dolphins (Tursiops aduncus) in the SwanCanning riverpark, Western Australia, using behavioural information. Pacific. Conserv. Biol. 18 (4), 247–262. doi: 10.1071/PC120247
Cochran J. E., Braun C. D., Cagua E. F., Campbell M. F. Jr., Hardenstine R. S., Kattan A., et al. (2019). Multi-method assessment of whale shark (Rhincodon typus) residency, distribution, and dispersal behavior at an aggregation site in the red Sea. PLoS One 14 (9), e0222285. doi: 10.1371/journal.pone.0222285
Davies T. K., Stevens G., Meekan M. G., Struve J., Rowcliffe J. M. (2013). Can citizen science monitor whale-shark aggregations? investigating bias in mark–recapture modelling using identification photographs sourced from the public. Wildlife. Res. 39 (8), 696–704. doi: 10.1071/WR12092
de la Parra Venegas R., Hueter R., Cano J. G., Tyminski J., Remolina J. G., Maslanka M., et al. (2011). An unprecedented aggregation of whale sharks, rhincodon typus, in Mexican coastal waters of the Caribbean Sea. PLoS One 6 (4), e18994. doi: 10.1371/journal.pone.0018994
Diamant S., Rohner C. A., Kiszka J. J., d Echon A. G., d Echon T. G., Sourisseau E., et al. (2018). Movements and habitat use of satellite-tagged whale sharks off western Madagascar. Endangered. Species. Res. 36, 49–58. doi: 10.3354/esr00889
Dulvy N. K., Robinson D. P., Pierce S. J., Norman B., Fernando D., Khan M., et al. (2017). The conservation status of sharks, rays, and chimaeras in the Arabian Sea and adjacent waters. Eds. Jabado R. W., Kyne P. M., Pollom R. A., Ebert D. A., Simpfendorfer C. A., Ralph G. M., Dulvy N. K. (Vancouver, Canada: Environment Agency – Abu Dhabi, UAE and IUCN Species Survival Commission Shark Specialist Group), 236 pp.
Fox S., Foisy I., de la Parra Venegas R., Galván Pastoriza B. E., Graham R. T., Hoffmayer E. R., et al. (2013). Population structure and residency of whale sharks rhincodon typus at utila, bay islands, Honduras. J. Fish. Biol. 83 (3), 574–587. doi: 10.1111/jfb.12195
Germanov E. S., Bejder L., Chabanne D. B., Dharmadi D., Hendrawan I. G., Marshall A. D., et al. (2019). Contrasting habitat use and population dynamics of reef manta rays within the nusa penida marine protected area, Indonesia. Front. Mar. Sci. 6, 215. doi: 10.3389/fmars.2019.00215
Graham R. T., Roberts C. M. (2007). Assessing the size, growth rate and structure of a seasonal population of whale sharks (Rhincodon typus smith 1828) using conventional tagging and photo identification. Fisheries. Res. 84 (1), 71–80. doi: 10.1016/j.fishres.2006.11.026
Graham R. T., Roberts C. M., Smart J. C. (2006). Diving behaviour of whale sharks in relation to a predictable food pulse. J. R. Soc. Interface 3 (6), 109–116. doi: 10.1098/rsif.2005.0082
Harvey-Carroll J., Stewart J. D., Carroll D., Mohamed B., Shameel I., Zareer I. H., et al. (2021). The impact of injury on apparent survival of whale sharks (Rhincodon typus) in south ari atoll marine protected area, Maldives. Sci. Rep. 11 (1), 1–15. doi: 10.1038/s41598-020-79101-8
Hearn A. R., Green J., Román M. H., Acuña-Marrero D., Espinoza E., Klimley A. P. (2016). Adult female whale sharks make long-distance movements past Darwin island (Galapagos, Ecuador) in the Eastern tropical pacific. Mar. Biol. 163 (10), 214. doi: 10.1007/s00227-016-2991-y
Heupel M. R., Carlson J. K., Simpfendorfer C. A. (2007). Shark nursery areas: concepts, definition, characterization and assumptions. Mar. Ecol. Prog. Ser. 337, 287–297. doi: 10.3354/meps337287
Hilborn R. (1990). Determination of fish movement patterns from tag recoveries using maximum likelihood estimators. Can. J. Fisheries. Aquat. Sci. 47 (3), 635–643. doi: 10.1139/f90-071
Holmberg J., Norman B., Arzoumanian Z. (2008). Robust, comparable population metrics through collaborative photo-monitoring of whale sharks rhincodon typus. Ecol. Appl. 18 (1), 222–233. doi: 10.1890/07-0315.1
Holmberg J., Norman B., Arzoumanian Z. (2009). Estimating population size, structure, and residency time for whale sharks rhincodon typus through collaborative photo-identification. Endangered. Species. Res. 7 (1), 39–53. doi: 10.3354/esr00186
Jäckel D., Mortega K. G., Sturm U., Brockmeyer U., Khorramshahi O., Voigt-Heucke S. L. (2021). Opportunities and limitations: A comparative analysis of citizen science and expert recordings for bioacoustic research. PLoS One 16 (6), e0253763. doi: 10.1371/journal.pone.0253763
Janik V. M., King S. L., Sayigh L. S., Wells R. S. (2013). Identifying signature whistles from recordings of groups of unrestrained bottlenose dolphins (Tursiops truncatus). Mar. Mammal. Sci. 29 (1), 109–122. doi: 10.1111/j.1748-7692.2011.00549.x
Lester E., Meekan M. G., Barnes P., Raudino H., Rob D., Waples K., et al. (2020). Multi-year patterns in scarring, survival and residency of whale sharks in ningaloo marine park, Western Australia. Mar. Ecol. Prog. Ser. 634, 115–125. doi: 10.3354/meps13173
Lester E., Speed C., Rob D., Barnes P., Waples K., Raudino H. (2019). Using an electronic monitoring system and photo identification to understand effects of tourism encounters on whale sharks in ningaloo marine park. Tourism. Mar. Environments. 14 (3), 121–131. doi: 10.3727/154427319X15634581669992
Magson K., Monacella E., Scott C., Buffat N., Arunrugstichai S., Chuangcharoendee M., et al (2022). Citizen science reveals the population structure and seasonal presence of whale sharks in the Gulf of Thailan. Journal of Fish Biology. doi: 10.1111/jfb.15121
Maxwell S. M., Hazen E. L., Lewison R. L., Dunn D. C., Bailey H., Bograd S. J., et al. (2015). Dynamic ocean management: Defining and conceptualizing real-time management of the ocean. Mar. Policy 58, 42–50. doi: 10.1016/j.marpol.2015.03.014
McCoy E., Burce R., David D., Aca E. Q., Hardy J., Labaja J., et al. (2018). Long-term photo-identification reveals the population dynamics and strong site fidelity of adult whale sharks to the coastal waters of donsol, Philippines. Front. Mar. Sci. 5, 271. doi: 10.3389/fmars.2018.00271
McKinney J. A., Hoffmayer E. R., Holmberg J., Graham R. T., Driggers W. B. III, de la Parra-Venegas R., et al. (2017). Long-term assessment of whale shark population demography and connectivity using photo-identification in the Western Atlantic ocean. PLoS One 12 (8), e0180495. doi: 10.1371/journal.pone.0180495
Meekan M. G., Bradshaw C. J., Press M., McLean C., Richards A., Quasnichka S., et al. (2006). Population size and structure of whale sharks rhincodon typus at ningaloo reef, Western Australia. Mar. Ecol. Prog. Ser. 319, 275–285. doi: 10.3354/meps319275
Motta P. J., Maslanka M., Hueter R. E., Davis R. L., de la Parra R., Mulvany S. L., et al. (2010). Feeding anatomy, filter-feeding rate, and diet of whale sharks rhincodon typus during surface ram filter feeding off the Yucatan peninsula, Mexico. Zoology 113 (4), 199–212. doi: 10.1016/j.zool.2009.12.001
Norman B. M., Morgan D. L. (2016a). The return of “Stumpy” the whale shark: two decades and counting. Front. Ecol. Environ. 14 (8), 449–450. doi: 10.1002/fee.1418
Norman B. M., Reynolds S., Morgan D. L. (2016b). Does the whale shark aggregate along the Western Australian coastline beyond ningaloo reef? Pacific. Conserv. Biol. 22 (1), 72–80. doi: 10.1071/PC15045
Norman B. M., Holmberg J. A., Arzoumanian Z., Reynolds S. D., Wilson R. P., Rob D., et al. (2017a). Undersea constellations: the global biology of an endangered marine megavertebrate further informed through citizen science. BioScience 67 (12), 1029–1043. doi: 10.1093/biosci/bix127
Norman B. M., Whitty J. M., Beatty S. J., Reynolds S. D., Morgan D. L. (2017b). Do they stay or do they go? acoustic monitoring of whale sharks at ningaloo marine park, Western Australia. J. Fish. Biol. 91, 1713–1720. doi: 10.1111/jfb.13461
Perry C. T., Figueiredo J., Vaudo J. J., Hancock J., Rees R., Shivji M.. (2018). Comparing length-measurement methods and estimating growth parameters of free-swimming whale sharks (Rhincodon typus) near the South Ari Atoll, Maldives. Marine and Freshwater Research. 69 (10), 1487–1495.
Perry C. T., Clingham E., Webb D. H., de la Parra R., Pierce S. J., Beard A., et al. (2020). St. Helena: An important reproductive habitat for whale sharks (Rhincodon typus) in the central south Atlantic. Front. Mar. Sci. 7, 899. doi; 10.3389/fmars.2020.576343
Pierce S. J., Grace M. K., Araujo G. (2021)Rhincodon typus (Green status assessment). In: The IUCN red list of threatened species 2021 (Accessed 22 February 2022).
Pierce S. J., Norman B. (2016)Rhincodon typus. In: The IUCN red list of threatened species (Accessed 29 March 2021).
Prebble C. E., Rohner C. A., Pierce S. J., Robinson D. P., Jaidah M. Y., Bach S. S., et al. (2018). Limited latitudinal ranging of juvenile whale sharks in the Western Indian ocean suggests the existence of regional management units. Mar. Ecol. Prog. Ser. 601, 167–183. doi: 10.3354/meps12667
Ramírez-Macías D., Meekan M., de la Parra-Venegas R., Remolina-Suárez F., Trigo-Mendoza M., Vázquez-Juárez R. (2012b). Patterns in composition and abundance of whale sharks (Rhincodon typus) near holbox island, Mexico. J. Fish. Biol. 80, 1401–1416. doi: 10.1111/j.1095-8649.2012.03258.x
Ramírez-Macías D., Vázquez-Haikin A., Vázquez-Juárez R. (2012a). Whale shark rhincodon typus populations along the west coast of the gulf of California and implications for management. Endangered. Species. Res. 18 (2), 115–128. doi: 10.3354/esr00437
R Core Team (2021). R: A language and environment for statistical computing (Vienna, Austria: R Foundation for Statistical Computing). Available at: https://www.R-project.org/.
R Core Team (2020). R: A language and environment for statistical computing (Vienna, Austria: R Foundation for Statistical Computing). Available at: https://www.R-project.org/.
Rendell L., Simião S., Brotons J. M., Airoldi S., Fasano D., Gannier A. (2014). Abundance and movements of sperm whales in the western Mediterranean basin. Aquat. Conservation.: Mar. Freshw. Ecosyst. 24 (S1), 31–40. doi: 10.1002/aqc.2426
Reynolds S. D., Norman B. M., Beger M., Franklin C. E., Dwyer R. G. (2017). Movement, distribution and marine reserve use by an endangered migratory giant. Diversity Distributions. 23, 1268–1279. doi: 10.1111/ddi.12618
Robinson D. P., Jaidah M. Y., Bach S., Lee K., Jabado R. W., Rohner C. A., et al. (2016). Population structure, abundance and movement of whale sharks in the Arabian gulf and the gulf of Oman. PLoS One 11 (6), e0158593. doi: 10.1371/journal.pone.0158593
Robinson D. P., Jaidah M. Y., Bach S. S., Rohner C. A., Jabado R. W., Ormond R., et al. (2017). Some like it hot: repeat migration and residency of whale sharks within an extreme natural environment. PLoS One 12 (9), e0185360. doi: 10.1371/journal.pone.0185360
Robinson D. P., Jaidah M. Y., Jabado R. W., Lee-Brooks K., El-Din N. M. N., Malki A. A. A., et al. (2013). Whale sharks, rhincodon typus, aggregate around offshore platforms in Qatari waters of the Arabian gulf to feed on fish spawn. PLoS One 8 (3), e58255. doi: 10.1371/journal.pone.0058255
Rohner C. A., Armstrong A. J., Pierce S. J., Prebble C. E., Cagua E. F., Cochran J. E., et al (2015a). Whale sharks target dense prey patches of sergestidshrimp off Tanzania. J. Plankton. Res. 37 (2), 352–362. doi: 10.1093/plankt/fbv010
Rohner C. A., Richardson A. J., Prebble C. E., Marshall A. D., Bennett M. B., Weeks S., et al (2015b). Laser photogrammetry improves size and demographic estimates for whale sharks. PeerJ 3, e886. doi: 10.1093/plankt/fbv010
Rohner C. A., Cochran J. E., Cagua E. F., Prebble C. E., Venables S. K., Berumen M. L., et al. (2020). No place like home? high residency and predictable seasonal movement of whale sharks off Tanzania. Front. Mar. Sci. 7, 423. doi: 10.3389/fmars.2020.00423
Rowat D., Brooks K. S. (2012). A review of the biology, fisheries and conservation of the whale shark rhincodon typus. J. Fish. Biol. 80 (5), 1019–1056. doi: 10.1111/j.1095-8649.2012.03252.x
Schmidt J. V., Schmidt C. L., Ozer F., Ernst R. E., Feldheim K. A., Ashley M. V., et al. (2009). Low genetic differentiation across three major ocean populations of the whale shark, rhincodon typus. PLoS One 4 (4), e4988. doi: 10.1371/journal.pone.0004988
Schwarz C. J., Arnason A. N. (1996). A general methodology for the analysis of capture-recapture experiments in open populations. Biometrics, 860–873. doi: 10.2307/2533048
Sigsgaard E. E., Nielsen I. B., Bach S. S., Lorenzen E. D., Robinson D. P., Knudsen S. W., et al. (2016). Population characteristics of a large whale shark aggregation inferred from seawater environmental DNA. Nat. Ecol. Evol. 1 (1), 1–5. doi: 10.1038/s41559-016-0004
Speed C. W., Meekan M. G., Rowat D., Pierce S. J., Marshall A. D., Bradshaw C. J. (2008). Scarring patterns and relative mortality rates of Indian ocean whale sharks. J. Fish. Biol. 72 (6), 1488–1503. doi: 10.1111/j.1095-8649.2008.01810.x
Thomson J. A., Araujo G., Labaja J., McCoy E., Murray R., Ponzo A. (2017). Feeding the world's largest fish: highly variable whale shark residency patterns at a provisioning site in the Philippines. R. Soc. Open Sci. 4 (9), 170394. doi: 10.1098/rsos.170394
Torres L. G., Read A. J., Halpin P. (2008). Fine-scale habitat modeling of a top marine predator: Do prey data improve predictive capacity. Ecol. Appl. 18 (7), 1702–1717. doi: 10.1890/07-1455.1
Turchin P. (1998). Quantitative analysis of movement (Sunderland, Massachusetts, USA: Sinauer. Inc.).
Tyminski J. P., de la Parra-Venegas R., González Cano J., Hueter R. E. (2015). Vertical movements and patterns in diving behavior of whale sharks as revealed by pop-up satellite tags in the eastern gulf of Mexico. PLoS One 10 (11), e0142156. doi: 10.1371/journal.pone.0142156
Van Tienhoven A. M., Den Hartog J. E., Reijns R. A., Peddemors V. M. (2007). A computer-aided program for pattern-matching of natural marks on the spotted raggedtooth shark carcharias taurus. J. Appl. Ecol. 44 (2), 273–280. doi: 10.1111/j.1365-2664.2006.01273.x
White G. C., Burnham K. P. (1999). Program MARK: survival estimation from populations of marked animals. Bird. Study. 46 (sup1), S120–S139. doi: 10.1080/00063659909477239
Whitehead H. (2001). Analysis of animal movement using opportunistic individual identifications: application to sperm whales. Ecology 82 (5), 1417–1432. doi: 10.1890/0012-9658(2001)082[1417:AOAMUO]2.0.CO;2
Whitehead H. (2007). Selection of models of lagged identification rates and lagged association rates using AIC and QAIC. Commun. Statistics—Simulation Computation® 36 (6), 1233–1246. doi: 10.1080/03610910701569531
Keywords: lagged identification rate, Rhincodon typus, photo-ID, movement ecology, collaborative
Citation: Araujo G, Agustines A, Bach SS, Cochran JEM, Parra-Galván Edl, Parra-Venegas Rdl, Diamant S, Dove A, Fox S, Graham RT, Green SM, Green JR, Hardenstine RS, Hearn A, Himawan MR, Hobbs R, Holmberg J, Shameel I, Jaidah MY, Labaja J, Leblond S, Legaspi CG, Maguiño R, Magson K, Marcoux SD, Marcoux TM, Marley SA, Matalobos M, Mendoza A, Miranda JA, Norman BM, Perry CT, Pierce SJ, Ponzo A, Prebble CEM, Ramírez-Macías D, Rees R, Reeve-Arnold KE, Reynolds SD, Robinson DP, Rohner CA, Rowat D, Snow S, Vázquez-Haikin A and Watts AM (2022) Improving sightings-derived residency estimation for whale shark aggregations: A novel metric applied to a global data set. Front. Mar. Sci. 9:775691. doi: 10.3389/fmars.2022.775691
Received: 14 September 2021; Accepted: 29 June 2022;
Published: 28 July 2022.
Edited by:
Gail Schofield, Queen Mary University of London, United KingdomReviewed by:
Elizabeth Bevan, University of Alabama at Birmingham, United StatesRory Wilson, Swansea University, United Kingdom
Copyright © 2022 Araujo, Agustines, Bach, Cochran, Parra-Galván, Parra-Venegas, Diamant, Dove, Fox, Graham, Green, Green, Hardenstine, Hearn, Himawan, Hobbs, Holmberg, Shameel, Jaidah, Labaja, Leblond, Legaspi, Maguiño, Magson, Marcoux, Marcoux, Marley, Matalobos, Mendoza, Miranda, Norman, Perry, Pierce, Ponzo, Prebble, Ramírez-Macías, Rees, Reeve-Arnold, Reynolds, Robinson, Rohner, Rowat, Snow, Vázquez-Haikin and Watts. This is an open-access article distributed under the terms of the Creative Commons Attribution License (CC BY). The use, distribution or reproduction in other forums is permitted, provided the original author(s) and the copyright owner(s) are credited and that the original publication in this journal is cited, in accordance with accepted academic practice. No use, distribution or reproduction is permitted which does not comply with these terms.
*Correspondence: Gonzalo Araujo, Z29uem9AbWFyZWNvLm9yZy51aw==