 Jon Lapeyra Martin
 Uwe John
 Colin Royer
 Nathalie Gypens1
- 1Laboratoire d’Ecologie des Systèmes Aquatiques, Université Libre de Bruxelles, Brussels, Belgium
- 2Alfred Wegener Institute, Helmholtz Centre for Polar and Marine Research, Bremerhaven, Germany
- 3Helmholtz Institute for Functional Marine Biodiversity, Carlvon Ossietzky University of Oldenburg, Oldenburg, Germany
- 4Unité d’Océanographie Chimique, Université de Liège, Liège, Belgium
Protists engaging in photo- and phago- mixotrophy (mixoplankton) are common members of the global plankton community. They are involved in primary production and contribute to the carbon and nutrient cycling. Two major mixoplankton functional types (MFTs) are considered based upon the origin of their photosynthetic abilities: innate for constitutive-mixoplankton (CM) and obtained from prey for non-constitutive mixoplankton (NCM). Regardless of their significance, little attention has been paid to their diversity and temporal succession. We performed a metabarcoding survey of the V4-18S rRNA gene in 92 surface water samples collected during 2018–2019 in five fixed stations of the Belgian Coastal Zone. Environmental data such as nutrients, sea surface temperature, salinity, Chl-a and light were collected to understand their influences over mixoplankton community changes. The temporal diversity of mixotrophs, autotrophs, and heterotrophs was analyzed and the distinct seasonal patterns were evidenced. Results showed that dinoflagellates and ciliates were the major mixoplankton contributors. There were no significant differences among protist communities between the stations sampled. The time-series showed high proportional abundances of CM, accounting in average for 24.4% of the reads, against the low contribution of NCM, 4.8%. CM dinoflagellates belonging to Heterocapsa, Alexandrium, Karlodinium, and Tripos genus were the most abundant, and co-occurred with strict autotrophic plankton. Strombidium genus ciliates were the most representative organisms for NCM. Mixoplankton showed lower diversity than autotrophs and heterotrophs throughout the time series, however, the environmental factors controlling the seasonal community shifts (β-diversity) were similar. Overall, the metabarcoding approach allowed to depict with high resolution the composition of mixoplankton and its diversity among auto- and heterotrophs in the Belgian Coastal Zone.
Introduction
Plankton research has traditionally been grounded on the former phytoplankton-zooplankton paradigm, classifying organisms as strict producers or consumers (photo-autotrophs and phago-heterotrophs, respectively) (Flynn and Hansen, 2013). We now know that this dichotomy does not represent the real complexity of the marine planktonic systems. Mixoplankton are marine protists capable of obtaining nourishment via photo(auto)trophy and phago(hetero)trophy (Flynn et al., 2019), and they are now recognized to be globally widespread among marine ecosystems (Leles et al., 2017; Selosse et al., 2017; Faure et al., 2019).
Several studies have already highlighted the potential of mixoplankton to significantly alter ecosystem dynamics as we currently understand them (Mitra et al., 2016; Ghyoot et al., 2017; Leles et al., 2017; Stoecker et al., 2017). They are abundant (Stoecker et al., 2017), have a potential role in nutrient cycling and trophodynamics of plankton (Leles et al., 2018), and they have been closely associated with Harmful Algal Bloom (HABs) events (Jeong et al., 2010). Furthermore, their composition and seasonal dynamics among the protist community have a direct influence on the production of higher trophic levels (Gran-Stadniczeñko et al., 2019). These reasons led mathematical modelers, physiologists, and molecular scientists to particularly focus on mixoplankton during last decade (Mitra and Flynn, 2010; Barton et al., 2013; Stoecker et al., 2017; Flynn et al., 2019).
A wide taxonomical diversity can be found within mixoplankton (Jones, 1997; Stoecker, 1998). In an effort to better understand their mode of nutrition and their functional diversity, Mitra et al. (2016) proposed a comprehensive terminology to classify mixoplankton in functional types (MFTs): constitutive mixoplankton (CM), that possess their own photosystems; and non-constitutive mixoplankton (NCM), that acquire photosynthetic abilities through external means (from their prey). CM take up inorganic nutrients and mainly consume bacterial prey, but also other protists, and they are found in most eukaryotic microalgal lineages (chlorophytes, cryptophytes, chrysophytes, haptophytes, and dinoflagellates). They do not indispensably need to rely on both phototrophy and phagotrophy for growth and/or survival (Adolf et al., 2006; Wilken et al., 2013). NCM rely on diverse prey types in order to acquire their chloroplasts. Two different types can be distinguished depending on their prey specificity: generalist (GNCM) or specialists (SNCM; Mitra et al., 2014). These are mostly found among ciliates, dinoflagellates, foraminifera, and radiolaria.
Generally, eukaryotic plankton (protists) field studies are limited in their spatial and temporal coverage, and the methodological approach plays a crucial role in the study of certain plankton traits such as mixotrophy (Gran-Stadniczeñko et al., 2019). The recognition and representation of different MFTs in modeling studies, indeed, has helped to understand the great diversity of the ecological niches of mixoplankton (Flynn and Mitra, 2009; Ghyoot et al., 2017). Recently, Leles et al. (2020) presented a comprehensive modeling study linking the carbon flux together with MFTs’ temporal successions from a coastal temperate sea, emphasizing mixoplankton presence in time, and brought knowledge on different MFT population dynamics. Mixoplankton global biogeography was also studied based on both molecular and microscopy data sets (Leles et al., 2017, 2019; Faure et al., 2019). However, regardless of their global significance, little attention has been paid to the characterization and diversity of the two main MFTs in temperate seas. Particularly in the Southern North Sea, Schneider et al. (2020b) explored the trophic spectrum applying current knowledge to a long-term (inverted microscopy) dataset. The latter results suggested that mixoplankton thrive in low turbidity and mature ecosystems. Yet, the way in which abiotic factors drive MFT diversity and species richness in temperate seas remain unclear.
In the North Sea, protist plankton is under the influence of strong seasonal fluctuations (characteristic of temperate seas) of nutrient, temperature, irradiance, and biotic interactions (like grazing, pathogens, and competition) (Masquelier et al., 2011; Gran-Stadniczeñko et al., 2019). To a large extent, these control the protistan community composition and abundance and therefore those of mixoplankton. The Southern North Sea, receives freshwater and nutrient loads from anthropized rivers (mainly the Seine and the Scheldt) that mix with inflowing English Channel waters (Passy et al., 2013). In this region, mixed water column and nutrient-enriched waters prevail (Desmit et al., 2015) and massive Phaeocystis globosa blooms occur every spring in response to high nitrogen loads (Lancelot et al., 2005; Gypens et al., 2007).
Molecular techniques are widespread for plankton diversity assessment (Medlin and Kooistra, 2010) and have a high potential for very detailed monitoring (Ebenezer et al., 2011; Stern et al., 2018), capturing the entire size-range of protistan community including nano- and picoplanktonic components. The small ribosomal subunit (SSU) 18S rRNA gene is the most widely used marker for groups and species detection and classification within marine eukaryotic microorganisms. Despite providing semi-quantitative information (Santoferrara, 2019), metabarcoding of the V9 (De Vargas et al., 2015) or more recently the V4 (Armeli Minicante et al., 2019) regions of the 18S rRNA gene has been proven to be a powerful and sensitive tool for large-scale biodiversity surveys, allowing comparison between studies rooted in taxonomy (Chain et al., 2016).
In the context of a growing recognition of the mixoplankton paradigm (Flynn et al., 2019), gathering taxonomical information is vital in order to sort organisms within the newly described functional trophic groups. The spatial and temporal changes in microbial species composition (Genitsaris et al., 2015; Massana et al., 2015; Berdjeb et al., 2018; Das et al., 2019; Bruhn et al., 2021) combined with environmental parameters (Wang et al., 2013; Xue et al., 2018; Hörstmann et al., 2021) have already allowed an enhanced comprehensive understanding of ecosystem functioning (Duffy et al., 2017). This enhanced understanding of marine protist diversity and community shifts could also lead to an improvement in the detection of HAB events (Nohe et al., 2020), which often are mixotrophs (Glibert et al., 2018; Flynn et al., 2019).
This study aimed to (1) characterize the temporal variations of the dominant protist assemblages in the Belgian Coastal Zone (BCZ) based on molecular data - metabarcoding-, emphasizing the detection and classification of two major MFTs, and (2) to explore MFTs diversity dynamics and correlation with environmental parameters such as sea surface temperature (SST), sea surface salinity, and inorganic nutrients.
Materials and Methods
Sampling and Processing
Monitoring took place monthly from March 2018 to June 2019 at five fixed stations (130, 230, 330, 700, and ZG02) (Figure 1) in the BCZ (n = 92), located in the Southern North Sea. BCZ time-series sites were sampled performing several expeditions aboard the RV Simon Stevin (Vlaams Instituut voor de Zee). Both in 2018 and 2019 throughout the spring-summer months one extra monthly cruise was undertaken and samples were collected in order to closely follow the evolution of the phytoplanktonic blooms that occur in this period in Belgian waters (Gypens et al., 2007). Seawater samples were collected at 3 m depth using 4 L Niskin bottles connected to a CTD sensor (Sea-bird SBE25). Physicochemical parameters (temperature, salinity, and major nutrients) were measured and analyzed as part of the national water quality monitoring programs LifeWatch (Mortelmans et al., 2019a) years with the methodology found in Mortelmans et al. (2019b). The daily global solar radiation data was collected at the Oostende station of the Royal Meteorological Institute of Belgium, transformed to Photosynthetic Active Radiation (PAR, μmol m–2 s–1) making use of the empirical relation found in Rousseau et al. (2000) and biweekly averaged.
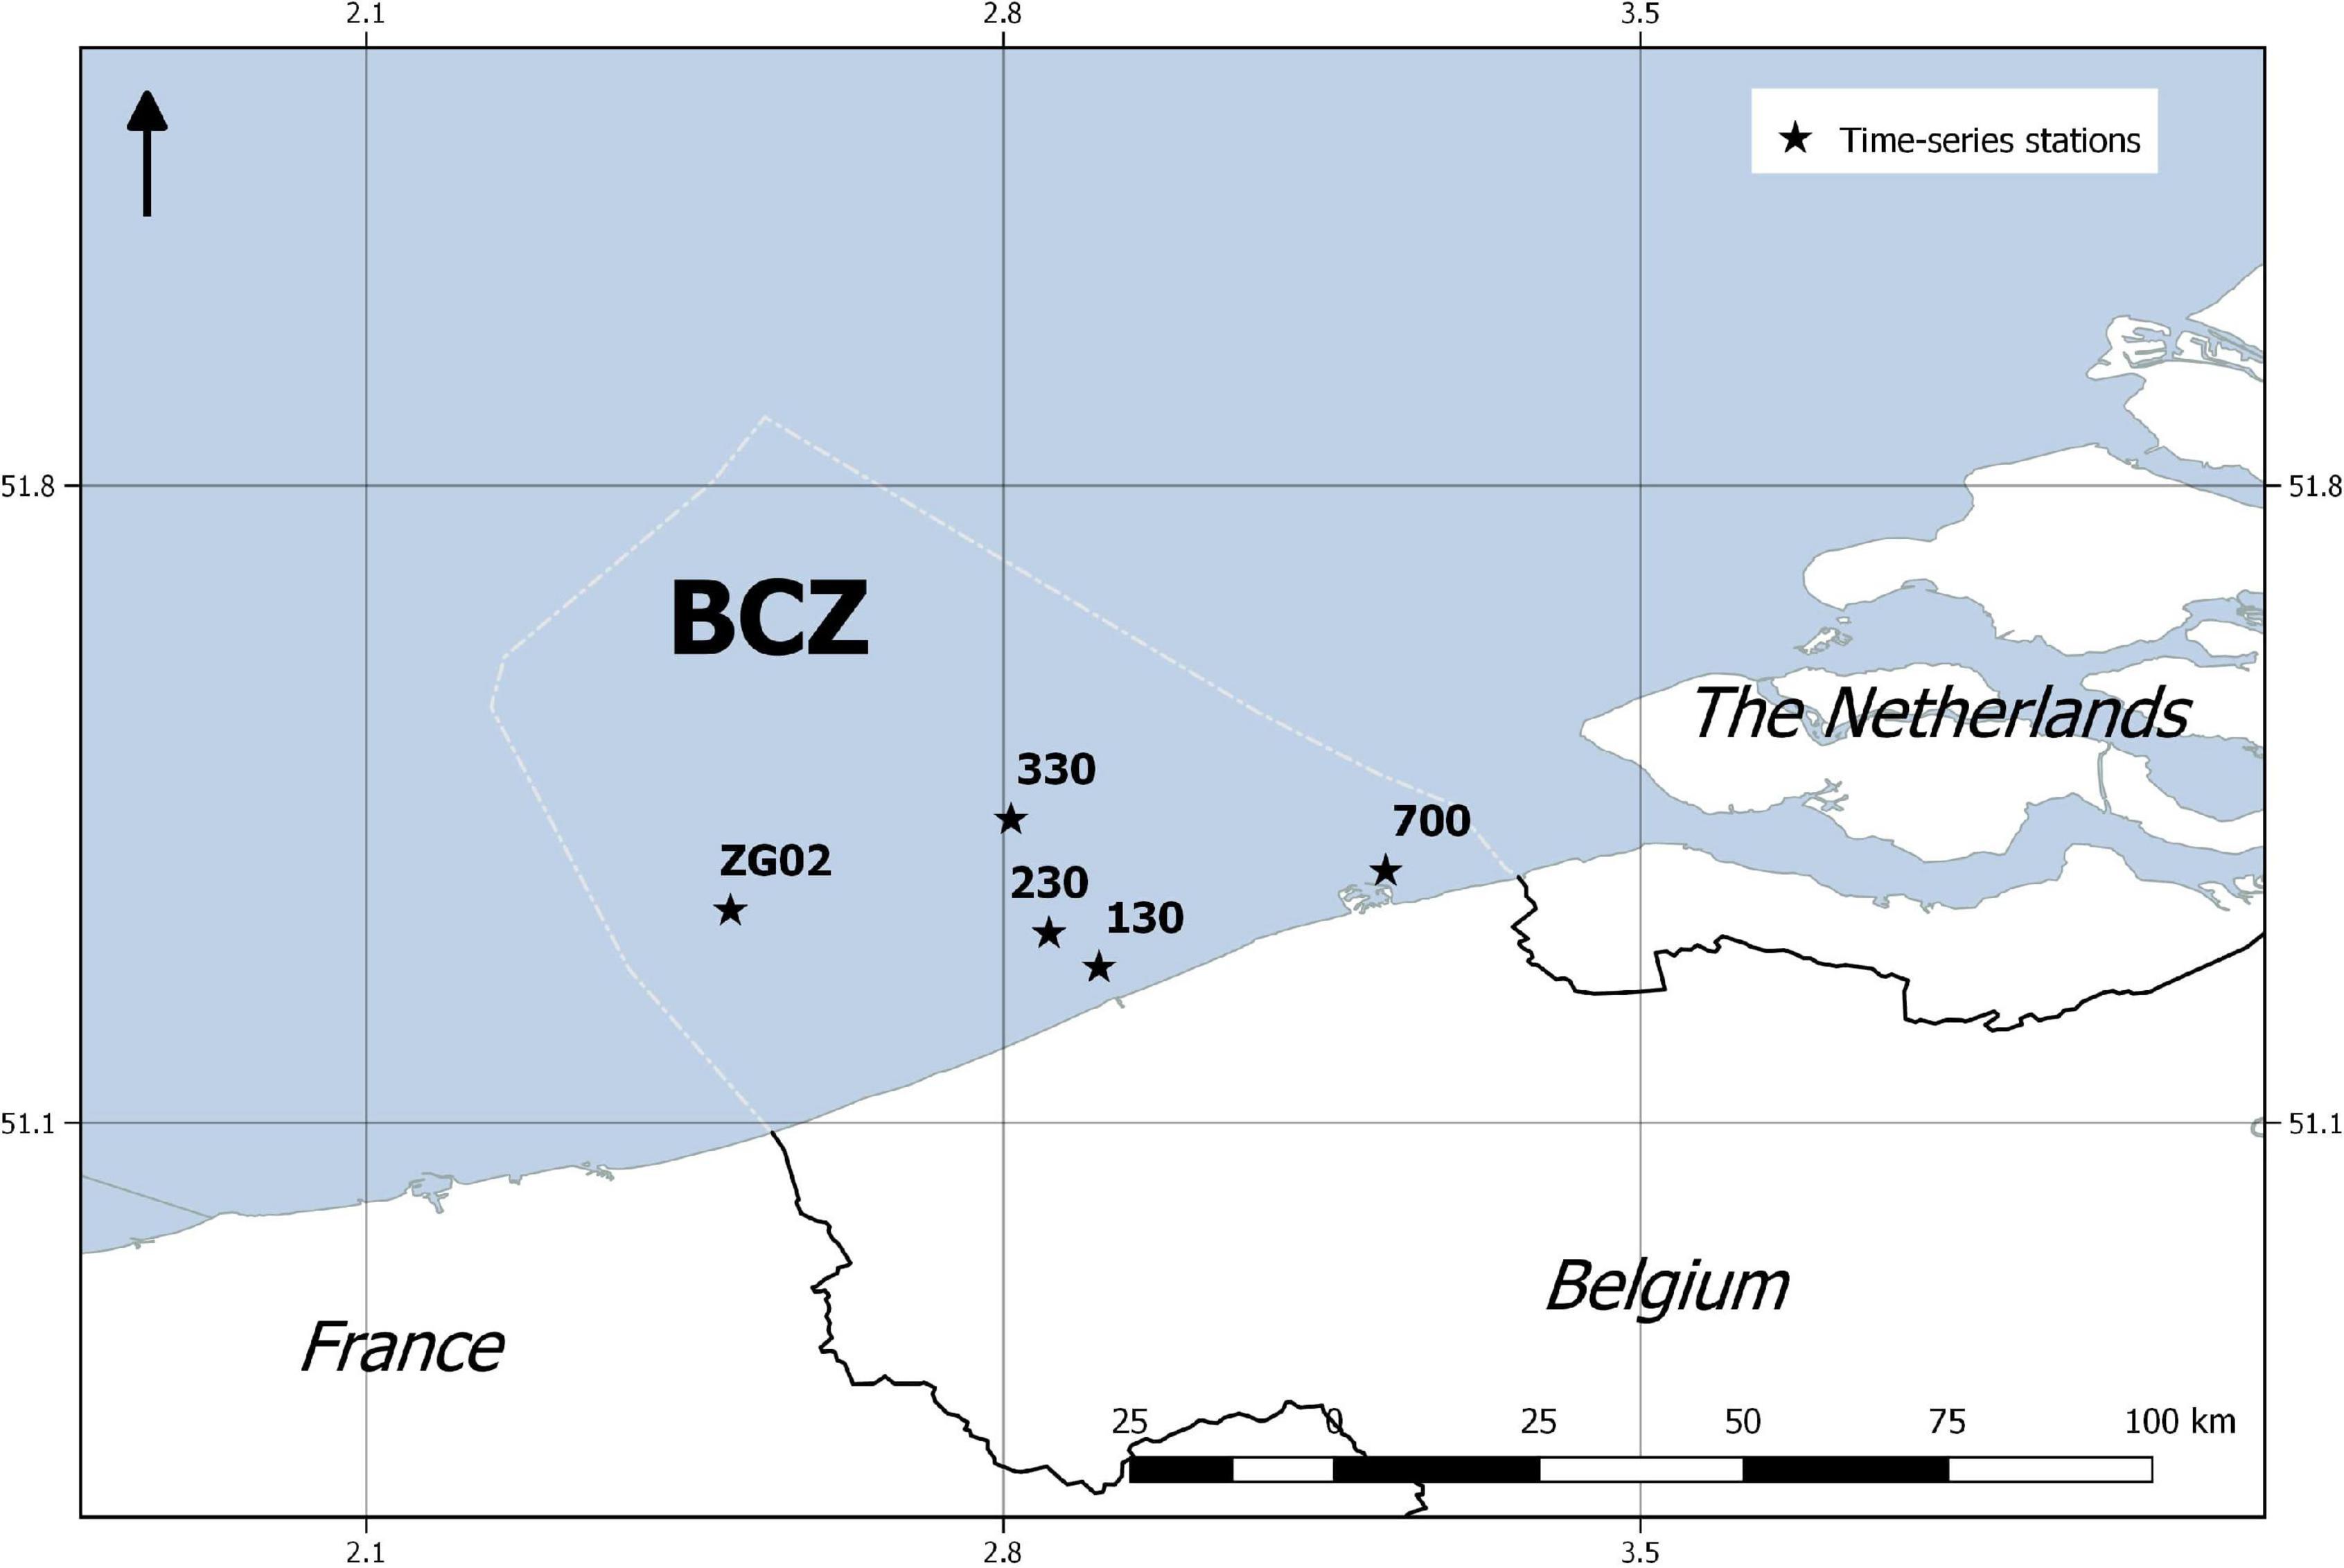
Figure 1. Field sampling locations in the Belgian Coastal Zone accessed using the RV Simon Stevin during years 2018–2019.
For all above-mentioned expeditions the identical sampling methodology was followed. 100 mL of water from Niskin bottles was stored and frozen in vials for the analysis of each of the nutrients such as: NO3–, NO2–, NH4+ [Dissolved Inorganic Nitrogen (DIN) = NO3– + NO2– + NH4+], dissolved inorganic phosphate (DIP = PO43–) measured as soluble reactive phosphorus, and dissolved inorganic silica (DISi). For chlorophyll-a (Chl-a) analysis 100–500 mL of water were filtered using glass-fiber filters (Whatman GF/F) and immediately frozen at −20°C. Chl-a was quantified fluorometrically in the laboratory using acetone 90% for extraction (Strickland and Parsons, 1972).
Additional 50 mL of water from St. 330 were taken and preserved with 40% formaldehyde (final concentration 2%) for heterotrophic bacteria counts. Bacteria were DAPI stained following Porter and Feig (1980) method and enumerated under epifluorescence microscopy. Biovolumes were calculated by treating cocci and rods as cylinders and spheres, and finally converted to C-biomass using the biovolume-dependent conversion factor established by Simon and Azam (1989).
Considering that mixoplankton is largely widespread in both nano and microorganisms, the field sampling technique used in this study targeted the marine protist plankton sizing >0.22 μm. The DNA samples for the study of the protistan community were collected vacuum filtering 500–800 mL of water (from Niskin) through 0.22 μm polycarbonate filters (47 mm) and storing the samples immediately at −20°C. Total DNA was extracted from filters using NucleoSpin Soil extraction Kit (Macherey-Nagel, Düren, Germany) following manufacturer’s protocol. For a maximum efficiency of the extraction from the filters a sample lysis step was added using 10 mL cryotubes (using a high velocity bead beater for 10 min). Up to three filters were pooled and used for DNA extraction when there was not found sufficient biomass on a single filter. Standard polymerase chain reactions (PCR) were performed to amplify the universal eukaryote SSU 18S rRNA gene. Primers TAReuk454FWD1 (5′-CCAGCASCYGCGGTAATTCC-3′), TAReukREV3 (5′-ACTTTCGTTCTTGATYRA-3′) were used to target the V4 region of the 18S rRNA gene (Stoeck et al., 2010). PCR reactions performed had a total volume of 25 μL, containing 2.5 μL of microbial DNA (5 ng/μL), 5 μL of both amplicon forward and reverse primers (1 μM) and 12.5 μL of high-fidelity polymerase (Kapa Biosystems). Plates were sealed and the following PCR-program was run in a thermal cycler: initial denaturation at 95°C for 3 min, followed by 25 cycles of 95°C for 30 s, annealing at 55°C for 30 s; extension at 72°C for 30 s final extension at 72°C for 5 min. All PCR products (480 bp, ∼383 bp + 97 bases of primers) were verified on a 1.5% agarose gel. The following library preparation of 18S ribosomal RNA gene amplicons was performed: PCR clean-up 1, index PCR, PCR clean-up 2, library quantification, normalization and pooling following the 16S Metagenomic Sequencing Library Preparation guide (Illumina, 2013). Library denaturing and sample loading to the Illumina MiSeq system was performed to perform a 300 bp paired-end sequencing using V2 chemistry.
Bioinformatic Pipeline and Downstream Analysis
The reads were denoised and merged with DADA2, v1.16. (Callahan et al., 2016) and annotation reads were subsequently classified with assignTaxonomy, the DADA2 implementation of the naive Bayesian classifier method. We used the Protist Ribosomal Reference Database PR2 (Guillou et al., 2012) for the taxonomic assignment of sequences. Preparation of the amplicon sequence variant (ASV) tables was done in R v4.0 (R Core Team, 2018). The number of final sequenced reads per sample ranged between 23,299 and 52,256.
As this study focuses on protists, taxa not belonging to eukaryotic unicellular (protists) plankton were removed (including fungi, cnidarians, and metazoans), as well as singletons and all low abundance ASVs (the ones not seen more than three times in at least 10% of the samples). Final curated results produced ∼5 million reads that were grouped into 686 ASVs representing the protistan communities in the BCZ.
Trophic strategies were manually annotated and curated based on the current accepted forms of protistan plankton nourishment (Flynn et al., 2019). Species-specific knowledge obtained from published literature were used (Armeli Minicante et al., 2019; Faure et al., 2019; Leles et al., 2019; Schneider et al., 2020a) to classify the species into the next trophic groups: proto- phytoplankton or strict autotrophs (AU), proto- zooplankton or strict heterotrophs (HET), constitutive-mixoplankton (CM), non-constitutive mixoplankton (NCM), and Unknown (NA). Similarly, ASVs were grouped in functional taxonomic groups based on the assigned taxonomical information: dinoflagellates (Dinophyta), ciliates (Ciliophora), haptophytes (Haptophyta except Phaeocystis genus), diatoms (Bacillariophyta), cryptophytes (Cryptophyta), heterotrophic nanoflagellates (comprised by mainly Cercozoa, Protalveolata, Choanoflagellida, and Picozoa), green-brown microalgae (mainly Mamiellales, Prasinophyceae, Chrysophyceae), Phaeocystis (referring to Phaeocystis genus), rhizarians, and unclassified.
Statistical Analysis
We used the compositional approach described in Gloor et al. (2017) to analyze our metabarcoding dataset. First, a Bayesian-multiplicative treatments of zeros was performed on the ASV table using cmultRepl() function of the zCompositions package (v1.3.4): this uses sample-wise totals to convert zero counts (which will lead to errors in log-ratios) into near-zero estimates, assuming undersampling rather than absence. Next, a centered log-ratio transformation (clr) was applied to the dataset (Aitchison, 1986) using “microbiome” package (Lathi and Shetty, 2017). All statistical analyses were conducted in R, version 4.0.2 (R Core Team, 2018) and the following packages were used for data visualization: “ComplexHeatmap” (Gu et al., 2016) “ggplot2” (Wickham, 2011).
We examined the distribution of samples along the time-series using a principal component analysis (PCA) on our microbial diversity metadata. Microbial community dissimilarities (β-diversity) between seasons, months, sampling dates (cruises), and stations were tested with PERMANOVA (Anderson, 2001) on Aitchison distance of the clr-transformed ASV tables. Ultimately, we used the adonis() function along with a beta dispersion test. The latter was used to evaluate the homogeneity of dispersion by the application of the betadisper() function in “vegan” package (Oksanen et al., 2019).
Read count proportions of the most abundant species occurring in our dataset (auto-, hetero-, and mixotrophs) were displayed using a heatmap visualization. Proportions were relative to the sum of all observed ASVs corresponding to the each sampling date, which corresponded to five station averaged data. In order to enhance the understanding of mixoplankton temporal diversity within a greater context (i.e., seasonality and temperate seas) samples were classified by seasons respecting the season start days (which showed statistical significant differences, see section “Results”). Species with sample reads proportions reaching more than 5% were considered as significant contributors to the community.
Alpha diversity (α-diversity) was determined by calculating Shannon entropy and species richness for all the samples. Shannon diversity measures reflects true diversity (richness + evenness) and is less susceptible to fluctuations in rarer phylotypes. Trophic group’s specific Shannon and species richness were as well calculated for autotrophs, heterotrophs and both mixoplankton functional types (CM and NCM). The correlations of CM and NCM richness and α-diversity with environmental contextual data was performed constructing Pearson correlation matrices that were calculated and plotted using the corrplot() function of the “corrplot” package (v0.84) and adjusted for multiple testing. We calculated Variance Influence Factor (VIF) to check for multi-collinearity of each of the predictor variables. In order to avoid multi-collinearity between highly correlated variables (i.e., nutrients), we removed the variables that had a high VIF (>5).
The spatial and temporal patterns of environmental data were checked for normal distribution and spatially (by stations) and temporally analyzed by multiple statistical tests (Tukey, Kruskal–Wallis, Pairwise Wilcoxon). To explore trophic groups’ beta diversity (β-diversity) and its relation to environmental and contextual variables (SST, salinity, PAR, DISi, DIP, DIN, Bacteria biomass, and Chl-a) we performed a set of redundancy analyses (RDA) using the clr-transformed ASV tables as response matrices and tables of environmental variables as explanatory matrices. We performed stepwise model to identify most significant environmental variables using ordiR2step() function in “vegan.”
Results
A total of 4,875,053 raw reads were obtained across all samples from the MiSeq runs. Nucleotide sequences are available at the National Center for Biotechnology Information, accession number MZ687469-MZ687778. Filtering, denoising, merging, chimera-removal steps, and downstream analysis resulted in 687 ASVs representing the protistan community. The assigned trophic modes are presented in the Supplementary Data 1, along with the corresponding sequences and read abundances. Overall, 169 ASVs were assigned to mixoplankton: 122 to CM and 47 to NCM. Regarding the number of reads of the total dataset comprising 92 samples, 24.4% were assigned to CM, 4.8% to NCM, 28.6% to AU, 40.1% to HET, and 2.1% to Unknown.
Regarding the taxonomic functional groups established, dinoflagellates and diatoms were the most abundant groups in terms of number of reads (43.0 and 13.5%, respectively), followed by heterotrophic nanoflagellates (15.8%), ciliates (10.3%) and the haptophyte genus Phaeocystis (4.6%). Green-brown microalgae, haptophytes (without Phaeocystis), cryptophytes, rhizarians, and unclassified groups’ abundances ranged in between 0.5 and 7.5%. Heterotrophic nanoflagellates showed the highest number of ASV richness (167) followed by diatoms (155), dinoflagellates (150), ciliates (99), and green-brown microalgae (47). ASV richness assigned to the remaining taxonomic groups (haptophytes without Phaeocystis, the genus Phaeocystis, cryptophytes, unclassified and rhizarians) were lower, ranging from 5 to 27.
Seasonality in the Belgian Coastal Zone
The environmental conditions widely varied across the temporal series in the BCZ (Figures 2A,B), and generally the values recorded in the study period follow the seasonal dynamics already described for the area. PAR values significantly increased in spring and summer (up to 903.0 ± 222.7 μmol m–2 s–1) and were lowest in winter months (185.8 ± 100.3 μmol m–2 s–1) (Figure 2A). The yearly mean incident PAR values for the years 2018 and 2019 were the two highest ones of the last 35 years with an increase of 13.6% (2018) and 11% (2019) to the calculated median for this period (Oostende station of the Royal Institute of Meteorology, Belgium, not shown). SST dynamics closely followed the light increase effects, reaching the peaks in July 2018 and June 2019 (21.3 ± 0.7°C and 16.3 ± 0.9°C) and the minimum temperature values were found in March 2018 and January 2019 (2.7 ± 0.9°C in 2018 and 5.4 ± 0.6°C in 2019) (Figure 2A). Salinity values in the BCZ differed most between summer and autumn 2018, 33.2 ± 1.5 and 32.2 ± 1.6, respectively (data not shown), but were not significantly different (Kruskal–Wallis, p > 0.05). The only environmental contextual data that showed significant differences among stations was salinity (Kruskal–Wallis, p < 0.05).
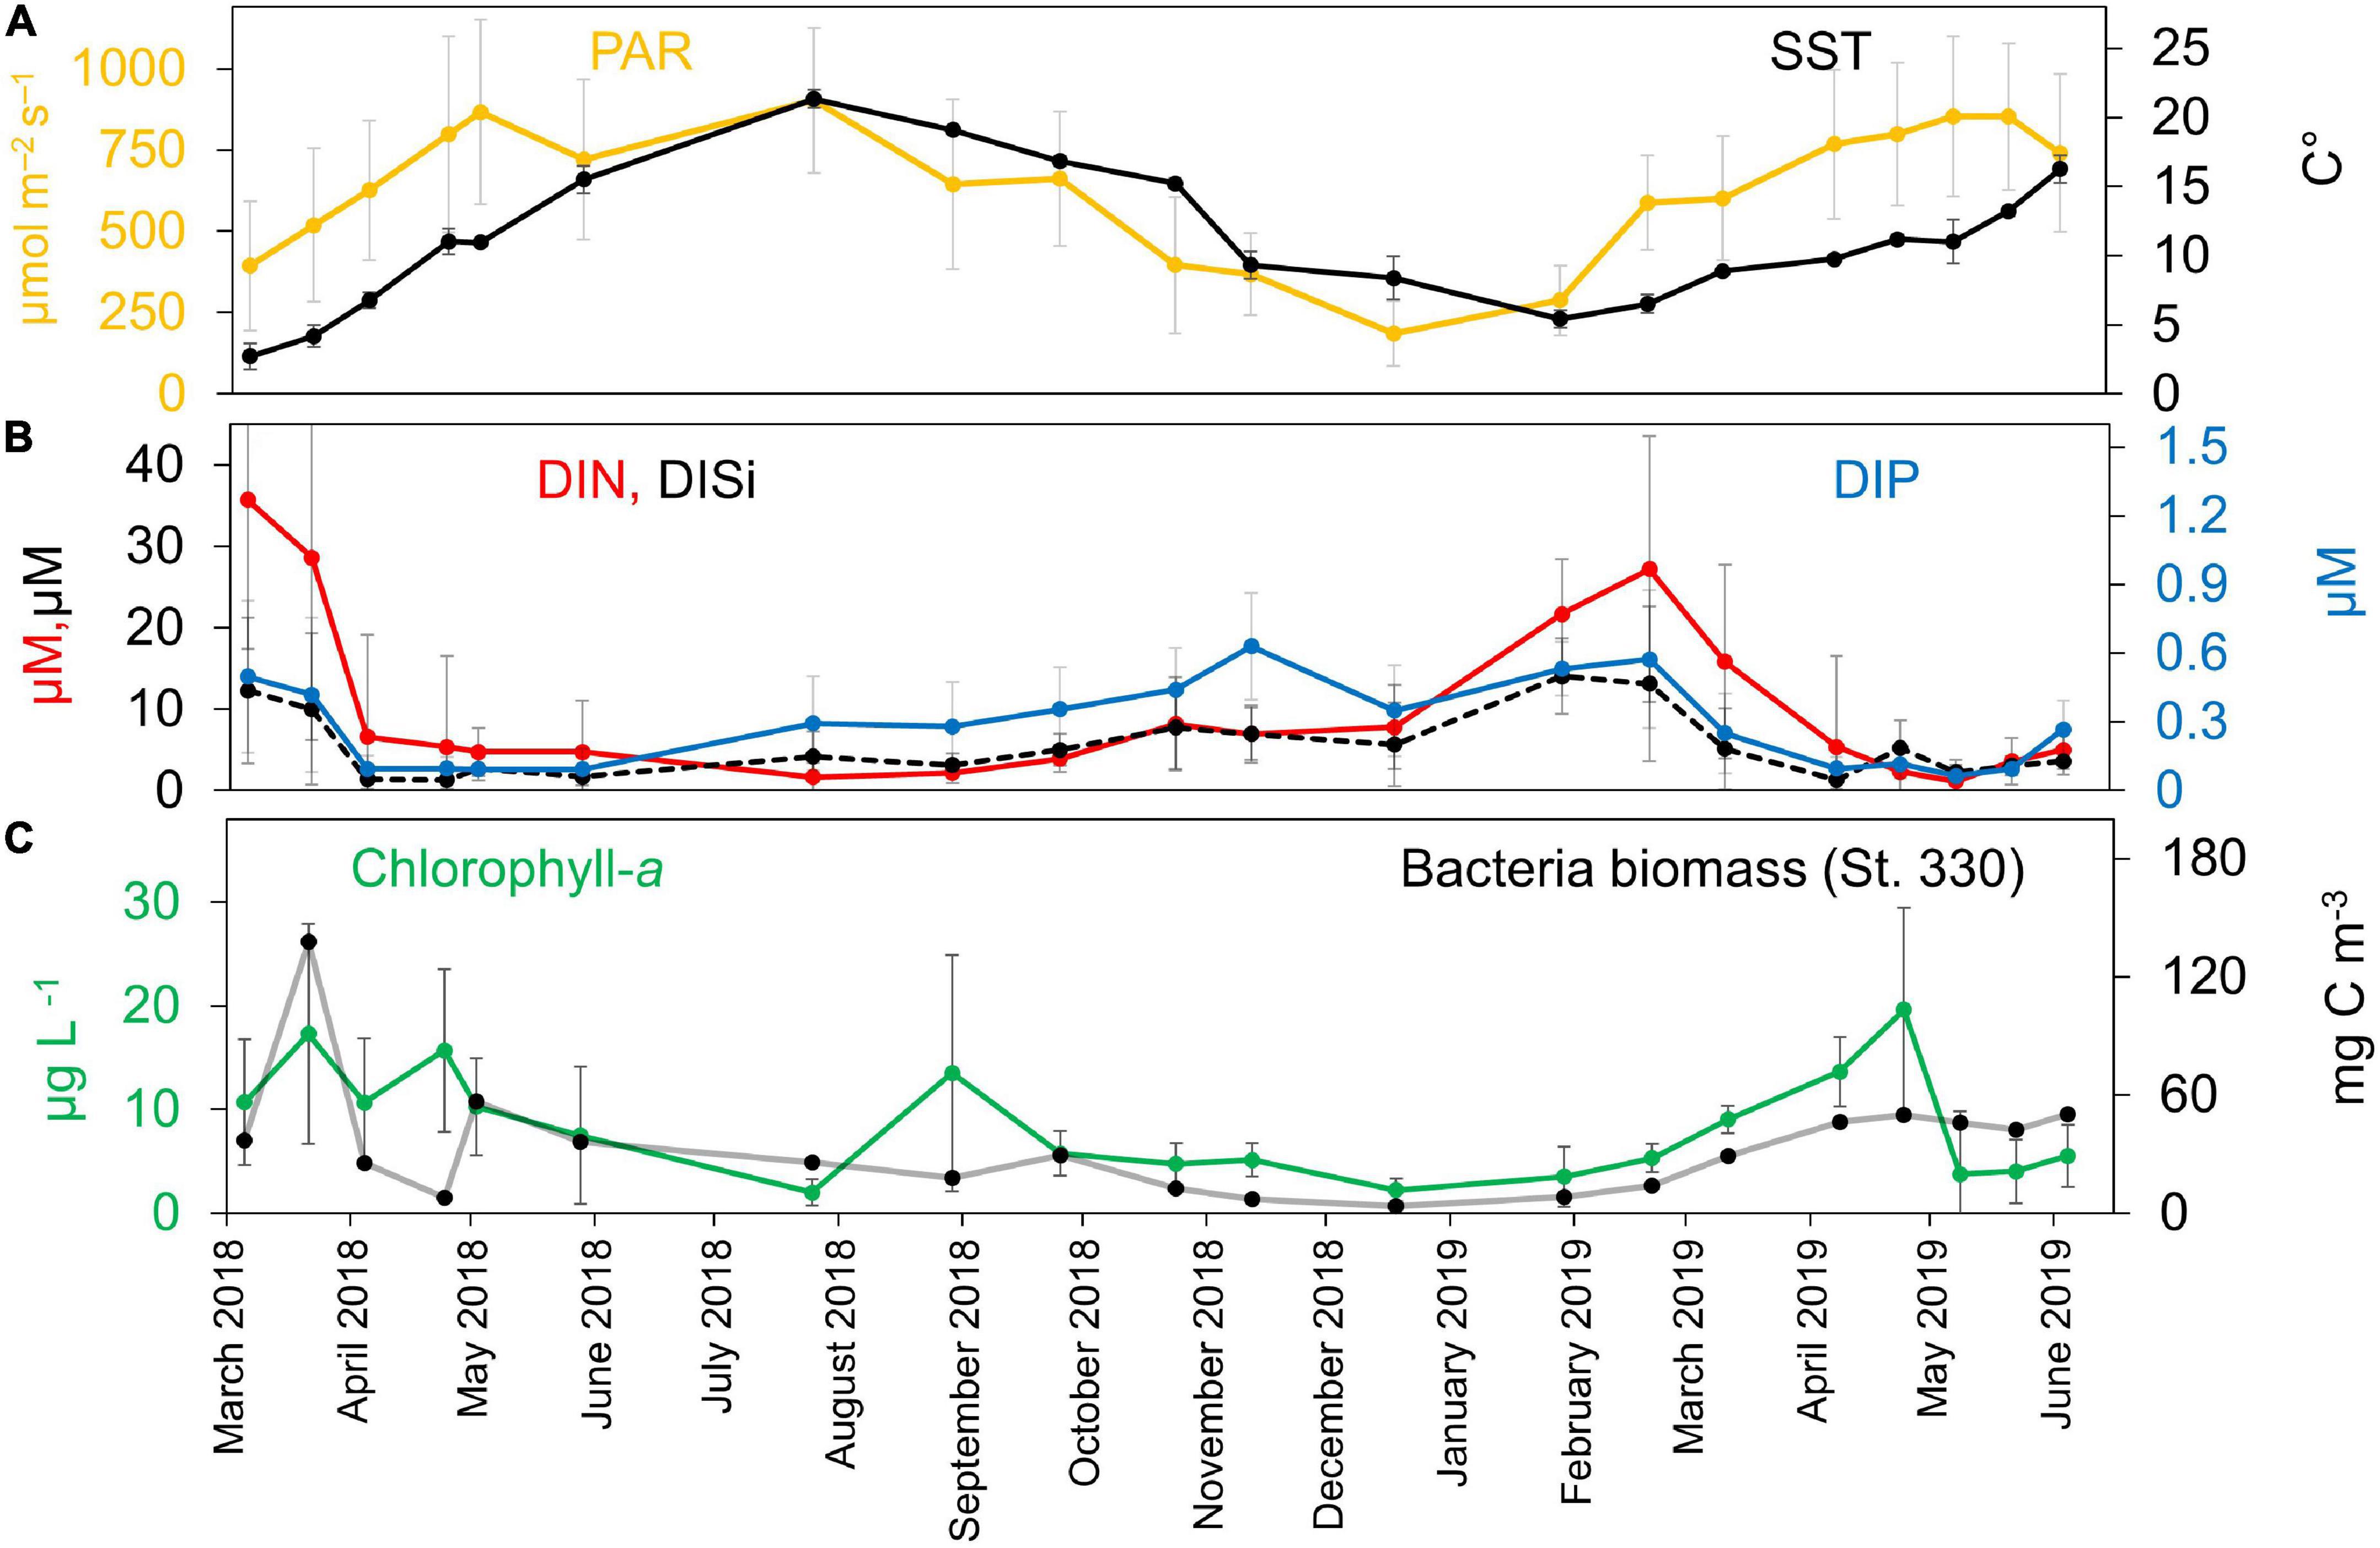
Figure 2. Temporal succession of environmental contextual data for the BCZ time-series sampling. (A) PAR (μmol m–2 s–1) and SST (°C). (B) DIN, DIP, and DISi (μM) concentrations. (C) Chl-a concentration (μg L–1) and total heterotrophic bacterial biomass (mg C m–3).
Inorganic nutrient concentrations followed the typical temperate sea seasonal dynamics (Figure 2B), with higher concentrations in winter (DIN: 27.2 ± 16.3 μM; DIP: 0.57 ± 0.3 μM; DISi: 14.0 ± 9.5 μM) than in summer (DIN: 2.2 ± 1.7 μM; DIP: 0.28 ± 0.2 μM; DISi: 3.1 ± 1.3 μM), and with the maximum peaks just before the early spring phytoplanktonic bloom around February–March in both years 2018–2019. The highest bacterial biomass peak measured throughout the time-series attained 137 mg C m–3 in March 2018 (Figure 2C). Chl-a concentrations fluctuated between 0.5 and 32.1 μg L–1 in the BCZ (Figure 2C) and the station averaged values showed three peak periods with maximum values of 27.3 μg L–1 in March 2018, 30.6 μg L–1 in August 2019 and 32.1 μg L–1 in April 2019. The lowest Chl-a concentrations were found in August and December 2018.
Seasonality was inferred when all the sampled (n = 92) were mapped using a PCA on the Euclidean distance of clr transformed data (Figure 3). Four distinct seasonal clusters were observed, placed in a circular pattern (temporal). Statistical analysis showed significant differences among seasons (PERMANOVA, p < 0.001). The similarities between summer and autumn samples were noted, and community variations within a season between different months. We performed PCAs for all samples, clustered by sampling dates, stations and seasons independently (Supplementary Figure 1). Whereas statistically significant differences among sampling dates and months were found (PERMANOVA, p < 0.01), there were no significant differences among stations (PERMANOVA, p = 0.97). Similarly, there were no significant differences found between interannual variations among samples. Since there were no spatial differences found among communities (between stations), time-series visualization of the proportional number of reads was done on the five stations averaged values (Figures 4, 5).
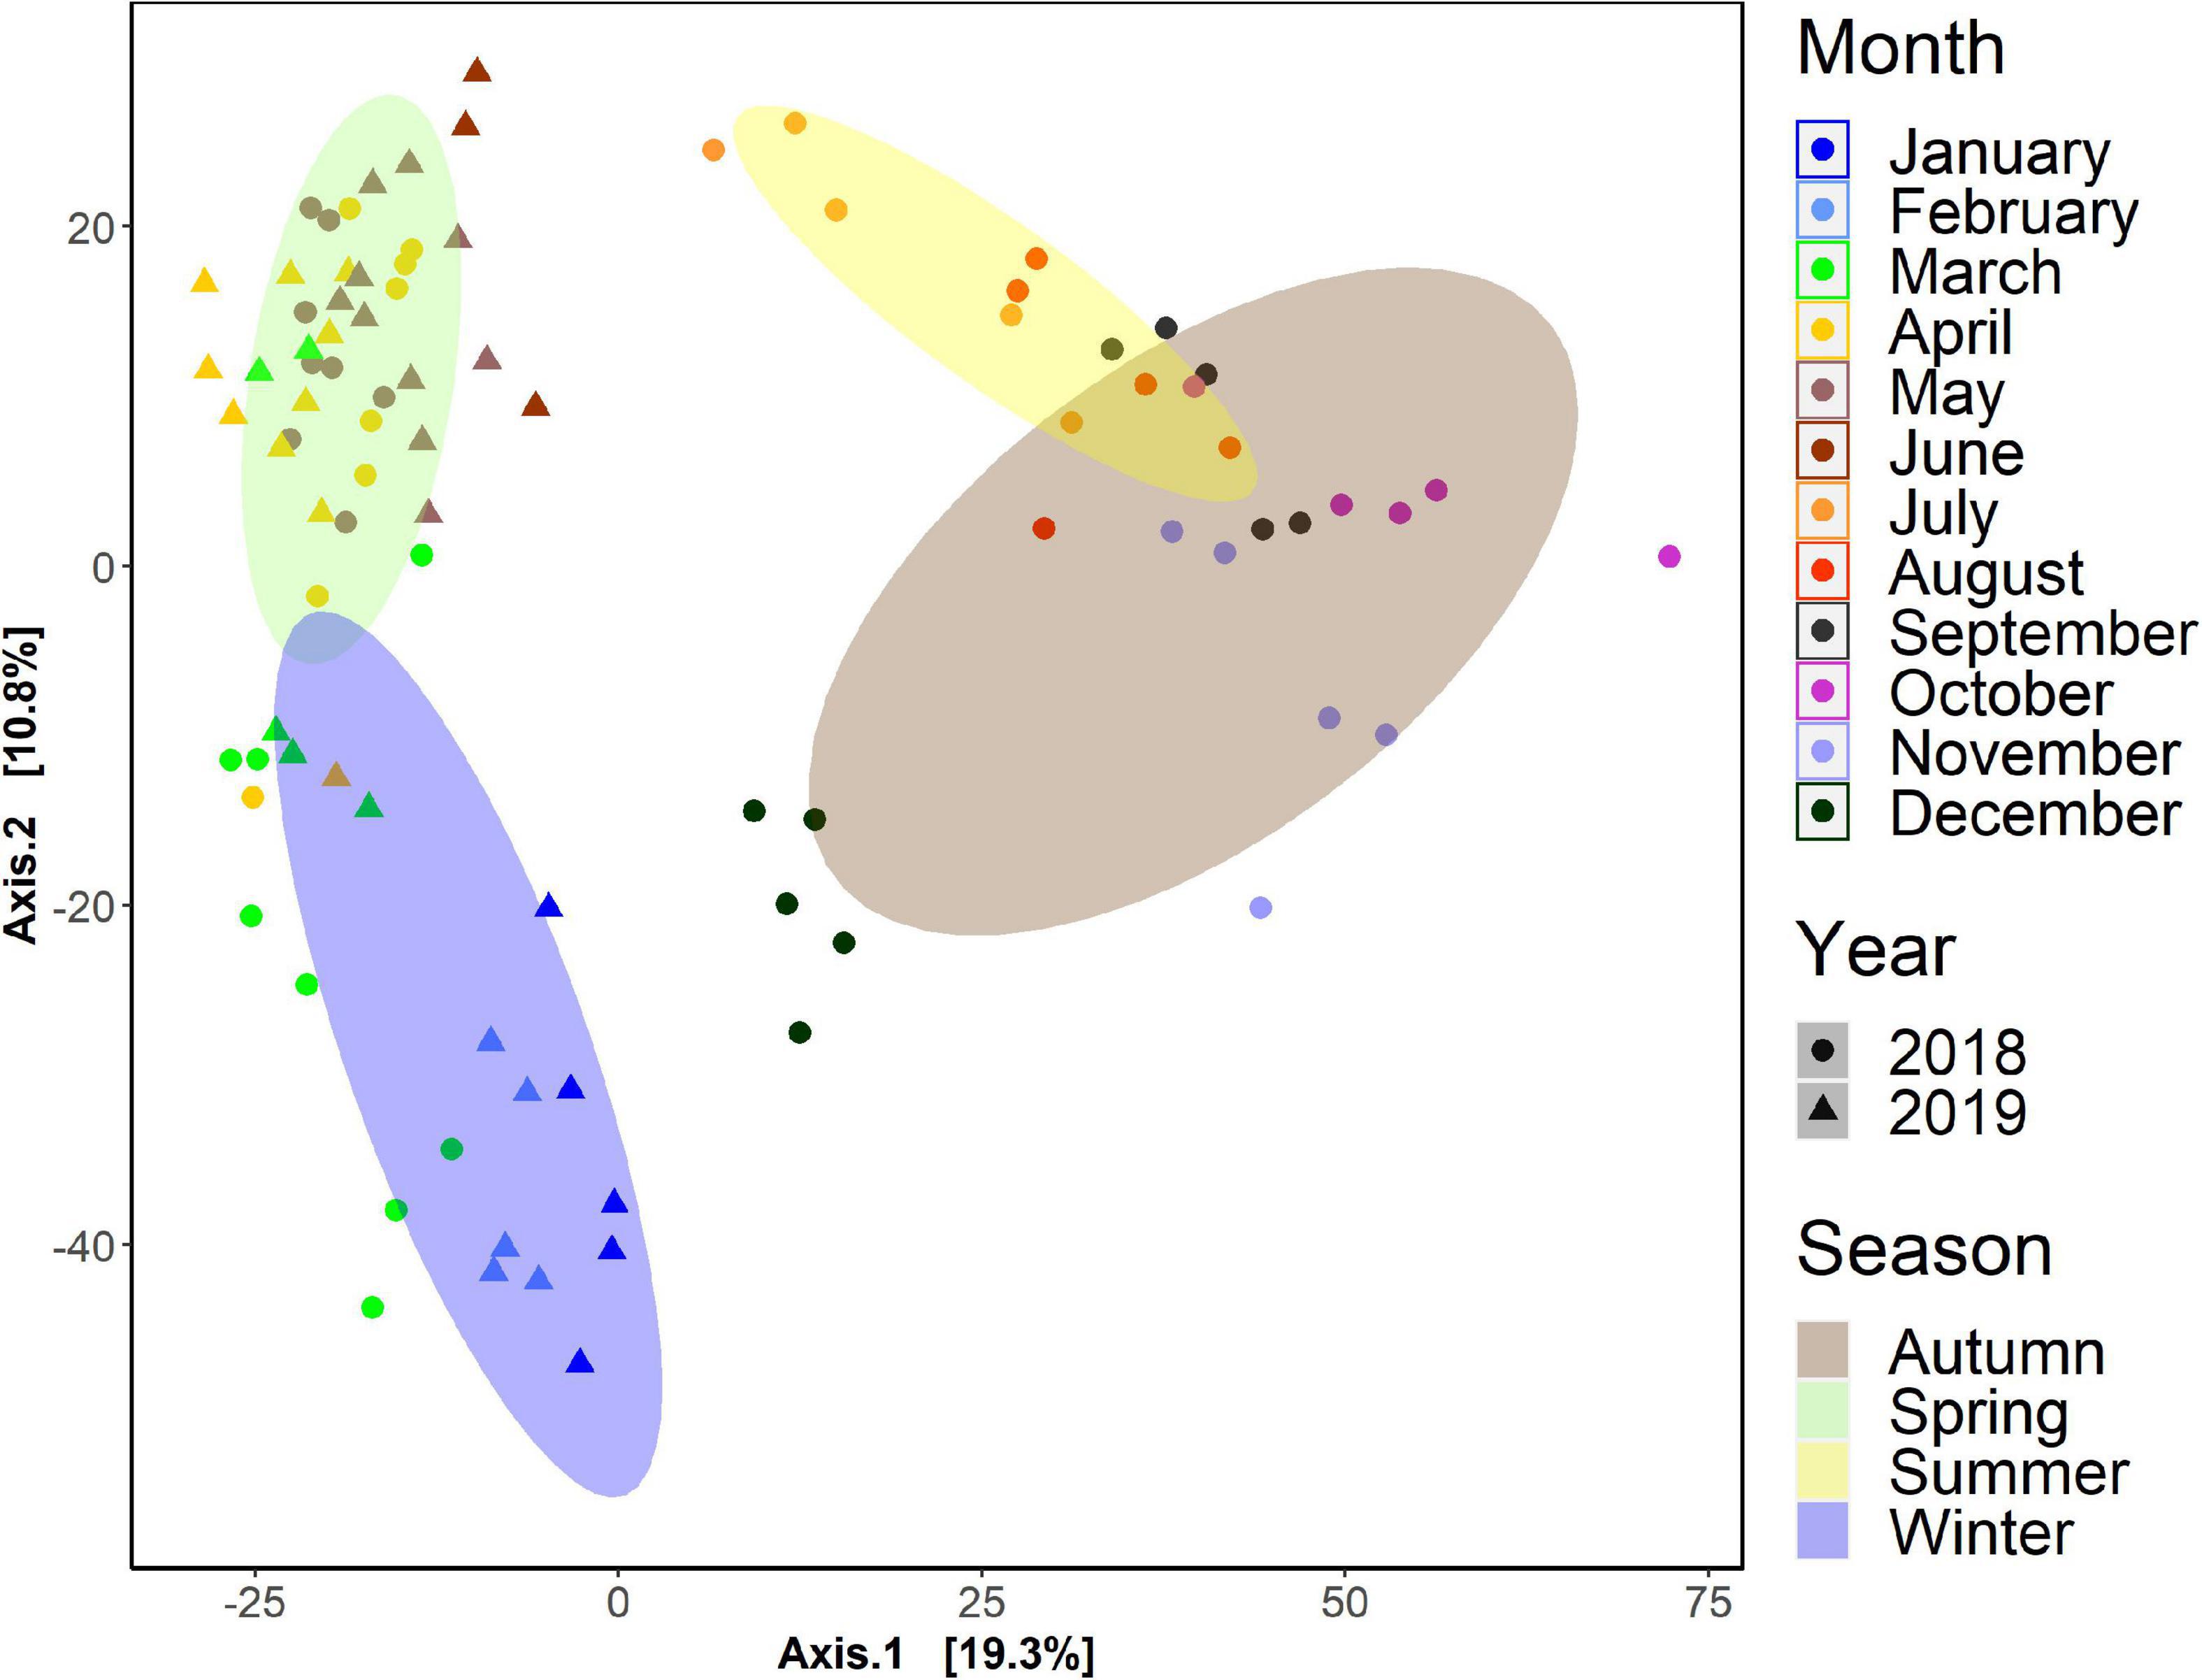
Figure 3. Monthly, seasonally, and yearly arranged PCA ordination plot of all samples used for BCZ time-series. Results were obtained from clr transformed data (Aitchison distance) dissimilarity matrices calculated to explore entire community patterns in the time-series of the Belgian Coastal Zone. Statistical analysis showed significant differences among seasons (PERMANOVA, p < 0.001).
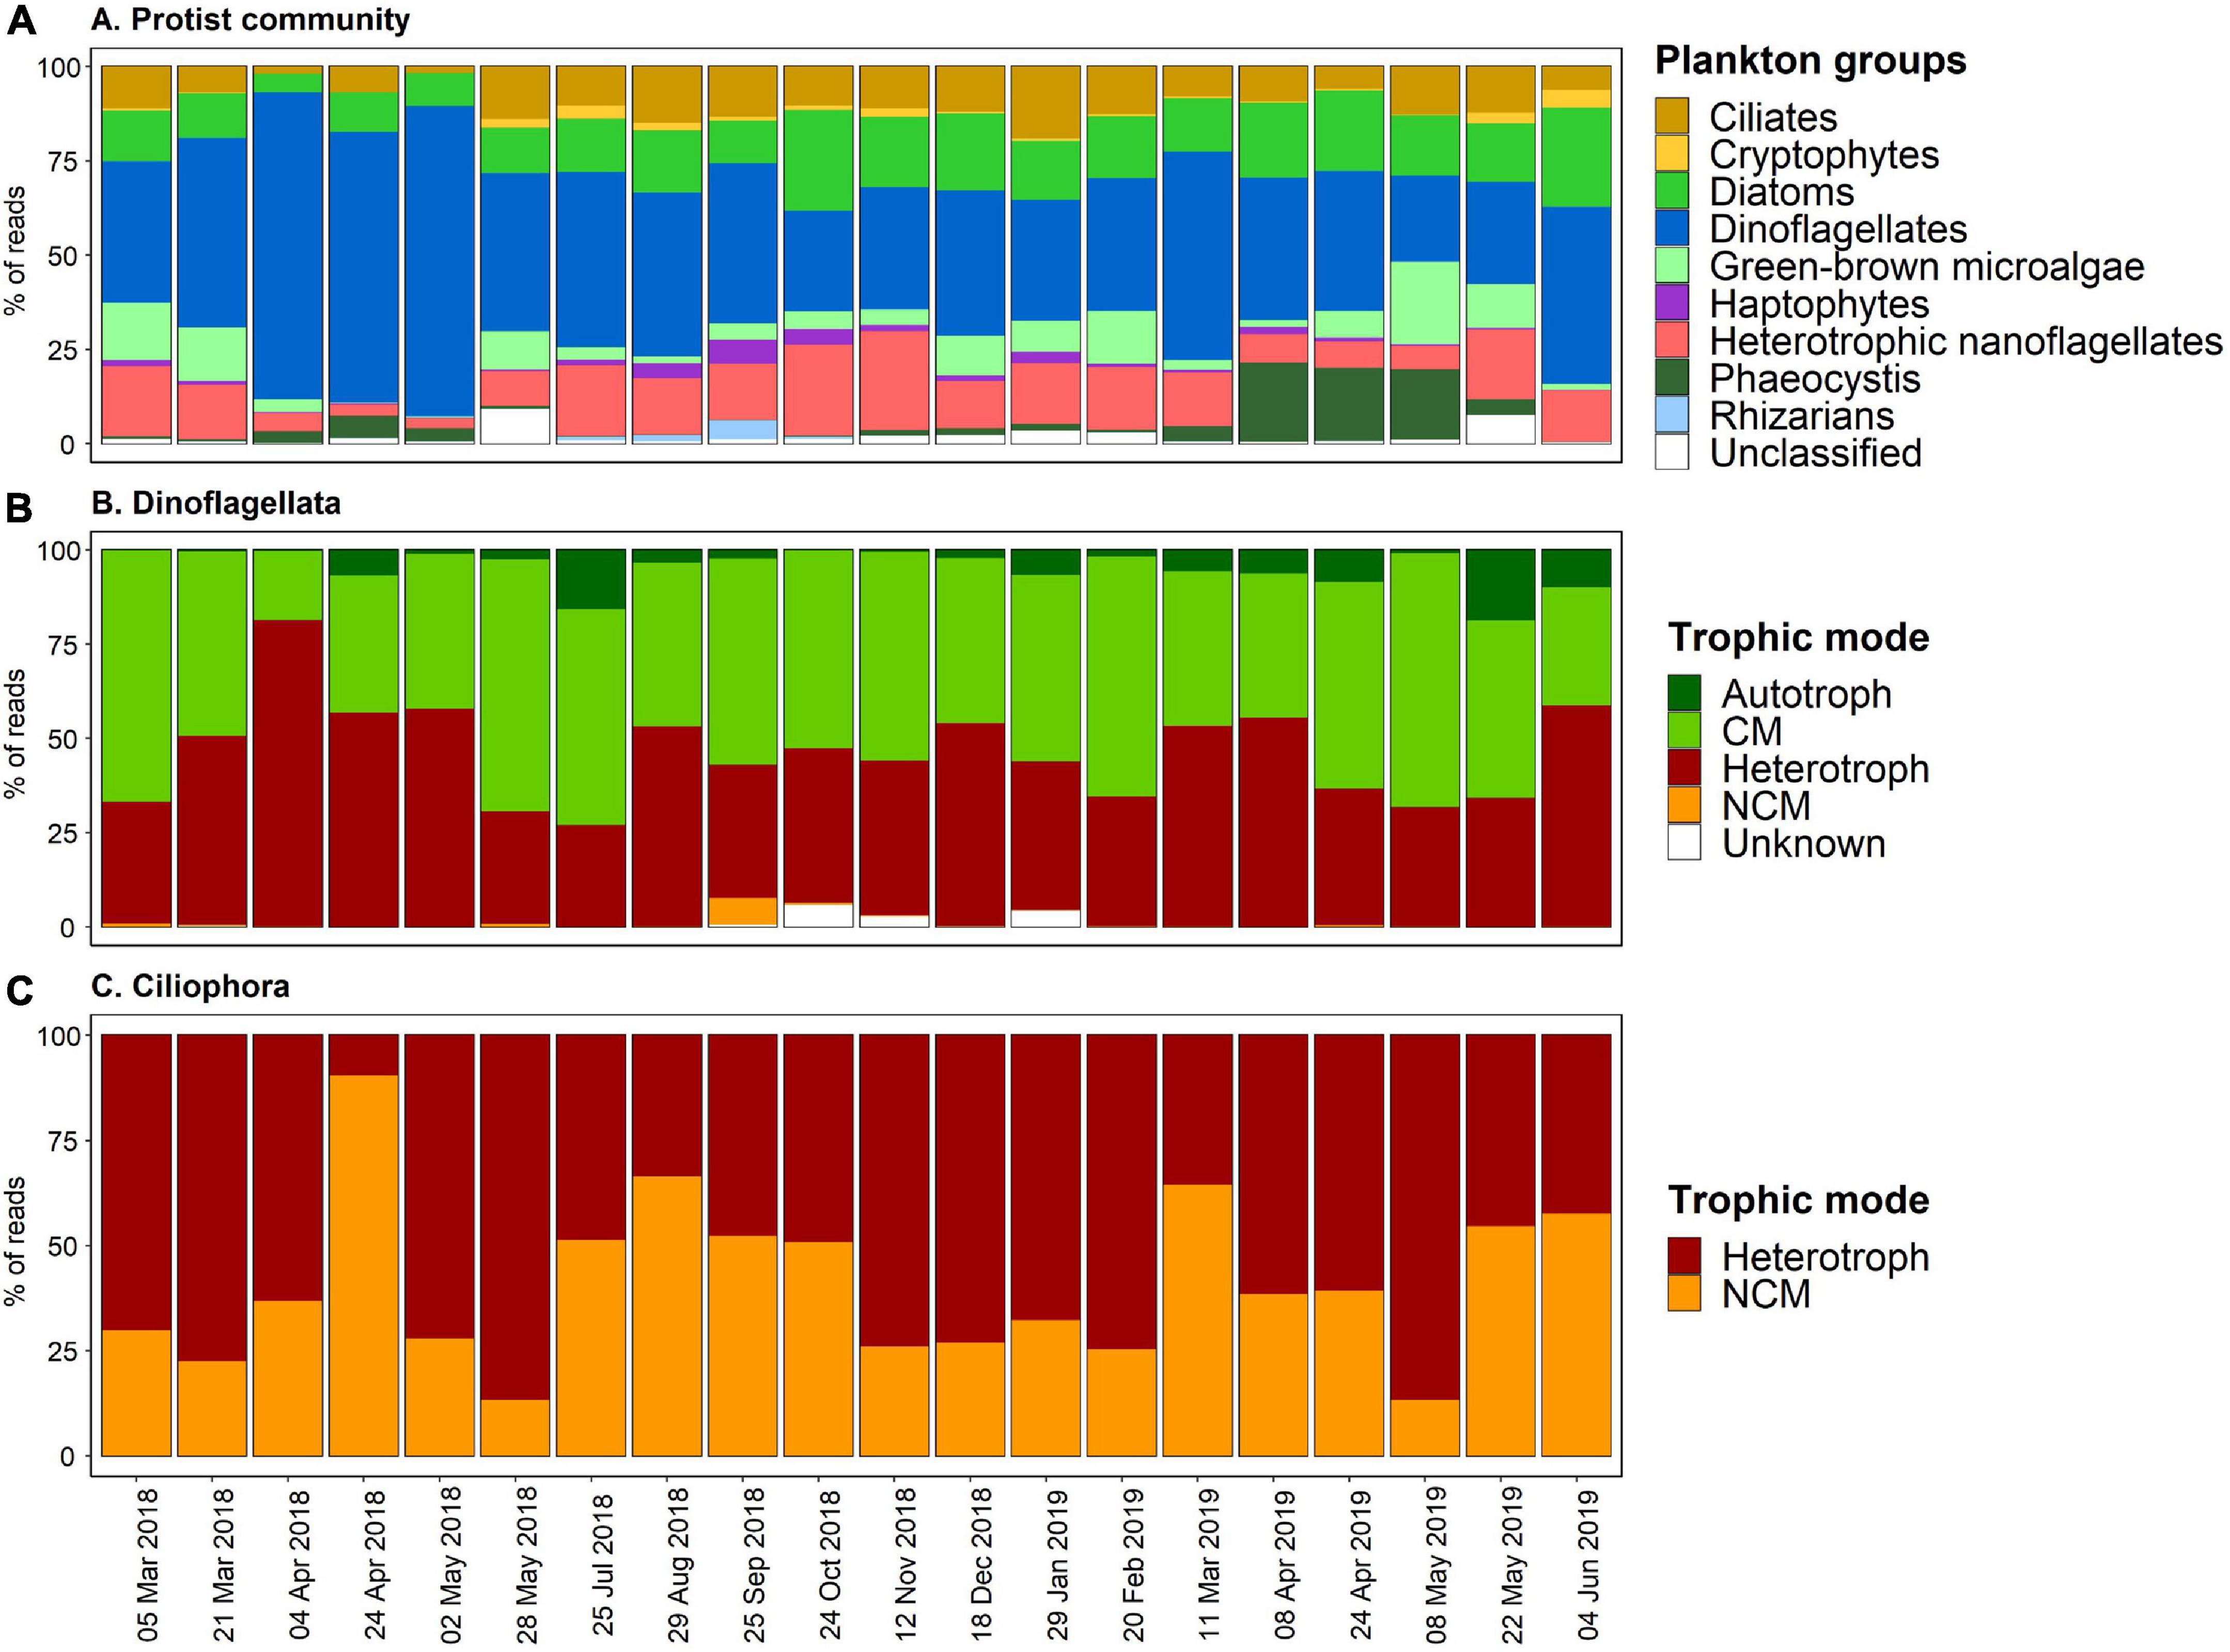
Figure 4. (A) Temporal succession of the BCZ metabarcoding survey displaying the proportions of reads of the different taxonomic functional plankton groups across years 2018–2019. (B,C) Display the temporal relative proportions of the trophic modes assigned to Dinoflagellata and Ciliophora, respectively.
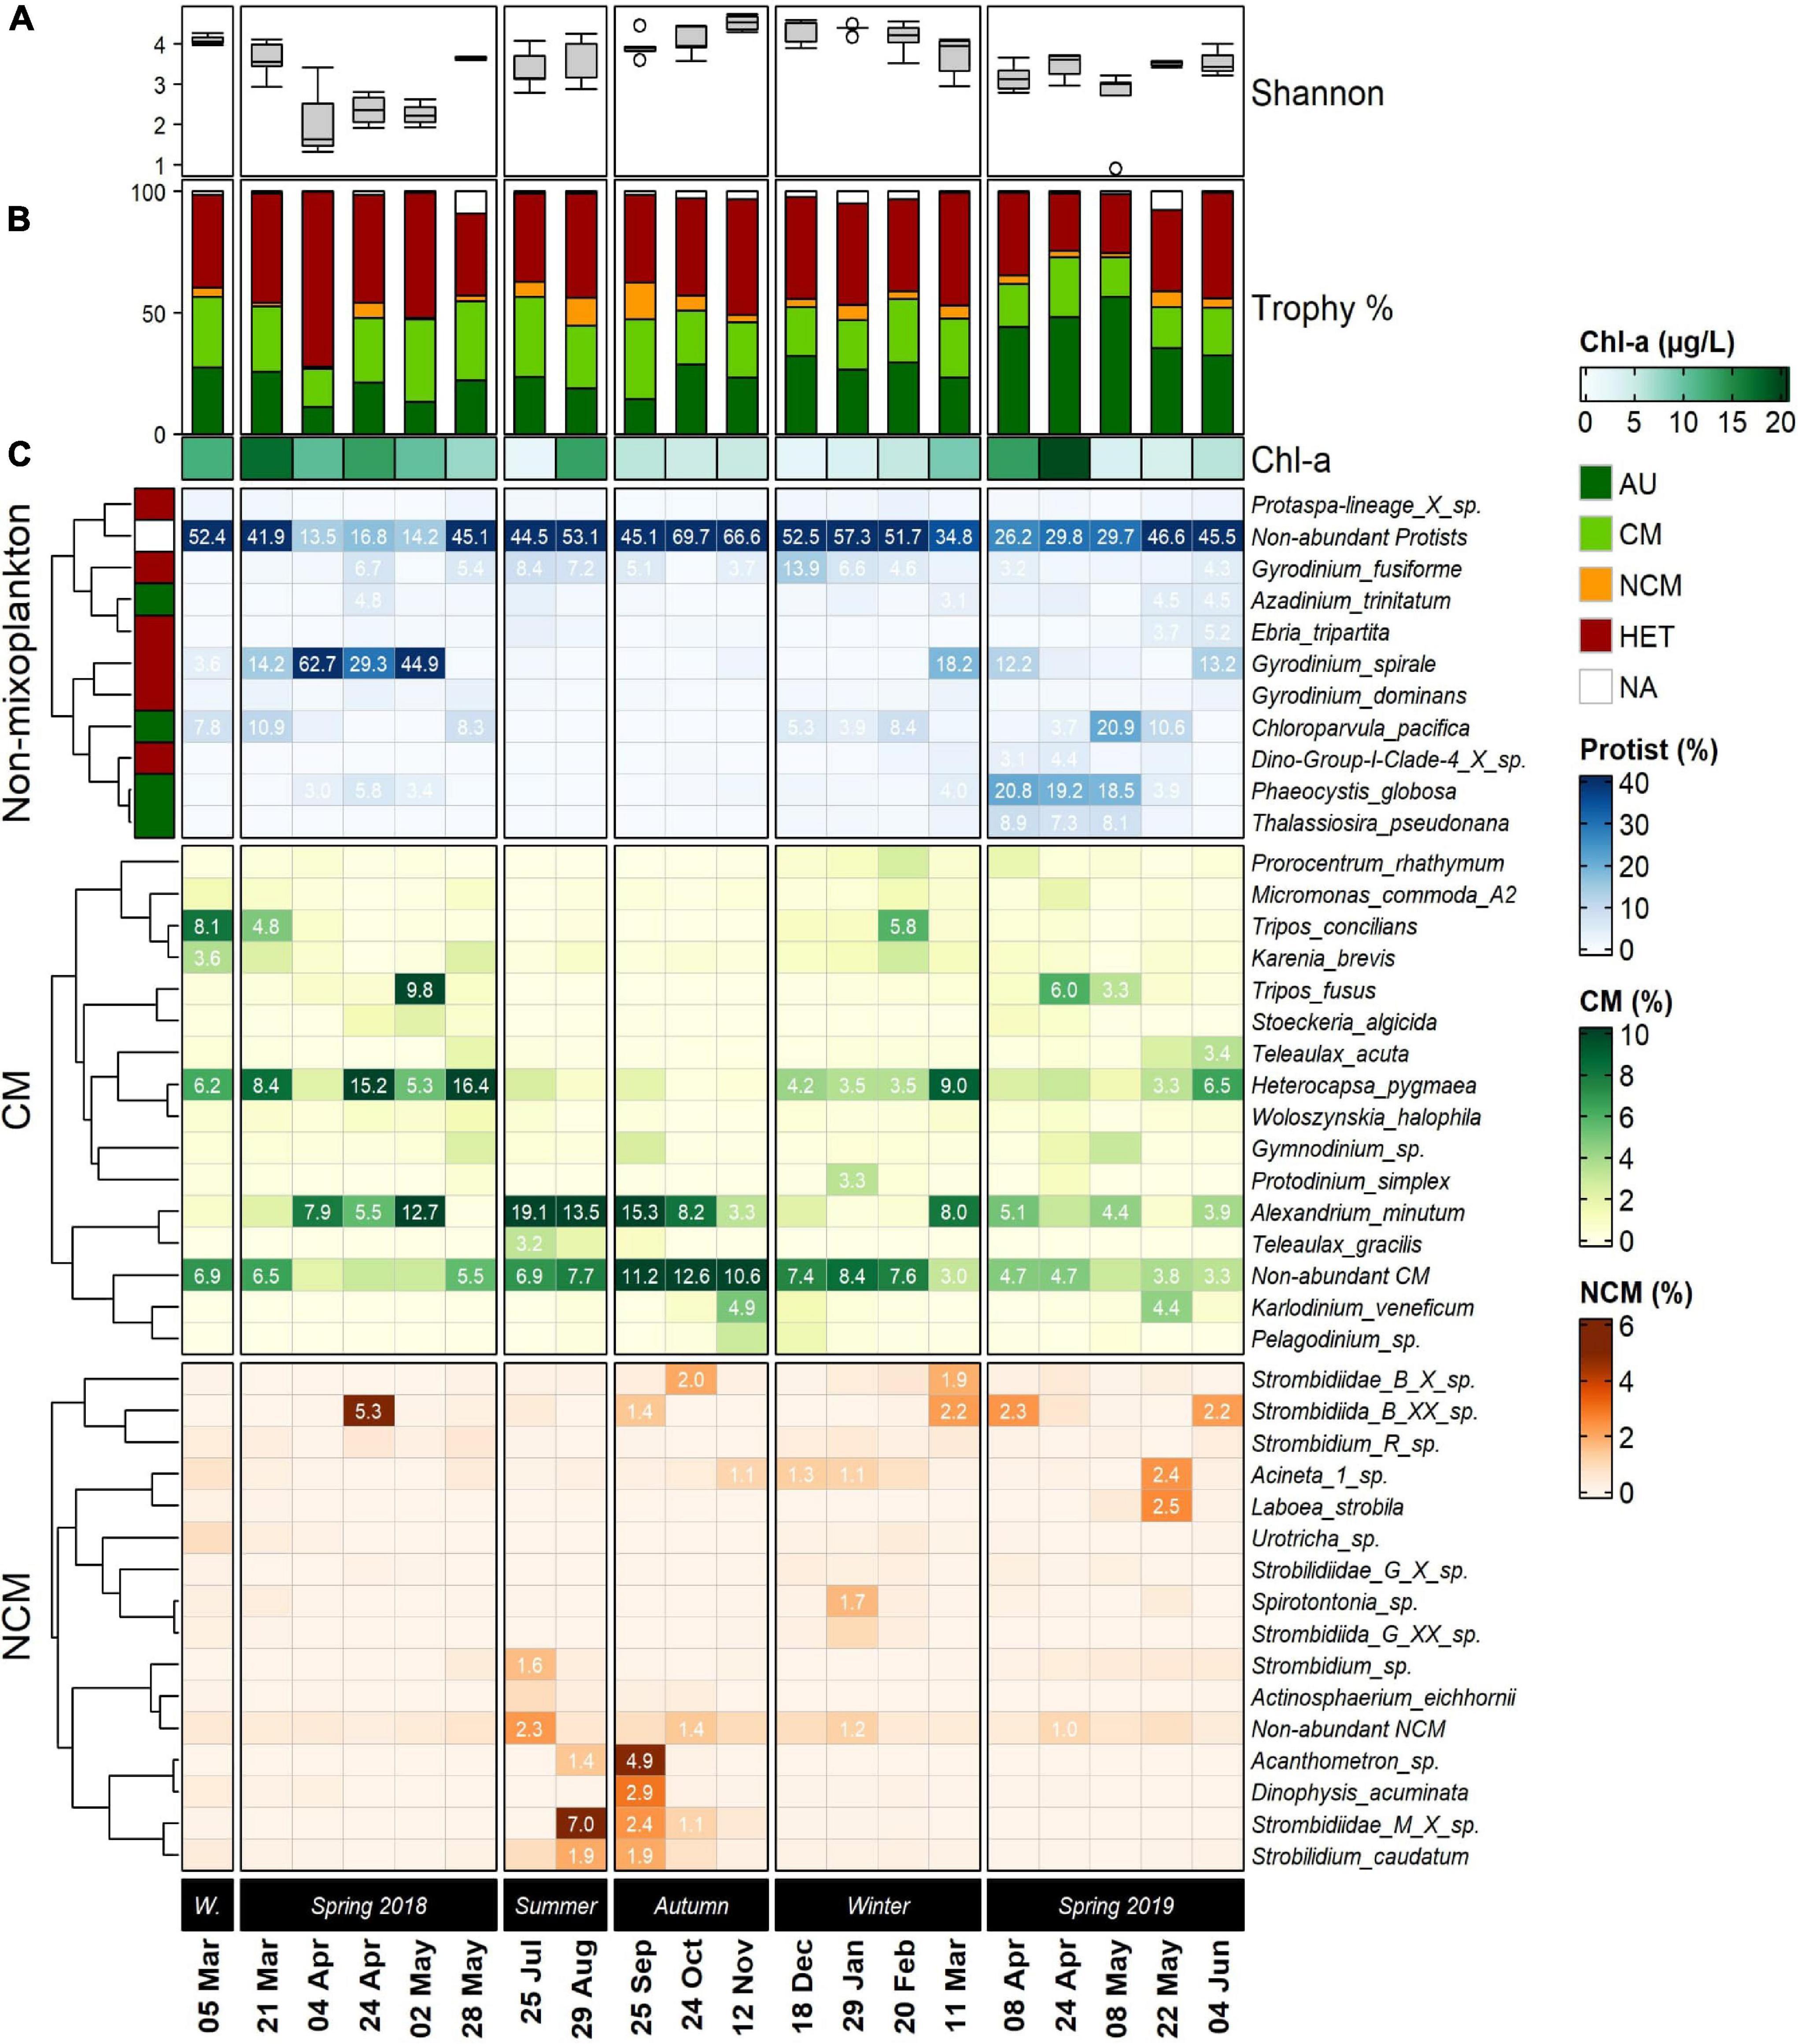
Figure 5. Series of seasonally arranged heatmaps displaying the community composition in the Belgian Coastal Zone temporal samples (five stations averaged). The top 10 most abundant non-mixotrophic protists are displayed in blue, which included strict auto- and heterotrophic organisms. Below, the top 15 constitutive mixoplankton (CM) and non-constitutive mixoplankton (NCM) are displayed in green and orange, respectively. (A) Boxplots displays the temporal progression of the entire community Shannon diversity index at each temporal sample. (B) Colored stacked bar plots represent the proportions of reads of the different trophic strategies. Below, Chl-a concentrations are annotated. (C) Taxonomic affiliation of ASVs at the lowest possible level (species), is shown in lines. Left annotation in colors refers to the trophic modes assigned for each of the non-mixoplankton species. The color scale (blue, green, orange) represents the relative abundances calculated as percentage of final total reads per temporal sample. The results that accounted ≥3% were annotated for non-mixoplanktonic protists and CM a (≥1% for NCM). Row clustering and its corresponding dendrogram was built using Pearson distance. W. = Winter 2018.
The temporal succession analysis of plankton groups’ (in relative abundances) (Figure 4A), showed that dinoflagellates were major contributors to the dataset with 22.8–82.2% of the assigned ASV reads. The maximum peak of autotrophic sequence reads coincided exactly with the Phaeocystis (group) proportion increase within the community in April and May 2019 samples, that reached up to 18.6–20.9%, respectively (Figure 4A). In addition, Chl-a concentration peaks during the sampling period coincided in time with the Phaeocystis increments observed during spring (greater in 2019 than in 2018) (Figures 2C, 4A). Besides these two peak periods, the contributions of Phaeocystis to the samples were less than 4% of the reads.
Diatoms ranged from 4.9% (April 2018) up to 26.6% (June 2019). Heterotrophic nanoflagellates and ciliates contributed significantly to the sequence reads, attaining maximum values up to 26.3% (November 2018) and 19.1% (January 2019), respectively. Green-brown microalgae, rhizarians and the ensemble of haptophytes-cryptophytes associated reads accounted less than 7% to the total counts throughout all seasons (Figure 4A). Similarly, unclassified taxa were <10% all along the sampling period, however, they had a significant contribution in May 2018 and 2019 (Figure 4A).
Metabarcoding results revealed that dinoflagellates (Dinophyta) was the taxa comprising most mixotrophic species, accounting for 70.9% of the total mixoplankton reads and a total of 70 identified ASVs out of 169 ASVs (Supplementary Data 1). The second major mixoplankton contributors were ciliates with 13.5% of the mixoplankton reads and 36 assigned ASVs. The remaining taxonomic groups containing mixoplankton contributed all together <20% to the total mixoplankton associated read counts and corresponded to a total of 36 ASVs.
We reported the temporal proportions of the trophic strategies adopted by two major taxa comprising mixoplankton species, dinoflagellates, and ciliates (Figures 4B,C). The average proportion of mixotrophic dinoflagellates and ciliates over the studied period was about 49.5 and 41.0%, respectively. Nevertheless, differences lie in the MFTs associated to each taxonomic group: primarily CM for dinoflagellates and NCM for ciliates. Indeed, dinoflagellates classed as strict autotrophic (Supplementary Data 1) or as NCM did not account for more than 5% of the reads throughout the temporal samples and no ciliate species were classed as CM or strict autotroph (Figures 4B,C). Trophic strategies in both in dinoflagellates and ciliates did not show a clear seasonal pattern, however, heterotrophic dinoflagellates attained >50% of the reads during spring 2018 temporal samples (Figure 4B), with a peak of 81% in April 2018. In the case of ciliates, April 2018 temporal sample showed particularly a high proportion of counts belonging to NCM (90.5%).
The protistan plankton taxonomical diversity and seasonal succession in the BCZ were illustrated and expressed in proportional number of reads (five stations averaged) emphasizing two major MFTs (Figure 5). The Shannon α-diversity indexes calculated for the entire community differed seasonally (Figure 5A), reaching the highest values during summer-winter 2018, with a maximum value of H’ = 4.73 in November 2018 and lowest values in April 2019 H’ = ∼ 0.9. Proportions of the community trophic strategies across the time-series samples (Figure 5B) revealed that highest CM proportions occurred between May–August 2018 (32–34% of the reads), and lowest in April 2018 and May–June 2019 (15–19%). CM proportion average throughout the sampling period attained up to 24.3% amongst the four assigned trophic modes. NCM was the least frequently occurring trophic strategy in our dataset, attaining maximum values of 15.1% in September 2018 and averaging 4.7% throughout the whole sampling period. In contrast, proportions of reads assigned to heterotrophic species were often dominating the community (>40% in 10 temporal samples), averaging 40.8% of the reads and reaching up values up to 72.2% in April 2018. Autotrophic read percentages attained a maximum of 53.4% in May 2019 and averaged 28%.
Out of the 10 most abundant non-mixoplankton ASVs 4 were assigned as autotrophs and 6 as heterotrophs (Figure 5C; blue color scale). The top 15 CM and NCM identified by our molecular dataset are shown below (green and orange color scales, respectively). The low diversity index measurements during spring 2018 matched with the important single-species contributions to the community. The heterotrophic dinoflagellate Gyrodinium spirale (Figure 5C) ranged from 29.3 to 62.7% in proportional number of ASV reads from April to May 2018. A slight presence of the characteristic bloom-forming species of the BCZ -Phaeocystis globosa- was noted (up to 5.8%). Heterocapsa pygmaea was the most abundant CM species (15–16%) together with Alexandrium minutum (7.9–12.7%). CM dinoflagellates Tripos concilians and Tripos fusus proportions reached non-negligible values (∼8–9%) in two temporal samples during spring 2018 (March and May). The only NCM species that had a significant (>5%) contribution to the community during this season was a ciliate belonging to Strombidiidae family (ASV 33: Strombidiida_B_XX_sp.).
In spring 2019 Phaeocystis globosa exerted the dominant role accounting up to 18–20% from April to May, together with high proportional abundance in May 2019 of autotrophic Chloroparvula pacifica (20.9%) and a slight presence of the diatom Thalassiosira pseudonana (∼7–9%). Summer and autumn in 2018 were characterized by a strong presence (avg. = 11.9%) of CM Alexandrium minutum, as well other “Non-abundant CM,” that contributed substantially to the community (∼7–12%). The molecular dataset revealed the highest NCM presence of the time-series in September 2018, led by Acanthometron sp. and the dinoflagellate Dinophysis acuminata. Several ciliates belonging to the Strombidium genus (i.e., Strombidium caudatum 1.9%) contributed modestly to the observed NCM peak.
Heterocapsa pygmaea presented the highest CM proportions during winter 2018–2019, sharing similar proportional read abundances with Alexandrium minutum (max. = 8%). However, most abundant non-mixoplanktonic organisms presented higher proportional number of reads such as the heterotrophic dinoflagellates belonging to Gyrodinium genus (max. = 13.9%).
Non-constitutive mixoplankton, overall, had a relatively low contribution to the total number of reads throughout all the studied period compared to CM (Figure 5C), with a total maximum contribution to the entire protistan community of 7% in September 2018. The most important constituents were marine oligotrich ciliates belonging to the genus Strombidium, ranging from 2 to 7% in summer 2018 and 2.6% and attaining up to 5.3% in April 2018.
Relating Mixoplankton Diversity and Environmental Conditions
Mixoplankton observed species richness (Obs.) and Shannon α-diversity (H’) throughout the time-series was significantly lower (Kruskal–Wallis, p < 0.01) than those observed for autotrophs and heterotrophs (see Supplementary Table 1 and Supplementary Figure 2). CM richness and H’ attained maximum values during winter (Obs. = 48.4 ± 4.7; H’ = 3.0 ± 0.2), and the lowest values were found in spring 2018 (Obs. = 2.1 ± 1.8; H’ = 1.2 ± 0.5). NCM observed diversity was significantly lower (Pairwise Wilcoxon, p < 0.01) than for CM (maximum Obs. = 15.4 ± 1.5; H’ = 2.2 ± 0.3) but Shannon diversity values did not differ. The temporal dynamics of the diversity values (Obs. and H’) followed the same seasonal pattern for both MFTs. Relative to other functional groups, heterotrophs presented the highest α-diversity and species richness, followed by autotrophs.
Mixoplankton in functional types specific Shannon α-diversity and ASV richness Pearson correlation matrices (n = 92) with environmental contextual data for the BCZ time-series are shown in Supplementary Figures 2, 3, respectively (autotrophs and heterotrophs were analyzed as well). DISi and DIN presented high VIF (>5, results not shown) and were removed from the analysis to avoid multi-collinearity. CM diversity and richness showed stronger positive correlation (r = 0.33–0.55, p < 0.01) with major inorganic nutrients (represented by DIP) than NCM (r = 0.33–0.45, p < 0.01). In contrast, PAR showed stronger negative correlation with CM Shannon diversity and observed richness (r = −0.70 to 0.55, p < 0.01) than NCM (r = −0.44 to 0.45, p < 0.01). Whereas both CM richness and H’ showed a significant negative correlation with bacterial biomass, NCM Shannon diversity showed a weak correlation. Salinity and Chl-a values were not strongly correlated with mixoplankton diversity or species richness (both CM and NCM), however, we found a weak negative correlation (r = −0.27, p < 0.01) with observed heterotroph species.
In the beta diversity (β-diversity) patterns performed for CM, NCM autotrophs and heterotrophs across the time-series (Figure 6), seasons (spring-winter and autumn-summer) were well separated along the first axis of our redundancy analysis (RDA) for each trophic group (between 13.2 and 14.8% of variance constrained). There was a strong orientation of temperature toward all summer samples in all the four trophic strategies displayed, and dissolved inorganic nutrient concentrations (DIP, DISi, DIN) were found to be associated with autumn and winter samples. High Chl-a concentrations were correlated with spring samples. Autotrophs β-diversity was found to be more impacted by Chl-a and inorganic nutrients than the remaining trophic groups (Figure 6C). Salinity resulted to be the environmental factor with low impact at the community shifts. It was observed that the samples for each of the trophic strategies were differently ordinated in our RDA plots. Shortest distances were observed between spring and summer sites for NCM (Figure 6B). Across all trophic groups, the autumn samples showed the largest spread among the first RDA axis and partially overlapped with summer and winter samples. Secondary axis inferred the separation of winter-autumn against spring-summer seasons. In our multivariate analysis, β-diversity for the different trophic groups was controlled by multiple environmental variables that shaped microbial communities over the time-series.
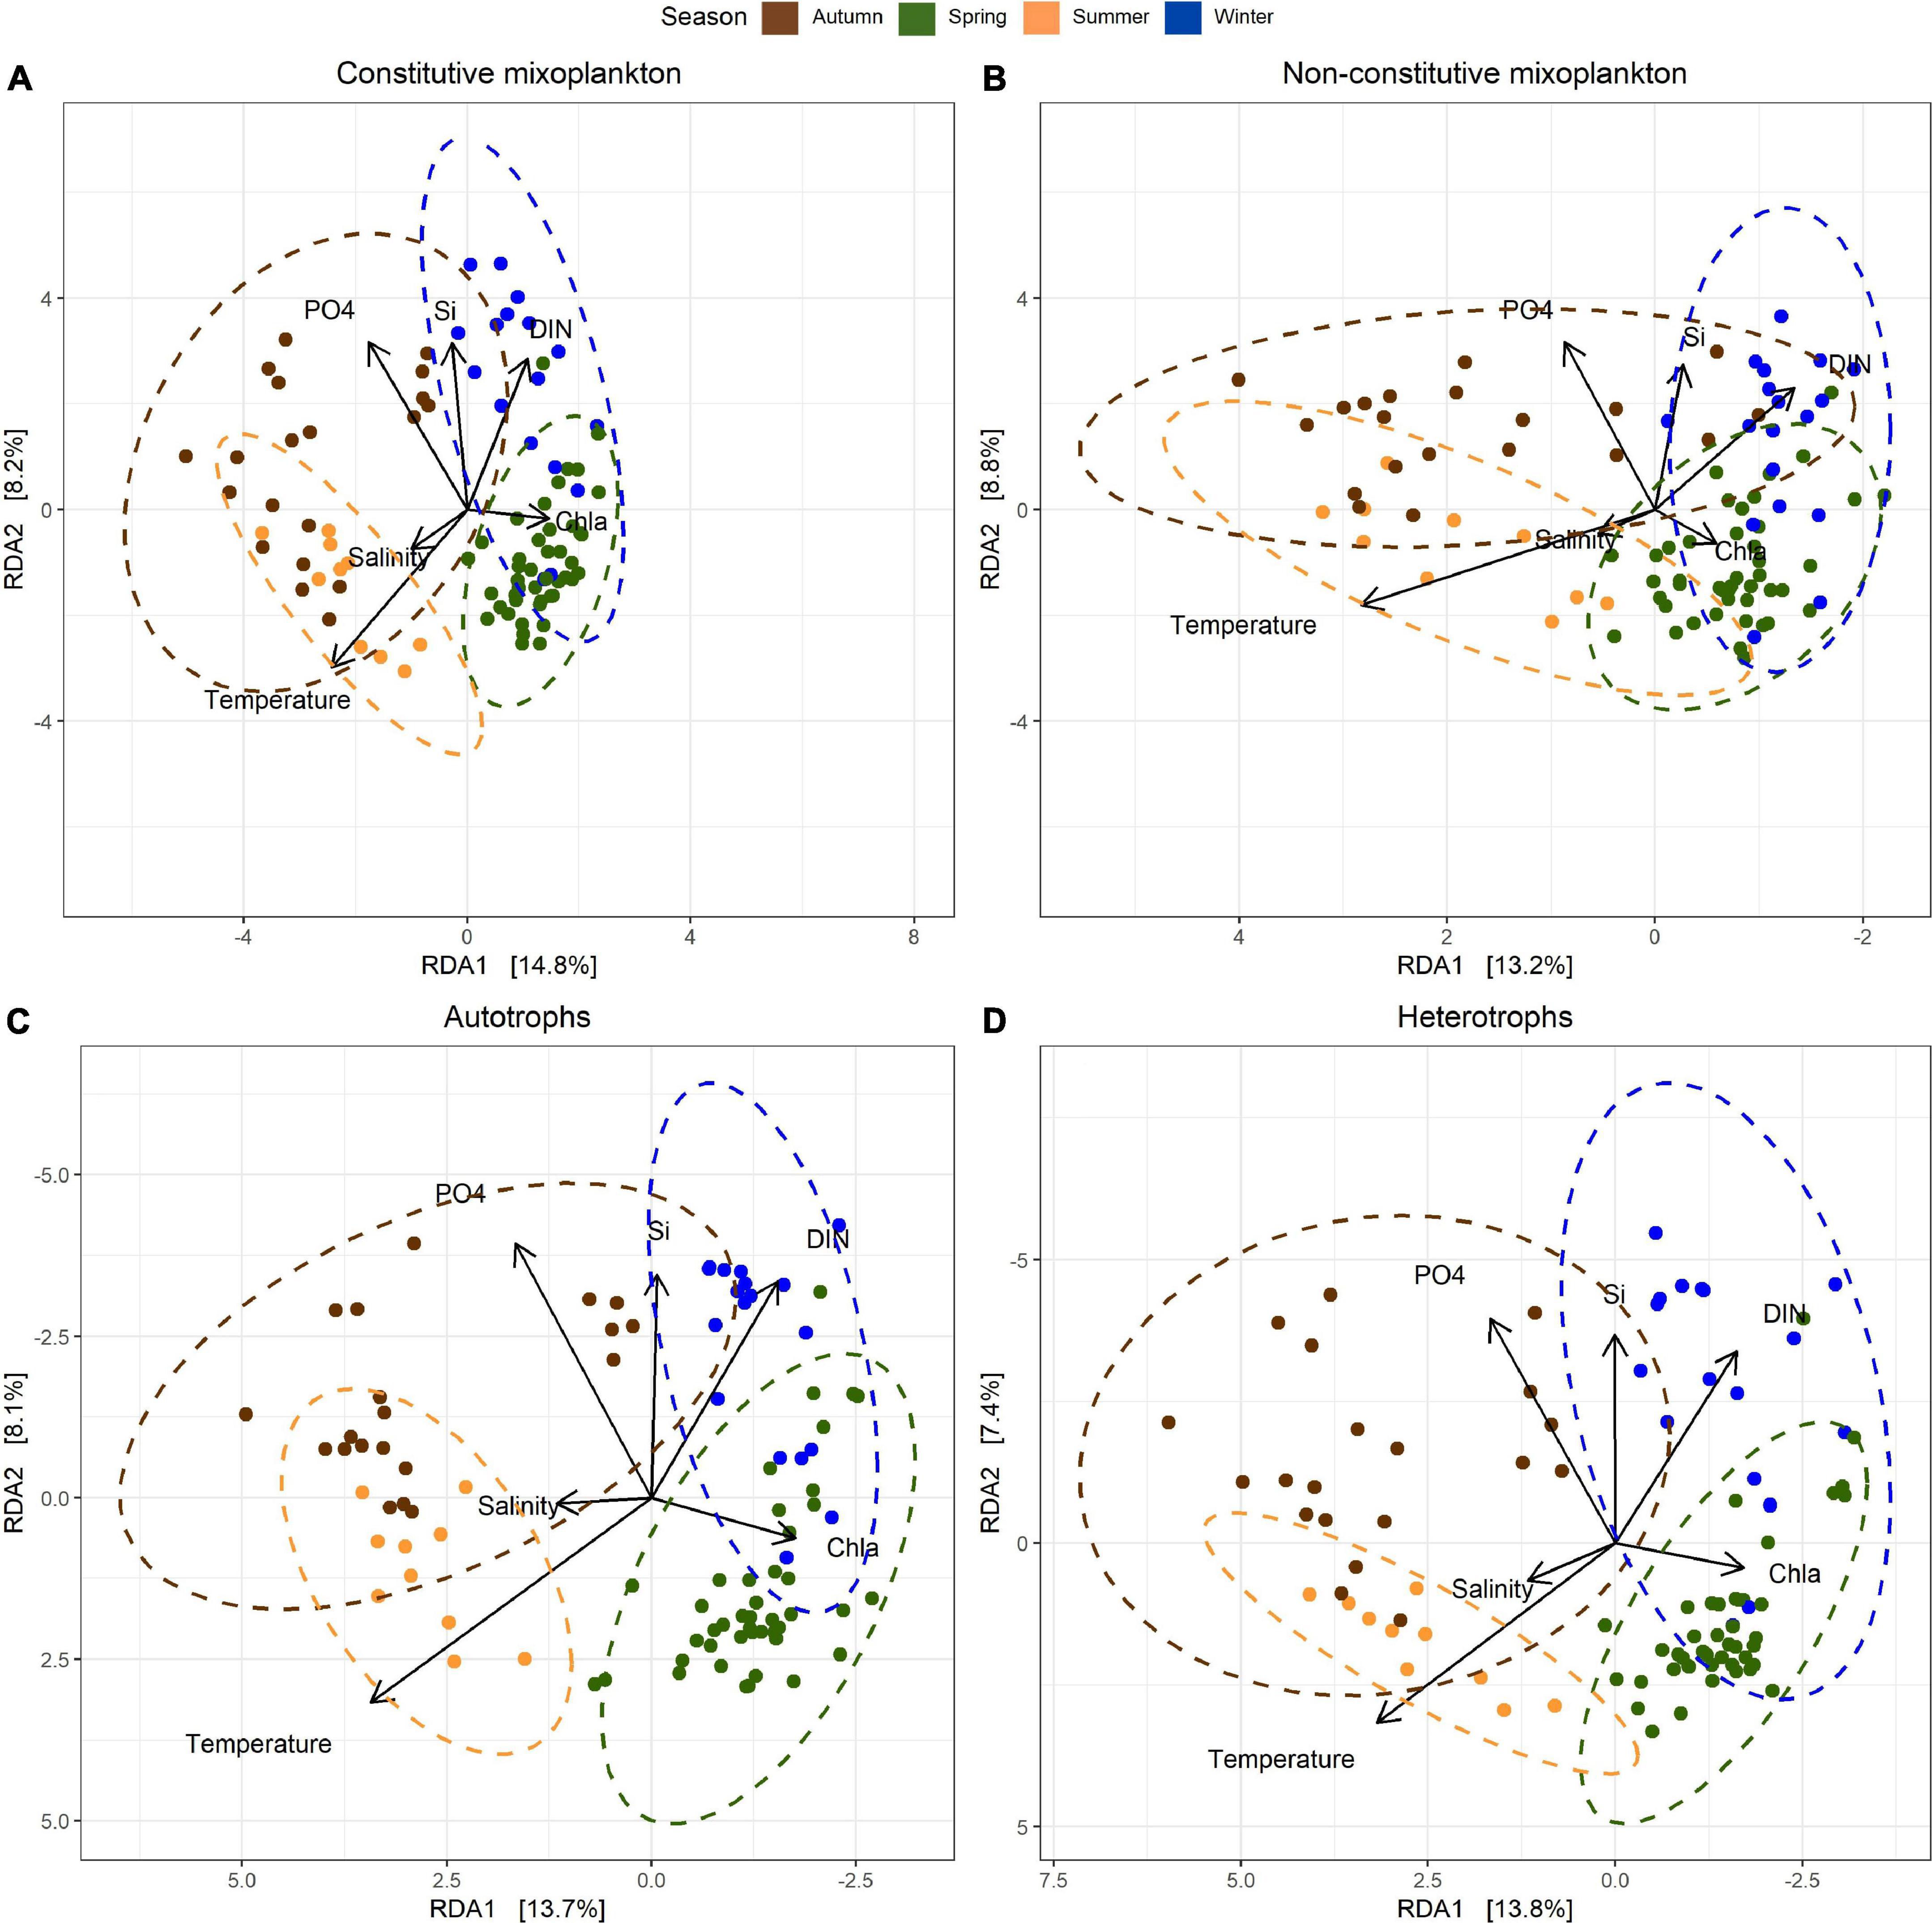
Figure 6. Redundancy analysis (RDA) of clr-transformed ASV counts were performed independently for each of the trophic strategies studied: (A) constitutive mixoplankton, (B) non-constitutive mixoplankton, (C) autotrophs, and (D) heterotrophs. Contextual environmental data were used as explanatory variables, represented as arrows. Vector lengths correspond to relative importance. Samples clusters were performed according to established seasons. Note reverse axis in (B) (x axis), (C,D) (x and y axis).
Discussion
Molecular Approach for Mixoplankton Research
For the presented work, we gathered new information regarding the spatial and temporal variability of the most relevant MFTs and marine protist plankton (>0.22 μm) in the North Sea based on the analysis of the V4 region of the 18S rRNA gene. Species trophic modes were assigned to depict the taxonomic composition and diversity of mixoplankton with high resolution, focusing on two MFTs.
While microscopy on mixoplankton research is still often deployed (Flynn et al., 2019), here, we used a Next Generation Sequencing approach by means of MiSeq Illumina sequencing, that provides the potential for rapid and more comprehensive automated examination of environmental samples (e.g., Mäki et al., 2017) to investigate the MFTs dynamics in the marine environment. Mostly dependent on taxonomic expertise for a species level resolution (Kase et al., 2020), optical microscopy methods are time-consuming (Stern et al., 2018), and certain small-sized taxa occurrence like dinoflagellates, which are generally mixotrophs, are underestimated (Stern et al., 2018; Kase et al., 2020). Furthermore, due to mixoplankton resemblances with several strict auto- or heterotrophic protistan plankton, misclassification has been relatively common due difficulties to assess phagotrophic and/or autotrophic capabilities (Anderson et al., 2017; Beisner et al., 2019). These reasons have led to a disrupted understanding of the nature of most marine planktonic primary producers, that in fact, have the ability to potentially express mixotrophy (Leles et al., 2019).
DNA analysis opens the possibility to partially replace or rather complement microscopy but just like optical methods, it has its limitations. In this work, the quantification of planktonic protists was visualized based on sequence amplicon data relative abundances, being aware of the difficulties of data interpretation of approaches based only on proportions (Kase et al., 2020), which has largely been discussed in recent literature (Weisse et al., 2016; Vasselon et al., 2017; Santoferrara, 2019). Besides the inherent technical issues occurring due to the method: sample preservation (Mäki et al., 2017), DNA extraction (van der Loos and Nijland, 2021), primer choice and specificity (Elbrecht and Leese, 2015) and polymerase chain reaction (PCR), protists have a strong variation in cell density, cell biomass and 18S rRNA gene copy number. This natural variability strongly varies between different taxonomic groups and species (Zhu et al., 2005) and has been already shown for dinoflagellates (Galluzzi et al., 2004), diatoms (Connolly et al., 2008; Godhe et al., 2008) or ciliates (Gong et al., 2013). For these reasons, sequencing results based only on the 18S rRNA gene proportions might often be misinterpreted since they differ with relative abundances revealed by microscopic counts (Santi et al., 2021).
In fact, microbiome datasets are compositional (Gloor et al., 2017) and therefore, standard methods of analysis are not applicable and validity of all downstream analyses is critical (Weiss et al., 2017). The total number of reads obtained per sample does not reflect the absolute number of microorganisms present, however, visualization of relative abundances of ASVs throughout a time-series is highly intuitive for the most abundant taxa present in metabarcoding datasets. Moreover, this allows a comprehensive understanding of the taxonomic profile (i.e., occurring species).
Although we cannot fully rely on a quantitative picture of microbial communities based on amplicon data (Lin et al., 2018), the DNA-barcoding approach was able to provide advantages over traditional methods to study MFTs, as, event if not quantitative, it gives a taxonomically enhanced picture of the whole protistan community, overrepresenting taxa on which mixoplankton mostly occurs such as dinoflagellates (Gran-Stadniczeñko et al., 2019). Besides, metabarcoding only analyzed molecules and not per se the organism itself, this means that the taxonomic assignment of a given ASV depends strongly on the reference database used (i.e., PR2). Nevertheless, it has recently been shown that the environmental drivers shaping protist communities are the same for molecular (metabarcoding) and quantitative microscopy methods (Piwosz et al., 2020), and therefore are reliable in the context of ecological interpretations.
Mixoplankton Among Auto- and Heterotrophs
In the BCZ, the previous knowledge focusing on protistan plankton relies on microscopy (Rousseau et al., 2000, 2006; Muylaert et al., 2006) or flow cytometry (Martínez et al., 2020), some of which include quantitative phytoplankton counts since 1968 to 2010 (Nohe et al., 2018). Traditionally, trend analyses and dynamics of autotrophic plankton biomass have been often based on pigment (Chl-a) concentration. Nevertheless, an important fraction of Chl-a containing protists are well known to have the ability to perform phagoheterotrophy (Flynn et al., 2019). Long-term marine protist plankton surveys have permitted to characterize in detail the recurrent annual phytoplankton events in BCZ: (1) late February–March diatom spring bloom, (2) directly followed by a huge bloom of the HAB Phaeocystis globosa in April–May, and (3) a late summer diatom bloom (Rousseau et al., 2002; Nohe et al., 2020). Regarding the mixoplankton diversity dynamics, we found that CM (mainly dinoflagellates) were highly present throughout the year, and often dominating the amplicon counts of our dataset. Similar results have already been revealed (for neighboring regions to the BCZ) in terms of absolute cell counts under light microscopy (Leles et al., 2019; Schneider et al., 2020b).
The metabarcoding approach did not reflect the above-mentioned diatom blooms in proportional number of reads (they were identified through microscopy survey, data not shown). Phaeocystis globosa blooms, however, were much more accurately represented (mainly in 2019). In contrast, our approach was able to emphasize mixoplankton, that were present and moderately abundant in all samples, suggesting that they coexist (Edwards, 2019) with strict autotrophic and heterotrophic protists under various environmental conditions in the BCZ. Similarly to previous studies (Taylor and Cunliffe, 2014; Massana et al., 2015; Kase et al., 2020), almost half of our sequence assemblages belonged to dinoflagellates, of which most were classified as CM and heterotrophs, and a smaller number as strict autotrophs and NCM. Compared to the main traditional long-term observations in BCZ based on microscopy (Nohe et al., 2018; Martínez et al., 2020) our results showed a higher taxonomic resolution resulting mainly in an increased identification small sized dinoflagellates (<20 μm).
Throughout the studied period CM-dinoflagellates genera Heterocapsa, Alexandrium, Tripos, and Karlodinium stood out within the mixoplankton read counts. Nohe et al. (2020) noted an increase of various dinoflagellate genera such as Alexandrium or Gyrodinium (heterotrophic) since the 1970s. However, it is possible that historical surveys that describe the area were underestimating dinoflagellate occurrence in the environment, due to resolution limitations of the identification methods used (Kase et al., 2020).
Non-constitutive mixoplankton were very scarce compared to other trophic groups and mostly emerged in summer-autumn under low-nutrients high-light irradiance conditions. Two hypothesis may explain this observation. First, there is lower predation by higher trophic levels during this period of the year and second, specific prey types for NCM (which are often restricted to a particular prey type) might be thriving during the period prior to the NCM abundance increase. NCM were almost exclusively represented by ciliates, and within ciliates, it was found that ∼ 40% on average were classed as mixotrophs. Our results are in accordance with former observations of Dolan (1992), that showed that chloroplast-retaining oligotrichs rarely dominate the ciliate community. In fact, the low biomass of NCM throughout the year in temperate seas was demonstrated by Leles et al. (2020), and previous studies on ciliates in oligotrophic waters showed similar proportions of mixotrophy (Dolan and Pérez, 2000; Stoecker et al., 2009; Romano et al., 2021).
Even though we were limited by the sampling strategy performed for heterotrophic bacterial biomass (data available only for one station of the BCZ), we explored its dynamics along with mixoplankton diversity. In fact, our dataset revealed a high bacterivorous mixoplankton genera (i.e., Alexandrium, Heterocapsa, Karlodinium). Heterocapsa, for instance, (i.e., Heterocapsa triquetra) is known to perform strong bacterivory (up to 12.3 ± 2.9 bacteria Heterocapsa–1 h–1) under light or nutrients limitation (Millette et al., 2017) as well as Alexandrium (Lim et al., 2019) and both can form large blooms (Galluzzi et al., 2004; Seong et al., 2006; Millette et al., 2015). Indeed, the importance of mixoplankton bacterivory (Zubkov and Tarran, 2008; Unrein et al., 2014) has been discussed to alleviate nutrient (Stoecker et al., 2017) or light stress (Fischer et al., 2017). Protists can strongly impact bacterial diversity (Suzuki, 1999) but the understanding of how mixoplankton impacts the bacterial biomass and nutrient cycling in the microbial loop remains unclear.
Like auto- and heterotrophs, mixoplanktonic diversity increased when resources were available (Edwards, 2019); yet, abundant light, nutrients or prey seemed to favor more strict autotrophic and heterotroph diversity (Mitra and Flynn, 2010). Our study revealed, in general, slight differences in α- and β-diversity temporal patterns for the studied microbial trophic groups. Schneider et al. (2020b) showed that mixoplankton had an advantage over strict autotrophs and heterotrophs in low biomass environments, nutrient-depleted areas and/or seasonally stratified water columns. The BCZ, however, is considered to have a well-mixed water column throughout the year (Masquelier et al., 2011). Therefore, when correlations of mixoplankton α-diversity with environmental data were investigated, species richness and Shannon diversity showed a stronger positive correlation with nutrient rich waters for CM than NCM, outlining the differences in nutrient acquisition strategies by each of the MFTs (Flynn et al., 2019).
More CM species prospered in nutrient rich and low Chl-a (proxy for biomass) environments and they did co-occur in time with strict autotrophs (i.e., Phaeocystis globosa). In contrast, strong light incidence and high temperature environment (low biomass and nutrient poor waters) favored NCM species diversity over CM. Overall, nutrient increase drove diversity and species richness within all trophic groups, particularly in autumn and winter, with DIP concentration changes being the most important factor driving this variability. The decrease in bacterial biomass was linked both to MFTs and heterotrophic richness α-diversity decrease, however, autotrophs were not correlated to bacterial biomass. Some of the above-mentioned correlates might be drivers of MFTs diversity and richness. In agreement to recent published modeling studies (Anschütz and Flynn, 2020; Leles et al., 2020) our molecular dataset demonstrated a niche separation between CM and NCM according to nutrient, prey (bacterial biomass) and light availabilities.
The multiple environmental contextual variables shaping microbial community shifts were located in similar places for the four groups, indicating that such seasonal changes in β-diversity for autotrophs, heterotrophs and mixoplankton, were controlled by the same physicochemical processes (temperature, light, and nutrient availability). These processes are directly affected by nutrient influx (from rivers, currents), remineralization or interspecific competition for resources (Da̧browska et al., 2020). Similar ecological analysis across different oceanic regions (Hörstmann et al., 2021) has already proved useful for the delineation of oceanographic provinces (ecosystem boundaries) and determination of important features generating microbial diversity changes. In our study, the time-series framework allowed to stress the importance of seasonality in BCZ for these community changes.
Ocean currents can drive overlaps in β-diversity signals: In an effort to understand the factors driving the differences between both MFTs (CM and NCM), auto- and heterotrophic plankton contrasting β-diversity patterns on our seasonally arranged RDA analysis for the microbial trophic groups associated under the same environmental conditions, results displayed for trophic groups.
We noted overlapping of in β-diversity signals: the light differences among the different trophic groups shows the value of microbial diversity data in holistically describing, especially temporal series seasonally arranged.
Conclusion
Our work provides a first picture of mixoplankton temporal variability among auto- and heterotrophs in the Belgian Coastal Zone in combination with environmental contextual data, emphasizing the identification and classification of MFTs. We depicted when, which and how many mixoplankton species occur in the area, using a V4 18S rRNA metabarcoding approach. However, this does not necessarily mean that they are actively performing phagotrophy and/or photoautotrophy at a particular time and place. Understanding the interplay of biological and physical controls to assess MFTs ecological niche is particularly challenging since there is a wide variety of different nutritional strategies (Mitra et al., 2016). In fact, taxonomical characterization of mixoplankton through 18S rRNA gene sequencing and the assessment of their diversity drivers are a first step. Future steps would require more complete analyses of biological (i.e., transcriptomics) and physical interactions within an integrative pipeline.
We found that mixoplankton are abundant and diverse, and thus we can consider them as a core trophic group together with strict photo- and phagotrophic protists. The key findings of this study are summarized as follows: (i) mixoplankton were significantly present throughout the year and co-occur with strict autotrophs and heterotrophs in mixed water columns; (ii) dinoflagellates and ciliates were taxa contributing most to mixoplankton in the Belgian Coastal Zone; (iii) CM were ubiquitous, more abundant and diverse than NCM; (iv) environmental drivers of mixoplankton diversity in the time-series were found to be similar to strict autotrophs and heterotrophs.
Since traditional marine trophic web formulation is currently experiencing the inclusion of additional trophic roles, beyond responding to questions such as “who? when? and where?” we need to understand the corresponding implications of different MFTs. Present challenges and current efforts in mixoplankton research are linked to comprehend significance of mixotrophic activity for community structure and dynamics, which is why it is important to know when these organisms are functionally mixotrophic (when they are eating). The rapid development of new sequencing technologies seems to point us toward a mixoplankton research scenario where the meta-omics prevail. This should provide precious complementary knowledge that will, with no doubts, augment the informative value of the data already collected (via other methodological approaches) in order to acquire firm knowledge of mixoplankton role and relevance in marine ecosystem dynamics.
Data Availability Statement
The datasets presented in this study can be found in online repositories. The names of the repository/repositories and accession number(s) can be found below: NCBI (accession: MZ687469-MZ687778).
Author Contributions
JL contributed to data acquisition and analysis, data interpretation, preparation of figures, and drafting of the manuscript. NG contributed to conceptualization, resources, supervision, project administration, writing review and editing, and funding acquisition. UJ contributed to resources, supervision, and writing review and editing. CR contributed to data acquisition, conceptualization, and writing review and editing. All authors reviewed the manuscript.
Funding
This research was supported by the MixITiN (www.mixotroph. org) project, which received funding from the European Union’s Horizon 2020 Research and Innovation Programme under the Marie Skłodowska-Curie Actions (MSCA) grant agreement no. 766327. JL was granted with MSCA funded ITN-ETN MixITiN Early Stage Researchers (ESRs) support. JL, NG, and CR received financial support from the Fonds David et Alice Van Buuren. CR was a Ph.D. grant from the FRIA (Fund for Research Training in Industry and Agriculture, FNRS). UJ was financially and logistically supported through the POF IV, topic 6 and subtopic 2 research program of the Alfred Wegener Institute, Helmholtz Centre for Polar and Marine Research.
Conflict of Interest
The authors declare that the research was conducted in the absence of any commercial or financial relationships that could be construed as a potential conflict of interest.
Publisher’s Note
All claims expressed in this article are solely those of the authors and do not necessarily represent those of their affiliated organizations, or those of the publisher, the editors and the reviewers. Any product that may be evaluated in this article, or claim that may be made by its manufacturer, is not guaranteed or endorsed by the publisher.
Acknowledgments
We recall with affection and gratitude to the dedicated technical assistance received by the crew of RV Simon Stevin and RV Heincke. We would like to express special thanks for the staff of the VLIZ (Flanders Marine Institute) and AWI (Alfred Wegener Institute), specially to Stefan Neuhaus, Jonas Mortelmans, Nancy Kühne, Cora Hörstmann, and Sylke Wohlrab for their valuable support provided.
Supplementary Material
The Supplementary Material for this article can be found online at: https://www.frontiersin.org/articles/10.3389/fmars.2022.786787/full#supplementary-material
References
Adolf, J. E., Stoecker, D. K., and Harding, L. W. (2006). The balance of autotrophy and heterotrophy during mixotrophic growth of Karlodinium micrum (dinophyceae). J. Plankton Res. 28, 737–751. doi: 10.1093/plankt/fbl007
Anderson, M. J. (2001). A new method for non-parametric multivariate analysis of variance. Austral. Ecol. 26, 32–46.
Anderson, R., Jürgens, K., and Hansen, P. J. (2017). Mixotrophic phytoflagellate bacterivory field measurements strongly biased by standard approaches: a case study. Front. Microbiol. 8:1398. doi: 10.3389/fmicb.2017.01398
Anschütz, A. A., and Flynn, K. J. (2020). Niche separation between different functional types of mixoplankton: results from NPZ - style N - based model simulations. Mar. Biol. 167, 1–21. doi: 10.1007/s00227-019-3612-3
Armeli Minicante, S., Piredda, R., Quero, G. M., Finotto, S., Bernardi Aubry, F., Bastianini, M., et al. (2019). Habitat heterogeneity and connectivity: effects on the planktonic protist community structure at two adjacent coastal sites (the lagoon and the gulf of venice, northern adriatic sea, italy) revealed by metabarcoding. Front. Microbiol. 10:1–16. doi: 10.3389/fmicb.2019.02736
Barton, A. D., Pershing, A. J., Litchman, E., Record, N. R., Edwards, K. F., Finkel, Z. V., et al. (2013). The biogeography of marine plankton traits. Ecol. Lett. 16, 522–534. doi: 10.1111/ele.12063
Beisner, B. E., Grossart, H. P., and Gasol, J. M. (2019). A guide to methods for estimating phago-mixotrophy in nanophytoplankton. J. Plankton Res. 41, 77–89. doi: 10.1093/plankt/fbz008
Berdjeb, L., Parada, A., Needham, D. M., and Fuhrman, J. A. (2018). Short-term dynamics and interactions of marine protist communities during the spring-summer transition. ISME J. 12, 1907–1917. doi: 10.1038/s41396-018-0097-x
Bruhn, C. S., Wohlrab, S., Krock, B., Lundholm, N., and John, U. (2021). Seasonal plankton succession is in accordance with phycotoxin occurrence in disko bay, west greenland. Harm. Alg. 103:101978. doi: 10.1016/j.hal.2021.101978
Callahan, B. J., McMurdie, P. J., Rosen, M. J., Han, A. W., Johnson, A. J. A., and Holmes, S. P. (2016). DADA2: high-resolution sample inference from Illumina amplicon data. Nat. Methods 13, 581–583. doi: 10.1038/nmeth.3869
Chain, F. J. J., Brown, E. A., Macisaac, H. J., and Cristescu, M. E. (2016). Metabarcoding reveals strong spatial structure and temporal turnover of zooplankton communities among marine and freshwater ports. Divers. Distrib. 22, 493–504. doi: 10.1111/ddi.12427
Connolly, J. A., Oliver, M. J., Beaulieu, J. M., Knight, C. A., Tomanek, L., and Moline, M. A. (2008). Correlated evolution of genome size and cell volume in diatoms (bacillariophyceae). J. Phycol. 44, 124–131. doi: 10.1111/j.1529-8817.2007.00452.x
Da̧browska, A. M., Wiktor, J. M., Merchel, M., and Wiktor, J. M. (2020). Planktonic protists of the eastern nordic seas and the fram strait: spatial changes related to hydrography during early summer. Front. Mar. Sci. 7:1–14. doi: 10.3389/fmars.2020.00557
Das, P. B., Gauns, M., and Naqvi, S. W. A. (2019). Ecological diversity of planktonic protists in spatial regimes of the arabian sea revealed through next-generation sequencing. Reg. Stud. Mar. Sci. 25:100484. doi: 10.1016/j.rsma.2018.100484
De Vargas, C., Audic, S., Henry, N., Decelle, J., Mahé, F., Logares, R., et al. (2015). Eukaryotic plankton diversity in the sunlit ocean. Science 348:6237. doi: 10.1126/science.1261605
Desmit, X., Ruddick, K., and Lacroix, G. (2015). Salinity predicts the distribution of chlorophyll a spring peak in the southern north sea continental waters. J. Sea Res. 103, 59–74. doi: 10.1016/j.seares.2015.02.007
Dolan, J. R. (1992). Mixotrophy in ciliates: a review of chlorella symbiosis and chloroplast retention. Mar. Microb. Food Webs 6, 115–132.
Dolan, J. R., and Pérez, M. T. (2000). Costs, benefits and characteristics of mixotrophy in marine oligotrichs. Freshw. Biol. 45, 227–238. doi: 10.1046/j.1365-2427.2000.00659.x
Duffy, J. E., Godwin, C. M., and Cardinale, B. J. (2017). Biodiversity effects in the wild are common and as strong as key drivers of productivity. Nat. Publ. Gr. 549, 261–264. doi: 10.1038/nature23886
Ebenezer, V., Medlin, L. K., and Ki, J. (2011). Molecular detection quantification and diversity evaluation of microalgae molecular. Mar. Biotechnol. 14, 129–142. doi: 10.1007/s10126-011-9427-y
Edwards, K. F. (2019). Mixotrophy in nanoflagellates across environmental gradients in the ocean. Proc. Natl. Acad. Sci. U.S.A. 116, 6211–6220. doi: 10.1073/pnas.1814860116
Elbrecht, V., and Leese, F. (2015). Can DNA-based ecosystem assessments quantify species abundance? Testing primer bias and biomass-sequence relationships with an innovative metabarcoding protocol. PLoS One 7:e0130324. doi: 10.1371/journal.pone.0130324
Faure, E., Not, F., Benoiston, A. S., Labadie, K., Bittner, L., and Ayata, S. D. (2019). Mixotrophic protists display contrasted biogeographies in the global ocean. ISME J. 13, 1072–1083. doi: 10.1038/s41396-018-0340-5
Fischer, R., Giebel, H., Hillebrand, H., and Ptacnik, R. (2017). Importance of mixotrophic bacterivory can be predicted by light and loss rates. Oikos 126, 713–722.
Flynn, K. J., and Hansen, P. J. (2013). Cutting the canopy to defeat the ‘selfish gene’; conflicting selection pressures for the integration of phototrophy in mixotrophic protists. Protist 164, 1–13. doi: 10.1016/j.protis.2013.09.002
Flynn, K. J., and Mitra, A. (2009). Building the ‘perfect beast’: modelling mixotrophic plankton. J. Plankton Res. 31, 965–992. doi: 10.1093/plankt/fbp044
Flynn, K. J., Mitra, A., Anestis, K., Anschütz, A. A., Calbet, A., Ferreira, G. D., et al. (2019). Mixotrophic protists and a new paradigm for marine ecology: where does plankton research go now? J. Plankton Res. 41, 375–391. doi: 10.1093/plankt/fbz026
Galluzzi, L., Penna, A., Bertozzini, E., Vila, M., Garce, E., and Magnani, M. (2004). Development of a real-time PCR assay for rapid detection and quantification of Alexandrium minutum (a dinoflagellate). Appl. Environ. Microbiol. 70, 1199–1206. doi: 10.1128/AEM.70.2.1199
Genitsaris, S., Monchy, S., Viscogliosi, E., Sime-Ngando, T., Ferreira, S., and Christaki, U. (2015). Seasonal variations of marine protist community structure based on taxon-specific traits using the eastern english channel as a model coastal system. FEMS Microbiol. Ecol. 91, 1–15. doi: 10.1093/femsec/fiv034
Ghyoot, C., Lancelot, C., Flynn, K. J., Mitra, A., and Gypens, N. (2017). Introducing mixotrophy into a biogeochemical model describing an eutrophied coastal ecosystem: The Southern North Sea. Prog. Oceanogr. 157, 1–11. doi: 10.1016/j.pocean.2017.08.002
Glibert, P. M., Berdalet, E., Burford, M. A., Pitcher, G. C., and Zhou, M. (eds) (2018). Global Ecology and Oceanography of Harmful Algal Blooms, Vol. 232. Cham: Springer.
Gloor, G. B., Macklaim, J. M., Pawlowsky-Glahn, V., and Egozcue, J. J. (2017). Microbiome datasets are compositional: and this is not optional. Front. Micr. 8:2224. doi: 10.3389/fmicb.2017.02224
Godhe, A., Asplund, M. E., Härnström, K., Saravanan, V., Tyagi, A., and Karunasagar, I. (2008). Quantification of diatom and dinoflagellate biomasses in coastal marine seawater samples by real-time PCR. Appl. Environ. Microbiol. 74, 7174–7182. doi: 10.1128/AEM.01298-08
Gong, J., Dong, J., Liu, X., and Massana, R. (2013). Extremely high copy numbers and polymorphisms of the rDNA operon estimated from single cell analysis of oligotrich and peritrich ciliates. Protist 164, 369–379. doi: 10.1016/j.protis.2012.11.006
Gran-Stadniczeñko, S., Egge, E., Hostyeva, V., Logares, R., Eikrem, W., and Edvardsen, B. (2019). Protist diversity and seasonal dynamics in skagerrak plankton communities as revealed by metabarcoding and microscopy. J. Eukaryot. Microbiol. 66, 494–513. doi: 10.1111/jeu.12700
Gu, Z., Eils, R., and Schlesner, M. (2016). Complex heatmaps reveal patterns and correlations in multidimensional genomic data. Bioinformatics 32, 2847–2849. doi: 10.1093/bioinformatics/btw313
Guillou, L., Bachar, D., Audic, S., Bass, D., Berney, C., Bittner, L., et al. (2012). The protist ribosomal reference database (PR2): a catalog of unicellular eukaryote small sub-unit rRNA sequences with curated taxonomy. Nucl. Acad. Res. 41, D597–D604. doi: 10.1093/nar/gks1160
Gypens, N., Lacroix, G., and Lancelot, C. (2007). Causes of variability in diatom and phaeocystis blooms in belgian coastal waters between 1989 and 2003: a model study. J. Sea Res. 57, 19–35. doi: 10.1016/j.seares.2006.07.004
Hörstmann, C., Raes, E. J., Buttigieg, P. L., Lo Monaco, C., John, U., and Waite, A. M. (2021). Hydrographic fronts shape productivity, nitrogen fixation, and microbial community composition in the southern indian ocean and the southern ocean (2021). Biogeoscience 18, 3733–3749. doi: 10.5194/bg-18-3733-2021
Illumina (2013). 16S Metagenomic Sequencing Library. 1–28. Available online at: http://support.illumina.com/content/dam/illuminasupport/documents/documentation/chemistry_documentation/16s/16s-metagenomic-library-prep-guide-15044223-b.pdf. (accessed March 15, 2020)
Jeong, H. J., du Yoo, Y., Kim, J. S., Seong, K. A., Kang, N. S., and Kim, T. H. (2010). Growth, feeding and ecological roles of the mixotrophic and heterotrophic dinoflagellates in marine planktonic food webs. Ocean Sci. J. 45, 65–91. doi: 10.1007/s12601-010-0007-2
Jones, H. L. J. (1997). A classification of mixotrophic protists based on their behaviour. Freshw. Biol. 37, 35–43. doi: 10.1046/j.1365-2427.1997.00138.x
Kase, L., Kraberg, A. C., Metfies, K., Neuhaus, S., Sprong, P. A. A., Fuchs, B. M., et al. (2020). Rapid succession drives spring community dynamics of small protists at helgoland roads, north sea. J. Plankton Res. 42, 305–319. doi: 10.1093/plankt/fbaa017
Lathi, L., and Shetty, S. (2017). Tools for Microbiome Analysis in R. Available online at: https://microbiome.github.io/tutorials/ (accessed November 20, 2022).
Lancelot, C., Spitz, Y., Gypens, N., Ruddick, K., Becquevort, S., Rousseau, V., et al. (2005). Modelling diatom and phaeocystis blooms and nutrient cycles in the southern bight of the north sea: the MIRO model. Mar. Ecol. Prog. Ser. 289, 63–78. doi: 10.3354/meps289063
Leles, S., Bruggeman, J., Polimene, L., Blackford, J., Flynn, K. J., and Mitra, A. (2020). Differences in physiology explain succession of mixoplankton functional types and affect carbon fluxes in temperate seas. Prog. Oceanogr. 190:102481. doi: 10.1016/j.pocean.2020.102481
Leles, S. G., Mitra, A., Flynn, K. J., Stoecker, D. K., Hansen, P. J., Calbet, A., et al. (2017). Oceanic protists with different forms of acquired phototrophy display contrasting biogeographies and abundance. Proc. R. Soc. B Biol. Sci. 284:20170664. doi: 10.1098/rspb.2017.0664
Leles, S. G., Mitra, A., Flynn, K. J., Tillmann, U., Stoecker, D., Jin, H., et al. (2019). Sampling bias misrepresents the biogeographical significance of constitutive mixotrophs across global oceans. Glob. Eco. Biogeo. 28, 418–428. doi: 10.1111/geb.12853
Leles, S. G., Polimene, L., Bruggeman, J., Blackford, J., Ciavatta, S., Mitra, A., et al. (2018). Modelling mixotrophic functional diversity and implications for ecosystem function. J. Plankton Res. 40, 627–642. doi: 10.1093/plankt/fby044
Lim, A. S., Jeong, H. J., and Ok, J. H. (2019). Five alexandrium species lacking mixotrophic ability. Algens 34, 289–301.
Lin, Y., Gifford, S., Ducklow, H., Schofield, O., and Cassara, N. (2018). Towards quantitative microbiome community profiling using internal standards. Appl. Environ. Microbiol. 85, 1–14. doi: 10.1128/AEM.02634-18
Mäki, A., Salmi, P., Mikkonen, A., Kremp, A., and Tiirola, M. (2017). Sample preservation, DNA or RNA extraction and data analysis for high-throughput phytoplankton community sequencing. Front. Microbiol. 8:1–13. doi: 10.3389/fmicb.2017.01848
Martínez, L. A., Mortelmans, J., Dillen, N., Debusschere, E., and Deneudt, K. (2020). LifeWatch observatory data: phytoplankton observations in the belgian part of the north sea. Biodivers. Data J. 8, 1–18. doi: 10.3897/BDJ.8.E57236
Masquelier, S., Foulon, E., Jouenne, F., Ferréol, M., Brussaard, C. P. D., and Vaulot, D. (2011). Distribution of eukaryotic plankton in the english channel and the north sea in summer. J. Sea Res. 66, 111–122. doi: 10.1016/j.seares.2011.05.004
Massana, R., Gobet, A., Audic, S., Bass, D., Bittner, L., Boutte, C., et al. (2015). Marine protist diversity in european coastal waters and sediments as revealed by high-throughput sequencing. Environ. Microbiol. 17, 4035–4049. doi: 10.1111/1462-2920.12955
Medlin, L. K., and Kooistra, W. H. (2010). Methods to estimate the diversity in the marine photosynthetic protist community with illustrations from case studies: a review. Diversity 2, 973–1014. doi: 10.3390/d2070973
Millette, N. C., Pierson, J. J., Aceves, A., and Stoecker, D. K. (2017). Mixotrophy in Heterocapsa rotundata: a mechanism for dominating the winter phytoplankton. Limnol. Oceanogr. 62, 836–845. doi: 10.1002/lno.10470
Millette, N. C., Stoecker, D. K., and Pierson, J. J. (2015). Top-down control by micro- and mesozooplankton on winter dinoflagellate blooms of Heterocapsa rotundata. Aquat. Microb. Ecol. 76, 15–25. doi: 10.3354/ame01763
Mitra, A., and Flynn, K. J. (2010). Modelling mixotrophy in harmful algal blooms: more or less the sum of the parts? J. Mar. Syst. 83, 158–169. doi: 10.1016/j.jmarsys.2010.04.006
Mitra, A., Flynn, K. J., Burkholder, J. M., Berge, T., Calbet, A., Raven, J. A., et al. (2014). The role of mixotrophic protists in the biological carbon pump. Biogeosciences 11, 995–1005. doi: 10.5194/bg-11-995-2014
Mitra, A., Flynn, K. J., Tillmann, U., Raven, J. A., Caron, D., Stoecker, D. K., et al. (2016). Defining planktonic protist functional groups on mechanisms for energy and nutrient acquisition: incorporation of diverse mixotrophic strategies. Protist 167, 106–120. doi: 10.1016/j.protis.2016.01.003
Mortelmans, J., Goossens, J. Amadei Martínez, L., Deneudt, K., Cattrijsse, A., and Hernandez, F. (2019a). LifeWatch observatory data: zooplankton observations in the Belgian part of the North Sea. Geosci. Data J. 6, 76–84. doi: 10.1002/gdj3.68
Mortelmans, J., Deneudt, K., Cattrijsse, A., Beauchard, O., Daveloose, I., Vyverman, W., et al. (2019b). Nutrient, pigment, suspended matter and turbidity measurements in the belgian part of the north sea. Sci. Data 6, 1–9. doi: 10.1038/s41597-019-0032-7
Muylaert, K., Gonzales, R., Franck, M., and Lionard, M. (2006). Spatial variation in phytoplankton dynamics in the belgian coastal zone of the north sea studied by microscopy, HPLC-CHEMTAX and underway fluorescence recordings. J. Sea Res. 55, 253–265. doi: 10.1016/j.seares.2005.12.002
Nohe, A., Gof, A., Tyberghein, L., Lagring, R., De Cauwer, K., Vyverman, W., et al. (2020). Marked changes in diatom and dinoflagellate biomass, composition and seasonality in the belgian part of the north sea between the 1970s and 2000s. Sci. Tot. Env. 716:136316. doi: 10.1016/j.scitotenv.2019.136316
Nohe, A., Knockaert, C., Goffin, A., Dewitte, E., De Cauwer, K., Desmit, X., et al. (2018). Marine phytoplankton community composition data from the belgian part of the north sea, 1968–2010. Sci. Date. 5, 1–9.
Oksanen, J., Blanchet, F. G., Kindt, R., Legendre, P., and Minchin, P. R. (2019). Package ‘vegan’. Commun. Ecol. Package 2, 1–295.
Passy, P., Gypens, N., Billen, G., Garnier, J., Thieu, V., Rousseau, V., et al. (2013). A model reconstruction of riverine nutrient fluxes and eutrophication in the belgian coastal zone since 1984. J. Mar. Syst. 128, 106–122. doi: 10.1016/j.jmarsys.2013.05.005
Piwosz, K., Shabarova, T., Pernthaler, J., Posch, T., Šimek, K., Porcal, P., et al. (2020). Bacterial and eukaryotic small-subunit amplicon data do not provide a quantitative picture of microbial communities, but they are reliable in the context of ecological interpretations. mSphere. doi: 10.1128/msphere.00052-20
Porter, K. G., and Feig, Y. S. (1980). The use of DAPI for identifying and counting aquatic microflora1. Limnol. Oceanogr. 25, 943–948. doi: 10.4319/lo.1980.25.5.0943
R Core Team (2018). R: A Language and Environment for Statistical Computing. Vienna: R Foundation for Statistical Computing.
Romano, F., Symiakaki, K., and Pitta, P. (2021). Temporal variability of planktonic ciliates in a coastal oligotrophic environment: mixotrophy, size classes and vertical distribution. Front. Mar. Sci. 8:641589. doi: 10.3389/fmars.2021.641589
Rousseau, V., Becquevort, S., Parent, J. Y., Gasparini, S., Daro, M. H., Tackx, M., et al. (2000). Trophic efficiency of the planktonic food web in a coastal ecosystem dominated by Phaeocystis colonies. J. Sea Res. 43, 357–372. doi: 10.1016/S1385-1101(00)00018-6
Rousseau, V., Leynaert, A., Daoud, N., and Lancelot, C. (2002). Diatom succession, silicification and silicic acid availability in belgian coastal waters (southern north sea). Mar. Ecol. Prog. Ser. 236, 61–73. doi: 10.3354/meps236061
Rousseau, V., Park, Y., Ruddick, K., Vyverman, W., Parent, J.-Y., and Lancelot, C. (2006). “Phytoplankton blooms in response to nutrient enrichment in curr,” in Status Eutrophication Belgian Coast. Zo, eds V. Rousseau, C. Lancelot, and D. Cox 45–59.
Santi, I., Kasapidis, P., Karakassis, I., and Pitta, P. (2021). A comparison of DNA metabarcoding and microscopy methodologies for the study of aquatic microbial eukaryotes. Diversity 13:180. doi: 10.3390/d13050180
Santoferrara, L. F. (2019). Current practice in plankton metabarcoding: optimization and error management. J. Plankton Res. 41, 571–582. doi: 10.1093/plankt/fbz041
Schneider, L. K., Flynn, K. J., Herman, P. M. J., Troost, T. A., and Stolte, W. (2020b). Exploring the trophic spectrum: placing mixoplankton into marine protist communities of the southern north sea. Front. Mar. Sci. 7:586915. doi: 10.3389/fmars.2020.586915
Schneider, L. K., Anestis, K., Mansour, J., Anschütz, A. A., Gypens, N., Hansen, P. J., et al. (2020a). A dataset on trophic modes of aquatic protists. Biodivers Data J. 8:e56648. doi: 10.3897/BDJ.8.e56648
Selosse, M. A., Charpin, M., and Not, F. (2017). Mixotrophy everywhere on land and in water: the grand écart hypothesis. Ecol. Lett. 20, 246–263. doi: 10.1111/ele.12714
Seong, K. A., Jeong, J. H., Kim, S., Hoon Kim, G., and Hoon Kang, J. (2006). Bacterivory by co-occurring red-tide algae, heterotrophic nanoflagellates, and ciliates. Mar. Ecol. Prog. Ser. 322, 85–97. doi: 10.3354/meps322085
Simon, M., and Azam, F. (1989). Protein content and protein synthesis rates of planktonic marine bacteria. Mar. Ecol. Prog. Ser. 51, 201–213. doi: 10.3354/meps051201
Stern, R., Kraberg, A., Bresnan, E., Kooistra, W. H. C. F., Lovejoy, C., Montresor, M., et al. (2018). Molecular analyses of protists in long-term observation programmes - current status and future perspectives. J. Plankton Res. 40, 519–536. doi: 10.1093/plankt/fby035
Stoeck, T., Bass, D., Nebel, M., Christen, R., and Meredith, D. (2010). Multiple marker parallel tag environmental DNA sequencing reveals a highly complex eukaryotic community in marine anoxic water. Mol. Ecol. 19, 21–31. doi: 10.1111/j.1365-294X.2009.04480.x
Stoecker, D. K. (1998). Conceptual models of mixotrophy in planktonic protists and some ecological and evolutionary implications. Eur. J. Protistol. 34, 281–290. doi: 10.1016/S0932-4739(98)80055-2
Stoecker, D. K., Hansen, P. J., Caron, D. A., and Mitra, A. (2017). Mixotrophy in the marine plankton. Ann. Rev. Mar. Sci. 9, 311–335. doi: 10.1146/annurev-marine-010816-060617
Stoecker, D. K., Johnson, M. D., De Vargas, C., and Not, F. (2009). Acquired phototrophy in aquatic protists. Aquat. Microb. Ecol. 57, 279–310. doi: 10.3354/ame01340
Strickland, J. D. H., and Parsons, T. R. (1972). A Practical Handbook of Seawater Analysis. Ottawa: Fisheries Research Board of Canada. 293.
Suzuki, M. T. (1999). Effect of protistan bacterivory on coastal bacterioplankton diversity. Aquat. Microb. Ecol. 20, 261–272. doi: 10.3354/ame020261
Taylor, J. D., and Cunliffe, M. (2014). High-throughput sequencing reveals neustonic and planktonic microbial eukaryote diversity in coastal waters. J. Phycol. 50, 960–965. doi: 10.1111/jpy.12228
Unrein, F., Gasol, J. M., Not, F., Forn, I., and Massana, R. (2014). Mixotrophic haptophytes are key bacterial grazers in oligotrophic coastal waters. ISME J. 8:132. doi: 10.1038/ismej.2013.132
van der Loos, L. M., and Nijland, R. (2021). Biases in bulk: DNA metabarcoding of marine communities and the methodology involved. Mol. Eco. 30, 3270–3288. doi: 10.1111/mec.15592
Vasselon, V., Bouchez, A., Rimet, F., Jacquet, S., Trobajo, R., Corniquel, M., et al. (2017). Avoiding quantification bias in metabarcoding: application of a cell biovolume correction factor in diatom molecular biomonitoring. Methods Ecol. Evol. 9, 1060–1069. doi: 10.1111/2041-210X.12960
Wang, J., Shen, J., Wu, Y., Tu, C., Soininen, J., Stegen, J. C., et al. (2013). Phylogenetic beta diversity in bacterial assemblages across ecosystems: deterministic versus stochastic processes. ISME J. 7, 1310–1321. doi: 10.1038/ismej.2013.30
Weiss, S., Xu, Z. Z., Peddada, S., Amir, A., Bittinger, K., Gonzalez, A., et al. (2017). Normalization and microbial differential abundance strategies depend upon data characteristics. Microbiology 5, 1–18. doi: 10.1186/s40168-017-0237-y
Weisse, T., Anderson, R., Arndt, H., Calbet, A., Hansen, P. J., and Montagnes, D. J. S. (2016). Functional ecology of aquatic phagotrophic protists – concepts, limitations, and perspectives. Eur. J. Protistol. 55, 50–74. doi: 10.1016/j.ejop.2016.03.003
Wickham, H. (2011). Ggplot2. wiley interdiscip. Rev. Comput. Stat. 3, 180–185. doi: 10.1002/wics.147
Wilken, S., Huisman, J., Naus-Wiezer, S., and Van Donk, E. (2013). Mixotrophic organisms become more heterotrophic with rising temperature. Ecol. Lett. 16, 225–233. doi: 10.1111/ele.12033
Xue, Y., Chen, H., Yang, J. R., Liu, M., Huang, B., and Yang, J. (2018). Distinct patterns and processes of abundant and rare eukaryotic plankton communities following a reservoir cyanobacterial bloom. ISME J. 2, 2263–2277. doi: 10.1038/s41396-018-0159-0
Zhu, F., Massana, R., Not, F., Marie, D., and Vaulot, D. (2005). Mapping of picoeukaryotes in marine ecosystems with quantitative PCR of the 18S rRNA gene. EMS Microb. Eco. 52, 79–92. doi: 10.1016/j.femsec.2004.10.006
Keywords: North Sea, 18S (SSU) rRNA gene, mixotrophy, seasonal succession, time-series, protists
Citation: Lapeyra Martin J, John U, Royer C and Gypens N (2022) Fantastic Beasts: Unfolding Mixoplankton Temporal Variability in the Belgian Coastal Zone Through DNA-Metabarcoding. Front. Mar. Sci. 9:786787. doi: 10.3389/fmars.2022.786787
Received: 30 September 2021; Accepted: 21 February 2022;
Published: 14 March 2022.
Edited by:
Alison Buchan, The University of Tennessee, Knoxville, United StatesReviewed by:
Sandi Orlic, Ruđer Bošković Institute, CroatiaTatiana A. Rynearson, University of Rhode Island, United States
Copyright © 2022 Lapeyra Martin, John, Royer and Gypens. This is an open-access article distributed under the terms of the Creative Commons Attribution License (CC BY). The use, distribution or reproduction in other forums is permitted, provided the original author(s) and the copyright owner(s) are credited and that the original publication in this journal is cited, in accordance with accepted academic practice. No use, distribution or reproduction is permitted which does not comply with these terms.
*Correspondence: Jon Lapeyra Martin, Sm9uLkxhcGV5cmEuTWFydGluQHVsYi5iZQ==