 Richard D. Pillans
 Gary C. Fry
 Geoff D. Carlin
 Toby A. Patterson
- 1CSIRO Oceans and Atmosphere, St Lucia, QLD, Australia
- 2CSIRO Oceans and Atmosphere, Hobart, TAS, Australia
The speartooth shark Glyphis glyphis is a Critically Endangered whaler shark known from a few tropical river systems in northern Australia and Papua New Guinea. There is limited genetic exchange in populations residing in northern Australian rivers that are greater than 100 km apart. In Queensland, the species is only found in the Wenlock and Ducie River that flow into Port Musgrave. Juveniles are confined to upstream reaches of these rivers with seasonal downstream movement related to freshwater influx. This region also supports commercial and recreational fisheries including crab pot and gillnet fisheries. Being obligate ram-ventilators, entrapment in crab pots results in mortality of bycaught speartooth sharks after a few hours. Following anecdotal reports of juvenile speartooth sharks being captured in crab pots, we investigated catch rates in crab pots experimentally and examined commercial fishing effort in the Wenlock and Ducie River from logbook data. Twenty four juvenile (55–80 cm TL) speartooth sharks were captured in experimental crab pots in the Ducie River and Tentpole Creek (a tributary of the Wenlock River) with catch rates high; up to 0.82 (±1.86 SD) sharks pot–1 day–1. Experimental catch rates in crab pots varied between rivers and with distance upstream and were highest in areas of highest shark density based on detection of acoustically tagged sharks over 7 years and line fishing catch per unit effort data. Although commercial crab effort varies spatially and temporally in relation to current catch rates and market demands, consistent monthly overlap with juvenile speartooth shark core distribution occurred throughout the year. Using CPUE data multiplied by fishing effort in Tentpole Creek, we estimate that in November alone, between 51 and 279 speartooth sharks are potentially captured in years with high fishing effort. Bycatch of juvenile speartooth sharks in commercial and recreational crab pots poses a significant threat to this genetically isolated and small population. Urgent management intervention to drastically reduce bycatch mortality either through gear modifications or spatial closures are required to ensure the viability of this population.
Introduction
Bycatch is the unintentional capture of non-target species during fishing as a result of low selectivity in fishing gear. It is a significant challenge to fishers and fishery managers around the globe (Suuronen et al., 2012) with approximately 10.8% of global fisheries catch classified as bycatch and the majority discarded back into the ocean (Perez Roda et al., 2019). Levels of discards are highly uncertain with under-reporting/no reporting an issue, that is exacerbated with threatened endangered and protected species due to rarity and or negative consequences for the fishery (Gray and Kennelly, 2018). Bycatch of threatened endangered and protected species in commercial fishing is a global issue with species such as sea birds, marine mammals, turtles, elasmobranchs, sea snakes and teleosts receiving considerable attention (Lewison et al., 2014; Oliver et al., 2015; Gray and Kennelly, 2018). There is evidence that bycatch may directly result in population declines and increase extinction risk of some species (Woodley and ELavigne, 1993; Dorcas et al., 2007; Campbell et al., 2008; Hatfield et al., 2011). Globally, there is a lack of data on bycatch of threatened endangered and protected species, with Gray and Kennelly (2018) noting that more effort is required to quantify interactions and reduce mortality.
Bycatch is a major threat to elasmobranch populations (Davies et al., 2009) with Perez Roda et al. (2019) estimating that approximately 10 million sharks were discarded annually. Elasmobranch populations are particularly susceptible to overfishing with Dulvy et al. (2014) estimating that one-quarter of all species are regarded as threatened by overfishing. Elasmobranch bycatch in pot fisheries has been reported in some studies (Brock et al., 2007; Öndes et al., 2018). Most elasmobranch species reported as bycatch in these fisheries rely on buccal pumping for respiration and as a result of this, survive for long periods in pots with the majority released alive.
Pots (also known as traps or creels) are widely used for catching crab, lobster, and some shrimp species (Miller, 1990). Pots are generally assumed to be more environmentally friendly fishing gear due to their associated low energy use (compared with towed mobile fishing gear), minimal habitat impact (e.g., Eno et al., 2001; Coleman et al., 2013), high selectivity (in terms of species and size) and a relatively high rate of bycatch survival (Jennings and Kaiser, 1998; Furevik et al., 2008). However, the capture and mortality of highly endangered species in pots can cause population declines even when only a few individuals are captured. Lobster, crab, and fish pots increase extinction risk in terrapins, sea lions, and sea otters (Dorcas et al., 2007; Campbell et al., 2008; Hatfield et al., 2011).
Speartooth Sharks
River sharks (Glyphis spp.) are known from a few rivers and coastal areas in northern Australia (Pillans et al., 2009) and coastal areas of Papua New Guinea (White et al., 2015). In Australia, there are two species, the speartooth shark Glyphis glyphis and the northern river shark G. garricki. There is strong evidence of female philopatry in speartooth sharks that results in population structuring even between populations in river systems in the Northern Territory that are <150 km apart (Feutry et al., 2015, 2017). In Queensland, the speartooth shark was originally described from the Bizant River, however the species is presumed extirpated from that system (Pillans et al., 2009) and is now only known from the Wenlock and Ducie River that flow into Port Musgrave. This “Wenlock River” population is completely genetically isolated from other known populations in the Northern Territory and Papua New Guinea (Feutry et al., 2017) and therefore represents the only known population in Queensland. Juvenile speartooth sharks in the Wenlock River have been shown to have specific habitat requirements and move downstream in response to increasing environmental flows during the monsoon and upstream once freshwater influx slows (Lyon et al., 2017). The Speartooth shark is listed as threatened “Critically Endangered” under Australian Commonwealth legislation (Environment Protection and Biodiversity Conservation Act, 1999; EPBC Act). In Australia, species listed under EPBC legislation are not allowed to be retained and all interactions with fisheries must be reported in fisheries logbooks.
Mud Crab Fishery
In Queensland, mud crabs (genus Scylla) are captured in either round or rectangular trawl-mesh (nylon) collapsible traps or rectangular wire mesh crab pots, with most commercial operators using round trawl mesh pots with four side entrances. Pots are usually deployed for up to 24 h before being re-baited or moved. In Queensland, the mud crab fishery is characterised by both intense effort and high catches, with the harvest greater than all other Australian mud crab fisheries combined (DAF, 2021). The commercial catch in 2017 was estimated at 863 tonnes with approximately 37,000 fishing days per year (DAF, 2021). There is also significant recreational harvest in Queensland with an estimated 339 tonnes taken in 2013; approximately 25% of the commercial harvest in that year (DAF, 2021).
Anecdotal information from recreational fishers targeting mud crabs with crab pots in the Wenlock River suggests that juvenile speartooth sharks are captured as bycatch (Lyon et al., 2017; Pillans, Pers. Obs.). While recreational fishers are not required to report their catches, commercial operators are required to report interactions with species of conservation interest (SOCI) within designated logbooks. There are no records of speartooth sharks in SOCI logbook data within the commercial mud crab fishery (Walton and Jacobsen, 2019). however, based on evidence of juvenile speartooth sharks within recreational crab pots the species was included in the risk assessment for the crab fisheries in Queensland (Walton and Jacobsen, 2020) where it was classified as high risk with a recommendation to improve data on interactions with both the commercial and recreational crab fishery and identify mechanisms to minimise speartooth shark interactions.
Given the lack of reporting and observer coverage in the Wenlock and Ducie River, we set out to quantify the catch rates of speartooth sharks in crab pots of the same configuration and set location of commercial and recreational crab pots and quantify commercial and recreational fishing effort in relation to the spatial distribution of juvenile speartooth sharks in the Wenlock and Ducie River. The specific objectives of this research were:
(1) Determine whether speartooth sharks enter crab pots used by commercial fishers.
(2) Examine the influence of pot type using four configurations used by commercial and recreational fishers.
(3) Examine the influence of distance upstream on catch rates of speartooth sharks in the wet and dry season.
(4) Examine the extent of overlap between the core distribution of speartooth sharks and spatial data of commercial and recreational fishing effort.
(5) Estimate expected catches of speartooth sharks using CPUE data for the months and sections of river where data were available.
As experimental CPUE data was gathered only in November and March, and from specific regions of the river system, we chose not to extrapolate to other months and or sections of river where data was not available.
Materials and Methods
Study Site
The Wenlock and the Ducie River drain into Port Musgrave, a coastal embayment in the eastern Gulf of Carpentaria (Figure 1). There is limited anthropogenic activity within the catchment with freshwater influx during the annual monsoon and hydro-ecological flows fed by perennial sandstone and bauxite springs (Leblanc et al., 2015). Commercial and recreational fishing occurs in the tidal reaches of both rivers and bauxite mining and mining exploration leases overlap with both catchments (accessed 21/7/21).1
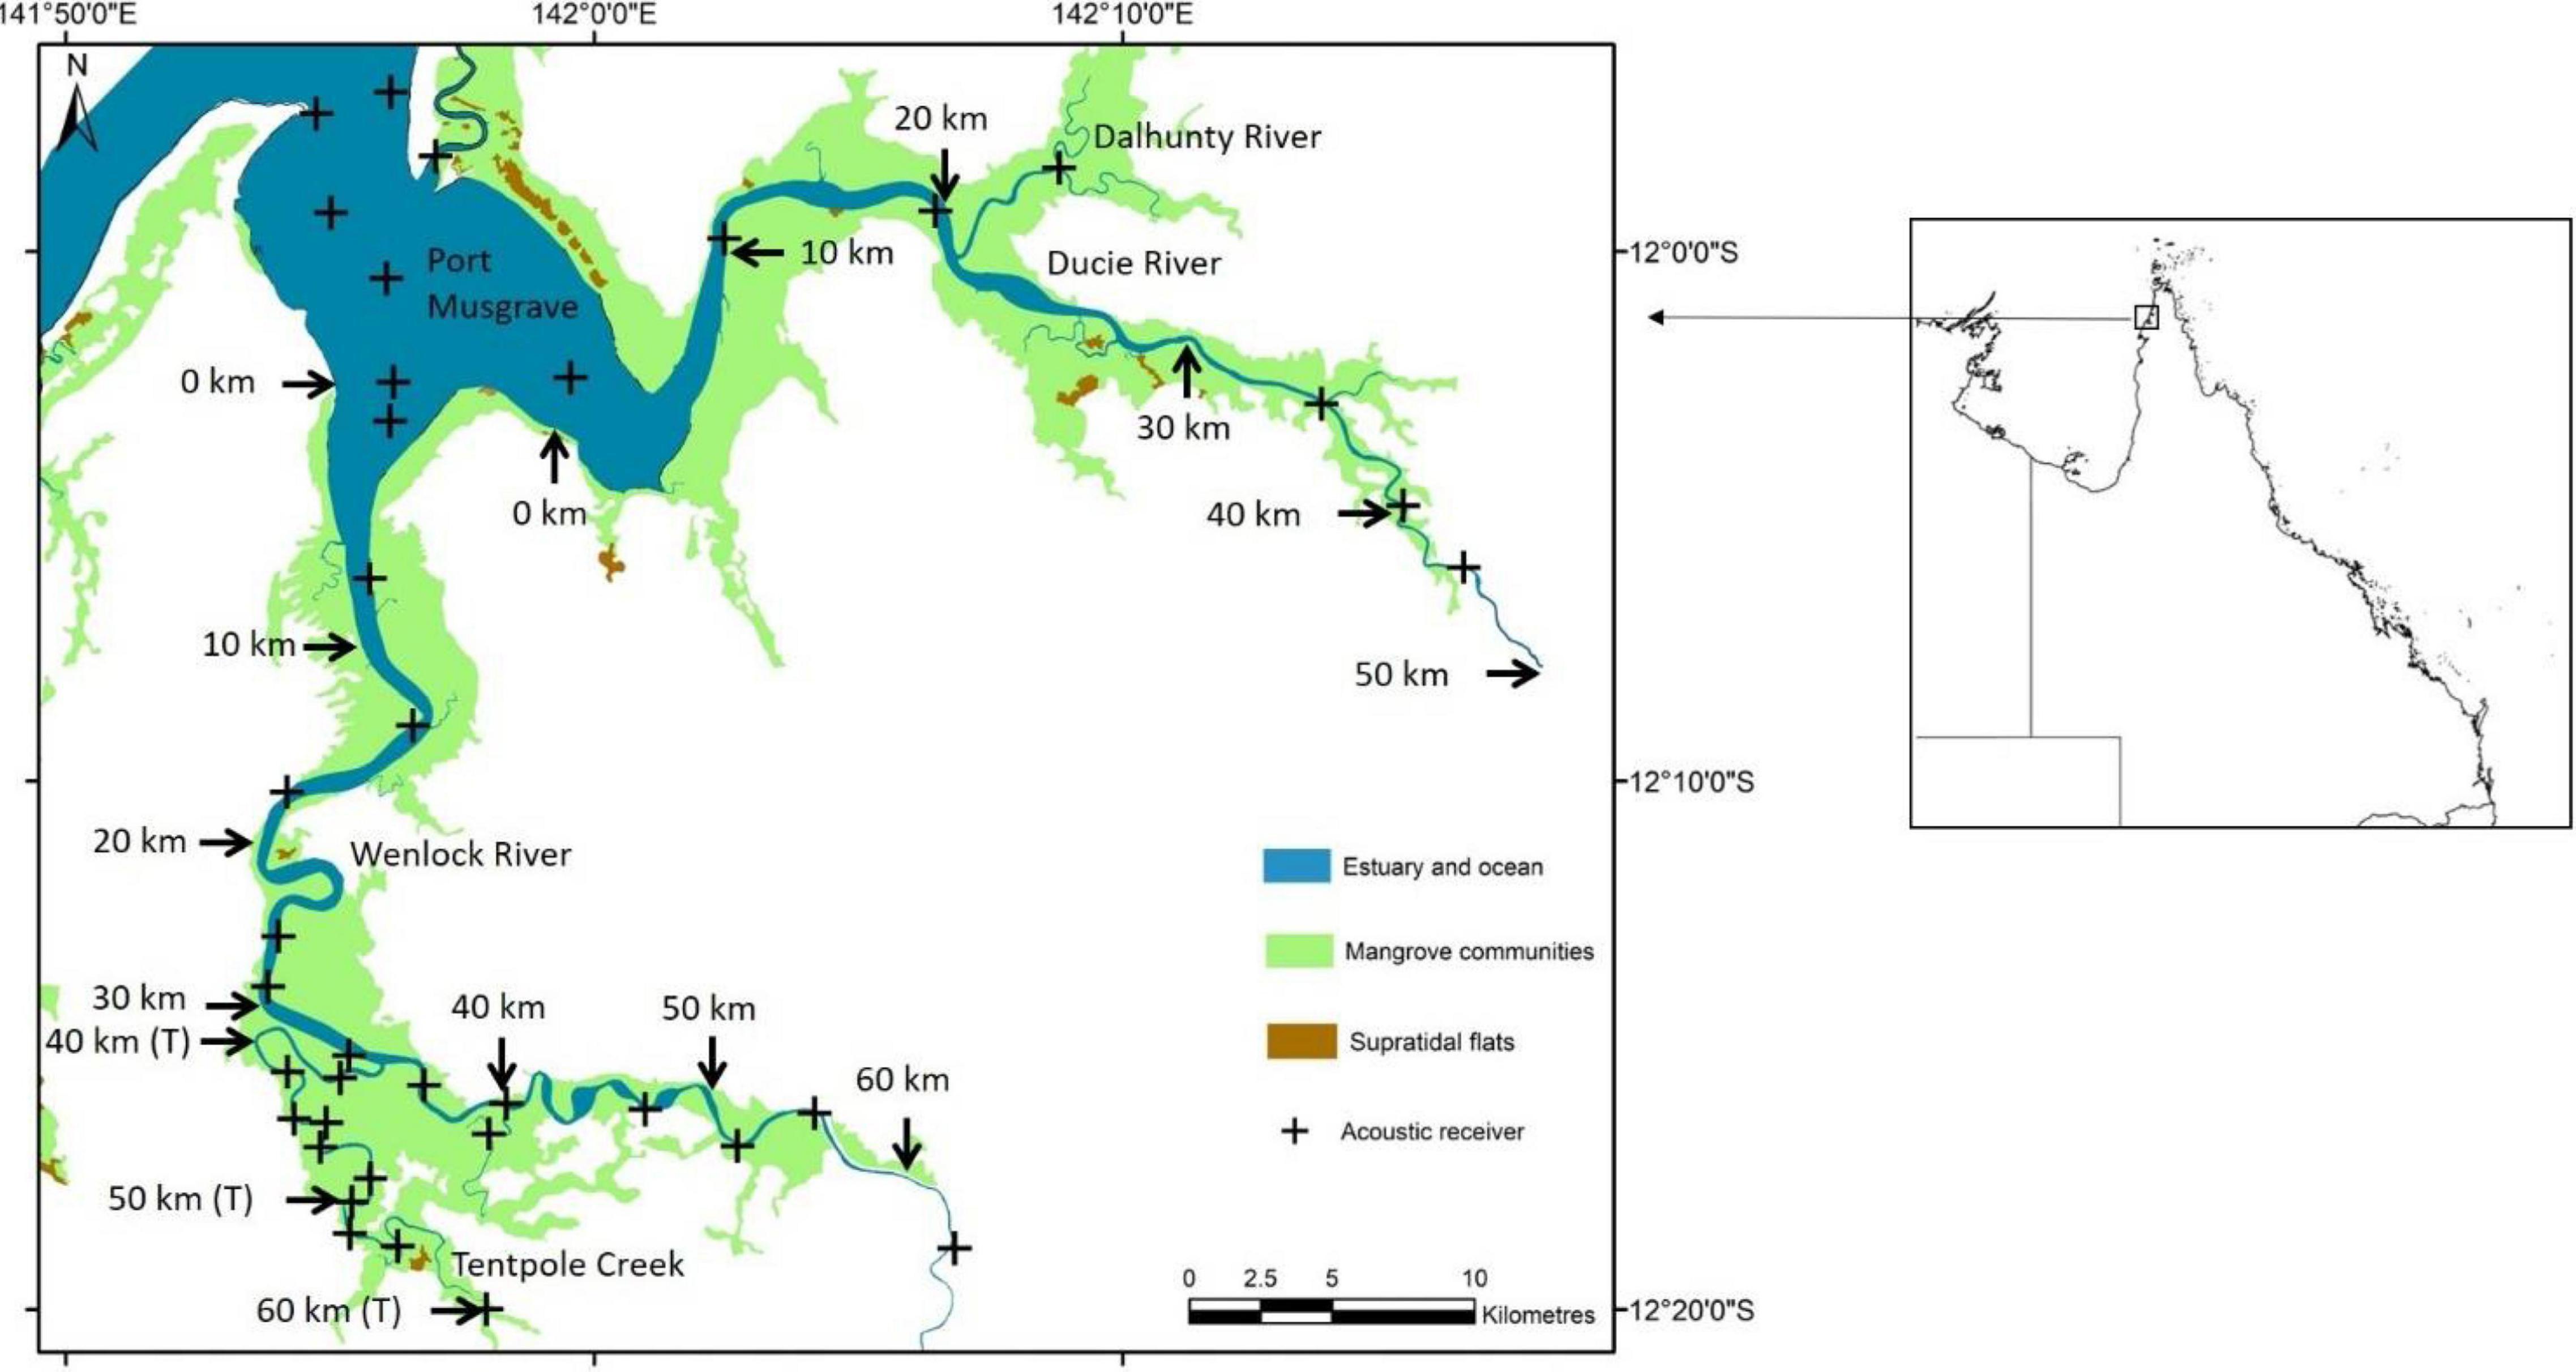
Figure 1. Location of 37 acoustic receivers in the Wenlock and Ducie River, Tentpole Creek and Port Musgrave. Arrows and distance upstream (kilometres from the mouth) the Wenlock and Ducie River is shown. The distance upstream in Tentpole Creek (from the mouth of the Wenlock River) is also shown with “T” in parenthesis after distance.
Vemco acoustic receivers (VR2W and VR2AR) were deployed in Port Musgrave (n = 6) and in the main branch and tributaries of the Wenlock (n = 24) and Ducie River (n = 7). The majority of receivers were deployed permanently between August 2013 and December 2020 with seven receivers added to the array in November 2018 to improve coverage of Tentpole Creek and the upper reaches of the Ducie River. In the Wenlock River, 14 receivers spanned 64 km of river and were placed approximately 5 km apart with at least two receivers every 10 km. In Tentpole creek, 10 receivers spanned 27 km of river with up to five receivers per 10 km (Figure 1). In the Ducie River, receivers spanned 45 km with fewer receivers due to lower catch rates of speartooth sharks in this system.
Tagging
Most sharks previously captured in crab pots were less than 92 cm TL and Lyon et al. (2017) demonstrated differences in movement of speartooth sharks based on size. Since we were primarily interested in the distribution of these small size classes, we investigated the spatial distribution of sharks estimated to be less than 2 years old (∼92 cm TL) using acoustic telemetry. This distribution information enabled estimation of the degree of overlap between juvenile sharks and commercial and recreational fishing operations. Speartooth sharks were captured with rod and line between 15 and 55 km from the mouth of the Wenlock and Ducie River. We used 5/0 circle hooks attached to ∼20 cm of plastic coated wire and 15 kg braided line. Animals without any external signs of injury and in good condition were tagged internally with a Vemco V13 (age-zero) or V16 (age-one) acoustic tag. The ping frequency was 60 s with V13 and V16 tags having a battery life of 3 and 10 years, respectively. Tagging methods were identical to those described by Lyon et al. (2017) and carried out under CSIRO animal ethics permits (CSIRO AEC # A2/2016; 2017-04; 2020-22).
Tagged animals were assigned an age-class of either 0 or 1 based on their length and presence of umbilical scars. Based on the presence of open umbilical scars, speartooth sharks are born between September and mid-November (Pillans, unpublished data). Using recapture data of neonates tagged in November–December and recaptured up to 12 months later, average (±SD) annual growth of neonates in their first year was 16 (±8) cm year–1 (CSIRO, unpublished data). Using this data combined with presence/absence of umbilical scars, we assigned animals to either age-zero (54.0–80.0 cm TL) or age-one (80.1–92.0 cm TL). Most age-zero animals (85%) were tagged in November/December and had an umbilical scar. The remaining age-zero animals were captured in April, May, June, or August and were assigned an age class based on their month and length at capture. The majority (75%) of animals assigned to age one were captured in November-December and had no umbilical scar and were less than 92 cm TL. The remaining animals were tagged in May, July, and August and assigned based on month and length at capture.
To estimate if animals were age 0–1 or 1–2 when detected we assigned all sharks a birth date of 15 October in the year they were born. Their age when detected is then a product of their estimated age when tagged and the number of days since born. For example, for a shark tagged in November 2014 and classified as an age zero (0–1 year old), this individual would be assigned to age class zero until 15 October 2015 and age class one (1–2 year old) until 15 October 2016. This enabled us to assign each individual with an estimated age of detection and only sharks aged between 0 and 2 years old were included in the analysis.
Animals without any external signs of injury and in good condition were tagged internally with a Vemco V13 (age-zero) or V16 (age-one) acoustic tag.
Movement of Tagged Sharks
Tagged sharks were monitored by acoustic receivers between 4 August 2013 and 6 December 2020. The distance of each receiver from the mouth of the Wenlock (−12.041S, 141.937E) or Ducie River (−12.037S, 141.989E) was calculated in ArcGIS 10.1 (ESRI) using satellite imagery of the region. Distance outside the Wenlock or Ducie River mouth (into Port Musgrave) was calculated by calculating the shortest pathway by water to the receiver/s. Mean daily distance upstream for each individual was calculated from the detection of sharks on receivers at known distance from the mouth of the Wenlock or Ducie. Distance upstream relates to the mouth of the respective river in which the detection occurred. Daily river flow data for the Wenlock River were obtained from the Queensland Government Department of Natural Resources and Mines water gauge located at Moreton Station (station 027015; S12.45°, E142.64°), approximately 170 km upstream of the Mouth of the Wenlock River.
Relative Density of Sharks Between Rivers and Tributaries
Line fishing surveys for speartooth sharks have been conducted annually in November–December since 2013. Catch per unit effort (CPUE) of speartooth sharks less than 2 year old was used to compare relative abundance of sharks in Tentpole Creek and the Wenlock and Ducie River and enable comparisons with CPUE of sharks captured using crab pots. Seasonal differences in relative density of speartooth sharks between rivers and tributaries was examined by comparing the number of acoustically tagged sharks (<2 year old) detected per month by receivers in Tentpole Creek and the Wenlock and Ducie River between August 2013 and December 2020.
Catch Rates of Speartooth Sharks in Pots
Round collapsible, trawl mesh crab pots of the type employed by commercial operators were obtained from a commercial supplier (Supplementary Figure 1A). Pots were 90 cm in diameter, 45 cm high and covered with 45 mm square trawl mesh and had four side entrances. Commercial operators in the Wenlock and Ducie River use a combination of mesh bait bags or bait held within containers made from 90 mm PVC tube and approximately 10–15 cm long with end caps and ∼20 × 10 mm holes throughout. Mesh bags are sewn into the bottom of the crab pot and enable the crab to physically consume the bait whereas bait within PVC tubes cannot be accessed by crabs and holes in the PVC allow scent to permeate. Some fishers also used a ∼15 mm length of 90 mm diameter PVC tube sewn into the bottom of the pot that is intended as an escape vent for small crabs and sharks. We incorporated PVC bait holders, mesh bait holders and PVC escape vents into 50 crab pots resulting in four pot configurations. The number in parenthesis represents the number of each configuration that we had to deploy.
(1) Mesh bait bag, no escape vent (n = 12).
(2) Mesh bait bag, PVC escape vent (n = 13).
(3) PVC bait holder, PVC escape vent (n = 12).
(4) PVC bait holder, no escape vent (n = 13).
Crab pots were baited with a combination of mullet (Mugil spp.), catfish (Arius spp.), and blue salmon (Eleutheronema tetradactylum) that were cut into pieces. Pots were set approximately 200 m apart parallel to the bank on both sides of the river in water depth ranging from 1 to 6 m. Pots were checked at least once every 2 h with any sharks measured and sexed before being released. Crabs were measured and released on the final check of the day when pots where removed. The location of each pot was recorded with GPS that enabled each set to be assigned to the stretch of river that corresponded to a distance upstream from the river mouth. Catch rates of speartooth sharks (sharks per hour) in each 10 km stretch or river was calculated for the Wenlock River, Tentpole Creek, and the Ducie River.
Commercial and Recreation Fishing Effort
Data on commercial fishing effort was obtained courtesy of the State of Queensland, Australia through the Department of Agriculture and Fisheries. Logbook data (catch and effort) was provided at six nautical mile resolution for the entire catchment of the Ducie and Wenlock River and Port Musgrave from 1993 to 2020. Effort data was provided as number of pot lifts per day with each pot lift equivalent to approximately 24 h of soak (fishing) time. To enable comparison with experimental crab pot in each 10 km stretch of river commercial effort was calculated in each 10 km stretch from the mouth of the Wenlock and Ducie River. Estimates of effort at 10 km increments upstream of the mouth of the Wenlock and Ducie River was calculated by determining the proportion of each six nautical mile grid cell that covered each 10 km stretch of river. Some 6 nm grids covered more than one 10 km stretch. To estimate fishing effort in 10 km sections of river (from the mouth to 60 km upstream in the Wenlock River, Tentpole creek, and Ducie River), we multiplied effort in that grid by the proportion of each 10 km stretch it covered. For example, if there were 100 pots in a six nautical mile grid that encompassed 80% of the 10–20 km and 20% of the 20–30 km stretch of river, effort in the 10–20 and 20–30 km stretch was estimated at 80 and 20 pots, respectively.
Recreational Crab Fishing Effort
To estimate effort, in April 2017, November 2017, November 2018, November 2019, and March 2020, all commercial and recreational crab pots in the Wenlock and Ducie River (and their tributaries) were counted by driving from the mouth to 65 km upstream. Pots on both sides of the river were counted using two vessels. The location of each pot and whether it was a commercial or recreational pot was recorded. Commercial crab and recreational crab pots were identified by markings on the float. Commercial operators have their licence symbol on the float whereas recreational fishers must have their name and address on the float.
Estimates of Speartooth Sharks Captured in Commercial and Recreational Crab Pots
Total monthly effort in each 10 km stretch of river was used to estimate bycatch of speartooth shark catches in each year (1993–2020). Since our estimates of CPUE were only from November and March we have only attempted to estimate catches in these months. No sharks were captured in March, so we only estimated bycatch CPUE in November. For bycatch estimates in commercial pots we used:
We used both the mean CPUE in that stretch of river (all pot types combined) as well the mean CPUE of pots with a PVC bait container (pot type 3 and 4). Commercial operators use a variety of pot configurations, however, PVC bait holders were used by at least two commercial operators. For bycatch estimates in recreational pots, we multiplied the mean, minimum and maximum observed effort (number of pots) in each 10 km stretch of river in November by the corresponding CPUE. Recreational fishers primarily used mesh bait bags so we used the mean CPUE of pots with mesh bait bags to estimate catches. CPUE in commercial and recreational pots was not standardised as pot types were very similar.
If no speartooth sharks were captured in our experimental sets within a section of river, we assumed CPUE was zero and our estimated catch in either commercial or recreational pots for that stretch of river was zero. Our estimates are therefore a highly conservative minimum estimate of catch rates and we did not attempt to extrapolate catches beyond the months or sections of river that we captured sharks in experimental sets.
Overlap of Commercial Fishery With Speartooth Distribution
To investigate long term overlap of the commercial fishery with speartooth shark distribution we plotted the average daily distance upstream for 224 speartooth sharks estimated to be less than 2 years that were tagged and monitored by receivers in the Wenlock and Ducie River and tributaries between 2013 and 2020. Commercial fishing effort (pot lifts) was calculated for each 10 km stretch of river in each month between 2013 and 2020. The fishing effort in the 10 km stretch of river that sharks occupied during that month/year was plotted to get an estimate of fishing effort within the core distribution of sharks in that month. For example, in April 2013, tagged speartooth sharks were on average 30–40 km upstream and in that month in that section of river, 1,360 pot lifts were reported.
Results
Space Use of Tagged Sharks
Between 1 August 2013 and 6 December 2020, 224 juvenile speartooth sharks assumed to be less than 2 years old were tagged and monitored by an array of receivers. Sharks were tagged 15–55 km upstream in the Wenlock and Ducie River and Tentpole Creek (Figure 1). Sharks ranged in size from 52 to 91 cm TL with average size of 68.4 (±8.9) cm TL. There was no difference in size of males and females (Two Sample T-test, p = 0.54) and the sex ratio was 1:1.05 (M:F). There were 408,919 detections of tagged sharks on 37 receivers ranging from ∼6 km seaward of the Wenlock River mouth (in Port Musgrave) to 62 km upstream in the Wenlock River and 45 km upstream in the Ducie River.
The mean daily distance upstream for sharks estimated to be between 0 and 2 years in Tentpole Creek and the Wenlock and Ducie River as well as mean daily flow [cumecs (m3 s–1)] in the Wenlock River is shown in Figure 2A. Only two sharks were tagged in the Ducie River, resulting in fewer detections although some sharks tagged in Tentpole Creek and the Wenlock River were detected in the Ducie River during periods of high flow. During periods of no flow, sharks were between 40 and 50 km upstream. During the annual wet season with high flow events greater than 200 cumecs between January and April, sharks moved rapidly downstream with animals recorded in Port Musgrave (up to 6 km seaward of the Wenlock and Ducie River Mouth). Between January to May and depending on the strength and duration of flow, sharks were 10–40 km upstream (Figure 2A) with rapid movement downstream and upstream corresponding to increase and decrease in flow. Tentpole Creek flows into Wenlock River 34 km upstream of the Mouth, resulting in animals not being detected in Tentpole during periods of high flow when animals move downstream. During the crab pot experiment period in November 2019, tagged sharks were 40–52 km upstream whereas during the March 2020 survey, sharks were 10–25 km upstream. Experimental crab pot effort overlapped core shark distribution during the surveys and was highest in the regions of highest use (Figure 2B).
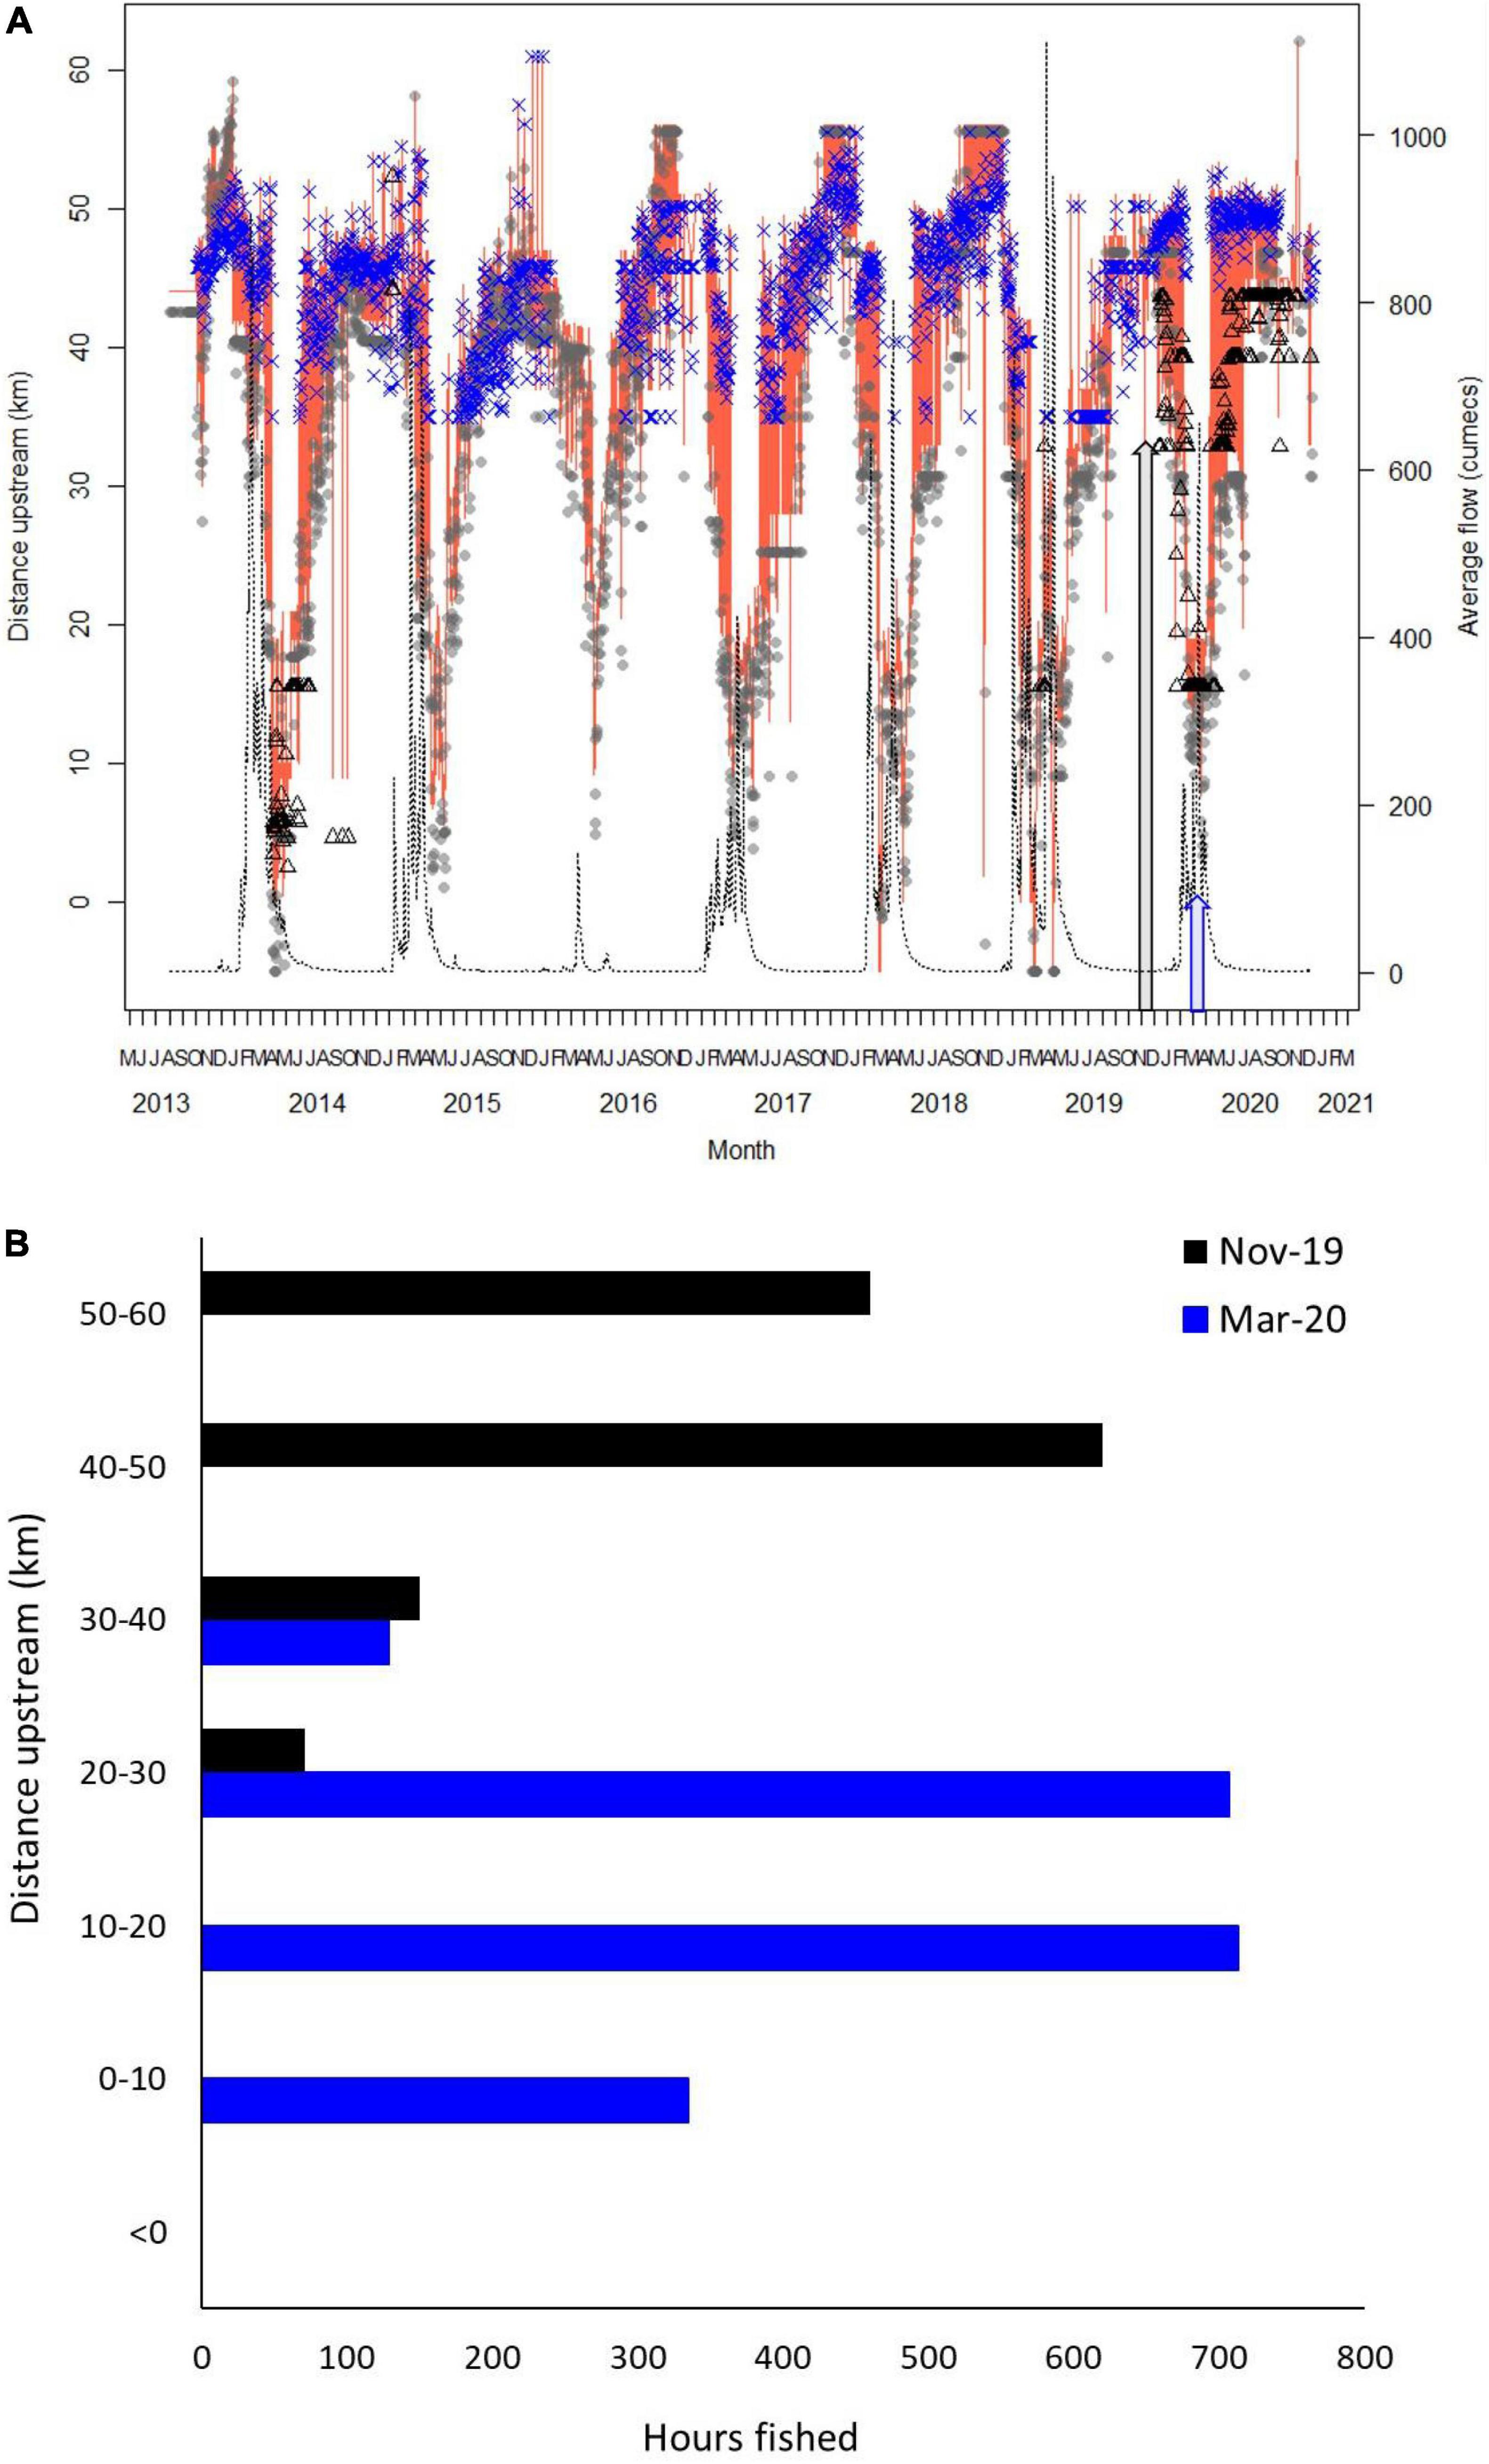
Figure 2. (A) Mean daily distance upstream of 0–2 year old speartooth sharks between August 2013 and December 2020. Grey dots show mean distance of sharks in the Wenlock River from Wenlock River mouth. Blue crosses show mean distance of sharks in Tentpole Creek (a tributary of the Wenlock River that branches off 34 km upstream from mouth of Wenlock River). Black triangles show mean distance upstream in the Ducie River. Orange line shows average distance upstream of all rivers/tributaries combined. Black line shows mean daily flow (cumecs). Grey arrow shows November 2019 and blue arrow March 2020 when experimental crab fishing occurred. (B) Total fishing time of crab pots in each 10 km stretch of river from the mouth to 50–60 km upstream during the November 2019 and March 2020 crab experiments. Rivers and tributaries are combined.
Relative Density of Sharks
Relative density of juvenile speartooth sharks was highest in Tentpole Creek during the late dry season with experimental line fishing CPUE 4.5 times greater than the Wenlock River and 11.3 times greater than the Ducie River (Figure 3A). Similarly, from May to January, up to four times more sharks were detected on receivers in Tentpole Creek and with more animals detected in the Wenlock River between February and April (Figure 3B).
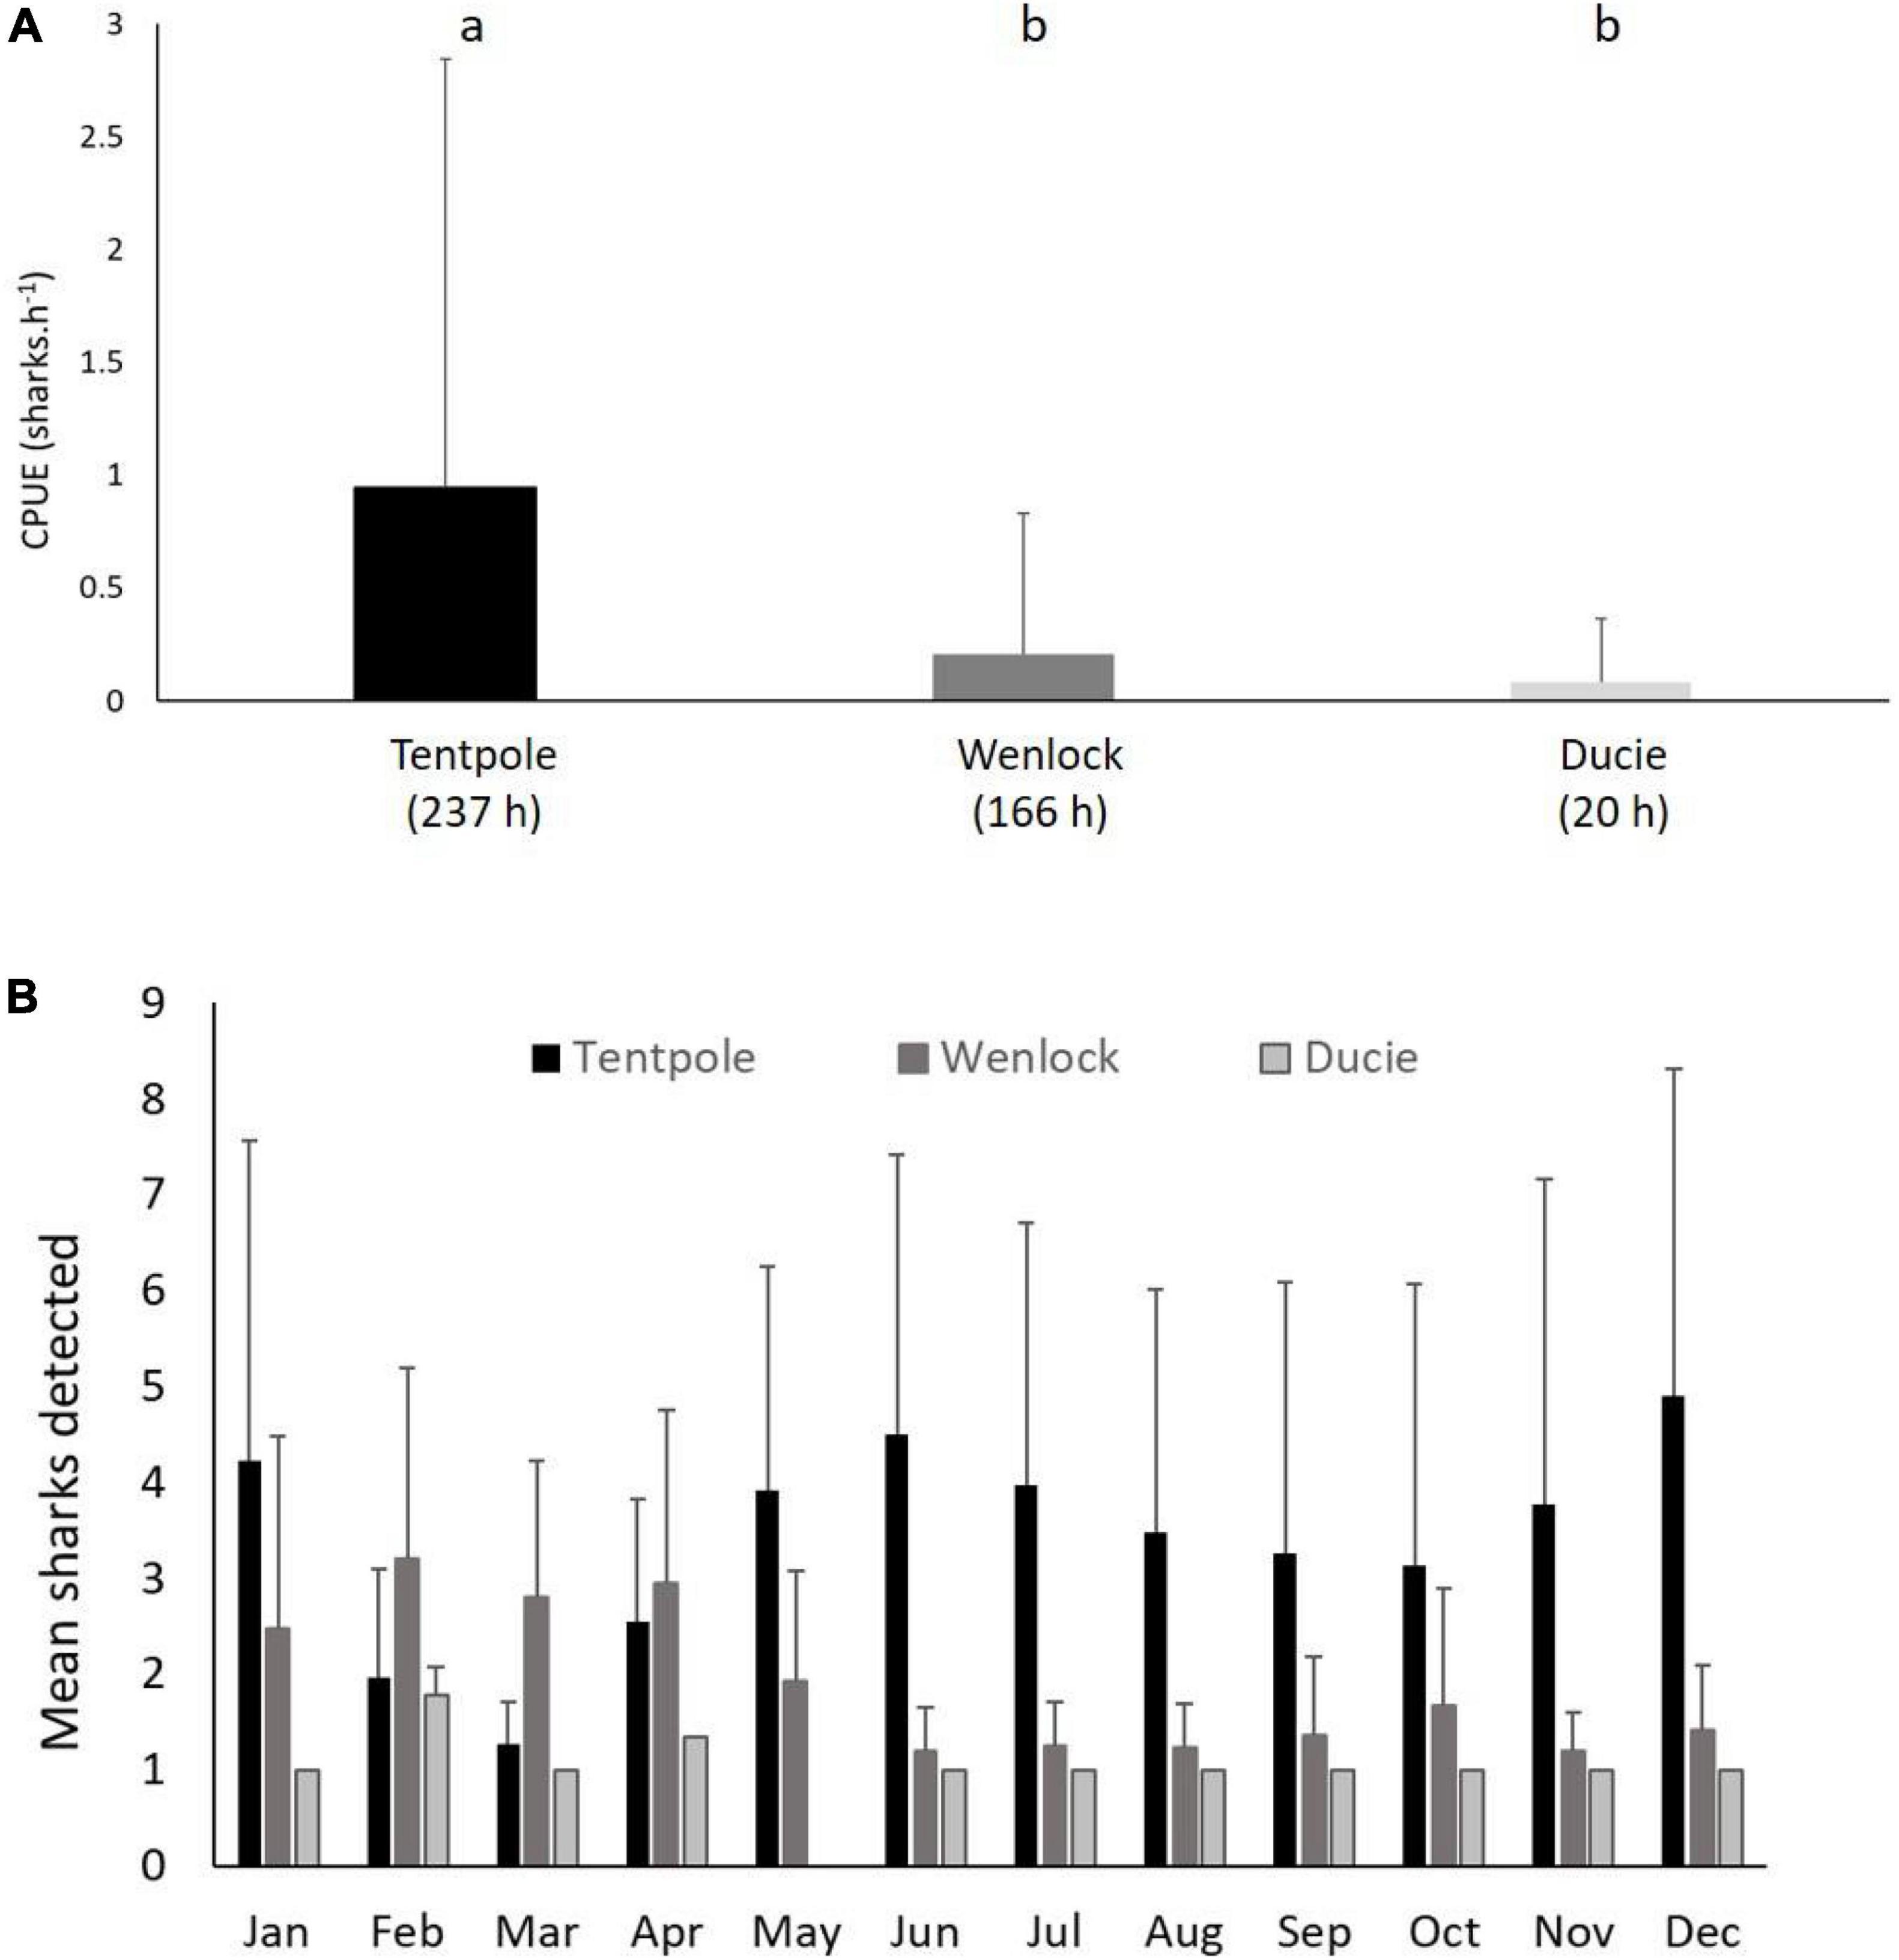
Figure 3. (A) Mean (+SD) catch rate of juvenile speartooth sharks (<92 cm TL) from line fishing surveys in November and December within Tentpole Creek, Wenlock River and Ducie River between 2013 and 2020. Letters denote significance of Tukey’s HSD test, p < 0.01). (B) Mean (+SD) number of tagged sharks (age 0–2) detected in Tentpole Creek, Wenlock River, and Ducie River in each month of the year between August 2013 and December 2020.
Fishery Independent Catch per Unit Effort of Speartooth Sharks in Crab Pots
During the dry season (November 2019), crab pots were set 20–60 km upstream in the Wenlock River, Tentpole Creek, and the Ducie River with a combined soak time of 1301 h and more effort in Tentpole Creek and the Wenlock River than the Ducie River (Table 1). In the wet season (March 2020), crab pots were set 0–40 km upstream in the Wenlock and Ducie River with a total soak time of 1944.3 h and more effort in the Wenlock River than the Ducie River (Table 1). There was a high degree of overlap between distribution of tagged sharks and experimental fishing effort in both November 2019 and March 2020 surveys (Figures 2A,B).
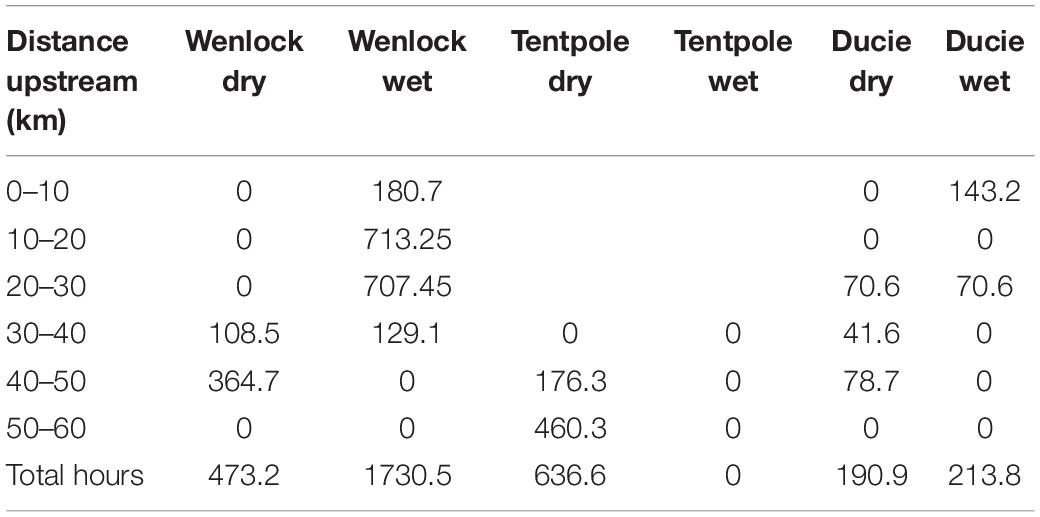
Table 1. Hours fished by experimental crab pots in each section of the Wenlock River, Tentpole Creek, and the Ducie River during November 2019 (dry season) and March 2020 (wet season).
No speartooth sharks were captured during the wet season surveys. In November 2019, 24 speartooth sharks were captured in crab pots set in Tentpole Creek and the Ducie River. One shark was captured 40–50 km upstream in the Ducie River and 23 sharks were captured 40–60 km upstream in Tentpole Creek. No sharks were captured in the Wenlock River in November 2019. Average size of sharks captured in the crab pots was 65.4 cm TL (±8.1 SD) with equal number of males and females and no difference in the size of sexes (Two sample T-test, p = 0.45). One shark was classified as being between 1 and 2 years old based on size and lack of umbilical scar when captured in November 2019. All other sharks had open umbilical scars and were classified as <1 year old.
There were significant differences in the catch rates of speartooth sharks (sharks pot–1 24 h–1) in the river and tributaries sampled (One Way ANOVA, F = 9.4, p = 0.0002). Average catch rates of speartooth sharks in Tentpole Creek (0.82 ± 1.86 sharks pot–1 24 h–1) were significantly higher than catch rates in the Ducie River (0.12 ± 0.83 sharks pot–1 24 h–1: One Way ANOVA, F = 9.4, p = 0.0002; Figure 4A). Catch rates in the Ducie River were not significantly different to those in the Wenlock River (no catch) (One Way ANOVA, F = 9.4, p = 0.86).
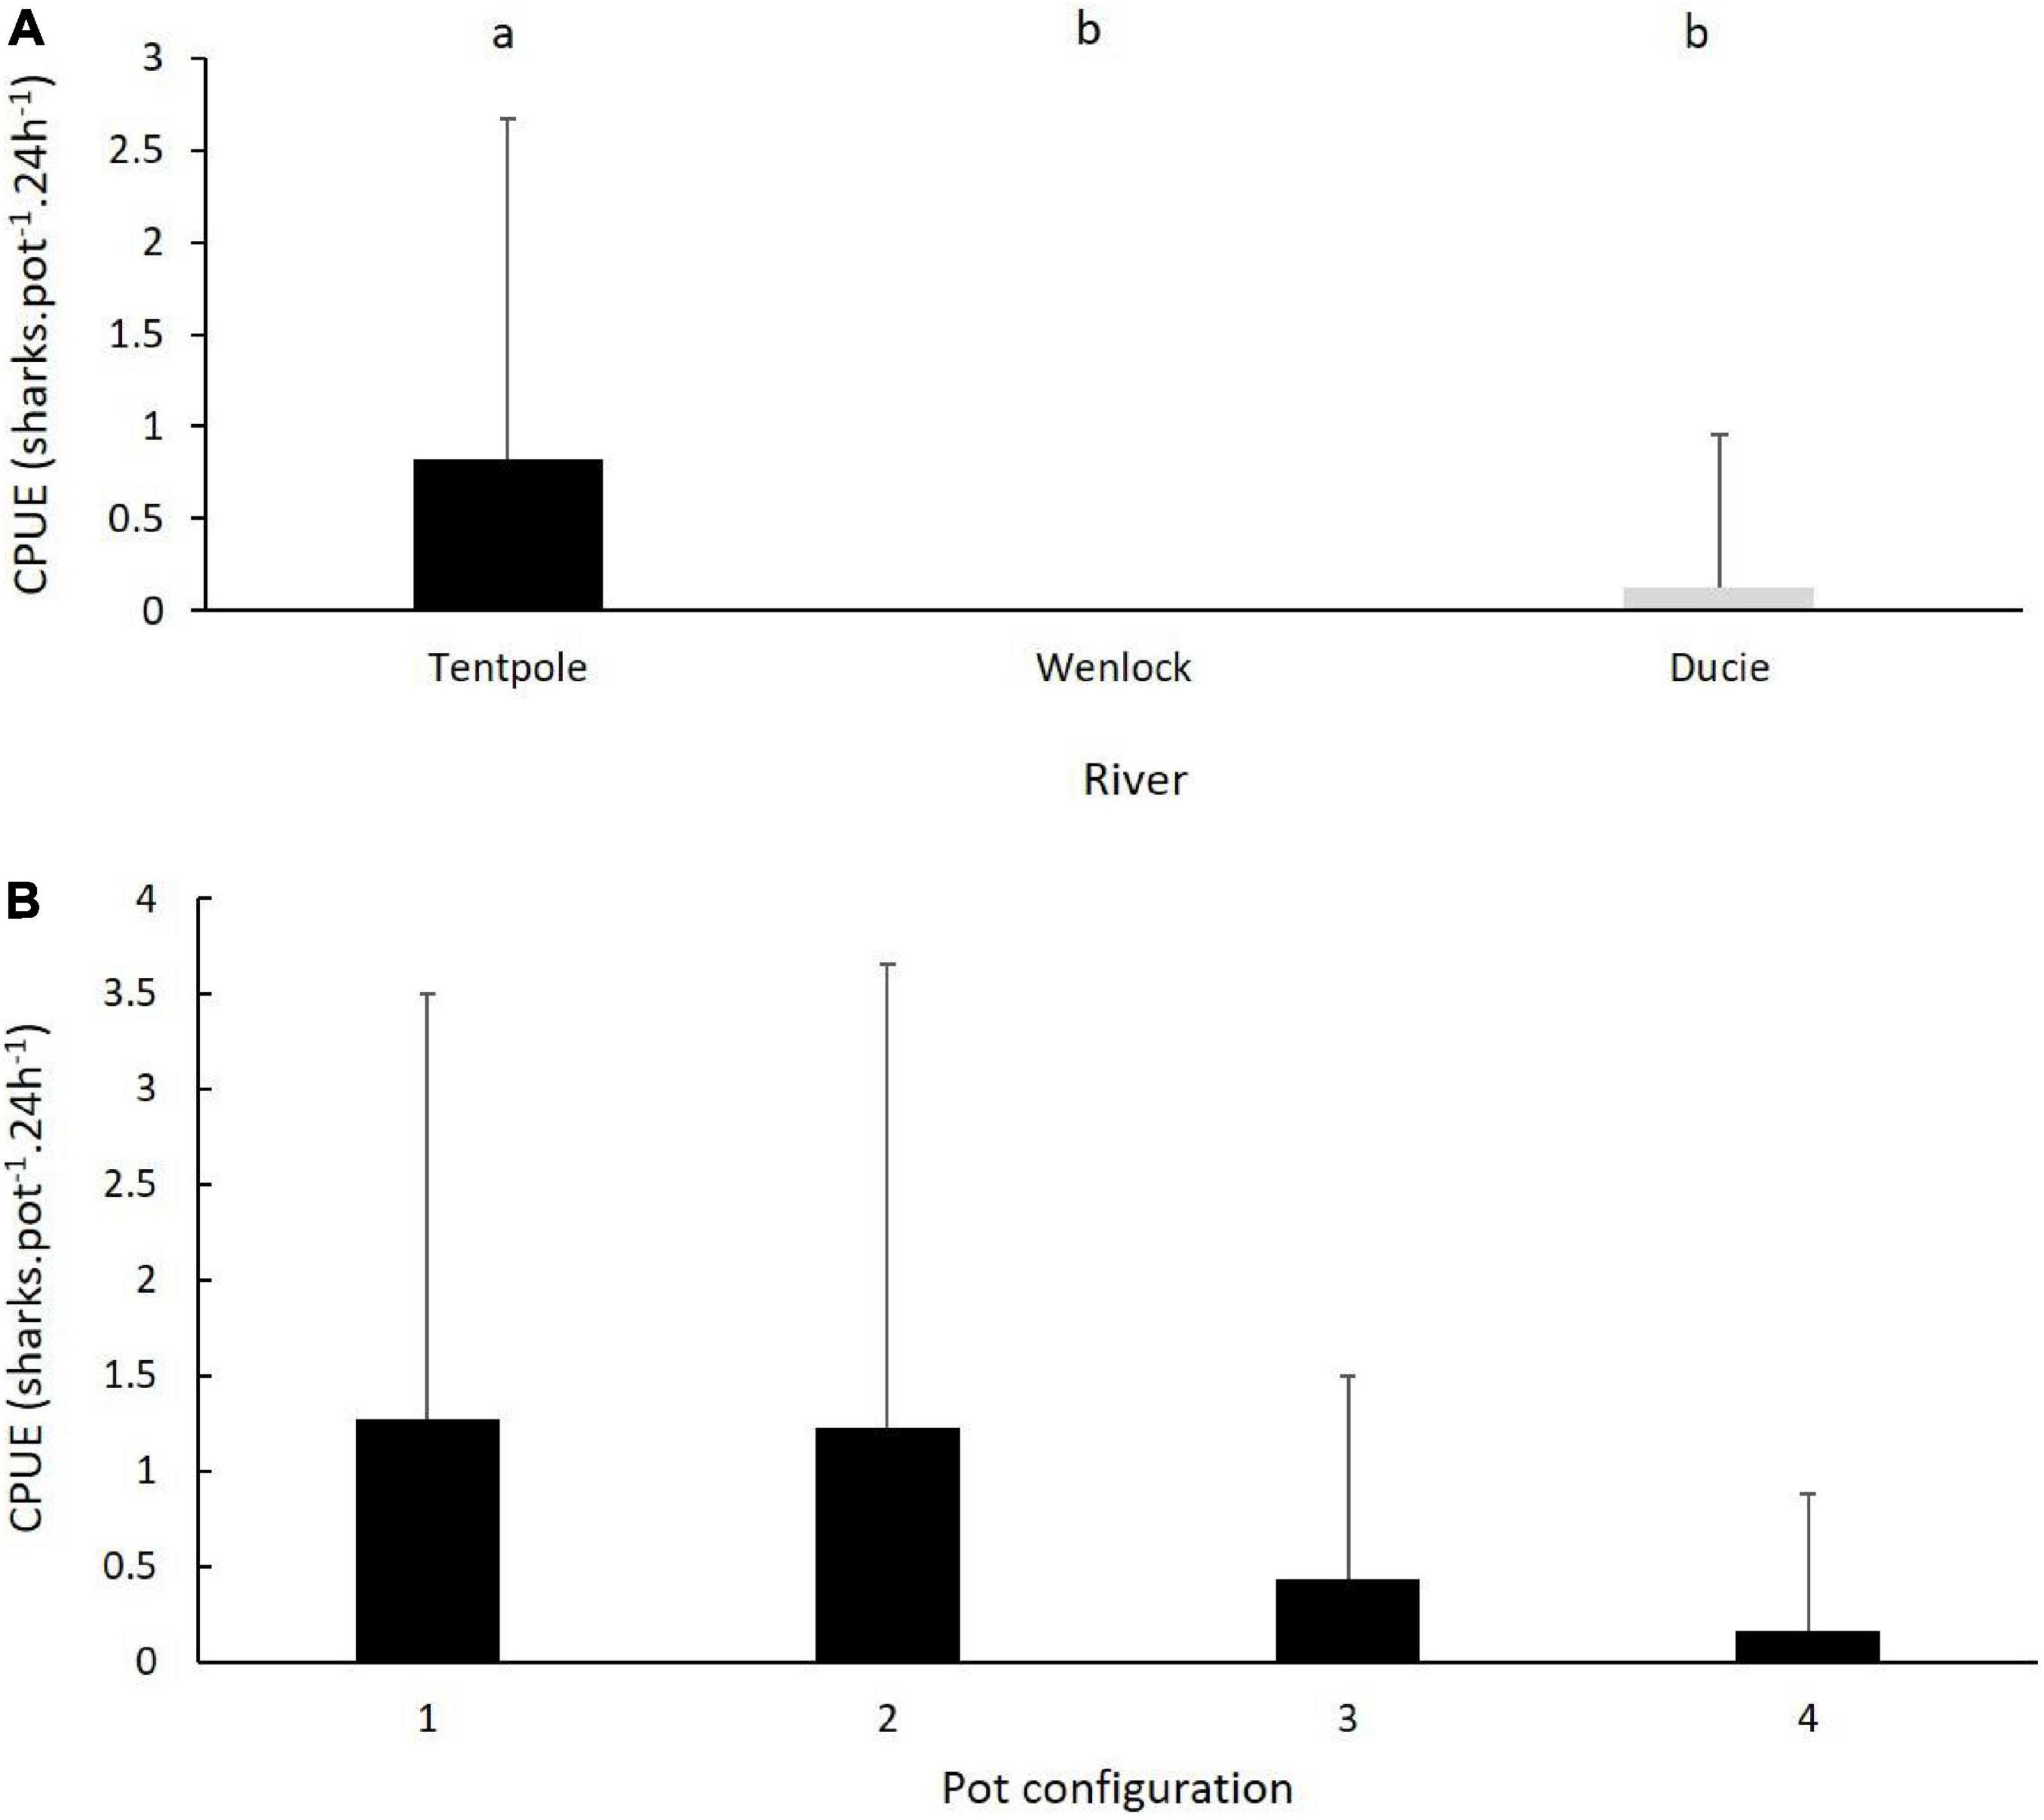
Figure 4. (A) Mean (+SD) CPUE of juvenile speartooth sharks in crab pots set in Tentpole Creek and the Wenlock and Ducie River. Letters denote significance of Tukeys HSD test. (B) Mean (+SD) of CPUE of juvenile speartooth sharks in four pot configurations used, only data from Tentpole Creek (n = 23) are plotted.
Within Tentpole Creek, speartooth sharks were captured in all four pot configurations. The average (±SD) catch rate of sharks in pots set 40–50 km (1.04 ± 1.93 sharks pot–1 24 h–1) and 50–60 km upstream (0.76 ± 1.85 sharks pot–1 24 h–1) were not significantly different (One Way ANOVA, F = 0.34, p = 0.56). There was no statistically significant difference between the four different pot configurations (One Way ANOVA, F = 1.93, p = 0.13). However, catch rates in pots with mesh bait bags with and without PVC escape vents was higher (mean catch rate of 1.27 ± 2.23 and 1.23 ± 2.43 sharks pot–1 24 h–1, respectively) than catch rates in pots with PVC bait holders with and without escape vents (0.43 ± 1.07 and 0.16 ± 0.72 sharks pot–1 24 h–1, respectively) (Figure 4B).
Long Term Commercial Fishing Effort
Between 1993 and 2020, annual total commercial fishing effort upstream of the mouth of the Wenlock and Ducie River ranged from 360 to 30,673 pot lifts with highest effort (>15,000 pot lifts year–1) in 1996, 1999, 2016, 2017, 2018, and 2019 (Figure 5A). Highest recorded effort was in 2018 and agreed with our observations of commercial effort. Highest levels of commercial fishing effort between 1993 and 2020 occurred in the Wenlock River where effort ranged from 360 to 22,235 pot lifts year–1. Effort in the Ducie River ranged from 0 to 7,100 pot lifts year–1 with effort prior to 2015 less than 3,000 pot lifts year–1 and highest effort in 2017 and 2018 (Figure 5A). Effort in Tentpole creek ranged from 0 to 3,767 pot lifts year–1 and was less than 1,500 pot lifts year–1 prior to 2015. Between 2015 and 2018 effort ranged from 2,474 to 3,767 pot lifts year–1 with highest effort in 2018 (Figure 5A). Overall, commercial fishing effort was highest in downstream reaches (0–30 km from the river mouth) of the Wenlock and Ducie River (Figure 5B). However, commercial fishing effort showed clear seasonal patterns with more effort upstream of 30 km in the dry season (June–December) and increased effort between 0 and 30 km upstream in the wet season (January–May) (Figure 5B). During the dry season, crab fishing effort 30–40, 40–50, and 50–60 km upstream ranged from 126 to 336, 0–326, and 30–158 pot lifts per month, respectively.
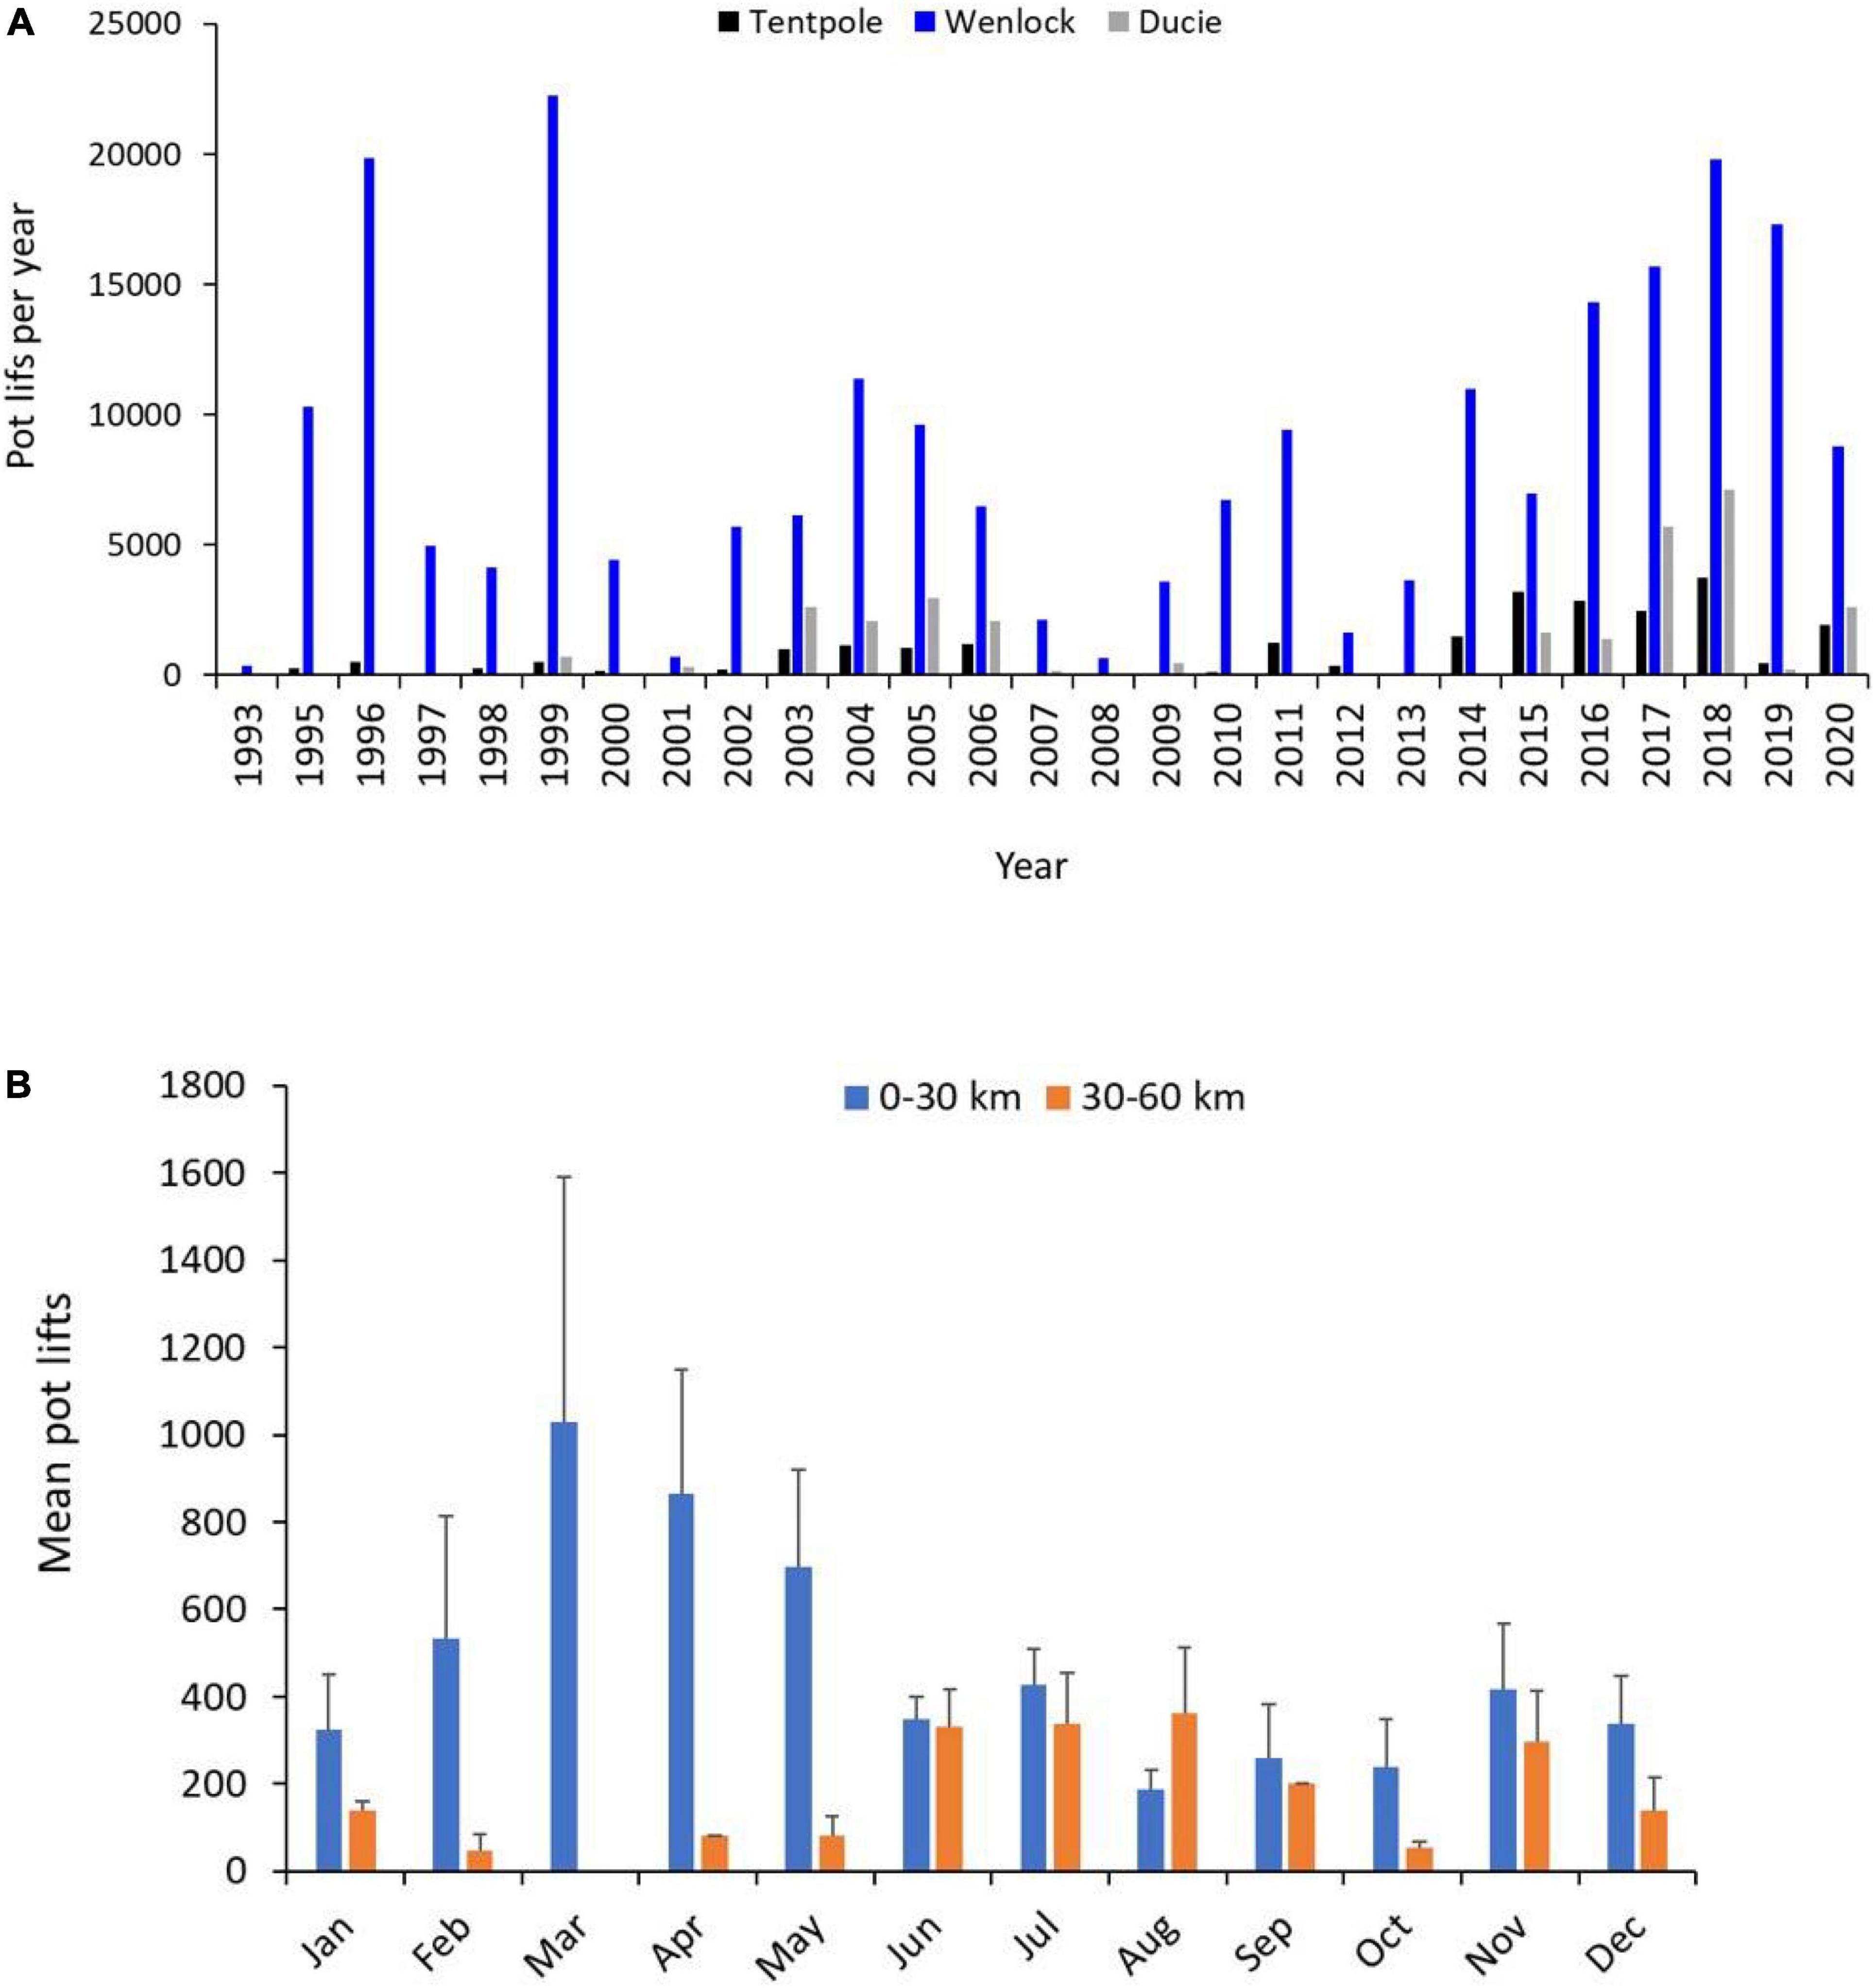
Figure 5. (A) Total number of commercial crab pot lifts per year from 1993 to 2020 in Tentpole Creek and the Wenlock and Ducie River. (B) Mean (+SD) number of commercial crab pot lifts per month from the 0–30 to 30–60 km upstream. Data from Tentpole Creek and the Wenlock and Ducie River between 1993 and 2020 were combined.
Recreational Fishing Effort
Counts of recreational pots revealed that recreational crab pot effort was sporadic. For example, in the 30–40 km stretch of Tentpole Creek surveyed in November between 2017 and 2020, out of 27 observed days, pots were only recorded on 11 days. The mean and maximum recreational pots observed per day in stretches of river are shown in Table 2. Mean daily recreational fishing effort was highest in the 40–60 km stretch of Tentpole Creek during the dry season (Table 2). Within the Wenlock and Ducie River no pots were observed upstream of 30 km. Within the Wenlock River, between 0 and 30 km upstream, mean number of pots observed in each stretch of river ranged from 0.63 to 2.0 pots day–1, with little difference between seasons. Despite low mean recreational pot density, in the upstream reaches of Tentpole Creek, up to 16 pots were observed per day which was comparable to numbers of commercial pots observed in upstream reaches.
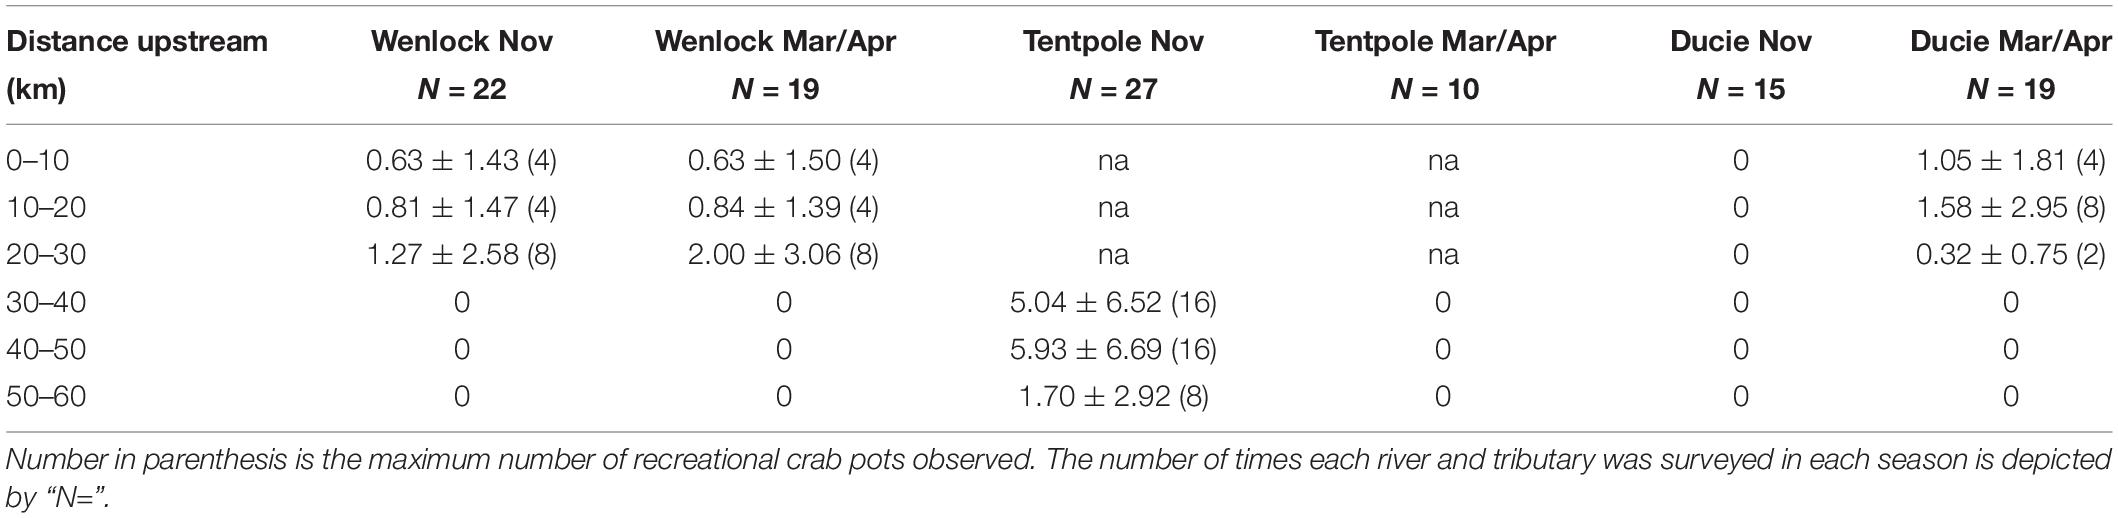
Table 2. Mean (±SD) number of recreational crab pots observed per day in the Wenlock, Tentpole, and the Ducie River according to 10 km reaches upstream from the mouth.
Predicted Catches of Speartooth Sharks
Predicted catches of speartooth sharks in November between 2019 and 2020 was estimated using CPUE from experimental crab pot sets in the same month. For the 20 km stretch of river in Tentpole Creek where commercial effort was reported in 2016 and 2018 using CPUE from all pot types combined, we estimated 159 and 279 speartooth sharks were captured, respectively. Using CPUE from pots with PVC bait holders, we estimated that 51 and 88 speartooth sharks were captured in November 2016 and 2018, respectively (Table 3). Estimates of daily recreational catch in the 40–60 km stretch of Tentpole Creek in November were between 0 and 29 sharks with a mean of 6 (±10 SD) (Table 4). Extrapolating daily recreational catches to monthly catches is problematic given the sporadic nature of recreational pots with recreational pots only observed on 11 of the 27 days and we have not attempted to do so.
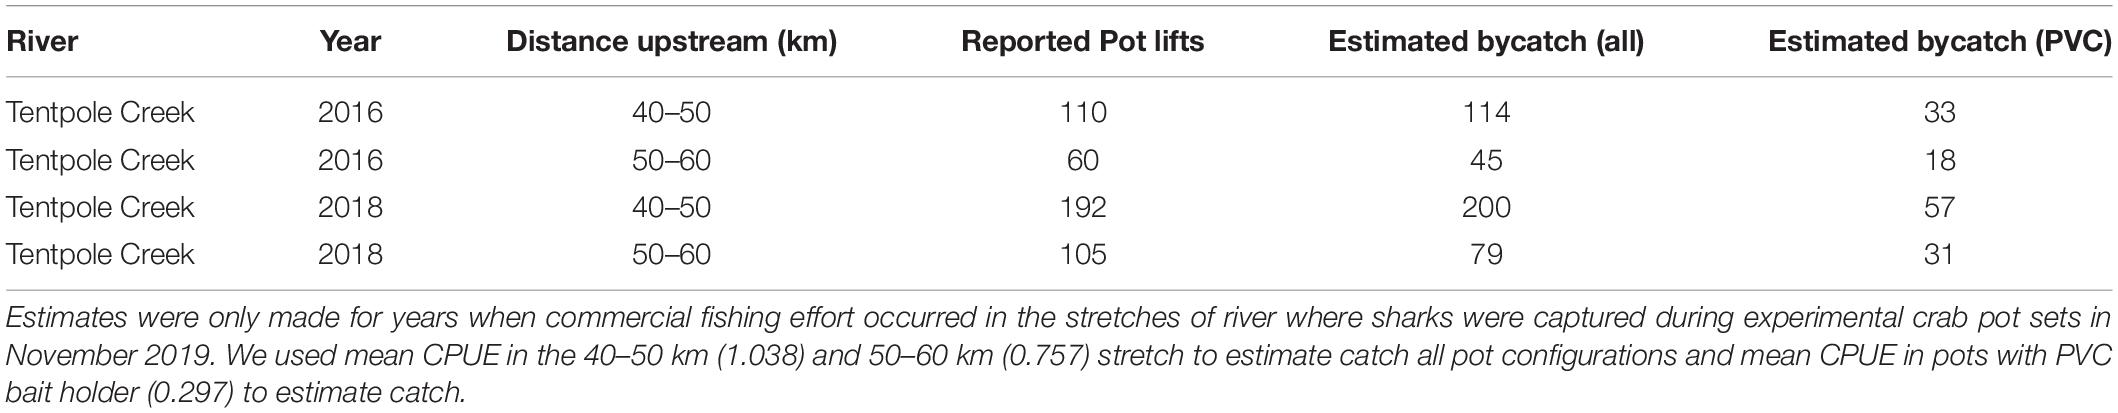
Table 3. Commercial crab effort and estimated commercial bycatch of 0–2 years old speartooth shark in Tentpole Creek during November.
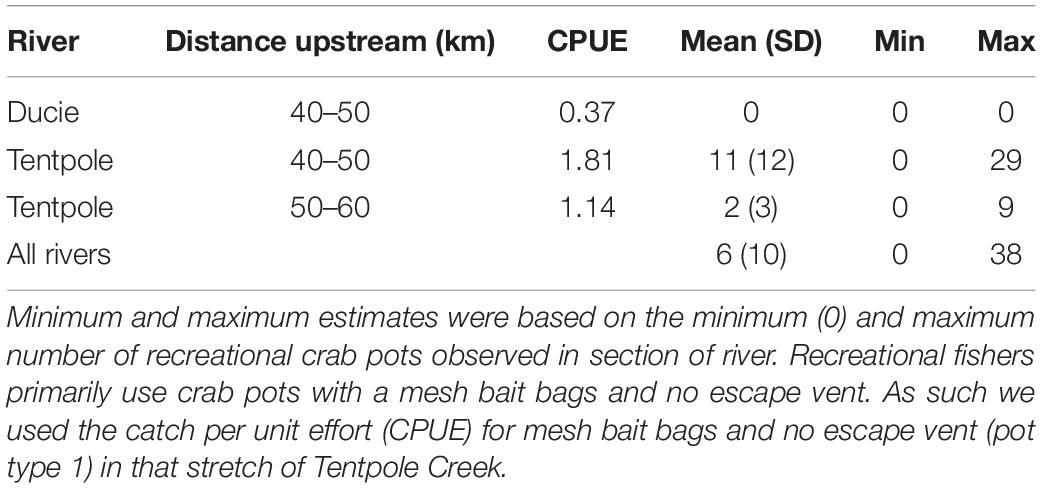
Table 4. Mean, minimum and maximum estimates of speartooth sharks captured per day (24 h) in recreational crab pots in November.
Overlap of Shark Distribution With the Commercial Fishery
Commercial fishing effort overlapped with the core distribution of tagged sharks in 40% of months between August 2013 and December 2020 (36 out of 89 months) (Figure 6A). The highest degree of overlap (24%) occurred during the wet season (January–June) with 16% overlap in the dry season. Estimated monthly effort in all years that overlapped with core shark distribution ranged from 0 to 1,538 pot lifts with a total of 10,182 pot lifts reported in core shark distribution.
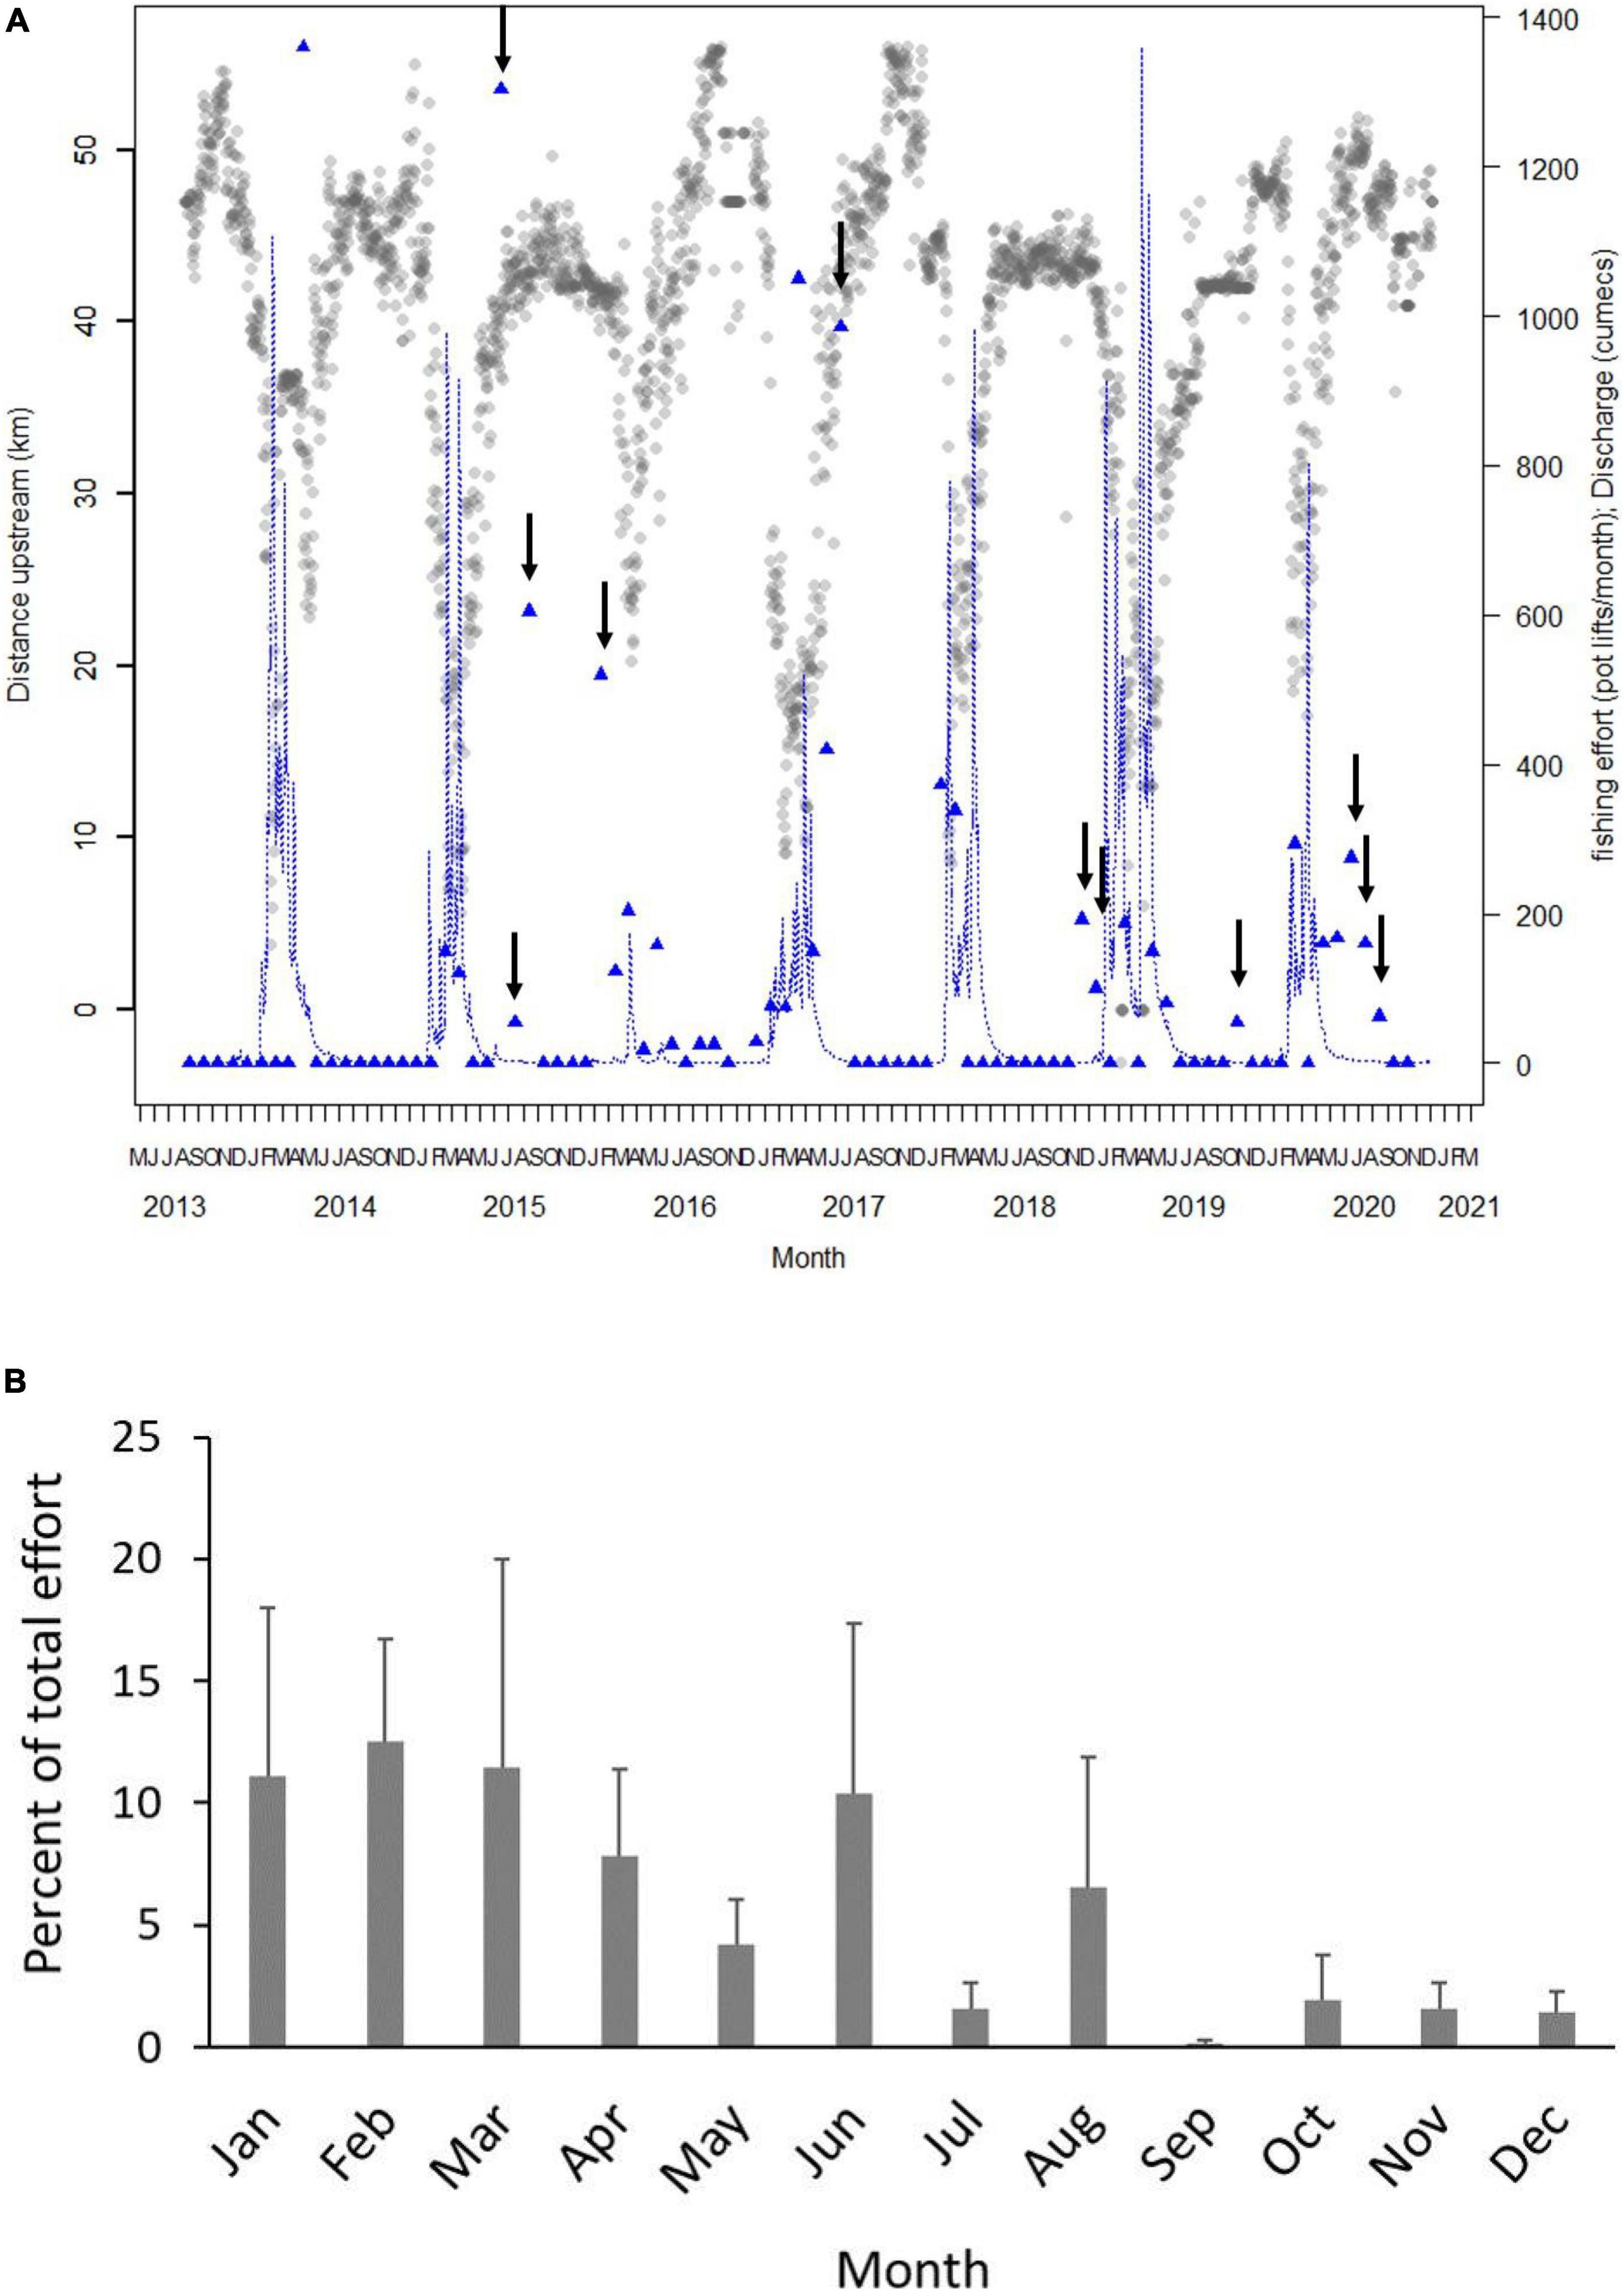
Figure 6. (A) Plot of mean daily distance upstream of acoustically tagged sharks between August 2013 and December 2020. Blue line shows average daily flow (cumecs). Blue triangles show total fishing effort (pot lifts) in each month in the stretch of river that overlapped with the average distance upstream of tagged sharks. For example, in April 2013, tagged speartooth sharks were on average 30–40 km upstream and in that section of river in that month, 1,360 pot lifts were reported. Arrows show months when there was fishing effort overlapping with average shark distribution during the dry season (June–December). Fishing effort and flow are both shown the right hand Y-axis. (B) Mean (+SE) percent of total commercial pot lifts that overlapped with core distribution of speartooth sharks per month. Monthly means were calculated for years from 2013 to 2020 when data on core distribution were available.
In the 10–20 km stretch, commercial effort overlapped with core shark distribution only in the wet season (February–April) with mean monthly effort between 38 and 146 pot lifts and a total effort of 2,200 pot lifts (Figure 6B). In the 20–30 km stretch, commercial effort overlapped with core shark distribution only in the wet season (January–March) and ranged from 9 to 37 pot lifts with a total effort of 572 pot lifts (Figure 6B). Mean commercial effort in sections of river overlapping with core shark distribution was highest 30–40 km upstream with a total of 5,500 pot lifts and monthly mean pot lifts of 112, 192, and 286 in January, April and June, respectively and no overlapping effort between July and December. In the 40–50 km stretch, commercial effort overlapped with core shark distribution in 8 months, primarily in the dry season. From May to December, mean monthly effort ranged from 3 to 87 pot lifts and effort was greater than 35 pot lifts in June, August and November (Figure 6B). Total effort in the 40–50 km stretch was 1,887 pot lifts.
Discussion
We used experimental crab pot sets in the Wenlock and Ducie River to demonstrate that juvenile speartooth sharks enter and become trapped in commercial style crab pots. Surveys were conducted in November 2019 (dry season) and March 2020 (wet season) with no sharks recorded in March 2020. In November 2019, speartooth sharks were only captured 40–60 km upstream in Tentpole Creek and 40–50 km upstream in the Ducie River with CPUE in Tentpole Creek significantly higher (0.82 ± 1.86 sharks pot–1 day–1) than in the Ducie River (0.12 ± 0.83 sharks pot–1 day–1). Acoustic telemetry was used to monitor movement of tagged sharks between 2013 and 2020. The degree of commercial and recreational fishing effort that overlapped with core distribution of tagged sharks varied both seasonally and annually. Using data from experimental CPUE and commercial fishing effort in November 2018, we estimate a minimum of 88 speartooth sharks were captured in 40–60 km stretch of Tentpole Creek alone and due to the long soak times of commercial crab pots, survival rates would be low. This suggest non-reporting of speartooth sharks by the commercial mud crab fishery within the Wenlock and Ducie River. Results of this study demonstrate that capture of juvenile speartooth sharks in crab pots set in the Wenlock and Ducie River poses a significant risk to the long-term viability the species. Urgent management intervention as well as additional data on CPUE of speartooth sharks in periods of highest fishing effort (outside of November) are also required to ensure the survival of this Critically Endangered species.
Capture of Elasmobranchs in Trap Fisheries
Our experimental pot sets in November demonstrated that juvenile speartooth sharks were only captured by crab pots set 40–60 upstream in Tentpole Creek and the Ducie River. The highest CPUE was in the 40–50 km stretch of Tentpole Creek with a mean of 1.04 (±1.93 SD) sharks pot–1 day–1. That we only captured sharks 40–60 km upstream is not surprising given that acoustic detection of tagged juveniles showed that the core distribution of tagged sharks in November was between 40 and 60 km upstream. In addition to higher catch rates in the 40–60 km stretch, catch rates in crab pots also differed between rivers and tributaries, with highest catches in Tentpole Creek. Tentpole Creek has previously been shown to be important for juvenile speartooth sharks (Lyon et al., 2017) and our line fishing CPUE collected in November and December from 2013 to 2020 showed catch rates of 0–2 years old sharks in the 40–60 km stretch of Tentpole Creek were four and 15 times greater than in the same stretch of the Wenlock River and Ducie River, respectively. These estimates were supported by detections of tagged sharks with up to four times more tagged sharks detected in Tentpole Creek between May and December than in the Wenlock and the Ducie River. The absence of speartooth sharks in crab pots set in the Wenlock River does not indicate that crab pots set in the Wenlock River will not catch sharks, rather, that the probability of capture is lower due to lower shark density. This is evident with data from the Ducie River, where despite long term line fishing CPUE and detection data suggesting lower abundance of 0–2 year old sharks, we captured one speartooth in 191 h of effort compared to no sharks in the Wenlock with 473 h of effort. Catch rates of speartooth sharks in crab pots are likely a function of shark density and appetite in this particular stretch of river.
Capture of elasmobranchs in crab and lobster pots is not unusual with the spotted catshark one of the most common bycatch species in crab pots in the Irish sea (Öndes et al., 2018). Similarly, Brock et al. (2007) recorded Port Jackson sharks (Heterodontus portusjacksoni), Gummy shark (Mustelus antarcticus) and School shark (Galeorhinus galeus) in commercial lobster pots in South Australia. Braccini et al. (2012) demonstrated significantly lower post capture mortality for benthic sharks than pelagic sharks. Benthic species respire using buccal pumping whereby water is drawn over the gills while the animals are motionless (Carlson and Parsons, 2001; Carlson et al., 2004). These species can therefore survive for long periods within crab and lobster pots and as long as they are released after capture, post capture mortality rates should be negligible. Pelagic species including Carcharhinid sharks are classified as ram ventilators and must keep swimming to ensure sufficient water movement across the gills for respiration (Wardle, 1985; Carlson and Parsons, 2001; Carlson et al., 2004). When trapped inside crab pots, juvenile speartooth sharks are unable to swim around freely due to the pot design with entrance funnels and lines keeping these open making it impossible for sharks to swim freely within the pot. Even when pots were checked regularly (every 2 h) some sharks were sluggish and took several minutes to revive. In pots checked after more than 2 h, sharks are difficult to revive and evidence suggests that mortality rate in sharks trapped in pots for more than 6 h is 100%. In the commercial sector, pots are lifted once in 24 h. Check time in the recreational fishery vary, however standard check times are between 8 and 24 h. Thus, the majority of sharks that enter crab pots will die and our estimate of CPUE provide a realistic baseline for mortality rates associated with bycatch in recreational and commercial crab pots.
Seasonal Changes in Catch per Unit Effort
During March 2020, highest experimental crab pot effort overlapped with core shark distribution, yet no sharks were captured. While seasonal changes in bycatch of elasmobranchs has been demonstrated (Öndes et al., 2018), we attribute the lack of shark captures in experimental crab pot surveys in March to changes in catchability of sharks resulting from environmental conditions at the time of the survey. The survey coincided with a monsoon trough that resulted in an influx of freshwater. The influx of freshwater resulted in a rapid reduction in salinity combined with a large difference between surface and bottom salinity. During surveys in March 2020, at 20 km upstream, salinity on the surface was 1.74 PSU compared to 15.5 PSU at 5 m depth (Supplementary Figure 2). Large and sudden changes in salinity are physiologically challenging for euryhaline elasmobranchs (Pillans et al., 2006, 2020) and it is well understood that in teleosts, the behavioural response to intensely acute or chronic stressors is a reduction in appetite (Bernier and Peter, 2001; Bernier, 2006). The primary stress hormone in elasmobranchs (1α-hydroxycorticosterone) is elevated following exposure to reduced salinity (Hazon and Henderson, 1984; Evans and Nunez, 2015) suggesting that large and sudden changes in salinity are likely to suppress appetite.
Line fishing CPUE during March 2020 was ∼20 times lower than mean CPUE during November 2019 and ∼12 times lower than catch rates in April and May suggesting that sharks were not actively feeding during this period. Our estimates of catch rates during March are therefore not likely to reflect catch rates outside of high flow events. Indeed, we spoke with several recreational fishers who reported catching speartooth sharks in crab pots 20–40 km upstream in April and May and from 40 to 60 km upstream in November to January. The location of these captures overlapped with core shark distribution at those times and suggests that outside of major freshwater influx events (such as we experienced in March 2020), crab pots overlapping core habitat are likely to capture juvenile sharks. While the majority of sharks we captured were neonates, larger sharks do enter crab pots. One recreational fisher reported the capture of two large juveniles 30–40 km upstream in the Ducie River. Both of these sharks were deceased and subsequently measured at 103 and 120 cm TL. It is therefore apparent that crab pots pose a threat to juvenile speartooth sharks of all sizes, not just the smallest size classes.
Estimates of Catch in the Commercial and Recreational Fishery
Since we only had estimates of CPUE from experimental sets in November, we only estimated catch rates of sharks in recreational and commercial fisheries in the corresponding stretches of river in that month. We estimated that between 51–159 and 88–279 juvenile speartooth sharks were captured in the 40–60 km stretch of Tentpole Creek in 2016 and 2018, respectively. Irrespective of recreational and commercial bycatch outside of November, our estimates of juvenile speartooth shark bycatch within Tentpole Creek in November suggest that that crab pots pose a direct and significant threat to speartooth sharks in the Wenlock and Ducie River. The experimental data on CPUE strongly suggests that there is non-reporting of bycatch in the commercial fishery. Underreporting, misreporting and non-reporting have been shown to be relatively widespread in commercial fisheries (Walsh et al., 2005; Burns and Kerr, 2008; Macbeth et al., 2018; Wakefield et al., 2018; Parsa et al., 2020) and can have serious implications for fishery sustainability. There is an urgent need to collect fisheries independent data on seasonal catches either through an observer program or additional experiments in months where fishing effort overlaps the core distribution of sharks. Babcock et al. (2003) estimated that for fisheries with small number of licences, observer coverage of ∼50% is required to detect rarely captured species with the appropriate degree of statistical certainty.
While there may be small differences in catch rates of sharks in commercial pots and our experimental sets, these differences are unlikely to be significant since we used similar baits, the same brand of pots used by at least some of the commercial operators in the river system and set our pots the same distance from the bank as commercial pots. Captured sharks were removed within 2 h of setting the pot to prevent them dying in the pot. It is unlikely that the presence or absence of sharks in a pot influenced the probability of other sharks entering the pot. We captured two neonate sharks in one pot and have received reports of two 1.0–1.2 m TL sharks in crab pots suggesting that multiple sharks will enter a pot. None of the sharks we captured in the crab pots were recaptures so our estimates weren’t inflated by a few individuals that were recaptured.
Since our pot configurations and position were the same as those used by commercial operators, there is no reason why our catch rates would differ from commercial catches. Similarly, while our estimates of catch were for 2016 and 2018, there is no obvious reason why catch rates in November 2019 (experimental CPUE estimates) would be different to catch rates for that month in other years. Our long term data on the distribution of juvenile speartooth sharks demonstrates that there is limited variability in the distance upstream during late dry season. This is presumably due to the relatively stable salinity regime at this time of year given the lack of rainfall with the wet season only commencing in January. The abundance of juvenile speartooth sharks in the system is highest immediately after pupping which occurs from early September to late October (Pillans, unpublished data) so abundance of neonates in November is likely to be tightly linked to adult abundance.
CSIRO (unpublished data) estimated that survival of speartooth sharks less than 2 years old was around 0.3 (implying that around 70% of sharks die each year). These estimates are total mortality and cannot distinguish between fishing and natural mortality. Regardless, these estimates are the highest estimates of juvenile mortality from direct measurement from long-term telemetry data (Heupel and Simpfendorfer, 2002, 2011). Estimates of adult population of speartooth sharks in the Wenlock River population is around 900 (using close kin mark recapture) with as few as 45 females pupping each year (CSIRO, unpublished data). With such high juvenile mortality and a very small adult population, any fishing mortality is likely to have a negative impact on the population.
Overlap of Commercial Fishing and Shark Distribution
The level of fishing effort varied annually, between rivers and also with distance upstream. Fishing effort followed a similar pattern to shark core distribution with highest effort in downstream reaches during the wet season (Jan–May) and increased effort and movement of the shark core distribution upstream during the dry season (June–December). Monthly estimates of CPUE are required to extrapolate catches from these data, however, it is clear that fishing effort overlaps with juvenile speartooth shark distribution throughout the year. Anecdotal and direct evidence of captures in April, May, November, December, and January indicate that an appropriate management response would need to cover all seasons as there will always be a chance of incidental capture.
Bycatch Mitigation
Mitigation measures to ensure the sustainability of the crab fishery include seasonal and or spatial closures as well bycatch reduction devises. Dwyer et al. (2019) used movement of tagged speartooth sharks to theoretically inform seasonal spatial management (seasonal fishing closures) but did not incorporate data on fishing effort. Our results on the degree of overlap between fishing effort and the core distribution of sharks suggest that seasonal closures (no fishing between 0 and 30 km upstream during the wet season and no fishing upstream of 30 km during the dry season) would eliminate bycatch of sharks, however this would result in an overall ∼70% reduction in fishing effort based on average monthly commercial fishing effort upstream and downstream of 30 km across all years (based on Figure 5B).
The use of escape vents (Broadhurst et al., 2014, 2020), larger mesh (Broadhurst et al., 2020), spikes (Campbell et al., 2008; Goldsworthy et al., 2010), magnets (Richards et al., 2018) and bycatch reduction devices (Roosenburg and Green, 2000; Morris et al., 2011) have successfully been used to reduce bycatch and increase target species catches in pot and trap fisheries. Richards et al. (2018) demonstrated a 30% reduction in elasmobranch bycatch in fish traps fitted with ferrite magnets. Traps fitted with magnets also captured more of the target species (snapper) which was attributed to presence of elasmobranchs in fish traps having a negative impact on targeted catch. While ferrite magnets may prove useful, a 30% reduction would still result in significant mortalities. Rigg et al. (2009) investigated the effect of ferrite magnets on the behaviour of five species of Australian sharks including speartooth sharks. While speartooth sharks were deterred by ferrite magnets, their turning distance was significantly smaller (∼0.25 m) than other species tested.
Although not statistically different, within Tentpole Creek, CPUE of juvenile speartooth sharks was up to three times lower in pots with PVC bait holders. These data suggest the use of PVC bait holders may slightly reduce catches, however, sharks will still enter pots with PVC bait holders so this method alone will not eliminate bycatch mortality. The lower CPUE in pots with PVC bait holders is presumably related to differences in the strength of the olfactory signal of baits in a mesh bag compared to in an enclosed PVC container with 10 mm holes. Crab pots are designed for easy entry but not exit. While some commercial fishers use a 90 mm PVC escape vent sewn into the side wall of crab pots, we demonstrated that catch rates in pots with and without these escape vents were no different. This was not surprising since although neonate speartooth sharks can fit their head through a 90 mm tube, their pectoral and dorsal fins prevent them passing through. While larger (105 mm diameter) escape vents are now used in the Queensland crab fishery, this legislation was brought in after we concluded this study. Additional research into the effectiveness of larger escape vents are required, however, the configuration of crab pots is such that sharks can easily become entangled in the ropes holding escape vents open. Additional research is required to determine at what size juvenile speartooth sharks can fit through a 105 mm diameter vent and what proportion of sharks that enter a pot can locate and exit the escape vent before they succumb to lack of oxygen.
Devices which physically prevent entrance into pots such as those used to exclude Australian Sea Lions (Campbell et al., 2008) and terrapins (Morris et al., 2011) may be more effective than escape vents designed to provide escapement from the pots. The large size of juvenile speartooth shark relative to the size of crab pots (mean shark TL of 64 cm compared to pot diameter of 90 cm) combined with the internal funnels and lines structure within the pot results in limited space for sharks to move around within the pot. This combined with near zero visibility and the fact that sharks easily become entangled in ropes that hold the pot entrances open will likely negate effectiveness of larger escape vents. Research into the efficacy of both larger escape vents as well as exclusion devices such as rectangular slots or right angle elbows in the entrance funnels that do no impact catch rates of legal sized mud crabs are required. Testing various configurations of these as well more data on the effect of PVC bait holders are required.
Summary and Need for Cumulative Data
Our data indicates that commercial mud crab fishing in the Wenlock and Ducie Rivers poses a significant threat to the viability of the genetically isolated and small population of speartooth shark in this system. A commercial gillnet fishery also operates in this system and speartooth sharks have be recorded by fisheries observers being impacted by this fishery (Salini et al., 2006). Clearly, both commercial and recreational crab fishing pose a significant threat to juvenile speartooth sharks and may be directly contributing to the high mortality estimates of 0–2 years old sharks. Understanding the cumulative impact of these two commercial fisheries as well as recreational bycatch is vital for the long-term viability of this Critically Endangered elasmobranch. There is an urgent need for management intervention such as closed seasons and or areas to significantly reduce and or eliminate bycatch mortality.
Data Availability Statement
The raw data supporting the conclusions of this article will be made available by the authors, upon reasonable request and where applicable with permission of the third party data provider.
Ethics Statement
The animal study was reviewed and approved by CSIRO animal ethics permits (CSIRO AEC # A2/2016; 2017-04; 2020-22).
Author Contributions
RP conceived the idea. RP, GC, and GF conducted the field work. All authors contributed to wrote the manuscript with RP and TP analysing the data, producing the figures, and approved the submitted version.
Funding
This research was funded by the Ord River Offset program.
Conflict of Interest
The authors declare that the research was conducted in the absence of any commercial or financial relationships that could be construed as a potential conflict of interest.
Publisher’s Note
All claims expressed in this article are solely those of the authors and do not necessarily represent those of their affiliated organizations, or those of the publisher, the editors and the reviewers. Any product that may be evaluated in this article, or claim that may be made by its manufacturer, is not guaranteed or endorsed by the publisher.
Supplementary Material
The Supplementary Material for this article can be found online at: https://www.frontiersin.org/articles/10.3389/fmars.2022.787634/full#supplementary-material
Supplementary Figure 1 | (A) Round, trawl mesh covered collapsible crab pots used in the experiments. (B) Juvenile speartooth shark captured in crab pot. White oval shows where the sharks head has been entangled in the rope holding the pot entrance open.
Supplementary Figure 2 | Salinity at depth (metres) taken at 0, 20, 40, and 50 km upstream of the mouth of the Wenlock River in November and March. Salinity at 60 km upstream in November and 50 and 60 km upstream in March was identical to 40 km upstream (∼0.27 PSU) in March and was not plotted to aid interpretation.
Footnotes
References
Babcock, E. A., Pikitch, E. K., and Hudson, C. G. (2003). How much Observer Coverage is Enough to Adequately Estimate Bycatch?. Washington, DC: Pew Institute for Ocean Science and Oceana.
Bernier, N. J. (2006). The corticotropin-releasing factor system as a mediator of the appetite-suppressing effects of stress in fish. Gen. Comp. Endocrinol. 146, 45–55. doi: 10.1016/j.ygcen.2005.11.016
Bernier, N. J., and Peter, R. E. (2001). Appetite-suppressing effects of urotensin I and corticotropin-releasing hormone in goldfish (Carassius auratus). Neuroendocrinology. 73, 248–260. doi: 10.1159/000054642
Braccini, M., Van Rijn, J., and Frick, L. (2012). High Post-Capture Survival for Sharks, Rays and Chimaeras Discarded in the Main Shark Fishery of Australia? PLoS One 7:e32547. doi: 10.1371/journal.pone.0032547
Broadhurst, M. K., Butcher, P. A., and Cullis, B. R. (2014). Effects of Mesh Size and Escape Gaps on Discarding in an Australian Giant Mud Crab (Scylla serrata) Trap Fishery. PLoS One 9:e106414. doi: 10.1371/journal.pone.0106414
Broadhurst, M. K., Tolhurst, D. J., Hughes, B., Raoult, V., Smith, T. M., and Gaston, T. F. (2020). Optimising mesh size with escape gaps in a dual-species portunid-trap fishery. Aquac. Fish. 5, 308–316. doi: 10.1016/j.aaf.2019.12.007
Brock, D. J., Hawthorne, P. J., Ward, T. M., and Linnane, A. J. (2007). Two monitoring methods that assess species composition and spatio-temporal trends in bycatch from an important temperate rock lobster (Jasus edwardsii) fishery. Mar. Fresh. Res. 58, 273–285. doi: 10.1071/mf06061
Burns, R. J., and Kerr, G. N. (2008). Observer effect on fisher bycatch reports in the New Zealand ling (Genypterus blacodes) bottom longlining fishery. N.Z. J. Mar. Fresh. Res. 42, 23–32. doi: 10.1080/00288330809509933
Campbell, R., Holley, D., Christianopolous, D., and Gales, N. G. (2008). Mitigation of incidental mortality of Australian sea lions in the west coast rock lobster fishery. Endang. Species. Res. 5, 345–358. doi: 10.3354/esr00155
Carlson, J., Goldman, K., and Lowe, C. (2004). Metabolism, energetic demand, and endothermy”,in Biology of sharks and their relatives. CRC Mar. Biol. Series 1, 203–224.
Carlson, J. K., and Parsons, G. R. (2001). The Effects of Hypoxia on Three Sympatric Shark Species: Physiological and Behavioral Responses. Env. Biol. Fish. 61, 427–433. doi: 10.1023/A:1011641302048
Coleman, R. A., Hoskin, M. G., Von Carlshausen, E., and Davis, C. M. (2013). Using a no-take zone to assess the impacts of fishing: Sessile epifauna appear insensitive to environmental disturbances from commercial potting. J. Exp. Mar. Biol. Ecol. 440, 100–107. doi: 10.1016/j.jembe.2012.12.005
DAF (2021). Queensland mud crab fishery harvest strategy:2021–2026, consultation draft. Available online at: https://daf.engagementhub.com.au/draft-crab-harvest-strategies (accessed 16/2/2021).
Davies, R. W. D., Cripps, S. J., Nickson, A., and Porter, G. (2009). Defining and estimating global marine fisheries bycatch. Mar. Policy. 33, 661–672. doi: 10.1038/s41598-017-02819-5
Dorcas, M. E., Willson, J. D., and Gibbons, J. W. (2007). Crab trapping causes population decline and demographic changes in diamondback terrapins over two decades. Biol. Conserv. 137, 334–340.
Dulvy, N. K., Fowler, S. L., Musick, J. A., Cavanagh, R. D., Kyne, P. M., Harrison, L. R., et al. (2014). Extinction risk and conservation of the world’s sharks and rays. Elife 3:e00590. doi: 10.7554/eLife.00590
Dwyer, R. G., Campbell, H. A., Pillans, R. D., Watts, M. E., Lyon, B. J., Guru, S. M., et al. (2019). Using individual−based movement information to identify spatial conservation priorities for mobile species. Cons. Biol. 33, 1426–1437. doi: 10.1111/cobi.13328
Eno, N. C., MacDonald, D. S., Kinnear, J. A. M., Amos, S. C., Chapman, C. J., Clark, R. A., et al. (2001). Effects of crustacean traps on benthic fauna. ICES J. Mar. Sci. 58, 11–20. doi: 10.1006/jmsc.2000.0984
Environment Protection and Biodiversity Conservation Act (1999). Australian Government. Gland: Environment Protection and Biodiversity Conservation Act.
Evans, A. N., and Nunez, S. B. (2015). Fresh water acclimation elicits a decrease in plasma corticosteroids in the euryhaline Atlantic stingray, Dasyatis sabina. Gen. Comp. Endocrinol. 222, 167–172. doi: 10.1016/j.ygcen.2015.08.010
Feutry, P., Berry, O., Kyne, P. M., Pillans, R. D., Hillary, R. M., Grewe, P. M., et al. (2017). Inferring contemporary and historical genetic connectivity from juveniles. Mol. Ecol. 26, 444–456. doi: 10.1111/mec.13929
Feutry, P., Kyne, P. M., Pillans, R. D., Chen, X., Naylor, J. P., and Grewe, P. M. (2015). Mitogenomics of the Speartooth Shark challenges ten years of control region sequencing. BMC Evol. Biol. 14:232–241. 014-0232-x doi: 10.1186/s12862-
Furevik, D., Humborstad, O.-B., Jørgensen, T., and Løkkeborg, S. (2008). Floated fish pot eliminates bycatch of red king crab and maintains target catch of cod. Fish. Res. 92, 23–27.
Goldsworthy, S. D., Page, B., Shaughnessy, P. D., and Linnane, A. (2010). Mitigating seal interactions in the SRLF and the gillnet sector SESSF in South Australia. FRDC Project 2007/041 Final Report. SARDI Aquatic Sciences Publication Number F2009/000613-1, SARDI Research Report Series Number. Canberra: FRDC.
Gray, C. A., and Kennelly, S. J. (2018). Bycatches of endangered, threatened and protected species in marine fisheries. Rev. Fish. Biol. Fisheries. 28, 521–541. doi: 10.1007/s11160-018-9520-7
Hatfield, B. B., Ames, J. A., Estes, J. A., Tinker, M. T., Johnson, A. B., Staedler, M. M., et al. (2011). Sea otter mortality in fish and shellfish traps: estimating potential impacts and exploring possible solutions. Endanger. Species Res. 13, 219–229. doi: 10.3354/esr00327
Hazon, N., and Henderson, I. W. (1984). Secretory dynamics of 1-alpha-hydroxycorticosterone in the elasmobranch fish, Scyliorhinus canicular. J. Endocrinol. 103, 205–211. doi: 10.1677/joe.0.1030205
Heupel, M. R., and Simpfendorfer, C. A. (2002). Estimation of mortality of juvenile blacktip sharks, Carcharhinus limbatus, within a nursery area using telemetry data. Can. J. Fish. Aquat. Sci. 59, 624–632.
Heupel, M. R., and Simpfendorfer, C. A. (2011). Estuarine nursery areas provide a low-mortality environment for young bull sharks Carcharhinus leucas. Mar. Ecol. Prog. Ser. 433, 237–244.
Jennings, S., and Kaiser, M. J. (1998). The effects of fishing on marine ecosystems. Adv. Mar. Biol 34, 201–351. doi: 10.1371/journal.pone.0252391
Leblanc, M., Tweed, S., Lyon, B. J., Bailey, J., Franklin, C. E., Harrington, G., et al. (2015). On the hydrology of the bauxite oases, Cape York Peninsula, Australia. J. Hydrol. 528, 668–682. doi: 10.1016/j.jhydrol.2015.06.001
Lewison, R. L., Crowder, L. B., Wallace, B. P., Moore, J. E., Cox, T., Zydelis, R., et al. (2014). Global patterns of marine mammal, seabird, and sea turtle bycatch reveal taxa-specific and cumulative megafauna hotspots. Proc. Natl. Acad. Sci. 2014:201318960. doi: 10.1073/pnas.1318960111
Lyon, B. L., Dwyer, R. G., Pillans, R. D., Campbell, H. D., and Franklin, C. E. (2017). Distribution, seasonal movements and habitat utilisation of an endangered shark, Glyphis glyphis from northern Australia. Mar. Ecol. Prog. Ser. 573, 203–213.
Macbeth, W. G., Butcher, P. A., Collins, D., McGrath, S. P., Provost, S. C., Bowling, A. C., et al. (2018). Improving reliability of species identification and logbook catch reporting by commercial fishers in an Australian demersal shark longline fishery. Fish. Manag. Ecol. 25, 186–202.
Miller, R. J. (1990). Effectiveness of Crab and Lobster Traps. Can. J. Fish. Aqua. Sci. 47, 1228–1251. doi: 10.1139/f90-143
Morris, A. S., Wilson, S. M., Dever, E. F., and Chambers, R. M. (2011). A Test of Bycatch Reduction Devices on Commercial Crab Pots in a Tidal Marsh Creek in Virginia. Est. Coast. 34, 386–390. doi: 10.1007/s12237-010-9330-1
Oliver, S., Braccini, M., Newman, S. J., and Harvey, E. S. (2015). Global patterns in the bycatch of sharks and rays. Mar. Policy. 54, 86–97.
Öndes, F., Kaiser, M., and Murray, L. (2018). Fish and invertebrate by-catch in the crab pot fishery in the Isle of Man, Irish Sea. J. Mar. Biolog. Assoc. U.K. 98, 2099–2111. doi: 10.1017/S0025315417001643
Parsa, M., Emery, T. J., Williams, A. J., and Nicol, S. (2020). An empirical Bayesian approach for estimating fleet-and vessel-level bycatch rates in fisheries with effort heterogeneity and limited data: a prospective tool for measuring bycatch mitigation performance. ICES J. Mar. Sci. 77, 921–929.
Perez Roda, M. A., Gilman, E. L., Huntington, T., Kennelly, S. J., Suuronen, P., Chaloupka, M., et al. (2019). A Third Assessment of Global Marine Fisheries Discards. FAO Fisheries and Aquaculture Technical Paper No. 633. Rome: FAO, 78.
Pillans, R. D., Anderson, W. G., Good, J. P., Hyodo, S., Takei, Y., Hazon, N., et al. (2006). Plasma and erythrocyte solute properties of juvenile bull sharks, Carcharhinus leucas, acutely exposed to increasing environmental salinity. J. Exp.Mar. Biol. Ecol. 331, 145–157. doi: 10.1016/j.jembe.2005.10.013
Pillans, R. D., Fry, G. C., Steven, A. D. L., and Patterson, T. A. (2020). Environmental Influences on Long-term Movement Patterns of a Euryhaline Elasmobranch (Carcharhinus leucas) Within a Subtropical Estuary. Estuaries Coast. 43, 2152–2169. doi: 10.1007/s12237-020-00755-8
Pillans, R. D., Stevens, J. D., Kyne, P. M., and Salini, J. (2009). Observations on the distribution, biology, short-term movements and habitat requirements of river sharks (Glyphis species) in northern Australia. End. Spec. Res. 10, 321–332. doi: 10.3354/esr00206
Richards, R. J., Raoult, V., Powter, D. M., and Gaston, T. F. (2018). Permanent magnets reduce bycatch of benthic sharks in an ocean trap fishery. Fish. Res. 208, 16–21. doi: 10.1016/j.fishres.2018.07.006
Rigg, D. P., Peverell, S. C., Hearndon, M., and Seymour, J. E. (2009). Do elasmobranch reactions to magnetic fields in water show promise for bycatch mitigation? Mar. Fresh.Res. 60, 942–948. doi: 10.1071/MF08180
Roosenburg, W. M., and Green, J. P. (2000). Impact of a bycatch reduction device on diamondback terrapin and blue crab capture in crab pots. Ecol. Appl. 10, 882–889. doi: 10.1890/1051-07612000010[0882:IOABRD]2.0.CO;2
Salini, J., McAuley, R., Blaber, S., Buckworth, R., Chidlow, J., Gribble, N., et al. (2006). Northern Australia sharks and rays: the sustainability of target and bycatch fisheries. Phase 2. Cleveland: CSIRO Marine and Atmospheric Research.
Suuronen, P., Chopin, F., Glass, C., Løkkeborg, S., Matsushita, Y., Queirolo, D., et al. (2012). Low impact and fuel efficient fishing—Looking beyond the horizon. Fish. Res. 119–120, 135–146. doi: 10.1016/j.fishres.2011.12.009
Wakefield, C. B., Hesp, S. A., Blight, S., Molony, B. W., Newman, S. J., and Hall, N. G. (2018). Uncertainty associated with total bycatch estimates for rarely-encountered species varies substantially with observer coverage levels: informing minimum requirements for statutory logbook validation. Mar. Pol. 95, 273–282. doi: 10.1016/j.marpol.2018.05.018
Walsh, W. A., Ito, R. Y., Kawamoto, K. E., and McCracken, M. (2005). Analysis of logbook accuracy for blue marlin (Makaira nigricans) in the Hawaii-based longline fishery with a generalized additive model and commercial sales data. Fish. Res. 75, 175–192. doi: 10.1016/j.fishres.2004.11.007
Walton, L., and Jacobsen, I. (2019). Crab Fishery Level 1 Ecological Risk Assessment. Technical Report. Brisbane: State of Queensland.
Walton, L., and Jacobsen, I. (2020). Crab Fishery Level 2 Ecological Risk Assessment. Technical Report. Brisbane: State of Queensland.
Wardle, C. S. (1985). “Swimming activity in marine fish,” in Physiological adaptations of marine animals, Vol. 1985, ed. M. S. Laverack (Scarborough: The Co. of Biologists Ltd), 1.
White, W. T., Appleyard, S. A., Sabub, B., Kyne, P. M., Harris, M., Lis, R., et al. (2015). Rediscovery of the Threatened River Sharks, Glyphis garricki and G. glyphis, in Papua New Guinea. PLoS ONE 10:e0140075. doi: 10.1371/journal.pone.0140075
Keywords: bycatch, trap fishery, movement, elasmobranch, mitigation, endangered species, mud crab, glyphis
Citation: Pillans RD, Fry GC, Carlin GD and Patterson TA (2022) Bycatch of a Critically Endangered Shark Glyphis glyphis in a Crab Pot Fishery: Implications for Management. Front. Mar. Sci. 9:787634. doi: 10.3389/fmars.2022.787634
Received: 01 October 2021; Accepted: 07 February 2022;
Published: 08 April 2022.
Edited by:
Vitor H. Paiva, University of Coimbra, PortugalReviewed by:
Vincent Raoult, The University of Newcastle, AustraliaHeather Welch, University of California, Santa Cruz, United States
Copyright © 2022 Pillans, Fry, Carlin and Patterson. This is an open-access article distributed under the terms of the Creative Commons Attribution License (CC BY). The use, distribution or reproduction in other forums is permitted, provided the original author(s) and the copyright owner(s) are credited and that the original publication in this journal is cited, in accordance with accepted academic practice. No use, distribution or reproduction is permitted which does not comply with these terms.
*Correspondence: Richard D. Pillans, cmljaGFyZC5waWxsYW5zQGNzaXJvLmF1