 Dwight Owens*
 Dilumie Abeysirigunawardena
 Ben Biffard
 Yan ChenPatrick Conley
 Reyna JenkynsShane KerschtienTim LavalleeMelissa MacArthurJina MousseauKim Old
 Meghan Paulson
 Benoît Pirenne
 Martin ScherwathMichael Thorne
- Ocean Networks Canada, University of Victoria, Victoria, BC, Canada
The advent of large-scale cabled ocean observatories brought about the need to handle large amounts of ocean-based data, continuously recorded at a high sampling rate over many years and made accessible in near-real time to the ocean science community and the public. Ocean Networks Canada (ONC) commenced installing and operating two regional cabled observatories on Canada’s Pacific Coast, VENUS inshore and NEPTUNE offshore in the 2000s, and later expanded to include observatories in the Atlantic and Arctic in the 2010s. The first data streams from the cabled instrument nodes started flowing in February 2006. This paper describes Oceans 2.0 and Oceans 3.0, the comprehensive Data Management and Archival System that ONC developed to capture all data and associated metadata into an ever-expanding dynamic database. Oceans 2.0 was the name for this software system from 2006–2021; in 2022, ONC revised this name to Oceans 3.0, reflecting the system’s many new and planned capabilities aligning with Web 3.0 concepts. Oceans 3.0 comprises both tools to manage the data acquisition and archival of all instrumental assets managed by ONC as well as end-user tools to discover, process, visualize and download the data. Oceans 3.0 rests upon ten foundational pillars: (1) A robust and stable system architecture to serve as the backbone within a context of constant technological progress and evolving needs of the operators and end users; (2) a data acquisition and archival framework for infrastructure management and data recording, including instrument drivers and parsers to capture all data and observatory actions, alongside task management options and support for data versioning; (3) a metadata system tracking all the details necessary to archive Findable, Accessible, Interoperable and Reproducible (FAIR) data from all scientific and non-scientific sensors; (4) a data Quality Assurance and Quality Control lifecycle with a consistent workflow and automated testing to detect instrument, data and network issues; (5) a data product pipeline ensuring the data are served in a wide variety of standard formats; (6) data discovery and access tools, both generalized and use-specific, allowing users to find and access data of interest; (7) an Application Programming Interface that enables scripted data discovery and access; (8) capabilities for customized and interactive data handling such as annotating videos or ingesting individual campaign-based data sets; (9) a system for generating persistent data identifiers and data citations, which supports interoperability with external data repositories; (10) capabilities to automatically detect and react to emergent events such as earthquakes. With a growing database and advancing technological capabilities, Oceans 3.0 is evolving toward a future in which the old paradigm of downloading packaged data files transitions to the new paradigm of cloud-based environments for data discovery, processing, analysis, and exchange.
Introduction
About Ocean Networks Canada
Ocean Networks Canada (ONC), a University of Victoria initiative, operates world-class cabled ocean observatories in the northeast Pacific, Arctic and Atlantic Ocean basins for the advancement of science and the benefit of Canada. With an operational design life of more than 25 years, the Ocean Networks Canada infrastructure collects and provides essential data required to address pressing scientific and policy issues. The innovative cabled infrastructure supplies continuous power and Internet connectivity to a broad suite of subsea instruments from coastal to deep-ocean environments. These observatories are supplemented by sensors installed on ferries, autonomous gliders and moorings, coastal radars, and other instrument technologies. Data acquired through these systems are provided freely and in near real time, from thousands of instruments distributed across some of the most diverse ocean environments found anywhere on Earth.
As one of the original Major Science Initiatives (MSI) funded by the Canadian Foundation of Innovation (CFI), Ocean Networks Canada is a national research facility hosted and owned by the University of Victoria. The total investments to build and operate the ocean observatories exceed $350M to date.
Ocean Networks Canada is among the vanguard of organizations advancing ocean intelligence, as the data, data products, and services from ONC physical and digital infrastructure support research by a growing cohort of scientists across diverse sectors and disciplines (see Supplementary Figure 43), inform policy decisions, provide a platform for Canadian industry to test and develop instruments and respond to events, and transform ocean technology and infrastructure into new knowledge that positions Canada at the forefront of the field.
Purpose of This Paper
This paper serves several purposes. First, an end-to-end description of data acquisition, processing, storage and product generation systems is provided to help scientific users better understand how ONC manages and serves data. This knowledge will help the researcher gain confidence in reliability and reproducibility of ONC data, while supporting needs to describe data provenance for scientific applications. The goal is to provide a citable reference for the ocean scientist.
Secondly, this paper is intended as a general reference for the overall Oceans 2.0/3.0 software framework, which will be of interest to those working in the areas of scientific data management systems and oceanographic data repositories. This paper does not delve deeply into the specifics of code, but rather provides a broad overview of the many platforms and capabilities comprising Oceans 2.0/3.0.
Motivations for a Data Management System
Decades of experience with expensive scientific observatories (both space-based, e.g., the Hubble Space Telescope, and terrestrial, e.g., large seismic arrays in several countries) have demonstrated the value of maintaining well-curated data archives. An observing system that costs on the order of 108 to 1010 dollars to design, implement and operate for any number of years must ensure its legacy – typically the data it collects – remains available for the longest possible time; doing so enables verification and reproducibility of results, and can often lead to new, unexpected discoveries. The long-term scientific productivity of projects like the Voyager probes (still producing data 44 years after they were launched) and Hubble (18,000+ scientific papers with 900,000+ citations) is attributable in no small part to the efforts made from the early design phase to include an associated data management and archiving system (Pirenne et al., 1993).
The large, real-time, high time-resolution ocean observatories pioneered by Ocean Networks Canada’s VENUS and NEPTUNE initiatives have similar long-term requirements for data management. From the early days, it became quickly apparent to the promoters of these initiatives that they could not be justified from either a science perspective (need for observations spanning decades) or a financial responsibility perspective (investment well into the $108 range) without a robust companion data management system.
Genesis of the System
With the need for a data management system clearly established in the early stages, the promoters of VENUS and NEPTUNE commissioned studies to assess needs, including the expected data types that the ocean observing systems would produce, together with design considerations and indications of an overall architecture. One such study was performed by the National Research Council’s Canadian Astronomy Data Centre (CADC) in 2004. CADC had, at the time, over 15 years of experience in dealing with research data from a variety of astronomical telescopes, both spatial and terrestrial, and with their curation, processing and visualization.
Toward the end of 2004, with the first staff in place, a prototype Data Management and Archiving System (DMAS) was developed to demonstrate the data acquisition, registration of new data and their archival. Simple but representative instruments were connected to the system, as shown in Figure 1.
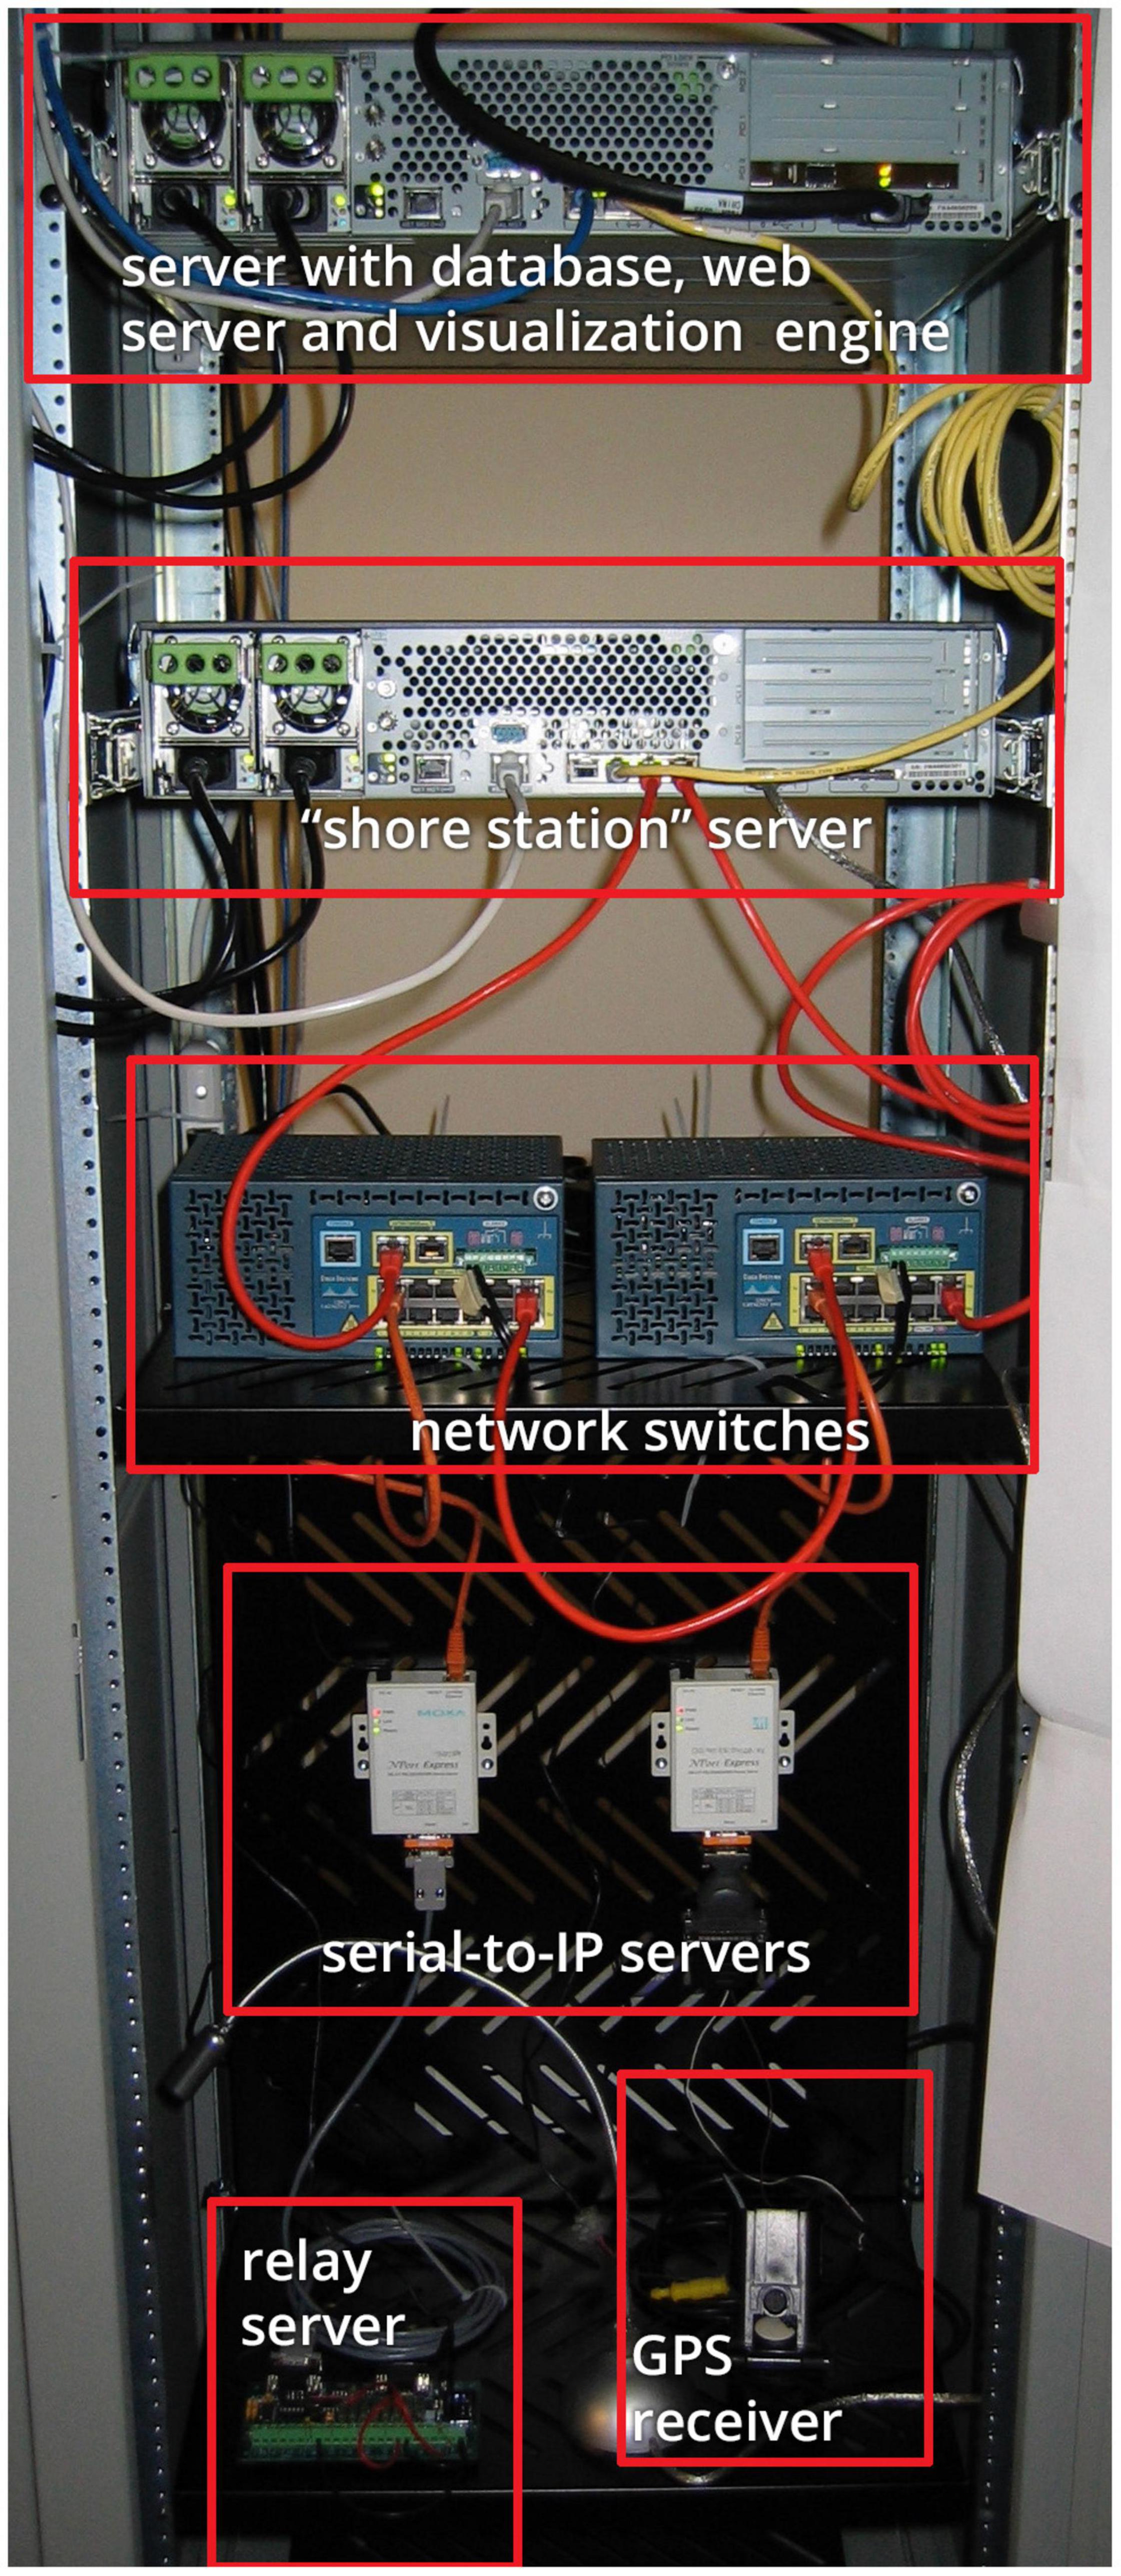
Figure 1. View of Prototype DMAS, implemented in a single equipment rack. At top is the initial concept of the “data center,” a server running the data repository, consisting of a database, web server and visualization software. Second from top is a server running the “shore station” with “drivers” that implement the communication protocols of each instrument, parsing and pre-processing. In the middle is network equipment that implements the tree topology of the infrastructure: switches representing connections within the network. Second from bottom are a pair of serial-to-IP terminal servers that interface to the “instruments” at the bottom of the image, in this example, including a relay server and a GPS receiver. This high-level architecture is still in place today, with multiple “shore stations” and hundreds of instruments supported.
The structure defined and tested through the prototype led to the development of an architecture that satisfied the eight requirements (Supplementary Table 1) of the nascent ocean data management system and which remain key structural elements in place today.
Following the prototype, an interim DMAS was developed to support the first of the VENUS arrays in Saanich Inlet on Vancouver Island, which went operational in February 2006. The key elements (including data center and shore station) were maintained, as developers focused on implementing code to interface with the various instruments deployed. Initially the Sybase relational data management system was chosen as a metadata database. A file management system called AD, in use at the CADC and at the European Southern Observatory, was implemented to host the data records from each instrument, split into 24-h data segments.
The interim DMAS rapidly evolved into a full-fledged system to support the second VENUS array (2008) and the NEPTUNE sensor network in 2010. Today, the system continues to grow and adapt, supporting an ever-expanding array of instruments and data types, and the significant combination of data products that can be derived from them. The flexibility and extensibility of the system has enabled expansion to support multiple communication technologies, and to collect data from many different locations, including the harshest deep ocean and arctic environments. The system also supports an increasingly diverse array of applications including an earthquake early warning system and a planned neutrino observatory. In 2012, DMAS was renamed and became known as Oceans 2.0, reflecting Web 2.0 concepts of user contribution and participation, as described by Murugesan (2007) (see section “User-Contributed Content”).
Features
The features of Oceans 2.0 were implemented to address the key top level requirements identified in Supplementary Table 1. Ocean Networks Canada designed a system structure and topology (illustrated in Figure 2) that would be able to support any number of sensors, instruments, sites and networks, modeled on the tree structure used by Internet Protocol (IP) networks (Rose and McCloghrie, 1990).
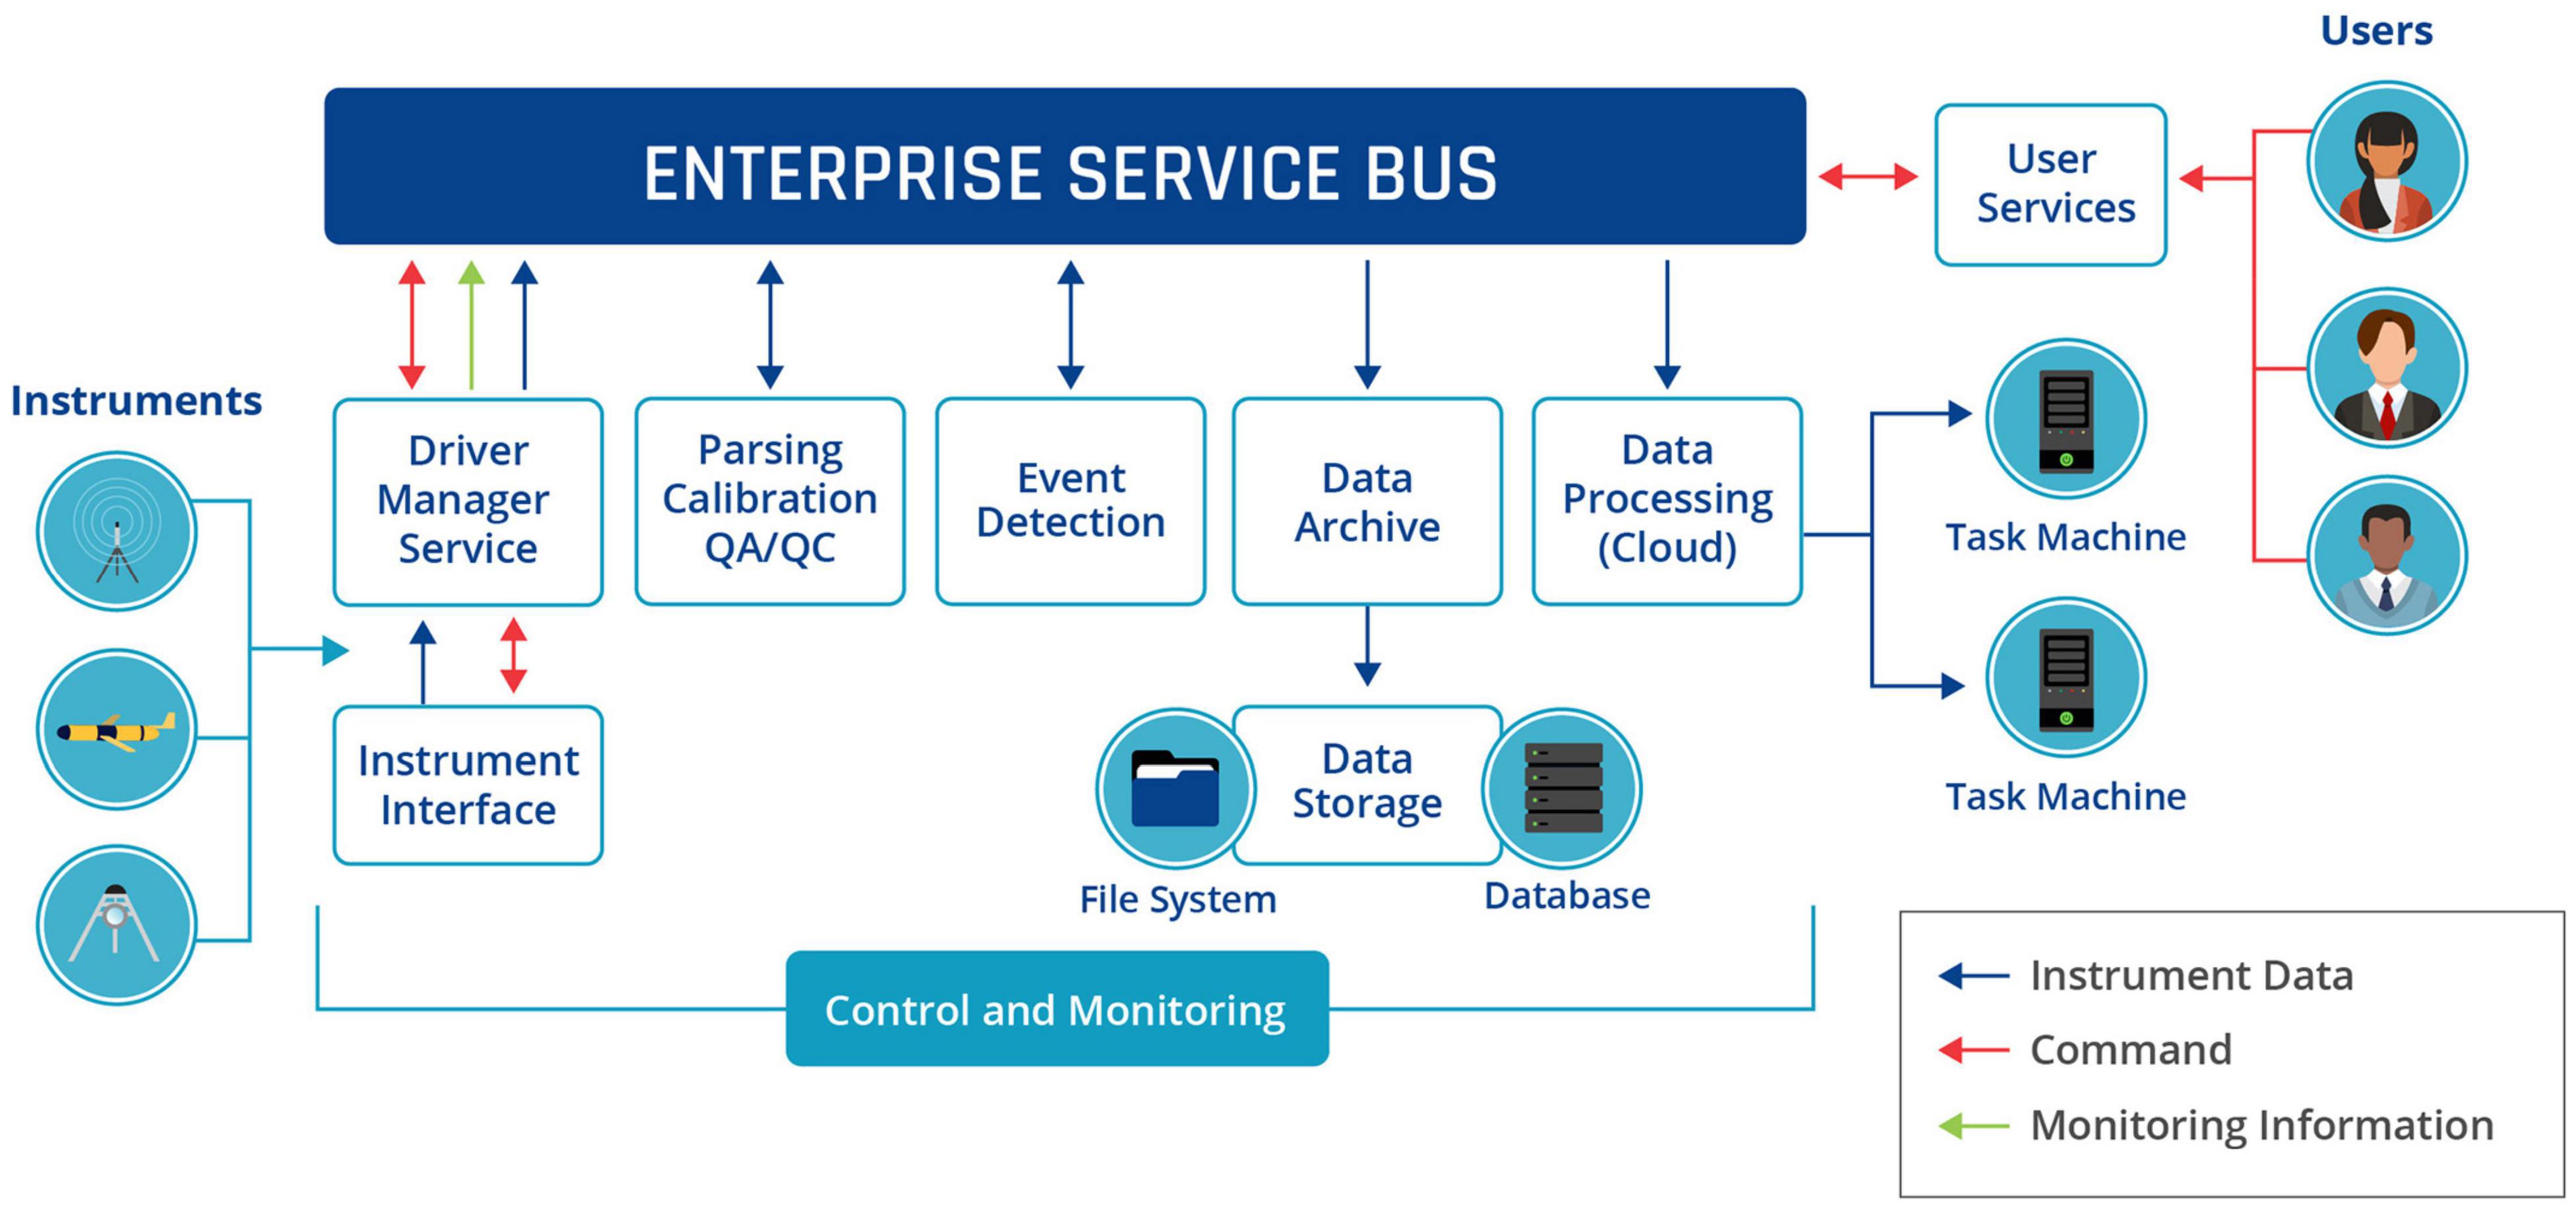
Figure 2. Overview of the Oceans 2.0/3.0 Data Management and Archiving System (DMAS) structure, where a number of interconnected modules perform specific activities and pass their results to an Enterprise Service Bus for other subscribing modules to take on and process further.
In ensuing years, the efforts of the Oceans 2.0 team consisted primarily in implementing:
• support for additional instrument types;
• new data products, i.e., packaging of data into containers that satisfy international or industry standards;
• improvements of visualization methods for the various data types (from time-series plots to hydrophone spectra to combined views of environmental sensors data next to video streams);
• dedicated tools to help users not only view data but describe or annotate these data streams (SeaTube, Digital Fishers);
• dedicated applications to allow the automated contribution of field data measured by trained individuals anywhere around the world (Community Fishers);
• the ability to generate and associate Digital Object Identifiers to datasets, with tracking of their reprocessing history and versioning;
• an integrated observatory management system that includes full instrument preparation workflow, real-time monitoring and control of the infrastructure and full instrument metadata management, including the complete history of the instruments throughout their lifetime at ONC.
At the time of this writing, Oceans 3.0 supported:
• 9400 active sensors producing data;
• 930+ instruments producing data daily;
• 299 unique file-based data products;
• 8600 pre-generated plots produced daily;
• 2550 average daily data requests;
• 430 GB average volume of uncompressed data archived per day;
• 1.2 PB total uncompressed volume of archived data.
The rest of this review explores Oceans 2.0/3.0 features in depth.
Architecture
Planning for Renewal
Ocean Networks Canada observatories are research infrastructures intended to last at least 25 years. This includes both the physical as well as the digital components. Given the pace of technology evolution, the design and operational plans must account for different time scales/lifetimes of various components so that they can be replaced as needed to retain currency with the state of the art, while providing continuity of service. Typical operational lifetimes for various technology elements are listed in Supplementary Table 2; these correspond to replacement cycles anticipated in the ongoing maintenance and renewal of the ONC’s research infrastructures.
At its core, Oceans 3.0, the digital component of the Ocean Networks Canada research infrastructure, is a comprehensive management system for sensor networks. As a centrally managed infrastructure, its overall structure is hierarchical and tree-like, modeled after the Internet Protocol (IP) structure. As briefly presented in the introduction, it can be depicted in an entity-relationship diagram as illustrated by Figure 3.
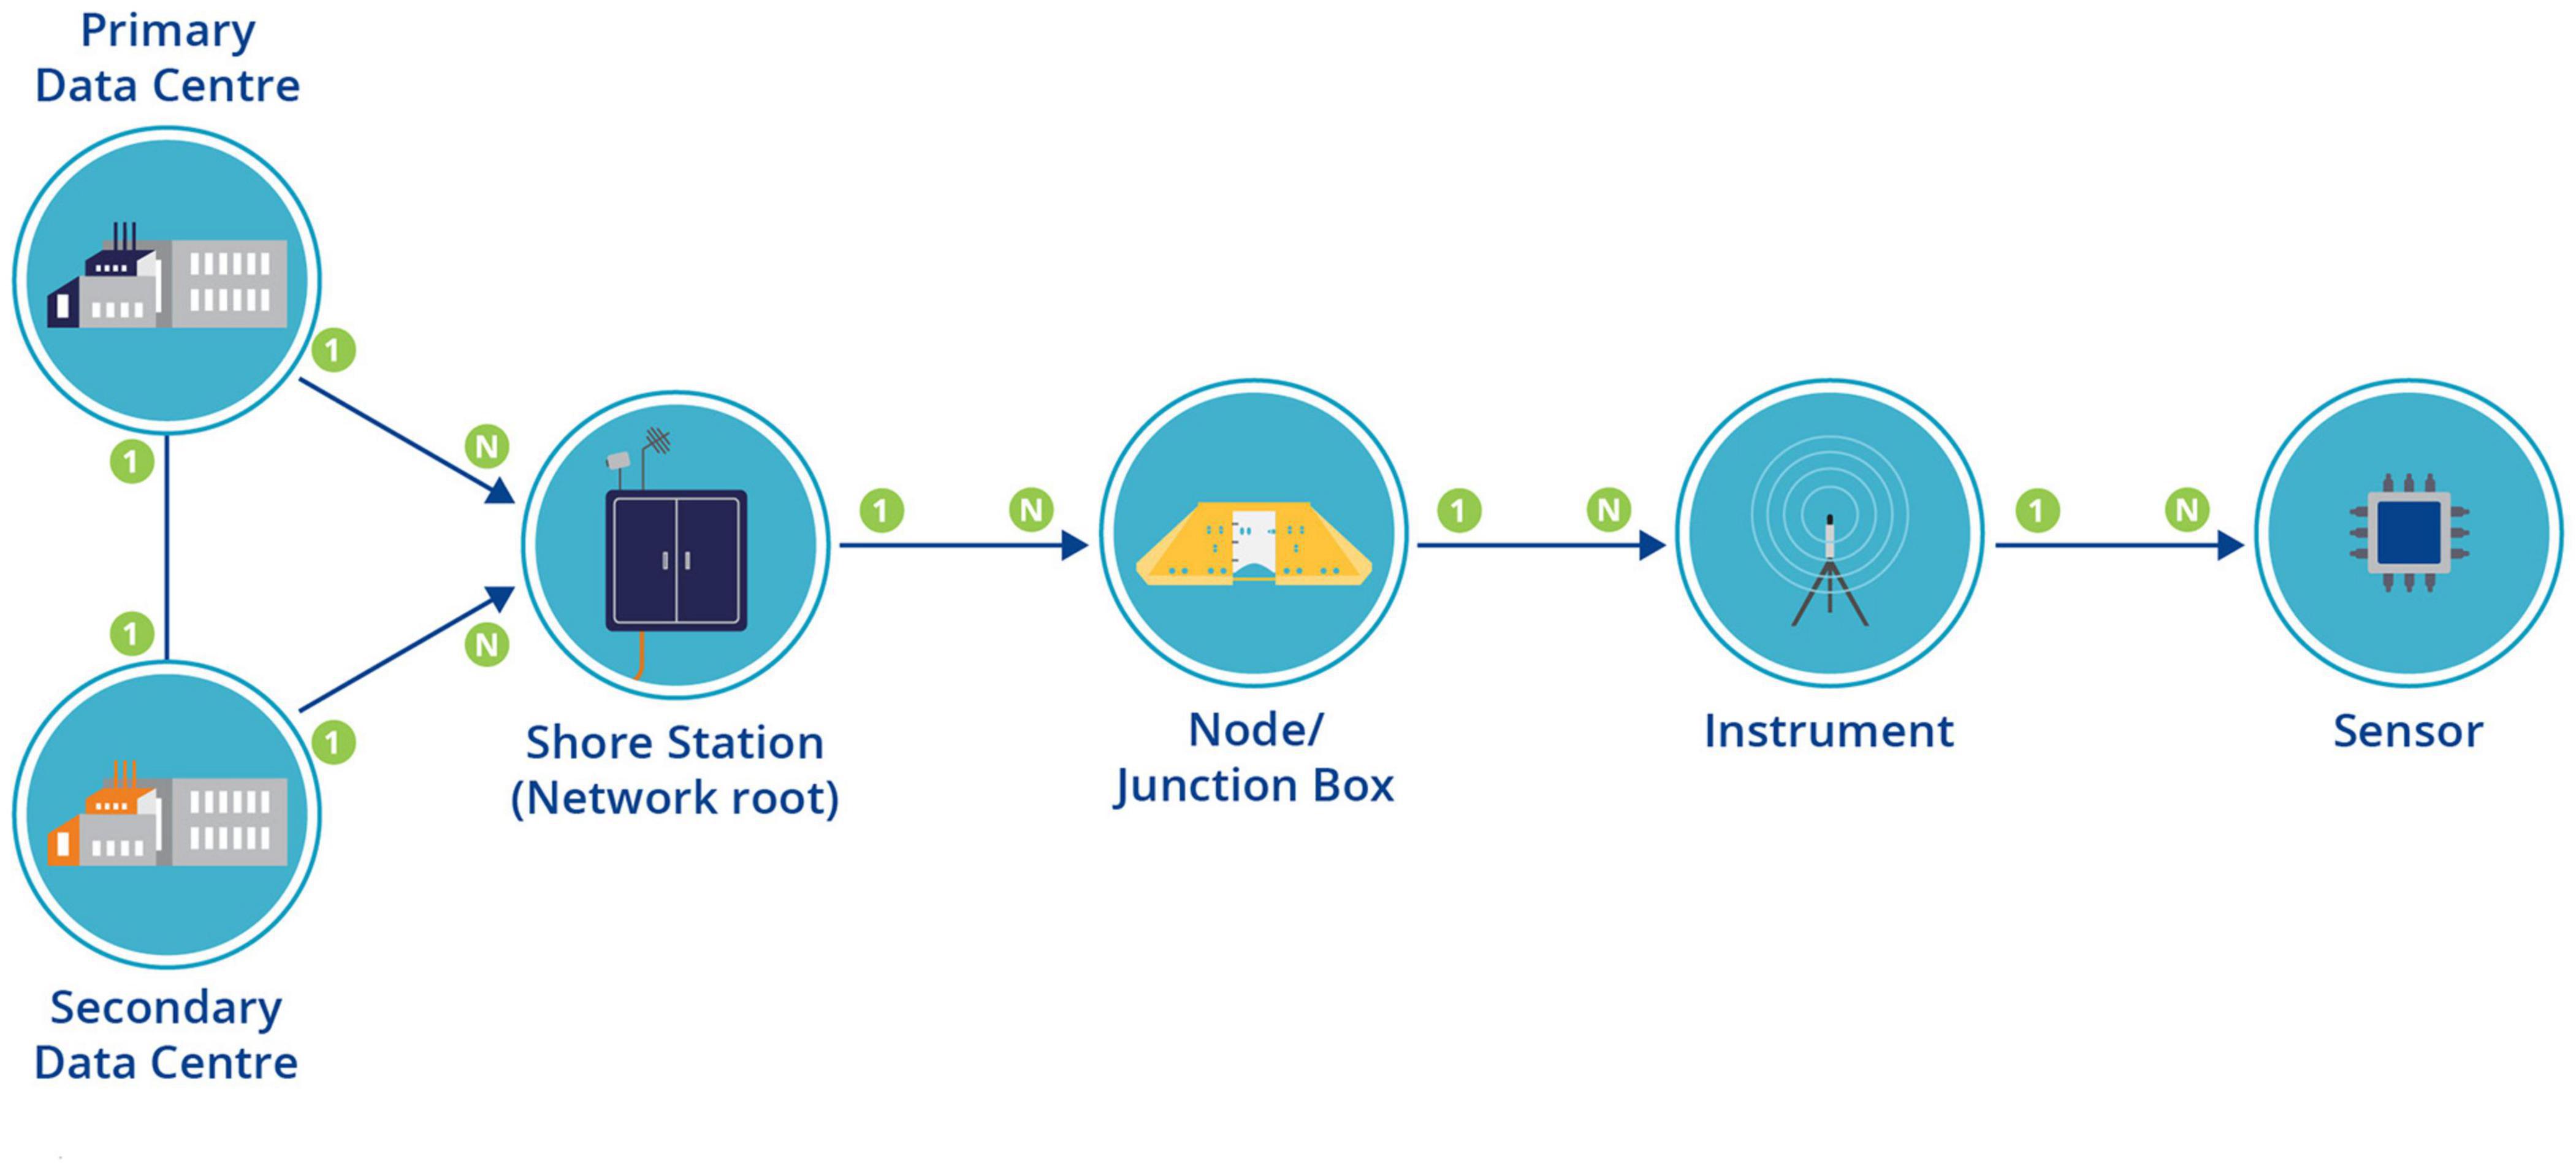
Figure 3. ONC infrastructure represented by hierarchical entity-relationships extending from data center to sensor. The primary and secondary data centers support n shore stations, which in turn connect n nodes or junction boxes. Each junction box may have n connected instruments, with each instrument comprising n sensors.
Network
Ocean Networks Canada operates a collection of sensor networks, distributed across a vast geography, nearly extending from pole to pole, with systems in the Arctic as well as one being prepared for deployment in Antarctica as of this writing, and systems on both the Pacific and Atlantic coasts of Canada. The sensor networks and all the key elements of ONC data centers are integrated in a Class A private network (rooted at the non-routable IPv4 address 10.x.x.x). Interconnections between the distributed segments of the network are performed over virtual private networks (VPNs) that integrate a variety of Internet service provision methods ranging from cabled terrestrial, to wireless, and to satellite.
Ocean Networks Canada operates three data centers; the primary data center is located at the University of Victoria, in British Columbia, while secondary data centers (described in section “Business Continuity and Disaster Recovery”) are housed in the interior region of British Columbia and Ontario. The backup data centers provide an important safeguard in the event of disruptions caused by a potential major seismic event on Canada’s West Coast.
Ocean Networks Canada operates multiple shore stations, which provide a focal point and a root for their local subnet. The shore stations host equipment for communication with individual instruments, typically (but not always) located underwater. The overall configuration of shore stations, data centers and network connections is illustrated by Figure 4.
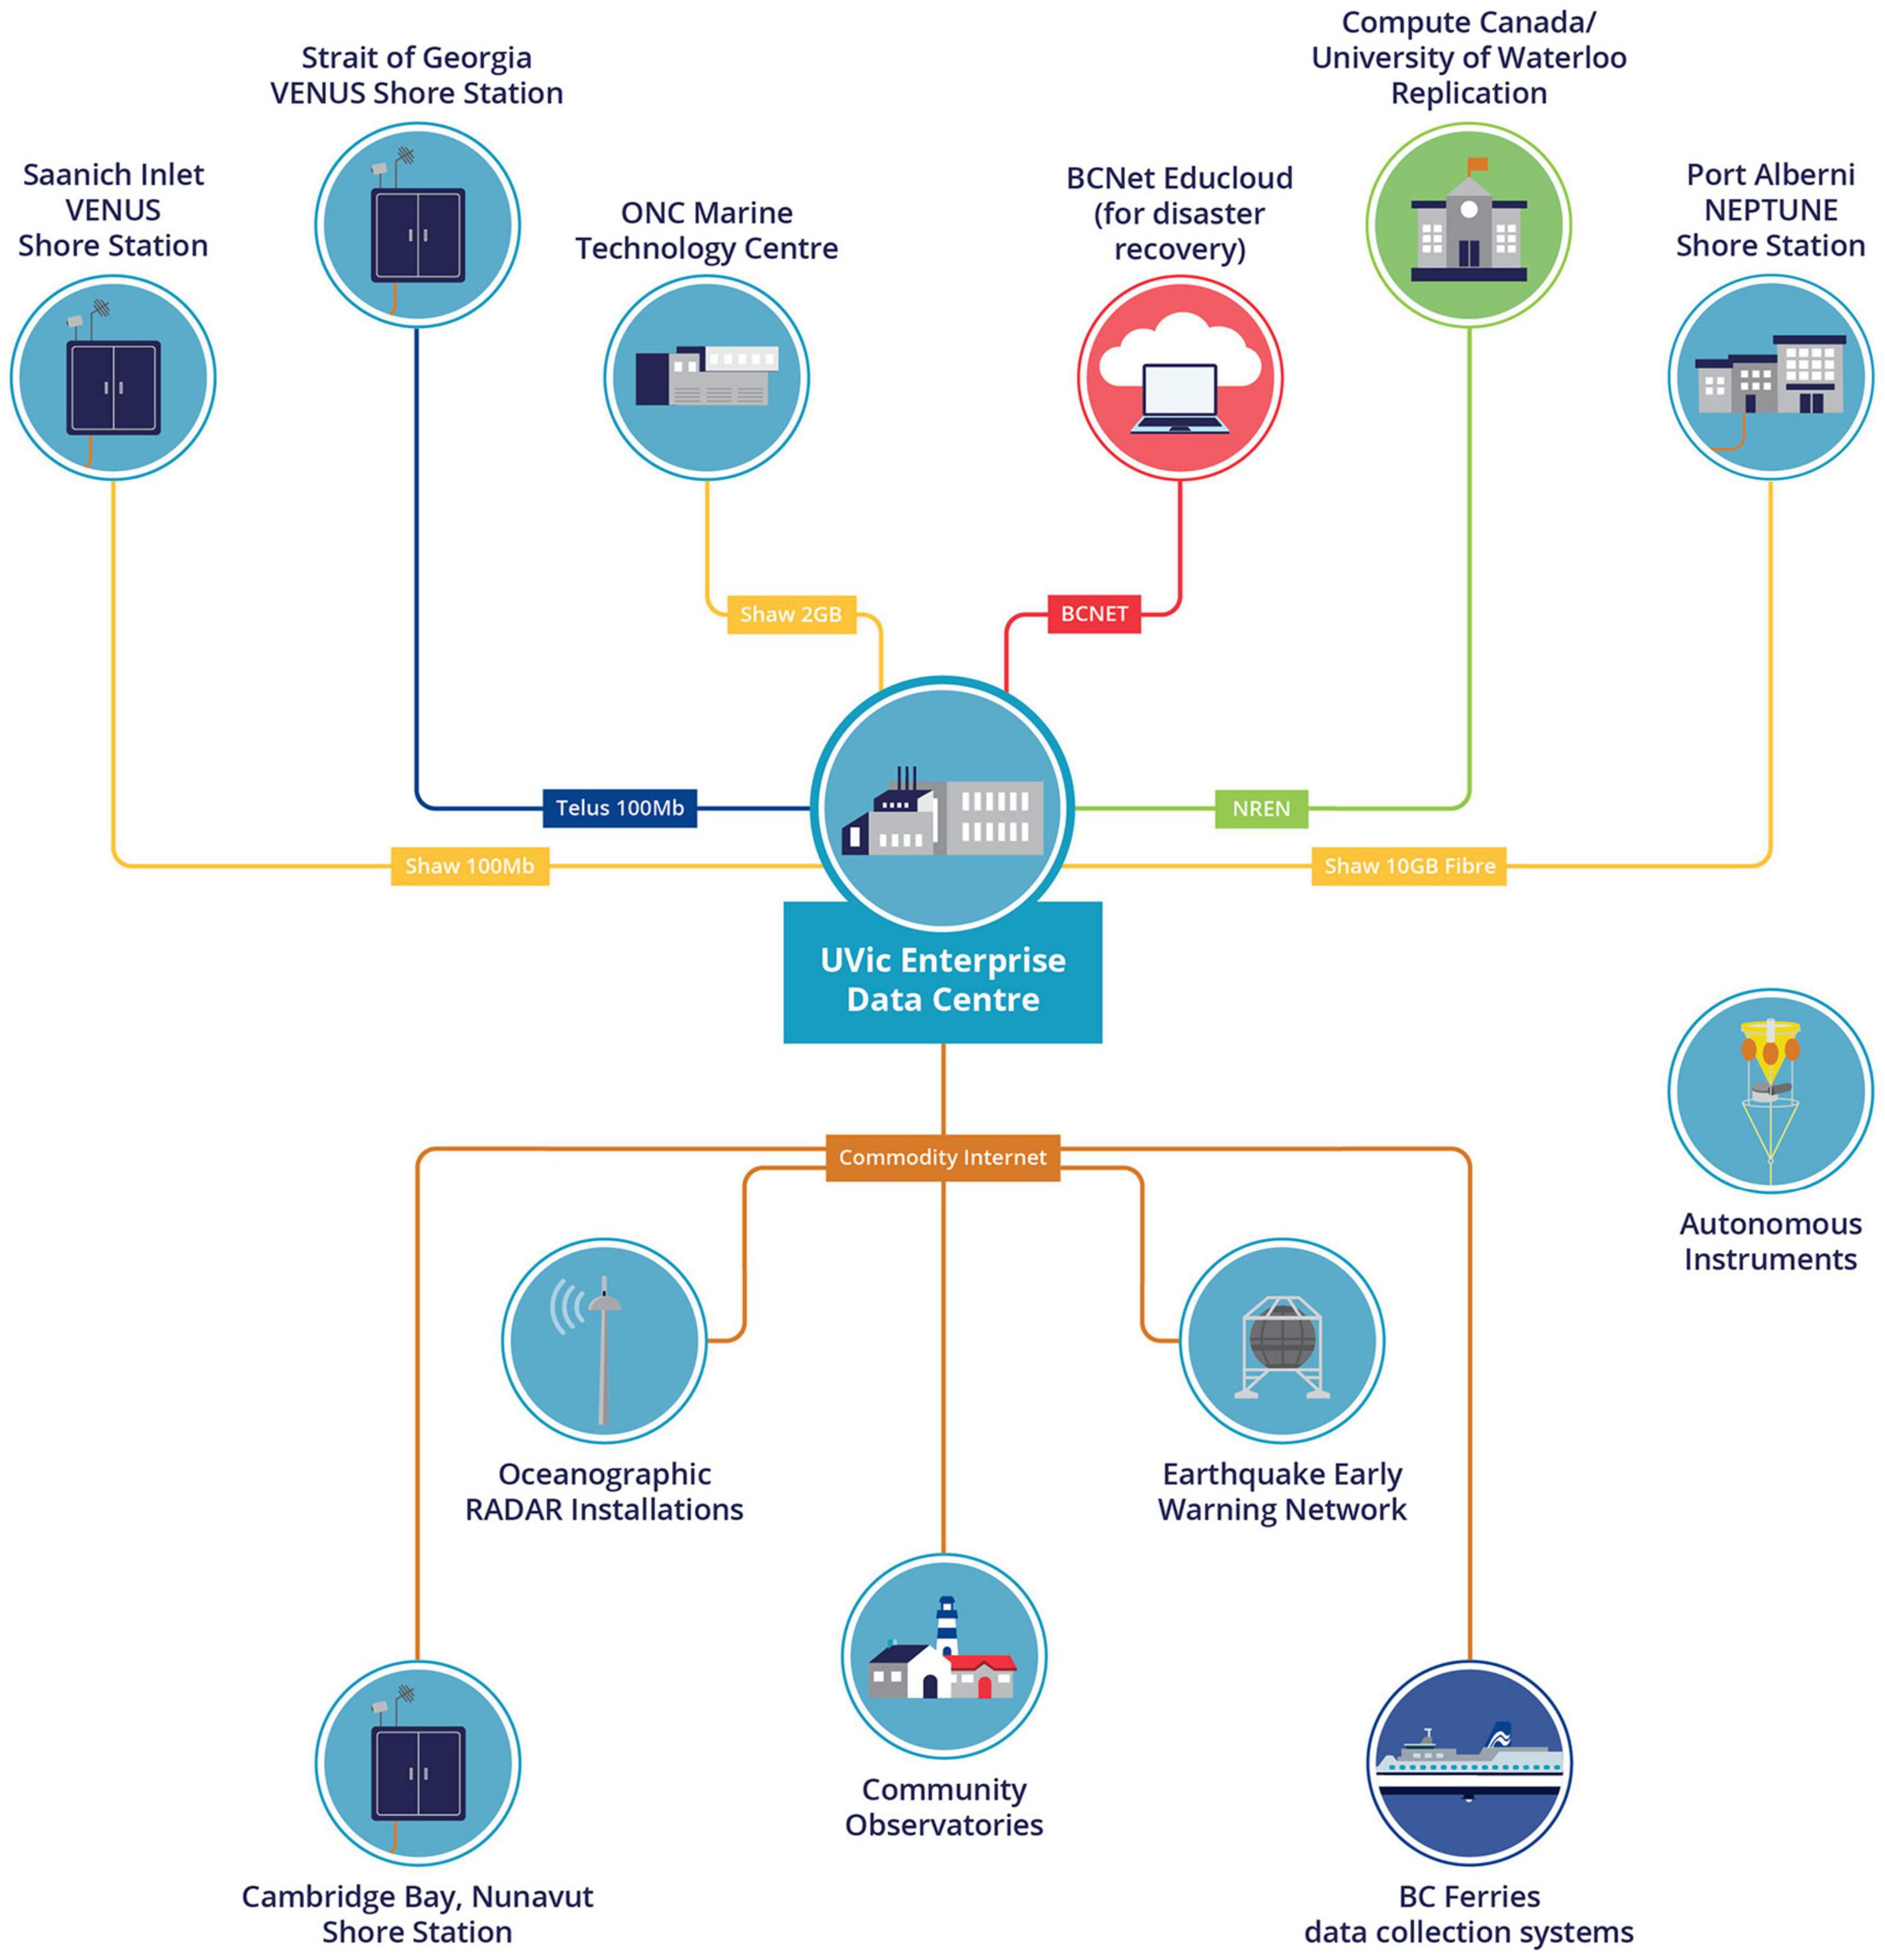
Figure 4. ONC networks connecting shore-based network nodes to the University of Victoria Enterprise Data Centre.
Since ONC’s infrastructure is essentially an extension of the Internet underwater, Internet Protocol (IP) access is extended as far as possible toward the sensor endpoints. For legacy serial instruments, terminal servers located in junction boxes translate the serial protocol to make their data available over IP. The terminal servers are configured to act as servers, while software drivers interacting with instruments act as clients for the purpose of the socket connection.
Timing
An integral aspect of Ocean Networks Canada facility design, and a key enabler of multi- and trans-disciplinary research, is the ability to coordinate observations between completely different observing systems (such as satellites and in situ sensors). This is only possible if a single, very accurate clock signal is available to synchronize all the readings from all instruments.
Ocean Networks Canada’s largest observing infrastructure (the NEPTUNE observatory) is equipped with three GPS clocks that follow the IEEE1588 Precision Time Protocol and can be inter-compared to ensure provision of the most accurate absolute time signal to all instruments underwater. All readings from all instruments are time-stamped at the shore station, and that time is used if the instrument cannot autonomously synchronize its internal clock with the shore station master clocks.
A single time reference allows the researcher to make direct comparisons between events seen in distinct data streams, for example, camera video and temperature readings, or the collation of data from seismic devices across the network to derive an earthquake epicenter. Additionally, the system enables secondary clocks to provide a higher accuracy time signal for specific local experiments, such as a planned neutrino observatory that will require nanosecond-level local timing.
Data Storage Formats
Resisting trends to build an archive in which datasets are stored in short-lived formats, or to choose one format among competing standards, ONC system architects decided to remain agnostic with respect to formats and select for internal storage those most appropriate for the given application. However, data downloads always respect users’ choices. For example, Oceans 3.0 delivers the same data to users, whether formatted as Comma-Separated Values (CSV), in a MATLAB table or in NetCDF. To enable this, Oceans 3.0 performs format conversions on the fly when generating products from internally stored data. This averts the possibility of being locked into specific stored formats that could be deprecated after a few years, requiring costly internal conversions. ONC believes this approach has been a beneficial best practice, both for data managers and users, thanks to its flexibility.
Hardware and Software Technologies
A variety of hardware platforms, software systems and technologies are combined to host and operate Oceans 3.0, including storage and database systems, virtualization infrastructure, and physical machines for specialized applications.
Ocean Networks Canada’s main storage system is a NetApp FAS8200 NAS (Network Attached Storage) with 1.5 PB of available storage as of July 2021. This system hosts the Oceans 3.0 Archive Data file server and archives. In addition, it hosts the Oceans 3.0 web server and all of ONC’s virtual machines and associated file systems as well as ONC’s supporting software systems used for system monitoring and graphing, issue tracking, documentation (including extensive details on data models, software requirements, design, etc.), and content management. These main data holdings are replicated in two back-up locations, as described in section Business Continuity and Disaster Recovery. At the time of writing, an additional layer of replication was in process of transitioning from Tivoli Storage Manager to Google Cloud.
Two main database systems support Oceans 3.0: Postgres and Cassandra. The Postgres database, which stores Oceans 3.0 metadata, is instantiated as a read/write master in the University of Victoria Enterprise Data Centre (UVic EDC), with read-only replicas at the UVic EDC and in the BCNet Educloud. The Cassandra no-SQL database, which stores Oceans 3.0 scalar data and other readings, is implemented as a 16-node cluster in the UVic EDC, with each datapoint replicated three times across the cluster. A backup Cassandra instance is implemented on BCNet Educloud across 12 nodes.
Ocean Networks Canada’s virtualization infrastructure supporting all Oceans 3.0 software development and production platforms runs on 21 physical servers, supporting over 170 virtual machines.
Seven dedicated task machines are also in operation, performing all of the computation and rendering for Oceans 3.0 data product generation. At the time of writing, ONC was in process of shifting from CPU-based to GPU-based platforms for data product generation, with work underway to partially implement these within Compute Canada’s cloud environment.
Instrument driver software runs on driver machines located in all ONC shore stations. These driver machines are operated as a redundant pair of machines, with the backup configured as a warm standby. The drivers running on these systems connect to oceanographic instruments, retrieve raw data and feed these data into the upstream components of the Oceans 3.0 data acquisition and archival system.
Oceans 3.0 runs on Gemini servers under the CentOS Linux operating system (Gemini is an open-source lightweight application-level server supporting the Open Service Gateway Initiative (OSGi) and encapsulating the ubiquitous open-source Tomcat server). Some of the main software systems used to operate Oceans 3.0 include the ActiveMQ messaging service (for transferring data, scheduling jobs and handling communications among Oceans 3.0 computing components), Zenoss (for network monitoring), Prometheus, Graphite and Grafana (for metrics and monitoring), Graylog and Splunk (for log file aggregation) and Wowza (for video recording and streaming).
Business Continuity and Disaster Recovery
Because ONC shore stations and data center are all located in seismically active areas, ONC operates two disaster recovery locations, one in Educloud hosted in Kamloops, British Columbia (a location far removed from the coastal seismic hazard zone) and a second in Compute Canada hosted at the University of Waterloo, Ontario, Canada.
The disaster recovery location at the University of Waterloo maintains an exact copy of all archived instrument and sensor data. Data are copied daily and periodically checked for consistency. At the time of this writing, the replication and consistency verification processes were being revamped to accommodate the large volume of archived data, in excess of 10TB and 2 million files per month. A third replica of archived data was formerly maintained on tape backups. Due to rising costs of operating a tape library ONC decided to transition the third replica to Google Cloud in Montréal.
The Educloud disaster recovery location runs all the software required to start Oceans 3.0 in the event of a major disaster impacting the UVic data center. This includes database replicas (Cassandra and Postgres) and virtual machines. Aside from Oceans 3.0, this also includes development, documentation and monitoring systems required to maintain and operate Oceans 3.0.
User Management and Access Restrictions
Since Oceans 3.0 was designed not only for providing access to the data produced by instruments on the networks but also for managing and controlling those instruments, a user management scheme was integrated into the design of Oceans 3.0. Permission schemes for individuals and groups, as well as functions that require group authorization have been implemented and offer the full range of authentication/permissions features. The operation of a specific instrument, for example an underwater camera, assigns permissions to one implicit group and two explicit groups for managing the various operational aspects. The implicit group’s permissions are restricted to merely viewing what the camera is seeing. One of the explicit groups allows its members to operate the camera (e.g., illuminate the lights, move the pan and tilt), whereas the third group members are allowed to change the observing program schedule.
Login is not required for simply browsing or accessing data; an anonymous use mode was implemented, which does not provide any access to specific features or assistance with data requests that may have gone awry. Login is required for users wanting to contribute content to the system, for instance to add annotations to data streams such as hydrophone audio or video recordings; this login requirement enables traceability, reporting by source, and helps prevent system abuse.
Specific cases where login is required also provide access to restricted data. Whereas the vast majority of the data are available immediately to users without any restrictions, in some specific cases restrictions are applied for sensitive data (more on this in section “Metadata”). This occurs when Oceans 3.0 is the repository of another organization’s data, governed by data agreements that stipulate either limiting access restrictions to a specific group or for a proprietary period lasting from minutes to years. These restrictions are applied broadly by device, or specifically by data product and time for specific users and groups. Data restrictions are adhered to throughout Oceans 3.0, including programmatic access, interactive data access and all downloads. Data access restrictions are also configurable in the user management system of Oceans 3.0.
Data Acquisition and Archival
The Oceans 3.0 data acquisition and archival system ingests readings from oceanographic instruments (referred to as devices), and stores them in database and file system archives. This highly automated pipeline is implemented by an interconnected set of software drivers, messaging queues, parsers, calibrators, Quality Assurance/Quality Control (QA/QC) tests, event detectors and archival routines.
Real Time Acquisition
Real time and near-real time data acquisition is handled by a series of systems and processes extending from instruments to database and file servers, as illustrated in Figure 5.
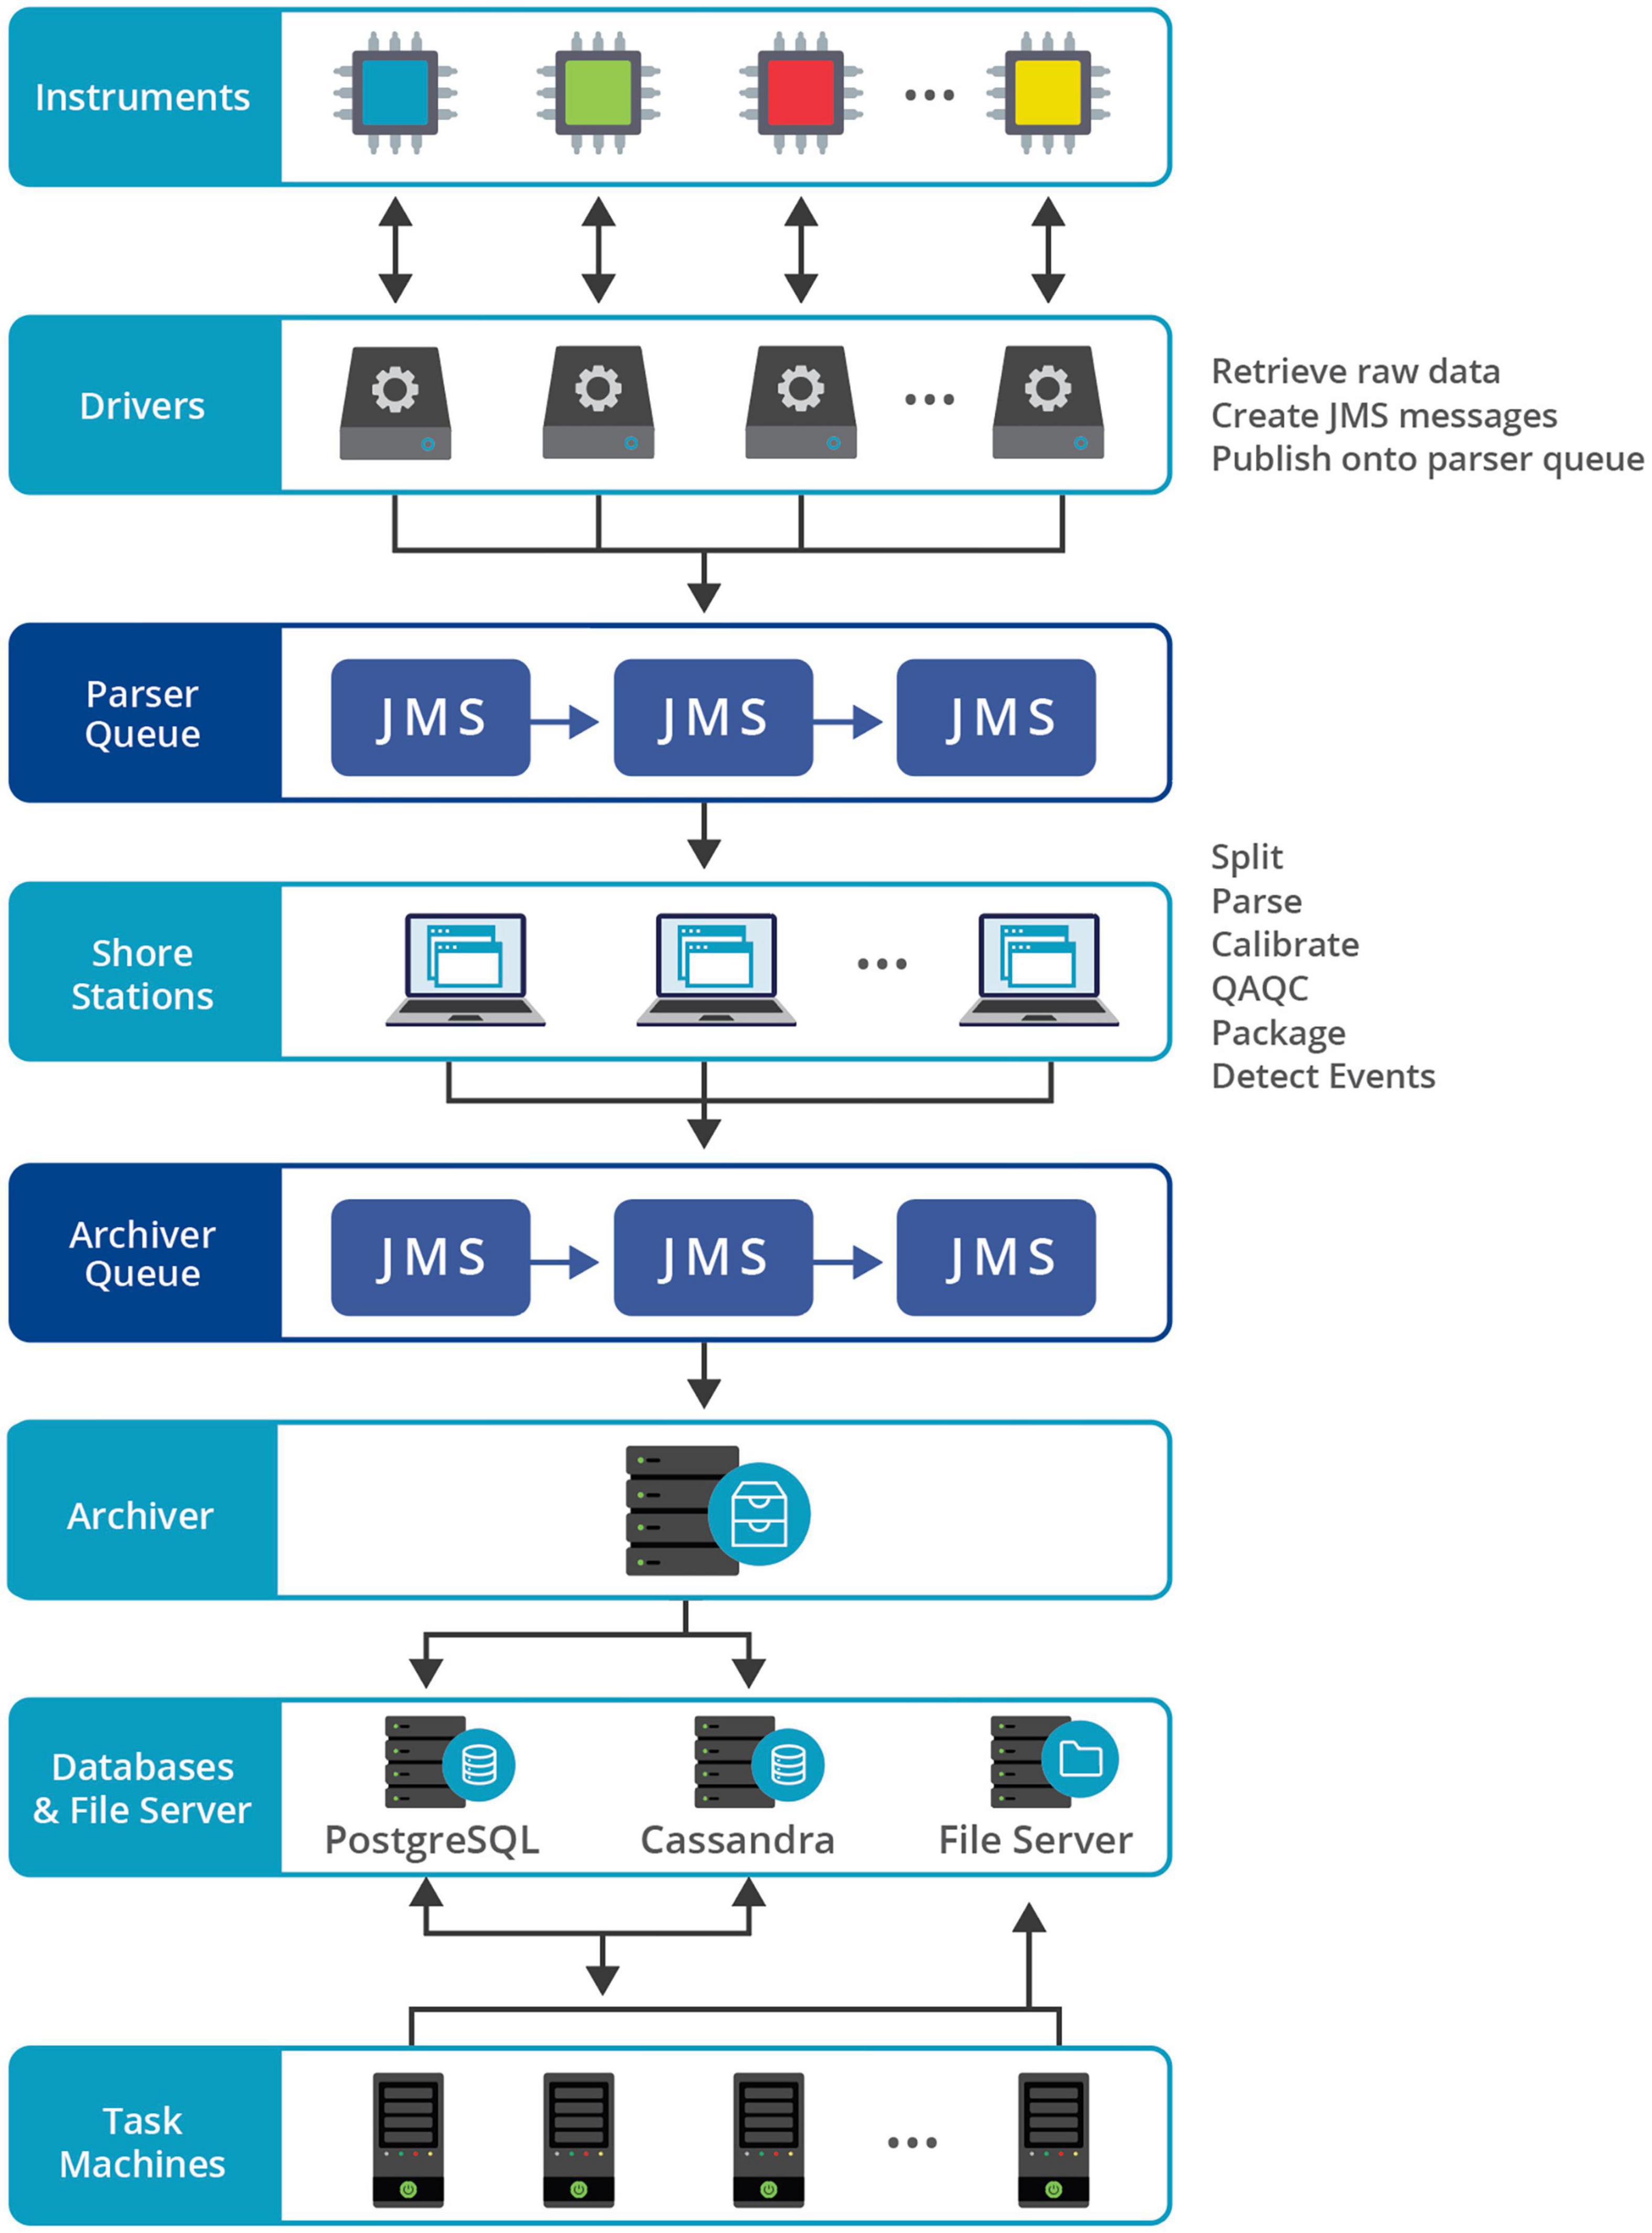
Figure 5. Conceptual diagram illustrating the major ONC data acquisition steps and components.
Step 1: Acquiring Data Readings
Programs that control and communicate directly with devices are called drivers within Oceans 3.0 nomenclature. The primary function of each driver is to acquire real time data from the device; they are designed to be as simple as possible for completion of this function. Drivers typically support a subset of the functions available on the target device, usually only commands related to configuring the device and retrieving data.
Data collected by drivers are published as Java Message Service (JMS) messages. Drivers are run on Java Virtual Machines (JVMs); there can be multiple drivers on one JVM. Typically, ONC spawns one JVM per physical machine and it is common practice to launch multiple JVM machines at a particular physical network location.
Within Oceans 3.0, network connections between drivers and devices are always handled through a Transmission Control Protocol (TCP) connection. Even serial data streams are converted into TCP format for network transmission. Different protocols are used for different devices, depending on configurations. Oceans 3.0 supports TCP, UDP, HTTP and SSH network connections.
Step 2: Publishing Onto the Parser Queue
Oceans 3.0 uses a publish and subscribe model for handling the JMS messages. These messages are published onto the parser queue. The JMS messaging standard is advantageous because of built-in failsafes, which ensure that any published message will reach its subscriber, even in the event of a lost connection or outage.
Oceans 3.0 employs the Active MQ implementation of JMS, which includes robust handshaking protocols and intermediary data backup. These messages are retrieved from the parser queue by the shore station for processing.
Step 3: Processing by the Shore Station
The Oceans 3.0 Shore Stations are not physical facilities, but rather JVMs running in the same physical location as the driver JVMs. These programs process JMSs sequentially, performing a number of operations along the way:
1. Splitting the raw data into components, such as device IDs or sub messages;
2. Parsing raw data and converting values into readings, configurations and complex data structures;
3. Calibrating parsed data, applying/converting units of measure, calculating derived quantities (e.g., salinity which is derived from other parameters);
4. QA/QC operations, such as checking for data out of bounds and flagging suspect data;
5. Packaging all of these elements into a new JMS containing the raw data along with parsed values, corrected values, derived values and QA/QC flags; and
6. Event detection, which can be any of a number of automated operations, depending on specific data values or ranges (e.g., sending an email).
Step 4: Publishing Onto the Archiver Queue
Finished JMS messages produced by the shore station are then published to the archiver queue, which is another instance of the Active MQ messaging service. This queue serves the same function as the parser queue, holding incoming messages, and allowing them to be picked up sequentially by the archiver, which subscribes to this queue.
Step 5: Archival
Although multiple shore stations are implemented within the Oceans 3.0 cyber infrastructure, there is currently only one archiver machine, which is another JVM running at the University of Victoria Enterprise Data Centre. The role of the archiver is to ensure all incoming data are stored in their proper storage systems. In the event that this system becomes overloaded or experiences malfunctions, the data remain in the MQ system until they can be safely archived. There is a manual process to re-ingest data failures and errors in the archiver (and the parsers on the shore stations). A new queue management and configuration system is being implemented in early 2022 which will allow for multiple archiver instances.
The incoming data, including raw data, sensor data and QA/QC flags, are stored in different systems, depending on the type of data. Currently, Oceans 3.0 supports the following storage systems:
• Postgres –an open-source SQL database, used for QA/QC flags in particular and all other metadata and data not stored in Cassandra;
• Cassandra – a no-SQL database, used to store parsed scalar sample values, complex readings, and as an accumulator for raw data prior to its writing into raw data files (Cassandra is used here instead of Postgres to more effectively handle and scale to the data throughput);
• Archive Directory (AD) – a file store, used to archive one concatenated file daily for each device.
Task Machine and Scheduled Jobs
The above steps comprise the end-to-end process of real time data acquisition, but some additional processing steps are handled by task machines at the end of this acquisition pipeline. Task machines incorporate a scheduler system, which runs thousands of jobs daily. One important scheduled job is the daily job, which runs every day after midnight UTC. This routine pulls all raw files recorded during the past day from the Cassandra database and writes them as one log file per device into the Archive Directory. These log files retain not only the data records, but also the commands and responses between the driver and the device. These log files are therefore an extremely valuable resource for troubleshooting and provenance. Another scheduled job pulls scalar data from Cassandra and generates 15-min averaged data values that are then stored back into Cassandra as quarter (hour) scalar data; the quarter scalar readings help improve performance when generating on-the-fly plots and other data products.
Other Acquisition Methods
Aside from the real time acquisition described above, Oceans 3.0 supports other types of acquisition for different data collection regimes.
3rd Party Data Push
For some systems, such as buoys operated by partner institutions, acquired data can be pushed directly to the Active MQ parser queue without passing through a driver. Additionally, some data are acquired via web services and sent directly to the archiver queue; this is the method for ship Automated Identification Services (AIS) data.
Store and Forward Acquisition
The store and forward model is used in situations where data are stored on an external device and forwarded to the Oceans 3.0 system periodically. Some examples of this are scheduled jobs that access external ftp or mail servers and upload the data. Some of these scheduled jobs also read the acquired files and push data directly onto the Active MQ parser queue, while all the files acquired this way are archived in the file system. Some independent drivers (not part of Oceans 3.0) also push files over the secure network to the file archiving scheduled jobs, where they can be tagged for post-processing by the data product pipeline.
Autonomous Systems
A variation on this model is used for data from autonomous systems, such as battery-powered moorings, which collect data over an extended period of time until the instruments are recovered and their raw data then ingested and processed. In these cases, the data are retrieved from the instrument at recovery or in situ following procedures outlined by the instrument manufacturers. These raw files are verified, renamed to ONC’s file naming conventions, and uploaded to the archive. In cases where data parsing is intended, scripts are executed to convert the raw manufacturer files into daily log files that mimic those produced from the driver-operated instruments. Once these log files are archived, the files are added into a parser queue to follow steps 2–5 above, in similar fashion to real time data acquisition.
Device Control
Co-located Active Acoustic Devices
In some cases, multiple active acoustics devices, such as echosounders, Acoustic Doppler Current Profilers or sonars, are located in close enough proximity that signal interference could be problematic. For example, with two co-located sonars, the drivers for these sonars coordinate their timing by interlacing the acoustic pings from each sonar. This is done by using the ping of one of the sonars as a signal for the 2nd sonar to perform its ping following a predefined delay. Supplementary Figure 1 illustrates this as a simplified timing diagram.
This solution is in use for several of ONC’s co-located sonar devices. It can be used for pairings of co-located devices provided there is enough time between pings for each sonar to perform a ping and the secondary sonar can be operated in a poll mode.
Camera Control and Acquisition
Camera Systems
Camera systems consist of a camera, lights and in some cases a pan/tilt device and/or set of lasers. Oceans 3.0 supports multiple manufacturers and models of each of these components. Camera operations include handling the video stream and controlling the various camera and peripheral settings. Figure 6 illustrates the system for data acquisition, camera control and distribution of the video stream.
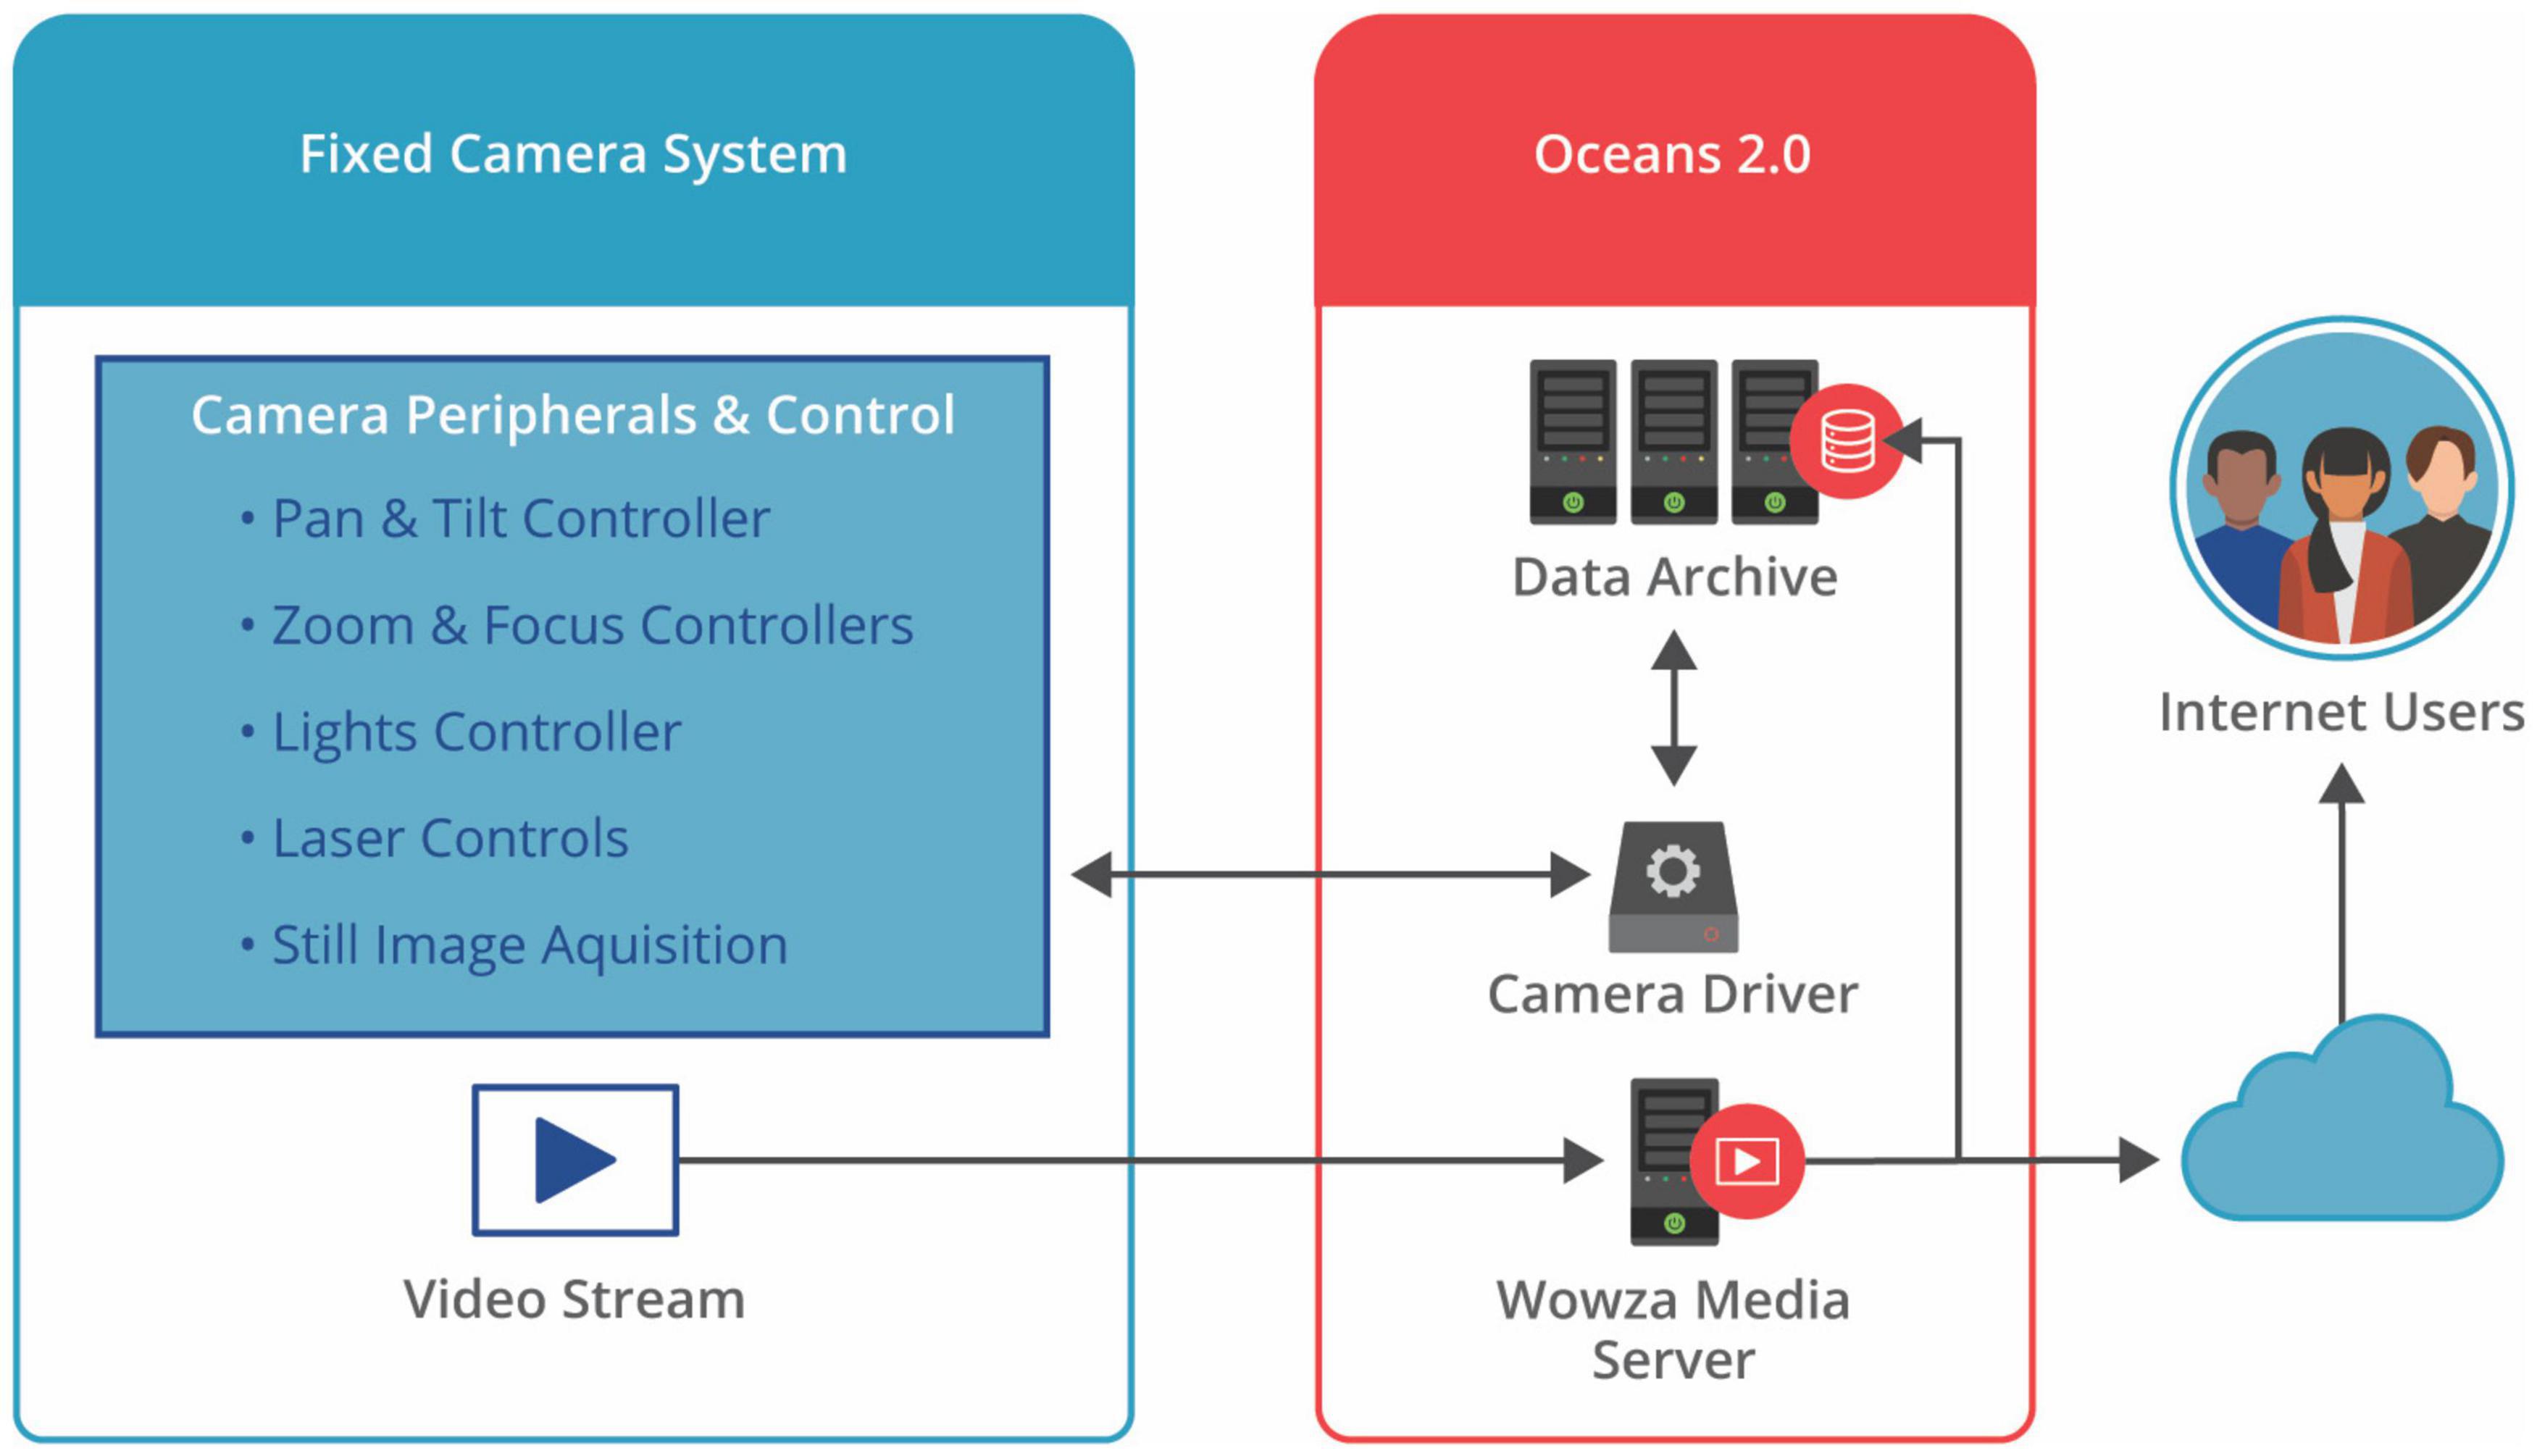
Figure 6. Control, data acquisition and stream distribution system for a fixed-location camera on the ONC network.
Video Streaming Server
A Wowza streaming video server is used to stream video from all cameras (Wowza Streaming Engine, 2022). Video is streamed in whatever format the camera supports and the video server maintains only one stream per camera. All Oceans 3.0 web pages that display streaming video from the cameras are connected to the Wowza streaming engine1, which provides video streams in a standard format and resolution. This streaming server technology is compatible with the networks, cameras and servers used by ONC; at the time of adoption by ONC in 2008 it also had the advantage of being one of the only alternatives to the proprietary Adobe Flash format.
The video streaming server also writes each video stream to the AD file system. For deep sea camera systems, writing the stream is usually controlled by the status of the camera’s lights; since there is almost no ambient light in the deep ocean, the stream is only written when the lights are illuminated.
Camera Driver
A camera driver is a type of driver as outlined in the above section Acquiring Data Readings. This driver contains additional capabilities to control various functions on the camera system such as zoom, focus, lights, pan/tilt, lasers, etc. Drivers transmit commands to the camera system and obtain telemetry and status information from the system. For some cameras, there is also a capability to record high-resolution still images, which are transmitted through the driver to the Oceans 3.0 data acquisition framework. Camera drivers implement a common set of camera commands that are the same for all camera systems regardless of the manufacturer or model (More on this in the Common Interfaces section “Common Interfaces” below).
Infrastructure Management Tools
Device Console
The Oceans 3.0 Device Console (Supplementary Figure 2) provides a real time display of instrument connectivity. This application serves as the command-and-control center for the observatory systems team, and is vital for the maintenance and troubleshooting of instruments. Using the Device Console, ONC system operators can start and stop instrument drivers. All users can obtain real-time summaries of any networked instrument’s current status, uptime and last archived file; in addition, interactive quick plots of sensor readings and links to Device Details are provided.
Junction Box View
Junction boxes are an integral component of the subsea infrastructure, as they distribute power and communications to connected individual scientific instruments. Within the ONC infrastructure, many different types of junction boxes are deployed, each customized for its specific needs; some junction boxes are designed to serve very basic functions, while others are quite sophisticated, integrating many dozens of sensors and control systems. The Junction Box View tab in the Device Console (Supplementary Figure 3) allows observatory operators to monitor electrical conditions for each junction box port and connected device as well as activate and deactivate instruments via the port on/off buttons. This common interface provides a standardized means of monitoring and controlling a wide range of instruments connected to a wide variety of junction boxes.
SeaScript
SeaScript is a scripting language developed by Oceans Networks Canada that enables control of device behavior through a script. This tool serves as an engine for creating and executing scripts containing commands for sets of devices in order to accommodate complex experiments. Some use cases for SeaScript include remote execution of profiling system casts and operation of pre-defined recording routines for seafloor video cameras.
The SeaScript commands and comments in Supplementary Figure 4 are part of a camera control sequence to control lights, pan/tilt, and camera settings then record an image. Such scripts can be scheduled to run periodically, for example every 4 h.
SeaScript allows scientific users to readily understand and easily customize the behavior of drivers. This is particularly useful in situations where the data acquisition routine is not clear from the outset and iterative refinements are required by the users to obtain the most meaningful results. Iterative software improvements include on-going support for new instrumentation and functions; for example, a new video camera was recently added that can be configured via SeaScript to record in 4K resolution.
Common Interfaces
Oceans 3.0 supports common interfaces for different devices of a given category, such as different camera models. By abstracting controls specific to individual makes and models to derive a generalized set of commands, the task of viewing and controlling different instruments is greatly simplified. At the time of this writing, 11 different camera model types were active on the ONC network, all supported by the same common control interface. Two contrasting examples are shown in Supplementary Figure 5.
Task Management
At any time, there may be hundreds of unscheduled and scheduled jobs running on Oceans 3.0 task machines. Unscheduled jobs typically process requests made by Oceans 3.0 users for specific data products, but also include reprocessing jobs initiated by ONC data stewards. Scheduled jobs are automated processes such as file generation and transfers that are part of ongoing operations. Jobs can also be batched and run as a consecutive set of tasks.
The Task Management interface (Supplementary Figure 6) allows specialists to see which jobs are queued, running, canceled, completed, or aborted with errors.
The Task Management interface also allows operators to define and edit specific tasks, such as an automated routine to illuminate a camera’s lights and record video for a period of time before turning the lights off again. Supplementary Figure 7 shows the Task Definition tab with task number 216, which runs a scheduled SeaScript job on the camera at the Folger Pinnacle location. The actual SeaScript is also shown in the lower part of this figure. Not all scheduled tasks are SeaScript routines; they also perform functions such as downloading files from an FTP site or generating 15-min averaged data and writing the values into the database.
Data Versioning
Data versioning is a necessary aspect of data management, which facilitates corrections or enhancements to datasets. Corrections may be required when fixes are made to calibration formulae, parsers, data processing algorithms, or other metadata that influence the resulting data products. Enhancement examples include adding more derived variables or improvements to data visualization parameters. On occasion, instruments send data in an unexpected format that breaks down-stream processes; once mitigating measures are identified and incorporated, it is sometimes possible to regain this segment of the time series through reprocessing.
The specific tools and procedures used vary depending on what part of the data product processing pipeline is affected. While there has always been some traceability of these events in the Oceans 3.0 database records and code versioning, there was limited ability to fully reconstruct and communicate the events pertaining to a particular dataset. Recognizing that dataset provenance is extremely important for reproducibility and to be able to apply versioning updates for dataset persistent identifiers, new infrastructure referred to as the batch system was developed in 2020.
In this revised system, batches are defined to encapsulate the triggers that initiate versioning of tasks, and the relevant DataCite DOI updates (see Persistent Identifiers and Data Citation section). A free-text field also allows data stewards to describe the reason and scope for the change. Triggers include items like calibration formula changes and parser updates. Versioning tasks include reprocessing the raw data (essentially redoing the Real Time Data Acquisition Steps 2 to 5 described above), re-generating derived data products, and file uploads (to fill gaps or replace faulty files). Once the tasks are complete, a new DOI is generated such that the new and previous DataCite DOIs are associated with one another using the “isPreviousVersionOf” and “isNewVersionOf” relationships.
This dataset versioning provenance information is communicated to end-users via the dataset landing page (as shown in Supplementary Figure 8).
This versioning approach is consistent with recommendations from the Research Data Alliance (RDA) Data Citation Working Group (Rauber et al., 2015) and the RDA Data Versioning Working Group (Principles 1, 5, and 6 of Klump et al., 2021). As new standards and best practices emerge from the research data community, ONC will continue to improve these frameworks. More information on this topic is also provided in section Persistent Identifiers and Data Citation.
Metadata
Ocean Networks Canada maintains a wealth of metadata and documentation to support the available datasets in Oceans 3.0. Metadata, often defined as data about data, provide users with the necessary information to discover, acquire and use data confidently and correctly. Metadata are also integral to the maintenance of ONC sensor networks.
Standardized metadata are provided to users in ISO 19115 (International Standards Organization, 2014) and DataCite metadata records, while more comprehensive content is available throughout the Oceans 3.0 data portal. An example snippet from an ISO 19115 XML metadata file is shown in Supplementary Figure 9; an example interface displaying metadata associated with a device is shown in Supplementary Figure 10. These metadata include details about the instrument life cycle events such as deployments, recoveries, maintenance, calibrations, configuration changes and more. All metadata records are maintained with the aid of the workflow tool described in the following section. In addition to instrument metadata, Oceans 3.0 maintains metadata describing a wide variety of entities, including non-instrument infrastructure, instrument platforms, expeditions, missions and remotely operated vehicle dives, etc.
Documentation for each instrument including manuals, calibration sheets and photos are curated in a content management system, and can be provided to data users upon request. For instrument deployments conducted through Remotely Operated Vehicle (ROV) operations, the annotated video is publicly accessible via Ocean 3.0’s SeaTube interface (see section “Data Discovery and Access”). This feature allows users to visually contextualize the environment in which an instrument is placed. ONC also maintains a transaction history of changes to any metadata, including details of who made the change and at what time. In 2020–2021, ONC implemented a more robust system for tracking data versioning changes, such as reprocessing or file fixes. These data versioning metadata are now provided in the dataset landing page. Dataset versioning prior to the allocation of DOIs is mostly traceable in ONC’s database, although not currently exposed to end-users. As of 2021, a maintenance history of changes was being implemented into the ISO 19115 metadata records.
Controlled Vocabularies
To efficiently serve Ocean Networks Canada’s large, interdisciplinary user community it is important to follow widely accepted and consistent conventions when describing data. Controlled vocabularies, such as those maintained on the vocabulary server provided by the Natural Environment Research Council (NERC) define a common language for referencing variables and instruments. The NERC Vocabulary Server (National Oceanography Centre, 2021) provides access to lists of standardized terms that cover a broad spectrum of disciplines of relevance to the oceanographic and wider community. All of the vocabularies are fully versioned and a permanent record is kept of all changes. By referencing controlled vocabularies, ONC can be confident that its use of terms adheres to the current standards of active controlled vocabularies.
Vocabularies were selected from the NERC Vocabulary Server that paired with concepts used by the Oceans 3.0 data management system, including device type, device category, and units of measure. Once a controlled vocabulary was selected, terms from Oceans 3.0 were manually mapped to corresponding terms in the vocabulary. These mappings are stored in ONC’s relational database, which simplifies management and maintenance of the controlled vocabularies. Implemented mappings include the SeaVoX Device Catalogue, SeaDataNet Device Categories, British Oceanographic Data Centre Data Storage Units, Climate and Forecasting Standard Names, IOOS categories, and Global Change Master Directory Keywords controlled vocabularies. Terms and the source-controlled vocabulary are returned to help users determine fitness for use of the data. Not every concept in Oceans 3.0 maps to a term in one of the selected vocabularies, in which case a null is returned with the search results. However, by adopting multiple vocabularies ONC minimizes gaps in the description of data.
Metadata Formats
Just as oceanographic data need to be provided in common and interoperable formats, so too do the metadata. Oceans 3.0 conforms to the ISO 19115-1:2014 Geographic Information Metadata schema to deliver metadata accompanying data search results.
There were several motivations to adopt ISO 19115. Developed by the International Standards Organization, the schema is well maintained with an active and engaged user community. The standard has been adopted by other organizations in the field of study, such as the National Oceanic and Atmospheric Administration, and is used by repositories that ONC contributes to, such as the Polar Data Catalogue. Additionally, the XML format of ISO 19115 ensures the metadata is machine readable, allowing users to easily parse documentation.
Extensive crosswalks have mapped concepts in Oceans 3.0 to relevant fields in the ISO-19115 schema. Mappings consider how metadata terms are defined in the main standard as well as how terms have been implemented by other organizations and the North American Profile of ISO 19115. The result is an ONC-tailored metadata profile that expands on the minimum mandatory requirements of ISO 19115. Doing so maximizes interoperability and provides users with the details they need to use the data obtained through Oceans 3.0.
Abiding by Principles and Standards
Ocean Networks Canada became a member of the International Science Council World Data System in 2014. This body, in partnership with the Data Seal of Approval (DSA) launched the CoreTrustSeal organization in 2017. CoreTrustSeal is an international community-based, non-governmental and non-profit organization promoting sustainable and trustworthy data infrastructures. CoreTrustSeal offers data repository certification based on conformance with an agreed set of requirements covering aspects such as data security, continuity of access, confidentiality, data integrity, discovery and identification. As of 2021, ONC was in process of preparing for recertification under CoreTrustSeal.
In developing ONC’s data management policies, careful attention has been paid to Several seminal principles, including FAIR, TRUST, OCAPTM, and CARE.
FAIR Principles
In 2016, the ‘FAIR Guiding Principles for scientific data management and stewardship’ were published, offering guidelines to improve the Findability, Accessibility, Interoperability, and Reuse of digital assets (Wilkinson et al., 2016). The Findable principle implies that data and metadata should be easy to find for both humans and computers. The Accessible principle ensures that once data are found, there are open processes for accessing them. Interoperability relates to the ability to integrate data from different sources as well as across different applications for analysis, storage and processing. Reusability is the ultimate goal, ensuring data are well-described so that they can be replicated or combined in different settings.
Ocean Networks Canada has strived to implement the FAIR principles within Oceans 3.0, although not all previous versions of data can always be accessed. In some situations when data are reprocessed, the older version becomes unavailable, but at minimum all associated metadata are preserved.
TRUST Principles
In 2020, Lin, et al. published the TRUST guiding principles for demonstrating the trustworthiness of a digital repository, including Transparency, Responsibility, User Focus, Sustainability, and Technology. The TRUST principles recognize that for a repository to provide “FAIR data whilst preserving them over time requires trustworthy digital repositories with sustainable governance and organizational frameworks, reliable infrastructure, and comprehensive policies supporting community-agreed practices.” (Lin et al., 2020) Transparency calls for repositories to enable publicly accessible verification of specific repository services and data holdings. The Responsibility guideline requires repositories to ensure the authenticity and integrity of data holdings as well as the reliability and persistence of their services. User Focus ensures that data management norms and expectations of target user communities are met. Sustainability reminds that services should be sustained and data holdings preserved for the long-term. Technology refers to the infrastructure and capabilities implemented to support secure, persistent and reliable services. As part of ongoing efforts to maintain CoreTrustSeal certification, ONC strives to abide by TRUST principles as foundational for implementation of the Oceans 3.0 data repository.
OCAP™ Principles
In 2014, the OCAP™ principles, originally introduced in 2002, were refined and updated by The First Nations Information Governance Centre (2014). These principles and values are reflective of Indigenous Peoples’ world view of jurisdiction and collective rights. They include Ownership, Control, Access and Possession. Ownership states that a community owns information collectively, and that ownership is distinct from stewardship. The Control principle asserts that Indigenous Peoples must have control over how their data are collected, used, disclosed and destroyed. The Access principle requires that Indigenous Peoples will have ongoing access to their data, while also having the right to make decisions regarding who can access these data. Possession describes the mechanism for Indigenous Peoples to assert and protect ownership of their data.
CARE Principles
In 2020, Carrol et al. published the CARE Principles for Indigenous Data Governance, in recognition that “ongoing processes of colonization of Indigenous Peoples and globalization of Western ideas, values, and lifestyles have resulted in epistemicide, the suppression and co-optation of Indigenous knowledges and data systems” (Carroll et al., 2020). The CARE principles seek to balance the FAIR principles for open data against respect for “Indigenous use of Indigenous data for Indigenous pursuits.” The CARE Principles include Collective benefit, Authority to control, Responsibility and Ethics. Collective benefit supports Indigenous creation/use/reuse of data for policy decisions and evaluation of services in ways that reflect community values. Authority to control affirms Indigenous Peoples rights to determine Indigneous data governance protocols and be actively involved in stewardship decisions. The Responsibility principle acknowledges the importance of nurturing respectful relationships with Indigenous Peoples from whom the data originate, while the Ethics principle recognizes that Indigenous Peoples’ rights and wellbeing should be the focus across data ecosystems and throughout data lifecycles.
As ONC upholds Indigenous partnerships for hosting environmental data, the data policy implementation plan and practices are informed by the CARE and OCAP Principles. ONC data stewards have completed training courses on OCAP™ and participated in the Portage Network’s Sensitive Data Expert Group (n.d.), which works to develop practical guidance and tools for the management of sensitive research data. The team is developing plans to increase Indigenous data support through means such as integrating notices and labels relating to traditional knowledge and biocultural holdings. ONC actively participates in Indigenous data governance events and continues to evolve practices and implementations within Oceans 3.0 accordingly.
Data Restrictions
Most data within the Oceans 3.0 repository are provided under the Creative Commons CC-BY 4.0 license, which means these holdings are open and free for anyone to use (Creative Commons, 2021). However, for some datasets, ONC maintains agreements with the relevant data partners to clarify the data restriction details, with follow-on support for providing access to designated users within the contractual time frame of the data agreement. Even in the case of restricted data, metadata remain accessible. Embargoes may be established in some cases for the entire dataset, specific subsets, or most recent data (e.g., last 4 h). ONC’s data access interfaces and services are generally designed to show the existence of datasets, even if access to the datasets requires specific permissions. Requests to access any restricted datasets are evaluated on a case-by-case basis.
Within the Oceans 3.0 framework, support has been implemented to handle requirements for access to, use and sharing of Indigenous datasets, which are defined by data agreements with providers.
Quality Assurance Lifecycle, Workflow and Testing
Quality Assurance/Quality Control Model
Ocean Networks Canada has developed and implemented a comprehensive process-oriented quality assurance (QA) model in combination with a product-oriented data quality control (QC) model. This QA/QC model systematically intercepts and examines the instrument and data streams at various stages with the objective of minimizing human and/or systematic errors, thus ensuring high quality data workflow (see Figure 7). ONC’s QA/QC methodology specifically addresses the QA/QC needs of a long-term dataset by ensuring data quality consistency within a single dataset and simultaneously among a collection of datasets at each site.
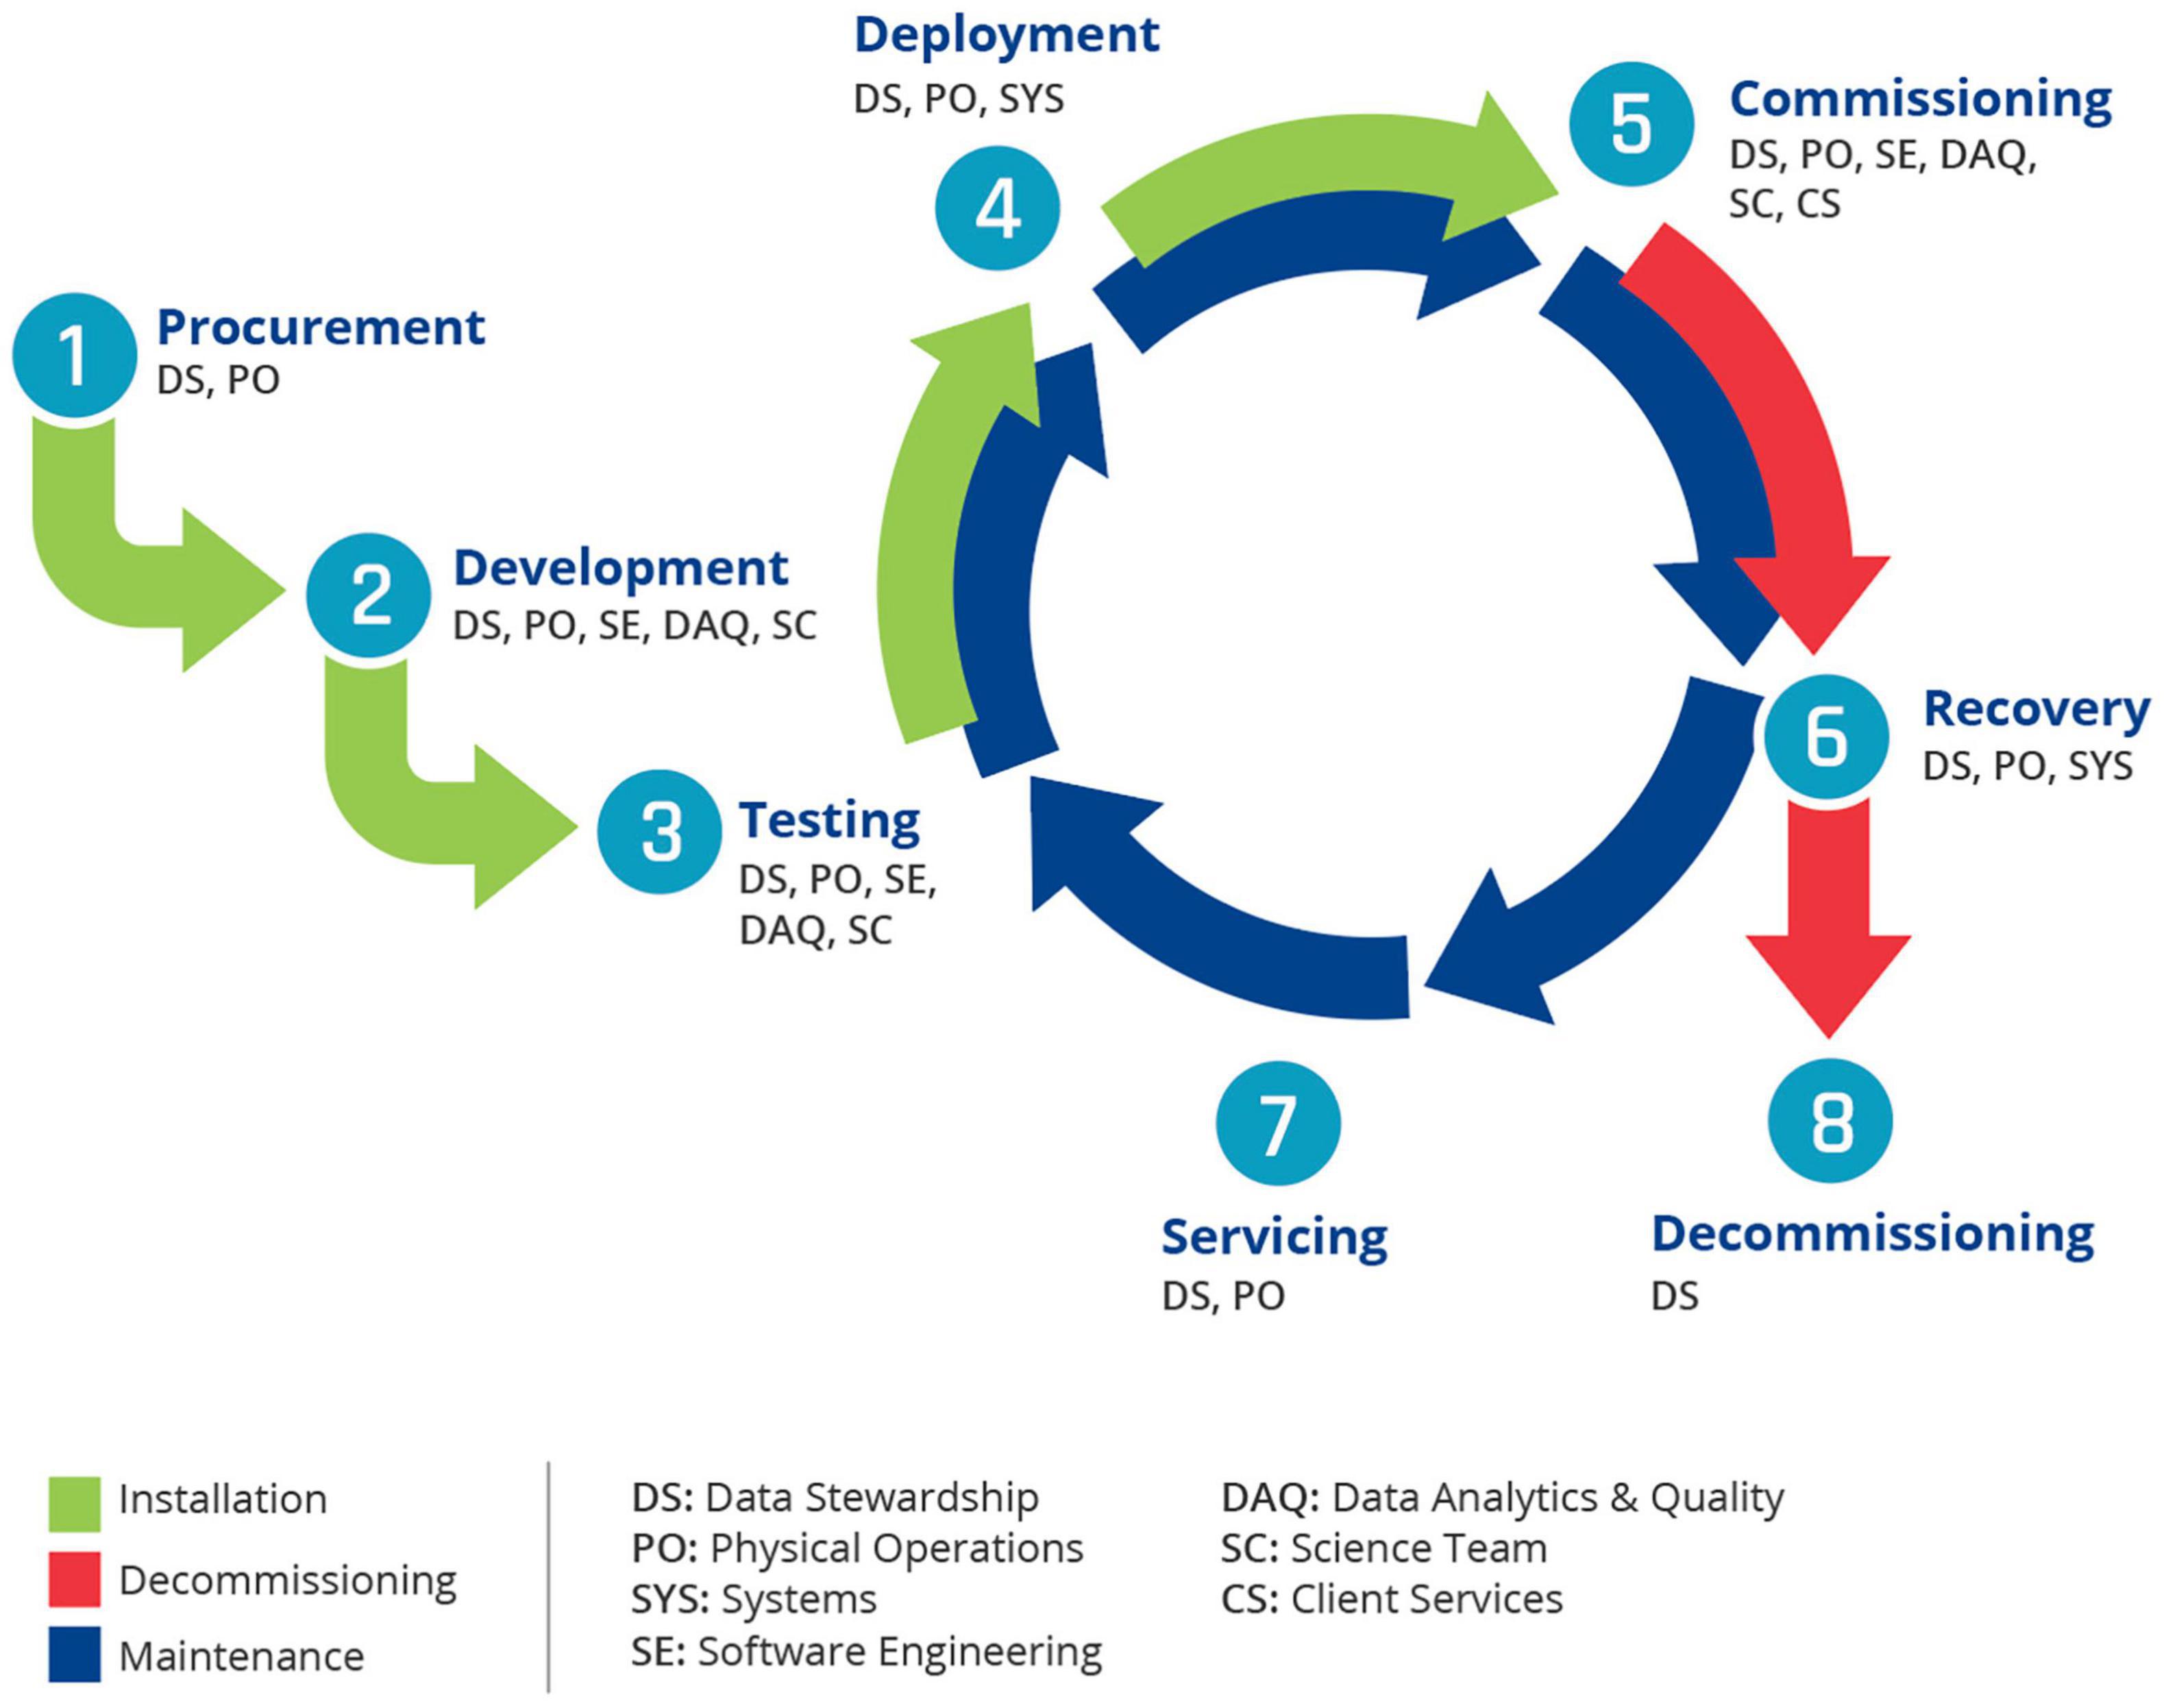
Figure 7. ONC instrument life cycle and major process groups involved.
The following QA/QC stages monitor the performances of measurement systems, which eventually contribute to scheduling maintenance expeditions and calibrations of the instrument platforms. These processes are complementary to research and development of improved and new monitoring technologies.
Pre-deployment Testing
This stage includes all data/metadata QA/QC checks performed during pre-deployment testing for an instrument up to actual deployment.
Post-deployment Commissioning
This stage includes all data/metadata QA/QC checks from actual deployment to commissioning of the data from an instrument as good or compromised.
Automated Quality Testing
This stage includes all data QA/QC-related checks, real-time or delayed, performed via automated quality control procedures while the instrument is deployed.
Manual Quality Control Methods
This stage includes all data QA/QC checks performed via systematic manual data assessments and annotation routines.
Post-recovery Tests
This stage includes all post-calibration checks performed during post-recovery and servicing of an instrument.
Data Quality Assurance
Data quality assurance (QA) processes are preventive measures implemented to minimize issues in the data streams and inaccuracies, thus averting corrective measures required to improve data quality. The ONC data QA component includes processes to ensure that the instrument sensor network protocols are appropriately developed and observed. Examples of QA processes currently in place include periodic manual data review by ONC data specialists, inclusion of data assessment annotations and the completion of end-to-end workflow tasks.
Manual Data Assessment Annotations
Quality assurance on the quality-controlled data is accomplished by performing periodic manual data quality reviews followed by modification to the existing data quality flags as required. In addition, ONC data specialists add manual data assessment annotations of devices, sensors and other observatory components, reporting events or conditions that may affect the quality of ONC data. Such information includes instrument commissioning, sensor failures, changes in instrument calibration, and explanations for data gaps. Effort has gone into developing user-friendly interfaces and tools to facilitate annotation entry by data specialists and to effectively link the annotations through the time domain with corresponding data. External users can conveniently access and download the annotations through the Annotation Search tool and various links provided in the ONC data download interface.
Workflow Processes
By using an end-to-end workflow with systematic methodologies and processes, ONC ensures that the necessary pre-conditions for high-quality data are met. A workflow-process user interface facilitates the integration of knowledge among various teams within the ONC organization where teams work together to ensure that instruments are well-documented and provide the highest quality data possible.
Since 2013, ONC has employed an in-house software tool (shown in Supplementary Figure 11) that facilitates task management for all the network instruments affected in a given expedition or program (Jenkyns et al., 2013). Its development was motivated by the necessity to ensure all instruments are properly managed during a busy expedition season that requires input from domains of expertise distributed throughout the organization. Its design and implementation also establish records of events in an instrument’s life cycle, and track ONC processes governing deployments, maintenance and recoveries.
Data Quality Control
Data quality control (QC) is a product-oriented process to identify and flag suspect data after they have been generated. QC includes both automated and manual procedures to test whether data meet necessary quality requirements. QC of ONC data includes three components. The first component evaluates real-time data automatically before data are parsed into the database. The second component evaluates near-real time or archived data using automatic delayed-mode testing. The third component is manual review, where an expert inspects the data for quality issues. The three components are discussed in more detail below.
Automatic Real Time Tests
Real time automated data qualification determines the initial validity of data prior to archival in the ONC database. The QA/QC test model follows conventions listed in the Argo quality controls manual (Wong et al., 2021) with additional tests developed at ONC. Qualifying the data prior to archival ensures that every reading with a QA/QC test has an associated QA/QC value.
The QA/QC architecture supports two types of automatic real-time QC tests: single-sensor range tests and dual-sensor relational tests. These tests are designed to catch instrument failures and erroneous data at regional or site-specific range values derived from various sources depending on test level (defined in the following section). In addition, quality flags are propagated to dependent or derived sensor data streams to ensure derived data are adequately quality controlled as well. Example listings of automatic real time tests are shown in Supplementary Figure 12; details of a range test for a fluorometer are shown in Supplementary Figure 13.
Automated Delayed-Mode Testing
Automated delayed-mode testing includes checks on data that can be applied in near real time or batch processed at set intervals. These tests require consecutive data where the central value is compared with surrounding values to determine its validity. The QA/QC test model supports tests such as spike detection and gradient steepness.
Manual Tests
Automated QC is a first pass at quality control, the results of which may contain both false positives and false negatives. For this reason, ONC data specialists conduct daily manual tests, by which all real time data are visually reviewed. In situations where data specialists notice issues with data visually, they isolate such data segments and perform an in-depth review to confirm whether automatic QA/QC tests were able to capture the instances and flag the data accordingly. If not, data specialists perform appropriate manual corrections to auto QA/QC flags.
An example situation requiring manual review of bad data points that were flagged as good, is with the automated Spike Test. This test is only able to capture a single erroneous point when applied as an auto test. However, there may be multiple erroneous data points subsequent to the initial instance. Such points can only be identified and flagged appropriately via manual review of data.
Another situation requiring manual review and flagging accordingly is the identification of potential drifts in the data. In general, automatic QA/QC tests, which are applied to single data points or very short segments of real time data, are unable to capture longer-term errors introduced gradually into the data from sensor drifts. This can only be addressed by data specialists periodically reviewing long term historical data visually, to identify potential drifts. Such data are flagged manually by ONC data specialists.
On occasion, in-depth reviews require consultation with ONC staff scientists to discuss potential natural events that may produce outliers. An example might be erroneously flagged data indicating presence of an unusual event, such as a marine heat wave or hypoxia intrusion. After consultation to confirm anomalies reflect actual events, data that may have been automatically flagged as “2 – probably correct” (see Table 1) could be reverted to “1 – good data.” As with all other manual QA/QC flagging, such changes are performed in delayed mode.
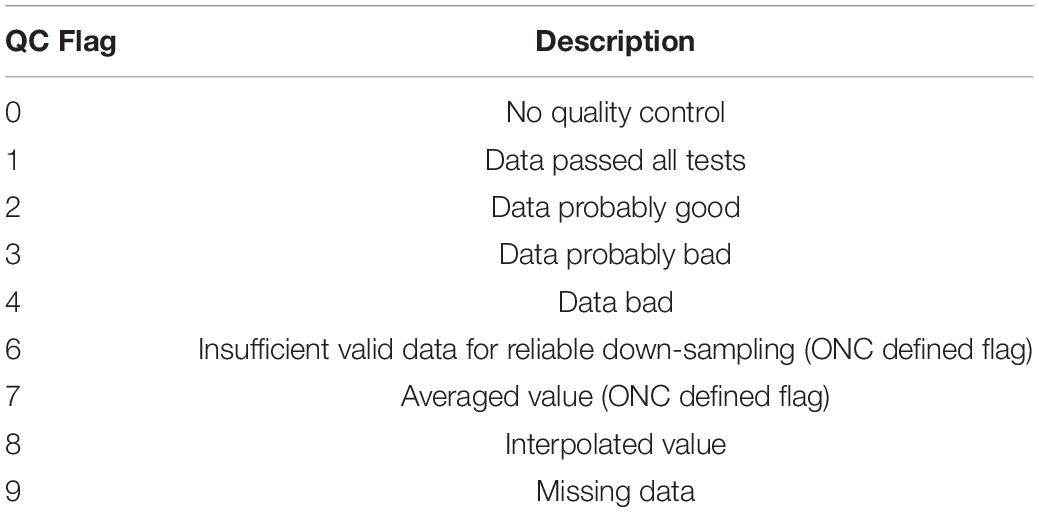
Table 1. ONC quality control flags.
Manual QA/QC tests essentially follow the test criteria applied by auto QA/QC tests. The test criteria are developed by ONC data specialists through analysis of long-term data from specific sites and regions. Significant weight is given to the skill of the data specialist to capture potential issues visually. ONC data specialists are subject matter experts on a variety of instrumentation and use their experience and knowledge to determine manual QA/QC flags that are not easily captured by automatic tests. These can include comparison with co-located instrumentation, drift analysis, seasonal events, stuck point values, and other tests. The underlying data stream used to derive the auto (and/or manual) tests will be validated against physical samples or shipboard and ROV cast data as and when they become available. However, availability of such data is limited.
Many problems are identified and corrected by the manual test process, including adjustment of automated QC test parameters. Within the ONC Quality Control terminology, manual QA/QC tests are considered as major tests (defined in next section).
Major Tests
A major test sets gross limits on the incoming data such as instrument manufacturer’s specifications or climatological values. Failure of this test level is considered major and it is recommended that the flagged data should not be used. Specific tests that belong to this category include instrument-specific comparisons (against value ranges specified by the manufacturer for each physical sensor on an instrument) and regional-level tests (based on climatological values for a region and depth).
Minor Tests
Minor tests are based on local statistics derived from historical ONC data. If a minor test generates failures, the data are considered suspect and require further investigation by the user to decide whether or not to include these data in their analyses. Specific tests that belong to this category include single-sensor tests (compared against historical ranges for a specific site and station) and dual-sensor tests (utilizing two different sensors on the same instrument to catch dropouts and other sensor-specific errors).
Quality Control Flags
Quality information for individual measurements is conveyed by integrating the results from multiple types of test evaluations. The overall quality of the data is shown by integer indicators, or flags, which are standardized across all ONC data and are based on the Argo quality control flagging system (Wong et al., 2021), as well as including some ONC-defined flags (Table 1).
Overall quality flags are used to demarcate data values that fail one or more QC tests. This is achieved by subjecting the data to various levels of testing that generate a QC vector containing the output for each test. The final quality control flag is then determined as follows.
• If all tests achieve pass status, the final output flag assigned is 1 (Data passed all tests).
• If passed status is reported on major tests but failed reported on minor tests, the final output flag assigned is 2 (Data probably good). In cases where the Temperature-Conductivity tests are failed, the output assigned flag is 3 (Data probably bad).
• If failed status is reported on major tests, the final flag is 4 (Data bad).
In addition to using flags as quality indicators, the ONC flagging systems also provide information about how the data were processed, with flag 7 for averaging and flag 8 for filling gaps via interpolation. Note that averaged and interpolated data exclusively use clean data (all values have QC flag 1). Users can determine the type of tests that have been applied to the data downloads by referring to the Data Quality Information section in the accompanying metadata file.
Quality Assurance/Quality Control Implementation Tools
Within the ONC data acquisition and delivery model, QA and QC procedures are applied at various stages as data flow from sensors to the end user. Various Oceans 3.0 tools and web interfaces have been developed for easy handling and linking this information to the data stream. Such tool developments are continuously improved and remain as work in progress. Both auto and delayed QA/QC tests are managed through a custom-designed QA/QC interface, which allows data specialists to search, display and filter test results for sensors and instruments.
Maintaining historical information over the lifespan of every ONC instrument is indispensable for delivering quality data. To serve this purpose, the design architecture of all the ONC tools related to data QA/QC ensures that all historical information pertaining to a device is accessible via a single link.
Ocean Networks Canada Quality Assurance/Quality Control Data Delivery Policies
Ocean Networks Canada delivers data to the end users in clean and raw data products or via web services that include QA/QC flags. For clean data products, all compromised data resulting from QA/QC assessments are removed and replaced with NaN (Not a Number) values. Raw data products deliver raw data (unmanipulated, preprocessed) with corresponding data assessment flags in separate columns. Data delivered via web services return the QA/QC flag values, but the onus is on the user to use the flags appropriately. Since there is a risk that real and potentially important phenomena will be ignored in fully automated QC models, the ONC data delivery policy emphasizes the need to maintain the raw unmanipulated data and offer the option of downloading raw data to the end user. Great care is also taken to ensure that valid data are not removed and that all QA/QC processing steps are well documented.
Data reliability is based, in part, on the capacity to reproduce data products. To this end, ONC data QA/QC model developers have carefully considered ways to preserve the original data in its raw form so that subsequent procedures performed on the data may be reproduced. Here, metadata act as a resource, holding valuable information about all QC procedures performed on the data (i.e., raw data, qualifier flags added, problematic data removed or corrected and gaps filled). Also included is all necessary information used to generate the data, such as the source file used, data-rejection criteria, gap-filling method, and model parameters. This information enables the data user to carefully scrutinize the data and determine whether data processing methods used by ONC are appropriate for their specific applications. Further, facilitating the review of uncorrected data through the ONC data distribution model helps end users perform their own quality analysis and identify real phenomena that may not be apparent in the corrected data.
Data Product Pipeline
As of Spring 2021, 299 distinct file-based data products were available for download through Oceans 2.0 (this total does not include data available via web services and interactive portals). Over the 2009–2021 time period, an average of 25 data products were created or revised annually, as shown in Figure 8. Data products are maintained in perpetuity, allowing for reproducibility, particularly via DOIs. This includes the ability to reproduce any historical version of a data product, particularly the more value-added and processed data products that are continually improved over time.
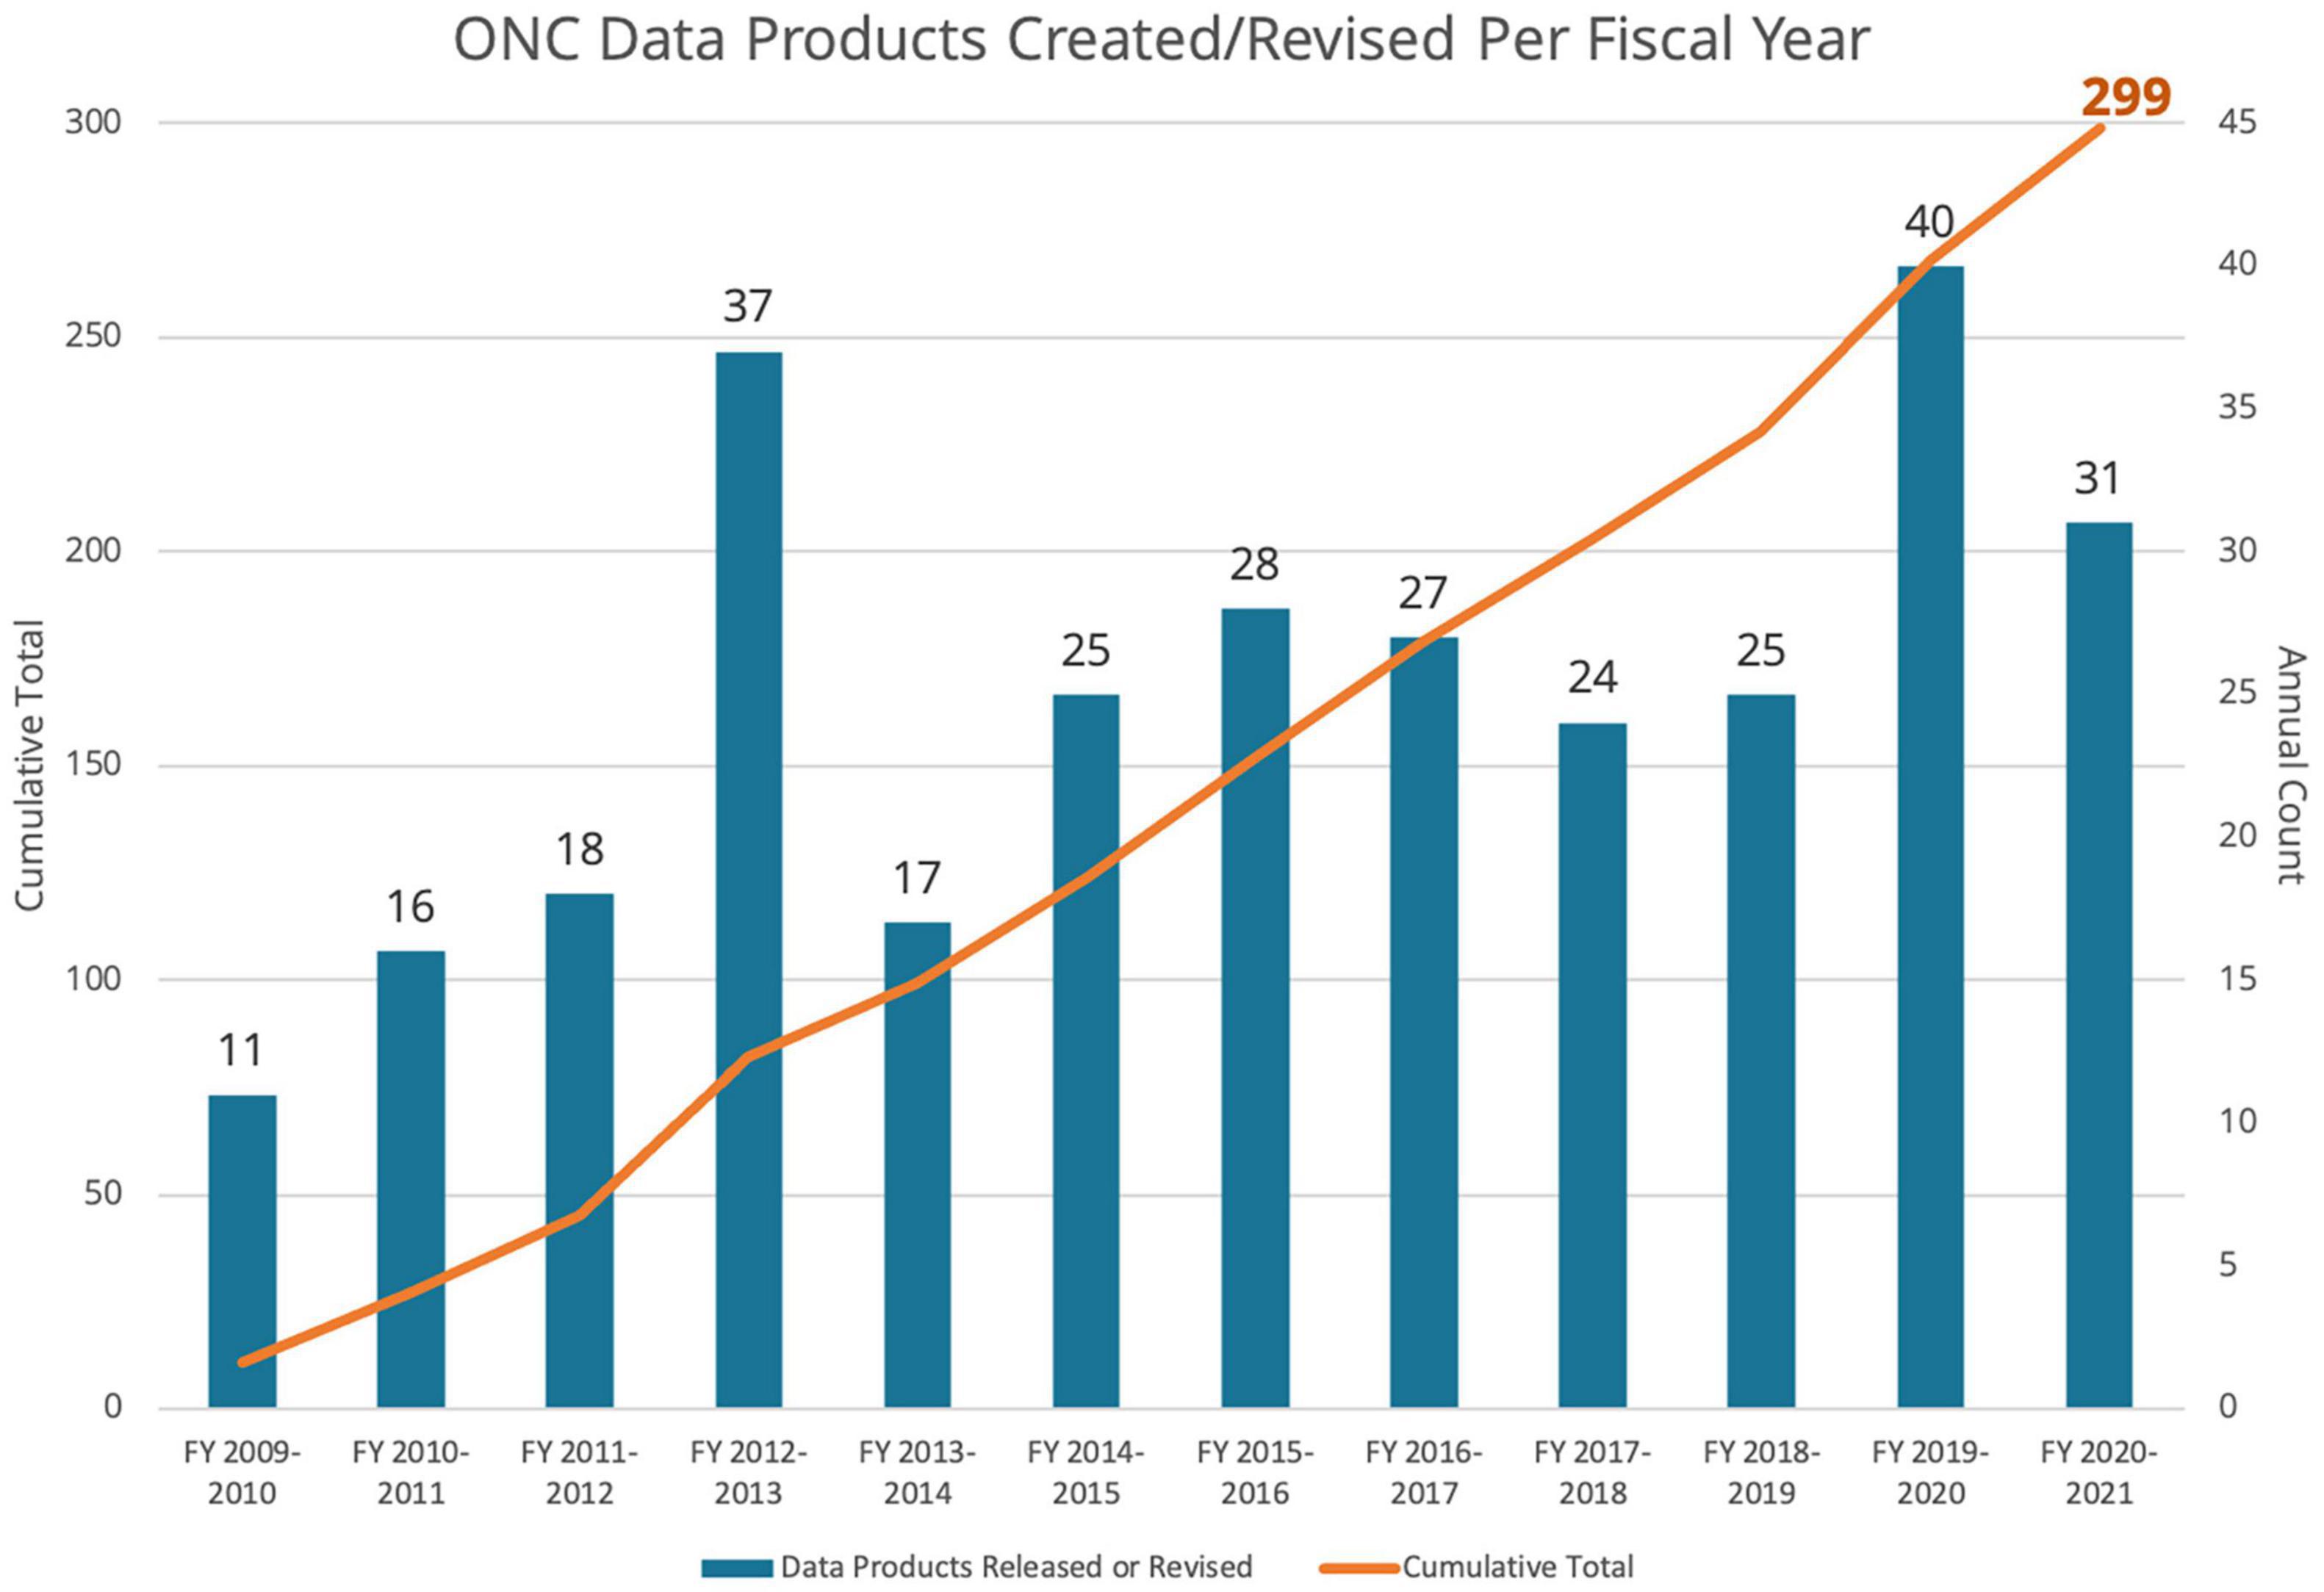
Figure 8. Graph of ONC data products created and revised per fiscal year (blue bars) and cumulative total (orange line), 2009–2021.
Data Products
Examples of data products include numerous forms of data plots, primarily in image formats, and many data file formats including self-describing and standard-adhering NetCDF formats, convenient MAT (MATLAB) files, accessible CSV files, manufacturer formats and raw data. These products are generated by Java or MATLAB codebases. Device manufacturers generally write their supporting software for standalone operation; usually for a PC laptop to connect, configure and download the data. To integrate with the network, ONC drivers emulate the device interaction and acquisition functions of the software, while ONC data products reproduce the initial manufacturer’s product, including calibration, configuration and any metadata, as if the device were operated in the usual way, albeit continuously, with no limitations on power, data transfer and storage. No two device types are the same, even those produced by the same manufacturer. Support from the manufacturers has been very beneficial in the effort to integrate the hundreds of devices and data products to date. In general, for each device type, Oceans 3.0 offers at least one visualization product and the manufacturer’s file product. Additional formats, including specialty products with increasing levels of refinement, are developed in response to user requests.
Data products are generated primarily on-demand, when requests are received from either the Oceans 3.0 web applications or the Application Programming Interface (API). As of July 2021, over 8600 graphical data visualizations were also pre-generated daily via scheduled jobs.
Depending on the data type, the data product processing pipeline converts device-specific source files, generic raw log files and/or parsed scalar data (from the database) into finished data products. Device-specific source files are usually acquired via file transfer (FTP, email, etc.). Generic raw log files include device output intermixed with logged commands and device response codes, as acquired by ONC device driver software. Some log files are stored in hex format, others in ASCII. As described in section Data Acquisition and Archival, incoming raw log files may be parsed into the scalar data system. Data products generated from the scalar data system have device independent format and options, while complex data products are generally specific to the device type. Consider the Teledyne Acoustic Doppler Current Profilers (AD) as an explanatory example. These ADCPs produce data via ONC device drivers that is stored as raw log files. Live incoming ADCP data is parsed in real-time producing scalar sensor data for temperature, tilt, and other state-of-health internal sensors, while the acoustic data is too complex to express as a single-reading in a unit of time. Instead, the data product pipeline processes the manufacturer format RDI files via a scheduled task; these are then stored in the file archive as an intermediary product and used to produce on-demand data products such as plots, MAT and NetCDF data products. If users request near real time complex data, most of the data product generation code is able to read raw live data directly from the Cassandra database, producing any normally pre-processed, intermediary formats on-demand. This mode is slower for processing large amounts of data, but it provides access to near real time data. The product generation code is also able to fill in any missing pre-processed data products on-demand as well. By using a combination of pre-processed stored formats and on-demand generation, the data product pipeline is optimized for both long time series and near real time data access.
Device-specific, manufacturer complex formats are necessary to support the diverse and numerous devices ONC operates. However, parsing some data into scalar sensors has many advantages over complex data products. Instruments with scalar sensors produce single values over time, such as temperatures or pressure readings. As described in detail in previous sections of this paper, incoming data streams are parsed, calibrated, quality controlled and stored within one of the Oceans 3.0 production databases, Postgres or Cassandra (Oceans 3.0 can be configured to use either or both of these database systems). The development of data products, visualization and interactive portals such as Plotting Utility (described in section “Data Discovery and Access”) is much more easily practicable when drawing from standardized, database-stored scalar data.
In addition to what ONC classifies as scalar and complex data products, some value-added and processed data products combine these using data from the same or different source instruments. An example is the processed radiometer data product which combines the complex array data with scalar depth values acquired by a separate instrument to reproduce a manufacturer format file for easier processing. All products are available alongside the raw data and all formats. The processing steps for all data products are described in online data product documentation (ONC Data Products Wiki, n.d.).
MATLAB-based ONC data parsing and data product generations routines are provided to interested researchers upon request. Future plans for Oceans 3.0 include the publication of citable and persistently identified data product generation routines, which will advance efforts to support replicability by providing open-source code that can be run independently.
Long-Term Time Series
Once deployed in the marine environment, oceanographic instruments can undergo degradation, biofouling, sensor drift and outages. For this reason, instruments must be periodically replaced and refurbished, typically every year. Thus, to monitor oceanographic conditions at a location over an extended time period requires deployment and recovery of a series of instruments over years. The instrument sensors comprising the time series for a specific location are designated within Oceans 3.0 nomenclature as primary sensors. To generate data product files from long-running scalar time series at such a location, a number of operations are required. First, queries on the metadata database (Postgres) are used to obtain the full list of devices and primary sensors for the location. Next the data from each device deployment is pulled from the database (for scalar data) or from the file archiver (for complex data). Scalar data products offer gap filling with non-numerical values (NaNs) to ease analysis for the end user. Typically, long-running time series must also be partitioned into manageable file sizes (typically 1 × 10⁶ lines for CSV files; 1 Gb for MATLAB and NetCDF files). The finished files are then packaged along with metadata files into zip files and made available for download by the end user. In this way, a continuous long-term time series product is compiled.
Long-term time series data can also be used to develop climatology data products, as exemplified in Supplementary Figure 44, which plots daily averages and statistical deviations for data gathered over a 12-year period (2009–2021). These plots and file products are pre-generated daily for Data Preview. The selection of primary sensors and locations comprising them are configurable via Task Management. New locations are added once 3 years of data is acquired; there were 22 locations supported at the time of publication.
Processing Options
A variety of processing options are offered to the user:
• Resampling: scalar data (and some complex data) may be offered with averaging, min-max and min-max average options. Resampling is applied using a simple box car algorithm, which in the case of averaging, is generally robust to aliasing. Each resample period box-car must meet a threshold of 70% data availability or it is QC flagged and shown as a NaN (not-a-number) value.
• Cleaning: raw or clean options are offered for scalar data products. Clean is the default where all data values that have been flagged as bad by the QA/QC algorithms are replaced by NaN values.
• De-tiding: for some datasets and data products, computational methods can be used to remove tidal signatures from the time series.
• Special Options: for complex data formats, a variety of special options are offered, including tilt compensation for ADCPs or color scale specification for hydrophone spectrograms. There are a total of 82 options available.
Low-Latency MATLAB Environment
Various approaches were investigated to address this problem. Eventually, an in-house solution was required and developed, named MATLAB-as-a-service. The concept is similar to the matlabcontrol open source Java API (Google, 2021) however, ONC’s implementation is fully in-house with some improvements over matlabcontrol. It uses the official MATLAB Java API, maintains a configurable pool of MATLAB instances, and is fully integrated into Oceans 3.0, extending all the error handling, task management and configuration features. The pool manager maintains interactive MATLAB instances with startup, clean up/reset scripts so that the MATLAB environment is ready and waiting for any code needing to be run. Tasks and searches can be canceled from the Oceans 3.0 UI as usual. When errors occur, they are caught, notification emails are sent, issue tracking tickets are created, and the affected instance is shut down. The pool manager’s maintenance thread asynchronously starts new MATLAB instances when the number running drops below the pool minimum and also ends instances when a time-to-live threshold is reached.
The result is a reliable, maintainable system with almost no start-up latency. Our testing shows the Data Preview (described in the following section) run-time for 8500+ search tasks is reduced by close to 60%, exceeding the amount expected from start up time latency alone (about 25%). The additional 35% reduction results from MATLAB’s internal caching, which is not as effective when running in the one-and-done mode. The MATLAB instances do use more memory in this configuration, presumably because of their internal caching. The system is scalable with additional hardware as each task server has its own Oceans 3.0 full stack. Another benefit of the system is the ability to run more automated testing nightly without adding hardware. ONC’s internal search automation tool runs 10000+ search tasks nightly in a QA environment comparing actual to expected results. Automated integration testing is essential when supporting nearly 300 data product formats with 82 option sets.
Data Discovery and Access
User Interface Tools and Data Visualization
Web Applications for Exploring and Visualizing Data
A variety of web-based applications have been developed as part of Oceans 2.0/3.0 to enable exploration and visualization of oceanographic data. These include the Data Preview, Plotting Utility, Dashboards, Search Hydrophone Data and other interfaces. Additional applications are under development. Table 2 lists the major user-facing applications of Oceans 2.0/3.0, with principal uses and years of original release.
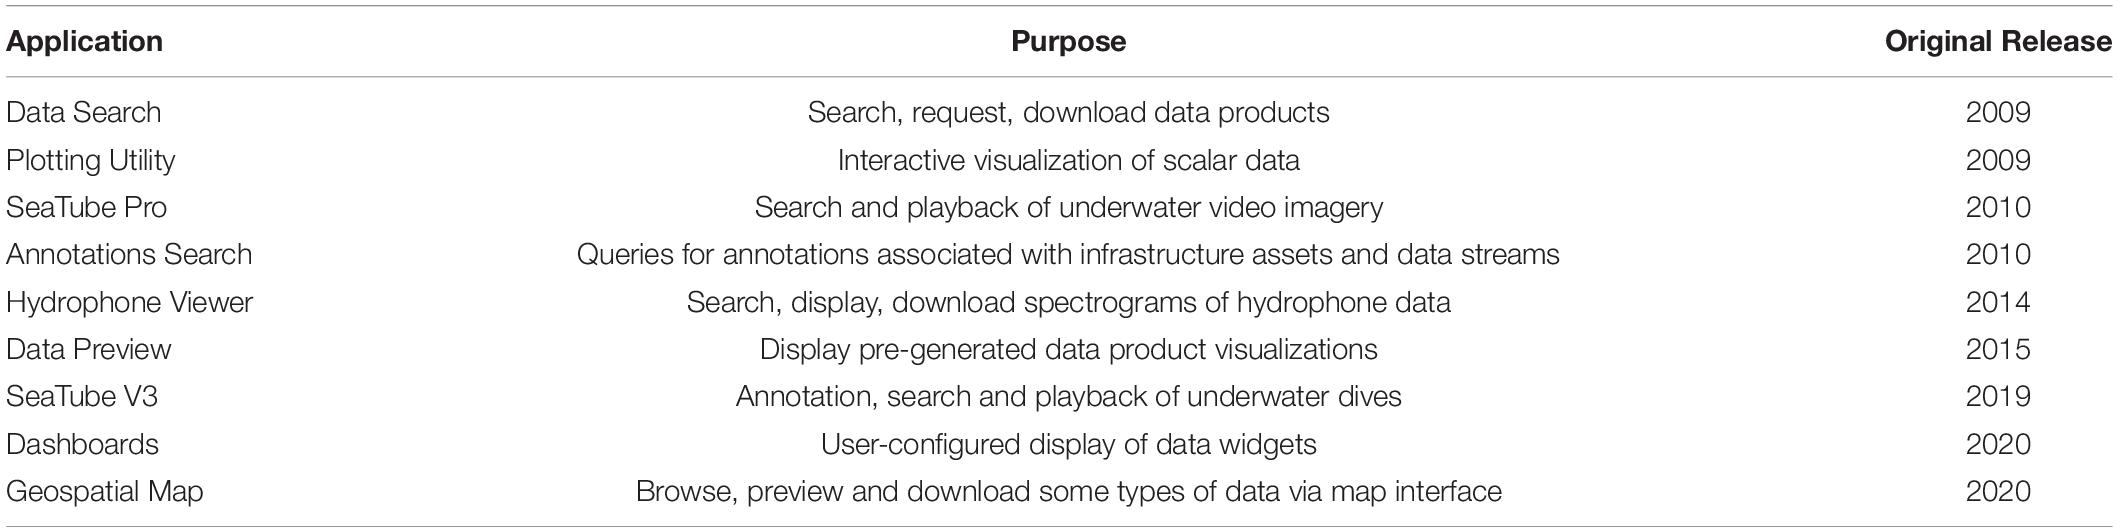
Table 2. Major user-facing Oceans 2.0/3.0 applications with principal uses and original release years.
User Interface Tools Used for Development
Over its 15 + year (to date) development history, Oceans 2.0/3.0 has employed a variety of User Interface (UI) tools and frameworks for implementation. Over time it has made use of Dojo (2009), MooTools (2009), YUI (2011), jQuery (2013), React (2018) and Material-UI (2018).
Prior to 2018, Oceans 2.0 was built using the YUI (Yahoo!) Library and the jQuery Library to ease DOM manipulation. Beginning in 2018 new UI development is done using the React (Facebook/Meta) Library for web components and the Material Design System (Google) Library for style and color. Several advantages motivated this change. As YUI became outdated and was no longer supported, it was gradually supplanted by React and Material Design System, which are well supported. Additionally, ONC struggled to hire developers familiar with YUI, as the majority of young talented developers expressed preference working with the more modern Reach/Material development stack.
Following this change, when YUI-based pages needed fixes or small upgrades, YUI was still used to complete the work. However, when new features were needed for those pages, they began to be developed in React and Material and placed alongside the YUI display. New pages are now developed completely with the React and Material Libraries.
Data Search
Overview
Oceans 3.0 Data Search (shown in Supplementary Figures 14–16) provides data processing and visualization for both scalar and complex data products. The application employs a shopping cart metaphor, whereby users browse and select data sources, choose data products and processing options (e.g., averaging or min-max), and then request and download processed results with accompanying metadata reports.
The shopping cart approach allows users to create and download multiple searches, and for logged-in users, records of previous searches are retained. This makes it possible for users to start a search in one session (e.g., from the office) and later check in on progress with the request from somewhere else (e.g., home).
Use Cases
Browsing Data Archives
Data Search allows users to see the full scope of all instrument deployment locations, time periods, and data products available in ONC’s extensive data archives. The map interface supports zoom-pan-scroll on networks and deployment locations, revealing the full density of deployments as users zoom to specific areas.
Targeted Search
The application’s main use is for the case where users have specific locations, time periods, instrument sources or data types in mind, and wish to perform targeted searches to obtain specific data products.
On-Demand Data Product Generation
Ocean Networks Canada’s 299+ data product types are all available for request and download via the Data Search application. Some of these products are retrieved directly from the file archive, while many are generated on demand, according to user-specified processing options.
Metadata
Upon fulfillment of every data request, an accompanying metadata file is generated, which includes information about instrument, sensor, date, time, geographical location, depth, and provenance of the requested data. Additionally, contact information for data stewards who can assist with data issues is provided.
Data Preview
Overview
Oceans 3.0 Data Preview (Supplementary Figure 17) displays visualizations of data from various time periods, including the previous 24 h, 30 days and over all time. As of 2021, approximately 8600 pre-generated data products were produced by daily scheduled jobs (the exact number varies). All products can be accessed via permalink and direct file requests in the API.
Use Cases
At-a-Glance Summary
Data Preview visualizations allow users to quickly review recent conditions and trends for locations and measurements of interest. These previews can be bookmarked (Supplementary Figure 18) for ease of sharing and single-click access. All displayed plots can be enlarged and downloaded to the user’s computer.
For every time series plot, associated sensor and instrument metadata are provided in a summary tab (Supplementary Figure 19), listing the sensor(s) used to produce the data, listings for each instrument deployed at the location over time, and direct links to interactive plots for each associated variable (generated within the Oceans 3.0 Plotting Utility application).
State-of-the-Ocean Plots
These all-time summary plots of down-sampled data indicate trends and anomalies over the entire time period of data collection from a location.
Animated Loops
Some data products display a series of gif images that are animated and controllable to indicate changes over time. An example is the set of animations showing surface current magnitude and direction, as detected by coastal radar array systems.
Plotting Utility
Overview
Oceans 3.0 Plotting Utility (Supplementary Figure 20) is an interactive plotting application for visualizing scalar measurements in the data archive. The application allows users to plot data over time (Supplementary Figure 24), zoom in/out over time, change plot formats, specify display of minima/maxima and averages, and overlay data in different dimensions to compare variations over time. Logged-in users can also save and share plots via permalinks for 1-click access.
Use Cases
Interactive Visualization and Exploration of Scalar Data
Plotting Utility allows users to interactively visualize explore scalar data in the Oceans 3.0 database, plotting values as zoomable time series. Hovering the cursor over plotted values reveals a dynamic readout of exact values, dates and times. The plot is expandable and includes a clickable legend enabling users to hide/reveal data averages and min-max envelopes.
An Options dropdown menu allows users to choose between raw or clean source data (the QA/QC option), generate a PNG image of the plot, view numerical values of plotted data (Supplementary Figure 26, generally decimated from the full source dataset), configure plot properties (Supplementary Figure 25) and toggle the plot legend display.
Comparative Analysis of Overlaid Data
Multiple curves, either from different sensors on the same instrument or from different instruments, can be combined into single plots, enabling comparative analysis of variables over time, as illustrated in Supplementary Figure 21, Plot 1 and Plot 4.
Saving and Sharing Plots
Defined data time series plots can be saved by logged-in users within the application. These plots can then be retrieved as menu items in the Saved Plots tab of the interface. They may also be referenced via unique sharable permalinks or Reference Links, as shown in Supplementary Figure 22.
Displaying Live Data Streams
This application can be used to display near real time data readings from non-autonomous instruments. By selecting a relatively short time period for display (e.g., last 24 or 2 h), and setting Auto Refresh interval (illustrated in Supplementary Figure 23) to a desired frequency (e.g., every 15 s or 60 min), the displayed plot will be configured to automatically regenerate, with latest data values appearing on the right side of the plot.
SeaTube Pro and SeaTube V3
Overview
SeaTube Pro and SeaTube V3 (Supplementary Figures 27, 28) are streaming video player applications that display video from fixed cameras on ONC’s networks as well as live and on-demand dive video from ROV cameras during maintenance and scientific expeditions. SeaTube Pro (first released in 2010) is a fully functional legacy application, which will eventually be deprecated. SeaTube V3 (first released in 2019) was an entirely new rebuild of the original application with enhanced capabilities and an improved UI. Both SeaTube applications are customized for creating, searching, and displaying annotations, comments associated with entries in published or custom taxonomies, and with other properties and events observed when the annotation was created. Annotations are described in more detail below, in section User-Contributed Content.
Use Cases
Dive Logging
One of SeaTube’s primary use cases is to provide a record of expedition dives. Dive loggers working both on the expedition vessel (as shown in Figure 9) and on-shore watch the live ROV video stream in the SeaTube video player, and annotate engineering events as well as biological observations. For maintenance operations, annotations describe what actions were taken by the ROV operators. Authorized users are presented with a form to add or edit annotations. Annotations created here can include a taxon from several external taxonomies (WoRMS, WoRDSS, and CMECS) and custom internal taxonomies. An annotation with a taxon from an external taxonomy is displayed with a link to the taxon’s details on the taxonomy’s website.
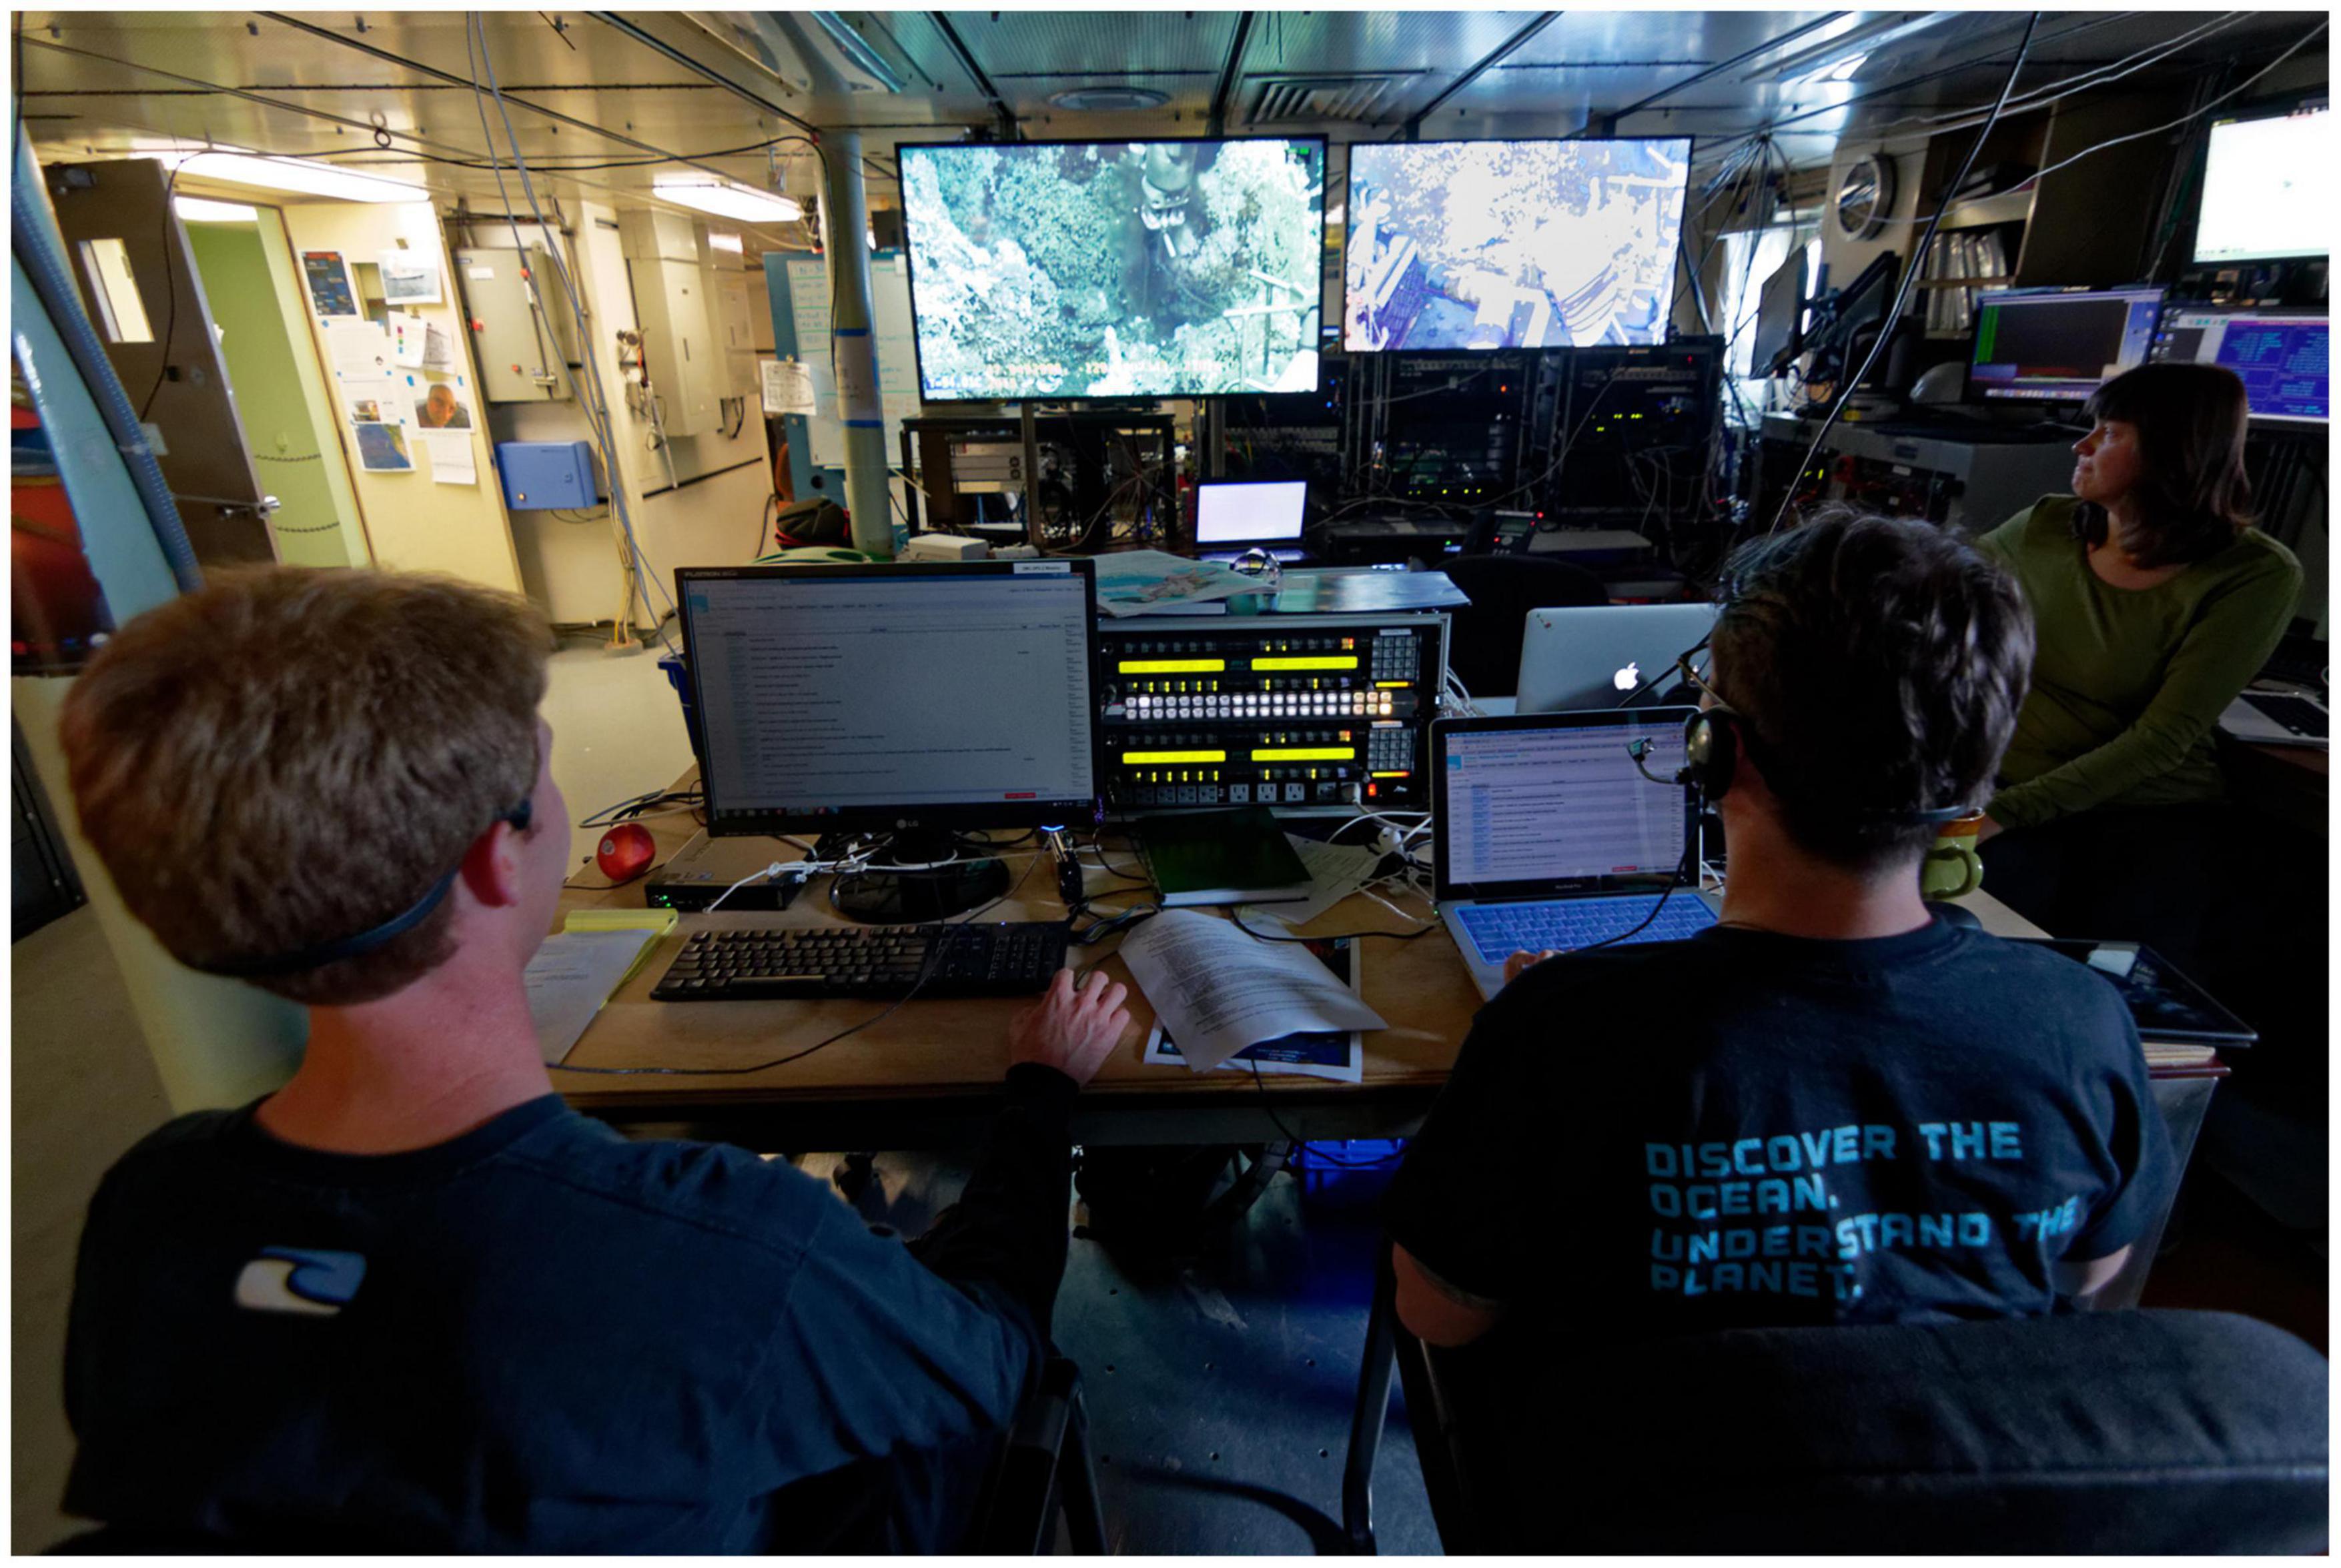
Figure 9. ONC dive loggers observing operations from the computer lab aboard the R/V Thomas G Thomson, 9 September 2015. Pictured from left: Ross Timmerman, Fabio C. De Leo, Reyna Jenkyns.
Searching for Video
Video events can be found either by browsing, or by searching through annotations. Both SeaTube Pro and SeaTube V3 provide navigational tools for browsing by organization, expedition and dive. As of May 2021, SeaTube contained video from 1400 dives across 160 expeditions by ONC, NOAA, Ifremer and Fisheries and Oceans Canada. SeaTube Pro also includes a geographical tree menu for navigating to recordings from fixed-location cameras.
Videos from one or more expeditions can also be found by searching annotations. Annotations can be searched by comment text, author, taxonomy and taxon, and other attributes. The user can navigate from the search results directly to the video at the point the annotation was entered.
SeaTube Search (shown in Supplementary Figure 29) enables discovery of annotations from one or more expeditions. A user can constrain the search by selecting one or more dives, annotation authors and editors, searching for taxons from any supported taxonomy, or specifying comment text. After running the search, the user can switch to the video player and jump to the time of an annotation by clicking in the search results. Users can export search results to CSV or JSON, and can include snapshots of the video at the time of each annotation.
Managing Attributes and Taxonomies
Management tools allow dive administrators to customize SeaTube. Taxonomy Management allows creation of custom taxonomies from user-defined taxons or ones imported from CMECS, WoRMS, or other users’ taxonomies. Attribute Management allows users to configure custom attributes (e.g., depth, description, count) to be attached to annotations or associated with taxons. These functionalities are described in detail in section User-Contributed Content.
Hydrophone Viewer
Overview
Oceans 3.0 Hydrophone Viewer (Supplementary Figure 30) allows users to browse visually through spectrograms representing passive acoustic data gathered from hydrophones. Visual patterns and signatures of acoustic events can be identified in these spectrograms and the associated data files can be downloaded directly from the Hydrophone Viewer interface.
Use Cases
Browsing Spectrograms
The main use of this application is for visually browsing through spectrograms, 1 day at a time. The table of 5-min spectrograms is scrollable and individual spectrograms enlarge/shrink on click to reveal more visual detail. Not all types of acoustic events are indicated by the default rendering parameters for these spectrograms, but many periods of acoustic activity can be more quickly identified by the trained eye for download and more in-depth inspection.
Downloading Hydrophone Data in Various Formats
Where available, archived hydrophone data can be downloaded in a selection of audio (WAV, FLAC, MP3, HYD) and spectral (PNG, PDF, FFT) data product formats. This shortcut is an alternative to downloading data via the Data Search application.
Searching for Annotated Hydrophone Data
For hydrophone data streams that have been annotated (whether manually or via automated algorithms) a simple search tool allows users to find specific 5-min periods associated with specific annotations.
Dashboards
Overview
Oceans 3.0 Dashboards provide an intuitive interface for creating displays of Oceans 3.0 data organized in ways that make sense to a user. It supports the display of time series, video and other data formats using a widget-based interface. A variety of users benefit from Dashboards functionality including experienced ONC staff members, who create their own custom displays for monitoring data, or educators wanting to highlight various data for their students.
A dashboard is defined as a visual tool providing an at-a-glance overview of a set of data. A widget is defined as an independent visualization of data that can be placed onto a dashboard.
Use Cases
Monitoring Data Streams
One use case is support for monitoring specific instruments. ONC staff members need to confirm their instruments are performing properly, Dashboards help them by displaying data from multiple instruments with different types of data on one page.
Community Pages and Displays
Another use case is to support simple creation of pages displaying highlights of community observatory data. A dashboard can also be used as a display in an educational or visitor facility to support exploration of selected data.
Sharing a Dashboard or Widget
A dashboard can be shared with another Oceans 3.0 user in read-only mode by specifying the user’s email address. In addition, a dashboard can be published where it will be visible to any user. It is also possible for logged-in users to share individual embeddable widgets. Widget types are listed in Supplementary Table 3. Each widget within a dashboard includes a hover link that displays embeddable iframe code that may be included in external web pages (as shown in Supplementary Figure 31).
User-Contributed Content
Annotations
Oceans 3.0 uses annotations to add comments to infrastructure elements and data segments, or to mark data of special interest. Annotations consist of metadata attached to system resources: physical entities (instruments, topology connections, remotely operated vehicles), logical connections, events (dives or expeditions), and data products (instrument data, audio, video, plots). An annotation includes form-based content, its author, and the resource and time range to which the annotation applies. The fields available for an annotation’s content are specific to the context in which the annotation is created and can be customized by administrators. These fields can include free text, selection and multi-selection from custom dropdown lists and trees, checkboxes and radio boxes, and entries from external taxonomies including WoRMS and CMECS.
Annotations are stored in the main relational database, with links to their annotated resource, allowing users to efficiently search for annotations and data according to resource type, resource, creation time and the contents of the annotation’s form’s fields. For example, a user could search for all annotations on a certain instrument’s data, or for all annotations denoting ship noise in hydrophone data.
Annotations of scientific interest on instrument data are most often created by experts logging dive video, by citizen science users, and by AI tools that classify and identify patterns in data streams, such as whale calls in hydrophone data.
Digital Fishers
Citizen scientist annotations are created through the Digital Fishers web application (Supplementary Figure 32), a tool for crowd-sourcing the annotation of video data. A citizen user of Digital Fishers watches a series of short (typically 15-s or 1-min) video clips, and annotates each clip according to a custom vocabulary specific to the campaign, for example, by dropdown selection of the water visibility, sea floor type, presence of certain fish species and presence of any other objects. Context of the current video clip is provided in a sidebar with the date of the video and the latitude, longitude, depth, and a map showing the location of the camera.
More experienced users are provided with a more detailed vocabulary to choose from when annotating clips; where a new user selects from “flat” or “uneven” to describe the seafloor, a more experienced user is provided a structured hierarchy of terms to indicate the presence of methane hydrates, biogenic structures (sponges, corals, etc.), bubbles, mineral structures (carbonates, black smokers, etc.), and soft bottom structures (sediment, pits, etc.).
To encourage user engagement, Digital Fishers includes several game-like features that are unlocked based on the number of video clips the user has annotated. After certain numbers of annotations are contributed, they unlock a card with information about, and an illustration of, a marine species (example shown in Supplementary Figure 33). Every five cards, the user reaches a new level (five levels exist), providing them with a more complex vocabulary. A tutorial appears when each level is unlocked to introduce the user to new terms, and can be reviewed while playing. A user always has the option of operating as a lower-level user in order to annotate using the simpler vocabulary. Digital Fishers shows a leaderboard listing the people with the highest daily and all-time numbers of annotations submitted.
Videos in Digital Fishers are organized into campaigns, which are created and managed by scientists and network administrators. The campaign creator writes a mission statement describing the campaign’s science goals (example in Supplementary Figure 34), and selects the annotation form and video clips to be used. Video clips are selected either by manually creating a list of segments by camera ID and time range, or by linking to a SeaTube playlist. A campaign is normally enabled during a date range specified by its creator, and can be enabled or disabled manually.
Digital Fishers tracks statistics about each campaign, which can be made available to administrators and campaign creators, providing breakdowns of the citizen users creating annotations and numbers of annotations and views of each clip.
Matabos et al. (2017) presented results of a campaign that compared crowd-sourced annotations with those produced by an expert fisheries biologist and an automated computer algorithm. Researchers found that volunteer annotators, with little prior experience, could with training and practice attain identification accuracies comparable to those of the expert. This study demonstrated the value of a hybrid combination of crowdsourcing and computer vision techniques as a tool to help process large volumes of imagery in support of basic research and environmental monitoring.
SeaTube
The SeaTube video player (described in section “Data Discovery and Access”) allows users to view and annotate dive video recorded from Remotely Operated Vehicle (ROV) cameras during ONC’s maintenance expeditions and NOAA’s scientific expeditions. Additionally annotations can be made for video recordings from fixed cameras on ONC’s networks. Expedition vessels typically do not have sufficient space for a full complement of scientific staff annotating the at-sea activities, and some of the logging needs to be performed on-shore. In order to support real time on-shore dive logging, live low-resolution video is streamed via satellite from the ship. Annotations are recorded by observers both at sea (from one or more expedition vessels) and on shore, and are collated together by an asynchronous messaging system, which ensures that annotations and other sensor data recorded on ship are archived even when the ship loses its Internet connection. The Oceans 3.0 video distribution and acquisition framework is illustrated in Figure 10. The data flow between multiple ships and shore-based systems is illustrated in Figure 11.

Figure 10. Oceans 3.0 video data acquisition and distribution system. The two blocks at left illustrate video and data flow from the Remotely Operated Vehicle to on-ship systems. On-ship loggers write annotations during dives while connected to the on-ship system. The low-res video, sensor and annotation data are transmitted via satellite from ship to the Oceans 3.0 Data Acquisition Framework (DAF). Video and camera data also flow from fixed camera systems via cabled networks into the DAF (box at right). Web and media servers within shore stations and the ONC data center distribute video streams, sensor data and annotations to the cloud. Loggers who are not on ship can watch the real time video stream and contribute annotations that are time stamped and collated with ship-based annotations.
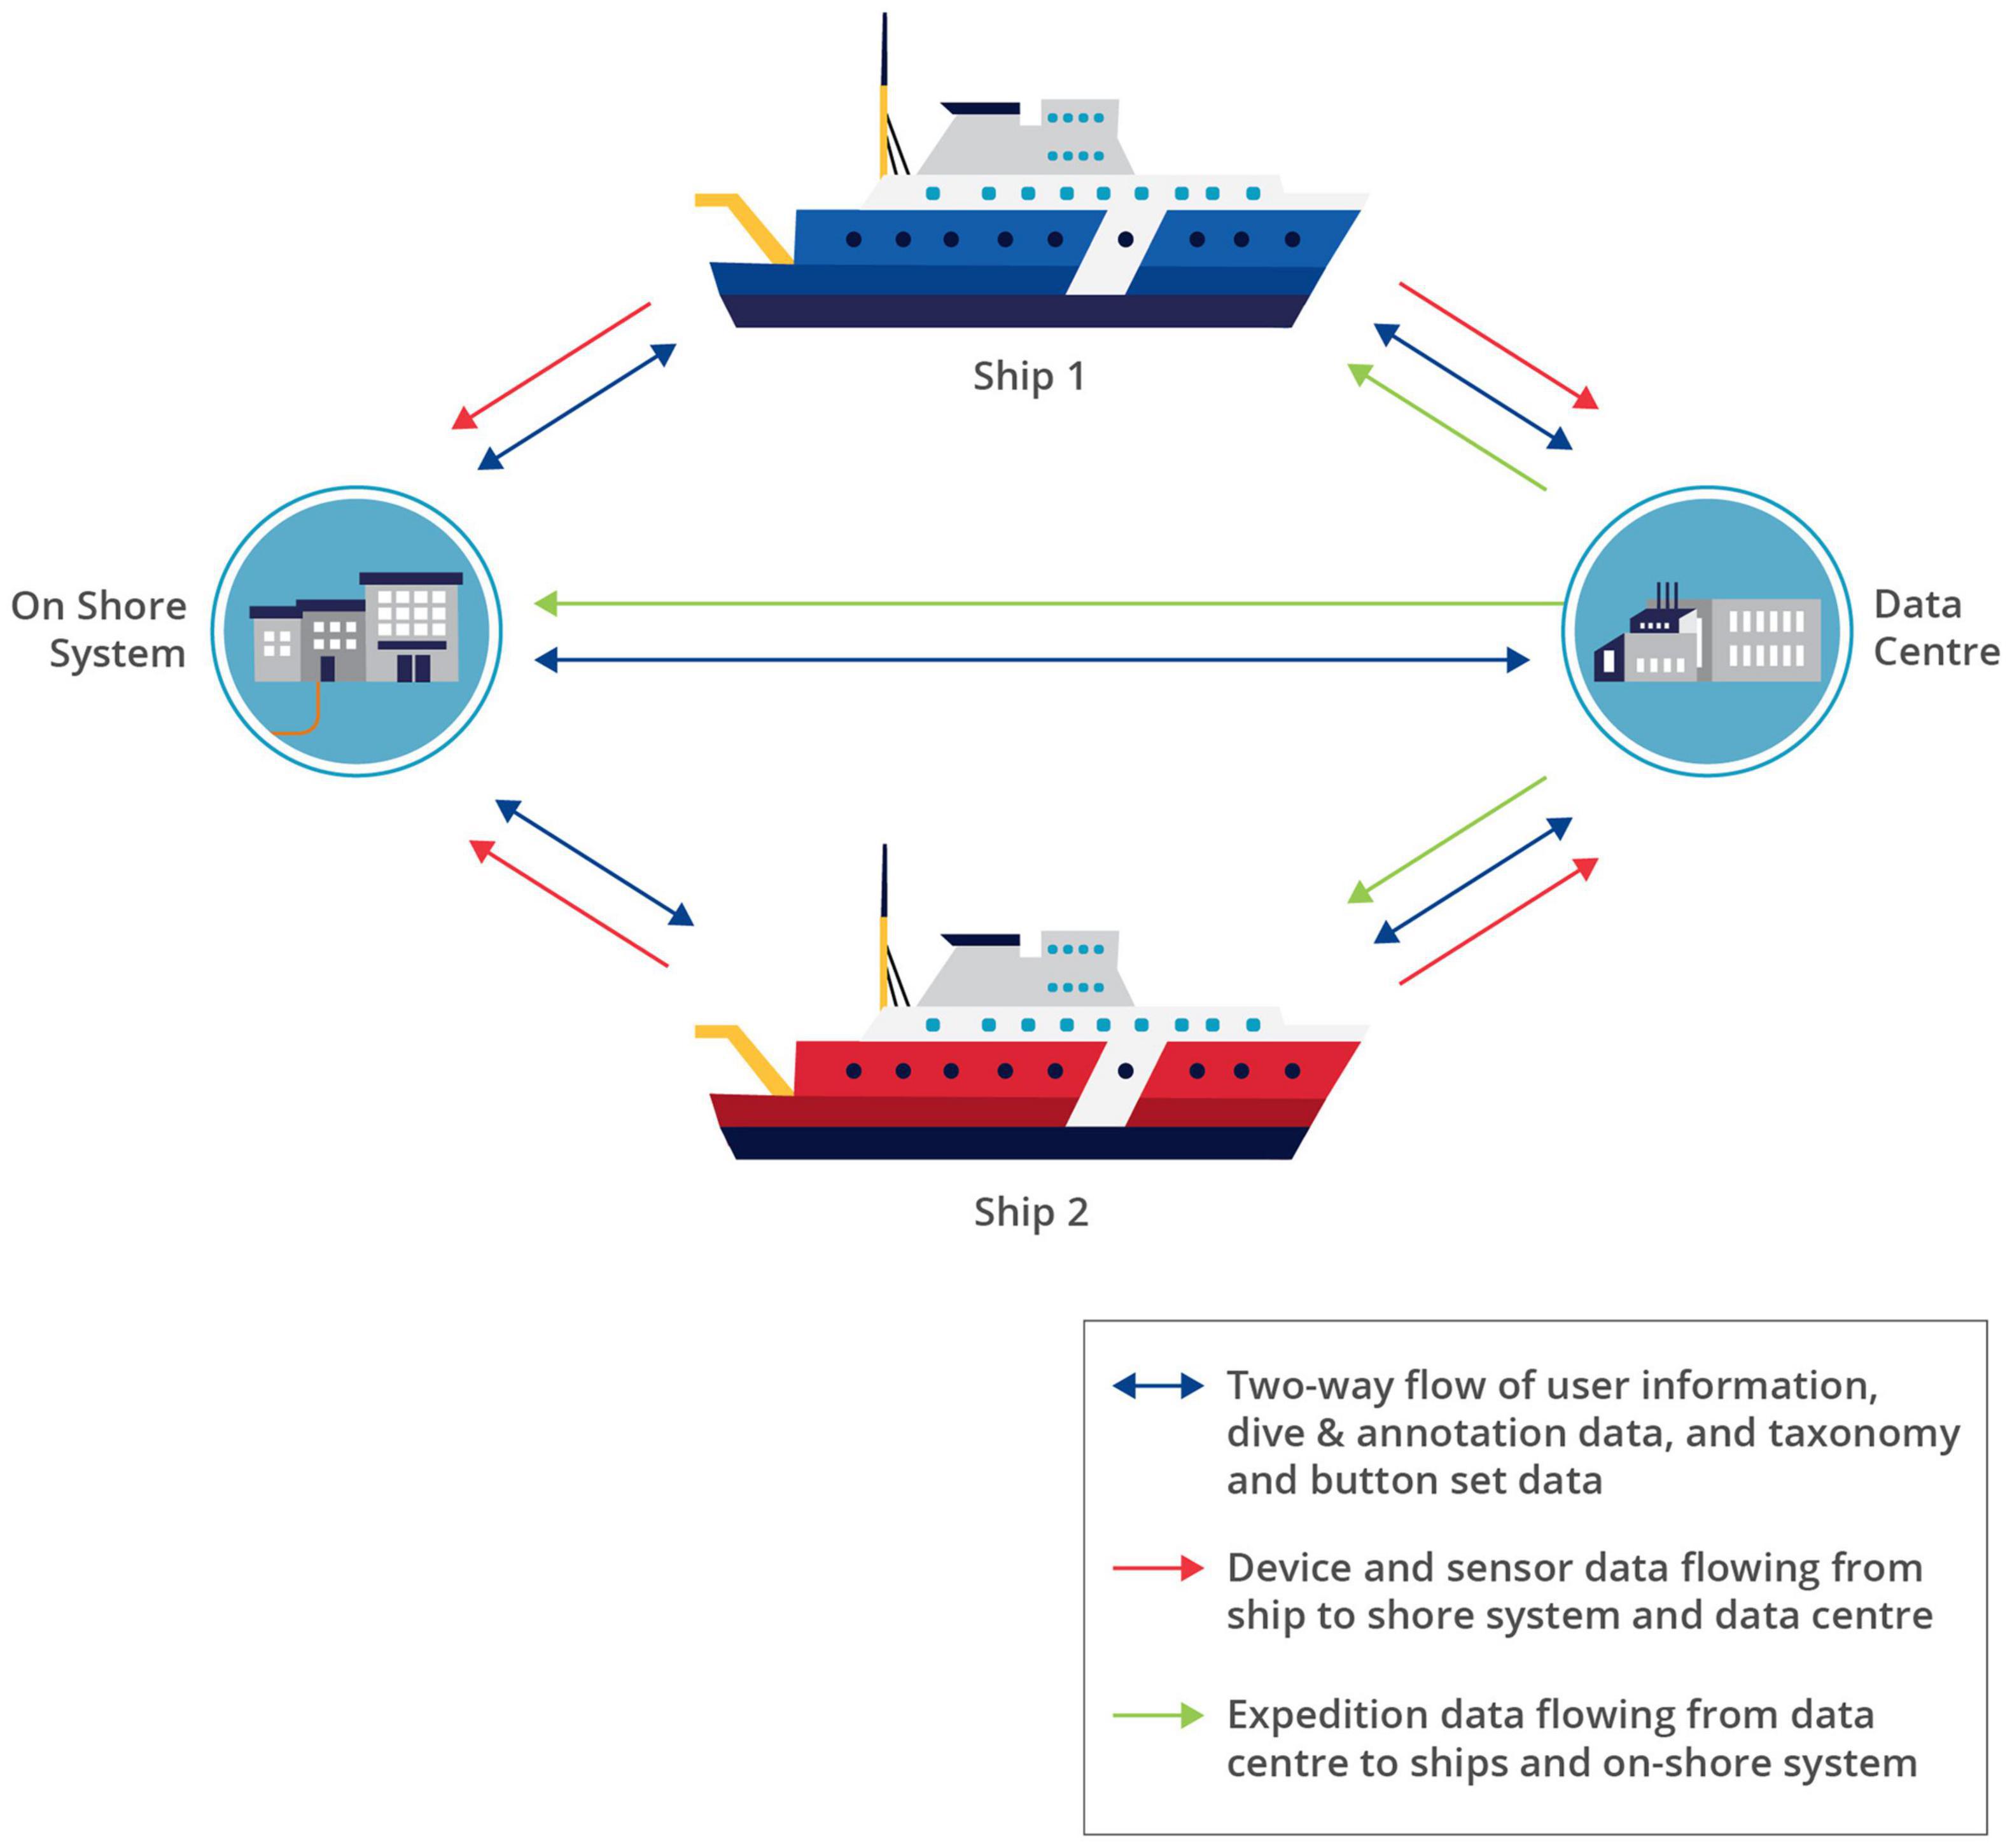
Figure 11. Data flow between ships, the on-shore system and the data center. The SeaTube annotation system supports simultaneous annotations and data streams from multiple ships and shore-based loggers. There is a two-way flow or user information, dive and annotation data and taxonomy and button set configurations. Device and sensor data flow from ships to both the on-shore system and the data center. Expedition data flows from the data center to the ships and the on-shore system.
Observers annotating dive video in SeaTube are not restricted to the limited taxonomies used by citizen science users in Digital Fishers; instead, annotations can include taxons from scientific taxonomies (such as WoRMS for scientific annotations, shown in Supplementary Figure 35) and task-specific taxonomies (for example, for engineering annotations on maintenance expeditions).
Users also have access to predefined button sets to quickly create annotations, as shown in Supplementary Figure 36. Annotations created in SeaTube are linked to specific time stamps in the video.
Community Fishers
Community Fishers is a citizen science program that partners with First Nations and other communities and organizations to gather water profile measurements from their vessels for their ocean monitoring programs. The Community Fishers crews are equipped with a Conductivity-Temperature-Depth (CTD) instrument and an accompanying Android tablet running custom data acquisition software, as shown in Figure 12. Most CTDs support additional sensors as piggy-backs including oxygen, turbidity and chlorophyll sensors. The instrument sets are calibrated by the manufacturer and validated by ONC before initial distribution to community partners. They are subsequently validated annually and recalibrated when necessary. ONC conducts a rigorous initial training program and provides ongoing support to partners, in order to ensure higher quality data collection and prevent potential damage through misuse.
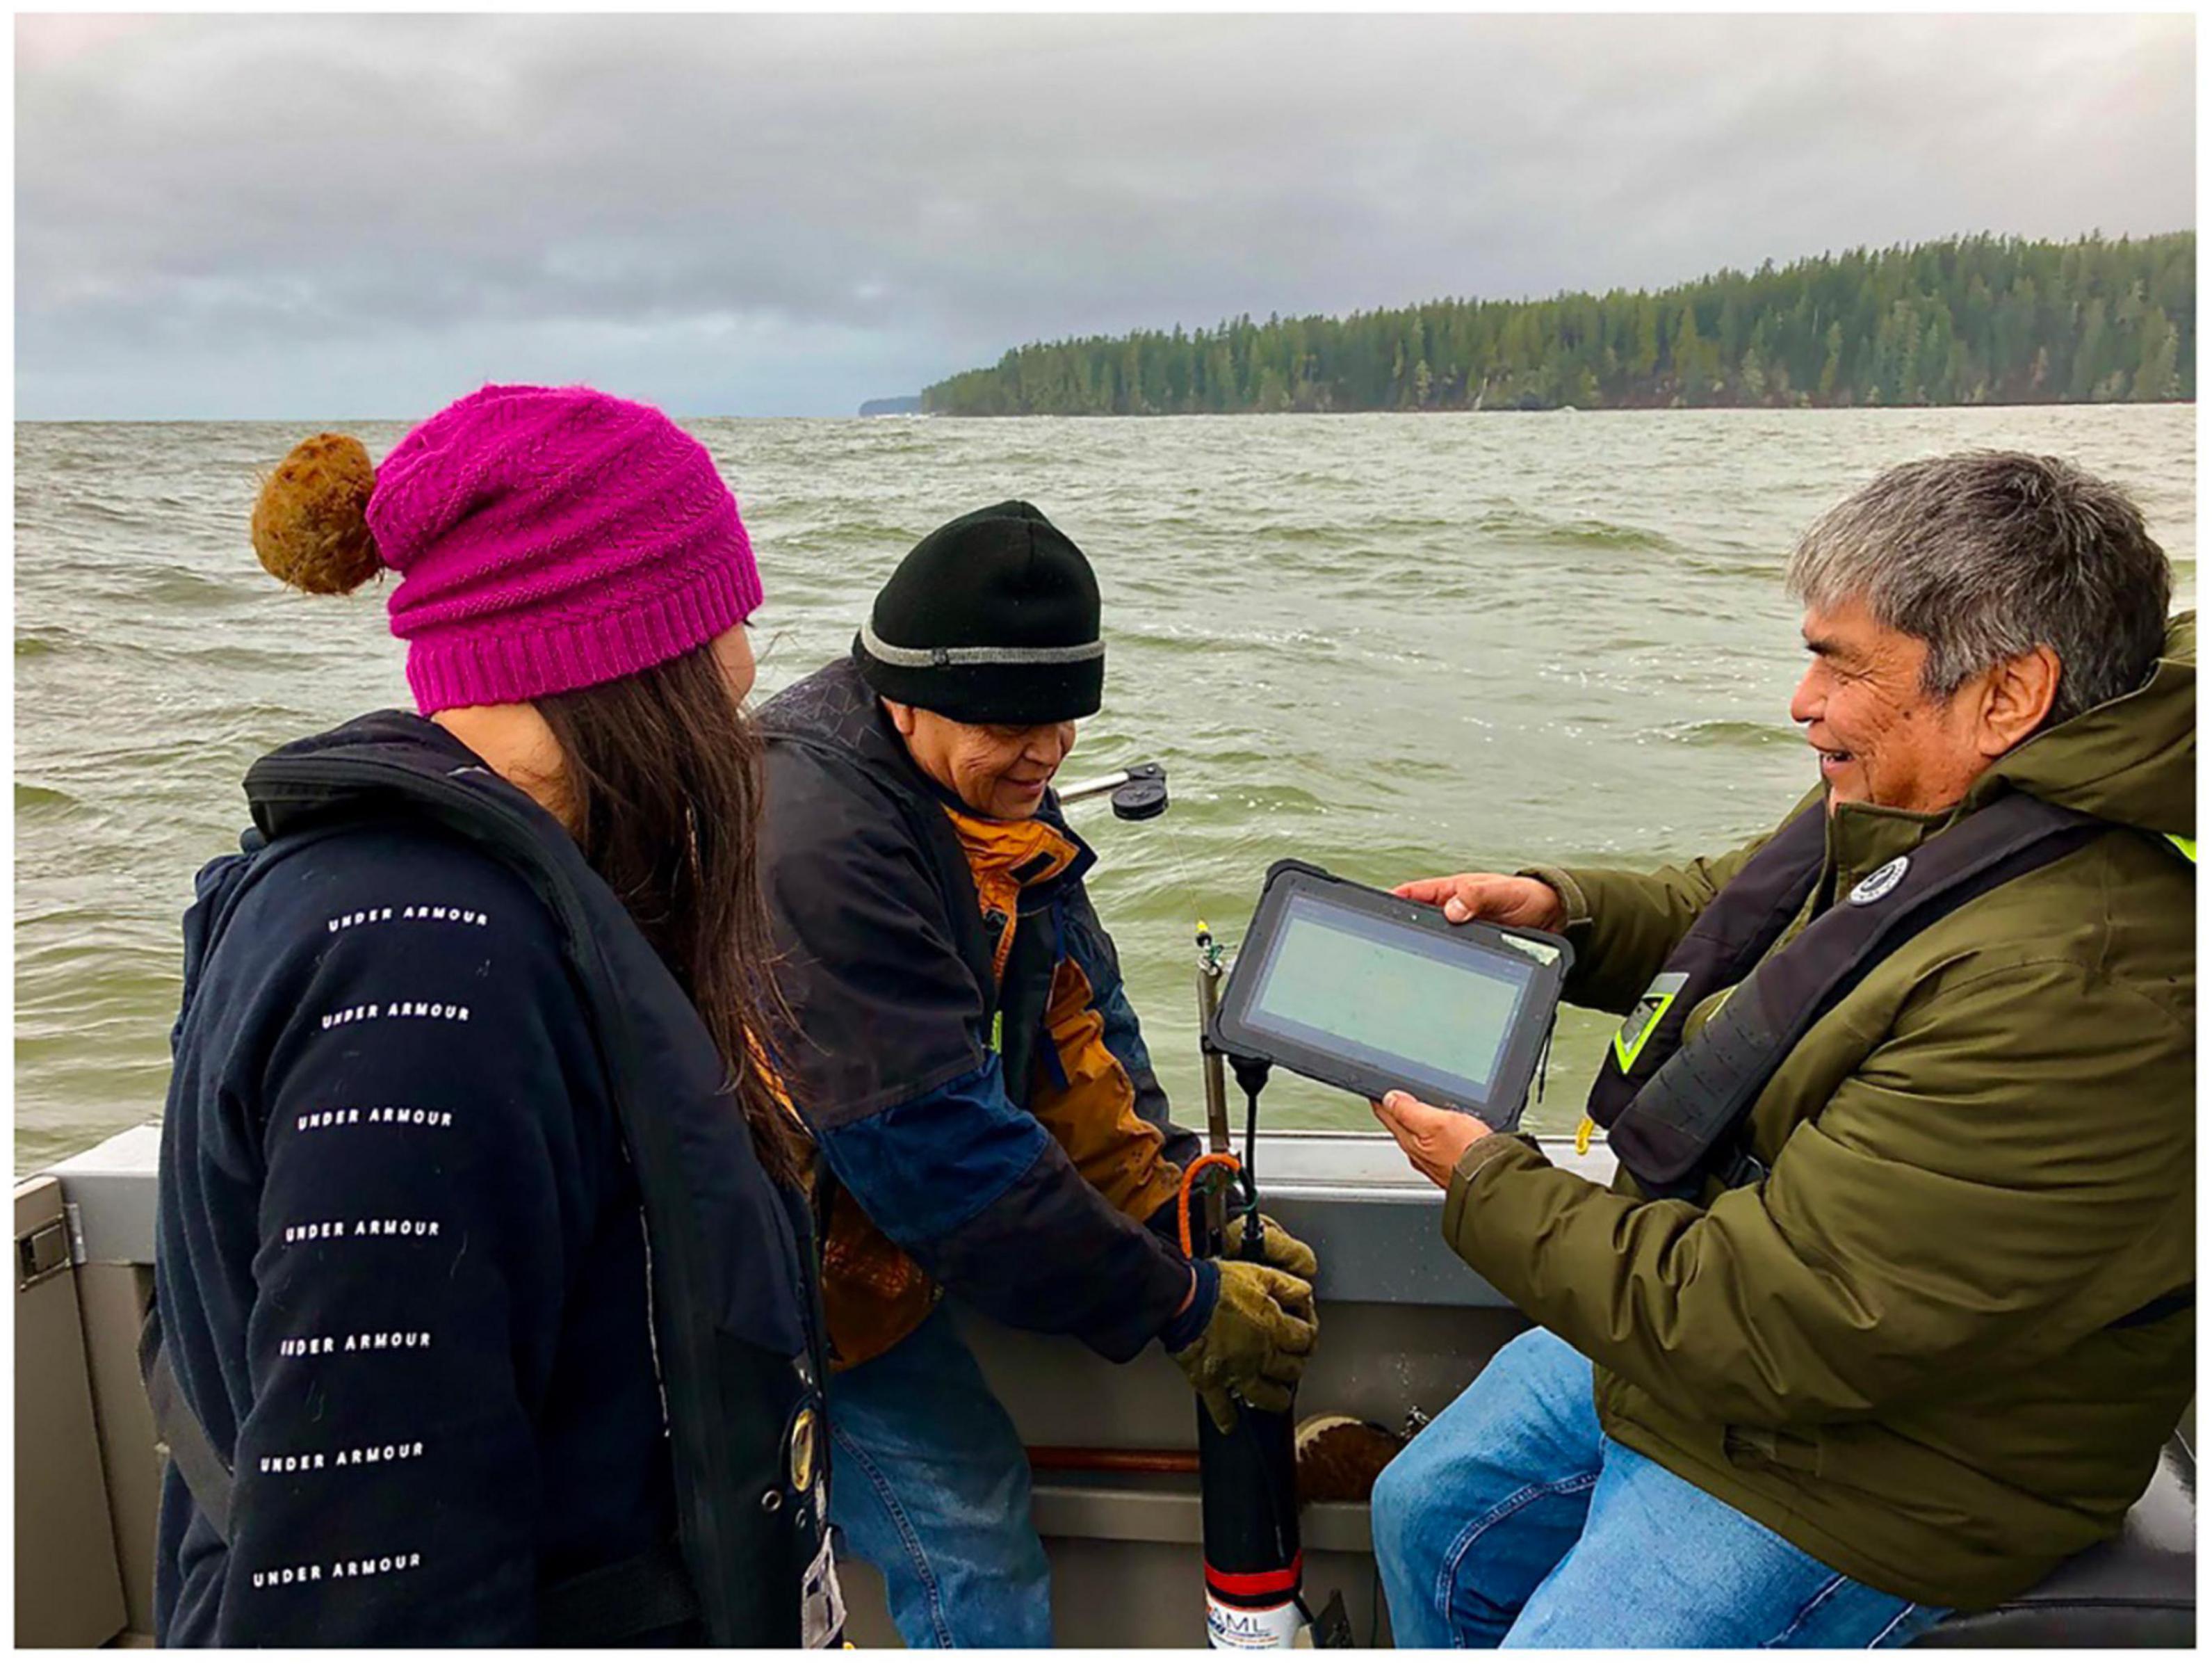
Figure 12. Citizen scientists use ONC’s Community Fishers app to collect oceanographic data within Pacheedaht First Nation waters in the Strait of Juan de Fuca, January 2020. Pictured from left: Tammi Peter, Leon Jones, Guy Louie. Leon Jones holds the Conductivity-Temperature-Depth (CTD) instrument used to collect readings, while Guy Louie holds an Android tablet with customized data acquisition software.
Each CTD device is typically deployed using a downrigger on a stationary vessel to lower the device through the water column to the seafloor, then retrieve it. After recovery, collected data are transmitted to the tablet via Bluetooth. Once the tablet comes within range of a WiFi network, the data are then uploaded to an FTP server on the ONC data acquisition framework. From this point forward, the process goes through the standard stages of parsing, calibration, QA/QC and packaging, as outlined in section Data Acquisition and Archival.
The Android app (screen capture shown in Supplementary Figure 37) has been designed as a turnkey system, with the aim of making it easy to use by non-technical operators on the water. The app reminds users to do things such as confirm GPS signal strength (or hand enter the latitude and longitude) and remove the cap on the oxygen sensor before deployment.
Data profiles are usually collected within predefined octagonal geospatial locations. In some instances, profiles are made in locations outside the area octagons, requiring location assignment by a data specialist.
After transmission to the shore system for processing, custom algorithms are used to find the relevant part of the data record; usually this is the downward moving cast through the undisturbed water. The software then analyzes the down-cast, collecting and averaging groups of readings into 1m pressure bins, which are used to create data profiles by calculating variables over depth. Data quality issues such as pauses in the down-cast, improper speed of lowering and ship heave are also detected and corrected by the software.
Geospatial Map
Data collected via the Community Fishers citizen science program can be accessed via the Oceans 3.0 Data Search application, via the API and via Geospatial Map, a specialized application designed for preview and download of cast data. The interface was designed for use in bandwidth-limited locations and combines several methods for reducing bandwidth requirements, including the use of OpenStreetMap for the map background (this mapping platform is lighter and quicker to load than many others) and a lazy loading strategy, in which data plots are not loaded into the interface until selected by the user.
When the user clicks within an octagonal cast area, a pop-up window appears (illustrated in Supplementary Figure 38), displaying zoomable pre-generated thumbnail profile plots to reduce loading time. From there, the user may drill down into the full history of casts for a location and download cast data in text format, as shown in Supplementary Figure 39.
Programmatic Use
Application Programming Interface
Oceans 3.0 includes a publicly accessible API, allowing users to access Ocean Networks Canada data via user-defined code. This API is guaranteed to be backward compatible and provides a number of RESTful (Fielding, 2000) services to discover and download data (Extensive details on these services are provided in the Oceans 3.0 public wiki2).
The services in the API are split into two groups: (1) Discovery and (2) Delivery.
Discovery Services
The purpose of Discovery services is to enable users to uncover terminology, organizing concepts and domain language used to structure data within the archive. Users can query the terms and infrastructure constructs used by Oceans 3.0, including:
• Locations,
• Deployments,
• Devices,
• Device categories,
• Properties, and
• Data products.
Each discovery service supports a set of filters with standardized codes; this makes it possible for the outputs of one service call to be used as filters for a subsequent call. These same codes can then be used in a delivery service to download data.
Example Discovery Calls
Devices service call to retrieve a list of all devices at the Barkley Hydrates location (locationCode BACHY):
• https://data.oceannetworks.ca/api/devices?method=get&locationCode=BACHY&token=YOUR_TOKEN_HERE
Locations service call to retrieve a list of all locations with a fluorometer (deviceCategoryCode FLNTU):
Deployments service call to retrieve a list of all fluorometer deployments (deviceCategoryCode FLNTU) in the Barkley Canyon Axis location (locationCode BACAX):
DataProducts service call to retrieve a list of all data product types available for fluorometer data (deviceCategoryCode FLNTU):
Since multiple instruments or devices may be deployed to the same location over time, the API also supports calls to query specific oceanographic variables or properties over time at a location. The software then stitches together measurements of the same property across different devices deployed over time at the specified location.
Example Property Calls
Properties service call to retrieve a list of all properties measured by a particular CTD (deviceCode SBECTD16p7028):
Properties service call to retrieve a list of all properties measured at the Barkley Hydrates location (locationCode BACHY):
• https://data.oceannetworks.ca/api/properties?method=get&locationCode=BACHY&token=YOUR_TOKEN_HERE
Delivery Services
The Delivery services are the methods used to request and obtain data. There are synchronous, asynchronous and direct delivery variants. The synchronous services support immediate delivery of scalar and raw data obtained from the real time acquisition system, whereas the asynchronous services support delivery of highly processed and/or large amounts of data.
Synchronous Delivery Services
Two synchronous services, scalardata and rawdata, return data in the response payload, supporting near real time access. Both services are designed around the chunking delivery pattern where the return is limited in size and provides the parameters to get the next chunk; the size is set to 100k records and 100 MB by default (whichever is exceeded first). The client iterates through the manageable chunks accumulating data. These services are provided by the task machine pool through a load balancer (this is a very recent change). These services have the option to request the latest data, while the scalardata service also offers resampling and aggregation.
Scalardata
Within Oceans 3.0 nomenclature, the term scalar is used to refer to simple data values, e.g., a temperature value from a specific time and location. Scalar data are stored in the Cassandra no-SQL database as tabular data. The scalardata service produces a JSON payload containing data values pulled from this database. Here is an example call to retrieve scalar data in JSON format from a specific Sea-Bird instrument (deviceCode SBECTD19p7027):
Rawdata
This service retrieves unparsed, unprocessed raw data produced by instruments. This could be recently acquired data that have been stored temporarily in the Cassandra database or daily compilations of data that have been written into raw log files stored within the Oceans 3.0 Archive Directory file server (see section “Data Acquisition and Archival” for more background information on data storage).
Archivefiles
The archivefiles service allows users to search for available files in a location or from a particular device and download them. All types of files are accessible, including those acquired via file acquisition such as FTP, processed data products, etc. The getListByLocation method produces a list of data files for a given location code and device category code. The getListByDevice method produces a list of data files from a specific device. The lists generated by these two methods can then be parsed into individual files that may be retrieved via the getFile method.
Client Libraries
Ocean Networks Canada also provides client libraries for MATLAB, Python and R which wrap the service calls and simplify access to discovery and delivery services. Depending on the language required, these libraries are available using the appropriate public repository, for example, PyPi for the Python library.
Asynchronous Delivery Service – DataProductDelivery
The dataProductDelivery service mirrors the 3-step process used in the Oceans 3.0 Data Search application (see section “Data Discovery and Access”) to specify a data request, run the request and then download the resulting data products. Thus, three methods are provided: request, run and download. When making a request call, the user specifies device sources, time periods, data products and processing options. The method does not generate data in this first step, instead it validates the parameters and generates a new request ID. This request ID is then used for the second run method, which starts the data product generation process by adding the request to the Oceans 3.0 task queue and generating a new run ID. Finally, the download method uses the run ID to obtain the status of the run, whether canceled, queued, error, running or complete. Once the status has been set to complete the requested data product files can be downloaded from the FTP server.
User-Defined Tasks
Overview
Ocean Networks Canada users often want to perform their own processing on Oceans 3.0 data. However, the amount of data required for processing may be very large, requiring a lengthy time period for download to the user’s environment. In order to minimize download time, Oceans 3.0 supports running the processing “close to the data” via user-defined tasks. “Close” refers to a minimized amount of time required to obtain data and make it available for processing.
User-defined tasks are run in a scalable cloud computing environment internal to ONC that enables users to upload and run their scripts (programs using Oceans 3.0 data) on ONC servers. This enables faster and more efficient data access which is particularly important for high-volume data such as acoustic or video data. Programs can be written in any of several languages including C/C++, Python, MATLAB, or R, and can be either scheduled or run on-demand. A user-defined task environment includes the Oceans 3.0 client libraries pre-installed, as well as other commonly used libraries such as the SciPy/NumPy scientific computing stack in Python. This set of libraries enables users to perform their desired scientific computing operations simply by calling the appropriate functions in their scripts. Oceans 3.0 includes system health monitoring features, including alerts for system admin staff when system resources are overloaded. The task machine pool can also scale to handle additional user-defined tasks, search requests and other processing as needed.
Users’ Code
The most important ingredient of a user-defined task is a user’s code. As a first step, users are advised to experiment, develop and test their code on their own machine with the supported languages, emulating the operational environment, while working with small amounts of downloaded data. Users need to make use of the Oceans 3.0 API, optionally through the client libraries.
Once the user’s code has been developed and tested, the next recommended step is for the user to upload this code into the sandbox environment, where access to larger datasets is optimized. Both the user’s development environment and the user-defined tasks runtime environment work the same way: data are downloaded to the working environment via the API, but that download is much faster within the ONC server environment.
User-Defined Tasks
When execution is transferred to the ONC server environment, the user’s code is defined as user-defined tasks (example shown in Supplementary Figure 40) that are created using Oceans 3.0 Task Management interface (see section “Data Acquisition and Archival” for more on the Task Management interface). For each task, the user chooses the language used, uploads the source and any accessory files, provides the command to run the code and saves the task.
Running a User-Defined Task
Once the user-defined task has been created it can be run from the same screen. The status of the task can be monitored from the Task Management tab. Once the task is complete the results can be viewed in User’s FTP Directory, which is also where search results and all products for users are stored (accessible via a link in the Oceans 3.0 main menu.) The results are organized under a directory with the task name. Depending on whether the task was run with the unzipped flag set to true or false the files generated by the task will either be stored in a data folder or in a.tar file.
Hydrophone Use Case
Hydrophones continuously collect data at very high rates over broad frequency ranges, resulting in very large data archives for each instrument. This data volume is compounded by the installation of tetrahedral hydrophone arrays, with four co-located instruments, which are used for directional location and tracking of sound sources such as ships or whales. For researchers wishing to analyze patterns or trends across multiple hydrophone arrays and over long time periods, data download becomes extremely impractical.
An example application might be searching through tens of thousands of hours of hydrophone recordings, using a classification algorithm to identify specific marine mammal call types. Another example could be the analysis of many months or years of hydrophone data in order to characterize the marine soundscape at a location. For applications such as these, the use of user-defined tasks running in the ONC server environment is the only practical approach.
Interoperability
When designing Oceans 3.0, ONC wanted to build a system that addressed the key requirements of Open Data, providing freely available, easily accessible data. When the FAIR principles (described in section “Metadata”) were later formulated in the global data management community, they aligned well with Oceans 3.0’s built-in support for Open Data allowing ONC to deliver data that are:
• Findable, through development of comprehensive search tools enabled by the underlying metadata structure.
• Accessible, through simple download of raw data or data products but also through visualization tools. This is the most developed user-facing aspect of Oceans 3.0.
• Interoperable, as a result of considerable efforts to make data shareable and usable by other third party analysis systems and tools. Interoperability starts with ONC’s approach to managing internal data: the wide variety of supported different instrument types requires standardization on many fronts such as with respect to timing or data transport formats, as described in section Architecture.
• Reusable. Reusability and reproducibility are enabled by a scheme that allows users to exactly specify a dataset and trace all alterations over time (e.g., re-calibration). To this end, Oceans 3.0 now implements citable, permanent Digital Object Identifiers attached to a unique version of a data segment (These are described in section Persistent Identifiers and Data Citation).
RESTful Web Services
In general, the Oceans 3.0 API strives to be RESTful, adhering to the REpresentational State Transfer (REST) software architectural style (Fielding, 2000). RESTful web services feature JSON or XML responses that are self-describing and contain information allowing the client to make sense of the response without prior or specialized knowledge. An interrogating user can explore the parameters and methods offered without too much difficulty. The Oceans 3.0 discovery services are a good example of this. Client code can also easily handle various contingencies as the responses are information rich.
Sensor Observation Service
In 2018, following a surge of interest in the Internet of Things (IoT) concepts and technologies, there was a strong motivation to provide Sensor Observation Service (SOS) interfaces for the various scalar instruments on the ONC infrastructure. This resulted in an effort to implement such compliant services with the help of SensorUP, a spinoff from the University of Calgary and advice from groups in Germany (in particular3). The services, including GetCapabilities, DescribeSensor, and GetObservations are still available and supported by Oceans 3.0 (Canarie Research Software, 2018). At the time of this writing, the 28-day availability rate for these services was 99.7%.
Persistent Identifiers and Data Citation
The current trend toward improved transparency and reproducibility in science is pushing researchers and institutions to develop new strategies for managing the data they produce. Increasingly, publishers insist on access to the datasets underpinning submissions (Ferguson et al., 2018), and national funding agencies are establishing policies (ESIP Data Preservation and Stewardship Committee, 2019) requiring the open sharing of data as a condition of awarding grants. These changes are driving the creation of new tools to ensure data are findable, accessible, and reusable and remain so into the future.
Persistent identifiers provide a long-lasting reference to a digital resource, including entities like articles, datasets, individuals and more. Depending on the entity, different types of identifiers, registries, relationships and accompanying metadata are typically used. A citation for the resource should follow established community conventions, including a reference to the persistent identifier.
Ocean Networks Canada has integrated persistent identifiers for datasets and organizations, with plans to expand to other entities in the future. For datasets, ONC is using DataCite Digital Object Identifiers (DOIs). For organizations, ONC is using Research Organization Register (ROR) identifiers. It is anticipated that more identifier systems will be integrated into Oceans 3.0 over time, especially those that are mature (Ferguson et al., 2018) and applicable to ONC.
Dynamic Data Citation
Persistent identifiers are relatively straightforward to create for static objects, such as a published paper or complete dataset. It is more difficult to affix identifiers to dynamic data that change over time, like ONC’s continuously accumulating data streams, as the dataset is constantly evolving. To reliably and reproducibly cite dynamic data requires more detailed information about specific subsets of the data, such as the exact date and time the data were retrieved, and any search parameters used in selecting a particular subset. A new DOI is allocated for new versions of a dataset, along with provenance metadata that describe the reason and extent of the change. Even if preserving all previous versions of all data is beyond any institution’s storage capacity, the landing page will remain available and will indicate relationships to any subsequent versions.
In February 2015, the Research Data Alliance (RDA) Working Group on Dynamic Data Citation released a set of 14 recommendations to guide best practices for persistently and reproducibly identifying these kinds of dataset. The recommendations rest on 3 pillars:
1. Versioning: Major changes to a dataset are marked with a new version number.
2. Timestamping: Queries made to the database are saved along with metadata about exactly when and how they were made.
3. Query Preservation: Persistent Identifiers (PIDs) are assigned not only to the whole dataset, but also to each time-stamped query used to extract a particular data subset from the repository’s database.
Combining these strategies, it becomes possible to refine the parameters of a dataset until they exactly match its state when previously retrieved. New version releases mark changes to the dataset, whether to the data values or the ways in which they were processed. Finally, assigning a persistent identifier to each individual query – an actual data request sent to the database – allows previously accessed subsets to be re-created with ease, eliminating the need to painstakingly replicate complex search parameters by hand. ONC’s solution represents one of the pilot implementations of these RDA guidelines (Rauber et al., 2021).
Data Set Landing Pages
Oceans 3.0 has implemented dataset landing pages, as shown in Supplementary Figure 41, that describe the high-level metadata associated with a dataset. Within this implementation, a dataset is defined as one deployment of one device, e.g., Aanderaa Optode 3830 (S/N 911) deployed at Folger Passage on 11-Sep-2015, recovered 02-May-2017. These dataset landing pages are linked and discoverable through the Oceans 3.0 User Interface.
Research Organization Registry
The Research Organization Registry (ROR) allocates unique, persistent identifiers to research organizations, much like ORCIDs for individual researchers. For example, the ROR ID for ONC is https://ror.org/05gknh003. As of August 2021, over 100,000 ROR IDs have been assigned since the registry launched in January 2019.
Persistent identifiers like ROR IDs ensure that research contributions are correctly attributed, by disambiguating entities which may be known by different names. When used within the scholarly communications and publication ecosystem, ROR IDs improve discovery, tracking, and linking of research outputs across platforms, organizations, and funders. RORs support the trend toward ensuring credit is given to all parties involved in producing research outputs but have been left out of traditional citations, such as funding bodies. When ONC mints a DataCite DOI for a dataset, the attribution metadata is associated with the ROR. In addition, attributions in the ISO 19115 metadata record (within the MD_DataIdentification class) also include the ROR details.
Dataset Citation
For data citations, ONC adheres to the ESIP Data Citation Guidelines for Earth Science Data, Version 2. The Oceans 3.0 Dataset Landing Page provides the specific citation text. For users or machines, Oceans 3.0 has also implemented a citation web service that returns citation text for a given DOI or Query PID, as illustrated in Supplementary Figure 42.
Linked Data and Repositories
Linked data are provided by frameworks for relationships between ONC’s Oceans 3.0 datasets and other repositories or harvesters. The value of these relationships is to enhance discoverability of ONC datasets, as well as to provide enriched contextual metadata and complementary data resources. Elements that facilitate linked data include web services, metadata catalogs, and persistent identifier relationships. While ONC has direct involvement in facilitating some relationships, any harvester can leverage these utilities to incorporate ONC content as long as they adhere to licensing and restrictions.
As contributors to the Canadian Integrated Ocean Observing System (CIOOS), ONC uses a CKAN metadata catalog and ERDDAP system as a means for the CIOOS portal to harvest and provide access to these datasets. Once metadata records are available within CIOOS, they are harvested again by the Federated Research Data Repository (FRDR). Other portals where ONC metadata or data are made available include the Polar Data Catalogue, Listening to the Deep Ocean Environment4 and Northwest Association of Networked Ocean Observing Systems (NANOOS).
In some cases, ONC is involved in data collection that may have all or part of the data archived with a partner institution. For example, some of the seismic instruments deployed on the NEPTUNE observatory have data streams feeding directly into the Incorporated Research Institutions for Seismology (IRIS). The corresponding metadata are provided by ONC, and the IRIS web services are used to retrieve the data from the Oceans 3.0 Data Search. Another example is a partnership with Ocean Tracking Network (OTN), whereby acoustic receiver data from ONC platforms are originally retrieved and archived within Oceans 3.0, but also shared with OTN who maintain the records on detected acoustic tags.
In other cases, ONC harvests data from other repositories where it may add value to ONC services. Examples include using web services to harvest from the Pacific Northwest Seismic Network (PNSN) for integration with ONC’s earthquake detection algorithm, and from the Canadian Coast Guard for vessel tracking applications based on Automatic Information System (AIS) data.
Advanced Features
Event Detection and Reaction
One of the key advantages of a real time sensor network infrastructure is the added ability to monitor, detect and react to predetermined events. Early this century, as the Ocean Networks Canada research infrastructure was envisioned and designed, the ability to include an event detection and reaction feature was part of the requirements. Although some initial ideas and suggestions were mentioned, no specific applications were identified at the outset, pointing to the need for the system to be as open and flexible as possible so that researchers would have the ability to define arbitrary event detection and reaction parameters running against arbitrary combinations of sensors.
This capability has since been implemented and can continuously monitor data streams from multiple sensors, checking whether their values, combined through specific formulas, match or exceed predetermined thresholds. Such a system has to be capable of performing an arbitrary number of such monitoring tasks in parallel for multiple users likely looking for widely varied phenomena.
The first major application of this capability was in support of ONC’s instrument data quality control. Here, individual sensor values are continuously tracked for out-of-bounds values to be flagged. This is relatively straightforward for scalar sensors where, e.g., spike detection can be implemented using Short Term Average versus Long Term Average values to identify outliers. But data quality control can also take different forms: newly arrived short video clips from an underwater camera can be subjected to a quick automated examination to determine whether the video lights failed to illuminate as expected, resulting in black images. The detection of empty/black, out of focus or off-target video can trigger automatic QC flagging.
Beyond the use of the event detection system for data quality monitoring, the Oceans 3.0 event detection and reaction system can be used in real time to seek, identify and flag patterns in data streams. Examples are transient temperature phenomena or the identification of marine mammals. In these instances, advanced techniques extending beyond simple deterministic formulas can be used. In particular, data mining/neural network approaches can be employed for real time detection, identification and reaction to specific data patterns, such as is done in hydrophone data streams to detect marine mammals.
An especially complex case of event detection and reaction implemented in Oceans 3.0 is the simultaneous use of a large, geographically distributed seismic and Global Navigation Satellite System (GNSS) network to detect, characterize and alert for earthquakes within seconds of the first detected trigger. The ONC/Natural Resources Canada Earthquake Early Warning System (EEWS) (Schlesinger et al., 2021) was implemented over the course of 3 years and is undergoing a commissioning phase at the time of this writing. It integrates data from over 35 distinct sites where sensors have been installed (including land-based as well as ocean-bottom locations). A distributed processing architecture that fits the Oceans 3.0 approach (see section “Architecture”) performs site-based parameter extraction and uses a messaging system to deliver those parameters to redundant data centers where detection, characterization and notification are implemented, as illustrated in Figure 13. Once commissioned, this system could provide a lead time of 60 to 90 s for notifying subscribers who implement pre-determined disaster mitigation reactions to impending shaking at their location. During the commissioning phase, a peer review committee was presented with the system description and provided with software details, results, analyses, and continuous improvement/maintenance plans. The committee will meet again at the end of the commissioning phase to provide its final approval. This EEW system will not be used to alert the public but will instead be provided to operators of critical infrastructure in the region who will be in a position to integrate dynamic reaction and alerting into their systems.
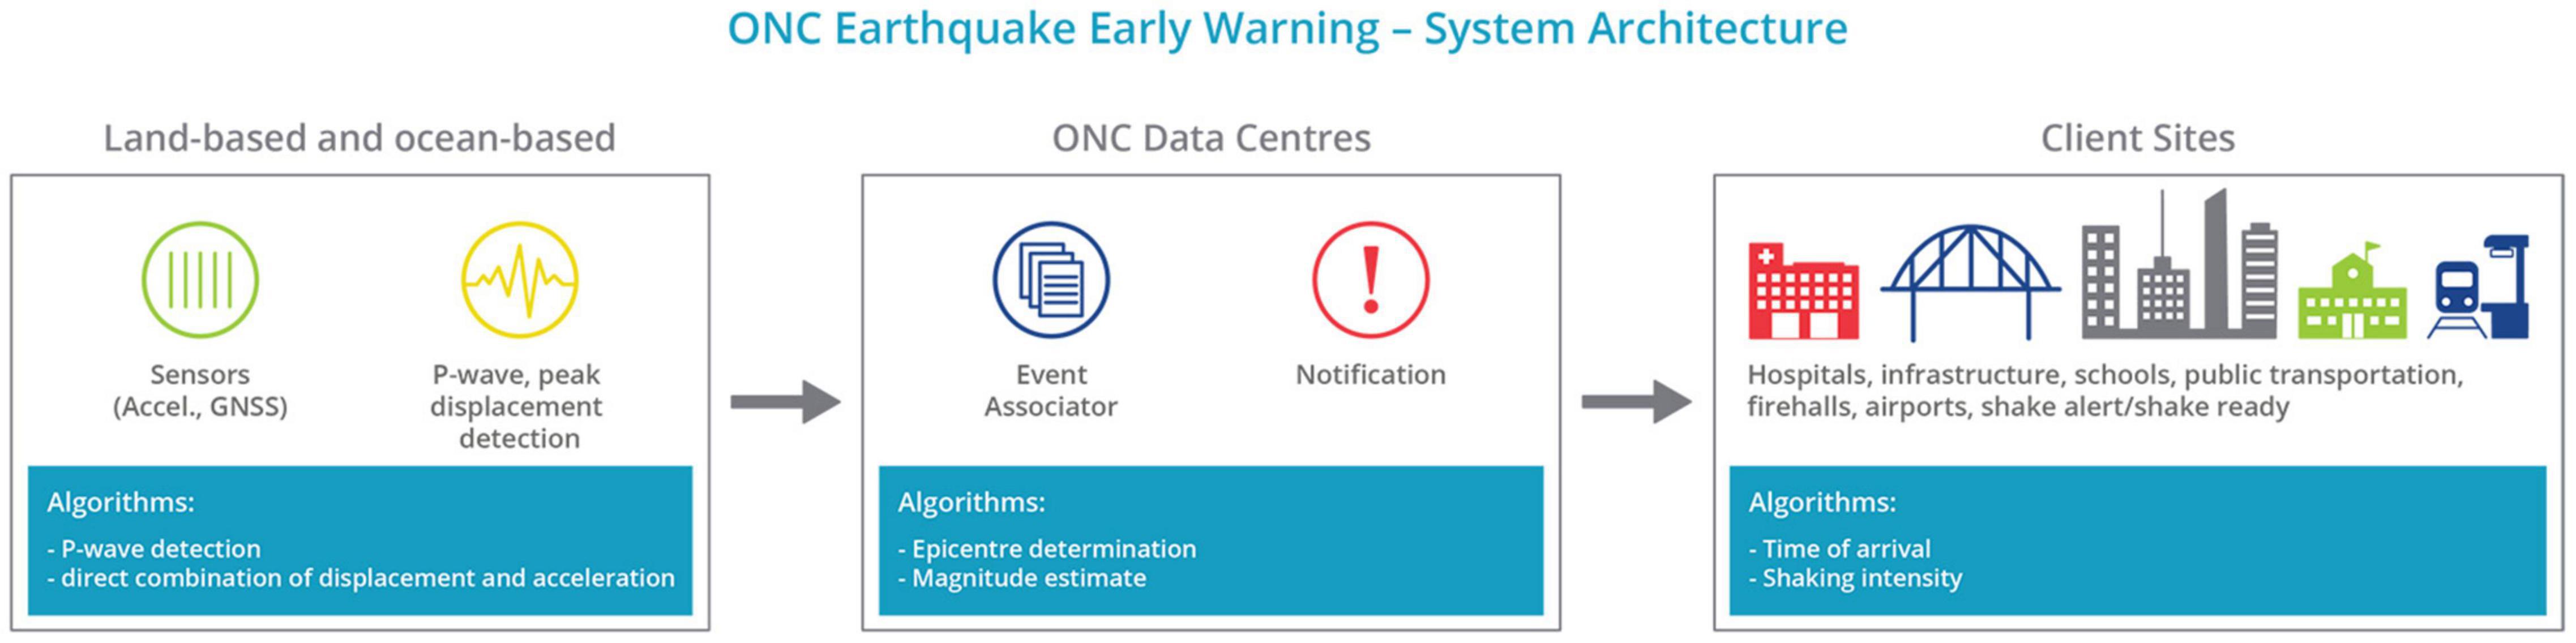
Figure 13. High-level architecture of the ONC/NRCan earthquake early warning system.
Data Mining, Machine Learning and Neural Nets
Generally referred to collectively as Artificial Intelligence, data mining, machine learning and neural network systems all seek to offer efficient means of identifying patterns in large data sets. Such systems perform two main functions, for which they use different techniques: detection and classification. In other words, first find “something” of interest (either pre-defined or simply deviating from the norm) and then attempt to determine what it is (typically based on a predetermined list of feature types or by identifying something that does not conform to any known patterns in the match database).
Data collected from real time ocean observing systems are well suited to the application of such techniques. With thousands of sensors reporting measurements every second, the accumulation of data in time series is substantial and quickly exceeds the capabilities of individuals to analyze, even with highly effective visualization tools. No less than 8 orders of magnitude in time scales (from seconds to decades) are present in the ONC data archive, allowing for the analysis of highly varied phenomena, from the random chaotic motion of water around the sensor to the impacts of climate forcing on the environment.
Additional time scales are involved for high sample rate instruments such as seismometers and hydrophones, which record at sampling rates around 100 kHz, resulting in 13 orders of magnitude in time scales after a few years of data collection. Other types of instruments producing time series of complex matrices present unique challenges as well; an example is a video camera producing no fewer than three large 2-D matrices (in red, green and blue wavelengths) 20+ times per second.
One of the first implementations of new data mining techniques in Oceans 3.0 was through the integration of the PAMGuard passive acoustic monitoring system specifically developed for the detection and identification of marine mammal vocalizations. PAMGuard is an open source system designed to provide a standard software infrastructure for acoustic detection, localization and classification of marine mammals, in order to help prevent and mitigate harm to these animals.
PAMGUARD (see5) has been integrated into Oceans 3.0, allowing users access to ONC’s large library of acoustic data. Users who are familiar with the PAMGUARD software can upload the configuration for detection algorithms created in the PAMGUARD software and use ONC’s library of acoustic data as the data source for detection. At the time of this writing, the system was being used for whale detection at various locations monitored with ONC’s data acquisition infrastructure. Because the PAMGUARD software is run on Oceans 3.0 servers co-located on the same network as the large sets of acoustic data, processing can be much faster than in situations when the user must download the acoustic data for processing.
Transition From Oceans 2.0 to Oceans 3.0
Oceans 2.0 was the cornerstone of Ocean Networks Canada since its inception, enabling the data that are collected to hold enormous value for ONC and end users. The time series is now of sufficient duration to observe decadal and climate-scale changes, while at the same time providing low-latency real time data useful for event-driven decision making such as Earthquake Early Warning. The ability to analyze data in the archive quickly and efficiently will help unlock new scientific discoveries.
The ability to have incoming data reviewed for quality by automatic processes and human experts ensures that the archive is fully qualified and supports a data collection process with minimal gaps. Efforts will continue to improve the autonomous characterization of data streams as they arrive onshore, thereby providing new metadata that describe the observations received from the instruments both in terms of their content and trustworthiness.
As ONC entered its 16th year of operations, Oceans 2.0 was growing beyond its original scope. The original user interfaces were expected to support three networks and eight seafloor nodes. Now, the archive includes data from an ever-proliferating list of locations. In the future, a new data discovery portal will be developed to integrate the existing apps, enabling users to find, preview and interact with the data much more easily. User interfaces will be updated to use the new Dashboards infrastructure, incorporating modern sharing and embedding features.
As the data volume continues to expand, outstripping users’ ability to download and work on data within their own hardware, data summation and enrichment facilities are becoming increasingly necessary. How data are managed, shared and published is also changing. Publications now require the code and data to be accessible, facilitating the reproducibility of science. Support for persistent identifiers on data has been added recently, while persistent identifiers for code should be added (and extended to physical samples). Internal improvements necessary to support all of the above include geospatial data integration, distributed caching, code modularization, continuous integration processes and expanded automated testing.
Many of the proposed additions and improvements align with web 3.0 concepts (Rudman and Bruwer, 2016). As such, ONC renamed Oceans 2.0 as Oceans 3.0. Oceans 3.0 high level features will include cloud-based interactivity using distributed computing resources, and adding value to the data with artificial intelligence, which will augment and target user contributions and improve data-driven decision making. More specifically, this means better viewing, improved usability/accessibility to the data, improved searching, and more refined data products. Additionally, this entails data summation and event detection and classification by machine learning, plus expanded annotations. Furthermore, ONC is working toward improved functionality of the sandbox, including an expanded public API. After 16 years of operation, Oceans 3.0 will continue to grow through innovation, enabling ocean science and discovery.
Data Availability Statement
The datasets encompassed in this article are available in Ocean Network Canada’s online data repository (http://doi.org/10.17616/R3RW43), which can be accessed via: https://data.oceannetworks.ca/home.
Ethics Statement
Written informed consent was obtained from the individual(s) for the publication of any potentially identifiable images or data included in this article.
Author Contributions
DO provided overall project coordination and drafted many sections of the manuscript. DA, BB, YC, PC, RJ, SK, TL, MM, MP, and MT contributed content and/or participated in reviews and edits. BB, DO, MS, RJ, and BP reviewed the article and provided final edits. DO, JM, and KO produced final figures. All authors contributed to the article and approved the submitted version.
Funding
The development of Oceans 2.0/3.0 has been generously supported through funding by the Canada Foundation for Innovation, the Government of Canada, the Government of British Columbia, and the University of Victoria.
Conflict of Interest
The authors declare that the research was conducted in the absence of any commercial or financial relationships that could be construed as a potential conflict of interest.
Publisher’s Note
All claims expressed in this article are solely those of the authors and do not necessarily represent those of their affiliated organizations, or those of the publisher, the editors and the reviewers. Any product that may be evaluated in this article, or claim that may be made by its manufacturer, is not guaranteed or endorsed by the publisher.
Acknowledgments
Ocean Networks Canada acknowledges with respect the ləḱwəηən peoples on whose traditional territory the ONC headquarters and Marine Technology Centre stand, and the Songhees, Esquimalt and W̱SÁNEĆ peoples whose historical relationships with the land and the ocean continue to this day. The 18 + year development of Oceans 2.0/3.0 has been an intensive labor of love, advanced by guidance and contributions from many past employes of Ocean Networks Canada and its precursor initiatives, VENUS (Victoria Experimental Network Under the Sea) and NEPTUNE (North-East Pacific Time-series Undersea Networked Experiments). Chief among these are Verena Tunnicliffe, who led the VENUS Project from its inception, Chris Barnes, first director of NEPTUNE, and Martin Taylor, Ocean Networks Canada’s founding CEO. Oceans 2.0/3.0 would also never have come into existence without the vision and tireless contributions of Eric Guillemot, who led the Software Engineering team through more than 15 years of invention and development. Many talented professionals contributed: Christine Adams, Omid Aghaei, Nick Allen, Phillip Au, Greg Baillie, Kevin Bartlett, Darren Bidulock, Tim Boesenkool, Ray Bon, Italo Borrelli, Cassandra Bosma, Mac Button, Jonathan Cheng, Tim Choo, Bob Crosby, Becky Croteau, Melissa Cuthill, Karen Douglas, Dmytro Draga, Derrick Evans, Eli Ferguson, Kyle Gering, Austin Henry, Martin Hofmann, Nick Houghton, Emil Jafarli, Marlene Jeffries, Bahareh Karmand, Eric Kolb, Nadia Kreimer, Josef Krentz, Murray Leslie, Helen He, Nathan Hogman, Ryan Hotte, Helena Jeeves, Alex Lam, Tony Lin, Johanna MacLeod, Conner McConkey, Kristen Meyer, Kiersten Mort, Sean Mullan, Kyle Newman, Kai Ong, George Parker, Susan Perkins, Daisy Qi, Yigal Rachman, Mark Rankin, Kalpana Rawat, Allan Rempel, Chantel Riudsdale, Casey Robb, Damian Rohraff, Cassandra Rosa, Ryan Ross, Jason Rush, Saurav Sahu, Angela Schlesinger, Ron Schouten, Adrienne Schumlich, Harry Singh, Nic Scott, Bernadette Simas, Jack Staples, Josh Stelting, Karen Tang, Tianming Wei, Ross Timmerman, Sean Tippett, Meghan Tomlin, Stephen Tredger, Mitozcelle Valenzuela, Jacklyn Vervynck, Seann Wagner, Mitchell Wolf, Yingsong Zheng and many interns, short-term employes and co-op students along the way. Finally, the authors wish to thank the reviewers, LF and MV, and editors whose comments and suggestions helped improve this article.
Supplementary Material
The Supplementary Material for this article can be found online at: https://www.frontiersin.org/articles/10.3389/fmars.2022.806452/full#supplementary-material
Footnotes
- ^ https://www.wowza.com/products/streaming-engine
- ^ https://wiki.oceannetworks.ca/display/O2A/Oceans+2.0+API+Home
- ^ 52North.org
- ^ http://listentothedeep.com/
- ^ pamguard.org
References
Canarie Research Software (2018). User-Defined Oceanographic Data Products. Available Online at: https://science.canarie.ca/researchsoftware/researchresource/main.html?resourceID=109 (accessed October 28, 2021).
Carroll, S. R., Garba, I., Figueroa-Rodríguez, O. L., Holbrook, J., Lovett, R., Materechera, S., et al. (2020). The CARE principles for indigenous data governance. Data Sci. J. 19:43.
Creative Commons (2021). About the Licences. Available Online at: https://creativecommons.org/licenses/ (accessed October 26, 2021).
ESIP Data Preservation and Stewardship Committee (2019). Data Citation Guidelines for Earth Science Data Ver. 2 (2019). ESIP Data Preservation and Stewardship Committee. Earth Science Information Partners. Available Online at: https://doi.org/10.6084/m9.figshare.8441816 (accessed February 8, 2022).
Ferguson, C., McEntrye, J., Bunakov, B., Lambert, S., Kotarski, R., Stewart, S., et al. (2018). D3.1 Survey of Current PID Services Landscape. Available Online at: https://doi.org/10.5281/zenodo.1324296 (accessed July 17, 2018).
Fielding, R. T. (2000). Architectural Styles and the Design of Network-based Software Architectures. Doctoral dissertation. Irvine: University of California.
Google (2021). Matlabcontrol Java API to Interact with MATLAB. Available Online at: https://code.google.com/archive/p/matlabcontrol/ (accessed 26 Oct 2021).
International Standards Organization (2014). Geographic information — Metadata (ISO Standard No. 19115-1:2014. Geneva: International Standards Organization
Jenkyns, R., Tomlin, M., and Pirenne, B. (2013). “Instrument task-driven workflow software for cruise and maintenance operations,” in Oceans – San Diego, 2013, (San Diego, CA: IEEE), 1–4. doi: 10.23919/OCEANS.2013.6741251
Klump, J., Wyborn, L., Wu, M., Martin, J., Downs, R. R., and Asmi, A. (2021). Versioning data is about more than revisions: a conceptual framework and proposed principles. Data Science J. 20:12.
Lin, D., Crabtree, J., Dillo, I., Downs, R. R., Edmunds, R., and Giaretta, D. (2020). The TRUST principles for digital repositories. Sci. Data 7:144.
Matabos, M., Hoeberechts, M., Doya, C., Aguzzi, J., Nephin, J., Reimchen, T. E., et al. (2017). Expert, crowd, students or algorithm: who holds the key to deep-sea imagery ‘big data’ processing? Methods Ecol. Evolut. 8, 996–1004. doi: 10.1111/2041-210X.12746
National Oceanography Centre (2021). NERC Vocabulary Server. Available Online at: https://www.bodc.ac.uk/resources/products/web_services/vocab/ (accessed October 26, 2021).
ONC Data Products Wiki (n.d.). Retrieved January 5, 2022, from Available Online at: https://wiki.oceannetworks.ca/display/DP/Data+Products+Home (accessed Janauary 5, 2022).
Pirenne, B., Benvenuti, P., Albrecht, R., and Rasmussen, B. F. (1993). “Lessons learned in setting up and running the European copy of HST archive,” in Proceedings of the SPIE 1945, Space Astronomical Telescopes and Instruments II, eds P. Y. Bely and J. B. Breckinridge (Bellingham, DC: SPIE).
Rauber, A., Asmi, A., van Uytvanck, D., and Proell, S. (2015). Data Citation of Evolving Data: Recommendations of the Working Group on Data Citation (WGDC). Available Online at: https://doi.org/10.15497/RDA00016 (accessed February 8, 2022).
Rauber, A. Gößwein, B. Zwölf, C. M., Schubert, C. Wörister, F., Duncan, J., et al. (2021). Precisely and persistently identifying and citing arbitrary subsets of dynamic data. Harvard Data Sc. Rev. 3. doi: 10.1162/99608f92.be565013
Rose, M., and McCloghrie, K. (1990). Structure and Identification of Management Information for TCP/IP-Based Internets. Available online at: https://datatracker.ietf.org/doc/rfc1155/
Rudman, R., and Bruwer, R. (2016). Defining Web 3.0: opportunities and challenges. Electronic Library 34, 132–154. doi: 10.1108/el-08-2014-0140
Schlesinger, A., Kukovica, J., Rosenberger, A., Heesemann, M., Pirenne, B., Robinson, J., et al. (2021). An earthquake early warning system for Southwestern British Columbia. Front. Earth Sci. 9:657.
Sensitive Data Expert Group (n.d.). Available online at: January 5, 2022, from https://portagenetwork.ca/network-of-experts/sensitive-data-expert-group/ (accessed January 5, 2022).
The First Nations Information Governance Centre (2014). Ownership, Control, Access and Possession (OCAPTM): the Path to First Nations Information Governance. Ottawa: The First Nations Information Governance Centre
Wilkinson, M., Dumontier, M., Aalbersberg, I., Appleton, G., Axton, M., and Baak, A. (2016). The FAIR guiding Principles for scientific data management and stewardship. Sci. Data 3:160018.
Wong, A., Keeley, R., Carval, T., and Argo Data Management Team (2021). Argo Quality Control Manual for CTD and Trajectory Data. Available Online at: https://doi.org/10.13155/33951 (accessed May 11, 2021).
Wowza Streaming Engine (2022). Available Online at: https://www.wowza.com/products/streaming-engine (accessed January 6, 2022).
Keywords: data management, data archival, quality assurance and quality control, data processing and analysis, metadata, persistent identifiers, data citation, data products
Citation: Owens D, Abeysirigunawardena D, Biffard B, Chen Y, Conley P, Jenkyns R, Kerschtien S, Lavallee T, MacArthur M, Mousseau J, Old K, Paulson M, Pirenne B, Scherwath M and Thorne M (2022) The Oceans 2.0/3.0 Data Management and Archival System. Front. Mar. Sci. 9:806452. doi: 10.3389/fmars.2022.806452
Received: 31 October 2021; Accepted: 28 January 2022;
Published: 08 March 2022.
Edited by:
Juan José Dañobeitia, ERIC Foundation, ItalyReviewed by:
Michael F. Vardaro, University of Washington, United StatesLucia Fanini, Hellenic Center for Marine Research, Greece
Copyright © 2022 Owens, Abeysirigunawardena, Biffard, Chen, Conley, Jenkyns, Kerschtien, Lavallee, MacArthur, Mousseau, Old, Paulson, Pirenne, Scherwath and Thorne. This is an open-access article distributed under the terms of the Creative Commons Attribution License (CC BY). The use, distribution or reproduction in other forums is permitted, provided the original author(s) and the copyright owner(s) are credited and that the original publication in this journal is cited, in accordance with accepted academic practice. No use, distribution or reproduction is permitted which does not comply with these terms.
*Correspondence: Dwight Owens, ZHdvd2Vuc0B1dmljLmNh