 Elsa B. Girard1,2*
 Anouk Langerak1
 Jamaluddin Jompa3
 Owen S. Wangensteen4
 Jan-Niklas Macher1
 Willem Renema1,2
- 1Naturalis Biodiversity Center, Leiden, Netherlands
- 2IBED, University of Amsterdam, Amsterdam, Netherlands
- 3Marine Science Department, Faculty of Marine Science and Fisheries, Hasanuddin University, Makassar, Indonesia
- 4Norwegian College of Fishery Science, UiT - The Arctic University of Norway, Tromsø, Norway
Traditional morphological methods for species identification are highly time consuming, especially for small organisms, such as Foraminifera, a group of shell-building microbial eukaryotes. To analyze large amounts of samples more efficiently, species identification methods have extended to molecular tools in the last few decades. Although a wide range of phyla have good markers available, for Foraminifera only one hypervariable marker from the ribosomal region (18S) is widely used. Recently a new mitochondrial marker cytochrome oxidase subunit 1 (COI) has been sequenced. Here we investigate whether this marker has a higher potential for species identification compared to the ribosomal marker. We explore the genetic variability of both the 18S and COI markers in 22 benthic foraminiferal morphospecies (orders Miliolida and Rotaliida). Using single-cell DNA, the genetic variability within specimens (intra) and between specimens (inter) of each species was assessed using next-generation sequencing. Amplification success rate was twice as high for COI (151/200 specimens) than for 18S (73/200 specimens). The COI marker showed greatly decreased intra- and inter-specimen variability compared to 18S in six out of seven selected species. The 18S phylogenetic reconstruction fails to adequately cluster multiple species together in contrast to COI. Additionally, the COI marker helped recognize misclassified specimens difficult to morphologically identify to the species level. Integrative taxonomy, combining morphological and molecular characteristics, provides a robust picture of the foraminiferal species diversity. Finally, we suggest the use of a set of sequences (two or more) to describe species showing intra-genomic variability additionally to using multiple markers. Our findings highlight the potential of the newly discovered mitochondrial marker for molecular species identification and metabarcoding purposes.
Introduction
The development of new molecular methods to identify and delimit species as well as to assess community composition, species richness in biodiversity and ecology studies has greatly accelerated in recent years (Hebert et al., 2003; Amaral-Zettler et al., 2009; Pawlowski et al., 2016; Wangensteen and Turon, 2017; van der Loos and Nijland, 2021). Metabarcoding methods based on high-throughput sequencing enable the identification of a wide range for organisms, especially using mitochondrial markers (Wangensteen and Turon, 2017). Most phyla in different Kingdoms have well defined markers such as the mitochondrial cytochrome oxidase subunit 1 (COI), but this gene has only recently been identified in Foraminifera (Macher et al., 2021b).
Foraminifera are unicellular protists living in aquatic environments, mostly known from marine ecosystems. Additionally to being important carbonate producers, these small organisms are good proxies, for (paleo)climatic changes (Billups and Schrag, 2003; Pawłowska et al., 2020), biochronology (Capotondi et al., 1999; Ueno et al., 2019) and coral reef ecosystem health (Hallock et al., 2003; Oliver et al., 2014; Girard et al., 2022). However, little is known at the whole genome level of Foraminifera. Molecular markers from the ribosomal small-subunit (18S SSU rRNA) and internal transcribed spacer (ITS) regions of the genome have been used to identify known foraminiferal morphospecies and cryptic species (Pawlowski et al., 1994; Morard et al., 2015; Borrelli et al., 2018; Macher et al., 2021a). Nonetheless, some Foraminifera are known to show high levels of genomic polymorphism (Morard et al., 2015), potentially due to the presence of several nuclei per cell (Weber and Pawlowski, 2014). Other taxa show too little variability between species, for example only one single nucleotide polymorphism (SNP) was reported between two Amphisorus species in the ITS gene (Macher et al., 2021a). This makes species identification based on 18S rRNA and ITS markers challenging (Morard et al., 2016; Macher et al., 2021a).
Established molecular barcoding methods commonly use a single marker to characterize species (Hebert et al., 2003). Shorter markers (fragment length < 600 bp) have been proven sufficient to differentiate between species in a wide range of organisms (Meusnier et al., 2008; Leray et al., 2013; Yeo et al., 2020). Many studies also show the importance of combining different markers to get a robust species identification and to better understand evolutionary traits and relationships within and between species (Purty and Chatterjee, 2016; Zhao et al., 2016). Macher et al. (2021b) recently discovered the first mitochondrial COI gene in Foraminifera. COI is a molecular marker commonly used in molecular research on animals (Hebert et al., 2003) and has been shown to be informative on other protists (Nassonova et al., 2010; Pawlowski et al., 2012; Burki et al., 2021). There are many advantages of using a coding region such as COI in addition to a non-coding region such as 18S. This includes less variability in total length, and the use of entropy-ratio metrics based on the variability per codon position (Antich et al., 2021), or the detection of stop codons, to help in distinguishing functional sequences from non-functional pseudogenes and sequencing errors (Andújar et al., 2021).
Here we evaluate the effectiveness of the COI marker for species identification and delimitation of Foraminifera by metabarcoding and compare it with the commonly used nuclear 18S marker. We explore the genetic variability of the 18S and COI markers in 22 large benthic foraminiferal morphospecies from the orders Rotaliida and Miliolida. Using foraminiferal single-cell DNA metabarcoding, we assessed the genetic variability within specimens (intra) and between specimens (inter) of a same species using amplicon sequence variants (ASVs).
Materials and Methods
Sampling and Sample Preparation
Samples were collected on the reef flat, the reef slope, and at the reef base from nine islands in the Spermonde Archipelago (Southwest Sulawesi, Indonesia) (Supplementary Table 1). The sampling took place between April 23rd and May 8th 2018. A subset of the samples was preserved in 96% ethanol and transported back to the Naturalis Biodiversity Center (NBC), Netherlands. The ethanol-preserved specimens were stored at −20°C at NBC until DNA extraction. One additional sample was taken from the Indo-Pacific coral reef aquarium in Burger’s Zoo in Arnhem (Netherlands) on March 18th 2021 (Supplementary Table 1). Foraminifera from this sample were kept alive in a 9-L aquarium in the NBC laboratory until DNA extraction. Before DNA extraction, all specimens were separated in individual eppendorf 1.5 mL tubes. The specimens were classified to morphospecies level based on the description from Renema (2018) and Macher et al. (2021a), photographed and cleaned in 70% ethanol with a brush and a needle to remove as much non-foraminiferal material as possible using a stereomicroscope. In total, we selected 200 foraminiferal specimens from two orders (Miliolida and Rotaliida), six families (Alveolinidae, Amphisteginidae, Calcarinidae, Peneroplidae and Soritidae) and 22 morphospecies (Alveolinella quoyi, Amphisorus SpL, A. SpS, Amphistegina lessonii, A. papillosa, A. radiata, Borelis schlumbergeri, Calcarina sp1, C. hispida, Heterostegina depressa, Marginopora vertebralis, Neorotalia calcar, N. gaimardi, Nummulites venosus, Operculina ammonoides, O. complanata, O. LKI27 type, Operculinella cumingii, Parasorites sp., Peneroplis planatus and Sorites sp.).
DNA Extraction and Amplification
Destructive and non-destructive DNA extraction methods were performed on the selected foraminiferal specimens (see Supplementary Table 1). After crushing 117 specimens using either tweezers or a mortar and pestle (destructive), we performed single-cell DNA extractions using the QIAamp DNA Micro Kit Tissue (QIAGEN, Hilden, Germany). To preserve morphological features of an additional 83 specimens (non-destructive), we performed the guanidinium isothiocyanate (GITC*) extraction method as in Weiner et al. (2016). DNA was eluted with 50 μL of Milli-Q water. Aliquots of DNA templates were further diluted 10 times before amplification.
Amplifications of targeted COI (Leray region) and 18S (37-41f fragment of the V4 region) markers were performed with foraminiferal specific primers (Table 1). The primers were complemented with a Nextera XT tail (Illumina, Inc.) in order to label each sample with a unique barcode. Amplifications were performed by polymerase-chain reaction (PCR) using a T100 Thermal Cycler (Bio-Rad, Hercules, CA, United States). For amplification of the 18S marker, two different reactions (i.e., TaqMan Environmental Master Mix 2.0 and KAPA HiFi HotStart ReadyMix) and their associated PCR program were tested to maximize amplification success. The reactions go as follows: 5 μL of diluted 10x DNA template was mixed to 3 μL Milli-Q water, 10 μL TaqMan Environmental Master Mix 2.0 (Thermo Fisher Scientific, Waltham, MA, United States) or KAPA HiFi HotStart ReadyMix (Roche, Basel, Switzerland), 1 μL forward primer 10 μM and 1 μL reversed primer 10 μM for a total volume of 20 μL. The PCR1 program for the Environmental Master Mix was 10 min at 95°C, followed by 35 cycles of 15 s at 95°C, 30 s at 50°C, 40 s at 72°C, followed by 5 min at 72°C. The program for KAPA Mix was 10 min at 95°C, followed by 35 cycles of 45 s at 95°C, 60 s at 57°C, 90 s at 72°C, followed by 5 min at 72°C. See Supplementary Table 1 on which amplification method was used for each specimen.
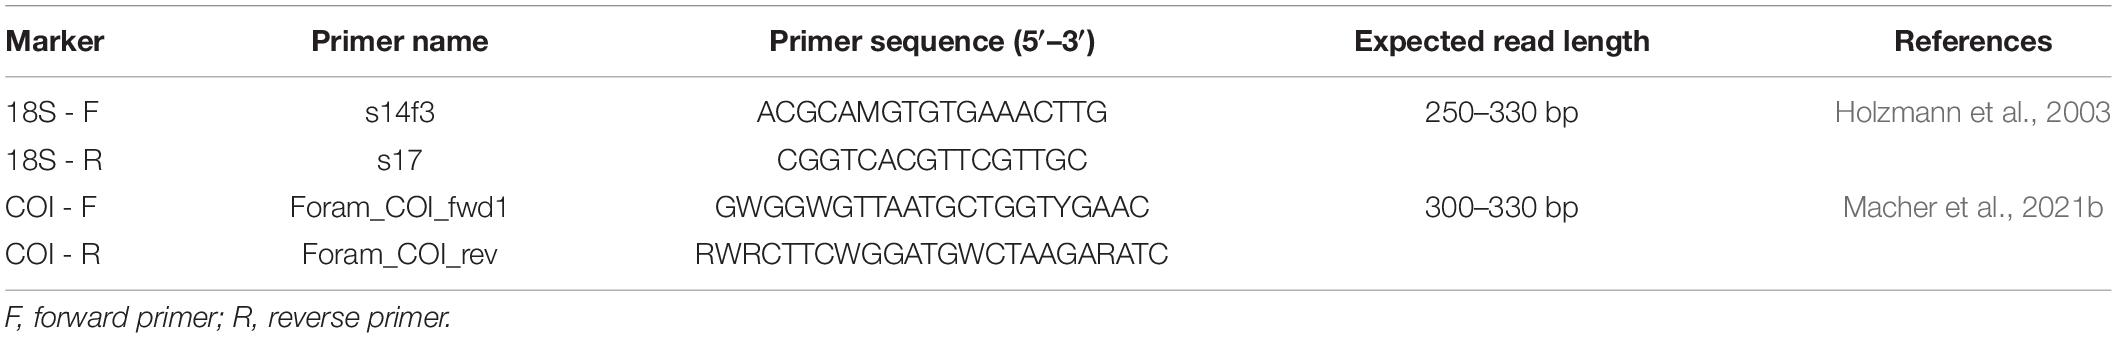
Table 1. Primer sets used for amplification of the targeted DNA regions COI and 18S.
For amplification of the COI marker, the protocol was improved from Macher et al. (2021b). 2.5 μL of diluted 10x DNA template was mixed to 11.7 μL Milli-Q water, 2 μL PCR buffer CL 10X (Qiagen), 0.4 μL MgCl2 25 mM, 0.8 μL BSA 10 mg/mL, 0.4 μL dNTP 25 mM, 0.2 μL Taq-polymerase (Qiagen) 5 U/μL, 1 μL forward primer 10 μM and 1 μL reverse primer 10 μM for a total volume of 20 μL. The PCR1 program was 3 min at 96°C, followed by 40 cycles of 15 s at 96°C, 30 s at 50°C, 40 s at 72°C, followed by 5 min at 72°C. A blank was performed with Milli-Q water instead of DNA template for each PCR run to check for potential (cross-)contamination. The quality of the amplification and DNA fragment size were confirmed on an agarose gel electrophoresis [1% agarose in 0.5x TBE buffer with 0.1% SyBr safe DNA gel stain and 1KB plus ladder (Invitrogen, Carlsbad, CA, United States)].
Library Preparation and Sequencing
DNA fragments of successfully amplified specimens were cleaned with NucleoMag NGS-Beads (bead volume at 0.9 times the total volume of the sample, Macherey Nagel, Düren, Germany) using the VP 407AM-N 96 Pin Magnetic Bead Extractor stamp (V&P Scientific, San Diego, CA, United States). Hereafter, the samples were labeled with the MiSeq Nextera XT DNA library preparation kit (Illumina, San Diego, CA, United States). For 18S, 3 μL of cleaned DNA product was mixed to 5 μL Milli-Q water, 10 μL Environmental or KAPA Master Mix, 1 μL NXT_S label and 1 μL NXT_N label for a total volume of 20 μL. The PCR2 program for the Environmental Master Mix was 10 min at 95°C, followed by 8 cycles of 30 s at 95°C, 1 min at 55°C, 30 s at 72°C, followed by 7 min at 72°C. The program for KAPA Mix was 3 min at 95°C, followed by 8 cycles of 20 s at 98°C, 30 s at 55°C, 30 s at 72°C, followed by 5 min at 72°C. For COI, the same reaction was used as for the first amplification, using specific NXT_S and NXT_N labeled primers. The PCR2 program was 3 min at 96°C, followed by 8 cycles of 15 s at 96°C, 30 s at 55°C, 40 s at 72°C, followed by 5 min at 72°C. A blank was performed with Milli-Q water instead of DNA template for each PCR run to check for (cross-)contamination. All blanks were negative. The samples were analyzed with the Agilent 5300 Fragment analyzer with the DNF-910-33 dsDNA Reagent Kit (35–1,500 bp) protocol (Agilent Technologies, Santa Clara, CA, United States) to confirm successful labeling of the DNA fragments. Separately for both markers, the samples were pooled together with QIAgility (Qiagen, Hilden, Germany). The end-pools were cleaned afterward with NucleoMag NGS-Beads, eluted in Milli-Q and DNA concentration measured using Tapestation 4150 (Kit HSD 5000, Agilent Technologies, Santa Clara, CA, United States). The sequencing was performed in two runs (one for each marker) on an Illumina MiSeq V3 PE300 platform (pair-end sequencing 2 × 300 bp) at BaseClear B.V. (Leiden, Netherlands).
Data Quality Filtering
Raw reads from the sequencing runs were merged using FLASH algorithm (settings minimum overlap = 50, maximum overlap = 300, mismatch ratio = 0.2) (Magoè and Salzberg, 2011). The primers were trimmed with cutadapt (minimum bases that need to match = 10, maximum allowed error rate = 0.2, minimum read length = 10) (Martin, 2011). Sequences that have base pairs with a quality score below 30 were filtered out in Usearch (function -fastq_truncqual 30) (Edgar and Flyvbjerg, 2015). We retained sequences within a specific fragment size range depending on the marker used (COI sequences = 300–330 bp, 18S sequences = 250–330 bp) using PRINSEQ (Schmieder and Edwards, 2011). The wide range allowed for 18S is the result of different mean fragment lengths between foraminiferal species. The denoising method UNOISE (settings alpha = 4.0, minimum abundance before clustering = 8) was used to cluster sequences into amplicon sequence variants (ASVs) (Edgar, 2016). From these clusters, an ASV table was produced. ASVs can be interpreted as gene copies present in a specimen. Samples for which less than 10% of the original (raw) reads were retained after bioinformatic processing and which did not exceed 1,000 reads in total were not further analyzed.
The ASV table was carefully screened and controlled in R (R Core Team, 2020). ASVs with a read count below 1.5% of the total sample read count were set to zero to reduce bias due to possible low-key cross-contamination and barcode switching during sequencing. This threshold was selected based on rarefaction curves (see method in section “Data Analysis”) (Supplementary Figure 1). ASVs that were at least present in two specimens of a genus (to account for blurry boundaries between morphospecies) were retained for the analysis in order to assess intra- and inter-specimen genetic variability. Additionally, ASVs that were present in only one specimen were retained (for intra-specimen variation analysis). ASVs from species with two or less specimens were also retained.
Data Analysis
To evaluate which threshold the ASVs should be filtered to, rarefaction curves were calculated with the vegan R package [function rarecurve()] (Oksanen et al., 2007). Sequence analysis was performed in Geneious Prime 2019.2.31. Sequences for each marker were aligned with the MAFFT v7.450 algorithm using default settings in Geneious (Katoh and Standley, 2013). Sequences that did not align properly [i.e., created important gap regions (>10 bp)] and did not give any BLAST2 results somewhat similar to the phylum Insecta, which is a common blast result for Foraminifera COI due to a lack of foraminiferal COI sequences in the reference database (Macher et al., 2021b), were removed from the analysis. Here, such sequences are referred to as “flagged” sequences. Gaps were masked from the alignment at a 50% threshold in Geneious. COI and 18S tree constructions were calculated in IQ-Tree (Trifinopoulos et al., 2016) using default settings with 1,000 iterations for bootstrap support. The trees were midpoint rooted and formatted in R. Additionally, species delimitation by automatic partitioning (ASAP3) (Puillandre et al., 2021) was performed to analyze whether the different ASVs clusters align with described morphospecies [settings: Kimura K80 (ts/tv = 2.0)]. ASAP was performed separately for the order Rotaliida and Miliolida, because the algorithm does not accurately delimit species in datasets with sequence clusters that are highly divergent, following Yule speciation model (Puillandre et al., 2021). From the ASAP clustering results, we applied Morard’s integrative molecular taxonomic system to screen for cryptic species in our dataset (Morard et al., 2016). In short, Morard’s system uses molecular operational taxonomic units (MOTUs) at three different levels by filtering for genetic gaps within species. From the morphospecies level, MOTUs level-1 were identified from a deep molecular gap (known as the “barcoding gap”), MOTUs level-2 identified from a shallow molecular gap and MOTUs level-3 represented by ASVs (the tips of the tree). To apply Morard’s system, we assume that specimens from the same morphospecies that share at least one ASV are considered to be the same MOTU level-2, even if they show different intra-specimen variability.
Additional comparative analyses were performed on taxa for which at least five specimens per analyzed marker were available. Barcoding gap analysis was performed using patristic distances (sum of branch length between two nodes in a tree) matrix calculated from a FastTree with default settings in Geneious (Fourment and Gibbs, 2006). Technical replicates from the same specimens and the same sequences were not compared, to avoid the bias toward low patristic distances. Because patristic distances form a bimodal distribution, two statistical tests that do not assume normal distribution of the data were performed. Levene’s test (Fox and Weisberg, 2018) and Fligner-Killeen test (Conover et al., 1981) for homogeneity of variances were used to assess whether the genetic variability between both markers is significantly different. These tests were computed in R using the “car” package [functions leveneTest() and fligner.test()] (Fox and Weisberg, 2018). The ASV table, aligned sequences and related R codes are available on GitHub (https://github.com/EBGirard/ForamCOIvs18S).
Results
To assess intra- and inter-specimen genetic variability of the 18S and COI genes in Foraminifera, 200 specimens from the Spermonde Archipelago (Indonesia) and Burger’s Zoo (Netherlands) representing two orders, six families, 13 genera and 22 species were analyzed by single-cell metabarcoding (Figure 1). For a more in-depth comparison between the two markers, all species (n = 7) with at least five specimens successfully sequenced per marker were selected: four from the order Miliolida (Amphisorus SpL, Amphisorus SpS, Marginopora vertebralis, Parasorites sp.) and three from the order Rotaliida (Amphistegina radiata, Nummulites venosus, Operculina ammonoides). Results from the data treatment and quality filtering, more specifically the number of reads and sample analyzed, are found in Table 2.
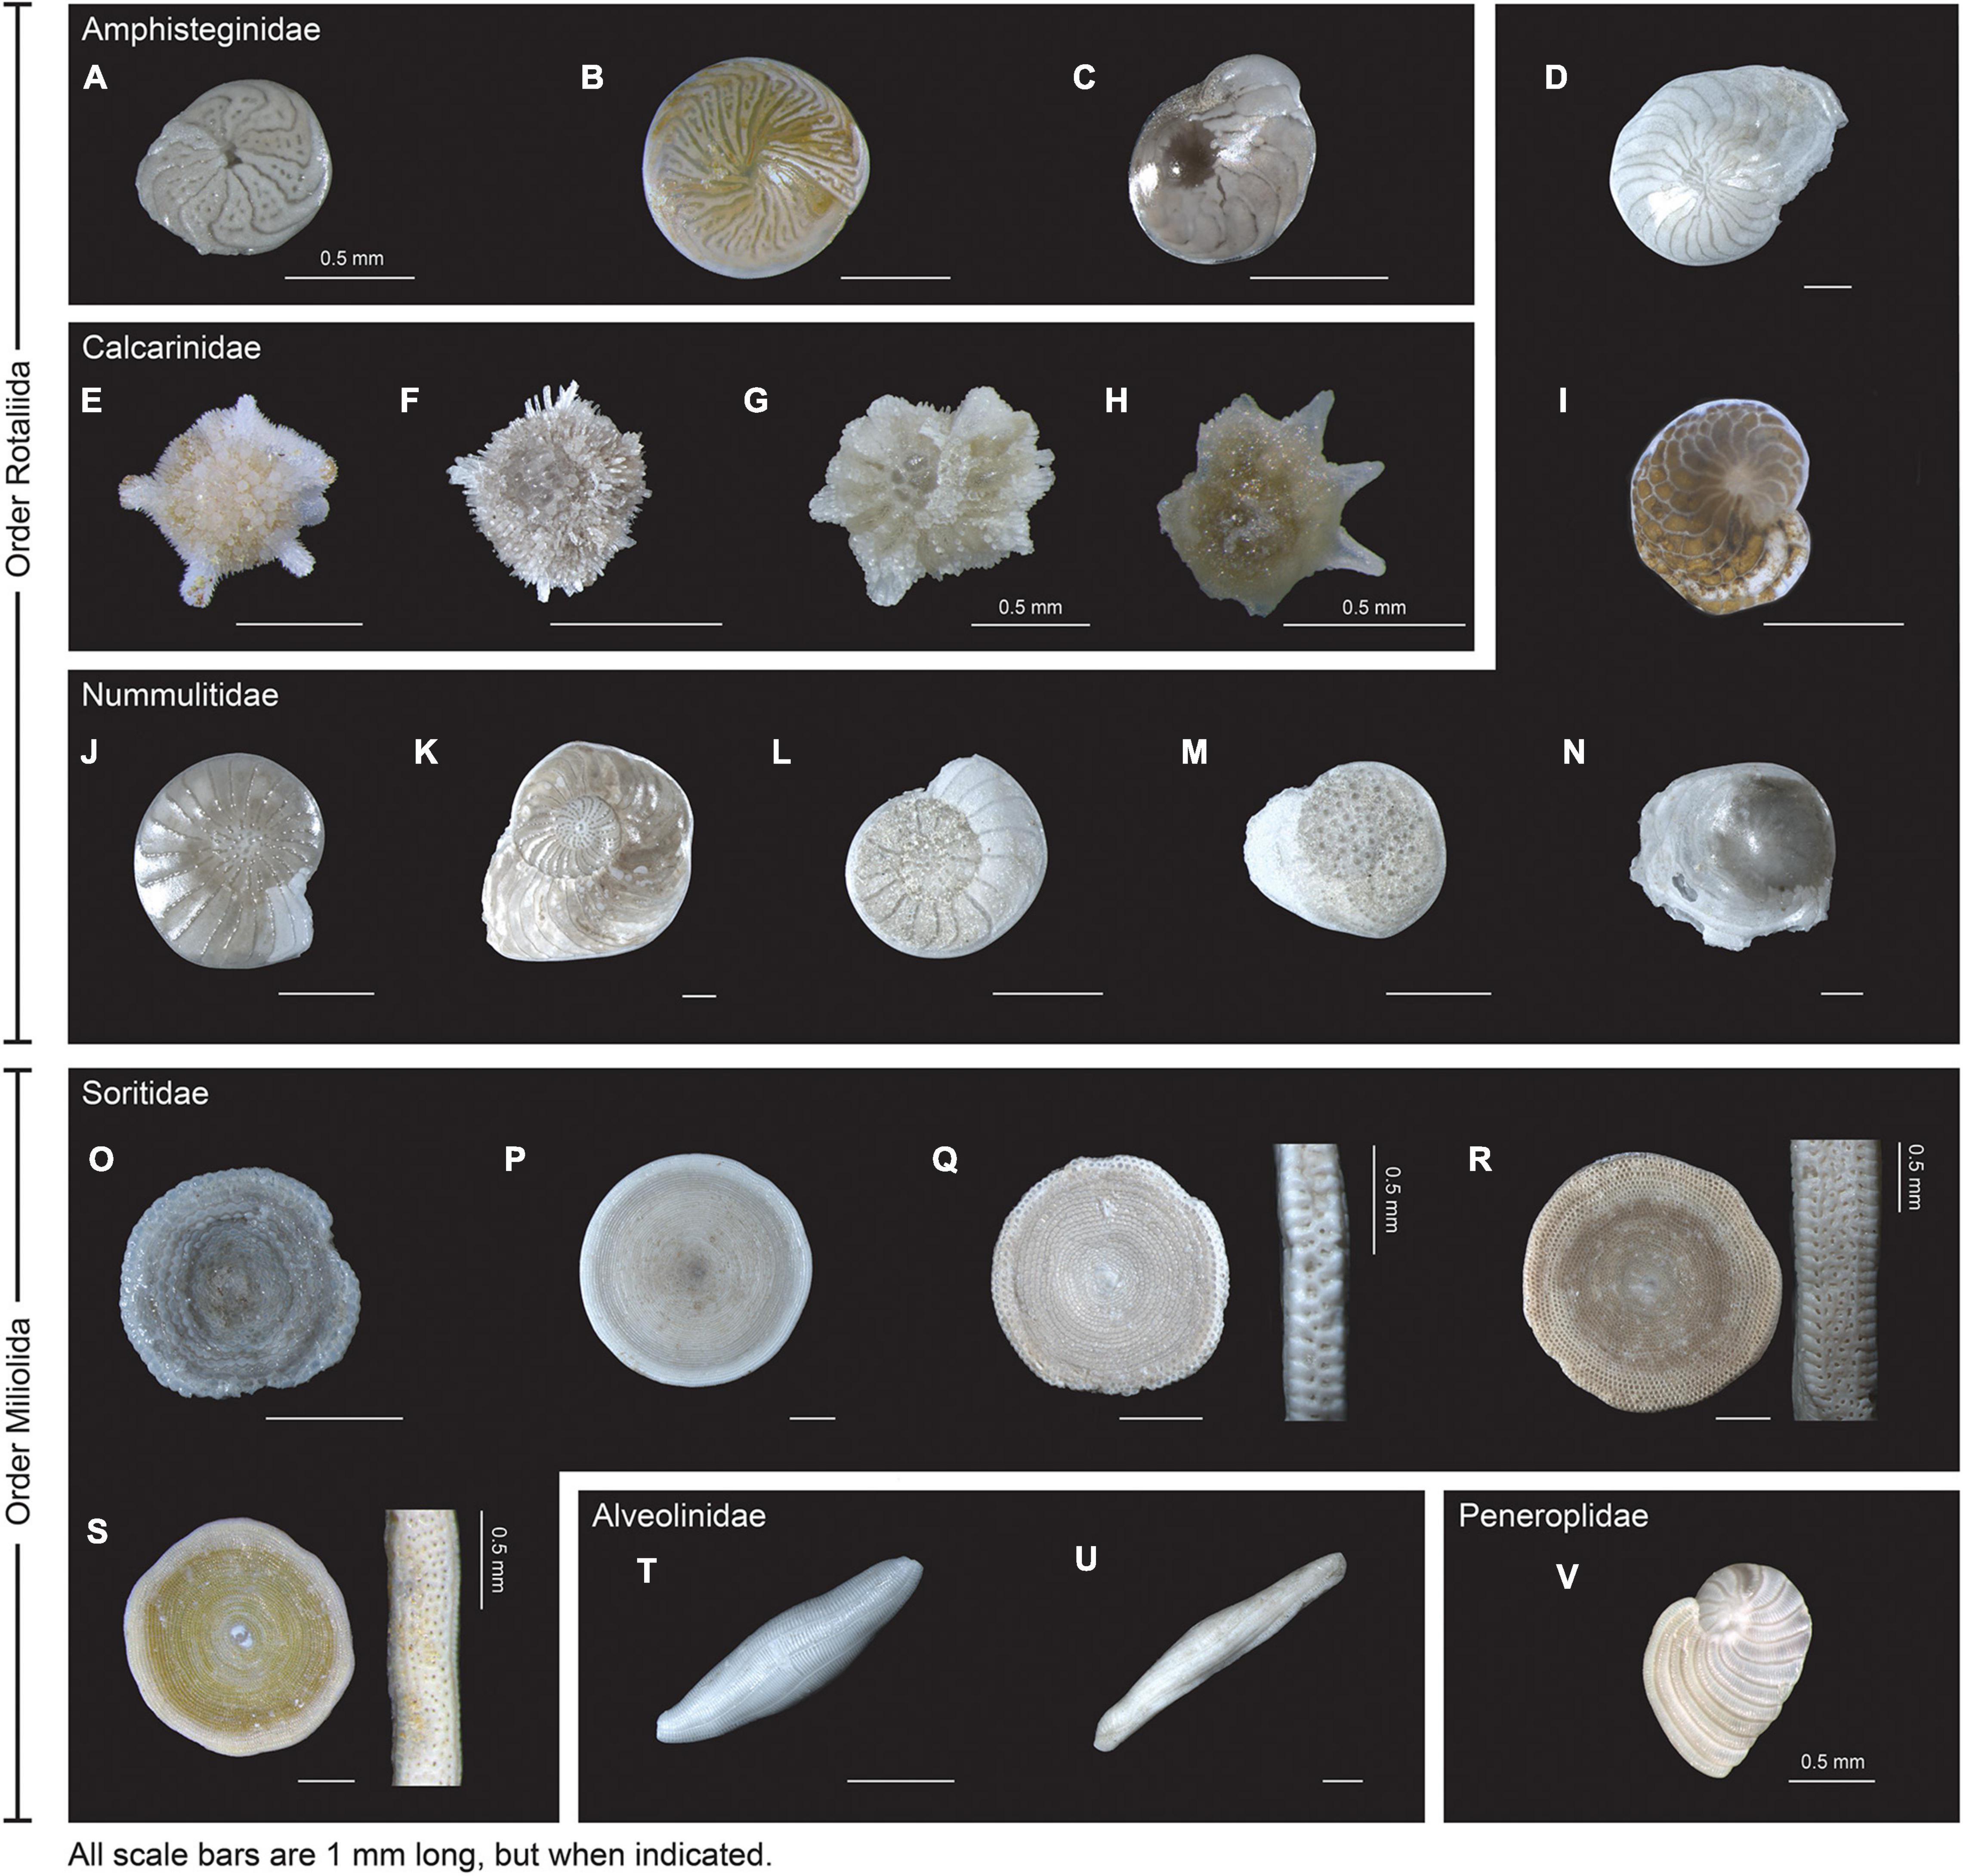
Figure 1. External view of the 22 species barcoded. Order Rotaliida: (A) Amphistegina papillosa. (B) A. radiata. (C) A. lessonii. (D) Nummulites venosus. (E) Calcarina hispida. (F) Calcarina sp1. (G) Neorotalia gaimardi. (H) N. calcar. (I) Heterostegina depressa. (J) Operculina ammonoides. (K) O. LKI27 type. (L) Operculina sp1. (M) O. complanata. (N) Operculinella cumingii. Order Miliolida: (O) Sorites sp. (P) Parasorites sp. (Q) Amphisorus SpS. (R) A. SpL. (S) Marginopora vertebralis. (T) Borelis schlumbergeri. (U) Alveolinella quoyi and (V) Peneroplis planatus. The scale bar is 1 mm unless indicated otherwise.
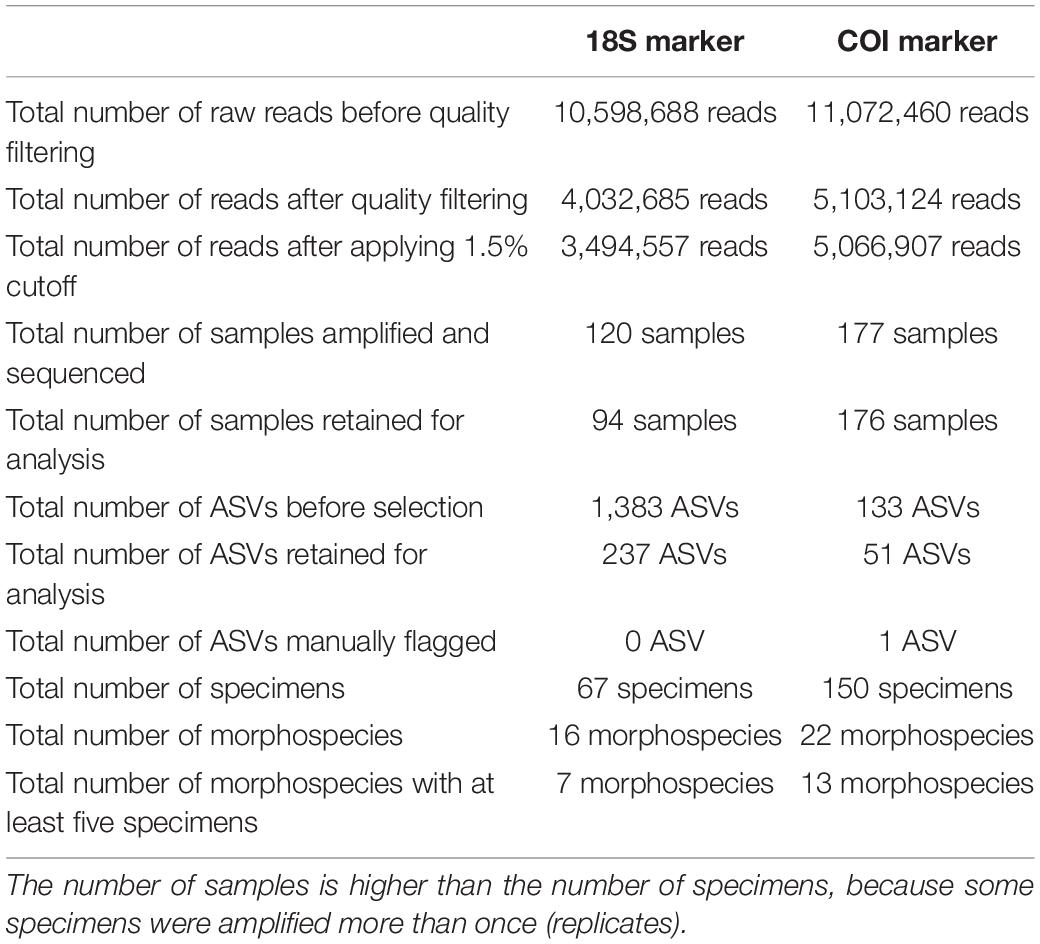
Table 2. Statistics on number of reads, samples and ASVs before and after quality filtering (see also Supplementary Table 4 for more information on the impact of the quality filtering on the number of reads per sample).
Amplification and Sequencing Success
The amplification protocol for 18S was less successful than the newly developed protocol for COI. Out of 200 extracted foraminiferal specimens, 151 specimens (from 22 species) could be amplified with the COI protocol (75.5%), whereas only a total of 73 specimens (16 species) could be amplified combining the results from both 18S protocols (36.5%) (Table 2). For the specimens extracted with Micro kit (n = 117), 94 specimens were successfully sequenced with COI marker (80%), whereas 64 were successful with 18S marker (45%). For the specimens extracted with GITC* (n = 83), 56 specimens were successfully sequenced with COI marker (67%), whereas only 12 were successful with 18S marker (14%). Additionally, a higher number of samples was retained after data treatment and quality filtering for COI (176/177 samples) compared to 18S (94/120 samples) (Table 2).
Genetic Variability
After quality filtering of the ASVs, eight taxa had a single (unique) sequence assigned to COI (i.e., Amphisorus SpL, A. SpS, Amphistegina lessonii, A. papillosa, Calcarina sp1, Marginopora vertebralis, Operculinella cumingii, Parasorites sp.) and nine taxa had a set of two characteristic COI sequences present in almost all specimens (Table 3), with usually one ASV much more abundant than the other (i.e., Amphistegina radiata, Borelis schlumbergeri, Calcarina hispida, Neorotalia spp., Nummulites venosus, Operculina ammonoides, O. complanata and O. LKI27 type). Amphisorus SpL and A. SpS., although morphologically distinct, share the same ASV for the COI marker, but have a different ASV for the 18S marker. Peneroplis planatus has only one ASV in each specimen but a total of two ASVs within the species for the COI marker. Heterostegina depressa specimens have two ASVs each, however, both specimens do not share the same two ASVs.
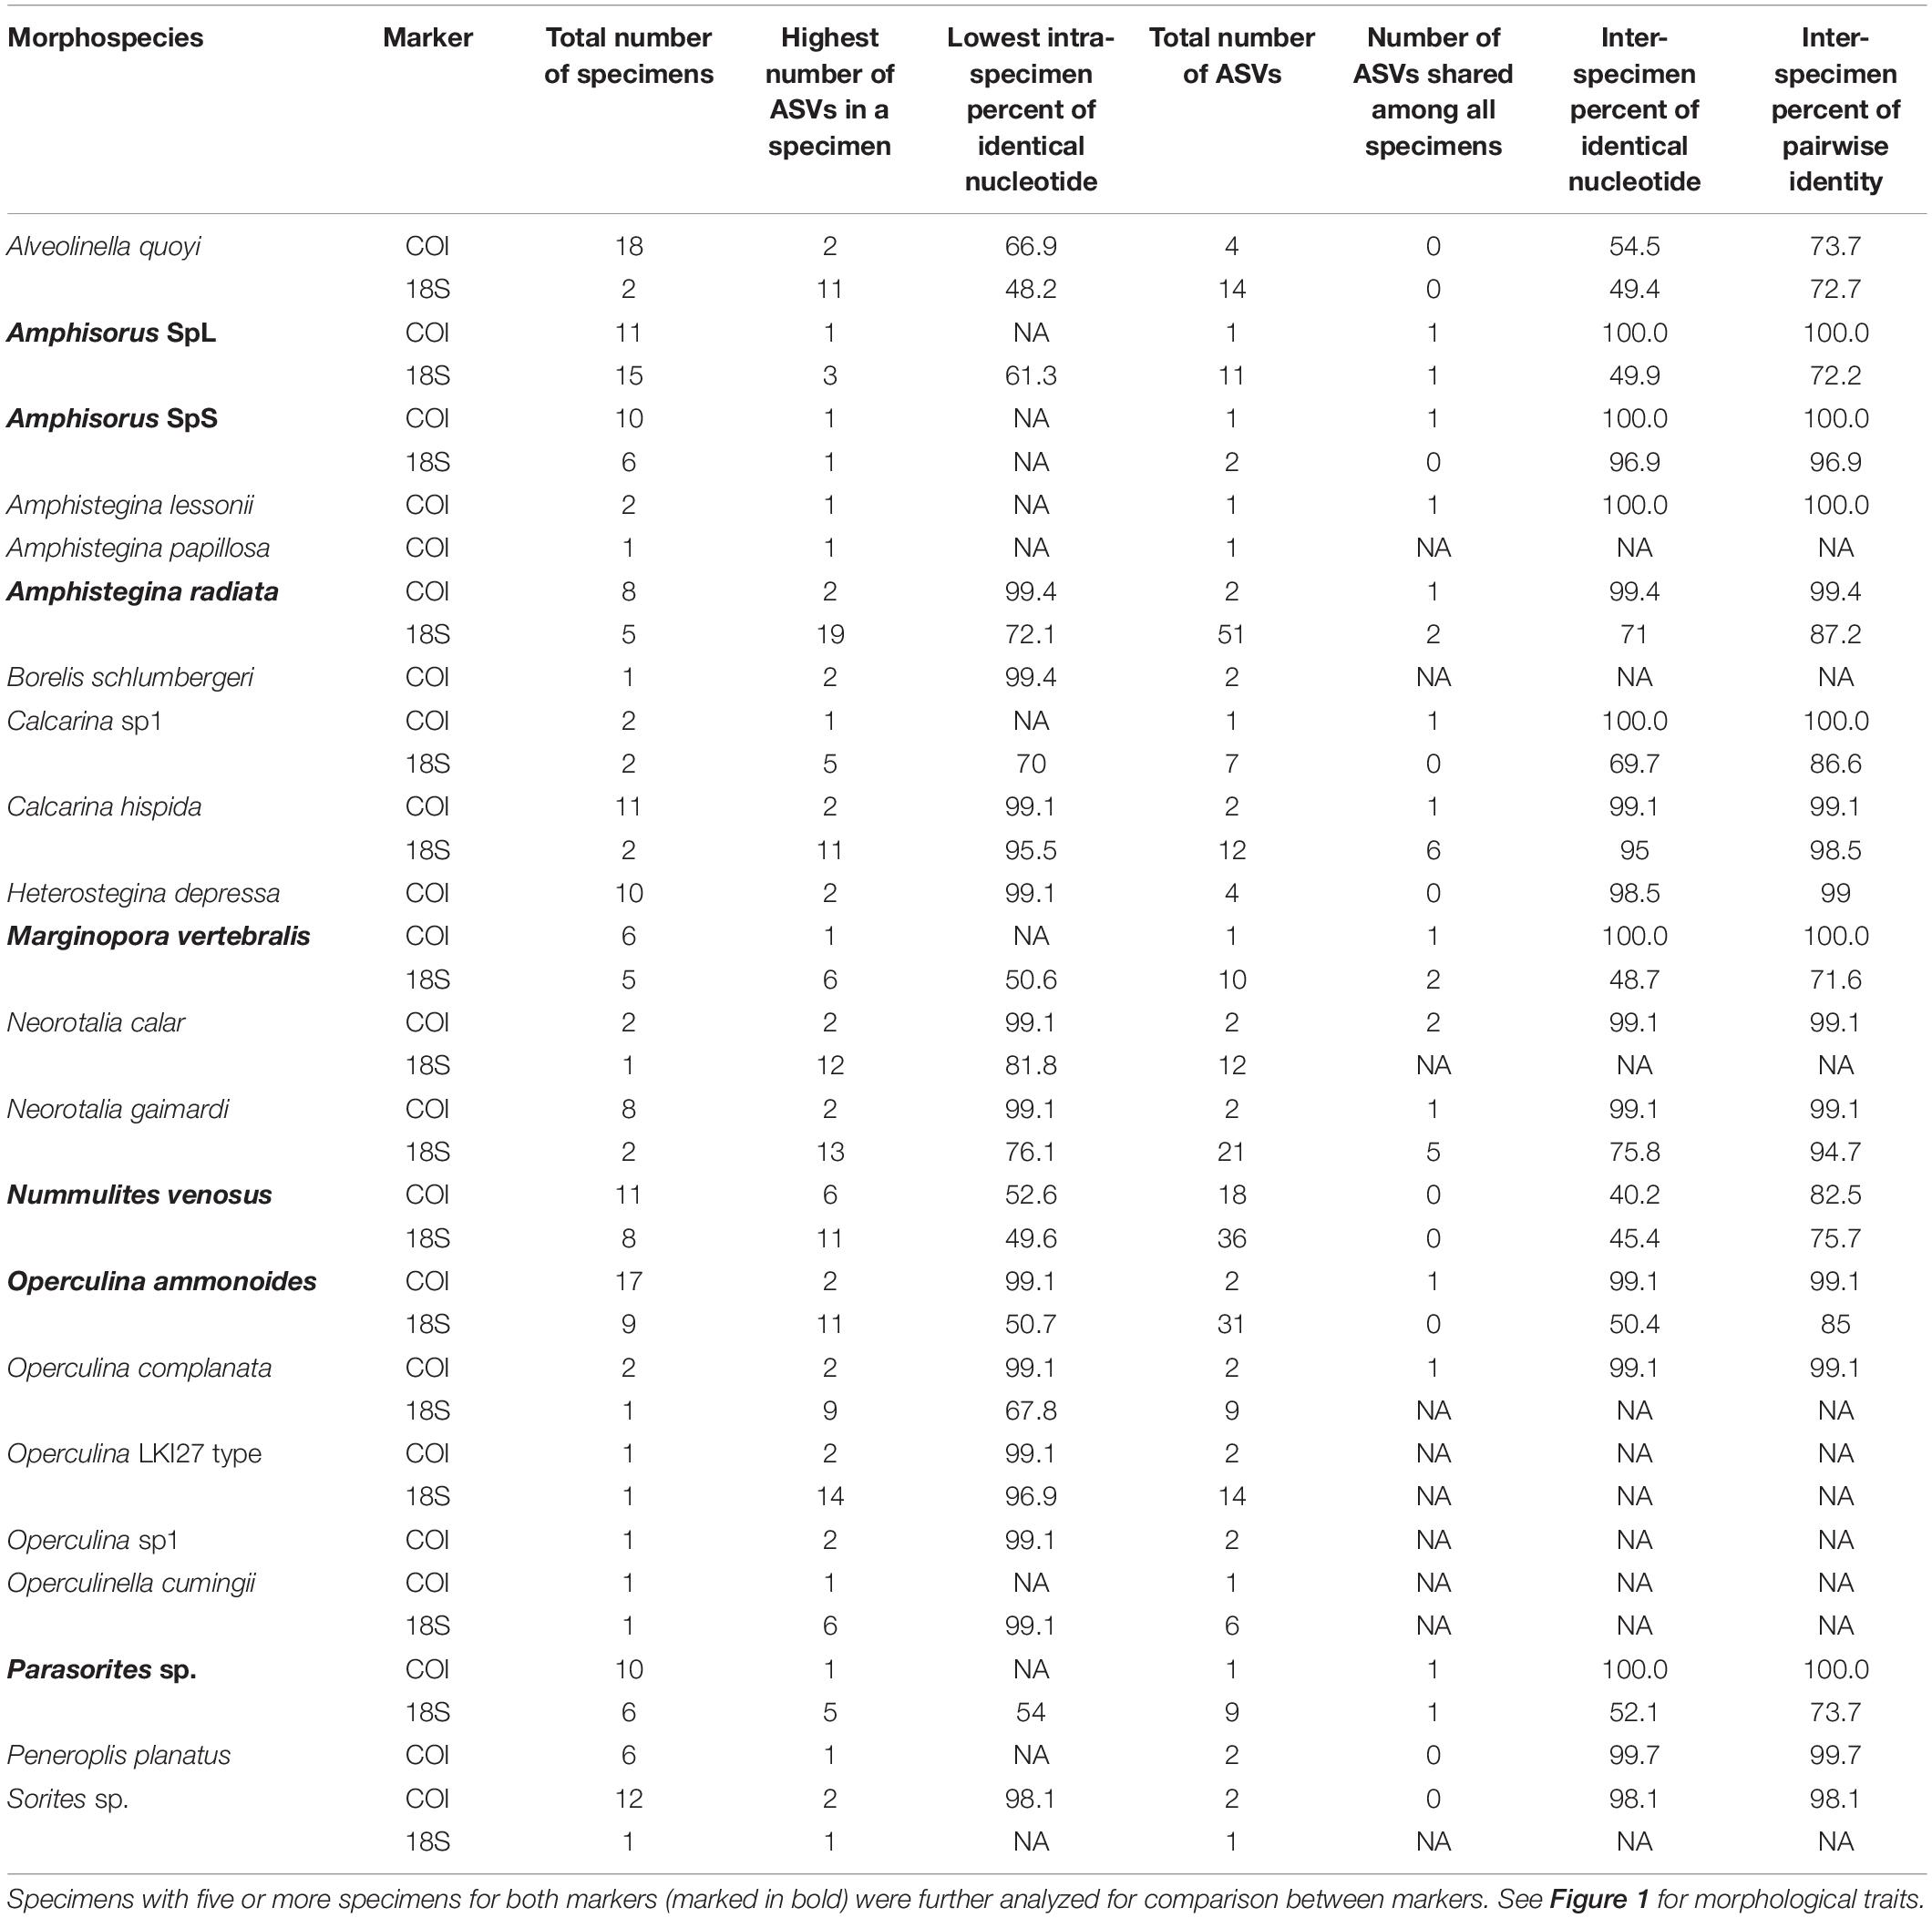
Table 3. Species genetic variability, intra-specimen and inter-specimen.
The variability of the 18S marker is greater in most species. It ranges from no ASVs shared between specimens in A. quoyi to 10 common, abundant ASVs in A. radiata (Table 3). Most specimens in a species do not share the same complete set of ASVs, but only few are in common. Besides the rotaliid taxon N. venosus, all other taxa for which we obtained both COI and 18S sequences have higher ratios of inter-specimen (between specimens) identical nucleotides and sequence pairwise identity in COI than in 18S (Table 3 and Figure 2). Genetic distance between ASVs were also compared between both markers at each level (intra- and inter-specimen) (Figure 2 and Figure 3). Both statistical tests (Levene and Fligner-Killeen) confirmed that inter-specimen genetic distances in COI are significantly smaller than in 18S for the seven compared species (Supplementary Table 2). The COI intra-specimen variability of A. radiata was much lower than for 18S, with seven specimens out of eight with only one (unique) ASV, and a single specimen with two ASVs (Table 3 and Figure 3).
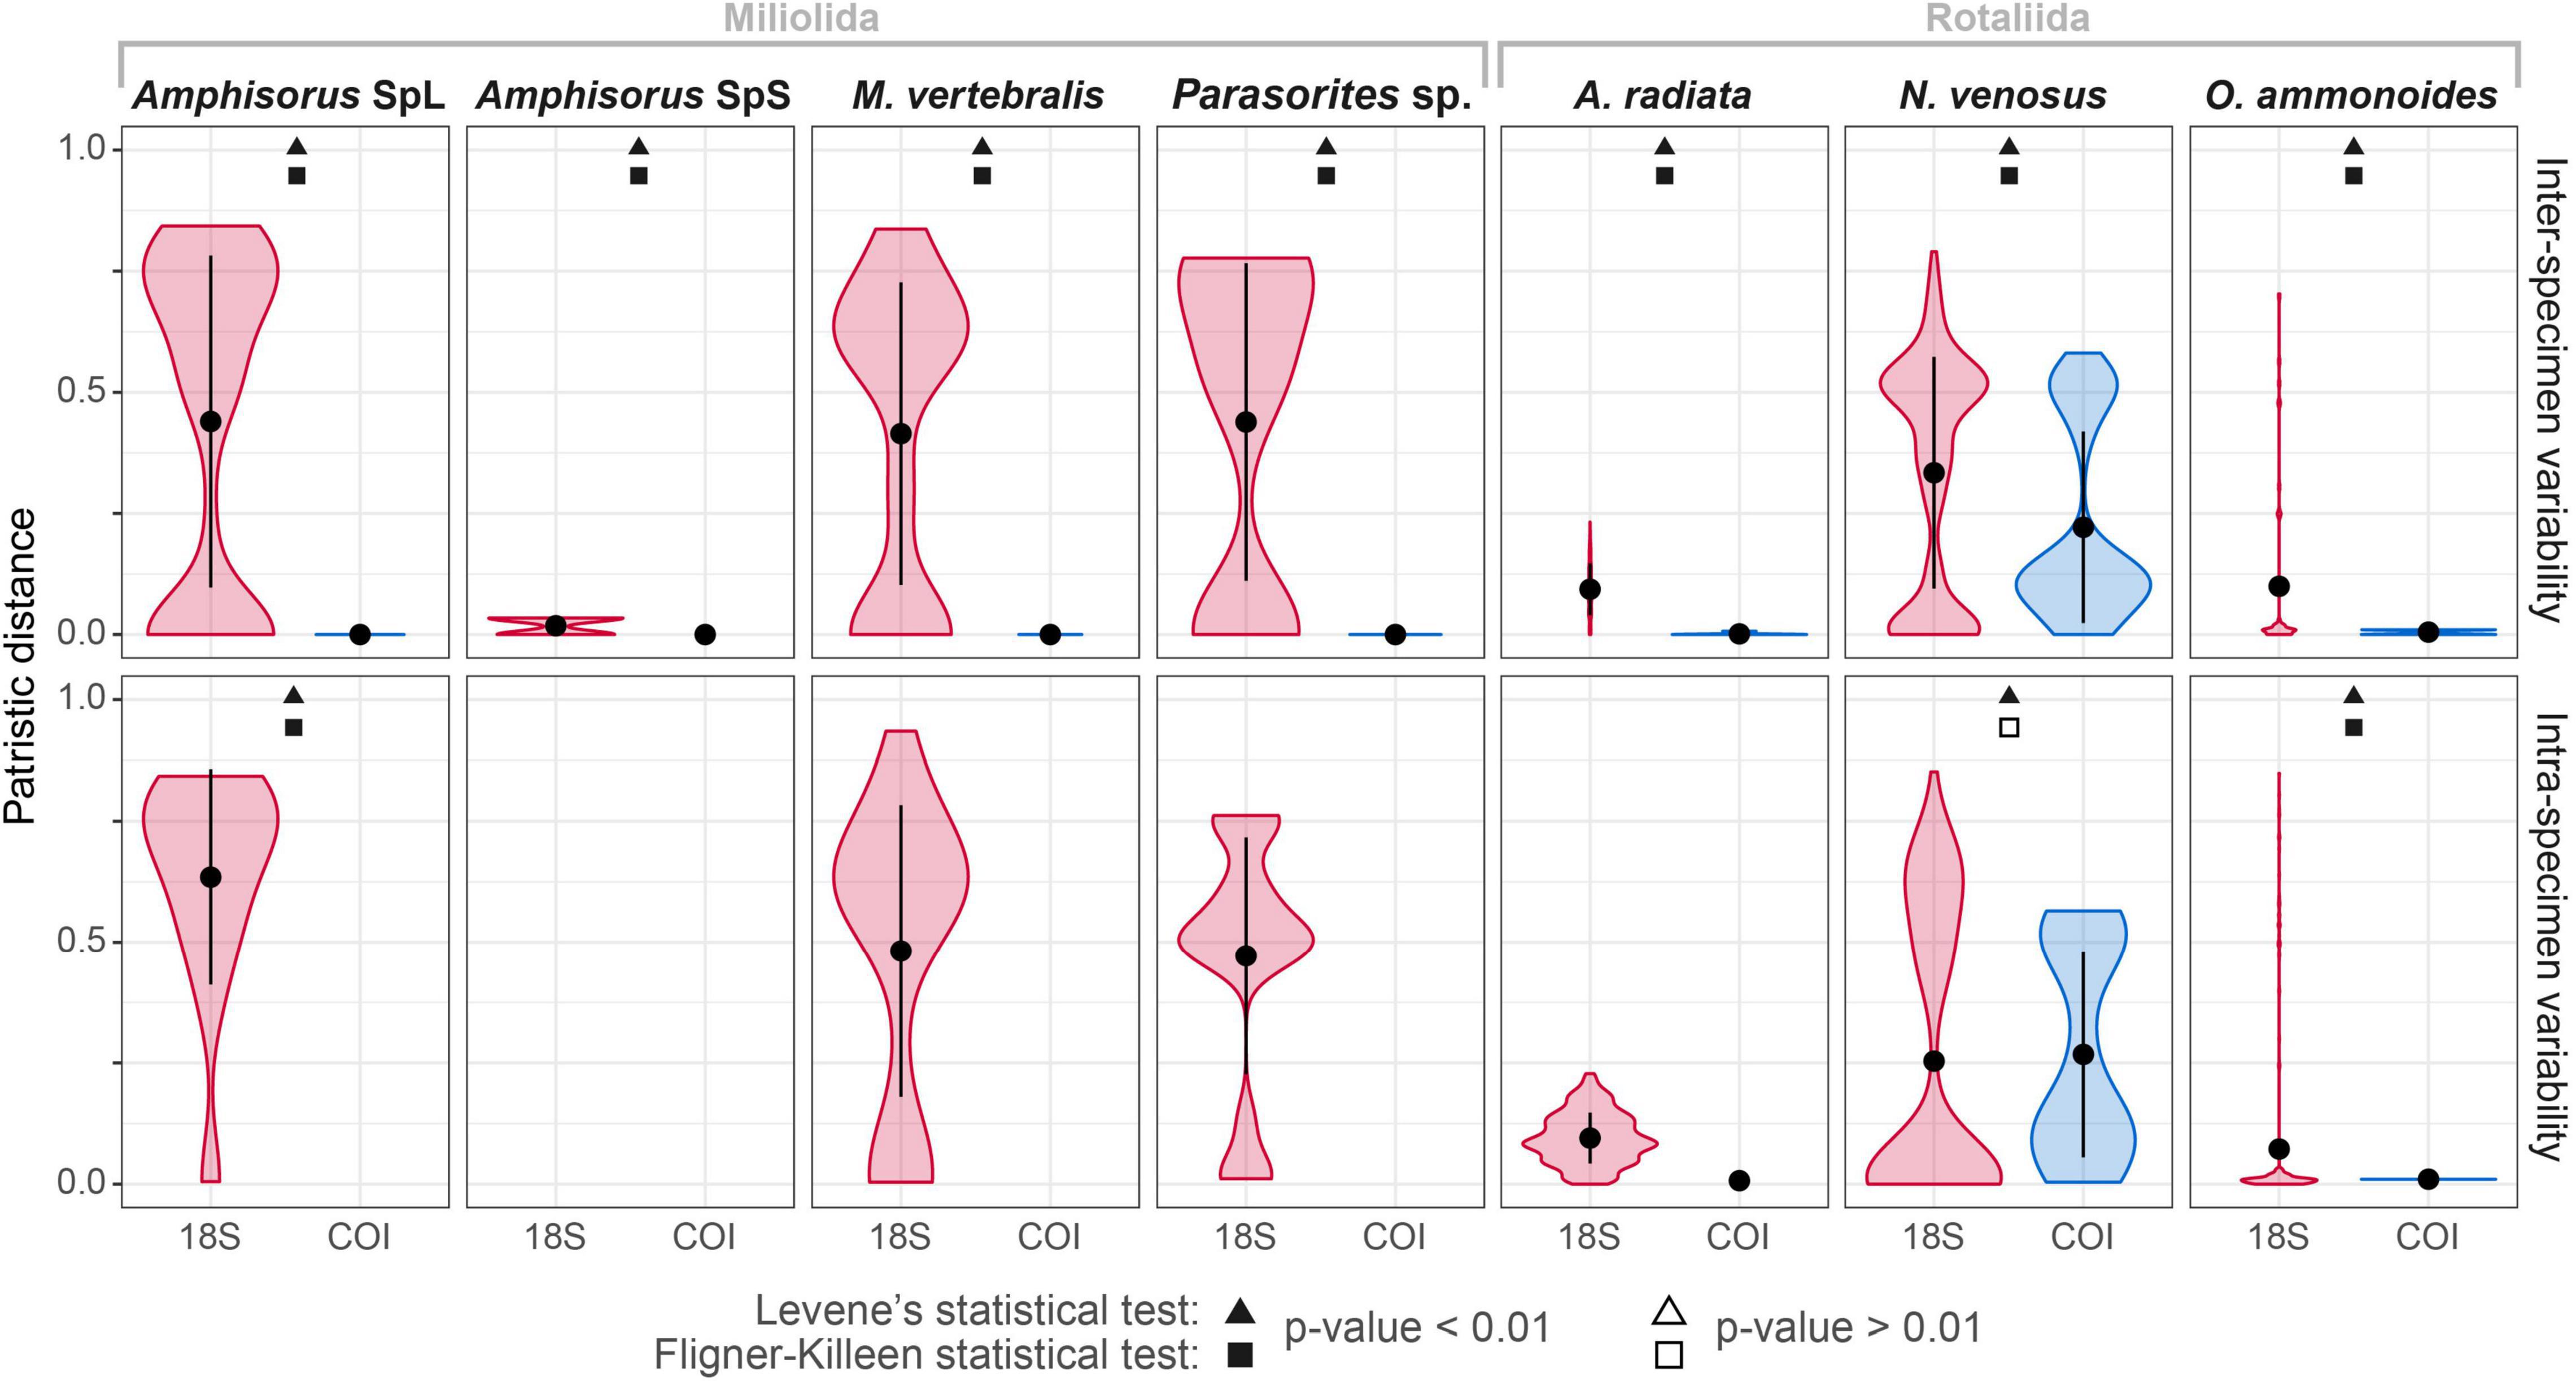
Figure 2. Comparison of the intra- and inter-specimen genetic variability between COI and 18S markers based on patristic distances. The black circles represent the mean distance and the vertical black line the standard deviation from the mean. Statistical Levene’s test (triangles) and Fligner-Killeen test (squares) were performed for each species and each variability level (intra- or inter-specimen). Complete statistical results in Supplementary Table 2. Significant differences in variance between both markers are indicated with black-filled shapes, whereas not significant results are indicated with white-filled shapes. The absence of boxplot in a facet means that there is no genomic variation (where the total number of ASVs = 1).
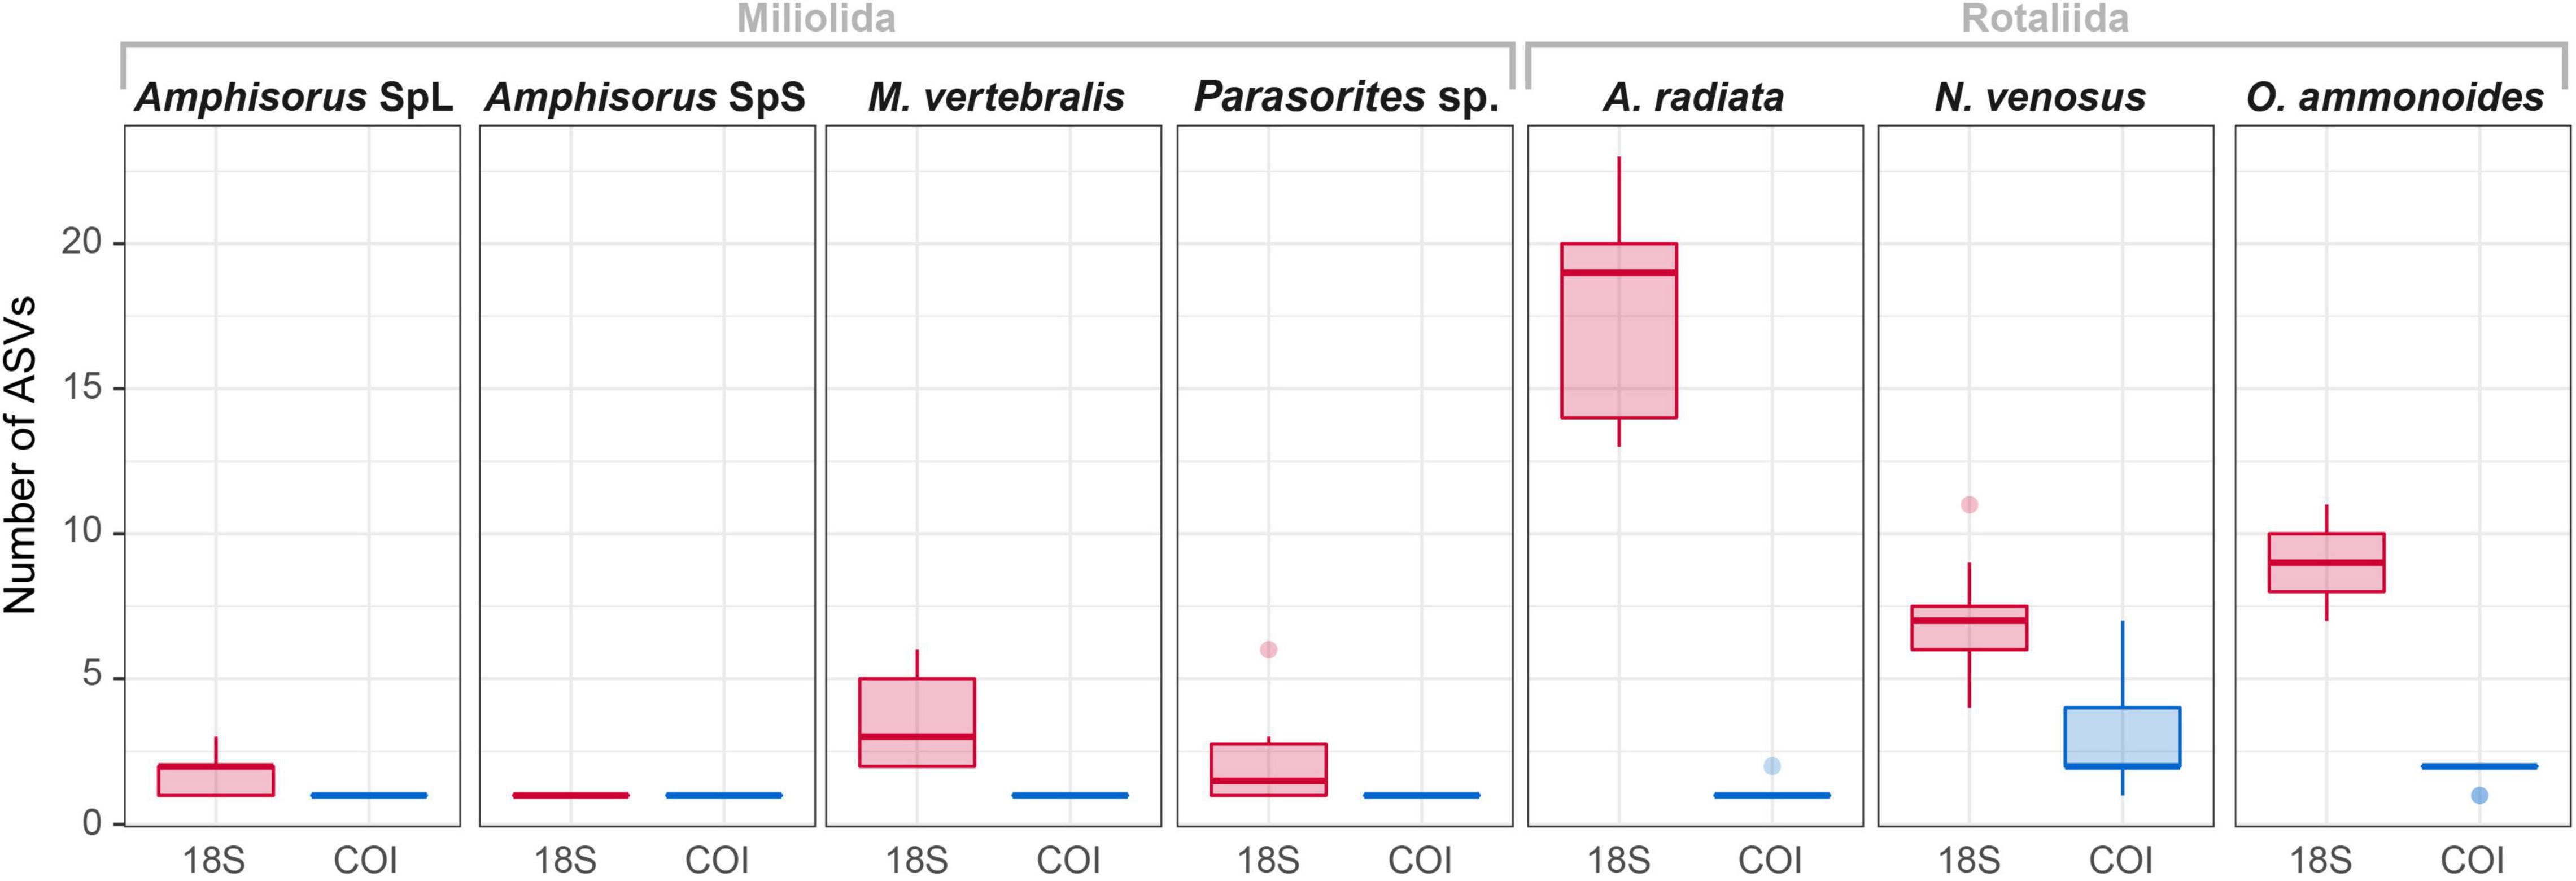
Figure 3. Overview of the number of ASVs in each specimen for 18S and COI markers.
Sequences creating an abnormal variability in the datasets were mostly filtered out by applying the 1.5% read count threshold. However, one additional ASV was flagged in the COI dataset and removed manually post processing (Supplementary Table 3). It had the desired fragment length, amplified with the right primers but created a 41-bp gap in the alignment with the other two ASVs (between the bases 180 and 220) in two specimens of the species C. hispida.
Phylogenetic Reconstruction and Species Delimitation
In both trees, rotaliid specimens cluster well together. With its decreased ASV number at the specimen and the species levels, the COI tree also has a decreased number of outlier sequences (Figure 4A). Indeed, the greater variability in 18S creates numerous inconsistencies in the phylogenetic reconstruction from N. venosus (specimens 3709, 3711 and 3712), from Parasorites sp. (specimen 3723) and from O. ammonoides (specimen 3725) (Figure 4B). The different morphospecies from the family Calcarinidae do not cluster as well in the 18S tree as in the COI. Miliolid specimens cluster very well in the COI tree, whereas the two alveolinid specimens have such a high variability in the 18S dataset that they do not cluster properly together nor with soritid specimens (Figure 4). Disregarding the high inter-specimen variability of certain species, both trees have similarities. For example, N. venosus is sister-group to O. complanata; Parasorites sp. is sister-group to Amphisorus spp. and to the clade formed by M. vertebralis and Sorites sp. Moreover, in both trees, N. venosus and A. quoyi are the two most variable species.
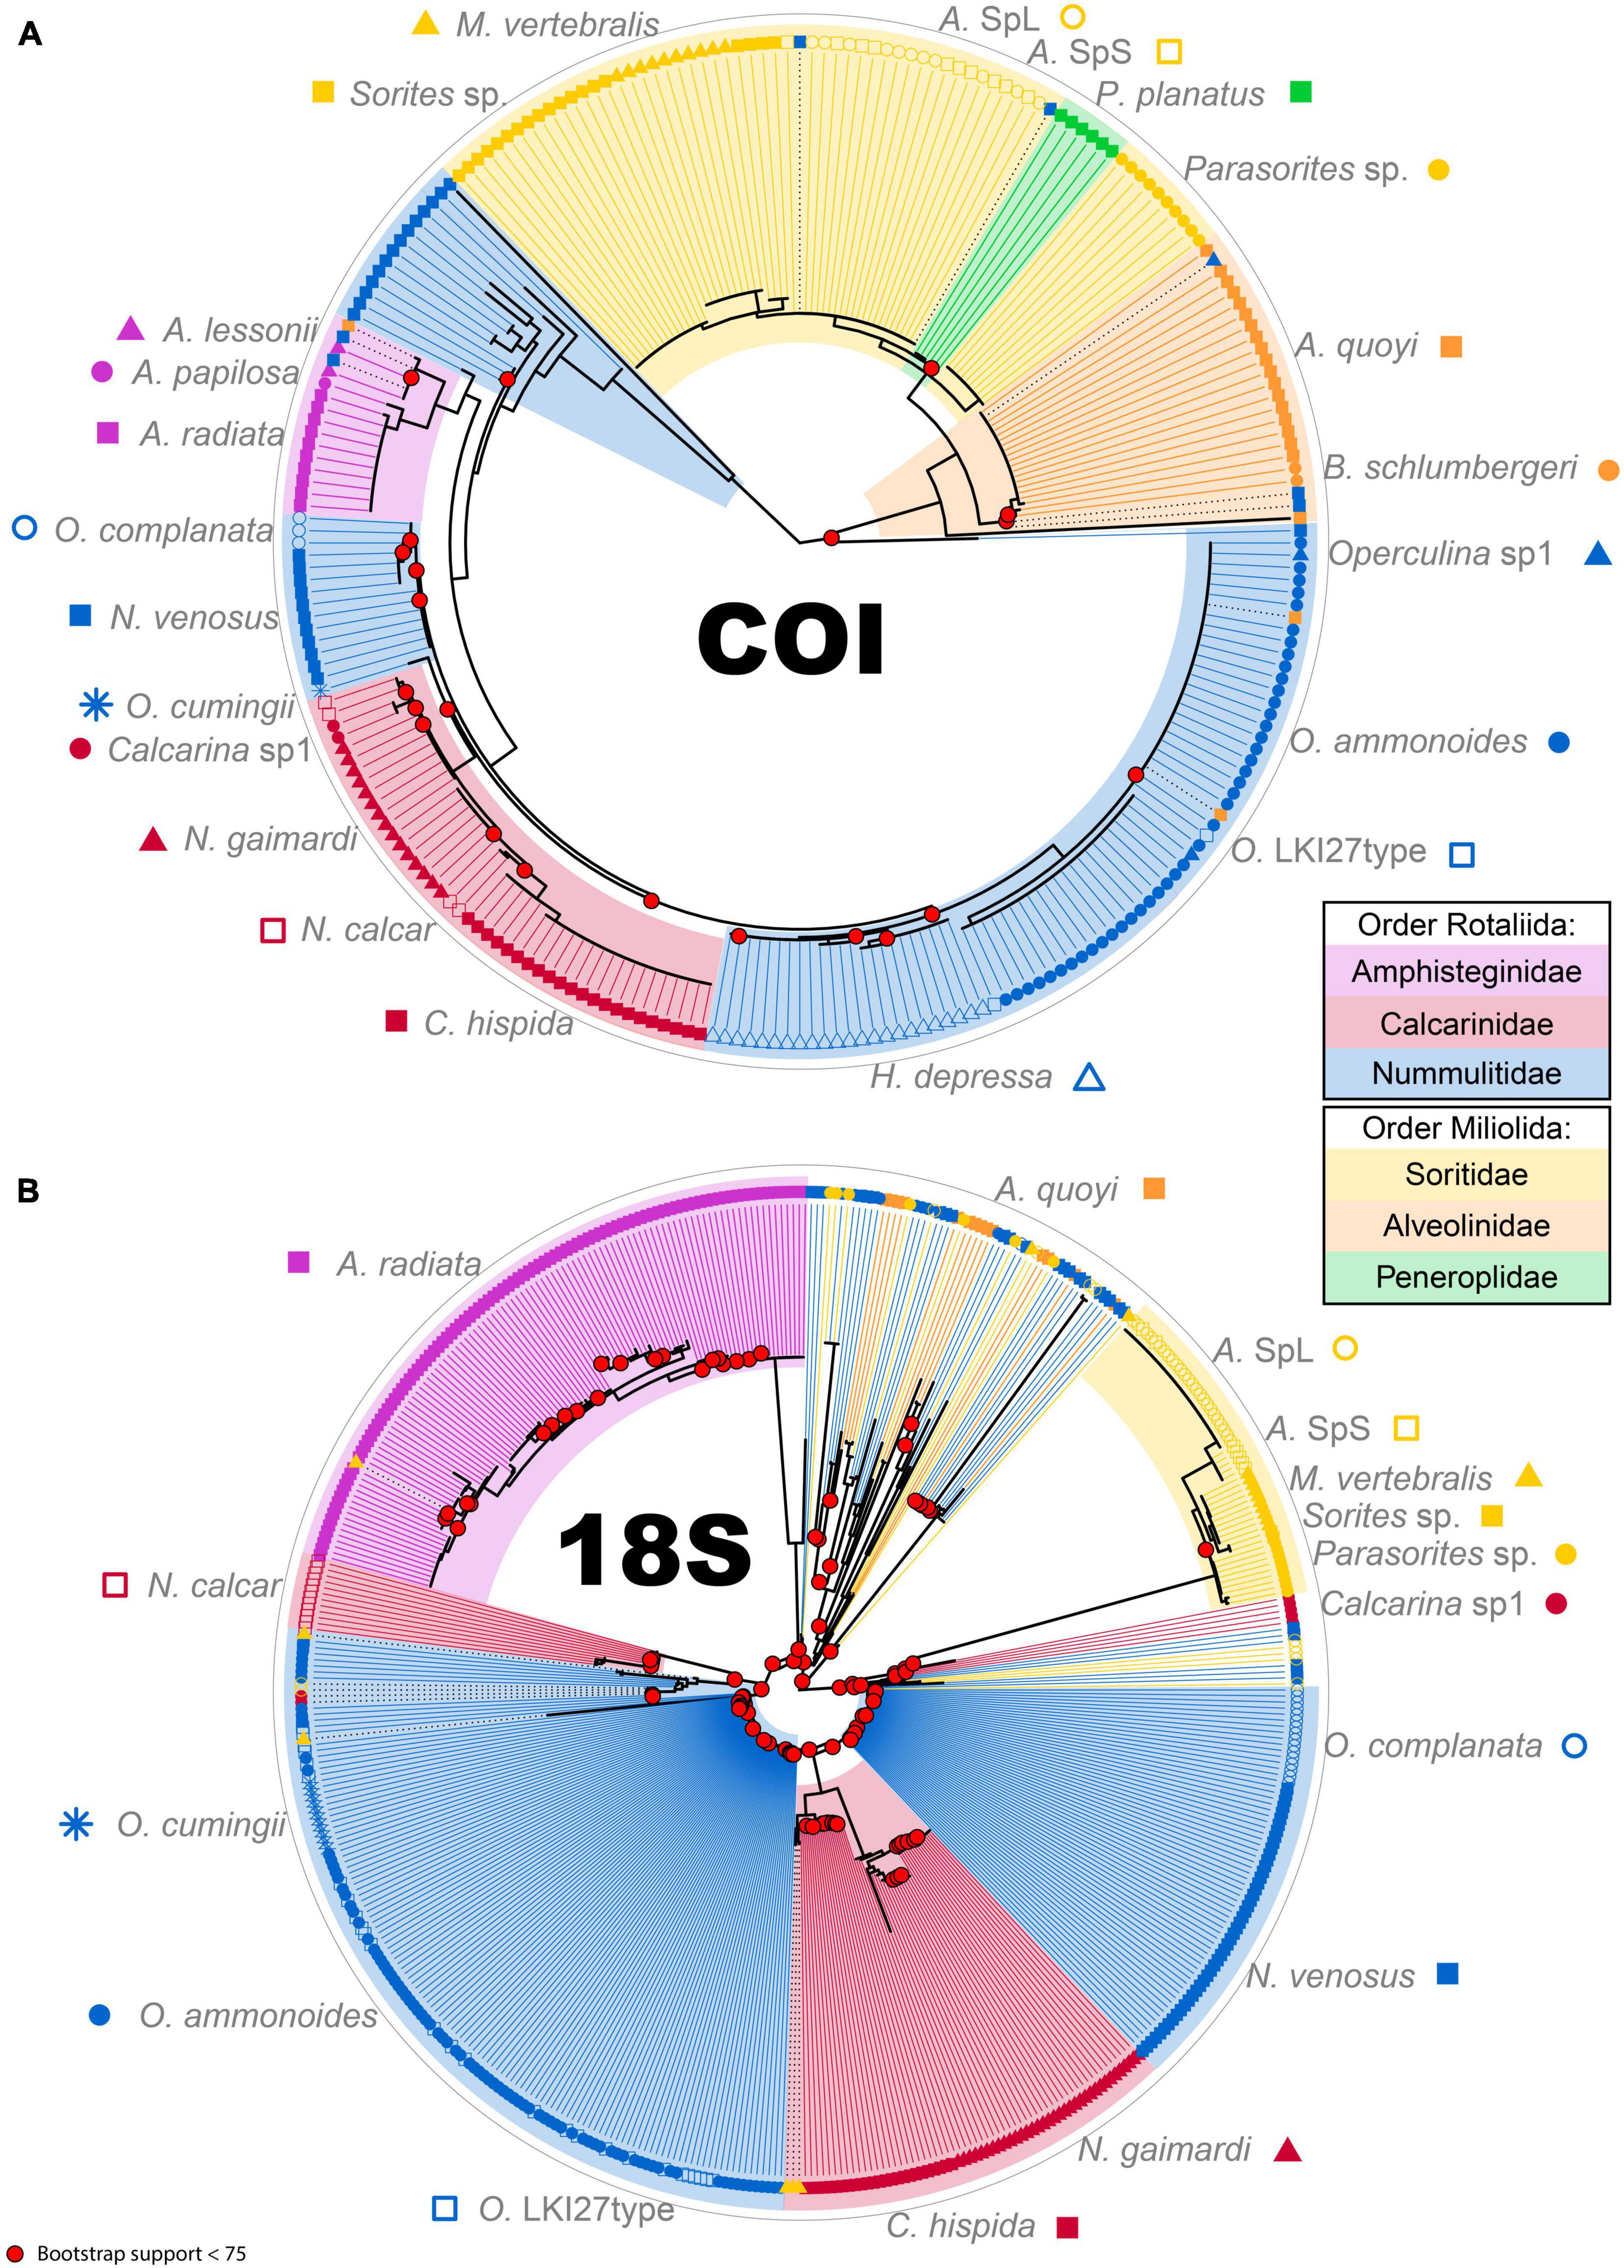
Figure 4. Phylogenetic tree for COI marker (A) and 18S marker (B). Colored areas represent the different families (Amphisteginidae, pink; Calcarinidae, dark red; Nummulitidae, blue; Soritidae, yellow; Alveolinidae, orange; Peneroplidae, green). Each species is represented by a symbol and colored according to the Family. The tips of the trees are ASV sequences in each sample. Black dotted lines between the phylogeny and the tip mean that the ASV does not cluster properly according to the morphological classification. Bootstrap values below 75 are highlighted at respective nodes in bright red.
The ASAP algorithm performed better for delimiting morphospecies with the COI marker (p-value < 0.1) than with the 18S marker (p-value > 0.1) due to the lower variability of the mitochondrial DNA (Table 4). Nonetheless, the number of morphospecies was overestimated by the algorithm in both cases. The genetic distance threshold in Miliolida is smaller than in Rotaliida in both markers (Table 4). When applying Morard’s integrative molecular taxonomic system on the datasets, we observed that COI and 18S are generally congruent in the estimated numbers of MOTUs level-2 and level-1 (Table 5). Seven species show divergences that could be interpreted as multiple MOTUs level-2. More interestingly, A. quoyi and N. venosus have two and three clusters, respectively, that appear to align with the concept of MOTUs level-2 and level-1 defined by Morard et al. (2016) in both markers. There are some exceptions, for example, Calcarina sp1 and O. ammonoides have two clusters aligning with MOTUs level-2 in the 18S dataset, but not in the COI one. Overall, most species do not show barcoding gaps that would result in multiple MOTUs level-1 based on Morard’s system (Table 5).
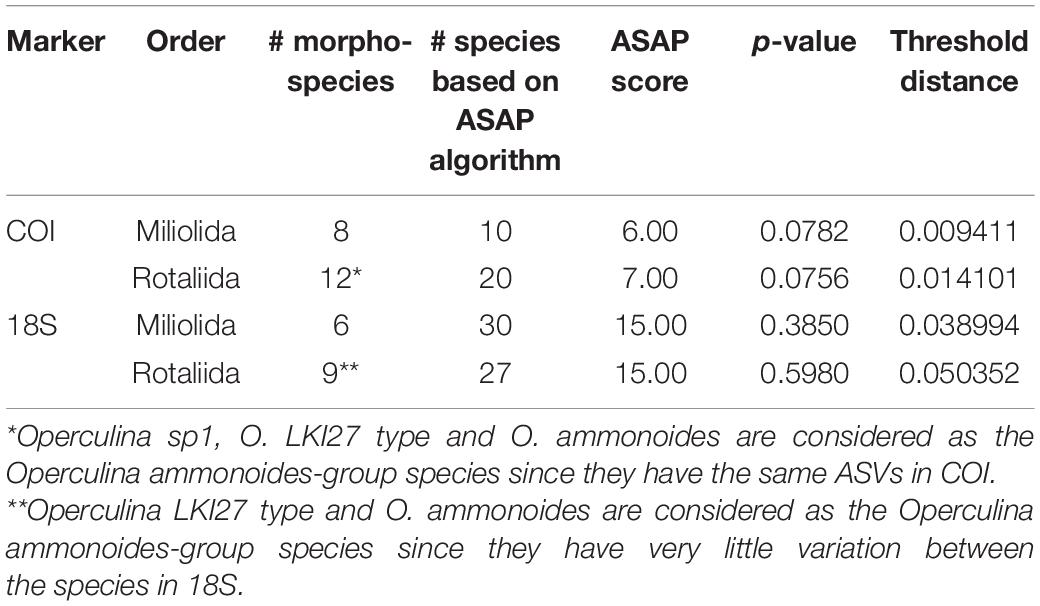
Table 4. ASAP results performed separately on the orders Rotaliida and Miliolida representing best the dataset.
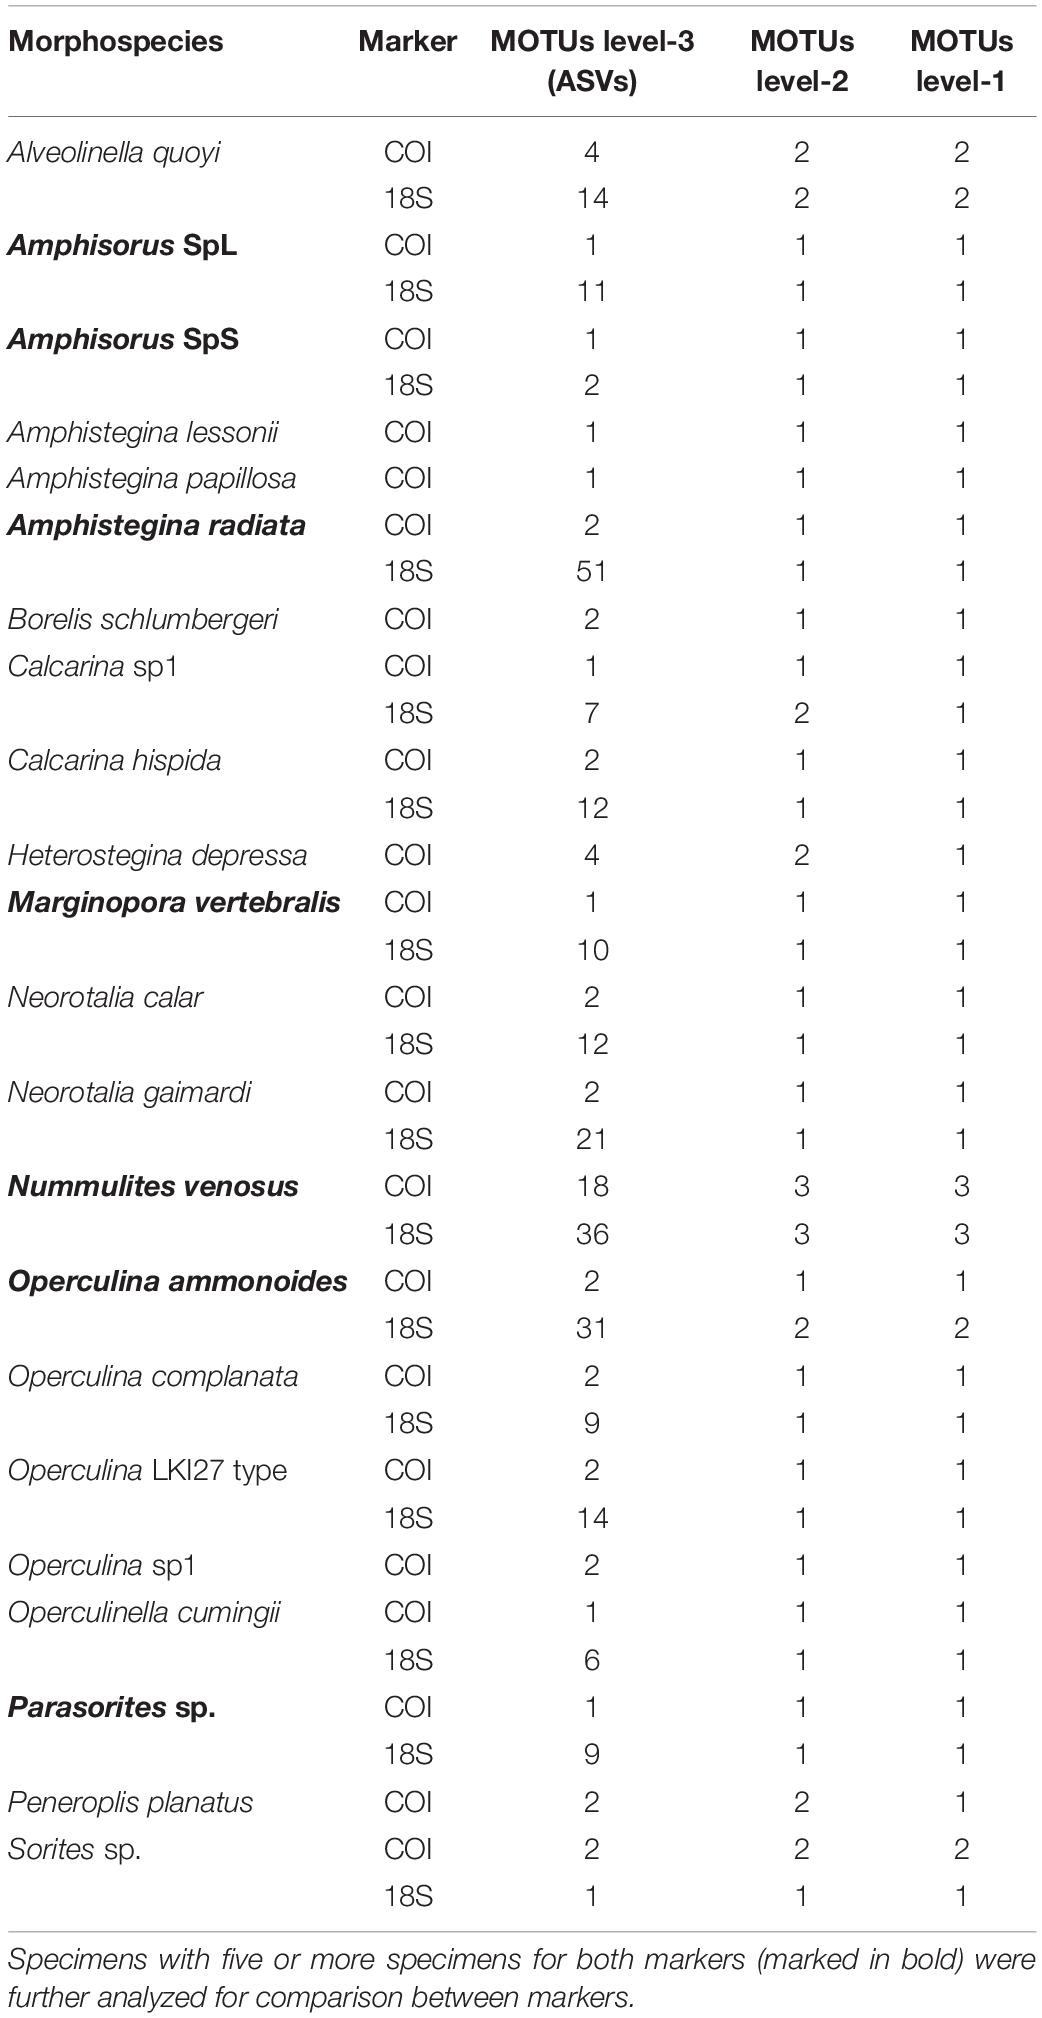
Table 5. Morard’s integrative molecular taxonomic system results at each MOTUs level, for each species and each marker.
Discussion
Only one widely used molecular marker, the 18S rRNA, has a large reference database and is available for species identification in foraminifera (Ertan et al., 2004; Morard et al., 2015; Holzmann and Pawlowski, 2017; Borrelli et al., 2018). Additional nuclear markers have been studied, such as the ITS (Macher et al., 2021a), which is also often used for molecular analyses of protists in general (Thornhill et al., 2007; Pawlowski et al., 2016), the ribosomal large subunit (Pawlowski et al., 1994), actin (Flakowski, 2005), tubulin (Takishita et al., 2005) and multiple genes based on expressed sequence tags data (Sierra et al., 2013). Recently, Macher et al. (2021b) established a barcoding protocol for foraminiferal mitochondrial cytochrome c oxidase I (COI), based on Rotaliida and Miliolida sequences. Here, we use high-throughput sequencing to assess intra- and inter-specimen genetic variability of two foraminiferal molecular markers, in order to test the potential of the newly discovered COI compared to the widely used 18S.
Amplification Methodology
The low amplification success rate from the 18S maker, compared to the COI, might be linked to suboptimal amplification protocol, either from the ratio between DNA template and reagents, the type of reagents (i.e., mastermix choice) or inadequate amplification program. Nested or semi-nested PCRs have often been used to amplify ribosomal regions (e.g., Holzmann et al., 2003; Holzmann and Pawlowski, 2017; Morard et al., 2018) and might provide better amplification results. Since the COI marker amplified well and the targeted fragment for both markers was about the same size (up to 330 bp), the preservation of the samples in ethanol and the extraction protocol were likely not the issue.
High Molecular Diversity in Large Benthic Foraminifera
We performed metabarcoding with high sequencing depth on single specimens and found a high genetic variability in the foraminiferal taxa studied. Genetic variability differed between analyzed markers and species. Some species were well identified and showed low intra- and inter-specimen variability (e.g., M. vertebralis and Parasorites sp.), resulting in a single amplicon sequence variant (ASV) per species. Other species show a variability exceeding the commonly applied 97% operational taxonomic unit (OTU) threshold, with up to 59.8% of non-identical sites in N. venosus. Similar patterns were observed in the SSU rRNA of other benthic foraminifera (Pillet et al., 2012; Weber and Pawlowski, 2014) and amoebozoa protists like Ripella spp., overestimating the number of species because of intragenomic variability (Kudryavtsev and Gladkikh, 2017).
The genetic variability in both markers is highlighted by the species delimitation analysis that overestimated the number of species in our dataset for both markers (Thornhill et al., 2007). Highly variable sequences remaining in the dataset after quality filtering might be the result of non-functional pseudogenes encoded in the genome (Thornhill et al., 2007; Guillou et al., 2013; Graham et al., 2021). If not flagged, pseudogenes may participate in increasing the amount of intra-genomic variation (Schultz and Hebert, 2021), especially in markers with non-coding regions such as 18S. The observed intra-genomic variation in single specimens may also be caused by the presence of multiple nuclei within the cell (Zhao et al., 2019), a high number of gene copies in the genome (Kudryavtsev and Gladkikh, 2017; Milivojević et al., 2021), or hybridization events (Pillet et al., 2012). Indeed, foraminifera can reproduce by multiple fission, which results in specimens at a multinucleate agamont stage (Bé and Anderson, 1976; Lee et al., 1979; Parfrey and Katz, 2010; Milivojević et al., 2021). The presence of high intra-genomic variability in some of the studied species may also be the results of cryptic speciation. Cryptic species in benthic and planktonic foraminifera have been identified multiple times (e.g., Pawlowski and Holzmann, 2002, 2009; Majewski et al., 2015; Morard et al., 2016). Morard et al. (2016) developed an integrative molecular taxonomic system for community metabarcoding in order to identify biological species and cryptic diversity in planktonic foraminifera. We tried to apply Morard’s system to our datasets even though our experimental design did not correspond to an eDNA sequencing output. The two species showing the most inter-specimen variability in both markers, A. quoyi and N. venosus, also clustered in what could be interpreted as multiple MOTUs level-1 according to Morard’s system (Morard et al., 2016). We refrain from interpreting these levels of genetic variability until more data on variability within species and between populations is available.
Another hypothesis is the possible horizontal gene transfer that should not be disregarded, since about 1% in the protist genome can be inherited from horizontal gene transfer processes (Van Etten and Bhattacharya, 2020). Specific groups of foraminifera commonly live in symbiosis with prokaryotes and eukaryotes, e.g., the so-called large benthic foraminifera that obligatory house micro-algal symbionts (Prazeres and Renema, 2019 and references therein) and other groups that thrive in anaerobic conditions (Orsi et al., 2020) that might be the result of such a biological process (Keeling and Palmer, 2008). Species that have closely related ASVs to other unrelated taxa, e.g., N. venosus and A. quoyi, might also be the result of possible horizontal gene transfer during close cohabitation in densely packed communities. However, this phenomenon has not yet been observed in foraminifera (Pillet and Pawlowski, 2013). Cross-contamination is also a possibility, but precautions were strictly applied during laboratory work and appropriate data filtering was performed.
Our results show that 14 out of 22 taxa consistently had two or more mitochondrial ASVs associated with a single specimen. The number of ASVs for the ribosomal gene in a single specimen can be very high, for example, up to 10 ribosomal ASVs are equally abundant and shared between two or more A. radiata specimens. This highlights the need to rethink the method of a “single sequence” for species identification and delimitation. The extreme intragenomic variability observed in the foraminiferal 18S marker is not a unique phenomenon. It has been observed in marine ciliates (Zhao et al., 2019), ichthyosporeans (Lohr et al., 2010) and radiolarians (Decelle et al., 2014). Zhao et al. (2019) suggests the use of a 97% similarity cutoff to delimit marine ciliate OTUs aiming to remove the intragenomic polymorphism. We rather suggest the use of a set of sequences based on ASVs or approaches like ZOTUs (Edgar, 2016) to identify species at the molecular level in addition to using a combination of different markers, with two or more ASVs per marker. This proposition is even more worthwhile for markers that have a hypervariable component, such as 18S in Foraminifera. How using sets of sequences can be applied to metabarcoding and bulk sample analysis is a question that will need further targeted mock community analyses.
Effectiveness of Cytochrome Oxidase Subunit 1 vs. 18S Marker in Species Identification
The COI and 18S datasets enabled us to identify specimens that are slightly morphologically different, but were misclassified during the morphospecies classification step (i.e., Calcarina sp1, N. calcar and B. schlumbergeri) (see Figure 1). Specimens from these three species had different mitochondrial and ribosomal sets of ASVs compared to their closely related taxon, which alerted us of their possible misclassification. It was clear from the COI dataset due to the decreased number of ASVs and genomic variability. The calcarinid 18S dataset blurred the molecular differences between species, but working with a set of ASVs instead of a single sequence has proven itself worthy to distinguish the misclassified species. Based on the latter findings, the inter-specimen variability observed in H. depressa and P. planatus hints at possible undiscovered biological species within these groups. The variability in H. depressa might be linked to its geographical molecular diversity, because the specimens come from an aquarium zoo where the populations are heterogeneous (Janse et al., 2008). Additionally, the taxonomy and morphological traits of the genus Peneroplis is yet unresolved (Langer et al., 2009; Consorti et al., 2020). Additional mitochondrial genomic data can therefore provide key insights on where to look for characteristic morphological traits in difficult taxonomic groups (Macher et al., 2021a). On the contrary, some taxa show more morphological than mitochondrial molecular variations. This is indeed the case for Amphisorus spp. that share the same unique COI sequence, but are distinguishable with the 18S fragment we sequenced. This example highlights the need to use multiple markers for robust molecular species identification. Another example is the Operculina ammonoides group, where specimens were classified in three morphological categories (i.e., O. ammonoides, O. LKI27type, O. sp1). Environmental drivers, such as hydrodynamics energy and depth, likely influenced the calcification pattern of their test, but the interaction between genetics and environmental pressures is still misunderstood (Pecheux, 1995; Oron et al., 2018).
Overall, for its decreased intragenomic variability and higher amplification success rate, the foraminiferal COI region is a great additional marker to combine with the 18S marker for molecular species identification. The same conclusion was obtained for ciliate protists (Zhao et al., 2016). The absence of several versions of this mitochondrial marker, indeed, renders its effectiveness over the ribosomal ones. The genetic code for the foraminiferal mitochondrion of the orders Miliolida and Rotaliida aligns well with translation Table 4 (Macher, personal communication), common in rhizarians (Wideman et al., 2020), but is yet unstudied in other foraminiferal groups. Since the COI marker was developed and tested mainly on Rotaliida and Miliolida specimens, complementary analyses on other foraminiferal groups, such as monothalamids, should be performed to confirm the potential of the COI marker on the whole phylum Foraminifera.
Beyond Species Identification
Metabarcoding methods have been used to identify foraminiferal community composition in water (Morard et al., 2018) and sediment samples (Frontalini et al., 2020; Li et al., 2020; Cavaliere et al., 2021). A recent study, however, unraveled extreme variations in the number of SSU rRNA gene copies in the genome of planktonic foraminifera (Milivojević et al., 2021). Additionally, metabarcoding results of the SSU rRNA do not always align well with morphospecies delimitation (Morard et al., 2016). With its multiple advantages (e.g., less intragenomic variability, consistent fragment length, higher potential for quality filtering) (Andújar et al., 2021; Antich et al., 2021), the mitochondrial marker is very promising for foraminiferal community metabarcoding. Together with previous studies, we call for cautions when using ribosomal markers in metabarcoding of protists as it likely leads to an exaggerated estimation of the number of species in environmental samples (Gribble and Anderson, 2007; Kudryavtsev and Gladkikh, 2017).
In light of our results, the foraminiferal COI set of sequences provides a great addition to the 18S reference sequence database for a more robust species identification at the molecular level. This newly discovered mitochondrial marker has great potential in molecular foraminiferal research that, we believe, will successfully support future metabarcoding projects toward environmental biomonitoring. Since this is a new marker, interpretation of metabarcoding data is still limited by the small number of available references.
Data Availability Statement
The datasets presented in this study can be found in online repositories. The names of the repository/repositories and accession number(s) can be found below: https://www.ncbi.nlm.nih.gov/genbank/, OK415028-OK415275; https://www.ncbi.nlm.nih.gov/genbank/, OK634032-OK634088; https://www.ncbi.nlm.nih.gov/, PRJNA767744.
Author Contributions
WR, OW, J-NM, EG, and AL participated in the method development. WR and JJ organized fieldwork. WR collected the samples and identified the specimens. EG and AL performed the experiment and wrote the manuscript. EG analyzed the data. WR, J-NM, and OW revised and provided feedback on the manuscript. All authors approved the final version of the manuscript.
Funding
This research was funded by the European Union’s Horizon 2020 Research and Innovation Program under the Marie Skłodowska-Curie grant agreement (4D-REEF, No 813360). Fieldwork in 2018 was supported by NWO-VIDI (#16.161.301).
Conflict of Interest
The authors declare that the research was conducted in the absence of any commercial or financial relationships that could be construed as a potential conflict of interest.
The handling editor declared a past co-authorship with one of the authors WR.
Publisher’s Note
All claims expressed in this article are solely those of the authors and do not necessarily represent those of their affiliated organizations, or those of the publisher, the editors and the reviewers. Any product that may be evaluated in this article, or claim that may be made by its manufacturer, is not guaranteed or endorsed by the publisher.
Acknowledgments
We would like to thank all persons who participated in the field campaign in 2018 for collecting the samples. We would also like to thank Elza Duijm, Frank Stokvis, and Roland Butôt for their help at the NCB lab. We would further like to thank the Indonesian authorities for providing the research visa and permits (research permit holder: WR; SIP no: 115/SIP/FRP/E5/Dit.KI/IV/2018) to conduct the research activities in the Spermonde Archipelago, in collaboration with Hasanuddin University (UNHAS, Makassar). We would like to thank the reviewers for their time and constructive input on our manuscript.
Supplementary Material
The Supplementary Material for this article can be found online at: https://www.frontiersin.org/articles/10.3389/fmars.2022.809659/full#supplementary-material
Footnotes
- ^ www.geneious.com
- ^ https://blast.ncbi.nlm.nih.gov/Blast.cgi
- ^ https://bioinfo.mnhn.fr/abi/public/asap/
References
Amaral-Zettler, L. A., McCliment, E. A., Ducklow, H. W., and Huse, S. M. (2009). A method for studying protistan diversity using massively parallel sequencing of V9 hypervariable regions of small-subunit ribosomal RNA genes. PLoS One 4:e6372. doi: 10.1371/journal.pone.0006372
Andújar, C., Creedy, T. J., Arribas, P., López, H., Salces-Castellano, A., Pérez-Delgado, A. J., et al. (2021). Validated removal of nuclear pseudogenes and sequencing artefacts from mitochondrial metabarcode data. Mol. Ecol. Resour. 21, 1772–1787. doi: 10.1111/1755-0998.13337
Antich, A., Palacin, C., Wangensteen, O. S., and Turon, X. (2021). To denoise or to cluster, that is not the question: optimizing pipelines for COI metabarcoding and metaphylogeography. BMC Bioinformatics 22:177. doi: 10.1186/s12859-021-04115-6
Bé, A. W., and Anderson, O. R. (1976). Gametogenesis in planktonic Foraminifera. Science 192, 890–892. doi: 10.1126/science.946914
Billups, K., and Schrag, D. P. (2003). Application of benthic foraminiferal Mg/Ca ratios to questions of Cenozoic climate change. Earth Planet. Sci. Lett. 209, 181–195. doi: 10.1016/S0012-821X(03)00067-0
Borrelli, C., Hou, Y., Pawlowski, J. W., Holzmann, M., Katz, M. E., Chandler, G. T., et al. (2018). Assessing SSU rDNA barcodes in Foraminifera: a case study using bolivina quadrata. J. Eukaryot. Microbiol. 65, 220–235. doi: 10.1111/jeu.12471
Burki, F., Sandin, M. M., and Jamy, M. (2021). Diversity and ecology of protists revealed by metabarcoding. Curr. Biol. 31, R1267–R1280. doi: 10.1016/j.cub.2021.07.066
Capotondi, L., Maria Borsetti, A., and Morigi, C. (1999). Foraminiferal ecozones, a high resolution proxy for the late Quaternary biochronology in the central Mediterranean Sea. Mar. Geol. 153, 253–274. doi: 10.1016/S0025-3227(98)00079-6
Cavaliere, M., Barrenechea Angeles, I., Montresor, M., Bucci, C., Brocani, L., Balassi, E., et al. (2021). Assessing the ecological quality status of the highly polluted Bagnoli area (Tyrrhenian Sea, Italy) using foraminiferal eDNA metabarcoding. Sci. Total Environ. 790:147871. doi: 10.1016/j.scitotenv.2021.147871
Conover, W. J., Johnson, M. E., and Johnson, M. M. (1981). A comparative study of tests for homogeneity of variances, with applications to the outer continental shelf bidding data. Technometrics 23, 351–361. doi: 10.1080/00401706.1981.10487680
Consorti, L., Kavazos, C. R. J., Ford, C., Smith, M., and Haig, D. W. (2020). High productivity of Peneroplis (Foraminifera) including aberrant morphotypes, in an inland thalassic salt pond at Lake Macleod, Western Australia. Mar. Micropaleontol. 160:101919. doi: 10.1016/j.marmicro.2020.101919
Decelle, J., Romac, S., Sasaki, E., Not, F., and Mahé, F. (2014). Intracellular diversity of the V4 and V9 regions of the 18S rRNA in marine protists (radiolarians) assessed by high-throughput sequencing. PLoS One 9:e104297. doi: 10.1371/journal.pone.0104297
Edgar, R. C. (2016). UNOISE2: improved error-correction for Illumina 16S and ITS amplicon sequencing. BioRxiv [Prerpint] doi: 10.1101/081257
Edgar, R. C., and Flyvbjerg, H. (2015). Error filtering, pair assembly and error correction for next-generation sequencing reads. Bioinformatics 31, 3476–3482. doi: 10.1093/bioinformatics/btv401
Ertan, K. T., Hemleben, V., and Hemleben, C. (2004). Molecular evolution of some selected benthic Foraminifera as inferred from sequences of the small subunit ribosomal DNA. Mar. Micropaleontol. 53, 367–388. doi: 10.1016/j.marmicro.2004.08.001
Flakowski, J. (2005). Actin phylogeny of Foraminifera. J. Foraminiferal Res. 35, 93–102. doi: 10.2113/35.2.93
Fourment, M., and Gibbs, M. J. (2006). PATRISTIC: a program for calculating patristic distances and graphically comparing the components of genetic change. BMC Evol. Biol. 6:1. doi: 10.1186/1471-2148-6-1
Fox, J., and Weisberg, S. (2018). An R Companion to Applied Regression. New York, NY: SAGE Publications.
Frontalini, F., Cordier, T., Balassi, E., Armynot du Chatelet, E., Cermakova, K., Apothéloz-Perret-Gentil, L., et al. (2020). Benthic foraminiferal metabarcoding and morphology-based assessment around three offshore gas platforms: congruence and complementarity. Environ. Int. 144:106049. doi: 10.1016/j.envint.2020.106049
Girard, E. B., Estradivari, Ferse, S., Ambo-Rappe, R., Jompa, J., and Renema, W. (2022). Dynamics of large benthic foraminiferal assemblages: A tool to foreshadow reef degradation? Sci. Total Environ. 811:151396. doi: 10.1016/j.scitotenv.2021.151396
Graham, N. R., Gillespie, R. G., and Krehenwinkel, H. (2021). Towards eradicating the nuisance of numts and noise in molecular biodiversity assessment. Mol. Ecol. Resour. 21, 1755–1758. doi: 10.1111/1755-0998.13414
Gribble, K. E., and Anderson, D. M. (2007). High intraindividual, intraspecific, and interspecific variability in large-subunit ribosomal DNA in the heterotrophic dinoflagellates Protoperidinium, Diplopsalis, and Preperidinium (Dinophyceae). Phycologia 46, 315–324. doi: 10.2216/06-68.1
Guillou, L., Bachar, D., Audic, S., Bass, D., Berney, C., Bittner, L., et al. (2013). The Protist Ribosomal Reference database (PR2): a catalog of unicellular eukaryote small sub-unit rRNA sequences with curated taxonomy. Nucleic Acids Res. 41, D597–D604. doi: 10.1093/nar/gks1160
Hallock, P., Lidz, B. H., Cockey-Burkhard, E. M., and Donnelly, K. B. (2003). Foraminifera as bioindicators in coral reef assessment and monitoring: the FoRAM Index. Environ. Monit. Assess. 81, 221–238. doi: 10.1023/A:1021337310386
Hebert, P. D. N., Cywinska, A., Ball, S. L., and deWaard, J. R. (2003). Biological identifications through DNA barcodes. Proc. Biol. Sci. 270, 313–321. doi: 10.1098/rspb.2002.2218
Holzmann, M., and Pawlowski, J. (2017). An updated classification of rotaliid Foraminifera based on ribosomal DNA phylogeny. Mar. Micropaleontol. 132, 18–34. doi: 10.1016/j.marmicro.2017.04.002
Holzmann, M., Habura, A., Giles, H., Bowser, S. S., and Pawlowski, J. (2003). Freshwater foraminiferans revealed by analysis of environmental DNA samples. J. Eukaryot. Microbiol. 50, 135–139. doi: 10.1111/j.1550-7408.2003.tb00248.x
Janse, M., Wensing, J., Gieling, H., and de Jongh, T. (2008). “Ecological management of a large coral reef eco-display at Burgers’ Zoo, Arnhem, The Netherlands,” in Advances in Coral Husbandry in Public Aquariums Public Aquarium Husbandry Series, eds R. J. Leewis and M. Janse (Arnhem: Burgers’ Zoo), 293–303.
Katoh, K., and Standley, D. M. (2013). MAFFT multiple sequence alignment software version 7: improvements in performance and usability. Mol. Biol. Evol. 30, 772–780. doi: 10.1093/molbev/mst010
Keeling, P. J., and Palmer, J. D. (2008). Horizontal gene transfer in eukaryotic evolution. Nat. Rev. Genet. 9, 605–618. doi: 10.1038/nrg2386
Kudryavtsev, A., and Gladkikh, A. (2017). Two new species of Ripella (Amoebozoa, Vannellida) and unusual intragenomic variability in the SSU rRNA gene of this genus. Eur. J. Protistol. 61, 92–106. doi: 10.1016/j.ejop.2017.09.003
Langer, M. R., Makled, W. A., Pietsch, S. J., and Weinmann, A. (2009). Asynchronous calcification in juvenile megalospheres: an ontogenetic window into the life cycle and polymorphism of Peneroplis. J. Foraminiferal Res. 39, 8–14. doi: 10.2113/gsjfr.39.1.8
Lee, J. J., McEnery, M. E., Kahn, E. G., and Schuster, F. L. (1979). Symbiosis and the evolution of larger Foraminifera. Micropaleontology 25, 118–140. doi: 10.2307/1485262
Leray, M., Yang, J. Y., Meyer, C. P., Mills, S. C., Agudelo, N., Ranwez, V., et al. (2013). A new versatile primer set targeting a short fragment of the mitochondrial COI region for metabarcoding metazoan diversity: application for characterizing coral reef fish gut contents. Front. Zool. 10:34. doi: 10.1186/1742-9994-10-34
Li, Q., Lei, Y., Morard, R., Li, T., and Wang, B. (2020). Diversity hotspot and unique community structure of Foraminifera in the world’s deepest marine blue hole - Sansha Yongle Blue Hole. Sci. Rep. 10:10257. doi: 10.1038/s41598-020-67221-0
Lohr, J. N., Laforsch, C., Koerner, H., and Wolinska, J. (2010). A Daphnia parasite (Caullerya mesnili) constitutes a new member of the Ichthyosporea, a group of protists near the animal-fungi divergence. J. Eukaryot. Microbiol. 57, 328–336. doi: 10.1111/j.1550-7408.2010.00479.x
Macher, J.-N., Wideman, J. G., Girard, E. B., Langerak, A., Duijm, E., Jompa, J., et al. (2021b). First report of mitochondrial COI in Foraminifera and implications for DNA barcoding. Sci. Rep. 11:22165. doi: 10.1038/s41598-021-01589-5
Macher, J.-N., Prazeres, M., Taudien, S., Jompa, J., Sadekov, A., and Renema, W. (2021a). Integrating morphology and metagenomics to understand taxonomic variability of Amphisorus (Foraminifera, Miliolida) from Western Australia and Indonesia. PLoS One 16:e0244616. doi: 10.1371/journal.pone.0244616
Magoè, T., and Salzberg, S. L. (2011). FLASH: fast length adjustment of short reads to improve genome assemblies. Bioinformatics 27, 2957–2963. doi: 10.1093/bioinformatics/btr507
Majewski, W., Bowser, S. S., and Pawlowski, J. (2015). Widespread intra-specific genetic homogeneity of coastal Antarctic benthic Foraminifera. Polar Biol. 38, 2047–2058. doi: 10.1007/s00300-015-1765-1
Martin, M. (2011). Cutadapt removes adapter sequences from high-throughput sequencing reads. EMBnet J. 17, 10–12. doi: 10.14806/ej.17.1.200
Meusnier, I., Singer, G. A. C., Landry, J.-F., Hickey, D. A., Hebert, P. D. N., and Hajibabaei, M. (2008). A universal DNA mini-barcode for biodiversity analysis. BMC Genomics 9:214. doi: 10.1186/1471-2164-9-214
Milivojević, T., Rahman, S. N., Raposo, D., Siccha, M., Kucera, M., and Morard, R. (2021). High variability in SSU rDNA gene copy number among planktonic Foraminifera revealed by single-cell qPCR. ISME Communications 1:63. doi: 10.1038/s43705-021-00067-3
Morard, R., Darling, K. F., Mahé, F., Audic, S., Ujiié, Y., Weiner, A. K. M., et al. (2015). PFR2: a curated database of planktonic Foraminifera 18S ribosomal DNA as a resource for studies of plankton ecology, biogeography and evolution. Mol. Ecol. Resour. 15, 1472–1485. doi: 10.1111/1755-0998.12410
Morard, R., Escarguel, G., Weiner, A. K. M., André, A., Douady, C. J., Wade, C. M., et al. (2016). Nomenclature for the nameless: a proposal for an integrative molecular taxonomy of cryptic diversity exemplified by planktonic Foraminifera. Syst. Biol. 65, 925–940. doi: 10.1093/sysbio/syw031
Morard, R., Garet-Delmas, M.-J., Mahé, F., Romac, S., Poulain, J., Kucera, M., et al. (2018). Surface ocean metabarcoding confirms limited diversity in planktonic Foraminifera but reveals unknown hyper-abundant lineages. Sci. Rep. 8:2539. doi: 10.1038/s41598-018-20833-z
Nassonova, E., Smirnov, A., Fahrni, J., and Pawlowski, J. (2010). Barcoding amoebae: comparison of SSU, ITS and COI genes as tools for molecular identification of naked lobose amoebae. Protist 161, 102–115. doi: 10.1016/j.protis.2009.07.003
Oksanen, J., Kindt, R., Legendre, P., O’Hara, B., Stevens, M. H. H., Oksanen, M. J., et al. (2007). The Vegan Package. Available online at: https://cran.r-project.org/web/packages/vegan/index.html (accessed August 1, 2021).
Oliver, L. M., Fisher, W. S., Dittmar, J., Hallock, P., Campbell, J., Quarles, R. L., et al. (2014). Contrasting responses of coral reef fauna and foraminiferal assemblages to human influence in La Parguera, Puerto Rico. Mar. Environ. Res. 99, 95–105. doi: 10.1016/j.marenvres.2014.04.005
Oron, S., Abramovich, S., Almogi-Labin, A., Woeger, J., and Erez, J. (2018). Depth related adaptations in symbiont bearing benthic Foraminifera: new insights from a field experiment on Operculina ammonoides. Sci. Rep. 8:11175. doi: 10.1038/s41598-018-27838-8
Orsi, W. D., Morard, R., Vuillemin, A., Eitel, M., Wörheide, G., Milucka, J., et al. (2020). Anaerobic metabolism of Foraminifera thriving below the seafloor. ISME. J. 14, 2580–2594. doi: 10.1038/s41396-020-0708-1
Parfrey, L. W., and Katz, L. A. (2010). Dynamic genomes of eukaryotes and the maintenance of genomic integrity. Microbe Magazine 5:156.
Pawłowska, J., Wollenburg, J. E., Zajączkowski, M., and Pawlowski, J. (2020). Planktonic Foraminifera genomic variations reflect paleoceanographic changes in the Arctic: evidence from sedimentary ancient DNA. Sci. Rep. 10:15102. doi: 10.1038/s41598-020-72146-9
Pawlowski, J., and Holzmann, M. (2002). Molecular phylogeny of Foraminifera a review. Eur. J. Protistol. 38, 1–10. doi: 10.1078/0932-4739-00857
Pawlowski, J., and Holzmann, M. (2009). “Diversity and geographic distribution of benthic Foraminifera: a molecular perspective,” in Protist Diversity and Geographical Distribution, eds W. Foissner and D. L. Hawksworth (Dordrecht: Springer Netherlands), 83–94. doi: 10.1007/978-90-481-2801-3_7
Pawlowski, J., Audic, S., Adl, S., Bass, D., Belbahri, L., Berney, C., et al. (2012). CBOL protist working group: barcoding eukaryotic richness beyond the animal, plant, and fungal kingdoms. PLoS Biol. 10:e1001419. doi: 10.1371/journal.pbio.1001419
Pawlowski, J., Bolivar, I., Fahrni, J., and Zaninetti, L. (1994). Taxonomic identification of Foraminifera using ribosomal DNA sequences. Micropaleontology 40, 373–377.
Pawlowski, J., Lejzerowicz, F., Apotheloz-Perret-Gentil, L., Visco, J., and Esling, P. (2016). Protist metabarcoding and environmental biomonitoring: time for change. Eur. J. Protistol. 55, 12–25. doi: 10.1016/j.ejop.2016.02.003
Pecheux, M. J.-F. (1995). Ecomorphology of a recent largeforaminifer, Operculina ammonoides. Geobios Mem. Spec. 28, 529–566. doi: 10.1016/S0016-6995(95)80209-6
Pillet, L., and Pawlowski, J. (2013). Transcriptome analysis of foraminiferan Elphidium margaritaceum questions the role of gene transfer in kleptoplastidy. Mol. Biol. Evol. 30, 66–69. doi: 10.1093/molbev/mss226
Pillet, L., Fontaine, D., and Pawlowski, J. (2012). Intra-genomic ribosomal RNA polymorphism and morphological variation in Elphidium macellum suggests inter-specific hybridization in Foraminifera. PLoS One 7:e32373. doi: 10.1371/journal.pone.0032373
Prazeres, M., and Renema, W. (2019). Evolutionary significance of the microbial assemblages of large benthic Foraminifera. Biol. Rev. Camb. Philos. Soc. 94, 828–848. doi: 10.1111/brv.12482
Puillandre, N., Brouillet, S., and Achaz, G. (2021). ASAP: assemble species by automatic partitioning. Mol. Ecol. Resour. 21, 609–620. doi: 10.1111/1755-0998.13281
Purty, R. S., and Chatterjee, S. (2016). DNA barcoding: an effective technique in molecular taxonomy. Austin J. Biotechnol. Bioeng. 3:1059.
R Core Team (2020). R: A Language and Environment for Statistical Computing. Vienna: R Foundation for Statistical Computing.
Renema, W. (2018). Terrestrial influence as a key driver of spatial variability in large benthic foraminiferal assemblage composition in the Central Indo-Pacific. Earth Sci. Rev. 177, 514–544. doi: 10.1016/j.earscirev.2017.12.013
Schmieder, R., and Edwards, R. (2011). Quality control and preprocessing of metagenomic datasets. Bioinformatics 27, 863–864. doi: 10.1093/bioinformatics/btr026
Schultz, J., and Hebert, P. (2021). Do pseudogenes pose a problem for metabarcoding marine animal communities? Authorea [Preprints] doi: 10.22541/au.163277441.14875855/v1
Sierra, R., Matz, M. V., Aglyamova, G., Pillet, L., Decelle, J., Not, F., et al. (2013). Deep relationships of Rhizaria revealed by phylogenomics: a farewell to Haeckel’s Radiolaria. Mol. Phylogenet. Evol. 67, 53–59. doi: 10.1016/j.ympev.2012.12.011
Takishita, K., Inagaki, Y., Tsuchiya, M., Sakaguchi, M., and Maruyama, T. (2005). A close relationship between Cercozoa and Foraminifera supported by phylogenetic analyses based on combined amino acid sequences of three cytoskeletal proteins (actin, alpha-tubulin, and beta-tubulin). Gene 362, 153–160. doi: 10.1016/j.gene.2005.08.013
Thornhill, D. J., Lajeunesse, T. C., and Santos, S. R. (2007). Measuring rDNA diversity in eukaryotic microbial systems: how intragenomic variation, pseudogenes, and PCR artifacts confound biodiversity estimates. Mol. Ecol. 16, 5326–5340. doi: 10.1111/j.1365-294X.2007.03576.x
Trifinopoulos, J., Nguyen, L.-T., von Haeseler, A., and Minh, B. Q. (2016). W-IQ-TREE: a fast online phylogenetic tool for maximum likelihood analysis. Nucleic Acids Res. 44, W232–W235. doi: 10.1093/nar/gkw256
Ueno, K., Ha, T. T. N., and Iryu, Y. (2019). Foraminiferal biochronology of the triassic hoang mai formation, central vietnam. J. Foraminiferal Res. 49, 339–354. doi: 10.2113/gsjfr.49.3.339
van der Loos, L. M., and Nijland, R. (2021) Biases in bulk: DNA metabarcoding of marine communities and the methodology involved. Mol Ecol. 30, 3270–3288. doi: 10.1111/mec.15592
Van Etten, J., and Bhattacharya, D. (2020). Horizontal gene transfer in eukaryotes: not if, but how much? Trends Genet. 36, 915–925. doi: 10.1016/j.tig.2020.08.006
Wangensteen, O. S., and Turon, X. (2017). “Metabarcoding Techniques for assessing biodiversity of marine animal forests,” in Marine Animal Forests: The Ecology of Benthic Biodiversity Hotspots, eds S. Rossi, L. Bramanti, A. Gori, and C. Orejas Saco del Valle (Cham: Springer International Publishing), 445–473. doi: 10.1007/978-3-319-21012-4_53
Weber, A. A.-T., and Pawlowski, J. (2014). Wide occurrence of SSU rDNA intragenomic polymorphism in Foraminifera and its implications for molecular species identification. Protist 165, 645–661. doi: 10.1016/j.protis.2014.07.006
Weiner, A. K. M., Morard, R., Weinkauf, M. F. G., Darling, K. F., André, A., Quillévéré, F., et al. (2016). Methodology for single-cell genetic analysis of planktonic Foraminifera for studies of protist diversity and evolution. Front. Mar. Sci. 3:255. doi: 10.3389/fmars.2016.00255
Wideman, J. G., Monier, A., Rodríguez-Martínez, R., Leonard, G., Cook, E., Poirier, C., et al. (2020). Unexpected mitochondrial genome diversity revealed by targeted single-cell genomics of heterotrophic flagellated protists. Nat. Microbiol. 5, 154–165. doi: 10.1038/s41564-019-0605-4
Yeo, D., Srivathsan, A., and Meier, R. (2020). Longer is not always better: optimizing barcode length for large-scale species discovery and identification. Syst. Biol. 69, 999–1015. doi: 10.1093/sysbio/syaa014
Zhao, F., Filker, S., Xu, K., Li, J., Zhou, T., and Huang, P. (2019). Effects of intragenomic polymorphism in the SSU rRNA gene on estimating marine microeukaryotic diversity: a test for ciliates using single-cell high-throughput DNA sequencing. Limnol. Oceanogr. Methods 17, 533–543. doi: 10.1002/lom3.10330
Zhao, Y., Yi, Z., Gentekaki, E., Zhan, A., Al-Farraj, S. A., and Song, W. (2016). Utility of combining morphological characters, nuclear and mitochondrial genes: an attempt to resolve the conflicts of species identification for ciliated protists. Mol. Phylogenet. Evol. 94, 718–729. doi: 10.1016/j.ympev.2015.10.017
Keywords: protist, high-throughput sequencing, metabarcoding, intra-genomic variation, benthic foraminifera
Citation: Girard EB, Langerak A, Jompa J, Wangensteen OS, Macher J-N and Renema W (2022) Mitochondrial Cytochrome Oxidase Subunit 1: A Promising Molecular Marker for Species Identification in Foraminifera. Front. Mar. Sci. 9:809659. doi: 10.3389/fmars.2022.809659
Received: 05 November 2021; Accepted: 10 January 2022;
Published: 02 February 2022.
Edited by:
Raphael Morard, University of Bremen, GermanyReviewed by:
Alexandra Anh-Thu Weber, Institut Français de Recherche pour l’Exploitation de la Mer (IFREMER), FranceMattia Greco, Institute of Oceanology, Polish Academy of Sciences (PAN), Poland
Agnes Katharina Maria Weiner, Smith College, United States
Copyright © 2022 Girard, Langerak, Jompa, Wangensteen, Macher and Renema. This is an open-access article distributed under the terms of the Creative Commons Attribution License (CC BY). The use, distribution or reproduction in other forums is permitted, provided the original author(s) and the copyright owner(s) are credited and that the original publication in this journal is cited, in accordance with accepted academic practice. No use, distribution or reproduction is permitted which does not comply with these terms.
*Correspondence: Elsa B. Girard, ZWxzYS5naXJhcmRAbmF0dXJhbGlzLm5s