 Jiwon Kang1,2
 Hanna Na2,3*
- 1Korea Institute of Ocean Science and Technology, Busan, South Korea
- 2School of Earth and Environmental Sciences, Seoul National University, Seoul, South Korea
- 3Research Institute of Oceanography, Seoul National University, Seoul, South Korea
The strong variability of the Kuroshio northeast of Taiwan is associated with changes in the strength of the Kuroshio shelf intrusion (KSI) in the East China Sea (ECS), which is a westward shift in the Kuroshio toward the shelf region. The KSI contributes to the exchange of different water masses between the shelf and the western boundary current regions, and plays a key role in ecosystem and climate regulation in the ECS and the downstream East Asian Marginal Seas. This study investigates the long-term variability of the KSI northeast of Taiwan during 1993–2018 and examines its relationship to the current and temperature variability in the ECS using a high-resolution ocean reanalysis dataset. The KSI was notably strengthened in 2000–2001, 2005, and 2009. It showed stronger interannual variability during the 2000s, whereas it was relatively stable in the 1990s and the 2010s. The strengthening of the KSI is accompanied by a westward shift of the Kuroshio axis, extending along its downstream path in the ECS. The associated warming is significant at depths >∼50 m but not near the surface. The resultant weakening of the vertical stratification in the shelf region would have important implications for ecosystem variability in the ECS.
Introduction
The Kuroshio is a western boundary current in the North Pacific that flows northeastward after entering the East China Sea (ECS) through a passage east of Taiwan (Figure 1). The main axis of the Kuroshio—estimated from the zonal location of the maximum current speed at different latitudes—shows that it is generally confined to the western edge of the Okinawa Trough (Figure 1A). However, the Kuroshio often meanders northeast of Taiwan, and a westward (or onshore) shift toward the continental shelf is referred to as the Kuroshio shelf intrusion (KSI) or onshore intrusion (Tang and Yang, 1993; Chuang and Liang, 1994). The KSI induces an exchange of water and materials between the deep western boundary current region and the shallow continental shelf region, and thereby changes the hydrographic properties in the ECS (Chern et al., 1990; Chen et al., 1995; Lian et al., 2016). The KSI is also responsible for variations in regional ocean circulation, climate, and ecosystem in the ECS (Chow et al., 2015; Sassa and Konishi, 2015; Chen et al., 2016; Chen and Guo, 2020; Liu et al., 2021).
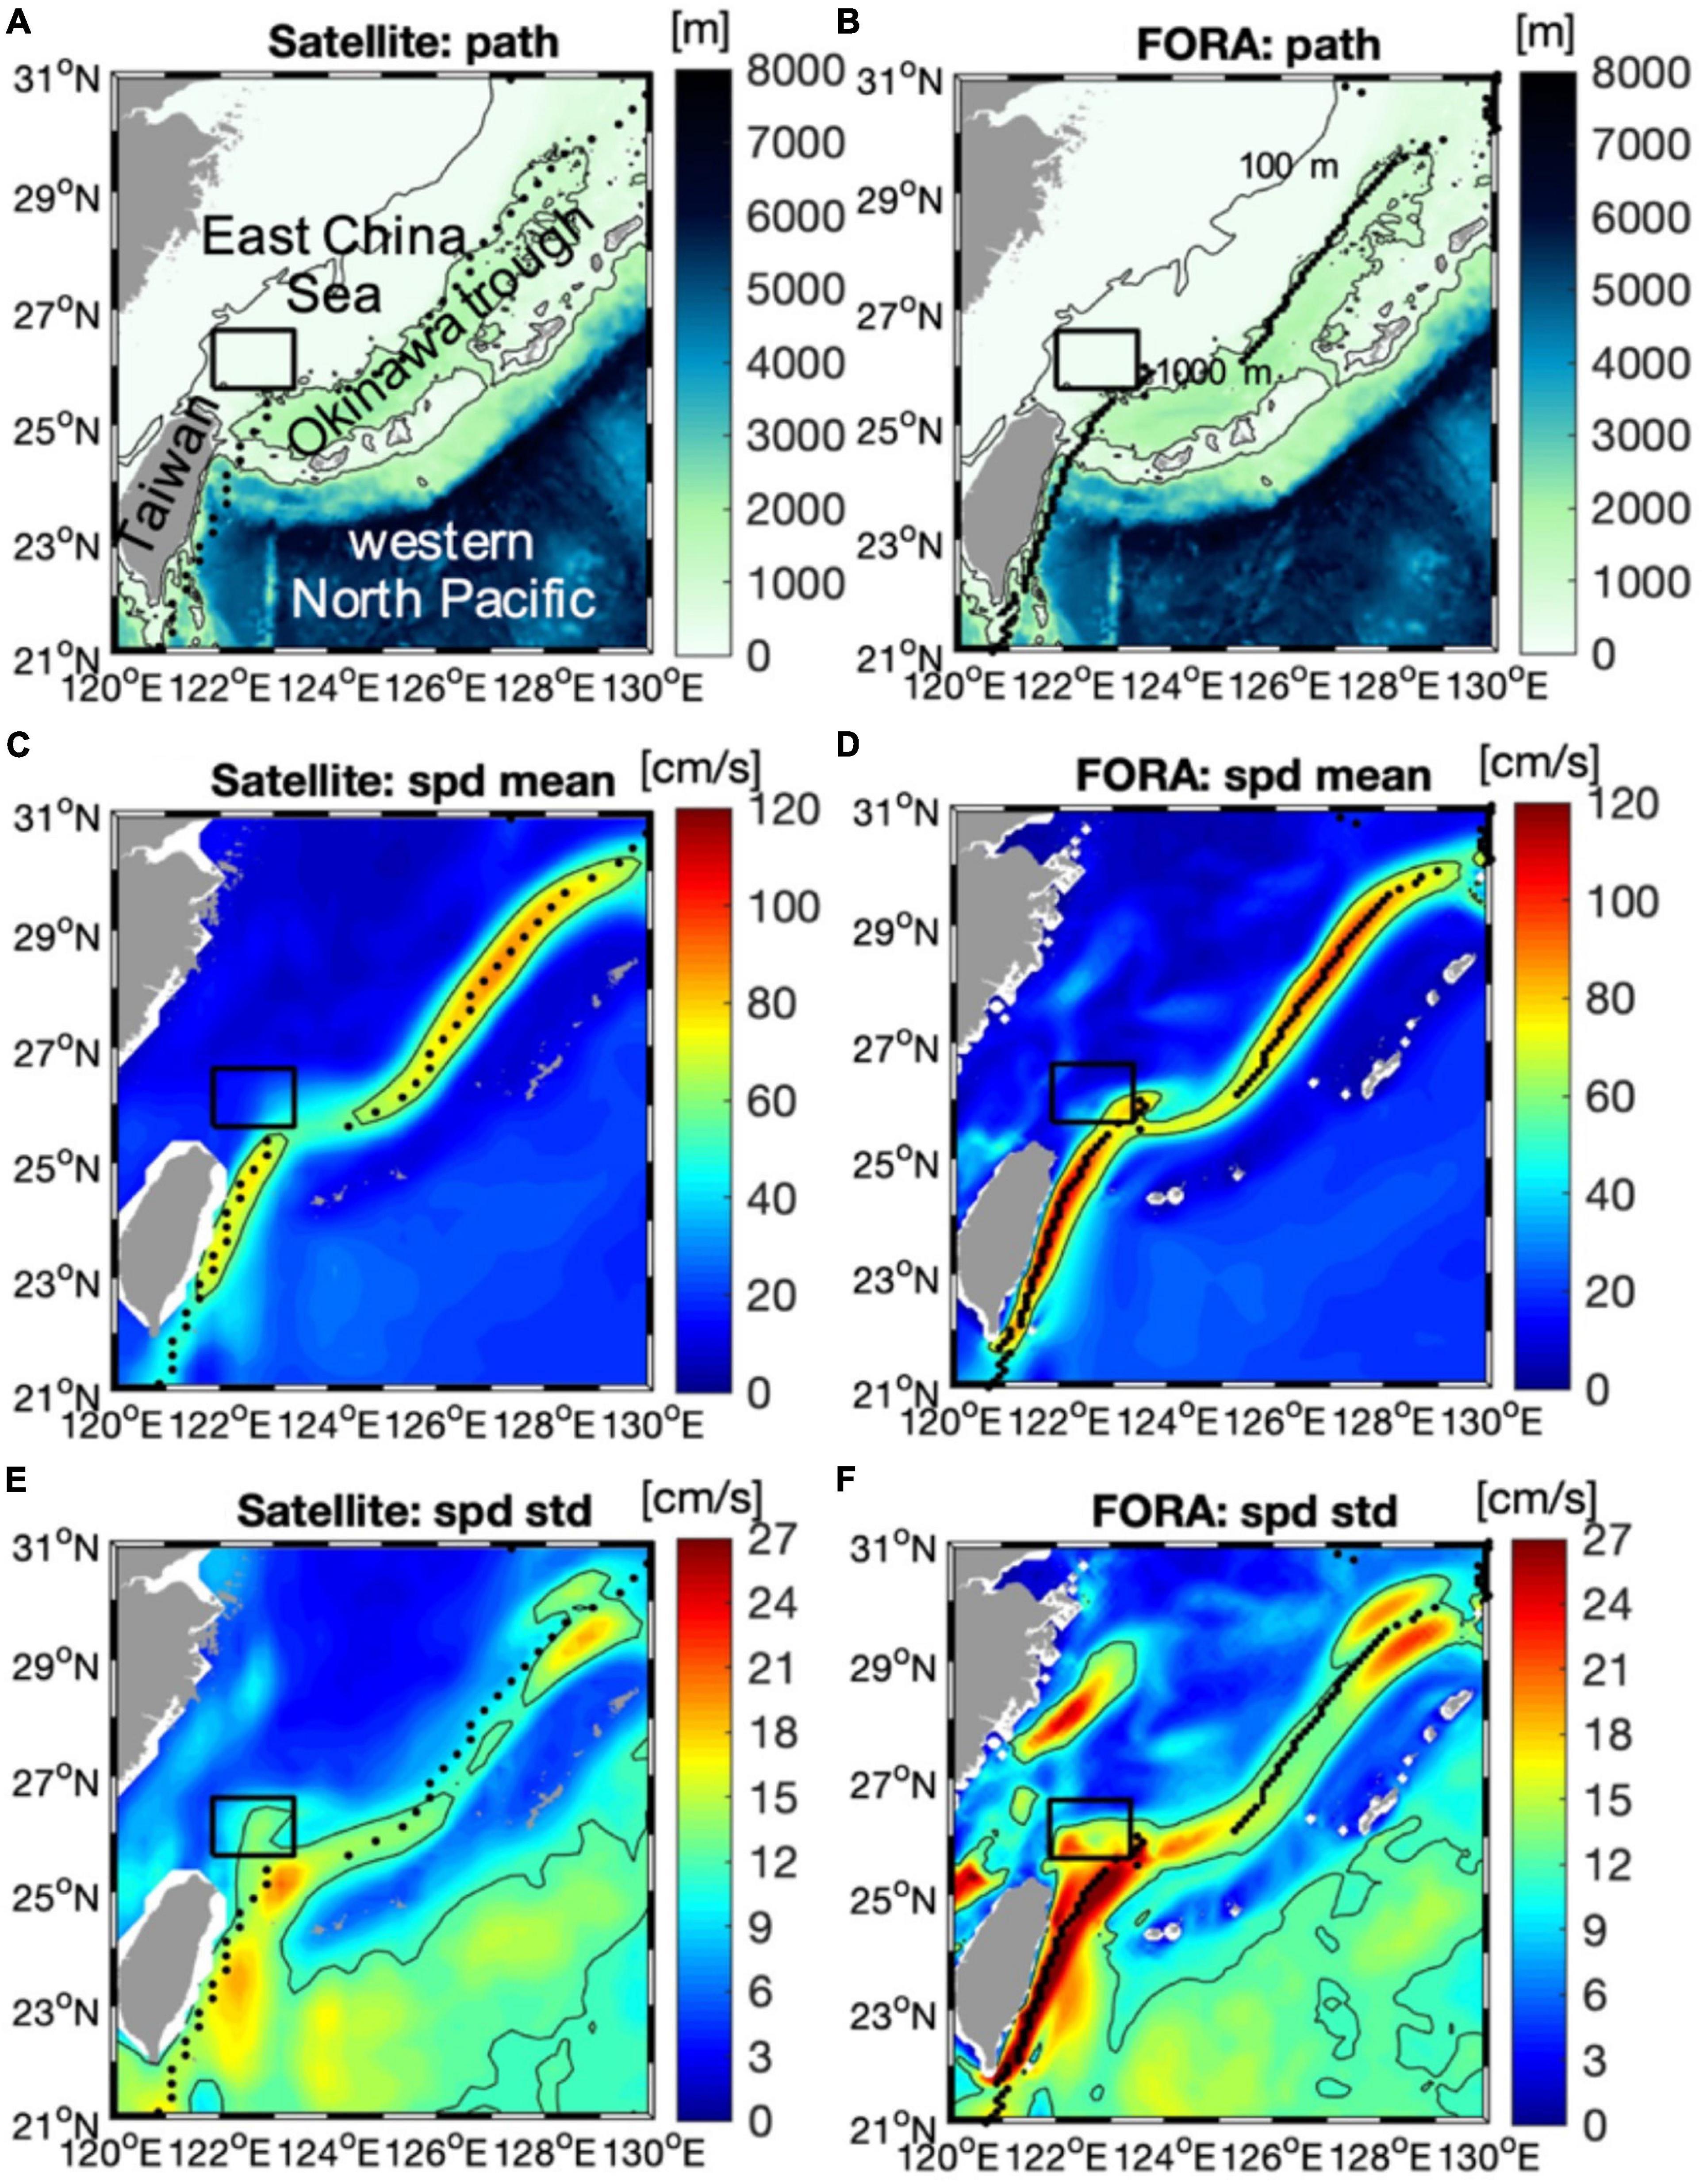
Figure 1. (A,B) Bathymetry from ETOPO2 and the mean path of the Kuroshio; (C,D) mean and (E,F) standard deviation of the surface current speed from monthly mean satellite altimetry for 1993–2018 (left) and monthly mean FORA for 1993–2014 (right). Black contours in panels (A,B) denote 100 and 1,000 m isobaths. The mean path of the Kuroshio, derived by longitudinal positions of maximum current speed at each latitude grid, is displayed as black dots. Black squares denote the Kuroshio shelf intrusion (KSI) domain, and black contours in panels (C–F) denote the 60 cm/s mean speed and the 12 cm/s standard deviation, respectively.
The KSI tends to become stronger in winter than in summer, associated with the changes in the strength of the upstream Kuroshio (Tang and Yang, 1993; Chuang and Liang, 1994; Wu et al., 2014). When the upstream Kuroshio is weak east of Taiwan, the path of the Kuroshio in the ECS shifts toward the shelf region and the KSI strengthens, whereas the path becomes relatively straight along the Okinawa Trough and the KSI weakens with the stronger upstream Kuroshio (Guo et al., 2006; Liu and Gan, 2012; Vélez-Belchí et al., 2013). The intensity of the upstream Kuroshio east of Taiwan is known to be modulated by the arrival of cyclonic and anti-cyclonic eddies from the interior of the North Pacific (Yang et al., 1999; Zhang et al., 2001; Chang and Oey, 2011; Andres et al., 2015; Jan et al., 2015); the westward propagation of the mesoscale eddies contributes strengthening or weakening of the Kuroshio, depending on characteristics of the eddies, e.g., polarity, size, location of arrival, etc. (Yan et al., 2016; Andres et al., 2017; Jan et al., 2017; Chang et al., 2018; Mensah et al., 2020). Furthermore, the relative number and intensity of cyclonic and anti-cyclonic eddies contribute to long-term variability of the upstream Kuroshio east of Taiwan (Hsin et al., 2013; Yin et al., 2019).
Recent analyzes of long-term satellite altimetry and model simulations have shown that the weakening (strengthening) of the Kuroshio and strengthening (weakening) of the KSI are related to the strengthening (weakening) of the northeasterly wind stress in the ECS (Wang and Oey, 2014; Wu et al., 2014); stronger northeasterly wind stress contributes to the weakening of the Kuroshio and strengthening of the KSI. During the strong KSI, the shelf exhibits warming, and the upward surface heat flux increase over the ECS (Liu et al., 2014; Wang and Oey, 2014). The influence of the changes in the KSI strength is observed not only in the surface, but also in the subsurface layers, which would have a significant impact on the shallow shelf region (Yang et al., 2018). The KSI-related changes in the subsurface layer have not, however, been described in detail due to a lack of three-dimensional (3-D) data with a high-resolution that is required to resolve complex topography between the shelf region and the Okinawa Trough in the ECS. Furthermore, it remains as an interesting question to be further explored, whether recent reports of intensified warming over the ECS (Toda and Watanabe, 2020) are associated with the KSI variability (i.e., resulting from changes in the heat advection by Kuroshio rather than surface warming via surface heat flux).
This study investigates the long-term (interannual to decadal) variability of the KSI northeast of Taiwan in the ECS for longer than 20 years using the Four-dimensional variational Ocean Reanalysis for the Western North Pacific over 30 years (FORA) product with the eddy-resolving (∼1/10°) resolution (Usui et al., 2017). Specifically, the present study aimed to determine (1) how the KSI variability derived from surface current velocity is linked to subsurface current variability, and (2) how the KSI variability is related to surface and subsurface temperature variability in the ECS. Long-term variability of the KSI was extracted from both satellite altimetry product and the high-resolution FORA dataset, and its relationship to upper-ocean current and temperature variability was investigated using the FORA. The resulting 3-D relationship between KSI and ocean-environmental variability help better understand the exchanges of water and materials that occur between the deep Kuroshio region (>1,000 m) and the shallow shelf region, as well as associated changes in the hydrographic properties of the ECS.
Data and Methods
Data
Sea surface height (SSH) and geostrophic velocity based on satellite altimetry were obtained from the Copernicus Marine Environment Monitoring Service1 with a spatial resolution of 0.25°. The mean Kuroshio axis derived from the zonal location of the maximum surface geostrophic current speed at each latitude generally follows 1,000-m isobaths (Figure 1A). The standard deviations of the current speed are larger to the east of the mean axis over the Okinawa Trough (Figure 1E). Three-dimensional ocean temperature and current velocity were obtained from the FORA product produced by the Japan Agency for Marine-Earth Science and Technology and Meteorological Research Institute of the Japan Meteorological Agency (Usui et al., 2017). This high-resolution (∼0.1°) reanalysis product includes 17 vertical levels in the upper 200 m, and the shallowest layer is 0.5 m. The FORA successfully reproduces the location of the mean Kuroshio axis, the zonal extent of the Kuroshio, and the location of larger temporal variability in the current speed (Figure 1), which is reasonable because the satellite altimetry was assimilated to FORA. However, FORA generally exhibits larger mean and standard deviations, mostly due to its finer spatial resolution.
Sea surface temperature data were obtained from the Optimal Interpolation Sea Surface Temperature dataset2 with a spatial resolution of 0.25°, which is produced by combining several observation platforms including satellites, ships, and buoys. Wind stress and wind stress curl were calculated using 10-m wind data from the Cross-Calibrated Multi-Platform version 2.0,3 which is reconstructed from satellites, moored buoys, and modeling outputs. In addition, surface heat flux data were obtained from the Objectively Analyzed air-sea Fluxes (OAFlux) project4 with a spatial resolution of 1°. Turbulent heat flux data were calculated as the sum of the sensible and latent heat fluxes, and the surface heat flux refers to the turbulent heat flux in this study. The Pacific Decadal Oscillation (PDO) index was obtained from the National Centers for Environmental Information of NOAA,5 and the Niño3.4 index was obtained from the NCAR Climate Data Guide.6 All data were either obtained as monthly means or averaged monthly, to focus on their long-term variability in the ECS. The analysis period was from 1993 to 2018 (26 years), except for the FORA dataset available until 2014.
Cyclostationary Empirical Orthogonal Function Analysis
The oceanic and atmospheric data in the ECS were analyzed using the CSEOF technique (Kim et al., 1996; Kim and North, 1997). The CSEOF technique decomposes each variable at each vertical level, Data(r,t), into cyclostationary loading vectors (CSLVs), Cn(r,t), which illustrate the spatio-temporal evolution of the nth mode and their corresponding principal component (PC) time series, Pn(t), as follows:
where n, r, and t denote the mode number, 2-D space, and time, respectively. CSLVs are periodic with the nested period, d, which was set to 12 months, such that each nth mode, Cn(r,t), consists of 12 monthly spatial patterns, thus:
The derived spatial patterns in this study represent the means of the 12 monthly patterns, as this study focuses on the long-term variability.
The CSEOF technique was applied to the monthly surface current speed of the KSI domain northeast of Taiwan, where the standard deviation of the current speed exhibits larger values over the shelf region (to the west of the mean Kuroshio axis) (Figure 1E). The first mode denotes the seasonal cycle that represents an increase of the current speed during winter and a decrease during summer, and the mean of the 12 monthly patterns is close to zero (not shown). The most dominant mode aside from the seasonal variation represents the long-term variability of the KSI strength, and was defined as the KSI strength mode, K(r,t) and K_index(t). Details of the KSI strength mode are presented in section “Relationship Between the Kuroshio Shelf Intrusion Strength Mode and Surface Variability in the East China Sea.”
Regression Analysis
The relationships between the KSI strength mode and the oceanic and atmospheric variables in the ECS was examined by applying regression analysis in the CSEOF space, as follows:
where K_index(t) is the target time series (the PC time series of the KSI strength mode) and Pm(t) is the predictor PC time series for mode m of oceanic and atmospheric variables in the ECS. Note that the CSEOF analysis was conducted on each variable at each layer, thus employing the PC time series for the multiple regression in Equation (3). The regression analysis in the CSEOF space finds common long-term undulations between the target KSI strength mode and each predictor variable at each depth. The R-squared values of the regression are presented in Figure 2. Regressed anomalies of the predictor variables were then obtained using regression coefficients, as follows:
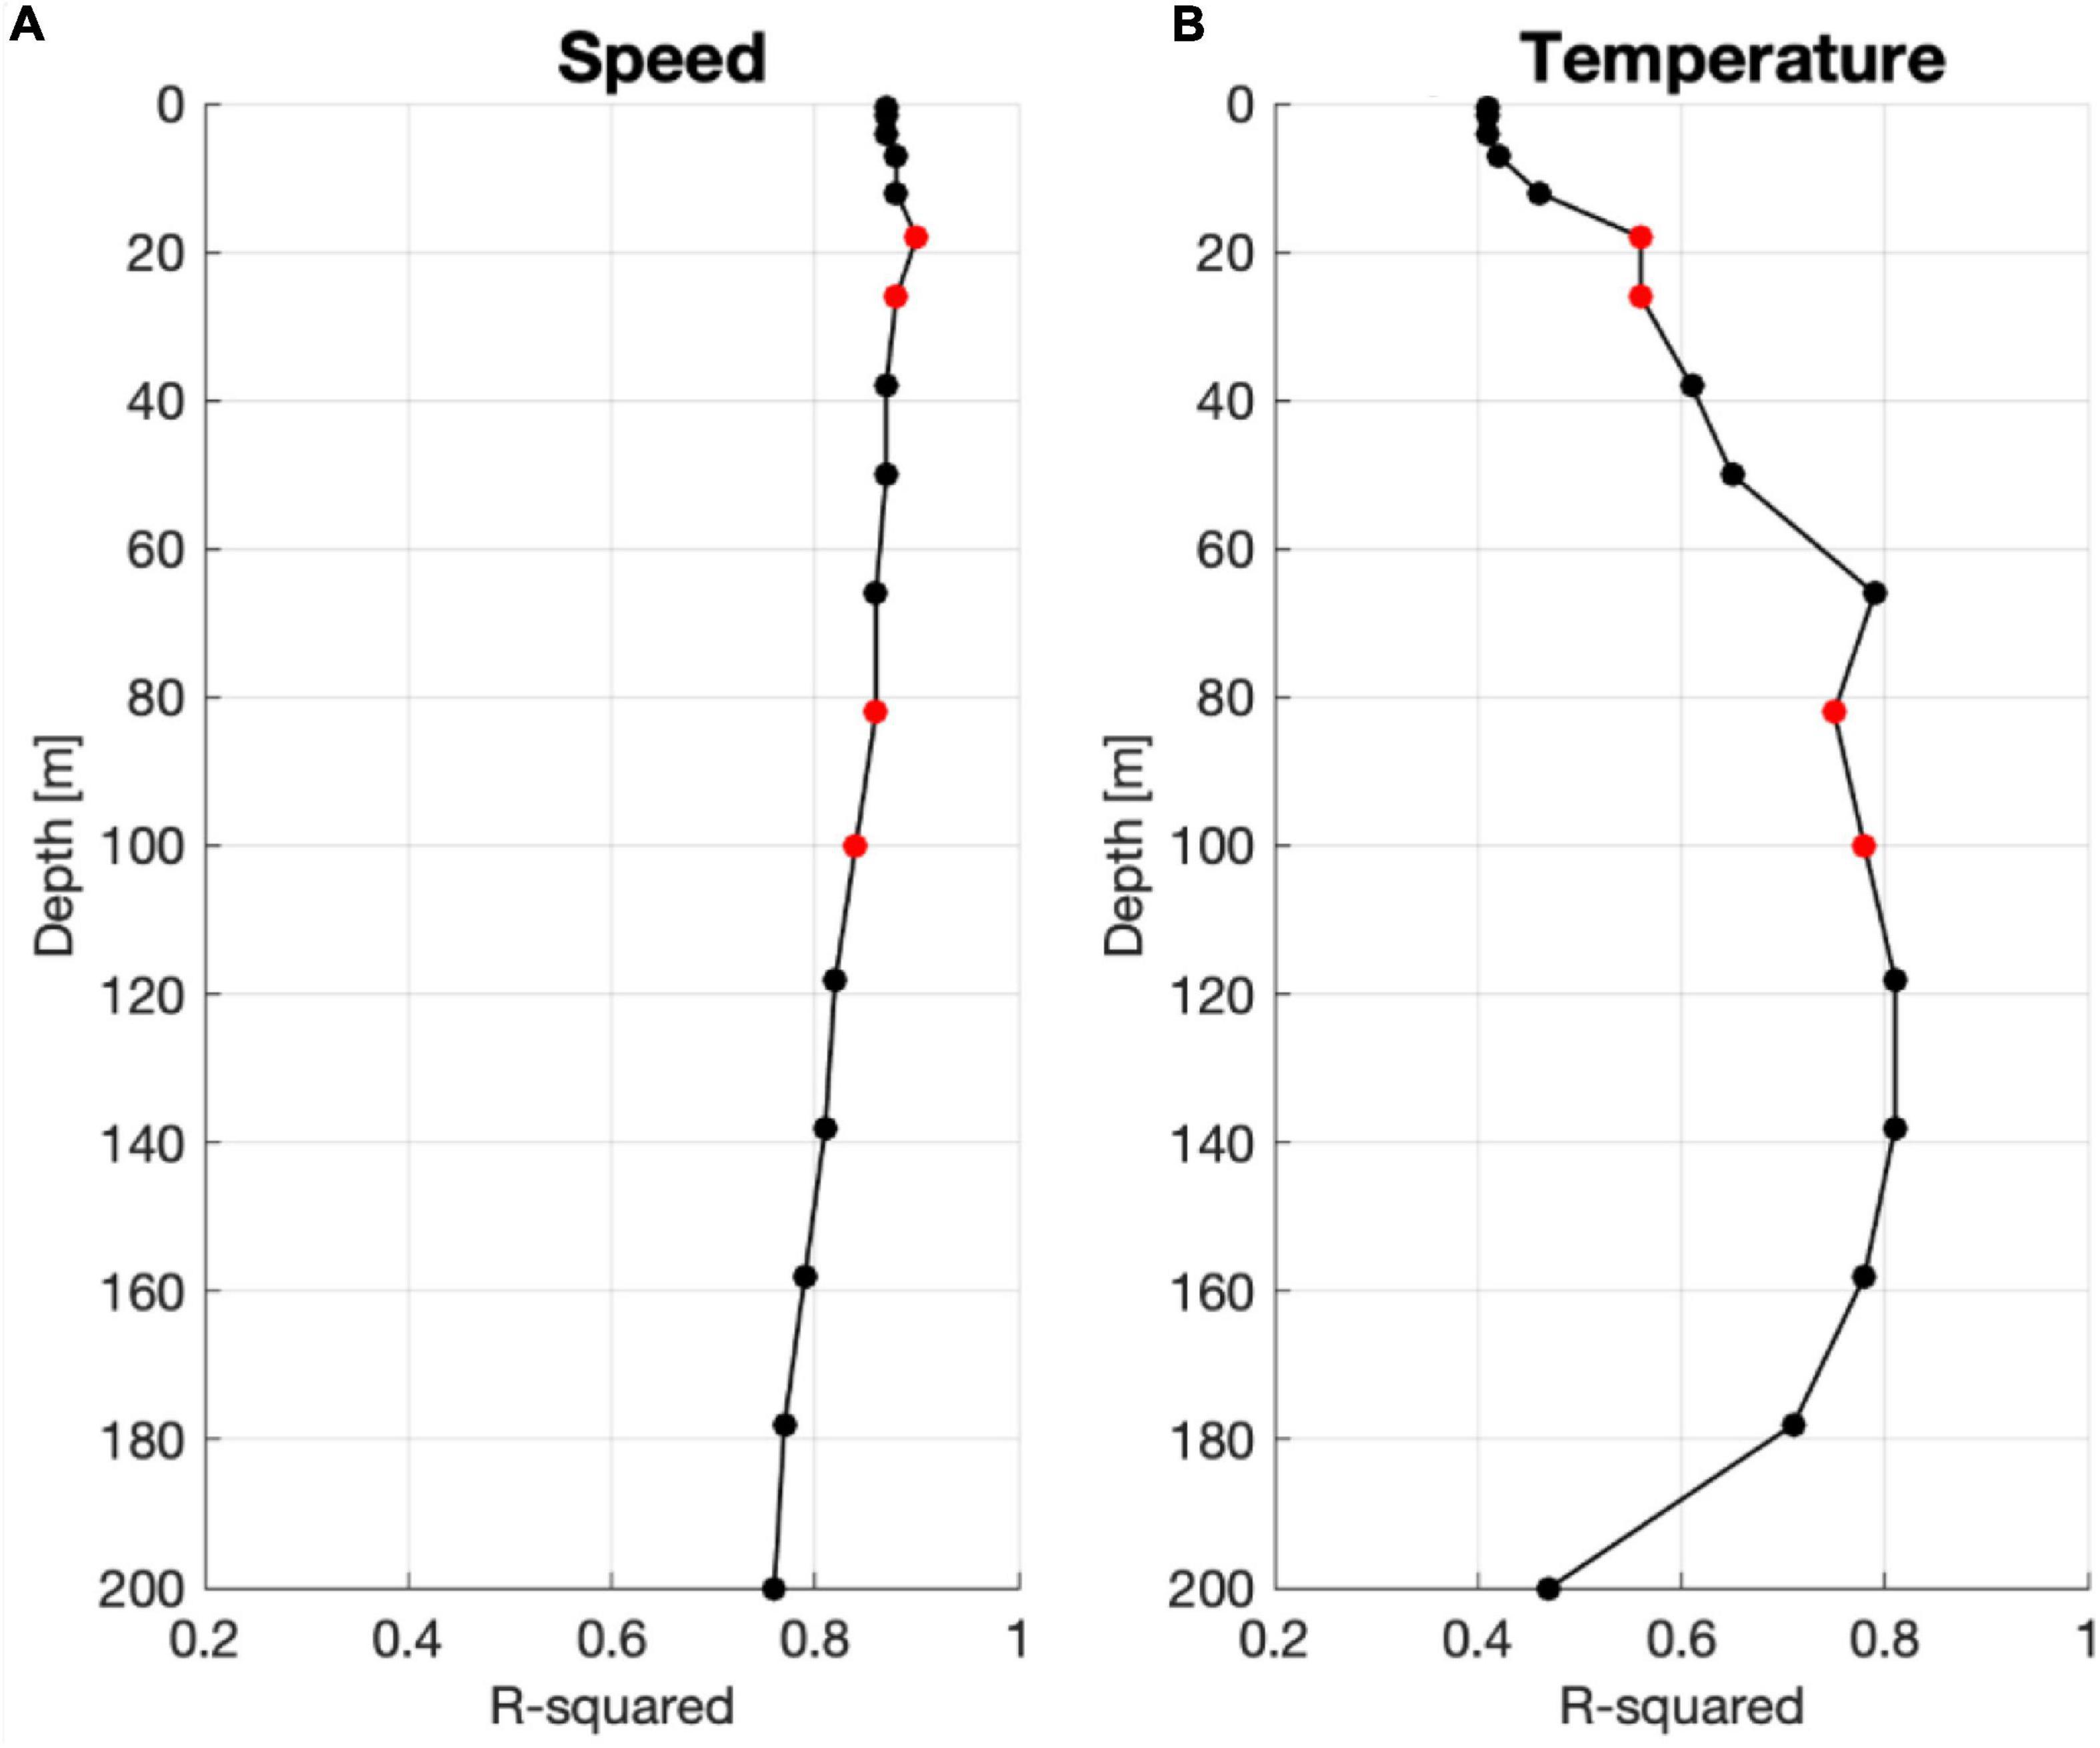
Figure 2. R-squared values of the regression analysis of (A) speed and (B) temperature at each depth targeting the KSI strength mode from FORA. Regression anomalies at the depths with red dots are presented in Figures 5, 6.
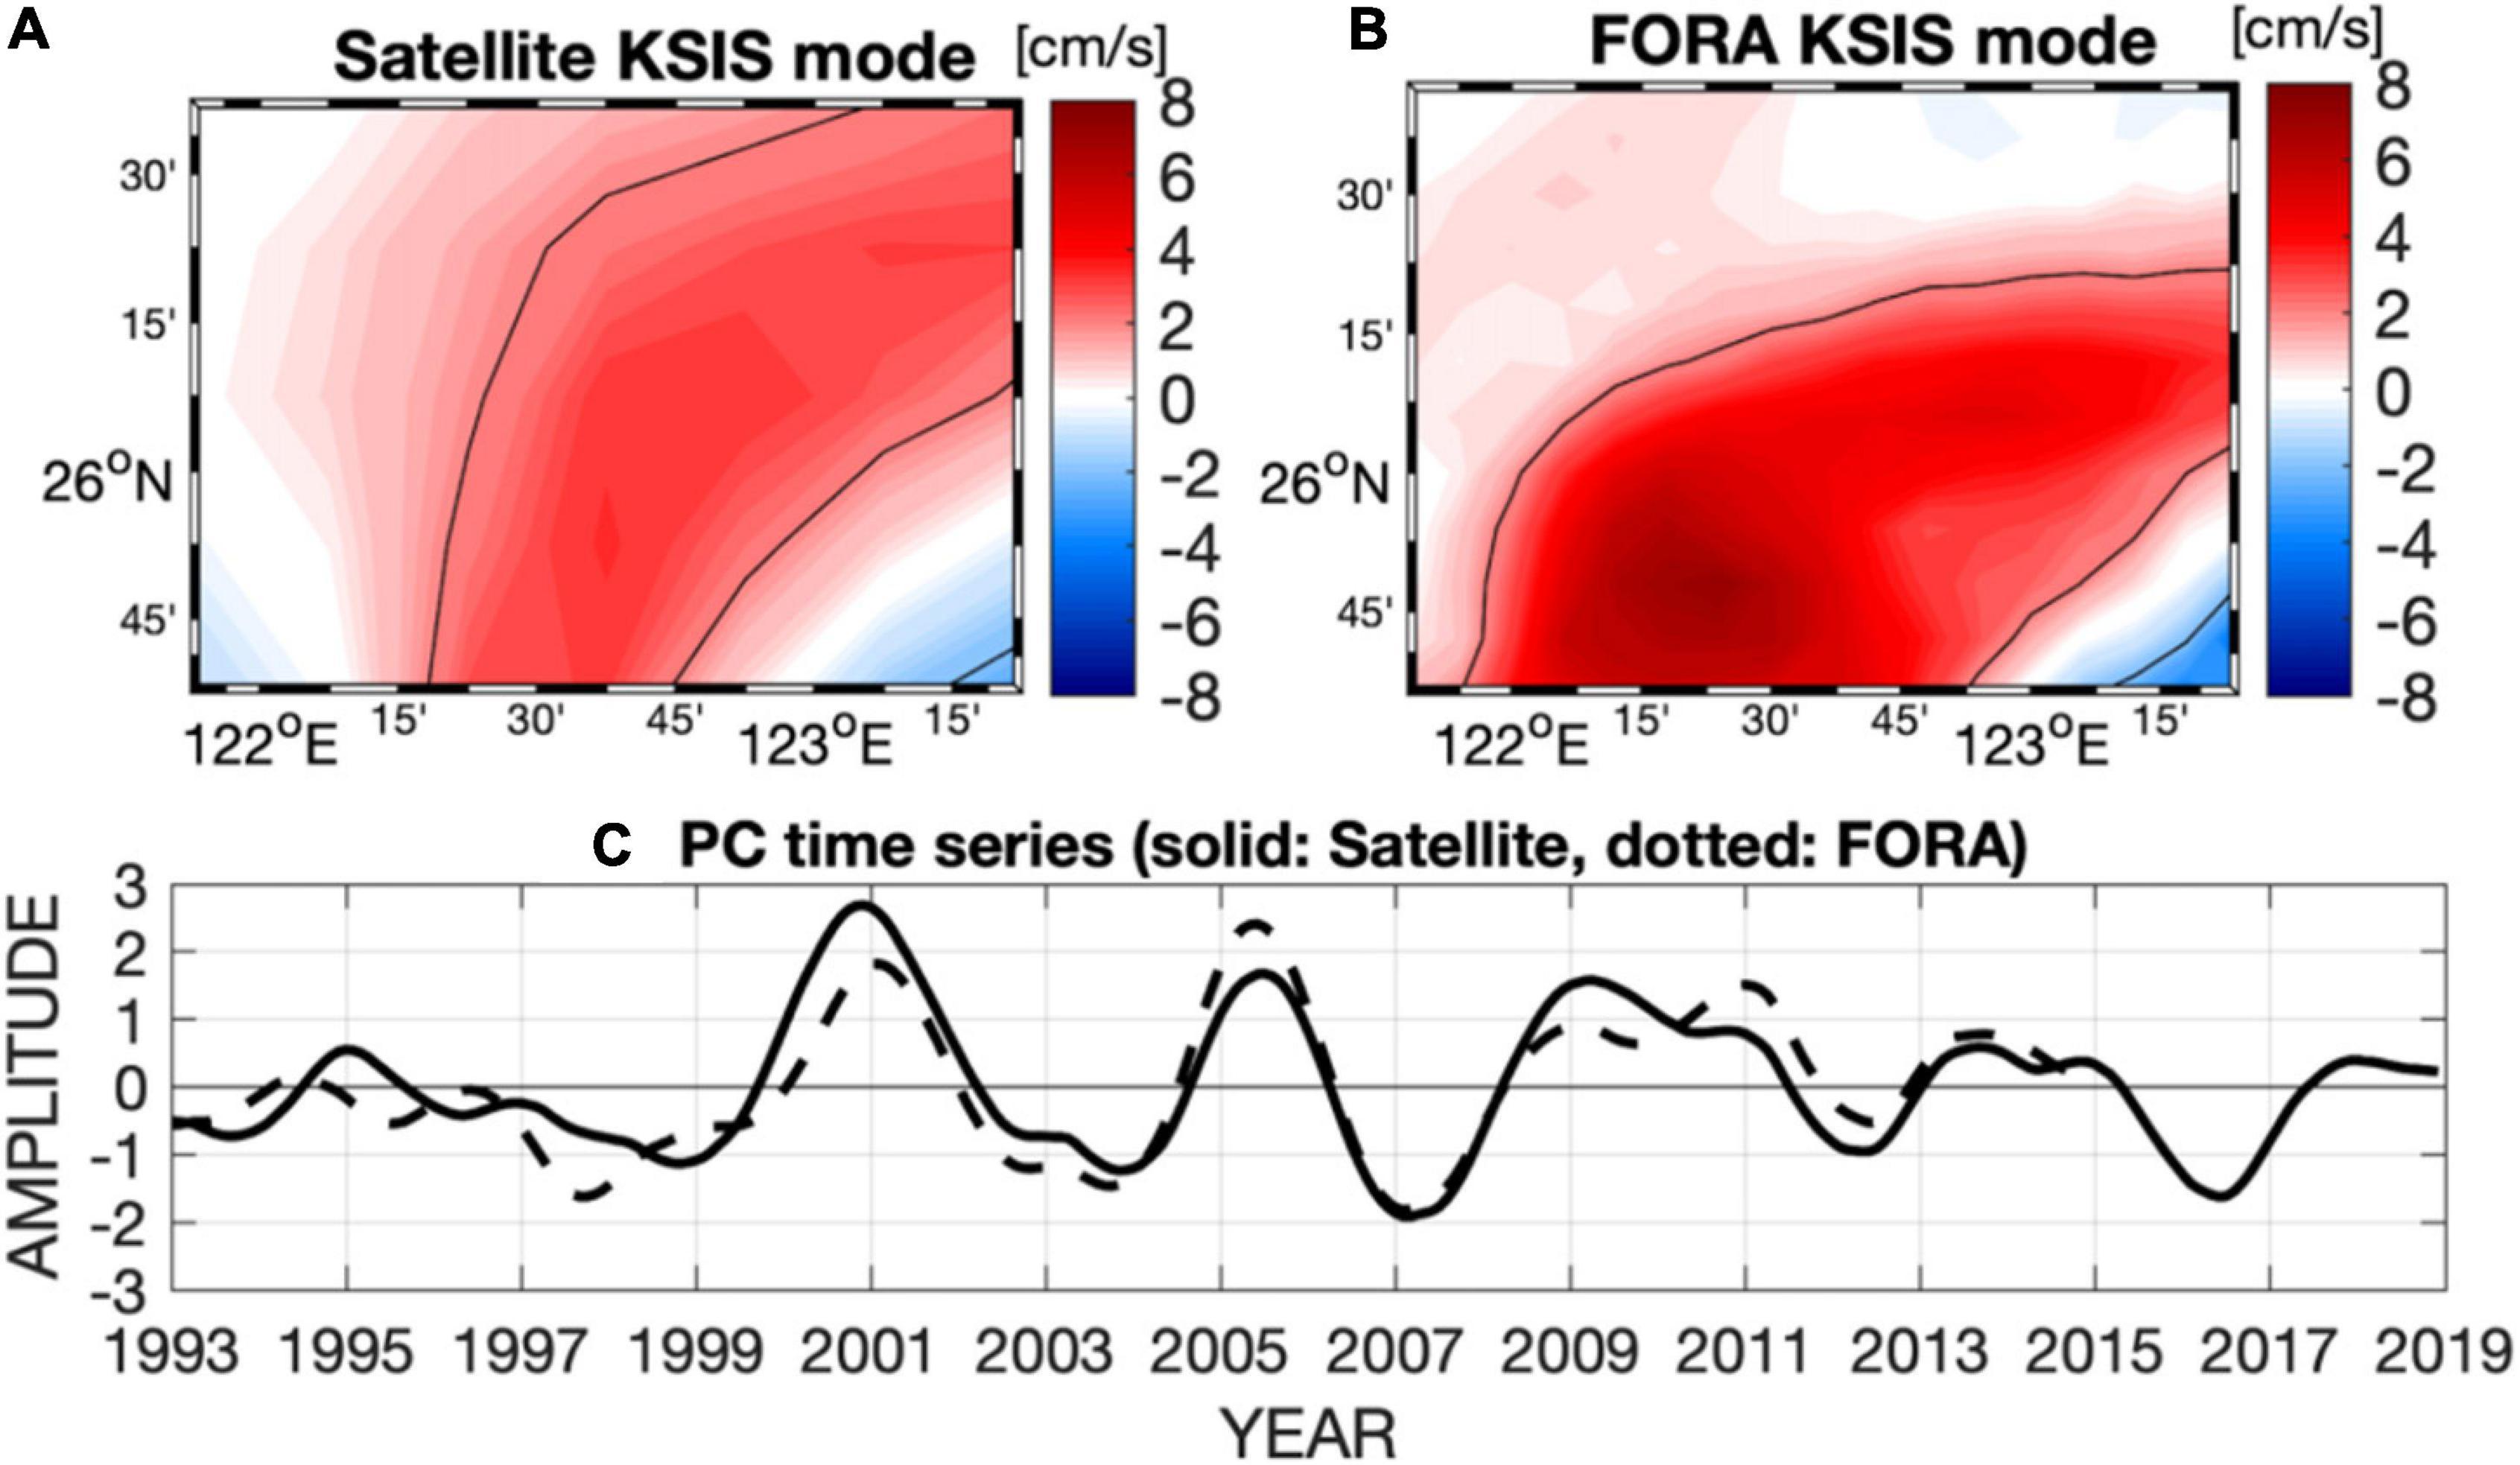
Figure 3. Kuroshio shelf intrusion strength modes (the second CSEOF modes of the surface current speed over the KSI domain) depicted from (A) satellite altimetry during 1993–2018 and (B) FORA during 1993–2014 with the corresponding PC time series in panel (C). Black contours in panels (A,B) denote 2 cm/s. The correlation coefficients between the solid and dotted line in panel (C) is 0.87 during the period 1993–2014.
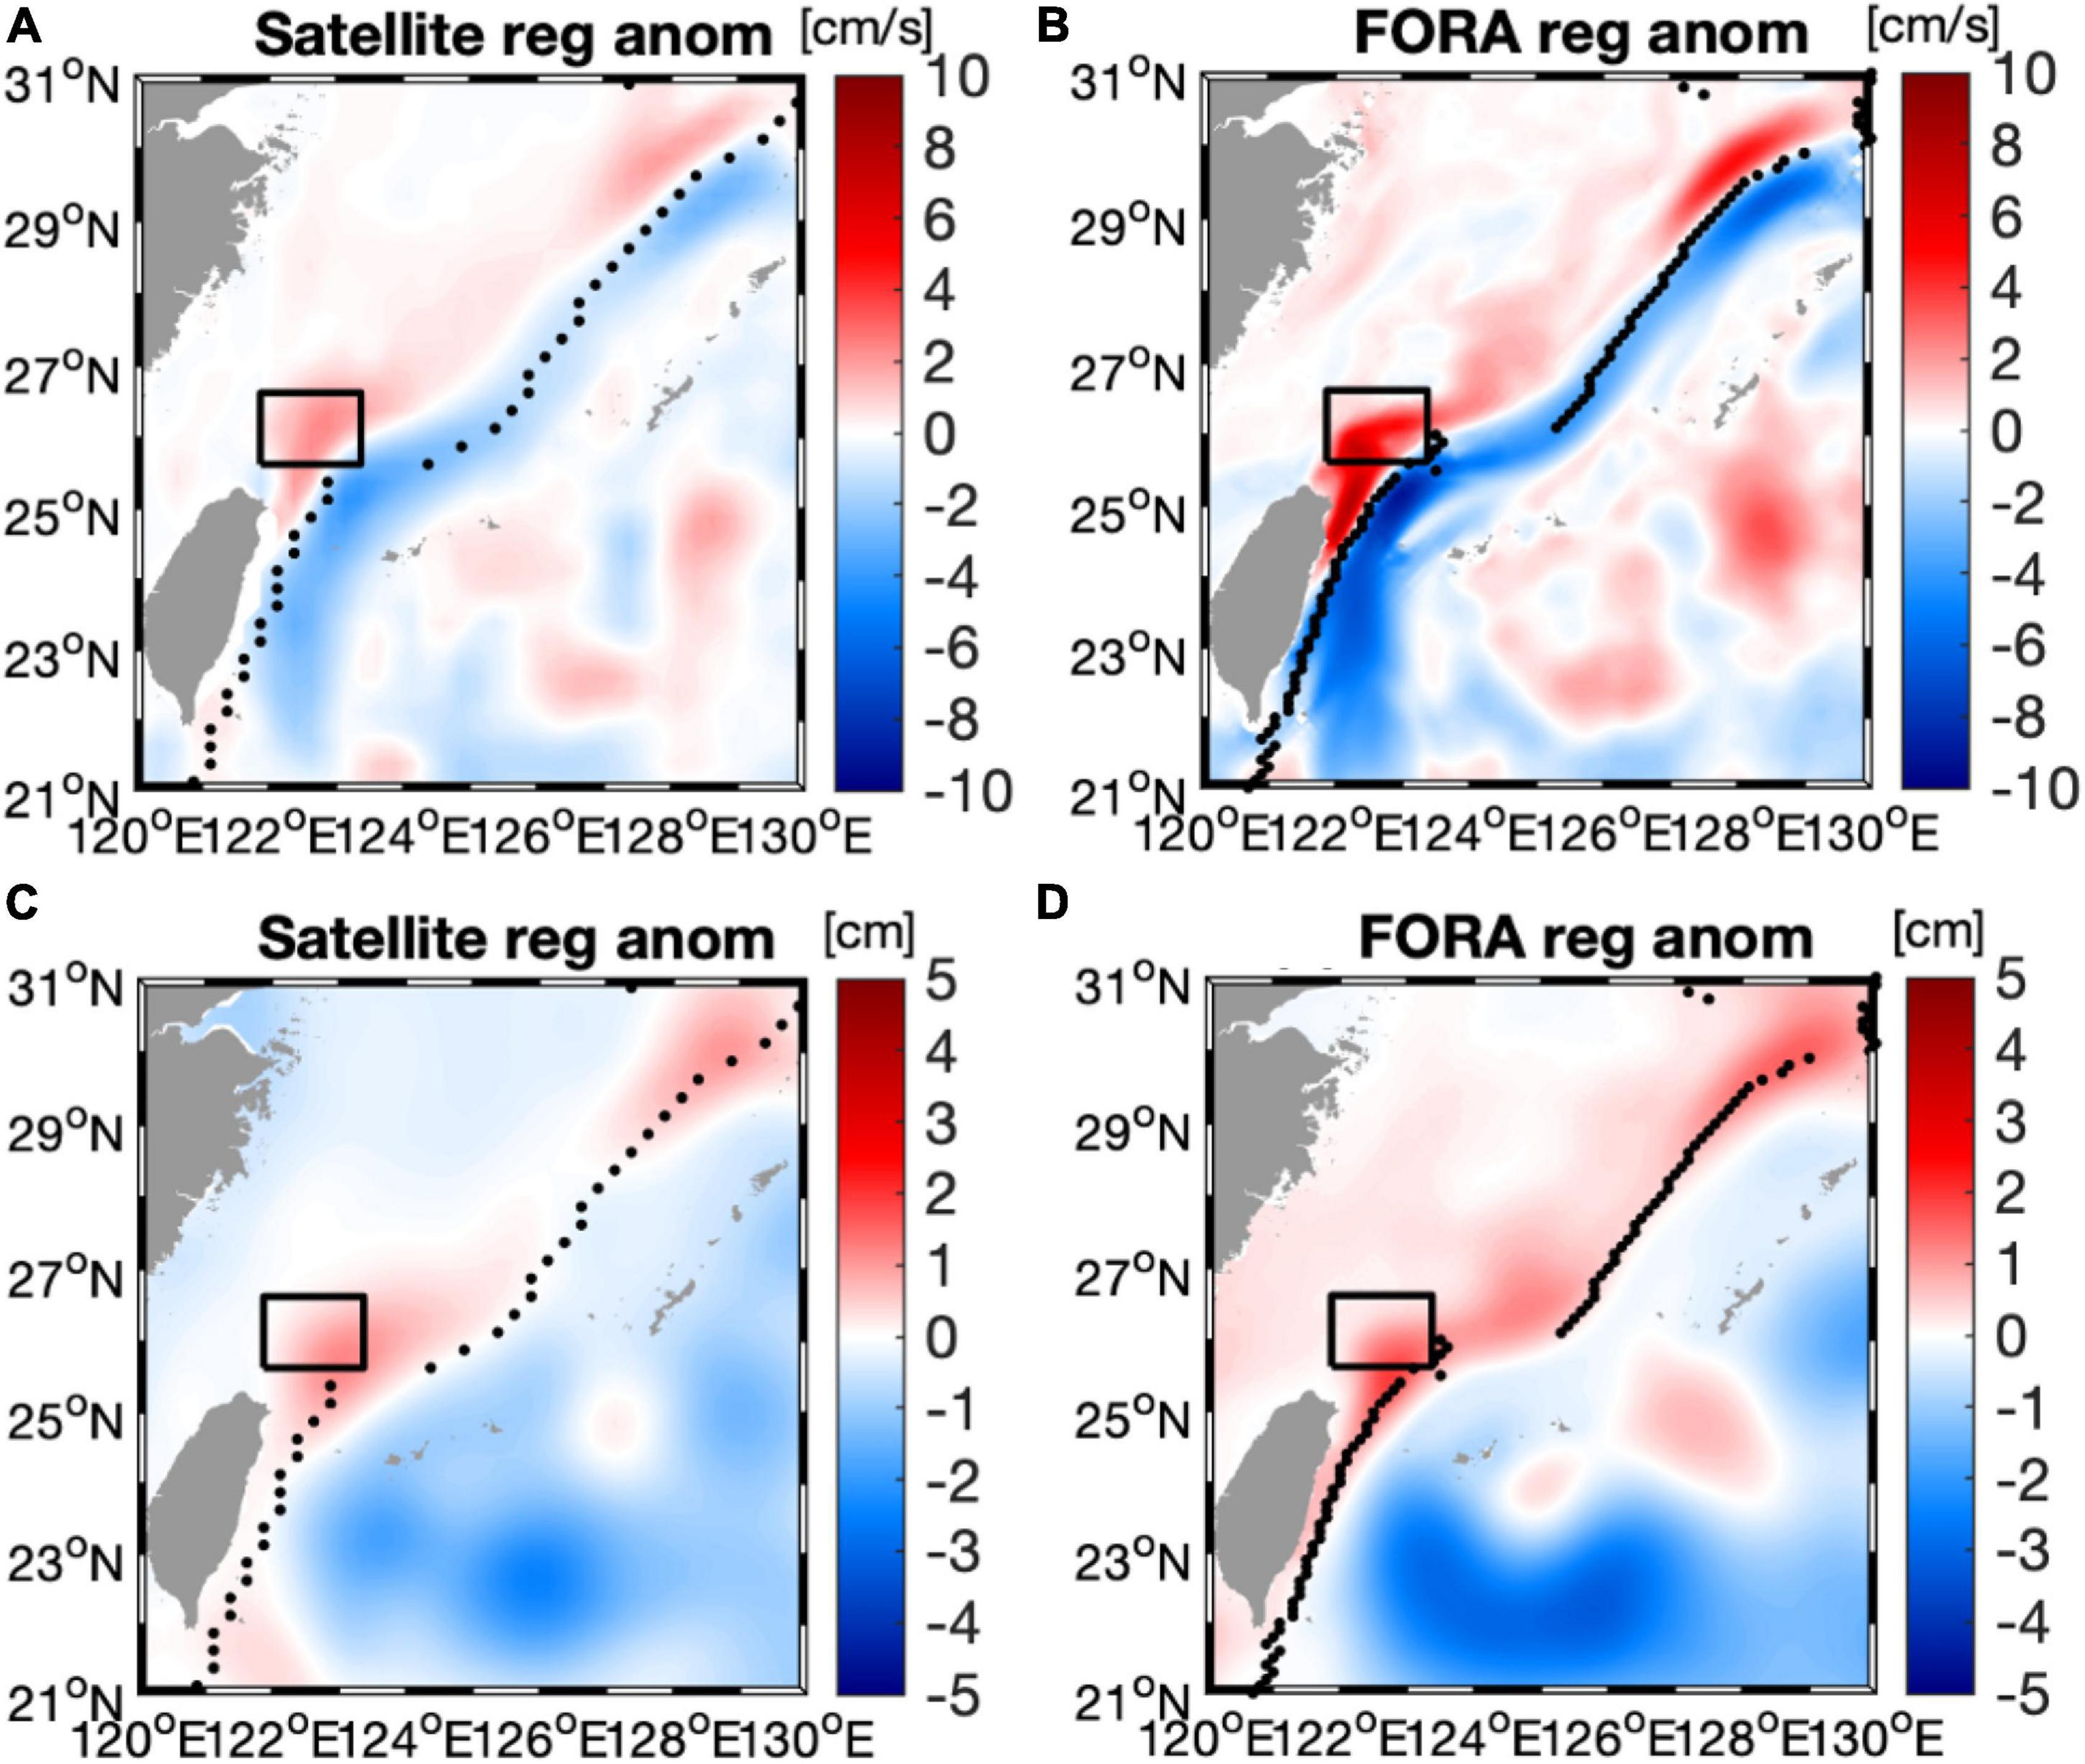
Figure 4. Regressed anomalies of (A,B) surface current speed and (C,D) sea surface height targeting the KSI strength modes. Regression analysis was based on satellite altimetry for 1993–2018 (left) and FORA for 1993–2014 (right). The mean path of the Kuroshio is displayed as black dots. Black squares denote the KSI domain.
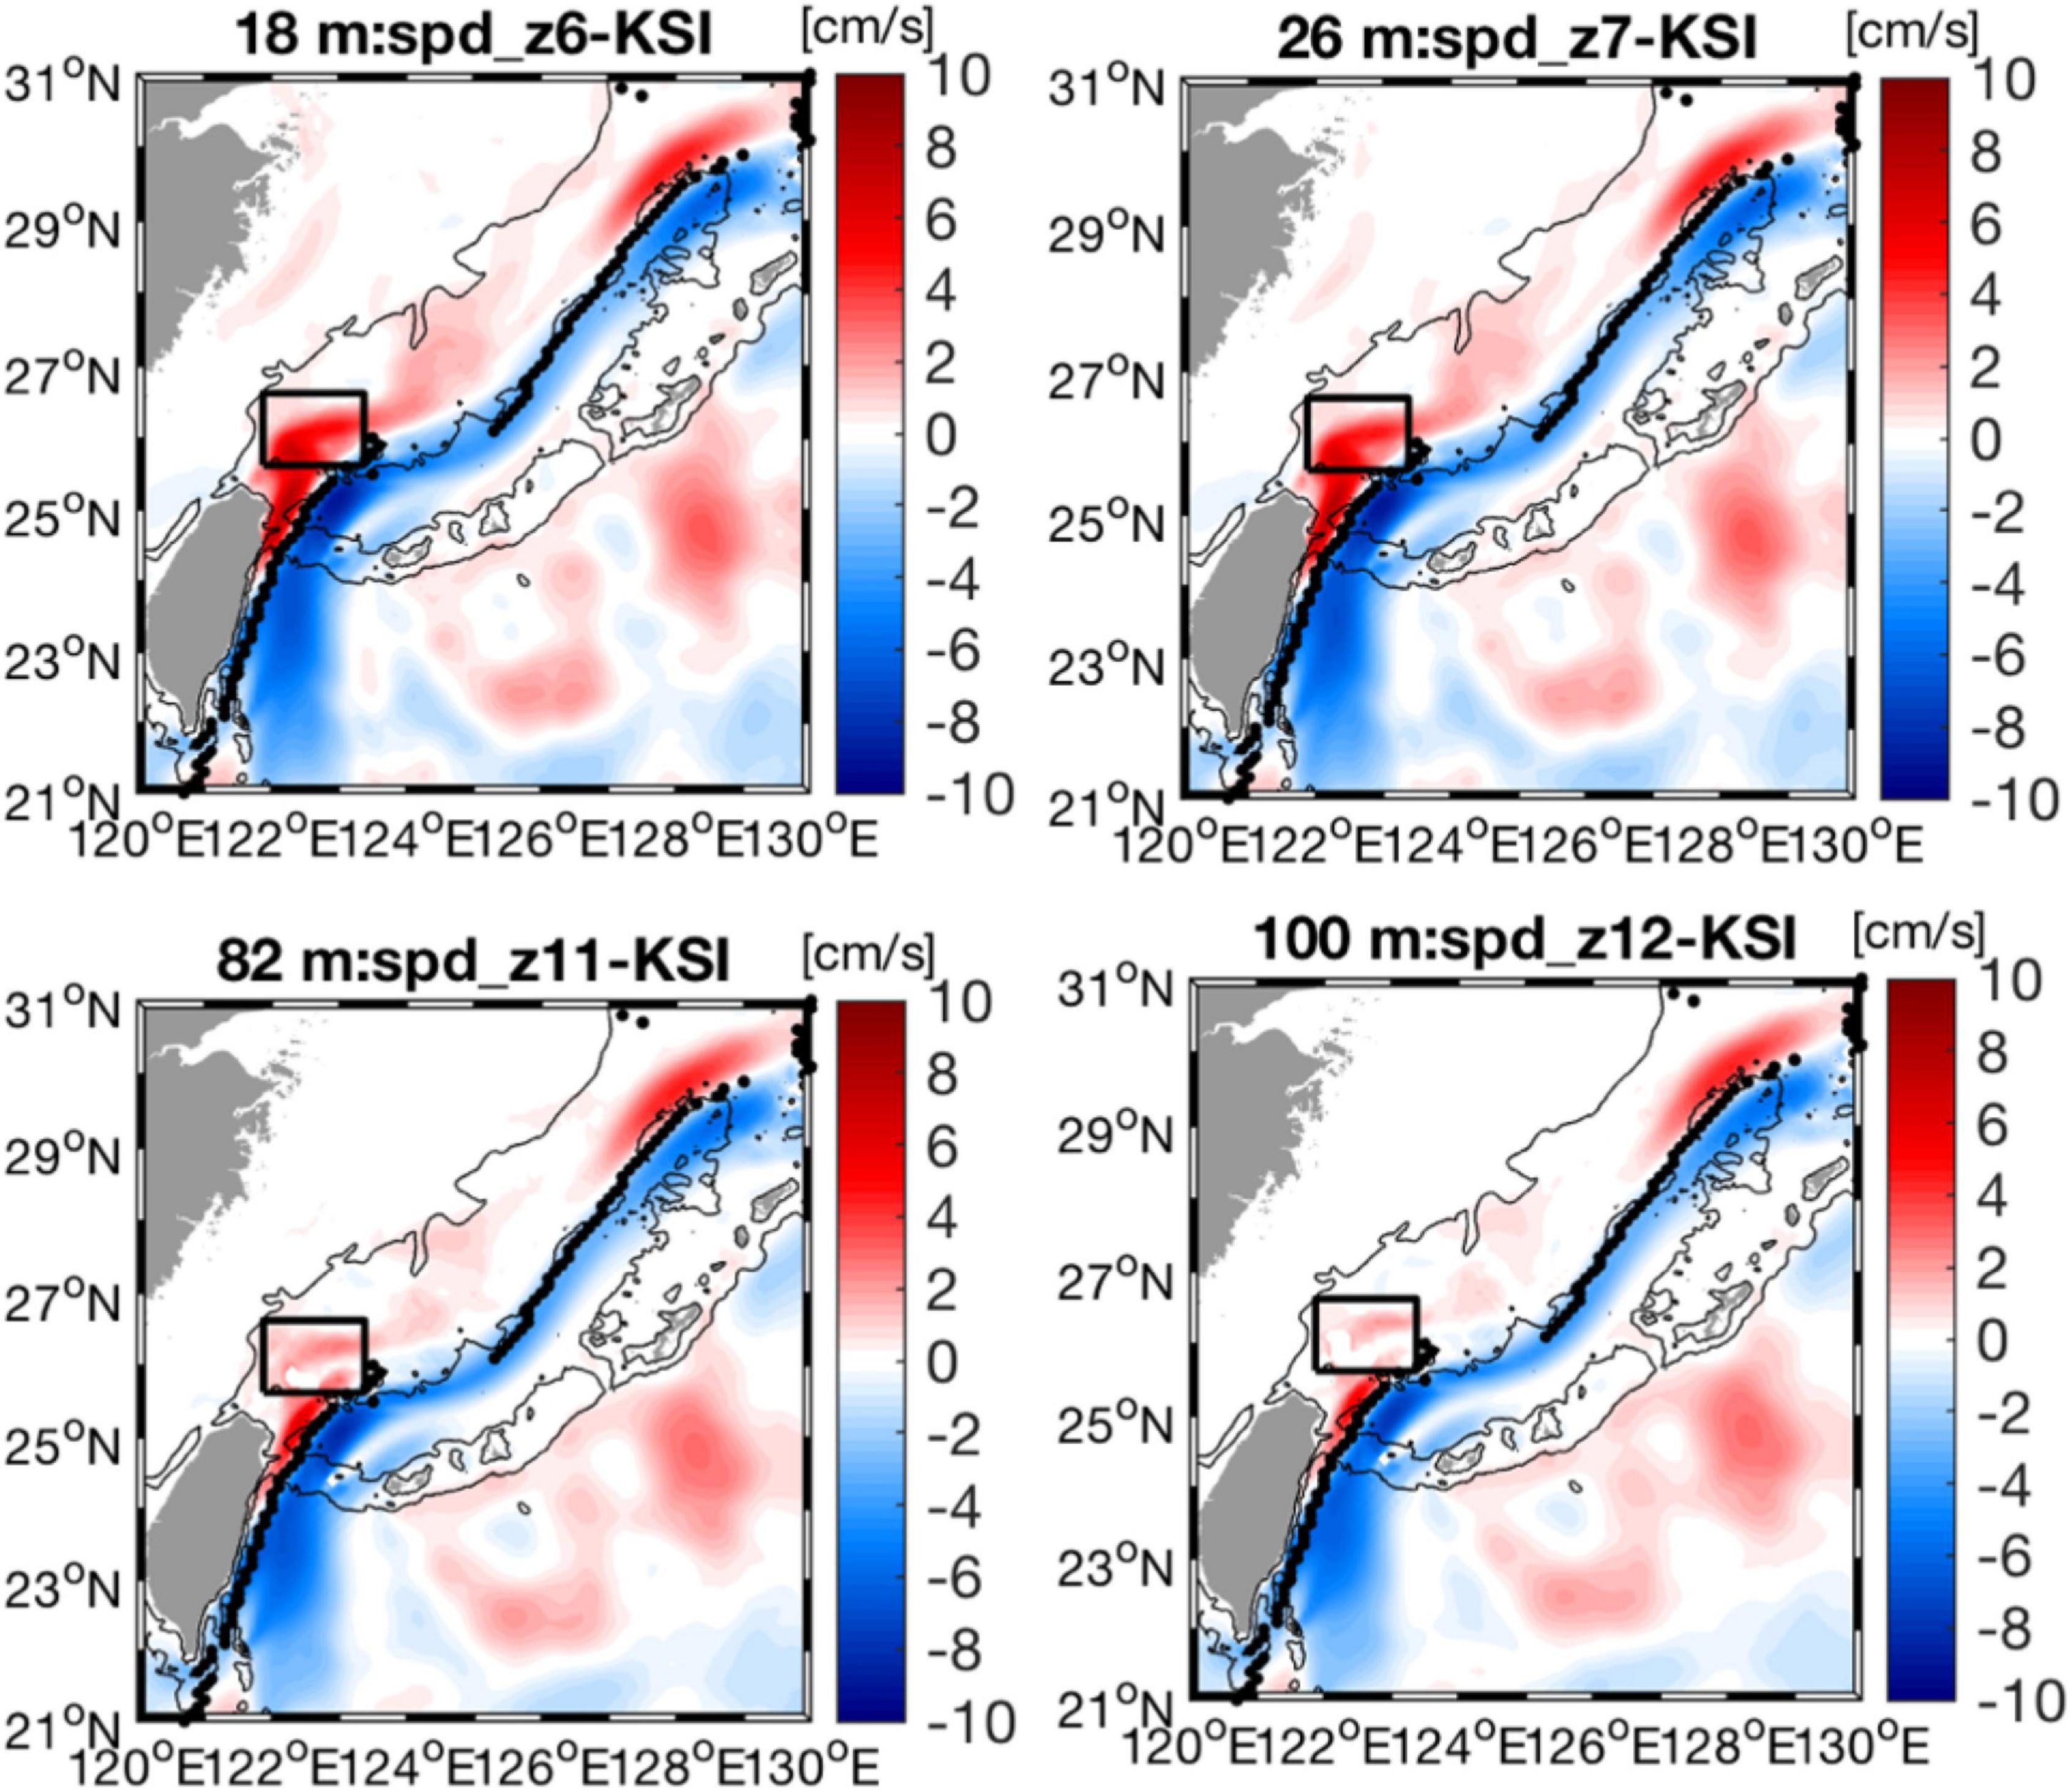
Figure 5. Regressed subsurface current speed anomalies at 18, 26, 82, 100 m, targeting the KSI strength mode from FORA. The mean path of the Kuroshio is displayed as black dots. Black squares denote the KSI domain, and the black contours denote 100 and 1,000 m isobaths.
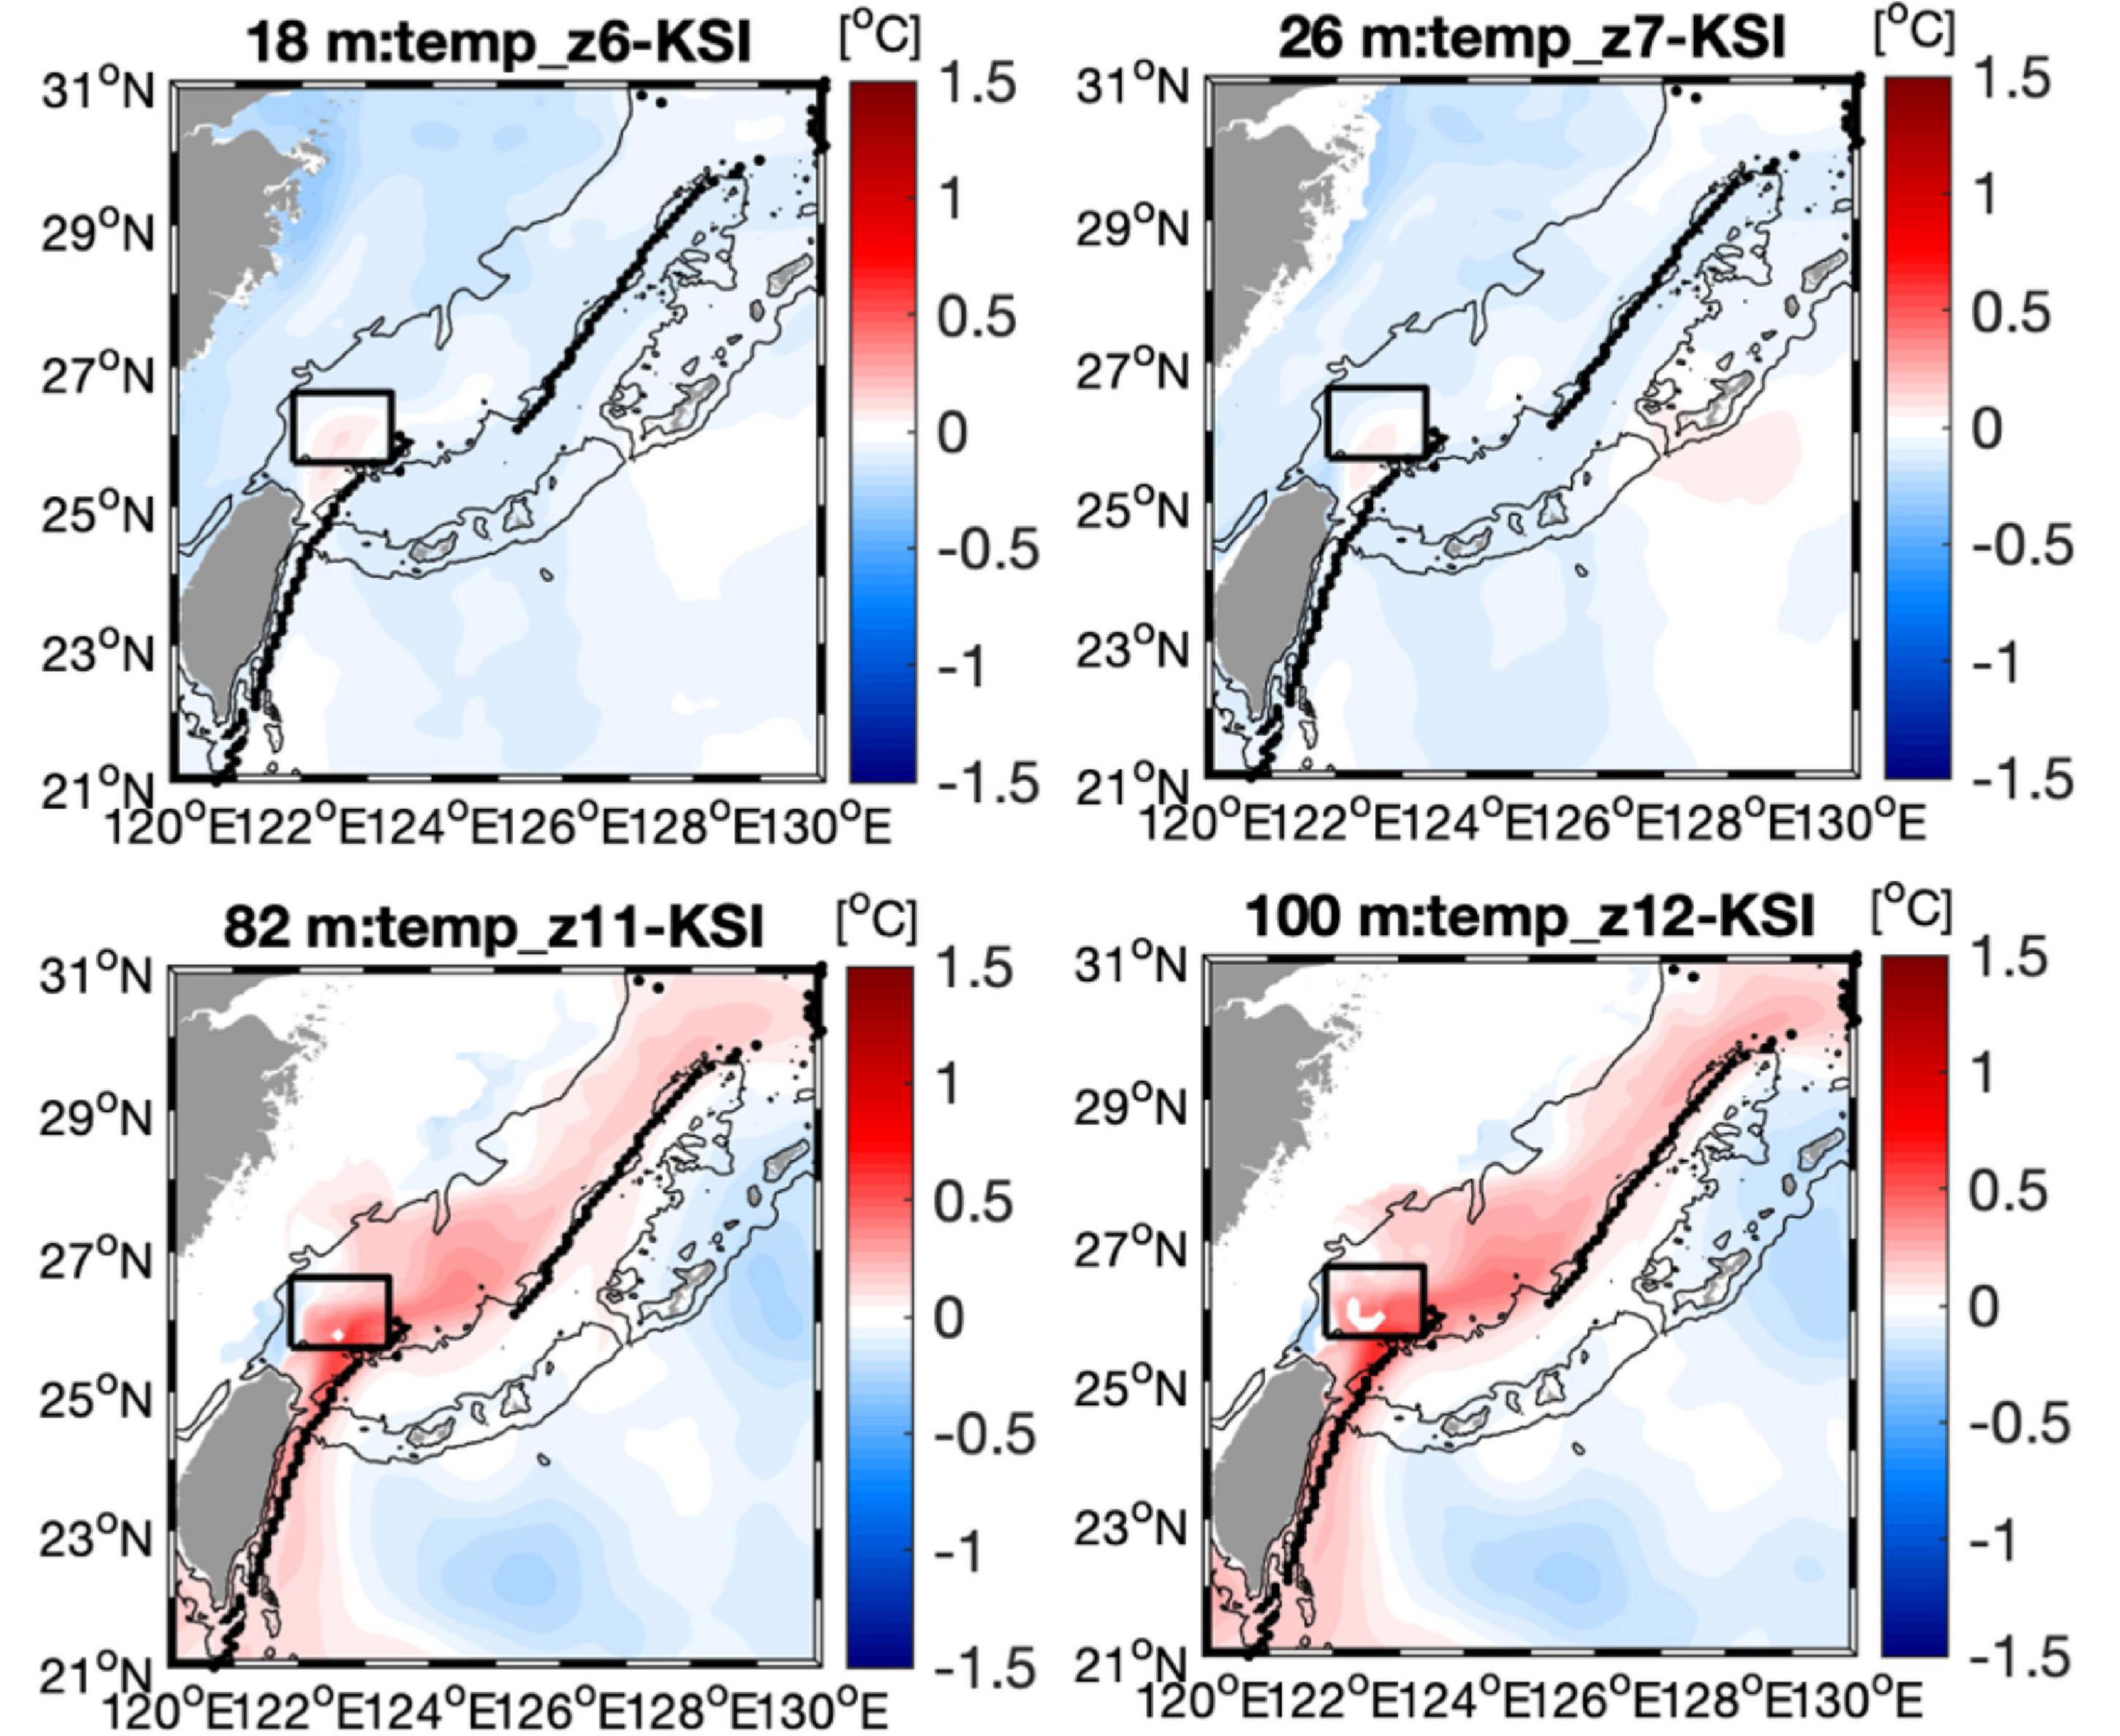
Figure 6. Regressed subsurface temperature anomalies at 18, 26, 82, 100 m targeting the KSI strength mode from FORA. The mean path of the Kuroshio is displayed as black dots. Black squares denote the KSI domain, and black contours denote 100 and 1,000 m isobaths.
where Cm(r,t) represents the CSLVs of the predictor variables. The resulting spatial patterns, Creg(r,t), share long-term undulations with the target variable; thus, the evolution of the predictor variable is physically consistent with the evolution of the target variable, i.e., the KSI strength mode. A significance of each spatial pattern at each depth is inferred from the R-squared values of the regression analysis in Figure 2, because the R-squared values denote how well the long-term variability of the resulting spatial patterns are correlated to the K_index(t). Examples and applications of regression analysis in the CSEOF space are provided by Kim et al. (2015). The spatial patterns of the regressed anomalies presented in this study are the means of the 12 monthly patterns, as this study focuses on the long-term variability.
Results
Relationship Between the Kuroshio Shelf Intrusion Strength Mode and Surface Variability in the East China Sea
Figure 3 shows the second CSEOF modes extracted from the surface current speeds of the KSI domain based on satellite altimetry and FORA, respectively. The KSI domain was selected considering the standard deviation of the current speed in Figure 1, where it exhibits greater variability in the shelf region of the ECS (depth: 100–1,000 m). The second CSEOF modes of the KSI domain from the two different datasets show consistent spatial patterns (Figures 3A,B), and their PC time series exhibit similar variability during the overlapping period (Figure 3C). Overall positive anomalies in the spatial patterns denote an increase in the current speed of the KSI domain during the positive phase of the PC time series. This increase in current speed represents the strengthening of the KSI, while the decrease in the current speed during the negative phase represents its weakening. The second CSEOF mode in Figure 3, thus represents the KSI variability northeast of Taiwan, hereafter referred to as the KSI strength mode. The KSI was particularly strengthened in 2000–2001, 2005, and 2009; weakening occurred in 2003, 2006–2007, and 2016. On a decadal time scale, the KSI showed stronger interannual variability during the 2000s, whereas it was relatively stable in the 1990s and the 2010s, which is consistent with Soeyanto et al. (2014) and Wu et al. (2017) that suggested an increase in the number of strong KSI events during 2002-2013 relative to 1993-2001 due to the decadal changes in the eddy kinetic energy. However, the linear trend of the PC time series of the KSI strength mode (a sightly increasing trend) is not statistically significant (p > 0.05), and the 26-year analysis period is not long enough to determine whether the KSI has strengthened or weakened on the decadal time scale.
Figure 4 displays the relationship between the KSI strength mode and surface current speed and SSH in the wider ECS. The regressed anomalies of surface current speed and SSH were reconstructed using the regression coefficients from the regression analysis targeting the KSI strength mode, as described in Data and Methods. The similarity between the spatial pattern of the KSI strength mode and the regressed anomalies for the KSI domain (Figures 3A,B, 4A,B, respectively) shows the physical consistency of the regression analysis. In the ECS, regressed anomalies of surface current speed based on both the satellite altimetry (R-squared = 0.77) and FORA (R-squared = 0.87) exhibit positive values to the west of the mean Kuroshio axis and negative values to the east, in the southern and northern ECS, suggesting a westward shift of the Kuroshio path when the KSI is strengthened. The negative anomalies align with the mean Kuroshio axis in the central ECS, which implies the weakening of the Kuroshio when the KSI is strengthened. However, the positive anomalies further to the west of the negative anomalies suggest that the weakening is accompanied by a westward shift in the central ECS. Note that in Figure 1, the central ECS exhibits smaller mean and standard deviation of the surface current speeds than the southern and northern ECS. The negative anomalies east of Taiwan indicate that the KSI is strengthened when the upstream Kuroshio is weakened, which is consistent with previous studies showing that a strong KSI is associated with the weakening of the Kuroshio east of Taiwan (Wu et al., 2014). The R-squared values of the regression from SSH of the ECS targeting the KSI strength mode are 0.59 for the satellite altimetry and 0.63 for the FORA, respectively. The spatial patterns in Figures 4C,D are physically consistent with those of the current anomalies in the ECS, i.e., the overall positive anomalies to the west and negative anomalies to the east of the mean Kuroshio path.
Relationship Between the Kuroshio Shelf Intrusion Strength Mode and Upper-Ocean Variability in the East China Sea
The relationship between the KSI strength mode and upper-ocean variability in the ECS was investigated based on regression analysis of the FORA dataset. The regressed anomalies targeting the KSI strength mode show how the current and temperature variability in the ECS are associated with the KSI variability. Figure 2 displays the R-squared values of the regression analysis, which are all greater than 0.75 for current speeds in the upper 200 m and show little variation with depth. In comparison, the R-squared values for temperature are generally lower; being <0.5 in the near-surface layer, but greater at the subsurface layers with the maximum at about 130 m.
The regressed anomalies of the current speed in the subsurface layer in Figure 5 show similar characteristics to those at the surface (as shown in Figure 4B). Positive anomalies to the west of the mean Kuroshio axis and negative anomalies to the east indicate that the Kuroshio path shifts westward throughout the water column in the upper ocean when the KSI becomes stronger, particularly in the southern and northern ECS. In the southern ECS, the amplitudes of positive anomalies are greater near the surface compared to those at greater depths. The amplitudes of negative anomalies are not significantly different between depths, probably because of the deeper (>1,000 m) bottom depth to the east of the mean Kuroshio axis. The regressed anomalies of subsurface temperature targeting the KSI strength mode in Figure 6 show different spatial patterns between the vertical layers. Overall, weak negative anomalies are observed near the surface in the ECS, except over the KSI domain. However, in the deeper subsurface layer, positive anomalies are observed in the overall shelf region with bottom depths between 100 and 1,000 m. The subsurface warming during the stronger KSI phase is particularly prominent in the southern ECS to the west of the mean Kuroshio path.
Figure 7 shows the vertical sections of the current speed and temperature across the KSI domain from the northwest corner to the southeast corner. The vertical section of the mean current speed in Figure 7A shows that the core of the current extends from the surface to approximately 100 m in the KSI domain. The location of the maximum current speed at the surface is similar to that of the subsurface layer, although this becomes slightly inclined toward the southeast at greater depths. The vertical section of the regressed current speed anomalies in Figure 7C shows the westward shift of the Kuroshio throughout the upper 100 m layer, that is, positive anomalies to the west of the mean Kuroshio axis and negative anomalies to the right. Figure 7B shows the vertical distribution of the mean temperature across the KSI domain; the isotherms are shallower in the shelf region, whereas they are deeper close to the mean Kuroshio path. The vertical section of the regressed temperature anomalies in Figure 7D indicates that the westward shift of the Kuroshio path during the stronger KSI phase does not induce significant temperature changes in the upper 50-m layer because of the small zonal temperature gradient between the shelf and deeper regions. However, in the deeper layer (below 50-m depth), the zonal difference in the isotherm depth contributes to positive anomalies over the KSI domain, which are particularly large where the zonal slope is steep.
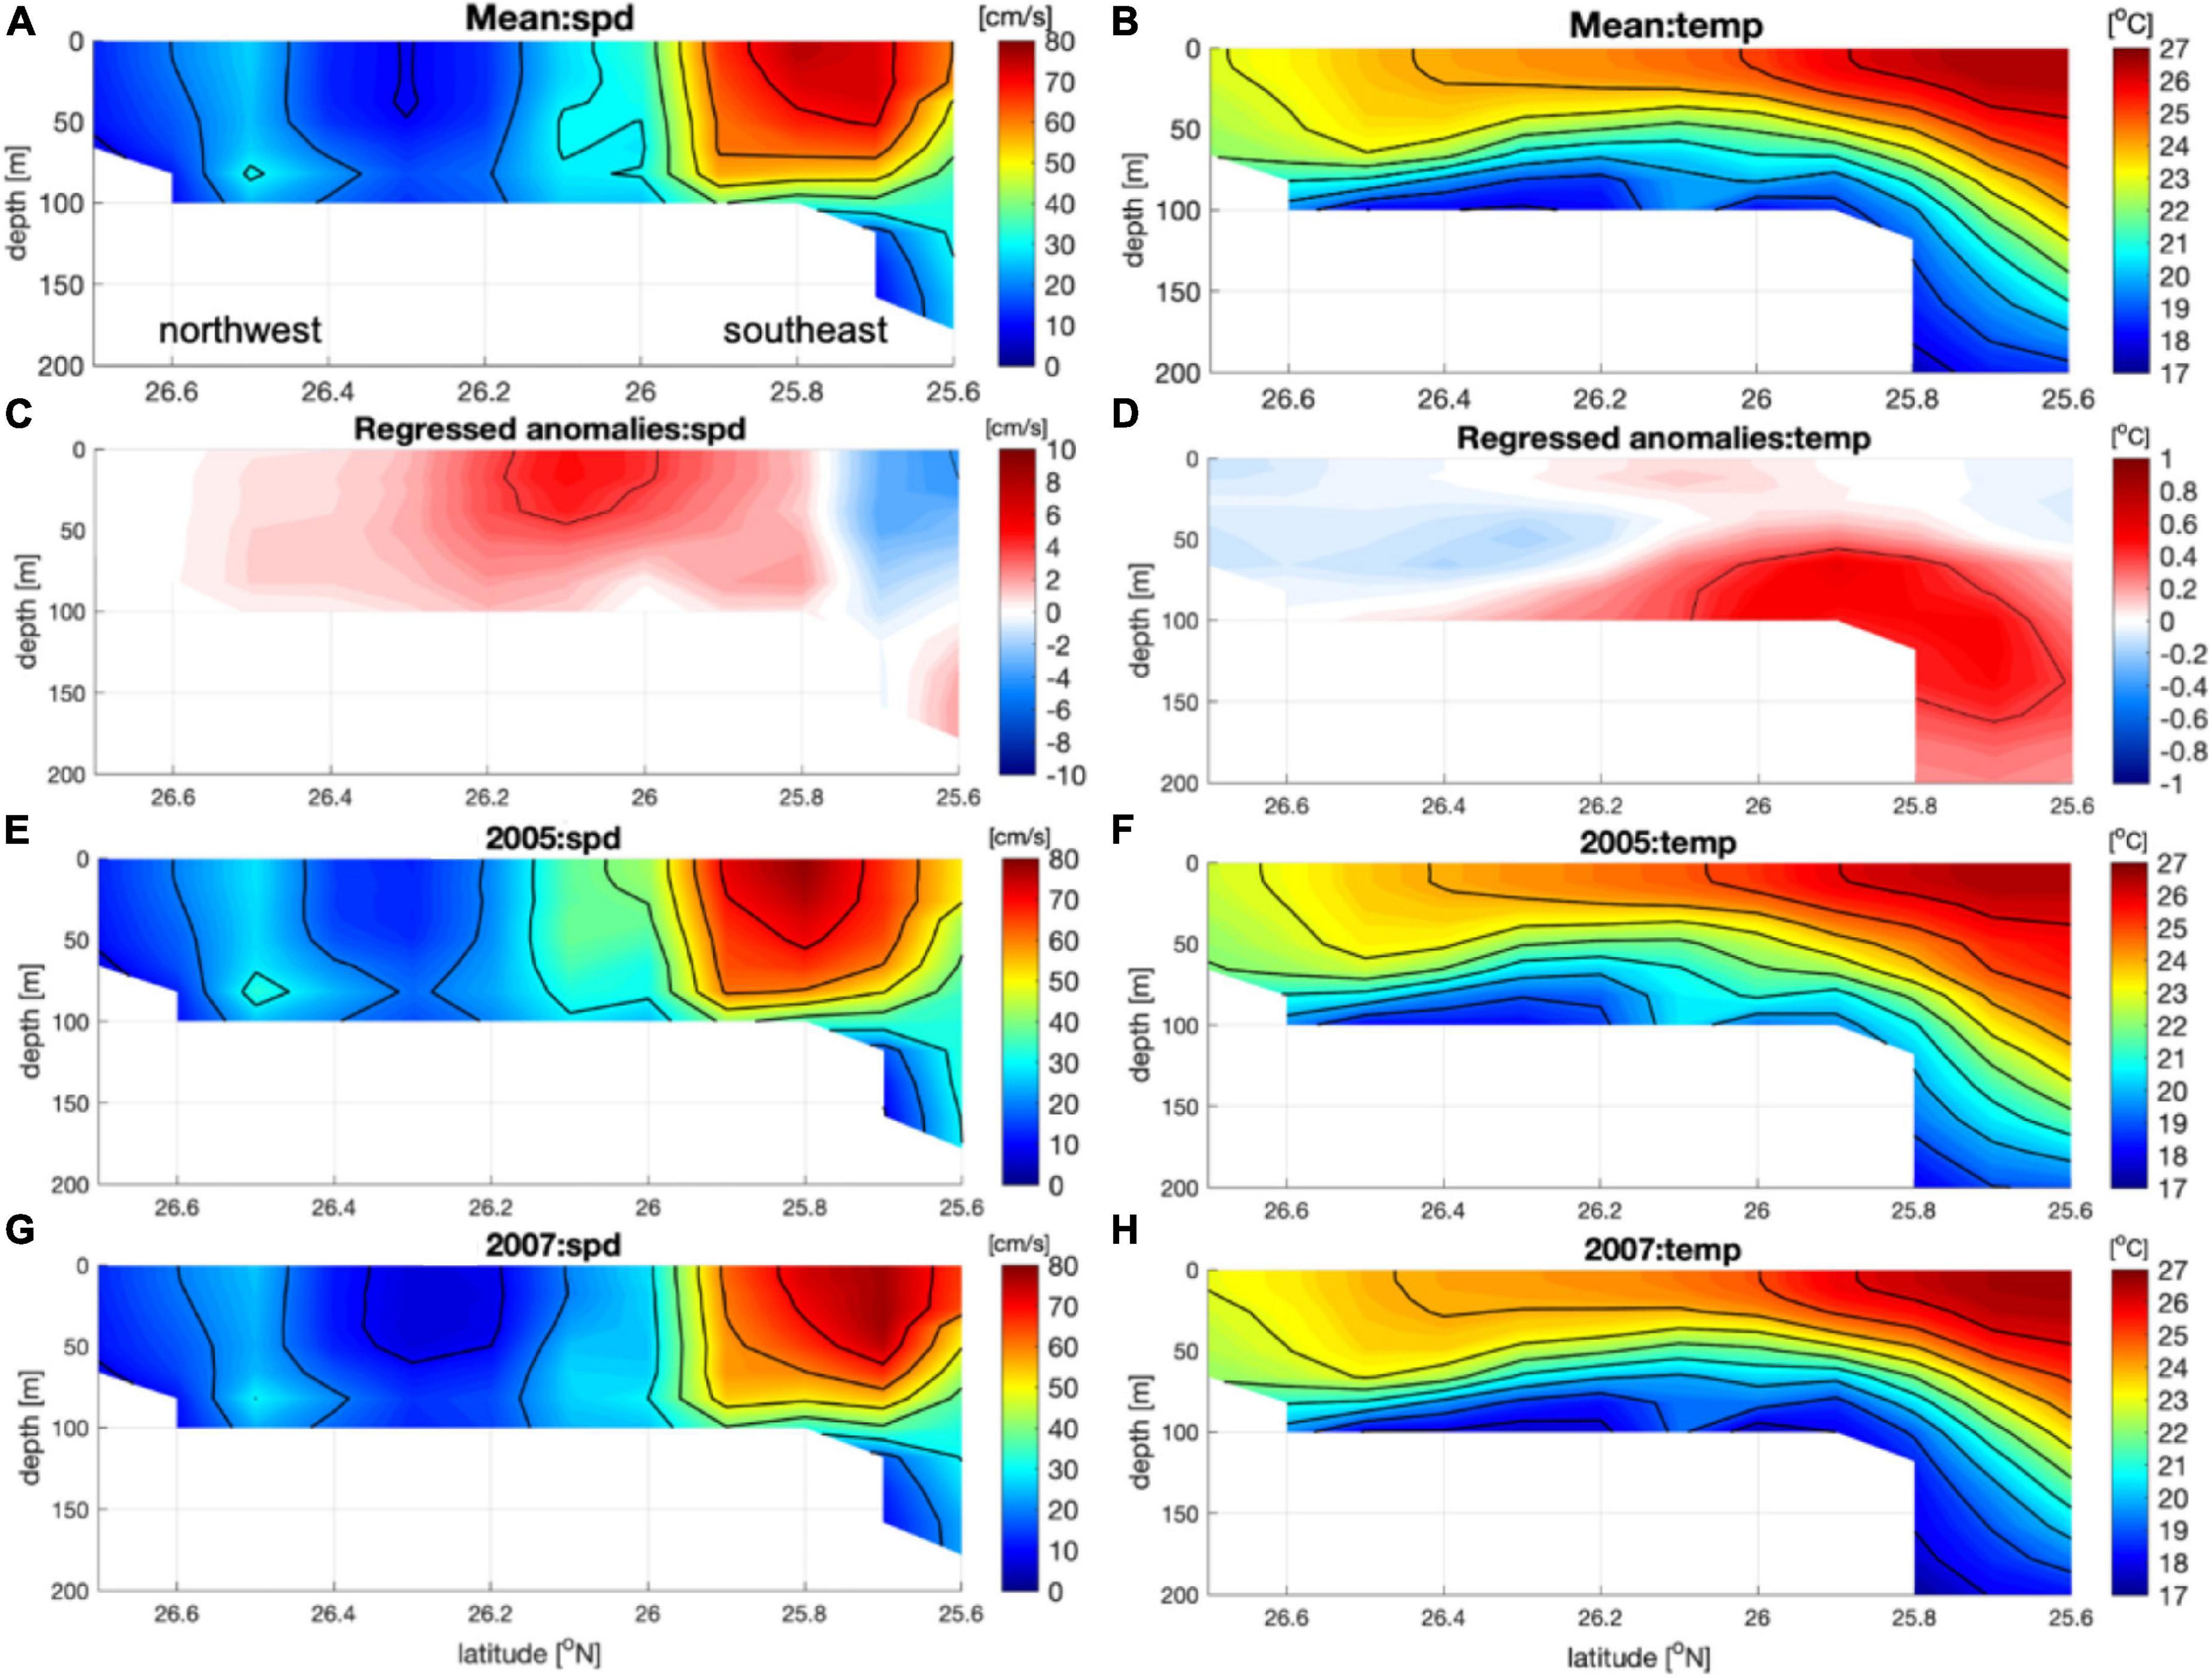
Figure 7. Vertical sections (northwest to southeast) of the (A,B) mean and (C,D) regressed anomalies diagonally crossing the KSI domain: (A,C) current speed and (B,D) temperature. Panels (E–H) display current speed and temperature in 2005 (when the KSI was strong) and 2007 (when the KSI was weak), respectively. Black contours in panels (C,D) denote 4 cm/s and 0.4°, respectively.
A comparison of current speed and temperature between the stronger and weaker KSI phases is presented in Figures 7E–H. The year 2005 and the year 2007 represent the stronger and weaker KSI years, respectively, based on the PC time series in Figure 3C, the K_index(t). The location of large current speed shifted relatively westward in 2005 when the KSI was stronger. The current speed over the shallower shelf region is larger in 2005 compared to that in 2007. The difference between the stronger and weaker KSI years is more distinct in the vertical section of the temperature. In 2005, the year of stronger KSI, the isotherms are relatively sparse, and the vertical temperature difference is reduced due to the positive temperature anomaly in the subsurface layer. The denser isotherms in 2007 indicate an increase of the vertical stratification over the shelf region.
Discussion and Conclusion
It is notable that the KSI variability, that is, the strengthening or weakening of the current speed in the KSI domain northeast of Taiwan, is more closely associated with the warming or cooling in the subsurface layer (>50 m) of the shelf region, compared to that in the near-surface layer. The relationships of the KSI variability with the SST and surface heat flux are shown in Figures 8A,B (R-squared values: 0.37 and 0.73, respectively). The weak negative SST anomalies in Figure 8A, except for the KSI domain, are similar to those of the near-surface temperature anomalies of the FORA dataset shown in Figure 6A. The regression of heat flux exhibits overall positive anomalies in the shelf region of the ECS, including the KSI domain, which denotes upward (ocean-to-atmosphere) heat flux anomalies during the strengthened KSI phase. The negative SST anomalies and upward heat flux anomalies imply the loss of heat from the ocean (i.e., the damping of underlying SST anomalies), whereas the positive SST anomalies and upward heat flux anomalies indicate the supply of heat by the ocean due to the excessive heat in the ocean. It is, therefore, suggested that the relationship between SST and surface heat flux may differ between the overall shelf region of the ECS and the KSI domain (Sasaki and Yamada, 2018). The strong subsurface temperature anomalies in the KSI domain may partly play a role in the regionally different relationships between the ocean and the atmosphere.
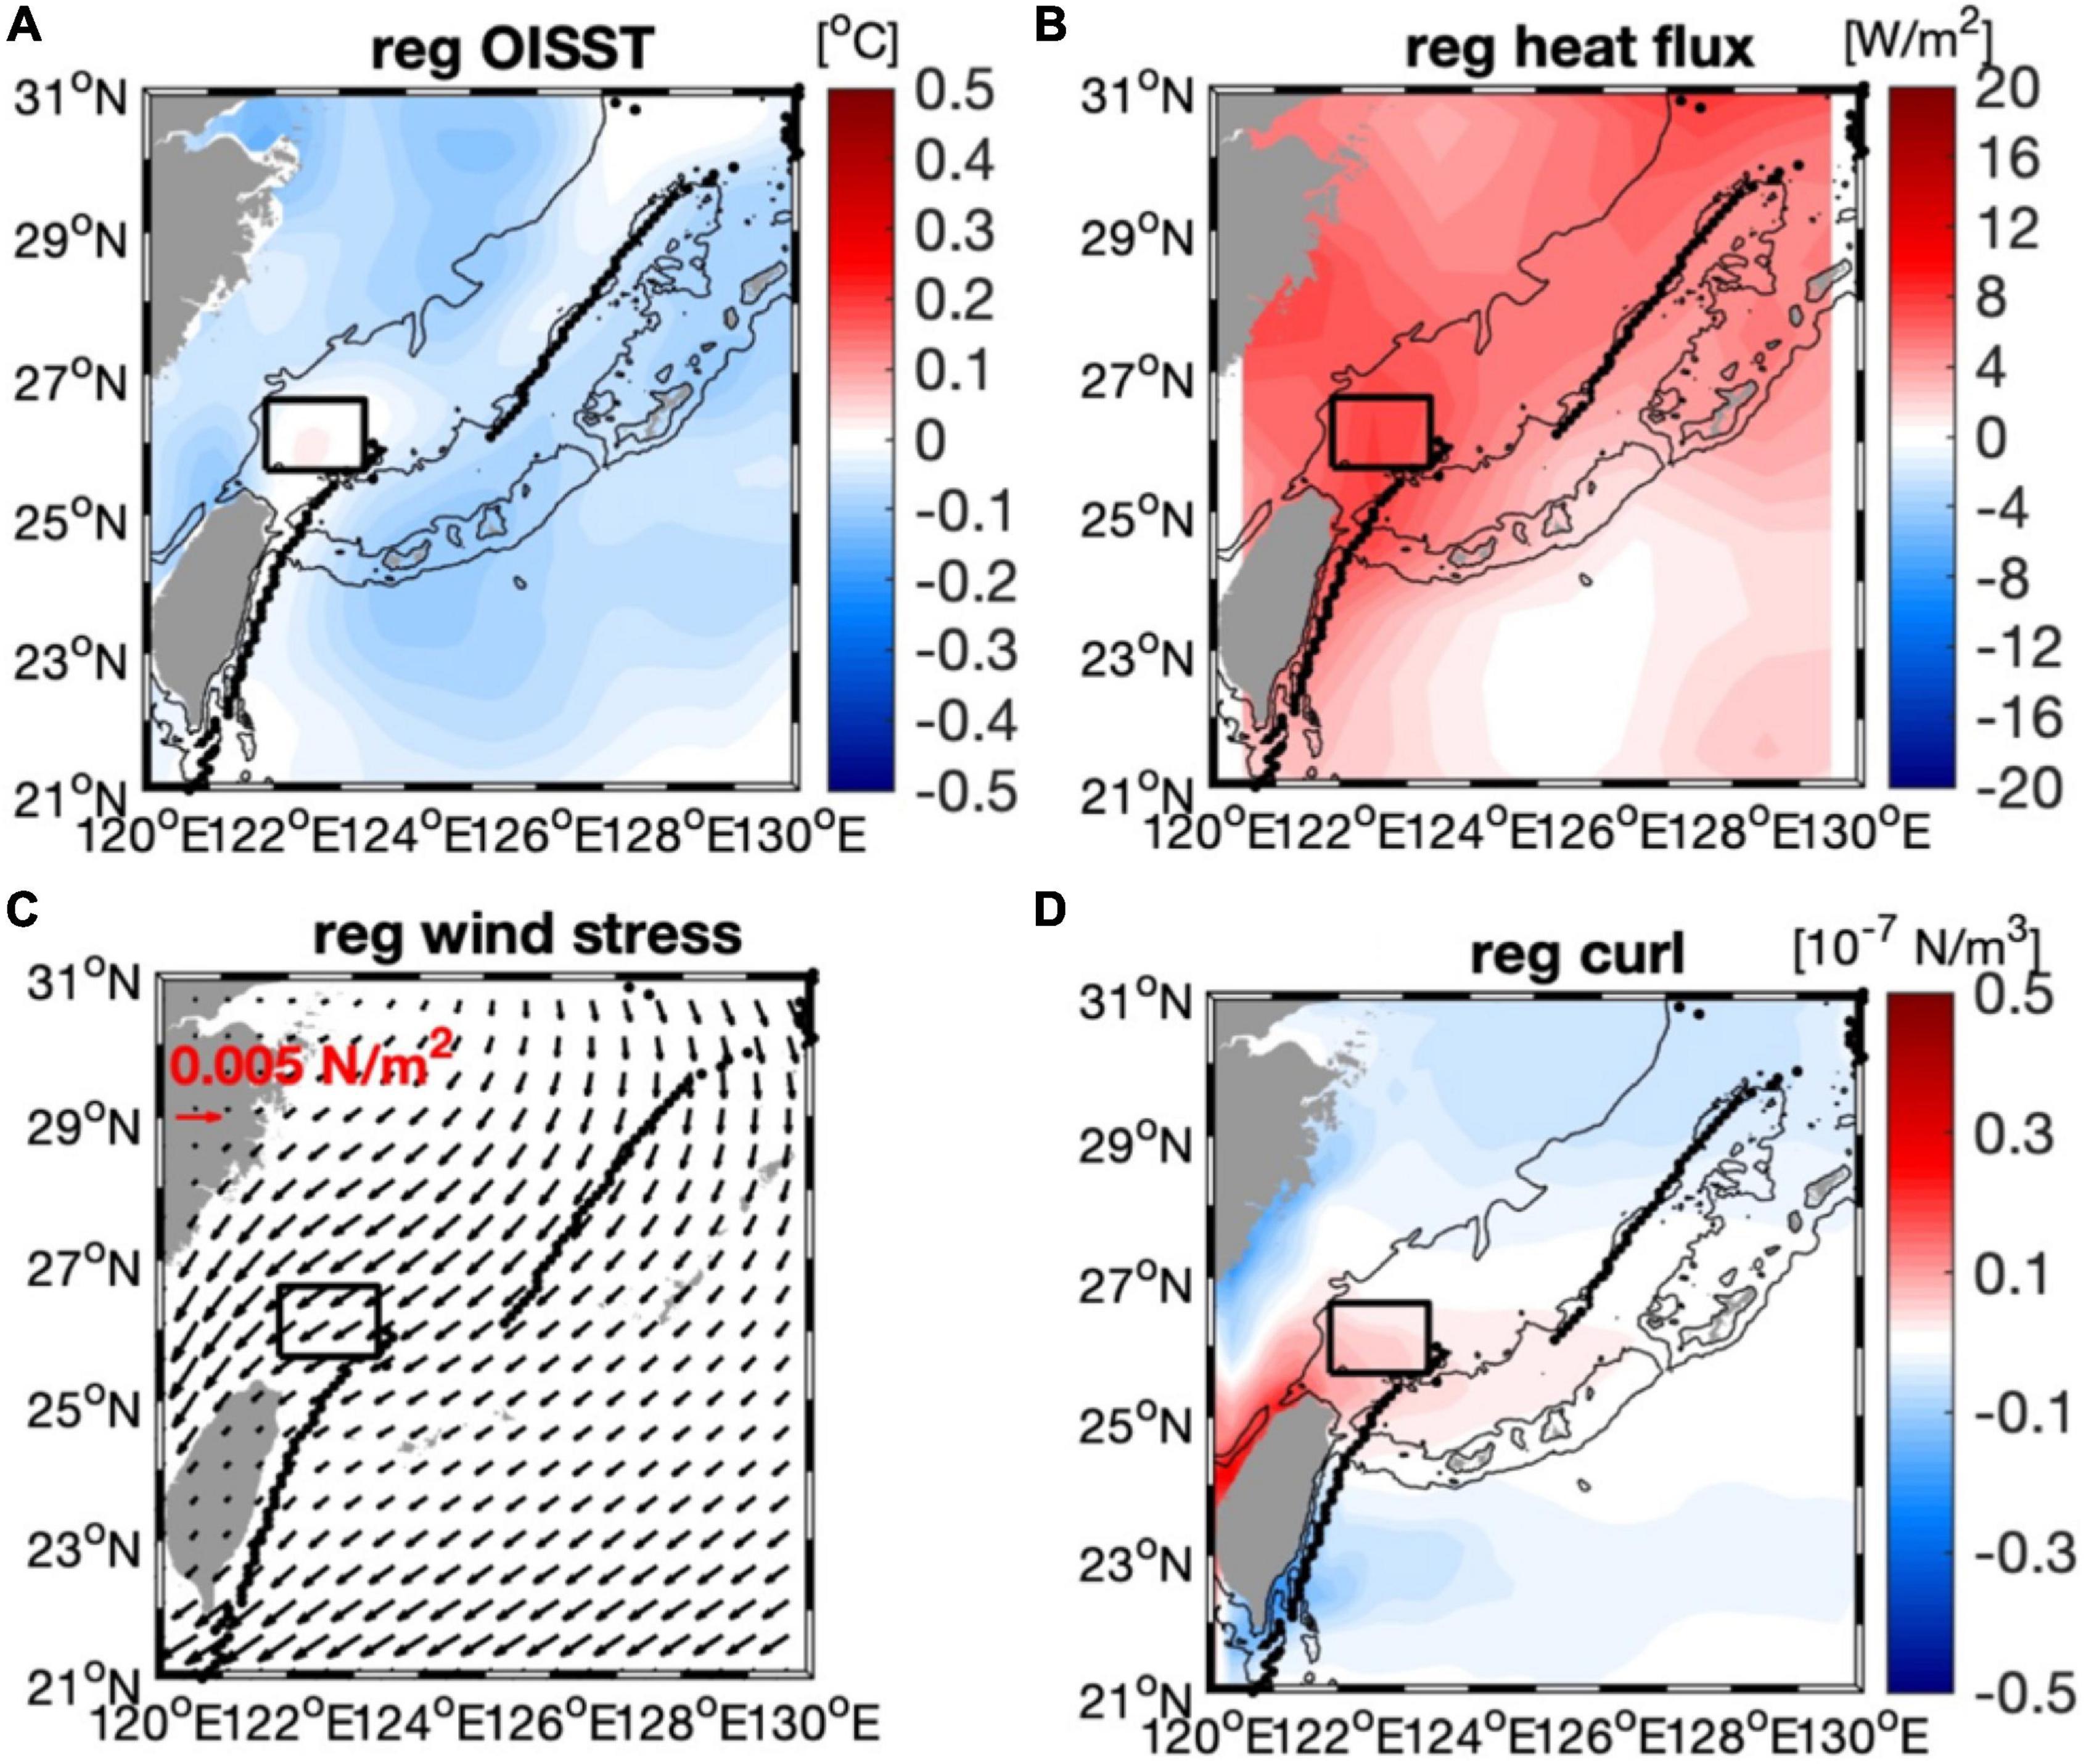
Figure 8. Regressed anomalies of (A) SST, (B) surface heat flux, and (C,D) wind stress and wind stress curl targeting the KSI strength mode. The R-squared values are 0.37, 0.73, 0.76, and 0.81, respectively. The mean path of the Kuroshio is displayed as black dots. Black squares denote the KSI domain.
Figures 8C,D show the relationships between KSI variability and wind stress (R-squared value: 0.76) and wind stress curl (R-squared value: 0.81) variability. Northeasterly wind stress anomalies are observed over the ECS during the stronger KSI periods. The northeasterly wind stress induces onshore Ekman transport, which is associated with the westward shift of the Kuroshio in the ECS (Guo et al., 2006). Wang and Oey (2014) also suggested that the strengthened northeasterly wind is one of the most important contributors to the strengthening of the KSI. It is interesting to note that the wind stress anomalies are stronger and more closely aligned with the direction of the Kuroshio axis in the southern ECS compared to the northern ECS. Furthermore, the anomalies are stronger to the west of the Kuroshio axis than to the east, which is associated with and consistent with the positive wind stress curl anomalies in the southern ECS.
Chow et al. (2015) showed that the strengthened KSI affects the local SST increase, which is linked with the lower atmospheric variability, including wind and precipitation. The regression results in Figure 8 suggest that the surface heat flux may play an important role in the strong air-sea interaction northeast of Taiwan, associated with the KSI variability. Comparison between the temporal variability of the KSI strength mode and the surface ocean environmental variables also shows that the surface heat flux variability is better correlated with the KSI variability compared to the SST variability (Figure 9A). A close relationship between the wind and KSI variability in Figure 9B indicates that the regressed wind anomalies over the ECS in Figures 8C,D are responsible for the long-term variability of the KSI. In terms of the relationship between the wind anomalies and large-scale climate index, Wu et al. (2014) reported that the weak KSI events in 1997 and 2003 occurred when the PDO index and Niño3.4 index were both positive. The negative relationship between the KSI strength and the two climate indices is observed in some years, including the El Niño years (Figure 9C). However, the negative relationship is not statistically significant; the correlation coefficients with the PDO index and Niño3.4 index are −0.33 and −0.29, respectively.
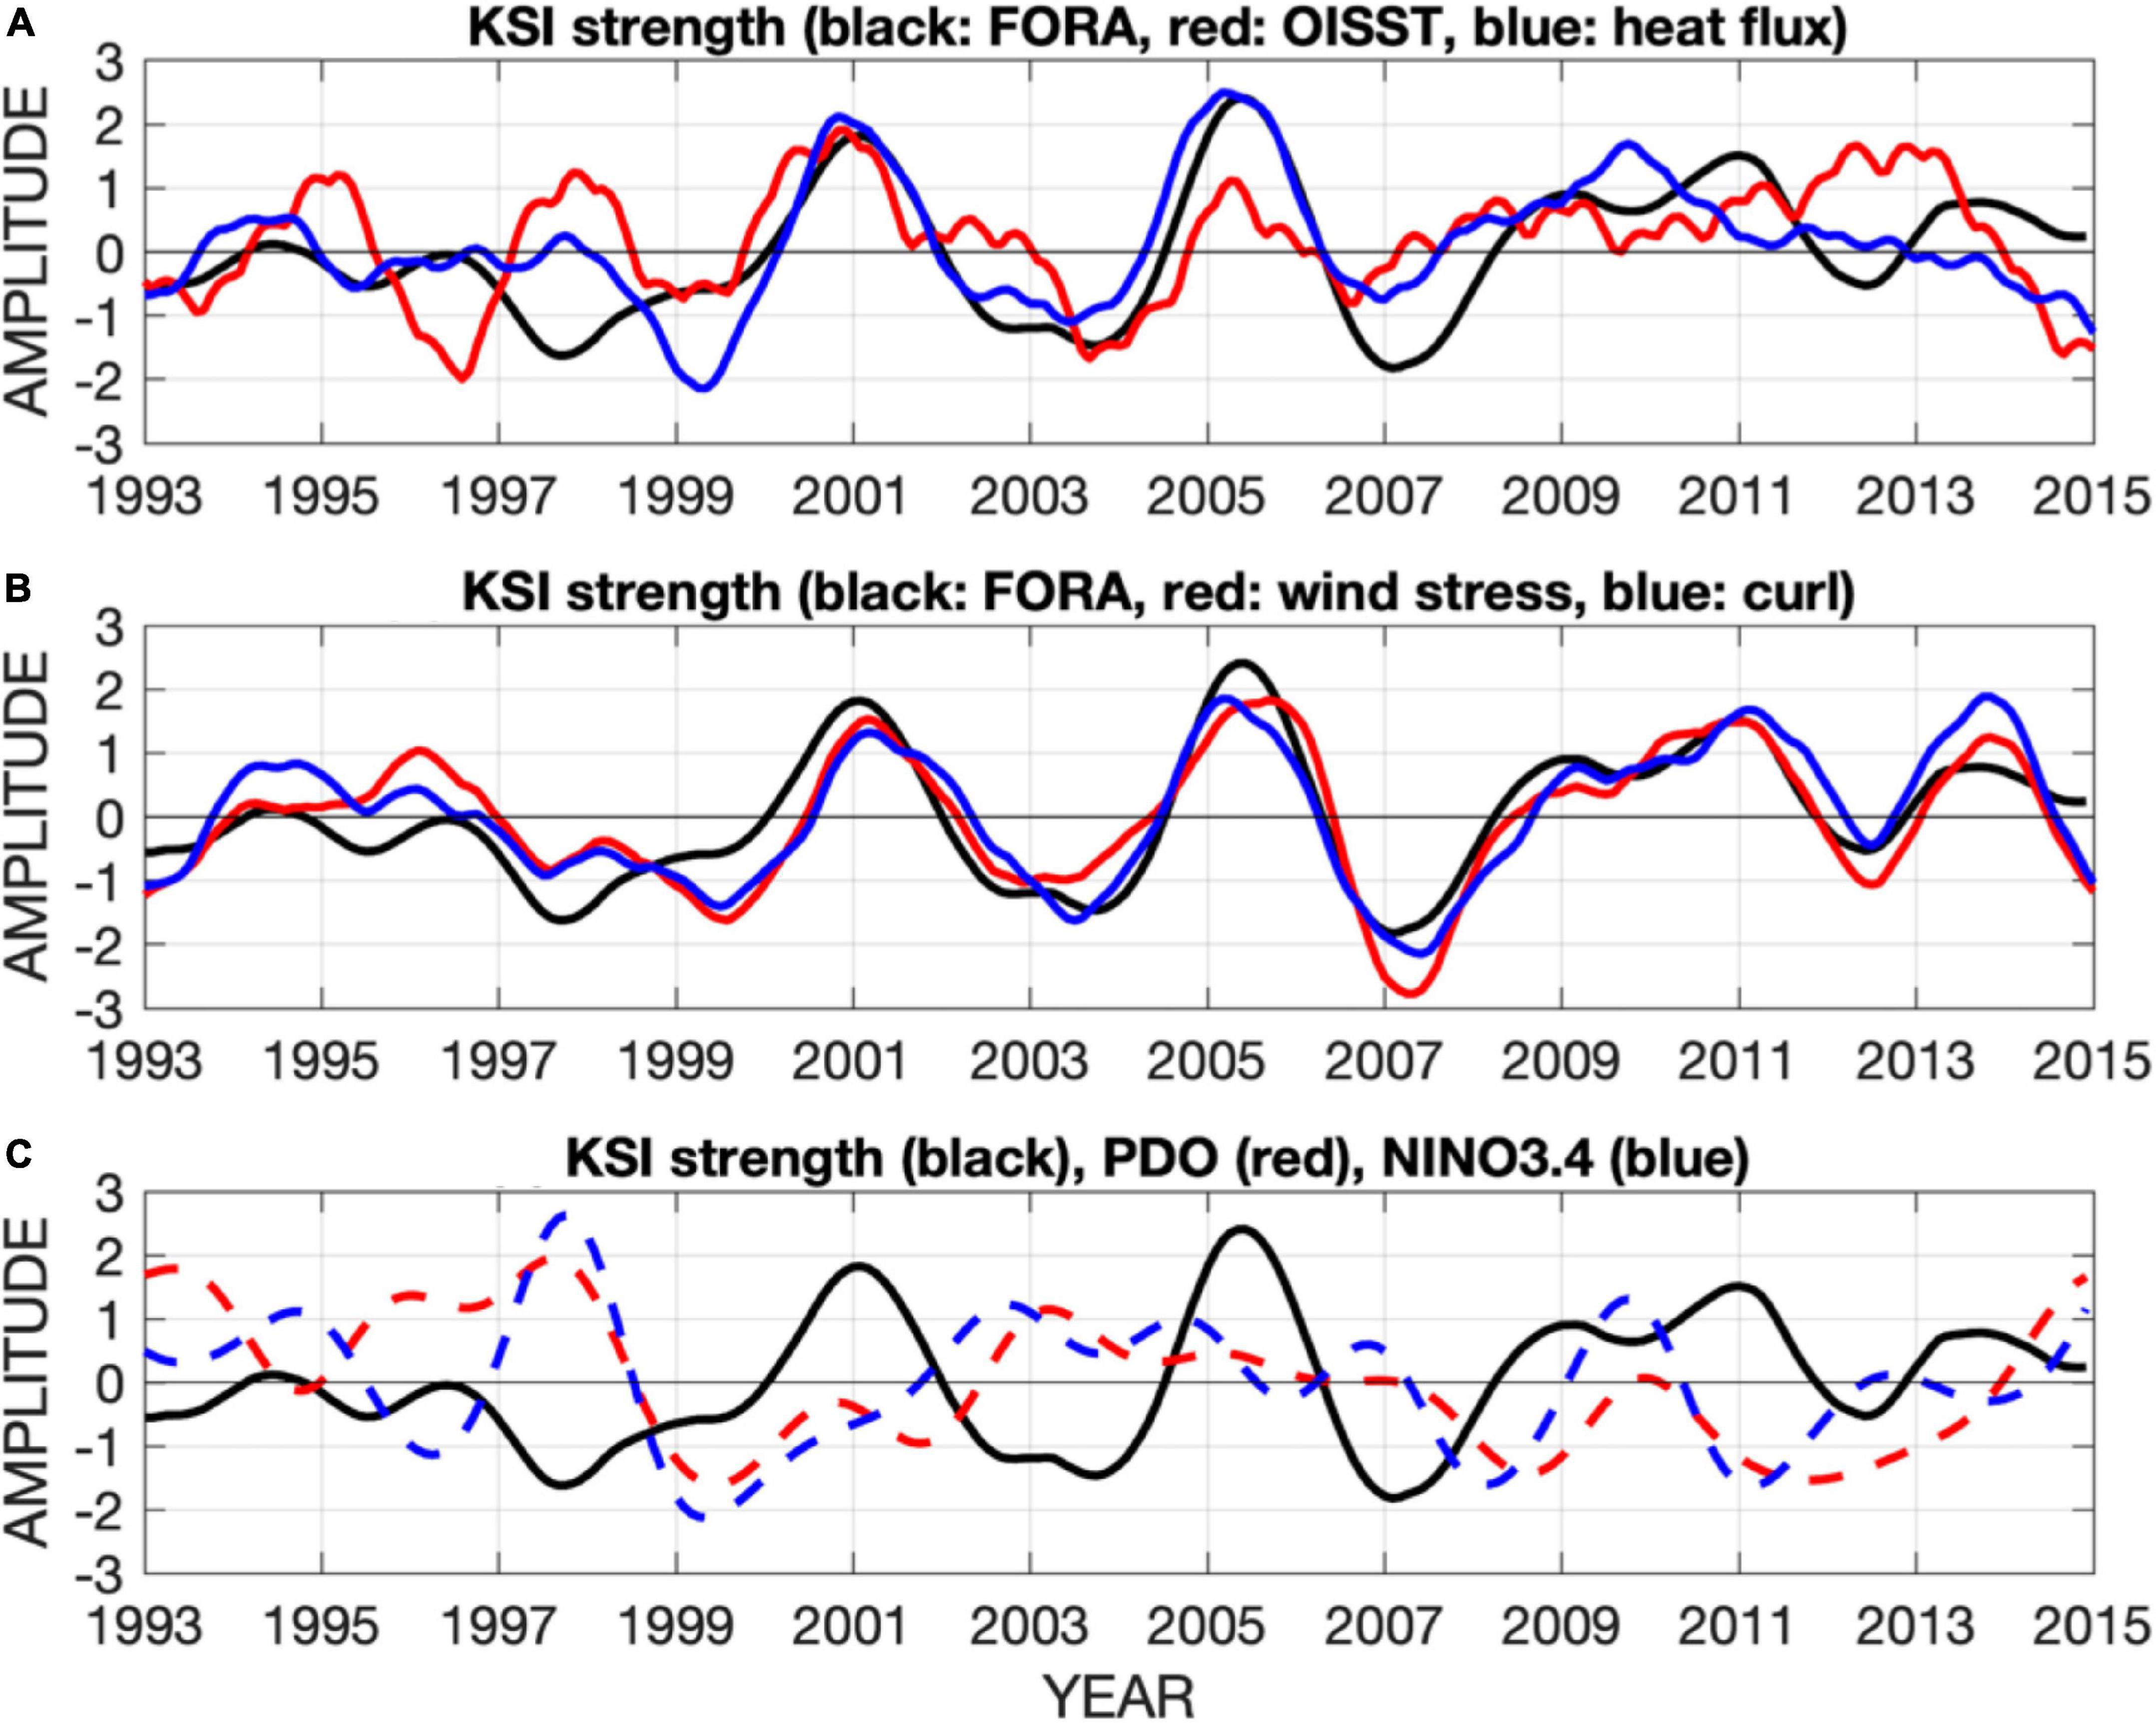
Figure 9. Comparison of the temporal variability of the KSI strength mode, K_index(t) (black) with (A) the regressed time series of SST (red) and surface heat flux (blue), (B) the regressed time series of wind stress (red) and wind stress curl (blue), and (C) the PDO index (red) and Niño3.4 index (blue). The PDO index and Niño3.4 index were 12-month low-pass filtered after removing seasonal climatology. The spatial pattern of the KSI strength mode is displayed in Figure 3. The regressed anomalies of the surface ocean environmental variables over the ECS are presented in Figure 8.
This study investigated the long-term variability of the KSI northeast of Taiwan and its associated changes in current and temperature variations in the surface and subsurface ECS. With regards to current speed, the shelf region of the ECS shows vertically homogeneous changes according to KSI variability. The onshore advection of offshore water masses during strong KSI phases may accompany the transport of heat, salt, and nutrients, thereby influencing the regional ECS ecosystem (Sassa and Konishi, 2015; Chen et al., 2016; Lian et al., 2016; Liu et al., 2021). In the case of temperature, strengthening or weakening of the KSI induces different changes in the near-surface and deeper layers. The KSI-associated temperature changes in the surface layer may be dampened by the surface turbulent heat fluxes on the long-term time scale. Furthermore, subsurface warming during strong KSI phases could decrease the vertical temperature difference and contribute to reducing vertical stratification in the shelf region as shown in Figure 7. The weakening or strengthening of the vertical stratification in the shelf region would have important implications for ocean mixing and ecosystem variability in the ECS (Yamaguchi and Suga, 2019). Overall, by expanding our understanding of the KSI variability and its associated changes in the surface to subsurface ocean layers, this study would contribute to the study of climate and ecosystem variability in the ECS.
Data Availability Statement
The original contributions presented in the study are included in the article/supplementary material, further inquiries can be directed to the corresponding author.
Author Contributions
JK and HN conducted the analysis, discussed the results, wrote the manuscript, and approved the submitted version.
Funding
This research was supported by the project titled “Deep Water Circulation and Material Cycling in the East Sea (20160040)” funded by the Ministry of Oceans and Fisheries, South Korea, and the National Research Foundation (NRF) of Korea grant funded by the Korean government (MSIT) (No. 2019R1C1C1010446).
Conflict of Interest
The authors declare that the research was conducted in the absence of any commercial or financial relationships that could be construed as a potential conflict of interest.
Publisher’s Note
All claims expressed in this article are solely those of the authors and do not necessarily represent those of their affiliated organizations, or those of the publisher, the editors and the reviewers. Any product that may be evaluated in this article, or claim that may be made by its manufacturer, is not guaranteed or endorsed by the publisher.
Footnotes
- ^ http://marine.copernicus.eu
- ^ https://www.ncdc.noaa.gov/oisst/data-access
- ^ http://www.remss.com/measurements/ccmp
- ^ http://oaflux.whoi.edu
- ^ https://www.ncdc.noaa.gov/teleconnections/pdo/
- ^ https://climatedataguide.ucar.edu/climate-data/nino-sst-indices-nino-12-3-34-4-oni-and-tni
References
Andres, M., Jan, S., Sanford, T. B., Mensah, V., Centurioni, L. R., and Book, J. W. (2015). Mean structure and variability of the Kuroshio from northeastern Taiwan to southwestern Japan. Oceanography 28, 84–95.
Andres, M., Mensah, V., Jam, S., Chang, M.-H., Yang, Y.-J., Lee, C. M., et al. (2017). Downstream evolution of the Kuroshio’s time-varying transport and velocity structure. J. Geophys. Res. Oceans 122, 3519–3542. doi: 10.1002/2016jc012519
Chang, Y. L., and Oey, L. Y. (2011). Interannual and seasonal variations of Kuroshio transport east of Taiwan inferred from 29 years of tide-gauge data. Geophys. Res. Lett. 38:L08603.
Chang, M.-H., Jan, S., Mensah, V., Andres, M., Rainville, L., Yang, Y.-J., et al. (2018). Zonal migration and transport variations of the Kuroshio east of Taiwan induced by eddy impingements. Deep Sea Res. 131, 1–15. doi: 10.1016/j.dsr.2017.11.006
Chen, C.-T. A., Ruo, R., Pai, S. C., Liu, C. L., and Wang, G. T. F. (1995). Exchange of water masses between the East China Sea and the Kuroshio off northeastern Taiwan. Cont. Shelf Res. 15, 19–39. doi: 10.1016/0278-4343(93)e0001-o
Chen, Y. K., Chen, W. Y., Wang, Y. C., and Lee, M. A. (2016). Winter assemblages of ichthyoplankton in the waters of the East China Sea and surrounding Taiwan. Fish. Sci. 82, 755–769.
Chen, C.-T. A., and Guo, X. (eds) (2020). Changing Asia-Pacific Marginal Seas. Atmosphere, Earth, Ocean, and Space. New York, NY: Springer. doi: 10.1007/978-981-15-4886-4
Chern, C. S., Wang, J., and Wang, D. P. (1990). The exchange of Kuroshio and East China Sea shelf water. J. Geophys. Res. 95, 16017–16023. doi: 10.1029/jc095ic09p16017
Chow, C. H., Liu, Q., and Xie, S.-P. (2015). Effects of Kuroshio intrusions on the atmosphere northeast of Taiwan Island. Geophys. Res. Lett. 42, 1465–1470.
Chuang, W. S., and Liang, W. D. (1994). Seasonal variability of intrusion of the Kuroshio water across the continental shelf northeast of Taiwan. J. Oceanogr. 50, 531–542.
Guo, X. Y., Miyazawa, Y., and Yamagata, T. (2006). The Kuroshio onshore intrusion along the shelf break of the East China Sea: the origin of the Tsushima warm current. J. Phys. Oceanogr. 36, 2205–2231.
Hsin, Y.-C., Qiu, B., Chiang, T.-L., and Wu, C.-R. (2013). Seasonal to interannual variations in the intensity and central position of the surface Kuroshio east of Taiwan. J. Geophys. Res. Oceans 118, 4305–4316.
Jan, S., Yang, Y. J., Wang, J., Mensah, V., Kuo, T. H., Chiou, M. D., et al. (2015). Large variability of the Kuroshio at 23.75°N east of Taiwan. J. Geophys. Res. Oceans 120, 1825–1840.
Jan, S., Mensah, V., Andres, M., Chang, M.-H., and Yang, Y. J. (2017). Eddy-Kuroshio interactions: local and remote effects. J. Geophys. Res. 122, 9744–9764.
Kim, K.-Y., North, G. R., and Huang, J. (1996). EOFs of one-dimensional cyclostationary time series: computations, examples, and stochastic modeling. J. Atmos. Sci. 53, 1007–1017. doi: 10.1175/1520-0469(1996)053<1007:eoodct>2.0.co;2
Kim, K.-Y., and North, G. R. (1997). EOFs of harmonizable cyclostationary processes. J. Atmos. Sci. 54, 2416–2427. doi: 10.1175/1520-0469(1997)054<2416:eohcp>2.0.co;2
Kim, K. Y., Hamlington, B., and Na, H. (2015). Theoretical foundation of cyclostationary EOF analysis for geophysical and climatic variables: concepts and examples. Earth-Sci. Rev. 150, 201–218.
Lian, E., Yang, S., Wu, H., Yang, C., Li, C., and Liu, J. T. (2016). Kuroshio subsurface water feeds the wintertime Taiwan Warm Current on the inner East China Sea shelf. J. Geophys. Res. Oceans 121, 4790–4803.
Liu, Z. L., and Gan, J. P. (2012). Variability of the Kuroshio in the East China Sea derived from satellite altimetry data. Deep Sea Res. 59, 25–36. doi: 10.1016/j.dsr.2011.10.008
Liu, C. Y., Wang, F., Chen, X. P., and Von Storch, J. S. (2014). Interannual variability of the Kuroshio onshore intrusion along the East China Sea shelf break: effect of the Kuroshio volume transport. J. Geophys. Res. Oceans 119, 6190–6209. doi: 10.1002/2013jc009653
Liu, Z., Gan, J., Hu, J., Wu, H., Cai, Z., and Deng, Y. (2021). Progress of studies on circulation dynamics in the east China Sea: the Kuroshio exchanges with the shelf currents. Front. Mar. Sci. 8:620910. doi: 10.3389/fmars.2021.620910
Mensah, V., Jan, S., Andres, M., and Chang, M.-H. (2020). Response of the Kuroshio east of Taiwan to mesoscale eddies and upstream variations. J. Oceanogr. 76, 271–288. doi: 10.1007/s10872-020-00544-8
Sasaki, Y. N., and Yamada, Y. (2018). Atmospheric response to interannual variability of sea surface temperature front in the East China Sea in early summer. Clim. Dyn. 51, 2509–2522.
Sassa, C., and Konishi, Y. (2015). Late winter larval fish assemblage in the southern East China Sea, with emphasis on spatial relations between mesopelagic and commercial pelagic fish larvae. Cont. Shelf Res. 108, 97–111.
Soeyanto, E., Guo, X. Y., Ono, J., and Miyazawa, Y. (2014). Interannual variations of Kuroshio transport in the East China Sea and its relation to the pacific decadal oscillation and mesoscale eddies. J. Geophys. Res. Oceans 119, 3595–3616. doi: 10.1002/2013jc009529
Tang, T. Y., and Yang, Y. J. (1993). Low frequency current variability on the shelf break Northeast of Taiwan. J. Oceanogr. 49, 193–210. doi: 10.1007/bf02237288
Toda, M., and Watanabe, M. (2020). Mechanisms of enhanced ocean surface warming in the Kuroshio region for 1951–2010. Clim. Dyn. 54, 4129–4145.
Usui, N., Wakamatsu, T., Tanaka, Y., Hirose, N., Toyoda, T., Nishikawa, S., et al. (2017). Four-dimensional variational ocean reanalysis: a 30-year high-resolution dataset in the western North Pacific (FORA-WNP30). J. Oceanogr. 73, 205–233. doi: 10.1007/s10872-016-0398-5
Vélez-Belchí, P., Centurioni, L. R., Lee, D. K., Jan, S., and Niiler, P. P. (2013). Eddy induced Kuroshio intrusions onto the continental shelf of the East China Sea. J. Mar. Res. 71, 83–108. doi: 10.1357/002224013807343470
Wang, J., and Oey, L. Y. (2014). Inter-annual and decadal fluctuations of the Kuroshio in East China Sea and connection with surface fluxes of momentum and heat. Geophys. Res. Lett. 41, 8538–8546.
Wu, C. R., Hsin, Y. C., Chiang, T. L., Lin, Y. F., and Tsui, I. (2014). Seasonal and interannual changes of the Kuroshio intrusion onto the East China Sea Shelf. J. Geophys. Res. Oceans 119, 5039–5051.
Wu, C. R., Wang, Y. L., Lin, Y. F., and Chao, S. Y. (2017). Intrusion of the Kuroshio into the South and East China Seas. Sci. Rep. 7:7895. doi: 10.1038/s41598-017-08206-4
Yamaguchi, R., and Suga, T. (2019). Trend and variability in global upper-ocean stratification since the 1960s. J. Geophys. Res. Oceans 124, 8933–8948.
Yan, X., Zhu, X.-H., Pang, C., and Zhang, L. (2016). Effects of mesoscale eddies on the volume transport and branch pattern of the Kuroshio east of Taiwan. J. Geophys. Res. 121, 7683–7700.
Yang, Y., Liu, C. T., Hu, J. H., and Koga, M. (1999). Taiwan current (Kuroshio) and impinging eddies. J. Phys. Oceanogr. 55, 609–617. doi: 10.1126/science.aax5758
Yang, D., Yin, B., Chai, F., Feng, X., Xue, H., Gao, G., et al. (2018). The onshore intrusion of Kuroshio subsurface water from february to july and a mechanism for the intrusion variation. Prog. Oceanogr. 167, 97–115. doi: 10.1016/j.pocean.2018.08.004
Yin, Y., Lin, X., and Hou, Y. (2019). Seasonality of the Kuroshio intensity east of Taiwan modulated by mesoscale eddies. J. Mar. Sys. 193, 84–93.
Keywords: Kuroshio shelf intrusion, East China Sea, long-term variability, upper-ocean variability, Kuroshio path, Kuroshio axis
Citation: Kang J and Na H (2022) Long-Term Variability of the Kuroshio Shelf Intrusion and Its Relationship to Upper-Ocean Current and Temperature Variability in the East China Sea. Front. Mar. Sci. 9:812911. doi: 10.3389/fmars.2022.812911
Received: 10 November 2021; Accepted: 20 January 2022;
Published: 10 February 2022.
Edited by:
Ryan Rykaczewski, Pacific Islands Fisheries Science Center (NOAA), United StatesReviewed by:
Yeqiang Shu, Key Laboratory of Marginal Sea Geology, South China Sea Institute of Oceanology, Chinese Academy of Sciences (CAS), ChinaYuan-Pin Chang, National Sun Yat-sen University, Taiwan
Copyright © 2022 Kang and Na. This is an open-access article distributed under the terms of the Creative Commons Attribution License (CC BY). The use, distribution or reproduction in other forums is permitted, provided the original author(s) and the copyright owner(s) are credited and that the original publication in this journal is cited, in accordance with accepted academic practice. No use, distribution or reproduction is permitted which does not comply with these terms.
*Correspondence: Hanna Na, aGFubmEub2NlYW5Ac251LmFjLmty