 Francois Bastardie
 Sara Hornborg
 Friederike Ziegler
 Henrik Gislason
 Ole Ritzau Eigaard
- 1Section for Ecosystem-Based Management, Technical University of Denmark, Institute for Aquatic Resources, Kgs., Lyngby, Denmark
- 2Department of Agriculture and Food, Division of Bioeconomy and Health, RISE Research Institutes of Sweden, Göteborg, Sweden
Understanding the drivers of greenhouse gas emissions in food production systems is becoming urgent. For wild capture fisheries, fuel use during the fishing phase generally dominates emissions and is highly variable between fisheries. Fuel use is also essential for the economy of the fisheries, but fuel-intensive fisheries can still be profitable due to fuel subsidies, in particular, if the target species is of high value. Developing an innovative bottom-up approach based on detailed catch and spatial fishing effort data, in the absence of direct fuel data, we analysed the fuel use intensity (fuel use per kg landed) and economic efficiency (landing value per litre fuel used) of Danish capture fisheries for the period 2005-2019. An overall decline in fishing effort did not significantly affect the overall fuel use intensity and efficiency, which was stable for most of the fleet segments and marine species. Robust differences in fuel use intensity among individual fisheries, reflected differential spatial accessibility and vulnerability of target species to fishing. In addition, different fishing techniques targeting the same set of species showed differences in fuel use per unit landed. Danish seining and gillnets had a lower fuel use intensity and higher economic efficiency than demersal trawling; and purse seining than pelagic trawling. The variability between stocks and fleets also indicates that there is generally potential for improvement in overall efficiency from improved stock status. Short-term management actions to promote the best available fuel-efficient fishing techniques combined with additional long-term actions to secure the recovery of stocks have the potential to reduce fishery greenhouse gas emissions. Sustainable fisheries and normative environmental management are crucial to developing incentives towards reducing fuel use whenever the fishing sector industry and science work jointly at implementing solutions, as incentives for the industry to reduce fuel use are limited as long as the fishing activity is profitable.
1 Introduction
A global challenge for capture fisheries is to promote fishing practices that minimize their environmental impacts while maximizing the societal value generated (Pikitch et al., 2004, Ziegler et al., 2016a). One major impact from fisheries is generally high levels of fuel use leading to greenhouse gas emissions, especially given that fuel is in many cases subsidised depending on country-specific fuel tax policy (EP, 2013; Ziegler and Hornborg, 2014; Sumaila et al., 2019; Schuhbauer et al., 2020, Skerritt et al., 2020). Since fuel use is also an essential aspect of the fishing economy, finding less fuel-intensive fishing practices for seafood production has been an issue for several decades (FAO, 1995). Extensive efforts have therefore been made to find innovative technical solutions for saving fuel, including modernization and renewal of the fishing fleet, investments in energy-efficient propellers, gears and other equipment, replacement of engines, and the construction of new energy-efficient vessel hulls and other energy-efficient procedures for fishing activities (e.g., Sala et al., 2011; Suuronen et al., 2012; Basurko et al., 2013; Parker et al., 2017; Byrne et al., 2021). However, energy use is now further challenging the fishing capture sector because of the need to end the use of fossil fuels and the episodic rise in fuel prices, which will likely rise again over the coming years e.g., EC, 2022). Furthermore, the influence of fisheries management on fuel use has received increased attention, such as the importance of gear-technical regulations, quota setting and other management actions (Tyedmers et al., 2005; Audsley et al., 2009; Driscoll and Tyedmers, 2010; Abernethy et al., 2010; Farmery et al., 2014; Hornborg and Smith, 2020).
The overarching aim of the Common Fisheries Policy (CFP, EU 2013) of the European Union (EU) is to ensure that fishing is environmentally, economically and socially sustainable. The goal is to optimize economic activity and societal value (art.33) while seeking to minimize the impact on the relevant ecosystem. Therefore, policymakers and managers in EU Member states should provide incentives to fishing vessels deploying selective fishing gear or using fishing techniques with reduced environmental impact, such as reduced energy consumption and habitat damage (Figure 1). However, operationalizing these policy ambitions is a complex task. For example, fishing practices performing equally from an economic perspective may have different ecosystem impacts (e.g., Bastardie et al., 2013, Dinesen et al., 2018). Furthermore, although lower carbon footprint aligns with policy ambitions to minimize the effects on marine ecosystems (ambitions described in EC, 2013 art.17 and EU Blue Growth agenda perspective in EC, 2021c), such ambitions also tacitly assumes that the adverse environmental effects are minimal when the fleet is economically and energy-efficient. However, if reducing fuel use has drawn increasing attention, it is still uncertain how and to what extent the resulting economic income from catches could be decoupled from this reduction to at least maintain the same profitability (e.g., Haberl et al., 2020). Any information about how this decoupling could be done is attractive to policymakers who want to identify efficient actions to meet environmental targets.
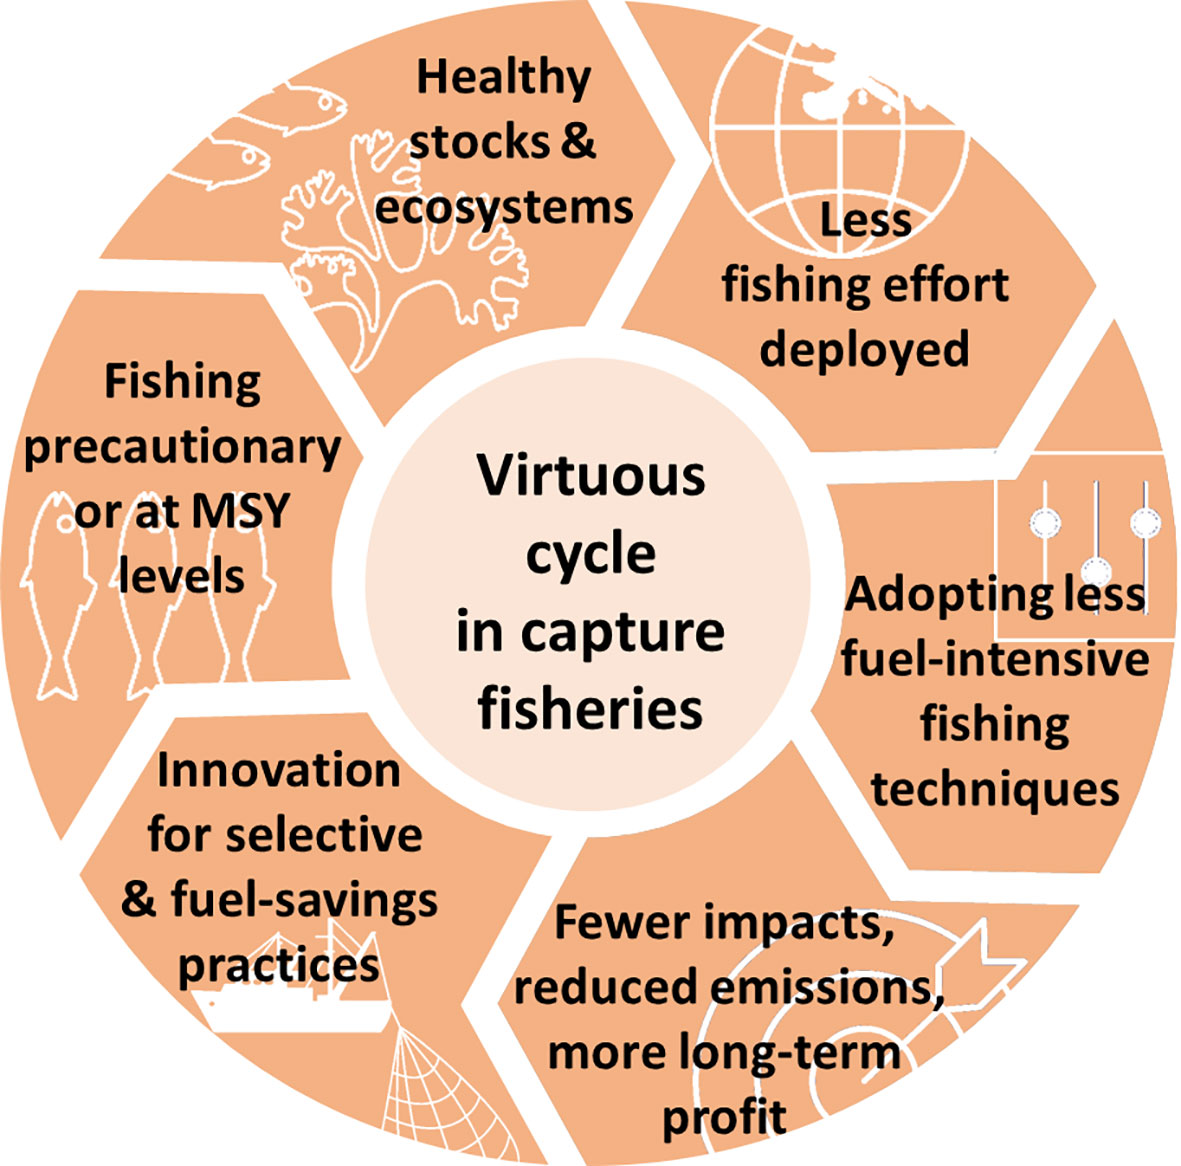
Figure 1 An idealized virtuous circle showing incremental steps that would provide incentives to fishing vessels deploying selective fishing gear or using fishing techniques with reduced environmental impact toward maintaining healthy and productive marine ecosystems supporting the fisheries and their future yields.
What drives the fuel and economic efficiency of fisheries needs to be better understood by collating and analysing more data (Schau et al., 2009; Sala et al., 2011; Ziegler and Hornborg, 2014; Parker et al., 2015; Parker and Tyedmers, 2015; Jafarzadeh et al., 2016; Byrne et al., 2021). Identifying the most efficient production methods between different fishing techniques and management systems may ultimately promote environmentally friendly fishing practices. Ideally, data on fuel use would be collected and be readily available for all fisheries for this type of analysis. However, high-resolution data on fuel use in fisheries are very sparse and almost never publicly available, which is why different approaches of estimating fuel use indirectly have been developed. Engine power and fishing effort are two central parameters determining fuel use and have previously been used to estimate the fuel use of fisheries with reasonable accuracy, which has been shown through validation with actual fuel use data (Tyedmers et al., 2001, Greer et al., 2019). If a relationship between landings per unit effort, stock size, fishing mortality and fuel use could be empirically established, it may be used to predict future fuel use intensity (FUI, defined as litres of fuel consumed per kg landed) and the potential for decarbonisation of fisheries (here from lowering the emissions linked to fuel used during the fishing operations) under different fisheries or environmental management scenarios.
Saving fuel and reducing emissions would also likely go hand-to-hand with higher economic returns and economic efficiency (defined here as landing value per litre fuel used). In this study, we have updated the methodology to estimate fuel use from fishing effort data developed in Bastardie et al. (2013) by refining the estimates of fuel use with the most recent effort data, and second, by relating fuel use to the economy and stock status of the most important fleet segments. We used the estimates to identifiy and discuss the potential for improving existing or future technical innovation-oriented approaches developed to minimize fuel use and potential leverages to reduce greenhouse gas emissions of the Danish fishing sector studied. Finally, the study aimed to measure the fuel use intensity defined as litres of fuel consumed per kg of fish landed and determine to what extent the fuel use intensity of Danish fisheries can be reduced/improved while catching the same volume of fish through management measures to improve stock status and/or using low-impact fishing techniques.
Fisheries management should integrate minimizing fuel use as a goal due to its importance for climate and fisheries economy. In this study, we found (i) that fuel use intensity and economic efficiency did not show specific trends over a 15-year period and across all segments of the Danish fishing fleet, (ii) that similar fishing efforts by different fleet segments showed differences in catch composition and volume that explain the relative difference in fuel use intensity, (iii) that fuel use intensity and economic efficiency generally improved with stocks closer to management targets, and (iv) that fuel use intensity reductions may be achieved by promoting a combination of technical solutions to reduce fuel consumption and management actions to improve stock status. Finally, we discuss the implications of alternatives to trade-offs between rebuilding stocks and ensuring that fishing businesses remain financially viable when implementing the uptake of energy-efficient fishing practices over time may also improve the health of exploited fish stocks.
2 Material & Methods
2.1 Segmentation of the Danish Fishing Fleet
The analysis splits the overall fishing effort of Danish vessels into fisheries based on the type of species being fished, area fished (ICES Subareas 27.3 (Skagerrak, Kattegat, Sound, Belt Sea, and Baltic Sea) and 27.4 (North Sea), see www.ices.dk), fishing gear type and gear mesh size used. The analysis distinguishes between the large and small vessels as they differ in the data source available (see below). The investigation further distinguishes the large from small gear meshes used by those vessels. The gear mesh variable is a solid explanatory factor for the target assemblage of species being caught by the diverse fleet segments. Finally, the analysis distinguishes the bottom contacting gears from the pelagic gears, as the difference in fuel use and fuel use intensity is found to be quite extensive. The segmentation into fisheries (or ‘métiers’) follows the European Data Collection Framework (DCF; EC, 2017) and is based on (i) a type of fishing gear (TBB: beam trawl; OTB: otter bottom trawl; OTT: multi-rig otter trawl; OTM: otter mid-water trawl; PS: purse seine; PTB: pair bottom trawl; PTM: pair mid-water trawl; SDN: anchored seine; SSC: fly shooting seine; GNS: set gillnet; and DRB: dredge, see https://datacollection.jrc.ec.europa.eu/wordef/fishing-activity-metier); (ii) a target assemblage of species (DEF: demersal fish; SPF: small pelagic fish; CRU: crustaceans; and MOL: molluscs, see EC, 2017); and (iii) a mesh size range for the trawl or the net (mm) to identify activities with similar exploitation patterns. This fleet segmentation provides consistent entities on which EU fisheries management and technical measures typically apply (EU, 2019, i.e., Technical Measure EU Regulation, EU Data Collection Framework). For example, in the DCF the fleet segment 27.3_SDN_DEF_>=120_0_0 refers to all vessels visiting FAO area 27.3 and using Danish Seine (SDN) gears, for targeting demersal fishes (DEF), with large mesh size (>120 mm), and not equipped with special device on gear (_0_0) (see Table 1). All Danish vessels were treated in the workflow, as described below, separated into larger vessels using bottom contacting gears or pelagic gears, and small, non VMS-equipped vessels (<12m). For the sole 2019 year, 263 Danish vessels out of 359 conducting bottom trawling were covered, representing 19000 out of the 24231 trips realized in this category. Also, 51 vessels conducting pelagic fisheries out of 60 in logbooks were treated, representing 1180 trips out of 1332 trips. Smaller non-VMS-equipped vessels (i.e. <12m) are treated in a separate category (see below). Hence, the coverage of the Danish fishing fleet was excellent as all the Danish vessels (having logbooks i.e. >8-10m) are accounted for in the analysis.
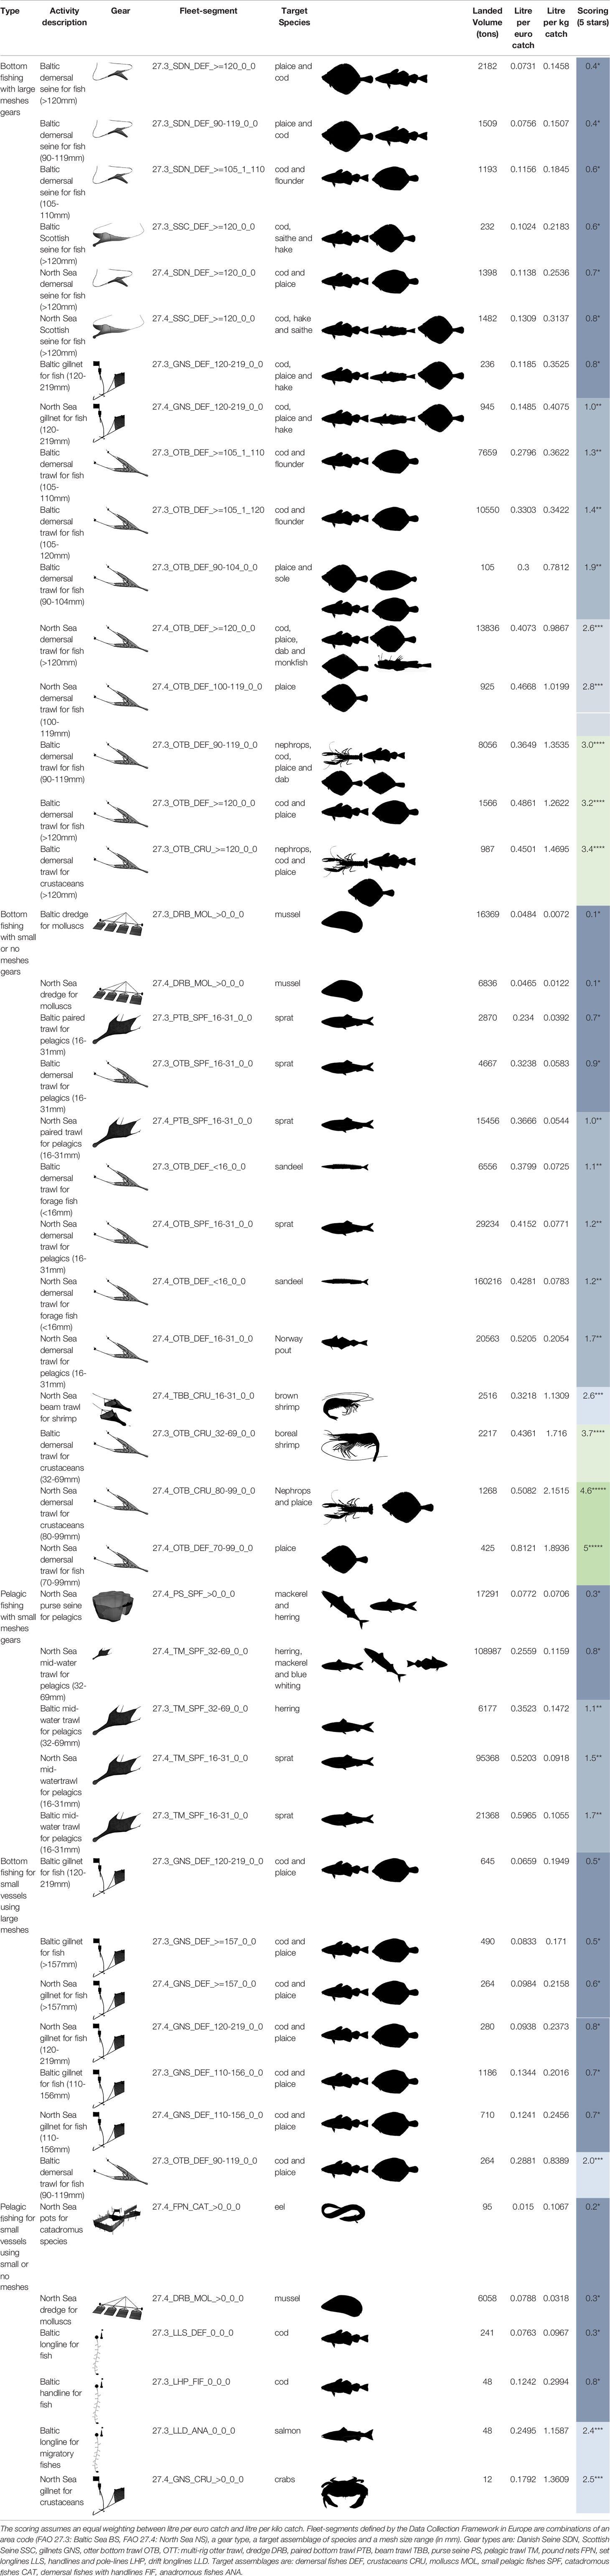
Table 1 Scoring Danish segments (relative average energy consumption in the period 2005 to 2019 is assessed as the average of per liter of diesel consumed per landing value and per kg landed per fishing trip after conversion of the two columns to percentage and expressed by stars on a scale from 1 to 5 (1-20 = ‘*’, 21-40 = ‘**’, 41-60 = ‘***’, 61-80 ='****', 81-100 = ‘*****’, with equal weight for monetary value vs kg catch), ordered from less (*, deep blue) to more fuel intense (*****, deep green) per type of fishing on a scale of 5 stars.
2.2 Constructing Trends in Fuel Use Intensity and Scoring
A time series (2005–2019) of data was constructed on effort, catch volume and value based on the economic data collected under the EU data collection framework for European fishing fleets (EC, 2017) and reported in fishing vessels logbooks we merged with sales slips. The engine power of each vessel is also retrieved from the EU Fleet Register (https://webgate.ec.europa.eu/fleet-europa/index_en). As a basis for the estimation of the denominator “catch” of the fuel use intensity (FUI) indicator, trip-based records of retained catches in fishers logbooks were coupled with individual vessel geo-positioning data from satellite-based technologies (VMS, Vessel Monitoring System) data, which are mandatory in European waters for large fishing vessels (>12 m), following the approach developed by Hintzen et al. (2012). For smaller vessels (<12 m), for which carrying VMS equipment onboard is not compulsory, logbooks and AIS (Automatic Identification System, e.g., Natale et al., 2015) information were used. Trip-based data included departure hour date and arrival hour date of each fishing trip, landed amount in kg per species, visited area (i.e., ICES rectangle) and fishing gear used. This enabled estimates of the trip duration in hours for each trip of each recorded vessel, which data, combined with sales slips, also identify the origin of the retained catch for each gear in volume and value per area. The use of VMS or AIS, when available, is an add-on to identify where and when the effective effort takes place (i.e., fishing operations) by distinguishing the time within a trip dedicated to fishing (towing the gear) from the time to reach and return from the harbour (steaming time) based on vessel speed thresholds (Hintzen et al., 2012). VMS equipped vessels conducting bottom fishing (TBB, OTT, OTB, SSC, SDN, PTB, DRB) were treated identically with vessels operating pelagic fishing (PTM, OTM, PS), apart from the fact that no seafloor area swept is calculated for pelagic fishing.
For vessels equipped with VMS, fuel consumption per hour was based on the recorded engine power (kW) in logbooks as the primary explanatory factor for a maximum fuel consumption rate factor (fmax, in litre fuel per hour) (following Bastardie et al., 2013).
Empirical data on fuel use in fisheries in operation (energy audits of the annual fuel consumption data for 46 Danish vessels in 2009; Jakobsen, 2011) have shown a high correlation with the applied kW-based proxy for fuel consumption per hour (R2 = 0.78). Other factors are known to strongly influence the actual fuel use, such as the speed of the vessel (e.g., Ronen, 1982). Therefore, the speed of vessel s recorded in VMS data was used to decrease the theoretical maximal fuel consumption fmax during the steaming phase by a cubic factor (see Ronen, 1982), i.e., fuel consumption rate (litre per hour) at a given speed for a given vessel was estimated as the ratio of maximum fuel consumption rate factor frate (in L per hour) over the cube of the maximal observed speed smax of this vessel.
This corrective decrease in fuel consumption rate along with lower speed was, however, not applied during the fishing phases of vessels using towed gear. Indeed we should account for the resistance/dragging effect arising from towing a net in the water or on the seafloor and the decrease in speed is more the result of the resistance of the gear being dragged than a decrease in the use of the engine power. To account for this effect, we have assumed 90% of the developed maximal engine load during towing phases, as referred by Coello et al. (2015). As a rule of thumb, trawl designers are used to scaling the size of trawls to the performance of the engine, which has been confirmed by examining flow meter data of individual trips using trawl (Ole Eigaard, pers. comm.). Finally, using spatial VMS data linked to the official logbook declaration allows for an estimated fuel use and catch volume in a given location on a trip basis for each vessel.
For small vessels without VMS data but with departure and end dates in hours for each trip recorded in logbooks (vessels larger than 8 m in the Baltic Sea and 10 m in the North Sea), automatic identifier system (AIS) data was used for sampled vessels. The AIS was used for safety reasons on board any type of vessel at sea but was not mandatory and therefore does not cover the entire fishing vessel fleet. However, some vessels, including small vessels, carry the device on board. AIS is a system recording the positioning of the vessel every second and hence provides fine tracks of fishing vessel movement at sea. Using the AIS it is possible to deduce the speed profile for each sampled vessel knowing the distance traveled every second during the individual trips of that vessel. Aggregate speed profiles makes it possible to obtain an average speed profile per fleet segment per trip and calculate the fuel consumption. The typical fuel consumption per hour was computed from the vessel kW (as described above for the large VMS-equipped vessels), and typical activity-specific speed profile. Total consumption were deduced per vessel for each trip within the departure and arrival hour interval. For towed gear, as for the large vessels, instead of using the consumption deduced from the actual speed, we assumed that 90% of maximum vessel-specific speed fuel consumption occured within the speed interval for which vessel using towed gears were assumed to be towing a net (1.5 to 3.5 knots).
The average estimates at the fleet segment level (a certain number of vessels consuming a combined amount of fuel) result from aggregating individual vessel fuel use estimates and vessel catch data, eventually expressing the average by species in volume (from the declaration in logbooks) and in monetary value (from the sales slip). For these segments, estimates were provided for fuel use intensity (FUI, fuel used per kg landed), catch-fuel efficiency (CPUF, kg catch landed per litre fuel) consumed during the entire trip (steaming and fishing phases), and economic efficiency (VPUF, landing value (EUR) per unit of fuel), the latter as uptake in cash profit for the fisheries segments. The metrics were first compared at the métier level with an additional split of vessels by length categories (0-12 m, 12-18 m, 18-24 m, 24-40 m, >40 m) to identify the contribution of vessel length in the estimates, but the estimates were similar and are therefore not presented further.
Finally, a scoring of Danish segments is presented based on FUI estimates. The scoring combines each fleet segment of the average litre of consumed fuel per EUR catch with the average litre per kg catch (FUI), after conversion of the two columns to percentages across fleet segments. The scoring, further standardized to 0 to 5, assumes an equal weighting between litre per euro catch and litre per kilo catch. For example, some fisheries could score low (i.e. more efficient toward 0) because it would provide a high value per unit of fuel, but possibly with low kg per unit of fuel. However, better scores are expected for fleet segments that simultaneously offer high monetary value and high kg per unit of fuel.
2.3 Fuel Use and Catch Efficiency in Relation to Stock Status
We used our catch-fuel efficiency (CPUF) estimates in order to evaluate a possible correlation between fuel use and change in stock size of the targeted species over the 2005-2019 period. In Europe, the performance of fisheries management in achieving targets of sustainable fishing pressure on a specific stock is assessed against the stock-specific F/FMSY ratio, for which a F/FMSY value lower than 1 indicates that the stock is being harvested sustainably (STECF, 2020a).
Once the dataset on different fisheries CPUFs was established, the fishing mortality (F) for the most recent year available and the target fishing mortality (FMSY) were obtained for each stock to compute the F/FMSY ratios (STECF, 2020a). For the Northeast Atlantic Ocean area (FAO area 27), the data were based on data from the ICES website in 2020 (http://standardgraphs.ices.dk), comprising the most recent published assessments, conducted up to and including 2019. The cross-correlations of time series of CPUFs and F/FMSY were computed with the cross-correlation function available in R (CCF in the R programming language, R teams 2021). This function uses approved time-series analyses such as the ARIMA model in R (e.g., Shumway and Stoffer, 2006; Jafarzadeh et al., 2015), which describes the relationships between two different time series yt and xt by identifying lags of the x-variable that might be valuable predictors of y. In our case, the analyses are useful to account for possible time lag effects to detect possibly misleading correlations between high effort and low F during the period of increasing abundances, and low effort with high F in periods of declining abundance. Another limitation in finding out meaningful correlations we cannot exclude would result from the fact that FMSY may be achieved before stock biomasses are entirely rebuilt. In such cases, although F/FMSY ratios is the current performance criteria measured for the monitoring of the EU Common Fisheries Policy, these ratio values may relate only partially to the actual biomass available and vulnerable to fishing in the sea, and even less to the catch per unit fuel metric.
The analysis here aggregates individual fishing trips to provide estimates of fuel use for a number of selected fisheries and species. This breakdown offers different opportunities than earlier studies (e.g., Van Marlen et al., 2009; Guillen et al., 2015) that aggregate fuel use and catch per (EU Data Collection Framework) fleet segment, and not per species, and thus makes it difficult to disentangle the relative fuel use intensity and the catch-fuel efficiency of individual fisheries and species. Yet, this breakdown of the overall fuel use per fished species might sometimes be misleading in mixed fisheries whenever several different species caught simultaneously are only marginally contributing to the catch volume for the same fuel input.
2.4 Limitations of the Effort-Based Approach
One limitation of our study is its reliance on theoretical model of fuel use instead of direct data based on field measurements of consumed fuel. These data will be remain unavailable as long as a monitoring programme collecting accurate data on fuel consumption at the vessel level will be lacking in EU. Although our estimation approach might bias in the estimates in absolute numbers, the relative change in fuel comsumption should be more robust. However, applying the same fuel use per h models depending solely on vessel speeds will always be prone to bias caused by additional aspects known to influence fuel use and catch efficiency, such as weather conditions, skipper and crew experience (Ruttan and Tyedmers, 2007) and general technological development and subsidized fleet renewals (Eigaard, 2009; Eigaard et al., 2014). Additionally, if engine power is underreported in the fleet register, the fuel consumption rate would be underestimated (EC, 2019). This problem is, however, likely not there for the Danish fleet case as no cases of infringement have been found (EC, 2019). Besides, we have only looked at the fuel consumption of the main engine while auxiliary engine may be embarked onboard vessels and used to supply electricity and hydraulic power onboard, which is also likely to depend on the vessel size and type of fishery (Basurko et al., 2013). Furthermore, the link between fishing effort spent at sea and fuel use is much weaker in passive fisheries (using coastal/static gear) than in active fishing techniques such as trawling (Tyedmers, 2001; Ziegler and Hornborg, 2014). In cases where both types of high-quality data have been available (e.g., Ziegler et al., 2016b; Ziegler et al., 2019), the effort-based indirect estimation has consistently resulted in considerably higher estimates than actual direct fuel use data. However, it is now possible to compare the results of the large versus the small vessels from this study directly due to the standardisation of the input data (coupled robust VMS-logbooks data compared to logbooks-partial AIS data for small vessels), even if there are still caveats analysing fuel use intensity for small vessels using passive gears with a kW-based approach because the fishing patterns (hours steaming or fished), and areas for fishing zones are unknown, and assumptions have to be made that are difficult to check (e.g., the use of an archetypical speed profile per activity deduced from the AIS data).
Declared catches in logbooks do not include the entire removals that deplete the fished stocks, as so-called discard of targeted species (with a TAC) occur during the operation of the fishing. Discarding was still allowed in Europe up to 1st of January 2019 when the Landing Obligation came into force. In our study, no attempt were made to raise the catch to include the non-retained and non-recorded part. The comparison of relative fuel use intensity and the link to stock status is therefore uncertain in that respect.
Even though identifying correlations between efficiencies and stock status is a first step, further investigations are needed due to the short length of the time series that might affect the present cross-correlation analysis. However, the hypothesis that the time series reflects a stationary process of the underlying biological dynamics is likely to be increasingly violated with a more extended time series, due for example to frequent technical changes in gear selectivity, advocating for restricting the analysis to a short time window of data. With a higher number of stocks assessed, the signal captured by the cross-correlation analysis will likely be improved, even if specifics to some stocks as shown here will remain. The more fundamental problem is that we thus far only have looked at correlations, not causation. Therefore, with longer time series, it would be worthwhile to apply a more robust method (e.g., Sugihara et al., 2012) to test if reduced fuel use intensity is the cause or, on the contrary, the result of stocks in better shape, or if both interact in a virtuous circle (Figure 1).
After the currently monitored recovery phase (STECF, 2020a), it is likely that for some fisheries, the link between fuel intensity and stock size becomes stronger, with catch rates increasing along with an increase in stock abundance resulting in a reduced fuel intensity. In contrast, even after recovery, other fisheries may still experience a flat relationship or show an inverse relationship, so that a period of greater fishing effort corresponds to a period of lower fishing mortality in the historical time series if the stock is high and vice versa if the stock is low (e.g., Kraak et al., 2013) and differs from the regressions that are forced through the origin (assuming that zero effort implies zero fishing mortality). Depending on the fleet adaptation and the stock level and density effects, this means that reductions in fishing effort may not translate (immediately) into equivalent reductions in fishing mortality and thus not in reducing the fuel use intensity. In our study, this translates into a negative lagged correlation between F/FMSY and CPUF. Besides this, if reduction in fishing effort would translate into saving fuel costs, it is uncertain how better stock development might increase the economic efficiency. There are other economic aspects that come into play in the make up of the income from landings and profit, especially the fish prices and fish price changes over time or among marketable categories, which is only partially touched upon in our evaluation. For example, even under the exact same catch limit, if any, it is be expected that the economic efficiency increase along with larger revenue from stocks in better shape just because large more priced individuals would be caught.
3 Results
3.1 Overall Trends 2005-2019
This study has provided a time series of estimated/calculated fuel used for each exploited stock and fleet segment and provided insights into how fuel use intensity and economic efficiency have varied over time and between targeted species, gears and fleet segments. The overall fuel use in Danish fisheries showed interannual variability without a general trend, resulting in an overall net increased fuel consumption per active vessel for a unit of effort hour (Figure 2). This excepts the fuel consumption for large pelagic vessels, which increased drastically in the three most recent years (2017-2019), while effort concomitantly dropped. Therefore, the underlying fishing effort deployed by the Danish fleet at sea continuously declined over the period 2005-2019, both measured in hours at sea and the number of active vessels (Figure 2). The largest decline in effort was found for the smaller vessel categories (<12 and 12-18 m, Supplementary Material Figure 1). A sharp decline in fishing effort was observed in 2008 for 12-18 m vessels conducting pelagic fisheries, likely arising from a restructuring of this fleet (Dinesen et al., 2018). Indeed, this decline in nominal effort over the 15 years is concomitant with implementing an ITQ system (since 2005, Dinesen et al., 2018) and reduction in capacity schemes in Europe (STECF, 2020b), explaining decommissioning of the smaller vessels. A decline in effort hours together with a constant or increased fuel consumption could be the result of vessels/engines becoming larger over time in the overall Danish fleet (Eigaard et al., 2011). Additionally, the total income from landings has been constant for vessels using bottom-contacting gears, while increasing for pelagic vessels, this latter at the highest level in the more recent years (Figure 2). Although the effort decreases in hours fished, the fuel consumption does not decrease accordingly because the remaining vessels were larger or have larger engines, which shows that effort deployed (in hours) was definitely not a sufficient proxy for fuel use intensity.
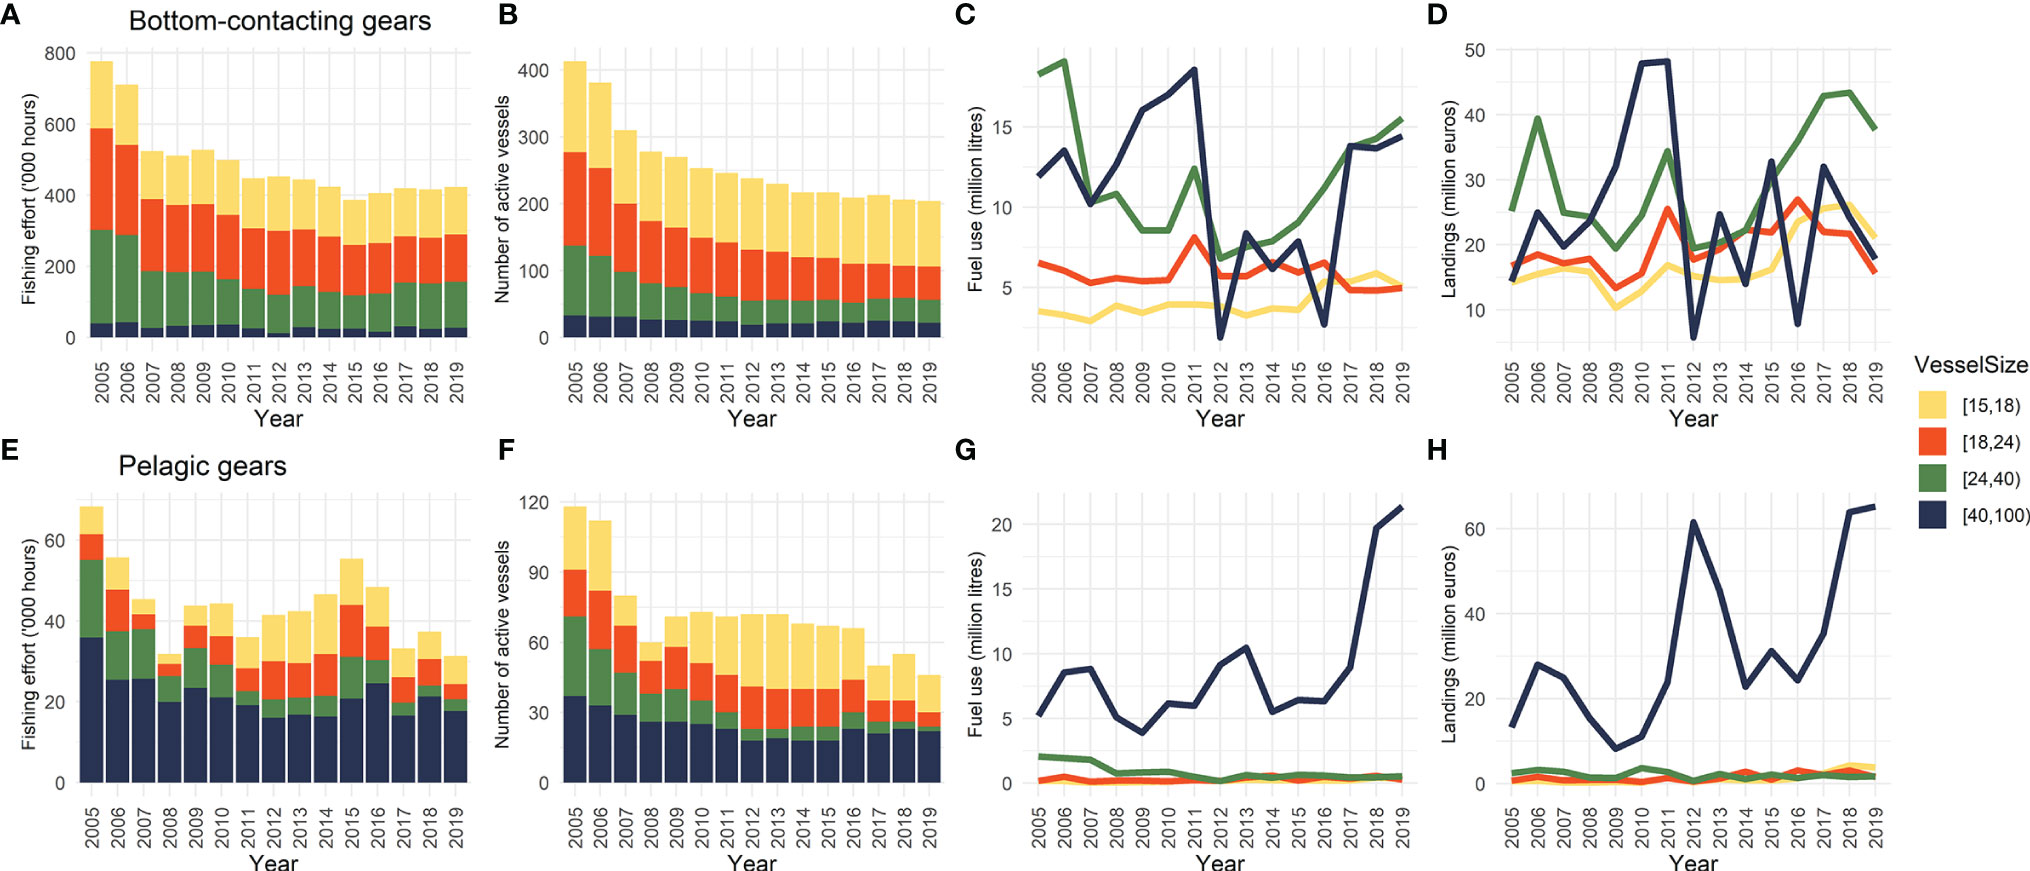
Figure 2 Time development for large VMS-equipped Danish vessels using bottom contact gears (top panel) or pelagic gears (bottom panel) of effective fishing effort (A, E), number of active vessels (B, F), fuel use (C, G), and landed value (D, H) during the period 2005-2019. The plots are sectored per vessel size category in metre (15-18m, 18-24m, 24-40m, >40m). Effective effort is deduced from the VMS positioning analysis coupled to logbooks.
Fuel use intensity estimates were found to be stable and consistent over the period for most segments because differences among segments were more extensive than changes over time. General patterns in the data showed that some vessels, regardless of size, use the same combination of gears, mesh sizes, and area visited, which leads to catches of similar assemblages of species. Larger vessels use mainly active gear (such as trawls, seines and dredges) that were dragged through the water, either on the seafloor with bottom-contacting gear or in the water column chasing for pelagic fish, whereas smaller vessels also deploy passive gear (such as nets, hook and line fishing, and pots and traps) depending on the species targeted. Therefore, the study outcomes were described below with regard to this broader fleet segmentation.
3.2 Large Vessels Using Bottom Contacting Gears and Small Gear Meshes
3.2.1 Forage Fish Fisheries
Fisheries using bottom-contacting gear in Danish waters and beyond are large and spatially diverse (Figure 3). Among them, bottom-contacting gear with small mesh sizes were the main catch methods for Danish fisheries (Supplementary Material Figure 2). The largest fuel consumption in overall volume consumed has occurred in the southern North Sea, catching high volumes of small fish per unit effort, such as sandeel Ammodytes spp. and European sprat Sprattus sprattus, or Norway pout Trisopterus esmarkii close to the Shetland Islands in the northern North Sea (Figure 4). In Denmark, sprat is fished by demersal and pelagic trawls. The fishery for sandeel made up a large share of total landings, landings value and fuel used of the whole Danish fleet over the period studied (Supp. data). These North Sea forage fish fleet segments demonstrated a low fuel use intensity (0.0771/kg for otter bottom trawl targeting sprat, Table 1) at an economic efficiency of 3.96 EUR/l and 0.0783 l/kg and 3.34 EUR/l for otter bottom trawl targeting sandeel in the North Sea (Table 1). Bottom trawling for sandeel showed large fluctuations in catch volume over the years. Bottom trawling for Norway pout also conducted with the largest vessels has a higher fuel use intensity (<0.2161 l/kg catch, Table 1), for an economic efficiency of 3.15 EUR/l. Each of these segments is specialized, landing only a few species (Figure 5). Other species, such as hake Merluccius merluccius, horse mackerel Trachurus trachurus and haddock Melanogrammus aeglefinus, are marine species bycaught by these fleets. For most fleet segments, the fuel use intensity was stable over 2005-2019, and it increased dramatically in 2018-2019 for the larger vessels active in the North Sea with the otter bottom trawl gear (Supplementary Material Figure 10).

Figure 3 Map showing, for all grounds fished by Danish demersal fishing vessels >12m in length, the species caught at highest value (EUR) per unit fuel (VPUF) during 2005-2019 (in FAO 22.3 Baltic Sea, FAO 22.4 North Sea and part of FAO 22.2 in North-East Atlantic) aggregated on 1x1 minute grid cells.
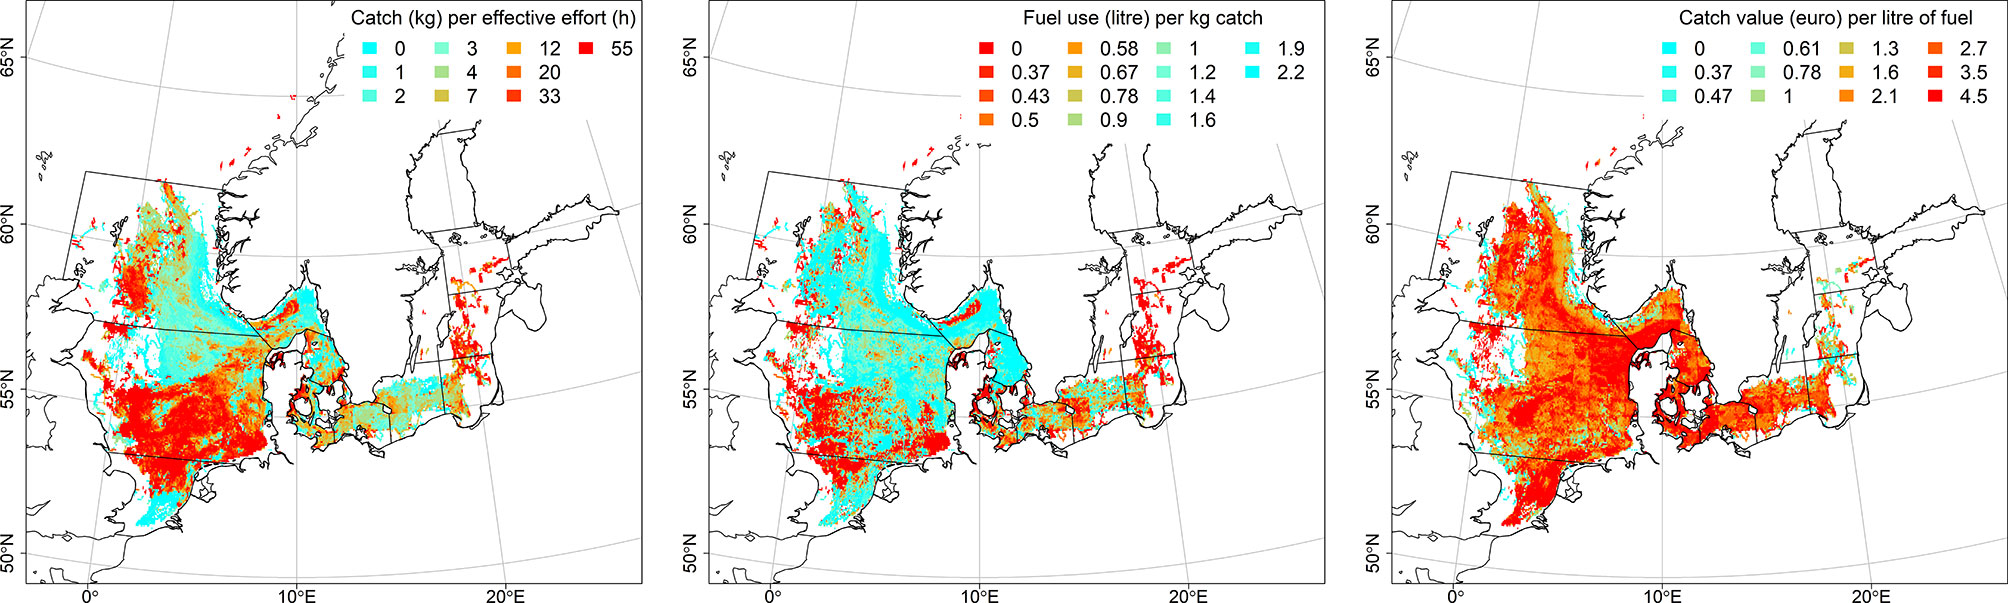
Figure 4 Average of indicators for bottom-contacting gears deployed during 2005-2019 by Danish fleets (in FAO 22.3 Baltic Sea, 22.4 North Sea, and part of 22.2, effort in other areas, e.g. Icelandic Waters, or EU Western Waters are not shown) aggregated on 1x1 minute grid cells. The larger grid corresponds to the FAO areas delineations.
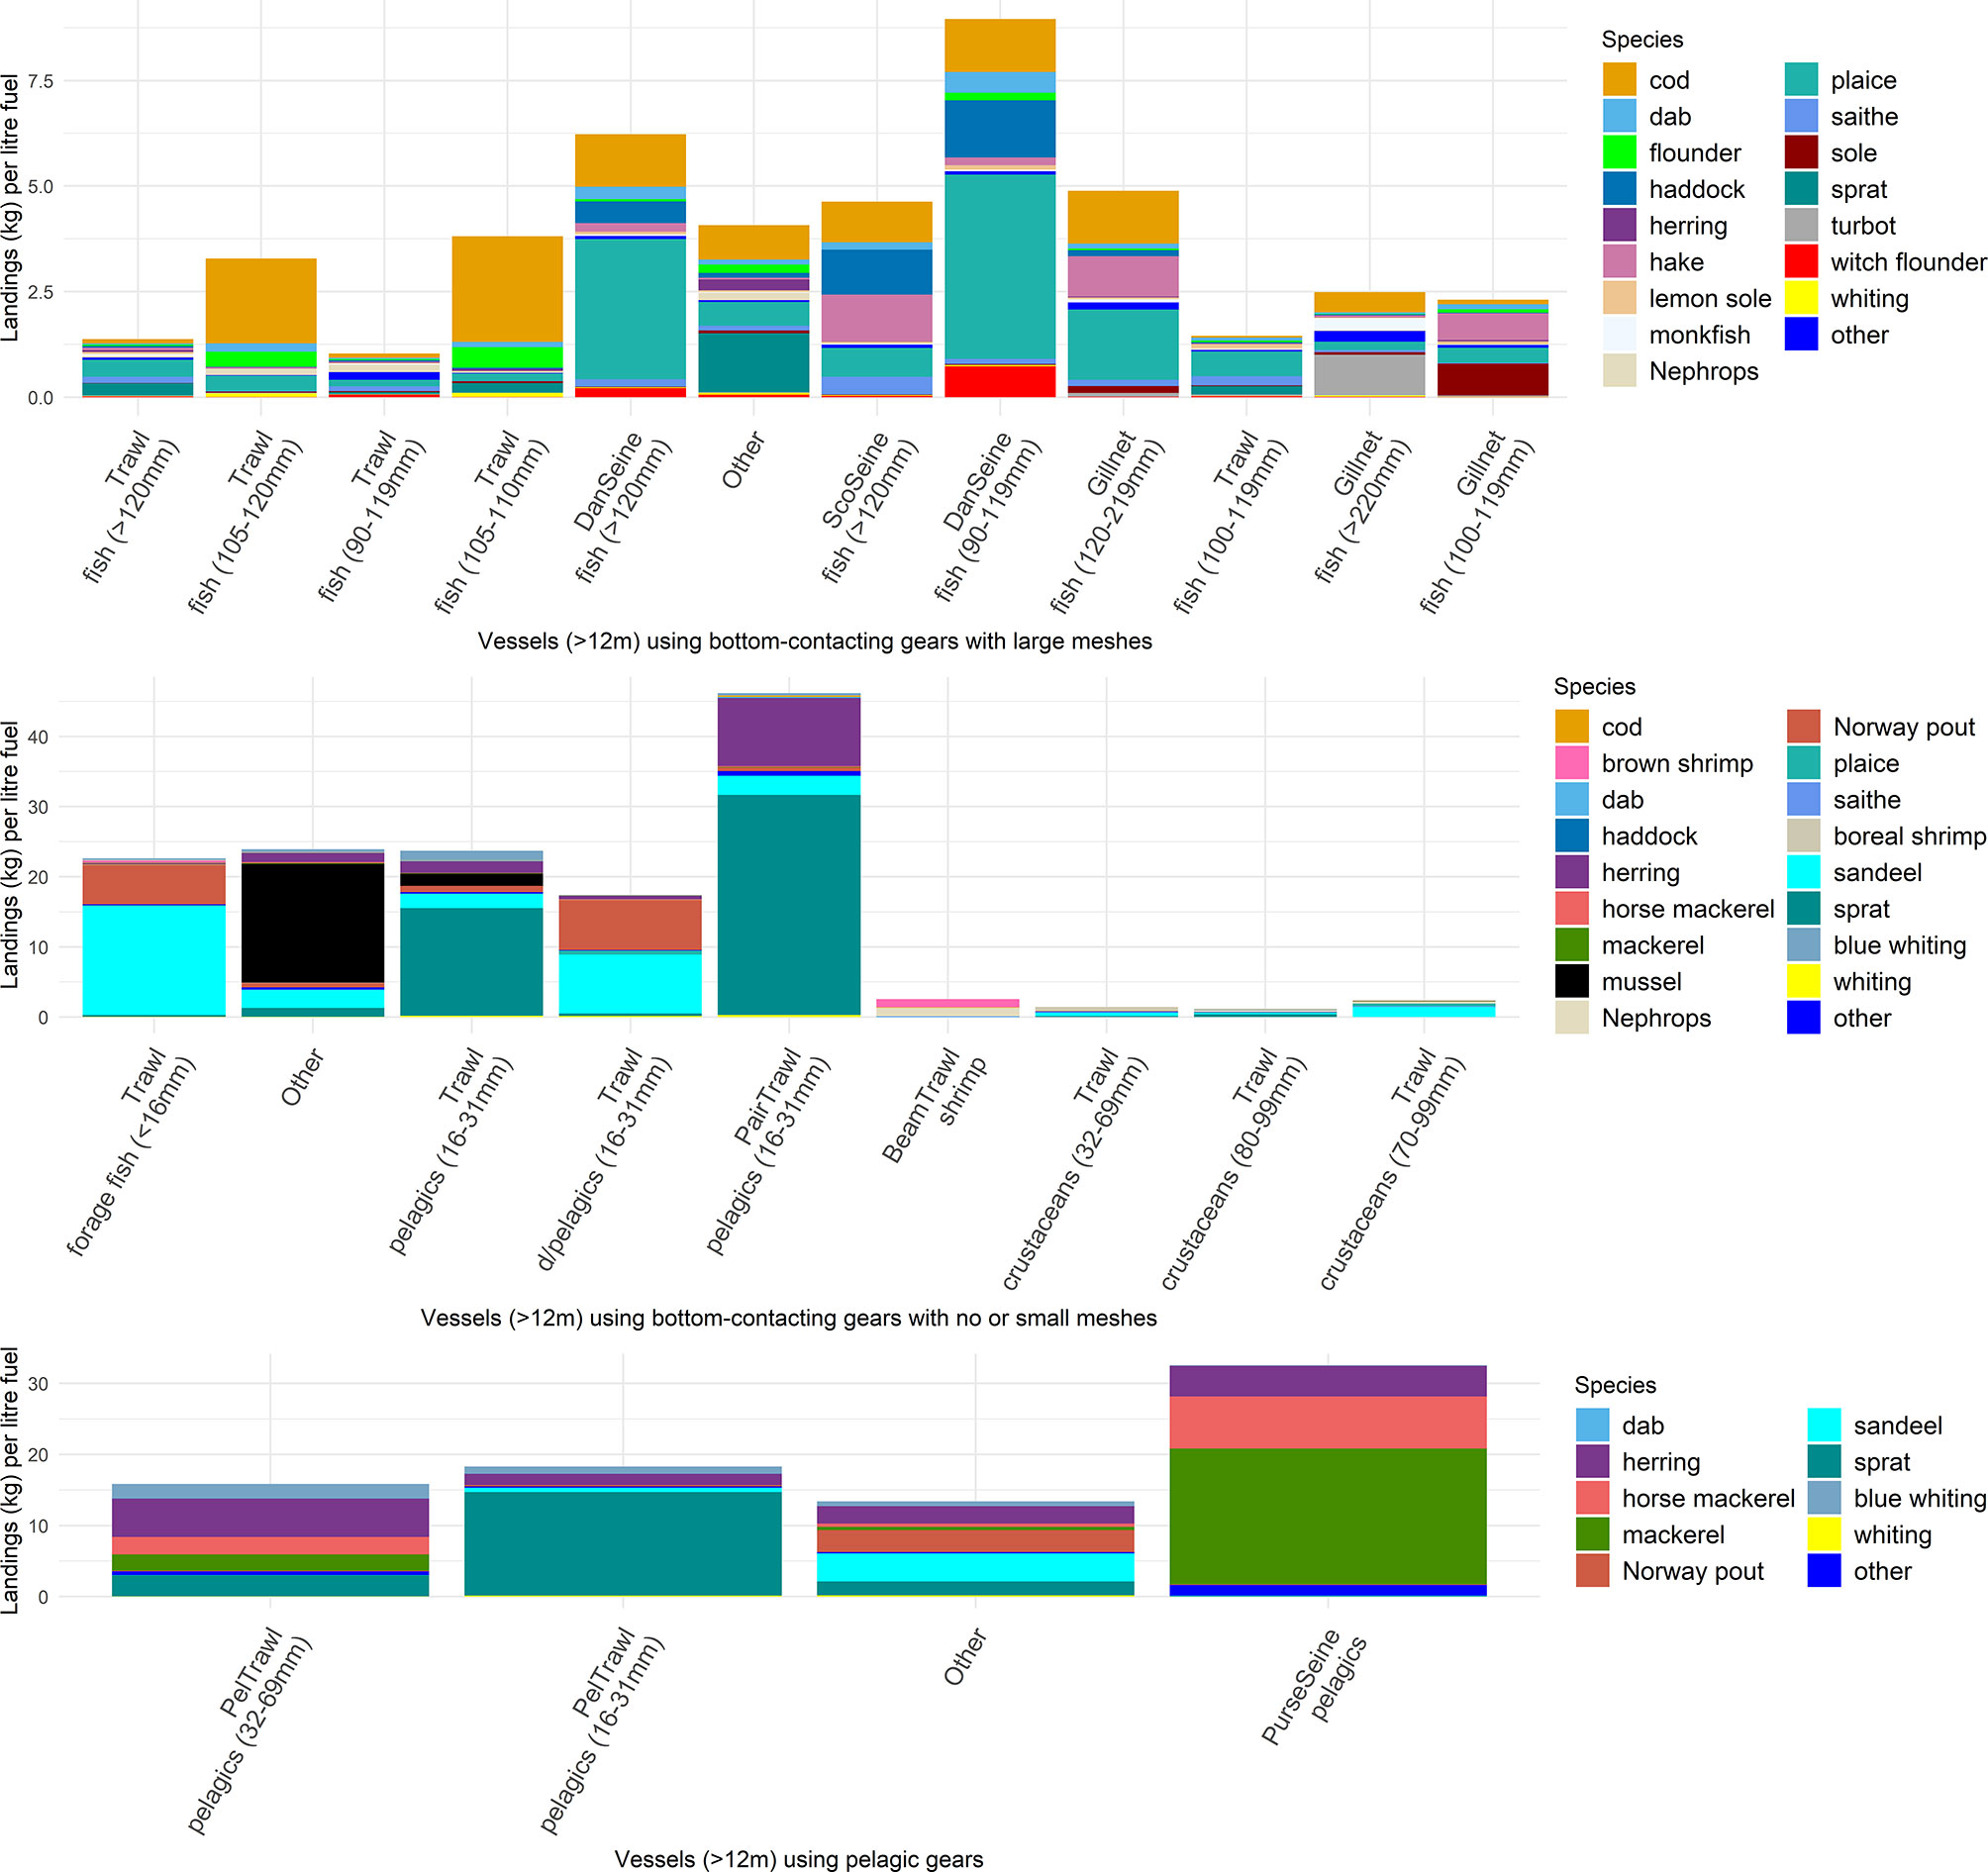
Figure 5 Landings (kg) per litre of fuel consumed (CPUF) per fleet-segment across species for large vessel using bottom contacting gears toward demersal species, or toward small forage fish, or for large vessel using pelagic gears. Fleet segments are ordered from left to right by landing volume. The overall CPUF estimates are sectored per species depending on their contribution to the total landing for each fleet-segment.
3.2.2 Crustacean Fisheries
The second type of fishery in this fleet segment is crustacean fisheries with landings of northern prawn Pandalus borealis with mesh sizes between 32-69 mm and Norway lobster Nephrops norvegicus using mesh sizes between 80-99 mm (Supplementary Material Figure 5). The brown shrimp crangon fishery using beam trawl and fine meshes (16-31 mm). Crustacean fisheries show higher fuel use intensity than any other fisheries (Table 1) but similar economic efficiency to the sandeel or sprat fishery. The fisheries for Northern prawn, Brown shrimp and Norway lobster showed a fuel use intensity of 1.716 l/kg for Norway prawn, 1.1309 l/kg for brown shrimp (Table 1), and 2.1515 l/kg for Nephrops (including plaice) with bottom trawl in the North Sea (Table 1). The total value of all crustacean species pooled was comparable to the landing for sole and cod (43 vs. 45 million euros, respectively). However, the crustacean fishery had a much lower return in terms of volumes landed (7720 tons for all crustaceans vs. 25230 tons annually for cod and sole pooled). Differences in economic efficiency are therefore not very large, with 3.24 to 4.87 EUR/l for crustacean fisheries (Table 1). This is because crustacean fisheries have a low volume of catches but high revenues, counteracting low catch rates measured in kilos per effort in the Skagerrak and Kattegat (Figure 5 and Supplementary Material Figure 9).
3.2.3 Mollusc Fisheries
The third type of fishery in this bottom-contacting gear fleet segment is using dredges directed towards molluscs such as blue mussel Mytilus edulis. The overall fuel consumption is not significant (i.e., < 250.000 litres, i.e., 0.4% of the volume consumed by the large vessels using bottom-contacting gears) compared to other small-mesh fisheries, and dredging for Blue mussel in fjord or coastal areas showed by far the lowest fuel use intensity (0.0072 to 0.0122 l/kg) due to the large catch obtained in short hauls. A part of the molluscs living weight accounted for in this metric is, however, not edible. Because molluscs are priced high, such a fishery also has the highest economic efficiency over the period (25 to 40 EUR/l), making this fishery impact score the lowest (Table 1).
3.3 Large Vessels Using Bottom Contacting Gears and Large Mesh Sizes
North Sea and Baltic Sea mixed demersal fisheries with bottom trawls (with mesh size range of >90 mm in the North Sea, vs. 105-120 mm for cod in the Baltic Sea or 90-104 mm for sole in the Baltic Sea), Danish seines, Scottish seines and gillnets (120-219 mm) are commercially important, targeting a wide range of species in diverse areas (Figure 3). Several species caught simultaneously that characterized mixed fisheries are apparent when looking at a fleet segment in particular (Figure 5). From another angle, it was also apparent that such species are also caught by several fleet segments (Figure 5). This fleet segment has significant fuel consumption and considerable effort at sea.
The fleet segment has relatively high fuel intensity (Table 1), except for 120 mm demersal seiners (0.15 to 0.25 l/kg), which scored low and outperformed 120 mm otter ottom trawlers in catching the same species (1.26 l/kg) (Table 1). 105-120 mm bottom trawling in the Baltic targeting cod was also one of the least fuel intense practice (0.34 l/kg) among these bottom-contacting gears segments using large meshes, and the economic efficiency was also higher than for the North Sea mixed fishery (3.73 EUR/l vs. 2.83 EUR/l), but much lower than Danish seiners (9.89 to 17.68 EUR/l) or Scottish seine (10.7 EUR/l) (Table 1). Therefore, the least fuel use intensive and most economically efficient fishing in this fleet segment occurred close to Danish coasts with seine and bottom trawling for cod in the Baltic Sea or gillnetting for cod, plaice and sole (Figure 4).
The differences in efficiency among seining and bottom trawling for mixed demersal fisheries in the Baltic Sea compared to the North Sea and mixed crustacean fisheries reflect differences in EUR per unit effort and landing values (Supplementary Material Figure 9). Hence, the less fuel-intense trawling in the Baltic landed lower-priced fish than when seining (3.47 EUR per kilo for seine, against 1.741 EUR per kg for trawlers). Seiners actually spent less effort landing the same landing value. On the other hand, the crustacean fishery caught higher-valued species, which also translated into higher landing values per effort (Supplementary Material Figure 9).
All fleet segments using bottom-contacting gears with large meshes showed no real trend in the fuel use intensity that was stable over 2005-2019, except for the 120 mm bottom trawl for demersal fish, which showed a slight increase in intensity in recent years (Supp. Mat Figure 10, and coefficients of variation in Supplementary Data).
3.4 Large Vessels Using Pelagic Gears
The use of pelagic gear occurred in a very large geographical area (Figure 6), and the main fleet segments exploiting pelagic species consumed an equivalent total amount of fuel compared to the main Danish fleet segments targeting demersal species. The large pelagic fleet fishing Atlantic mackerel Scomber scombrus, herring Clupea harengus, and blue whiting Micromesistius poutassou consume the most fuel across an extensive area (Supplementary Figure 3). The vessels were also operating in the most important 32-69 mm fishery characterized by very low fuel use intensity (0.1159 l/kg) relative to other segments and high economic efficiency (to 8.474 EUR/l), making the fishery scoring low (Table 1). The fuel use intensity was the lowest (0.071 l/kg), and economic efficiency was the highest when seining for mackerel and herring (25.87 EUR/l) in the northern North Sea and beyond (Figure 8).
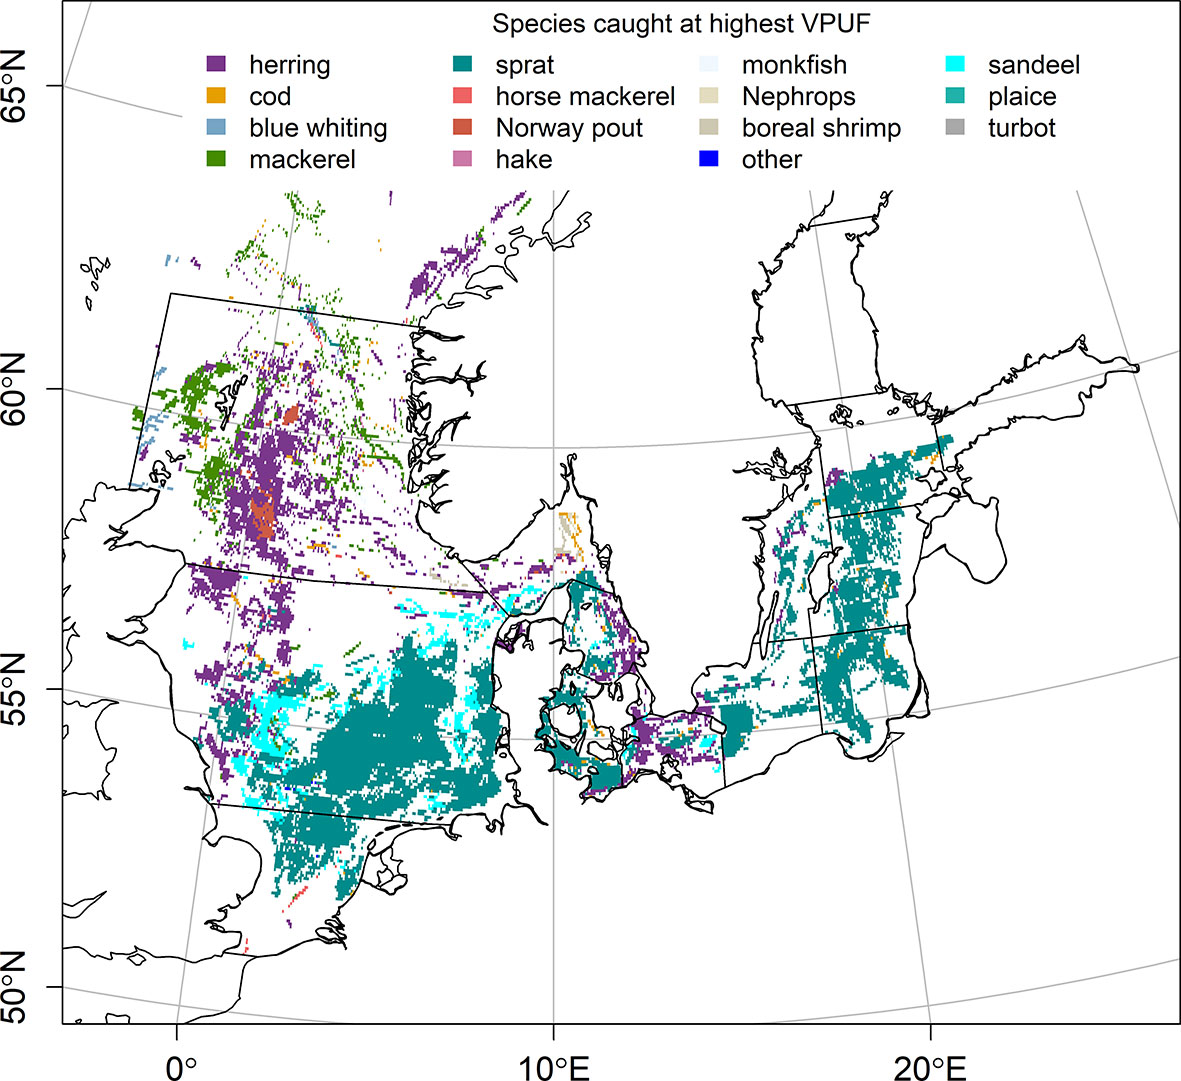
Figure 6 Spatial distribution of the maximal value of indicators during 2005-2019 for landed species (i.e. colored per species) for pelagic gears deployed by Danish fleets for vessels >12m (in FAO 22.3, 22.4 and part of 22.2) and aggregated on 1x1 minute grid cells.
The second-largest volume of catch comprises fishing for sprat Sprattus sprattus with a low fuel use intensity (0.0919 l/kg) and high economic efficiency (4.171 EUR/l), leading to a low impact score (Table 1). Large pelagic vessels (> 40 metres) fishing for sprat with small meshes returned the highest catch rates and stable fuel use in the Baltic Sea over the period, along with increased landing volume (Supplementary Material).
Other pelagic species included horse mackerel Trachurus trachurus, sandeel with semipelagic trawl, and Norway pout (Figure 8). For the herring fishery, the larger vessels were highly active in the North-East Atlantic waters beyond the FAO 27.2, 27.3 (Baltic), and 27.4 (North Sea) areas (Supplementary Figure 3). The spatial extent of the fisheries of the large vessels using pelagic or semipelagic gear was widespread, and the catch rate was large (Supplementary Figure 6). This makes fuel use erratically distributed spatially given that the fuel used to search for the fish pelagic schools has been allocated back to the haul positions in these maps.
All segments using pelagic gears have a stable fuel use intensity over 2005-2019, apart from the larger vessels with a pelagic 32-69 mm gear targeting herring and active in the North Sea, which shows a large increase in average intensity when all the vessels in this category were aggregated (Supplementary Material Figure 11).
3.5 Small Vessels Using Active and Passive Gears
The total fuel used for this fleet segment over time showed a decreasing trend in both the Baltic Sea (27.3) and the North Sea region (27.4), associated with a constant or a slight increase in economic efficiency and a reduced fuel use intensity for all segments. While cod initially was the species contributing most to the overall fuel use intensity, plaice has substituted cod in most recent years.
Part of the smaller vessels specialized in targeting demersal fish for mainly cod and plaice by trawlers. Another fishery targeted molluscs such as mussels, common cockle Cerastoderma edule and oyster Ostrea spp., using dredges. Some cod, plaice, dab or turbot Psetta maxima were caught by gillnetters. Small vessels, which are smaller in size and less numerous, are characterized by much lower overall fuel consumption and catch in terms of both volume and value compared to the larger fleet segments. The spatial distribution of fuel use and subsequent catches of the smaller vessels could not be analysed due to the lack of spatial data for these segments, albeit smaller vessels were limited in their geographical range to inshore areas.
The fuel use intensity of small vessels using small meshes or gears without meshes was mainly used to catch molluscs such as cockle and mussel with a dredge (Figure 7). Smaller catches were associated with a relatively small total effort, resulting in the lowest fuel use intensity and highest economic efficiency for mussel dredging (>0. 0318/kg, 15.25 EUR/l in Table 1), as also observed previously for larger vessels.
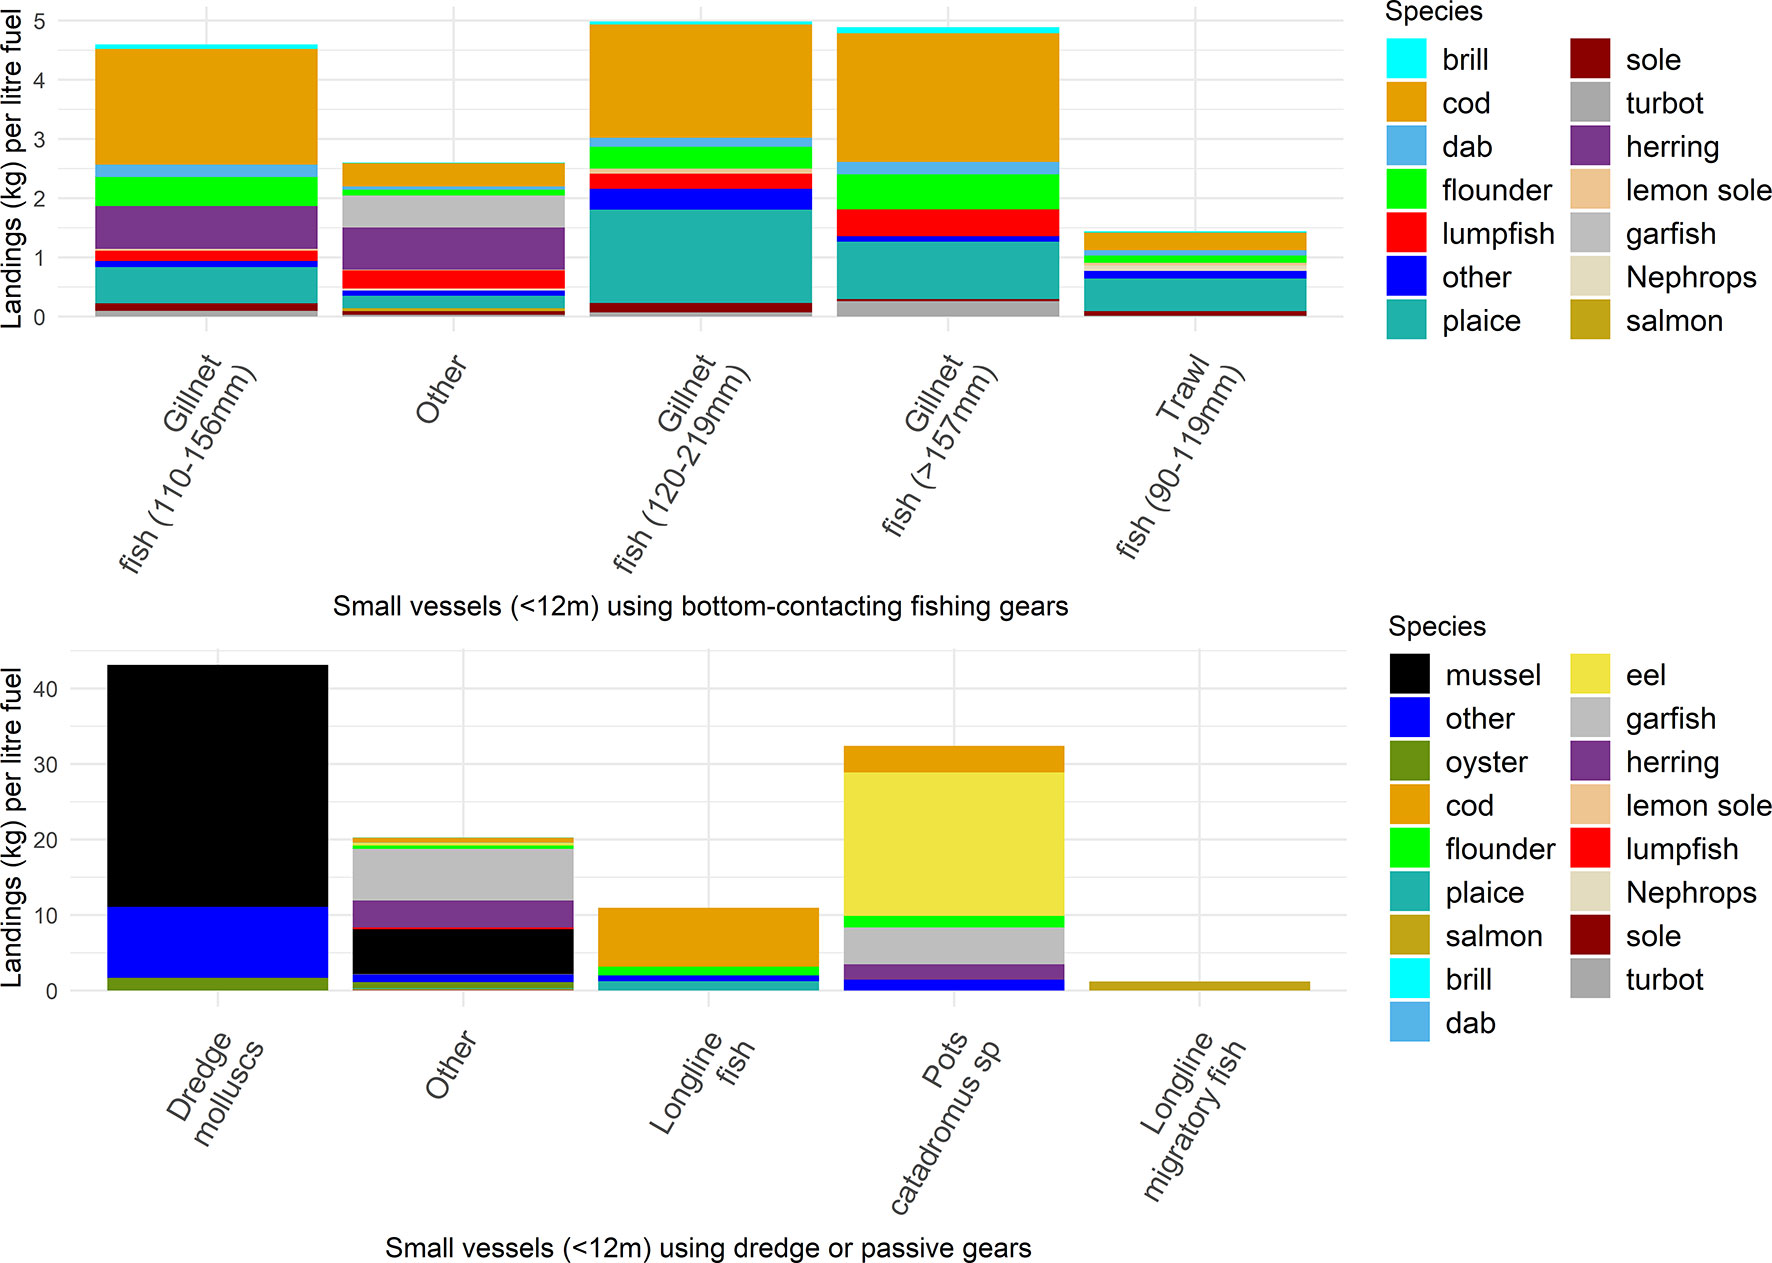
Figure 7 Landings (kg) per litre of fuel consumed (CPUF) per fleet-segment across species for small vessels (<12 m). Fleet segments are ordered from left to right by landing volume. The overall fuel use intensity estimates are sectored per species depending on their contribution to the total landing for each fleet-segment.
Small vessels using a variety of gillnets and other passive gears had a lower fuel use intensity than trawling irrespective of mesh size and outperformed bottom trawling in economic efficiency during the analysed period (ca. 0.17 to 0.24 l/kg and 9.57 EUR/l for 110-156 mm gillnetters vs. 0.83 l/kg and 4.19 EUR/l for 90-119 mm otter bottom trawlers fishing for a mixture of Nephrops, cod, plaice and flounder in the Skagerrak, Belt Sea and Baltic Sea). In addition, longlining had the highest fuel use intensity among small-scale segments when targeting salmon (1.1587 l/kg and 7.4152 EUR/l) and scored the highest in fuel use intensity for small vessels (Table 1).
Minor fisheries were fishing for European eel Anguilla anguilla and lumpfish Cyclopterus lumpus. Targeting for lumpfish was mainly a gillnet fishery, while eel was captured with other passive gear, such as pots, with a fuel intensity of 0.1067 l/kg. Some of these minor species in volume, such as lumpfish and sole, could have represented a large share of the economic return for these segments because they were more highly priced. The economic efficiency for eel was outstanding, with up to 224 EUR/l due to a high market price (7.5 EUR/kg).
3.6 Correlation With Assessed Fishing Mortalities
Anomalies in the time series of fishing mortalities ratios and catch-fuel efficiency ratios (Supplementary Figures 19 and 20) generated some significant cross-correlations (i.e., departing from the confidence intervals; Supplementary Material Figures 16–18) by large vessels with bottom-contacting gears. Negative correlations were found (with a time lag of 0 to 4 years) between F/FMSY and catch-fuel efficiency for North Sea cod, saithe, Northern boreal prawn, and sole fished in the Kattegat (Supplementary Figure 16), resulting from decreasing F/FMSY ratios over time (overexploited stocks going towards a value of 1) and improved catch-fuel efficiency (i.e., divergent trends). In contrast, a positive correlation was found for Kattegat Plaice (Supplementary Figure 16), implying that the plaice F/FMSY ratio recovering to 1 did not correlate with improved catch-fuel efficiency (Figure 8).
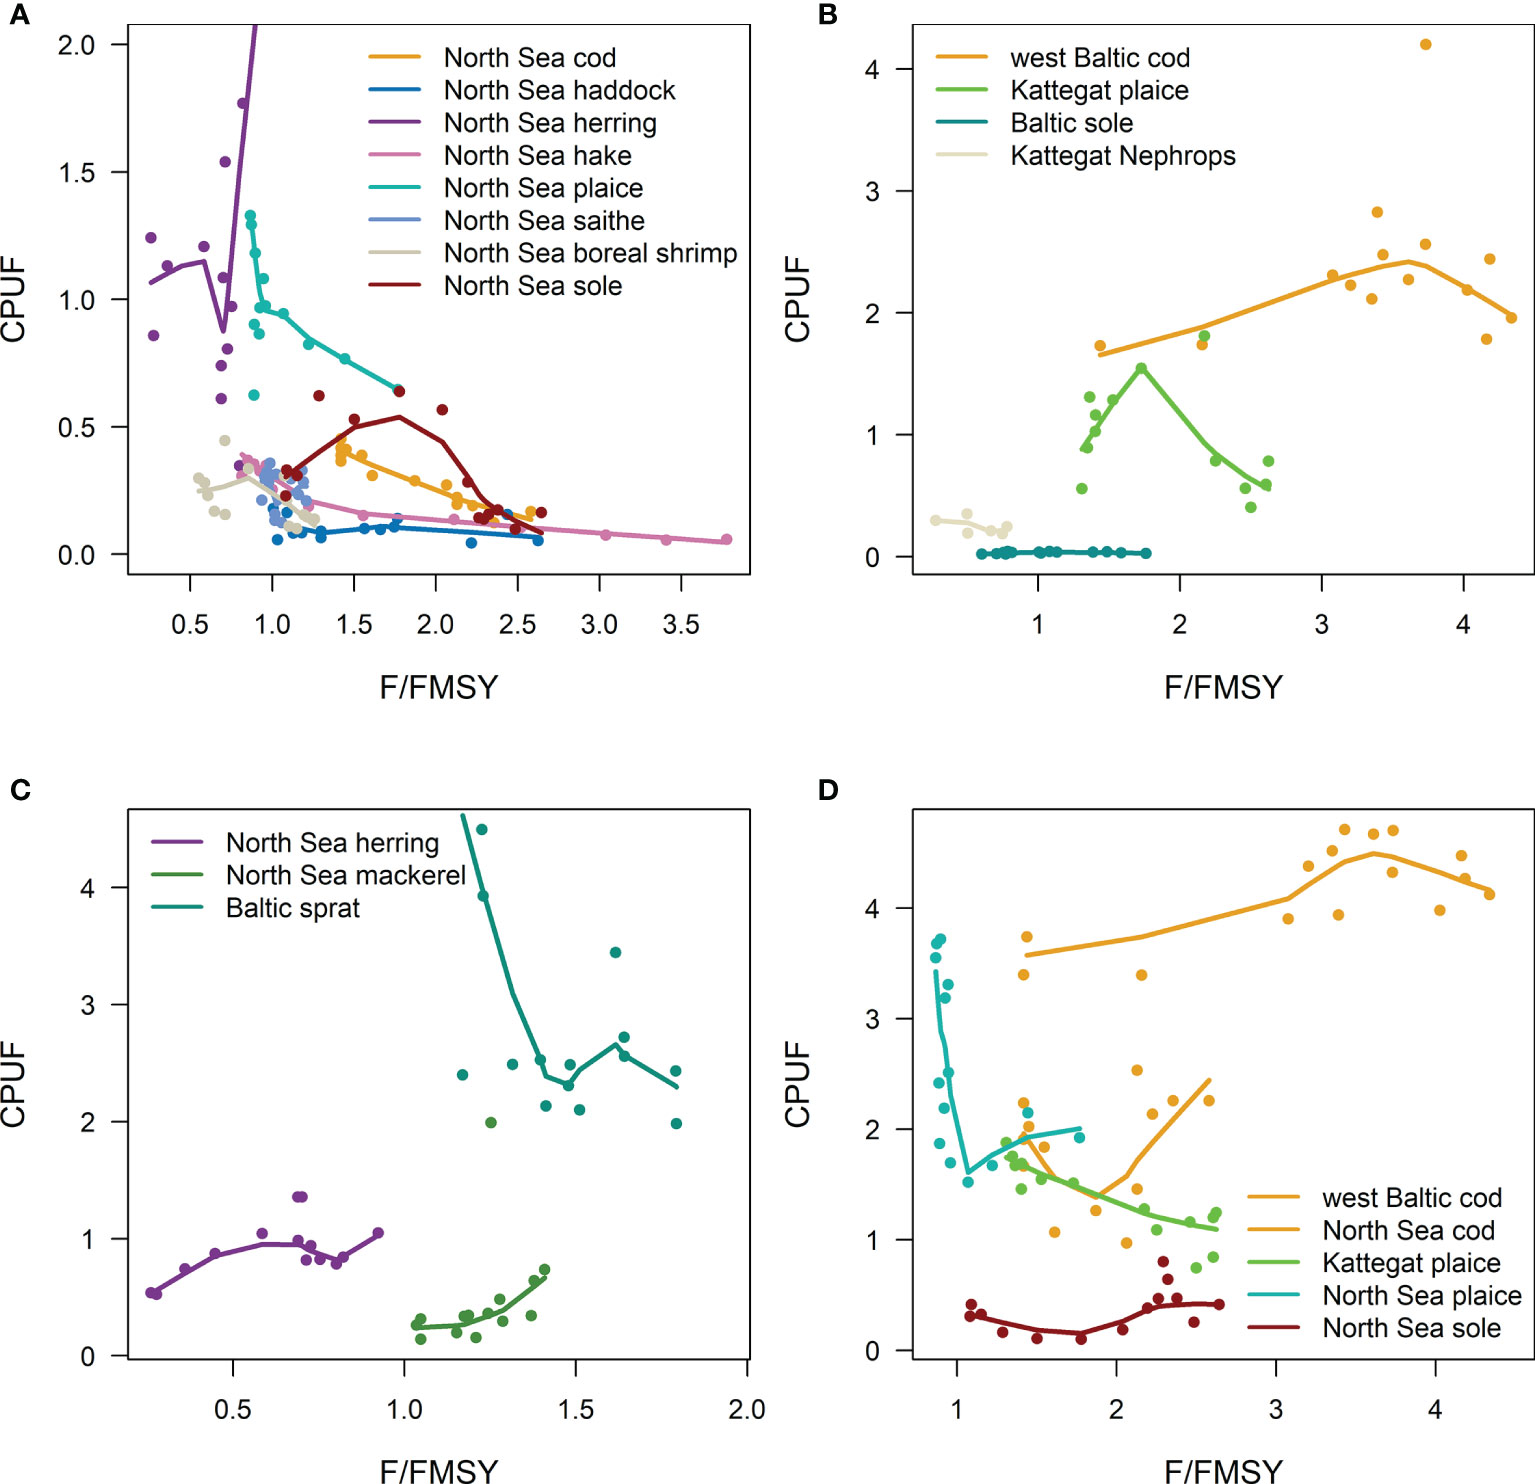
Figure 8 The EU common fisheries policy (CFP) fisheries performance indicator F/FMSY ratio in function of landings volume (kg) per unit fuel (CPUF) estimated annually over the period 2005-2019, (A) for North Sea stocks targeted by large Danish vessels using bottom-contacting gears, (B) for Baltic stocks targeting by large Danish vessels using bottom-contacting gears, (C) For North Sea pelagic stocks targeted by large Danish vessels, (D) for stocks targeted by the small Danish vessels (<12m). The dots are annual estimates and the curves depict a smoothed line obtained over each stock specific estimates.
For stocks with FMSY estimates targeted by pelagic vessels (mackerel and sprat), the fluctuations in both F/FMSY and catch-fuel efficiency ratios over time were considerable (Supplementary Material Figure 20). Nevertheless, a negative correlation was found for Baltic sprat, with a lag of 1 year (Supplementary Material Figure 17). For mackerel in the North Sea, a positive correlation was instead found (i.e., same decreasing direction) between trends in the F/FMSY ratio and catch-fuel efficiency, implying that a recovering stock (that is, a F/FMSY ratio trending to 1) does not always link to better catch-fuel efficiency i.e. higher CPUF (Figure 8).
Anomalies for significant stocks exploited by small vessels (Supplementary Material Figure 21) that are also targeted in other segments confirm that North Sea sole F/FMSY going to 1 came with improved catch-fuel efficiency (Figure 8). Instead of such an improvement, a positive correlation was observed for both the North Sea and western Baltic cod, with catch-fuel efficiency decreasing erratically along with a smooth reduction in F/FMSY. Other stocks did not show any significant correlations, albeit the signal for negative correlations (i.e., recovering stocks with better catch-fuel efficiency) was the most apparent (Figure 18; Supplementary Material).
4 Discussion
4.1 The Fuel Use Efficiency of Various Fisheries
This study has provided essential background data and analyses of the economic efficiency and fuel use intensity of Danish fisheries, including the fuel use intensity associated with catches of different marine species by different fishing techniques and fleet segments. Within this work, we found substantial differences in fuel use (and also intensity) between different fishing techniques, which confirms earlier findings that fuel consumption depends on fishing techniques and the targeted assemblage of species (Parker and Tyedmers, 2015). The differing performance of fisheries in fuel use and economic efficiency can be explained in many ways, from a combination of changes in behaviour, regulations and markets, including fisheries (i) directing effort towards more valuable species and size groups (affects economic efficiency), (ii) spending less effort catching the same or larger amount of fish (affects both catch-fuel and economic efficiency), (iii) using fishing techniques that catch higher-priced fish because of their better quality (affects economic efficiency, possibly fuel use intensity); and/or (iv) depending on trends in fuel and fish market prices (e.g., Abernethy et al., 2010). Hence, besides saving fuel costs, one can expect more significant revenue from stocks in better shape when large, higher priced individuals could be caught for the same level of quotas. Among larger vessels, vessel size does not seem to be an essential predictor, as such according to this study, supporting earlier findings (Ziegler and Hornborg, 2014). Nevertheless, small vessels using mainly passive gear with large mesh sizes are less fuel intense than larger vessels and when conducting equivalent fisheries. Large meshes are used to target the largest individuals making the reward high per unit of catch, added to the fact that passive gears avoid spending fuel on towing gears through the water). However, vessel size also conditions access to specific fishing grounds since smaller vessels (<12 m) are more restricted to coastal areas. This affects what fishing grounds and stocks may be targeted and the portion of the stock that is vulnerable to fishing. For example, widely distributed pelagic stocks are accessible only to very large vessels. Within fishing segments such as large vessels, there are also differences between species and gears (also supported by global analysis of fuel efficiencies; Parker and Tyedmers 2015). For example, fuel use intensity was relatively low for dredge fishing on mussels, but very high in comparison for a range of crustacean fisheries; this type of fishing has relatively high fuel use intensity, as there is a low level of return (i.e., biomass) against the amount of fuel used. Nevertheless, such high fuel use is balanced against the high economic return for such fisheries. Importantly, if an absolute value for fuel consumption is utilised, those economic fleet segments targeting pelagic species show the highest fuel use, as pelagic species, being geographically spread over an extended and offshore area, require the deployment of large fishing vessels. However, fuel use intensity for pelagic fisheries is low, i.e., lower than bottom trawling for demersal fish and shellfish resources. This is because fuel use intensity is determined by litre of fuel per unit of catch kg, and the pelagic fleet is landing a huge volume compared to any other fisheries (see Supplementary Data). Hence, pelagic trawling for catching mackerel and herring is conducted by vessels >40 m, but other fisheries, such as those fishing for Norway pout, sprat and sandeel, are also conducted with large trawlers. However, the fuel use intensity is lower for vessels targeting Norway pout, sprat and sandeel than for vessels targeting mackerel and herring, implying that target species, or perhaps gear type or fishing behaviour, are more important than vessel size. Compared to demersal fisheries, the pelagic fishery for mackerel represents about the same economic return, but using less effort, is less fuel intense overall even if each pelagic vessel, being the largest, consumes a large amount of fuel individually. In contrast, the demersal fisheries consume much more total fuel because the fishing is conducted by many smaller vessels, cumulating more time at sea.
4.2 Fuel Use Reduction Potentials in Fisheries and Policy Implications
At the policy level, there is a need to phase out the use of fossil fuels and there are ongoing regulatory initiatives at the EU level to incentive toward this reduction (EC, 2021). Phasing out fuel subsidies would have severe economic impacts on the fishing sector but would help bring forward the least fuel-dependent forms of fishing and trigger the development of alternative systems to operate the fishing. The variability within fishing segments indicates that individual fishers may improve performance to a certain extent, and a given vessel could also belong to several segments and perform better or worse than average. There are, however, outer boundaries to improvements defined by the availability of the stocks (Bastardie et al., 2020), the regulatory context such as gears enforced (Hornborg et al., 2012) and effects from fleet structure (Ziegler et al., 2016a). Hence, in addition to the individual changes, a fisher or management regulation can do to improve efficiency, such as i) changing target species or fishing techniques, and possibly define a “best available technique” (BAT) for each species and fishing area (given the differences highlighted in section 4.1), ii) developing and implementing innovative energy-efficient technologies for operating the fishing, iii) improving the exploited stock status, and iv) promoting a carbon footprint scoring system.
In the following, we discuss the four points listed here, knowing that the fuel consumption per unit of effort, which is a measure of fuel efficiency, is strictly associated with the physical vessel characteristics (hull design and engine power). In contrast, the fuel per unit of landed kg (i.e., fuel use intensity) is a measure that, in addition to vessel engine power and fishing effort deployed, largely relates to stock sizes, the fishing gears and mesh sizes in use, and the assemblage of marine species targeted. Hence, reducing fuel use intensity and overall fuel consumption could result from an increase in catch-fuel efficiency from different gears, mesh sizes and better stock status and from a decrease in the fuel consumed per unit of effort when operating the fishing with improved technologies.
4.2.1 Promoting the Best Available Techniques
Related to the point (i), based on the results here, a change in fishing techniques towards passive gears and Danish seines may reduce fuel use intensity in Danish fisheries. However, in reducing emissions from fisheries through management actions, attention should be given to identifying effective means to assist the transition phase. It is essential to identify possible win-win situations where synergic effects could arise albeit a change in gears will more likely come with trade-offs. For example, energy-intensive bottom trawling affects benthic habitats (Rijnsdorp et al., 2020), while gill nets generate incidental bycatches of marine seabirds or mammals (Glemarec et al., 2020). The short-term economic situation and long-term financial profitability of the fishing sector are dependent upon available marine resources and might restrict the viable paths for reducing Danish fisheries’ carbon footprint. In the long term, the incentive for changing target species and redirecting effort from fuel-intensive fisheries (e.g., downscaling the Nephrops trawl fisheries) towards more fuel-efficient fisheries might pose immediate challenges for policy-makers. Indeed, such an effort redirection could make existing segments unbalanced by possibly redirecting current fishing capacity towards other fisheries and impairing their future economic viability or facing nonexistent market demands.
4.2.2 Promoting the Development of Energy Efficient Technologies
Related to point (ii), removing taxation on alternative fuels (biofuels, biogas, and electricity) with potential for reducing the emissions per litre of fuel consumed would also provide an incentive for their use if their price become attractive to the fishing sector (EC, 2021). Most of the emission reduction potentials may be expected from implementing technical design innovations (e.g., by 15% in Basurko et al. (2013) by changing the design of the trawl doors), or on boat design, including the propulsion system, the marine engine, or the fishing gear, or upgrading or replacing existing equipment, for example, with new gear design, especially for towed gears, to reduce the hydrodynamic drag on the seabed (ICES, 2020). Alternatives include small fishing vessels being assisted by sail (Suuronen et al., 2012) or electrical or diesel-hybrid propulsion (Aarsæther, 2017; EC, 2021a), which requires developing harbour facilities that would enable vessels to connect to electric charging facilities on the quayside (EC, 2021b). While many of the solutions already exist as prototypes, there are likely obstacles preventing their large-scale use (e.g., engine battery autonomy is limited or limited space onboard for battery storage). Possible additional reductions in greenhouse gas emissions may also be attained by changing the way fishing is operated. Therefore, limited steaming time, limited drag duration, or speed limit can substantially reduce the overall fuel consumption to reach fishing grounds or to tow fishing gears. Other solutions could, for example, be in the form of better or new sensors that allow for real-time capture monitoring during fishing (e.g., UV cameras combined with automatic image recognition), which could reduce fishing haul duration by improving catch efficiency.
4.2.3 Improving Exploited Stock Status
Related to point (iii), this study has shown how the overall fuel efficiency can reflect the stock situation. Establishing this correlation with empirical data was a novel endeavour, with rare previous examples (but see Hospido and Tyedmers, 2005; Ziegler and Hornborg, 2014; Byrne et al., 2021). Studies often estimate the efficiency at the segment level for all catches combined (e.g., Van Marlen et al., 2009, Guillen et al., 2015), not linking fuel consumption to specific species. Our findings show that when the number of fish available for fishing is low due to overexploitation, Danish fishers have to spend more effort and fuel fishing to catch the total allowable catch (TACs). Rebuilding stocks could also, during the transitional phase, lead to trade-offs in fuel efficiency if the catch rates are reduced with the purpose of catching the most valuable fish (as demonstrated by the positive lagged correlation between F/FMSY and VPUF for some stocks, e.g., plaice and mackerel, or North Sea cod when exploited by small vessels). To improve fuel efficiency during the recovery phase, promoting the most fuel-efficient gears (i.e., promoting the best available technique per fishery as argued in section 4.2.1) would benefit both emissions per landed kg and fishing economy.
4.2.4 Promoting a Scoring System for Carbon Footprint
Related to point (iv), policy outcomes could also include market strategies such as certificates for energy use or carbon labelling for attaining a low footprint aimed at changing consumer habits (Thrane, 2006; Thrane et al., 2009) or include the fishing’s carbon footprint in current certification schemes such as the Marine Stewardship Council (MSC, www.msc.org), which sets standards for good fishing practices but currently does not consider the carbon footprint of a given product (Madin and Macreadie, 2015). In the EU, the ambition is to identify indicators gas emissions that could be incorporated in regulatory marketing standards, including carbon footprints (e.g., STECF, 2021, Art. 17 of the CFP). To support such initiatives, the current method to study Danish fisheries (see Table 1) could also be applied to other fisheries. These studies would contribute to engaging a virtuous circle to promote less impacting and more efficient fishing practices that also meet the sustainability targets defined in fisheries and environmental policies. To this end, the information would allow the fishing industry to fully exploit the benefits of providing edible protein from the seas in a sustainable manner and with a low carbon footprint as CO2-friendly alternative to more fuel intense land-based animal products. As a co-benefit, reducing the fuel consumption per unit of effort (section 4.2.2) and improving catch-fuel efficiency (sections 4.2.1 and 4.2.3) could go hand to hand with cutting on the operating costs of fishing. Reducing fuel consumption will certainly reduce fuel costs with different consequences if this expense is large compared to the income for a given fishery, which should come with better profitability for the fishery. Dependency levels to fuel compared to the income showed, e.g. in 2018, that the fuel cost consumed between 4% (passive gears) to 18% (large trawlers) of the gross income from landings in the Danish fisheries (STECF, 2020c), even though the fuel used for commercial fishing is subsidised in Denmark.
As ecosystem-based approaches to fishery management and integrated maritime policy are emphasized (e.g., Bastardie et al., 2021), there is a call for finding and operationalizing approaches to management that offer the same provisioning services with minimal effect on the ecosystem supporting services, including energy consumed. In the EU, documenting environmentally friendly fishing practices is today a criterion to grant vessels access to fishing opportunities (Article 17 of the EU CFP 2013). Hence, in addition to developing possible market-incentive solutions such as a carbon tax or carbon exchange market, the CFP Member States shall endeavour to provide incentives to fishing vessels deploying selective fishing gear or using fishing techniques with reduced environmental impact, such as reduced energy consumption or habitat damage. In the endeavour of operationalizing EBFM, it is essential to acknowledge what characterizes ‘best fishing practice’ or ‘best available technology’ to avoid unintended consequences such as higher emissions per catch (e.g., Farmery et al., 2014). It is first of primary importance to investigate the potential underlying drivers for different fuel uses. The fisheries sector is also under pressure given other large-scale changes in the marine ecosystem independent of fisheries. In particular, effects induced by climate change might soon worsen fuel consumption by forcing the fleet to chase some marine species “on the move” and becoming increasingly difficult to reach (Baudron et al., 2020). In addition, reducing the fuel use intensity and associated emissions could go hand to hand with reducing the spatial footprint of possible “blue carbon” habitats (usually marine vegetated coastal ecosystems, e.g., Duarte et al., 2013). Much attention has been given to recent studies (e.g., Sala et al., 2021) showing that sediment resuspension by demersal trawling might be a source of unwished organic carbon freed from the seafloor. Hence, further investigations require proper spatially explicit and bioeconomic management evaluation frameworks to enable the cross-sector evaluation of different management options, including conservation measures limiting the pressure on specific seabed habitats and promoting selective/clean fisheries and area-based management, such as fishing effort control and displacement, fishing closures, and other technical measures. Such an overview of fishing impact would be supported by numerous previous studies that documented the expected effects of fishing at the ecosystem level, as well as the subsequent impact on upstream businesses (see a review in Bastardie et al., 2021; Bastardie and Brown, 2021).
5 Conclusion
In the context of reducing emissions to meet environmental targets and complying with the EU Climate Target Plan (EC, 2020), reducing overall EU greenhouse gas emissions by 2030 by at least 55% below 2008 levels and becoming climate neutral by 2050 may require a special focus on fuel-intense fisheries. Such information can directly guide the existing advisory process when allocating effort or catch limits to different fleets depending on their fuel use intensity and economic return (CFP Article 17), therefore operationalizing the initial ambition of fisheries policy-makers. Since fuel use is also a proxy for the economic resilience of the fleets, it should provide incentives to further examine potential gains in both energy and economic efficiency for fishers with changes in practice towards fuel-efficient technologies. There are also opportunities to explore what would reduce the carbon footprint of the currently used main fishing techniques to simultaneously minimize fishing impacts on marine ecosystems, including preserving vulnerable species and marine supporting habitats (including essential fish habitats and now the so-called ‘blue carbon’ habitats). It is apparent that some fisheries target the same species and only differ by the fishing techniques in use. Hence, our work identified that as bottom trawling is more fuel intense, fisheries technological improvement would be most appropriate on that particular fishing practise, as not constituting the “best available fishing techniques” in regards to the fuel use intensity. Finally, our work showed that recovered stocks could reduce the fuel use required to catch them. However, the transitional phase toward rebuilding stocks could induce more fuel when the stock is still in the overexploitation phase and the fish more challenging to catch. Future studies should further expand towards a sustainability analysis that will account for the environmental, social, economic and institutional dimensions that may pose challenges for reducing the carbon footprint of fisheries. Such an analysis will help to identify hinders and trade-offs and how they may be mitigated. Since carbon emission reductions could be done following different or several paths, we propose for a future study to analyse the opportunities and potential trade-offs in, e.g., costs and benefits incurred by switching from one gear to another, one target species to another, or one spatial area to another.
Software & data
The data processing code is stored on a public repository: https://github.com/frabas/BENTHIS_2020 and can be reused to apply to other EU Member states countries. However, the Danish commercial fisheries data used in the present study cannot be shared due to sensitivity information. Instead template of data format are provided. DTU Aqua has a data agreement with the Danish Ministry for Food, Agriculture and Fisheries where DTU receive commercial fisheries data as part of an agreement on science based advice, to be used for obligations under the EU Data Collection Framework (EU 2017/1004), advice and research; DTU Aqua does not have permission to forward these data un-aggregated to third part due to data sensitivity under the GDPR regulation, however further and more detailed information on the commercial fisheries data can be requested from the DTU Aqua data specialists.
Data Availability Statement
The original contributions presented in the study are included in the article/Supplementary Material. Further inquiries can be directed to the corresponding author.
Author Contributions
FB developed the methodology, collated and processed the data with the workflow. FB wrote the original draft of the manuscript. All authors contributed to the article and approved the submitted version.
Funding
This work has been financed by the Danish Fiskeriafgiftsfonden within a project named “Fuel use and carbon footprint of the Danish commercial fishery” aiming at calculating the CO2 emissions during the catching process (active fishing, searching, sailing, etc.) for a selection of the Danish fishing fleet as a basis for comparison between different fisheries (gear and vessel types) and also as a basis for comparison with other food sources.
Conflict of Interest
The authors declare that the research was conducted in the absence of any commercial or financial relationships that could be construed as a potential conflict of interest.
Publisher’s Note
All claims expressed in this article are solely those of the authors and do not necessarily represent those of their affiliated organizations, or those of the publisher, the editors and the reviewers. Any product that may be evaluated in this article, or claim that may be made by its manufacturer, is not guaranteed or endorsed by the publisher.
Acknowledgments
We thank our industry partners from the Danish producer organisations we consulted within this project. We also thank Jeppe Olsen, DTU Aqua data analysist, for the assistance in compiling the AIS data used in this study.
Supplementary Material
The Supplementary Material for this article can be found online at: https://www.frontiersin.org/articles/10.3389/fmars.2022.817335/full#supplementary-material
References
Aarsaether K. G. (2017). Energy Savings in Coastal Fisheries: Use of a Serial Battery Hybrid Power System IEEE Electrification Magazine 3, 74–79. doi: 10.1109/MELE.2017.2718863
Abernethy K. E., Trebilcock P., Kebede B., Allison E. H., Dulvy N. K. (2010). Fuelling the Decline in UK Fishing Communities? ICES. J. Mar. Sci. 67 (5), 1076–1085. doi: 10.1093/icesjms/fsp289
Audsley E., Stacey K. F., Parsons D. J., Williams A. G. (2009). Estimation of the Greenhouse Gas Emissions From Agricultural Pesticide Manufacture and Use., 20p. Available at: http://dspace.lib.cranfield.ac.uk/handle/1826/3913
Bastardie F., Brown E. J. (2021). Reverse the Declining Course: A Risk Assessment for Marine and Fisheries Policy Strategies in Europe From Current Knowledge Synthesis. Mar. Policy 126, 104409. doi: 10.1016/j.marpol.2021.104409
Bastardie F., Brown E. J., Andonegi E., Arthur R., Beukhof E., Depestele J., et al. (2021). A Review Characterizing 25 Ecosystem Challenges to Be Addressed by an Ecosystem Approach to Fisheries Management in Europe. Front. Mar. Sci. 7, 629186. doi: 10.3389/fmars.2020.629186
Bastardie F., Nielsen J. R., Andersen B. S., Eigaard O. R. (2013). Integrating Individual Trip Planning in Energy Efficiency – Building Decision Tree Models for Danish Fisheries. Fish. Res. 143, 119–130. doi: 10.1016/j.fishres.2013.01.018
Bastardie F., Danto J., Rufener M. C., van Denderen P. D., Eigaard O. R., Dinesen G. E., et al (2020). Reducing Fisheries Impacts on the Seafloor: A Bio-Economic Evaluation of Policy Strategies for Improving Sustainability in the Baltic Sea. Fisheries Research, 230, 105681.
Basurko C., Gabiña G., Zigor U. (2013). Energy Performance of Fishing Vessels and Potential Savings. J. Clean. Product. 54 (1), 30–40. doi: 10.1016/j.jclepro.2013.05.024
Baudron A. R., Brunel T., Blanchet M., Hidalgo M., Chust G., Brown E. J., et al. (2020). Changing Fish Distributions Challenge the Effective Management of European Fisheries. Ecography 43, 494–505. doi: 10.1111/ecog.04864
Byrne C., Agnarsson S., Davidsdottir B. (2021). Fuel Intensity in Icelandic Fisheries and Opportunities to Reduce Emissions. Mar. Policy 127, 104448. doi: 10.1016/j.marpol.2021.104448
Coello J., Williams I., Hudson D. A., Kemp S. (2015). An AIS-Based Approach to Calculate Atmospheric Emissions From the UK Fishing Fleet. Atmosph. Environ. 114, 1–7. doi: 10.1016/j.atmosenv.2015.05.011
Dinesen G. E., Rathje I. W., Højrup M., Bastardie F., Larsen F., Sørensen T. K., Hoffmann E., Eigaard O. R., et al (2018). Individual Transferable Quotas, Does One Size Fit All? Sustainability Analysis of an Alternative Model for Quota Allocation in a Small-Scale Coastal Fishery. Mar Policy. 88, 23–31. doi: 10.1016/j.marpol.2017.10.03
Driscoll J, Tyedmers P.. Fuel Use and Greenhouse Gas Emission Implications of Fisheries Management: The Case of the New England Atlantic Herring Fishery. Marine Policy 34.3 (2010): 353–359. doi: 10.1016/j.marpol.2009.08.005
Duarte C., Losada I., Hendriks I., Mazarrasa I., Marbà N. (2013). The Role of Coastal Plant Communities for Climate Change Mitigation and Adaptation. Nat. Clim. Change 3, 961–968. doi: 10.1038/nclimate1970
EC (2017a). Regulation (EU) 2017/1004 of the European Parliament and of the Council of 17 May 2017 on the Establishment of a Union Framework for the Collection, Management and Use of Data in the Fisheries Sector and Support for Scientific Advice Regarding the Common Fisheries Policy and Repealing Council Regulation (EC) No 199/2008 (Recast).
EC (2017b). Commission Decision (EU) 2017/848 of 17 May 2017 Laying Down Criteria and Methodological Standards on Good Environmental Status of Marine Waters and Specifications and Standardised Methods for Monitoring and Assessment, and Repealing Decision 2010/477/EU (Text With EEA Relevance.).
EC (2019). Study on Engine Power Verification by Member States. European Commission, Directorate General for Maritime Affairs and Fisheries. doi: 10.2771/945320
EC (2020). Amended Proposal for a Regulation of the European Parliament And Of The CounciL on Establishing the Framework for Achieving Climate Neutrality and Amending Regulation (EU) 2018/1999 (European Climate Law). COM/2020/563 Final.
EC (2021a). Proposal for a Regulation of the European Parliament And Of The Council on the Use of Renewable and Low-Carbon Fuels in Maritime Transport and Amending Directive 2009/16/EC. COM/2021/562 Final.
EC (2021b). Proposal for a Regulation Of The European Parliament And Of The Council on the Deployment of Alternative Fuels Infrastructure, and Repealing Directive 2014/94/EU of the European Parliament and of the Council COM/2021/559 Final.
EC (2021c). European Commission, (2021). The EU Blue Economy Report. 2021. Luxembourg: Publications Office of the European Union.
EC (2022). Communication From The Commission To The European Parliament, The European Council, The Council, The European Economic And Social Committee And The Committee Of The Regions REPowerEU: Joint European Action for More Affordable, Secure and Sustainable Energy. COM/2022/108/Final.
Eigaard O. R. (2009). A Bottom-Up Approach to Technological Development and its Management Implications in a Commercial Fishery. ICES. J. Mar. Sci. 66, 916–927. doi: 10.1093/icesjms/fsp084
Eigaard O. R., Marchal P., Gislason H., Rijnsdorp A. D. (2014). Technological Development and Fisheries Management. Rev. Fish. Sci. Aquacult. 22, 156–174. doi: 10.1080/23308249.2014.899557
Eigaard O. R., Rihan D., Graham N., Sala A., Zachariassen K. (2011). Improving Fishing Effort Descriptors: Modelling Engine Power and Gear-Size Relations of Five European Trawl Fleets. Fish. Res. 110, 39–46. doi: 10.1016/j.fishres.2011.03.010
European Parliament (EP), Sumaila R., Lam V., Le Manach F., Swartz W., Pauly D. (2013). Global Fisheries Subsidies. Directorate General for Internal Policies, Policy Department B: Structural and Cohesion Policies – Fisheries. doi: 10.2861/38726
EU, (2019). Regulation (EU) 2019/1241 of the European Parliament and of the Council of 20 June 2019 on the conservation of fisheries resources and the protection of marine ecosystems through technical measures, amending Council Regulations (EC) No 1967/2006, (EC) No 1224/2009 and Regulations (EU) No 1380/2013, (EU) 2016/1139, (EU) 2018/973, (EU) 2019/472 and (EU) 2019/1022 of the European Parliament and of the Council, and repealing Council Regulations (EC) No 894/97, (EC) No 850/98, (EC) No 2549/2000, (EC) No 254/2002, (EC) No 812/2004 and (EC) No 2187/2005
FAO, (1995). Code of Conduct for Responsible Fisheries. (Rome:Food and Agriculture Organization of the United Nations), 41 pp.
Farmery A., Gardner C., Green B. S., Jennings S. (2014). Managing Fisheries for Environmental Performance: The Effects of Marine Resource Decision-Making on the Footprint of Seafood. J. Clean. Product. 64, 368–376. doi: 10.1016/j.jclepro.2013.10.016
Glemarec G., Kindt-Larsen L., Lundgaard L. S., Larsen F. (2020). Assessing Seabird Bycatch in Gillnet Fisheries Using Electronic Monitoring. Biol. Conserv. 243, 108461. doi: 10.1016/j.biocon.2020.108461
Greer K., Zeller D., Woroniak J., Coulter A., Winchester M., Palomares M. L. D., et al. (2019). Global Trends in Carbon Dioxide (CO2) Emissions From Fuel Combustion in Marine Fisheries From 1950 to 2016. Mar. Pol. 107, 103382. doi: 10.1016/j.marpol.2018.12.001
Guillen J., Cheilari A., Damalas D., Barbas T. (2015). "Oil for Fish: An Energy Return on Investment Analysis of Selected European Union Fishing Fleets: EROI of the EU Fishing Fleet". J. Ind. Ecol. 20 (1). doi: 10.1111/jiec.12272
Haberl H., Wiedenhofer D., Virág D., Kalt G., Plank B., Brockway P., et al. (2020). A Systematic Review of the Evidence on Decoupling of GDP, Resource Use and GHG Emissions, Part II: Synthesizing the Insights. Environ. Res. Lett. 15, 065003. doi: 10.1088/1748-9326/ab842a
Hintzen N. T., Bastardie F., Beare D., Piet G. J., Ulrich C., Deporte N., Egekvist J., Degel H., et al (2012). VMStools: Open-Source Software for the Processing, Analysis and Visualization of Fisheries Logbook and VMS Data. Fisheries Research, 115-116, 31–43. doi: 10.1016/j.fishres.2011.11.007
Hornborg S., Nilsson P., Valentinsson D., Ziegler F. (2012). Integrated Environmental Assessment of Fisheries Management: Swedish Nephrops Trawl Fisheries Evaluated Using a Life Cycle Approach. Mar. Policy 36 (6), 1193–1201. doi: 10.1016/j.marpol.2012.02.017
Hornborg S., Smith A. D. (2020). Fisheries for the Future: Greenhouse Gas Emission Consequences of Different Fishery Reference Points. ICES. J. Mar. Sci. 77 (5), 1666–1671. doi: 10.1093/icesjms/fsaa077
Hospido A., Tyedmers P. (2005). Life Cycle Environmental Impacts of Spanish Tuna Fisheries. Fisheries Research, 76(2), 174–186. doi: 10.1016/j.fishres.2005.05.016
ICES (2020). ICES Workshop on Innovative Fishing Gear (WKING). ICES Scientific Reports 2, 96. 130. doi: 10.17895/ices.pub.7528
Jafarzadeh S., Ellingsen H., Aanondsen S. A. (2015). Energy Efficiency of Norwegian Fisheries From 2003-2012. J. Clean. Product. 112, 3616–3630. doi: 10.1016/j.jclepro.2015.06.114
Jafarzadeh S., Ellingsen H., Aanondsen S. A. (2016). Energy Efficiency of Norwegian Fisheries From 2003 to 2012. J. Clean. Product. 112, 3616–3630. doi: 10.1016/j.jclepro.2015.06.114
Jakobsen O. (2011). Handbook in Energy Savings, Energy Efficiency for Fishing Vessels. The European Fisheries Fund: Denmark and EU's Investement in Substainable Fishery 23.
Kraak S. B., Bailey N., Cardinale M., Darby C., De Oliveira J. A., Eero M., et al (2013). Lessons for Fisheries Management From the EU Cod Recovery Plan. Marine Policy, 37, 200–213. doi: 10.1016/j.marpol.2012.05.002
Madin E. M. P., Macreadie P. I. (2015). Incorporating Carbon Footprints Into Seafood Sustainability Certification and Eco-Labels. Mar. Policy 57, 178–181. doi: 10.1016/j.marpol.2015.03.009
Natale F., Gibin M., Alessandrini A., Vespe M., Paulrud A. (2015). Mapping Fishing Effort Through AIS Data. PloS One 10 (6), e0130746. doi: 10.1371/journal.pone.0130746
Parker R. W. R., Blanchard J. L., Gardner C., Green B. S., Hartmann K., Tyedmers P. H., et al. (2018). Fuel Use and Greenhouse Gas Emissions of World Fisheries. Nat. Clim. Change 8, 333–337. doi: 10.1038/s41558-018-0117-x
Parker R. W.R., Gardner C., Green B. S., Hartmann K., Watson R. A. (2017). Drivers of Fuel Use in Rock Lobster Fisheries Fisheries. ICES J. Mar. Sci. Volume 74(6), 1681–1689. doi: 10.1093/icesjms/fsx024
Parker R. W., Hartmann K., Green B. S., Gardner C., Watson R. A. (2015). Environmental and Economic Dimensions of Fuel Use in Australian Fisheries. J. Clean. Product. 87, 78–86. doi: 10.1016/j.jclepro.2014.09.081
Parker R. W., Tyedmers P. H. (2015). Fuel Consumption of Global Fishing Fleets: Current Understanding and Knowledge Gaps. Fish and Fisheries, 16, 684–696. doi: 10.1111/faf.12087
Pikitch E. K., Santora C., Babcock E. A., Bakun A., Bonfil R., Conover D. O., et al. (2004). Ecosystem-Based Fishery Management. Science. 305: 346–347. doi: 10.1126/science.1098222
Rijnsdorp A. D., Hiddink J. G., Denderen P.D.v., Hintzen N. T., Eigaard O. R., Valanko S., et al. (2020). "Different Bottom Trawl Fisheries Have a Differential Impact on the Status of the North Sea Seafloor Habitats.". ICES. J. Mar. Sci. 77, 1772–1786. doi: 10.1093/icesjms/fsaa050
Ronen D. (1982). The Effect of Oil Price on the Optimal Speed of Ships. Journal of the Operational Research Society, 33(11), 1035–1040. doi: 10.2307/2581518
Ruttan L. M., Tyedmers P. H. (2007). Skippers, Spotters and Seiners: Analysis of the "Skipper Effect" in US Menhaden (Brevoortia Spp.) Purse-Seine Fisheries. Fish. Res. 83 (1), 73–80. doi: 10.1016/j.fishres.2006.08.022
Sala A., De Carlo F., Buglioni G., Lucchetti A. (2011). Energy Performance Evaluation of Fishing Vessels by Fuel Mass Flow Measuring System. Ocean. Eng. 38, 804–809. doi: 10.1016/j.oceaneng.2011.02.004
Sala E., Mayorga J., Bradley D., Cabral R. B., Atwood T. B., Auber A., et al. (2021). Protecting the Global Ocean for Biodiversity, Food and Climate. Nature 592(7854), 397–402. doi: 10.1038/s41586-021-03371-z
Schau E. M., Ellingsen H., Endal A., Aanondsen S. A. (2009). Energy Consumption in the Norwegian Fisheries. J. Clean. Product. 17 (3), 325–334. doi: 10.1016/j.jclepro.2008.08.015
Schuhbauer A., Skerritt D. J., Ebrahim N., Le Manach F., Sumaila U. R. (2020). The Global Fisheries Subsidies Divide Between Small- and Large-Scale Fisheries. Front. Mar. Sci. 7. doi: 10.3389/fmars.2020.539214
STECF (2020a). Scientific, Technical and Economic Committee for Fisheries (STECF) – Monitoring the performance of the Common Fisheries Policy (STECF-Adhoc-20-01). Publications Office of the European Union, Luxembourg, 2020, ISBN 978-92-76-18115-6, doi: 10.2760/230469, JRC120481
STECF (2020b). “Assessment of Balance Indicators for Key Fleet Segments and Review of National Reports on Member States Efforts to Achieve Balance Between Fleet Capacity and Fishing Opportunities (STECF-20-11),” (Luxembourg: Publications Office of the European Union). doi: 10.2760/414107
STECF (2020c). Scientific, Technical and Economic Committee for Fisheries (STECF) - The 2020 Annual Economic Report on the EU Fishing Fleet (STECF 20-06). (Luxembourg:Publications Office of the European Union), 2020. doi: 10.2760/500525, JRC123089
STECF (2021). Scientific, Technical and Economic Committee for Fisheries (STECF) – Criteria and Indicators That Could Contribute to Incorporating Sustainability Aspects in the Marketing Standards Under the Common Market Organisation (STECF-20-05). Publications Office of the European Union, Luxembourg, 2021
Shumway R. H., Stoffer D. S. (2006). Time Series Analysis and its Applications: With R Examples (New York: Springer).
Skerritt D. J., Arthur R., Ebrahim N., Brenne ValérieLe, Manach FrédéricLe, Schuhbauer A., et al. (2020). A 20-Year Retrospective on the Provision of Fisheries Subsidies in the European Union. ICES. J. Mar. Sci. Volume 77, 2741–2752. doi: 10.1093/icesjms/fsaa142
Sugihara G., May R., Ye H., Hsieh C. H., Deyle E., Fogarty M., et al. (2012). Detecting Causality in Complex Ecosystems. Science 338(6106): 496–500. doi: 10.1126/science.1227079
Sumaila U. R., Ebrahim N., Schuhbauer A., Skerritt D., Li Y., Kim H. S., et al. (2019). Updated Estimates and Analysis of Global Fisheries Subsidies. Mar. Policy 109, 103695. doi: 10.1016/j.marpol.2019.103695
Suuronen P., Chopin F., Glass C., Løkkeborg S., Matsushita Y., Queirolo D., et al. (2012). Low Impact and Fuel Efficient Fishing—Looking Beyond the Horizon. Fish. Res. 119–120, 135–146. doi: 10.1016/j.fishres.2011.12.009
Thrane M. (2006). LCA of Danish Fish Products. Int. J. Life Cycle Assess. 11, 66–74. doi: 10.1065/lca2006.01.232
Thrane M., Ziegler F., Sonesson U. (2009). Eco-Labelling of Wild-Caught Seafood Products. J. Clean. Product. 17, 416–423. doi: 10.1016/j.jclepro.2008.08.007
Tyedmers P. (2001). Energy Consumed by North Atlantic Fisheries. Fisheries Centre Research Report. In: Zeller D., Watson R., Pauly D., editors. Fisheries impacts on North Atlantic ecosystems: catch, effort and national/regional datasets, 9(3), 12–34.
Tyedmers P. H., Watson R., Pauly D. (2005). Fueling Global Fishing Fleets. Ambio, 34(8), 635–638. doi: 10.1639/0044-7447(2005)034[0635:FGFF]2.0.CO;2
Van Marlen B. (2009). Energy Saving in Fisheries (ESIF), FISH/2006/17-Final Report. Wageningen Report number C002/08, 425p
Ziegler F., Eigaard O. R., Parker R. W. R., Tyedmers P. H., Hognes E. S., Jafarzadeh S. (2019). Adding Perspectives to: "Global Trends in Carbon Dioxide (CO2) Emissions From Fuel Combustion in Marine Fisheries From 1950 - 2016". Mar. Policy 107, 103488. doi: 10.1016/j.marpol.2019.03.001
Ziegler F., Hornborg S. (2014). Stock Size Matters More Than Vessel Size: The Fuel Efficiency of Swedish Demersal Trawl Fisheries 2002–2010. Mar. Policy 44, 72–81. doi: 10.1016/j.marpol.2013.06.015
Ziegler F., Hornborg S., Green B. S., Eigaard O. R., Farmery A. K., Hammar L., et al. (2016a). Expanding the Concept of Sustainable Seafood Using Life Cycle Assessment. Fish. Fish. 17 (4), 1073–1093. doi: 10.1111/faf.12159
Ziegler F., Hornborg S., Valentinsson D., Skontorp Hognes E., Søvik G., Ritzau Eigaard O. (2016b). Same Stock, Different Management: Quantifying the Sustainability of Three Shrimp Fisheries in the Skagerrak From a Product Perspective. ICES. J. Mar. Sci. 73 (7), 1806–1814. doi: 10.1093/icesjms/fsw035
Ziegler F., Groen E. A., Hornborg S., Bokkers E. A., Karlsen K. M., de Boer I. J., et al. (2018). Assessing Broad Life Cycle Impacts of Daily Onboard Decision-Making, Annual Strategic Planning, and Fisheries Management in a Northeast Atlantic Trawl Fishery. Int. J Life Cycle Assess 23 (7):1357–1367.
Keywords: fishing gear, fuel use intensity, fisheries management, stock recovery, decarbonisation, carbon footprint
Citation: Bastardie F, Hornborg S, Ziegler F, Gislason H and Eigaard OR (2022) Reducing the Fuel Use Intensity of Fisheries: Through Efficient Fishing Techniques and Recovered Fish Stocks. Front. Mar. Sci. 9:817335. doi: 10.3389/fmars.2022.817335
Received: 17 November 2021; Accepted: 14 April 2022;
Published: 02 June 2022.
Edited by:
Tomaso Fortibuoni, Istituto Superiore per la Protezione e la Ricerca Ambientale, ItalyReviewed by:
Antonio Olinto Ávila da Silva, Instituto de Pesca, Agência de Agronegócio e Tecnologia de São Paulo (APTA), BrazilOihane C. Basurko, Technology Center Expert in Marine and Food Innovation (AZTI), Spain
Emilio Notti, National Research Council (CNR), Italy
Anna Schuhbauer, University of British Columbia, Canada
Copyright © 2022 Bastardie, Hornborg, Ziegler, Gislason and Eigaard. This is an open-access article distributed under the terms of the Creative Commons Attribution License (CC BY). The use, distribution or reproduction in other forums is permitted, provided the original author(s) and the copyright owner(s) are credited and that the original publication in this journal is cited, in accordance with accepted academic practice. No use, distribution or reproduction is permitted which does not comply with these terms.
*Correspondence: Francois Bastardie, ZmJhQGFxdWEuZHR1LmRr