 James Slingsby1*
 Beth E. Scott2
 Louise Kregting3
 Jason McIlvenny1Jared Wilson4Marion Yanez5Samuel Langlois1
 Benjamin J. Williamson1
- 1Environmental Research Institute, University of the Highlands and Islands (UHI), Thurso, Scotland, United Kingdom
- 2School of Biological Sciences, University of Aberdeen, Aberdeen, Scotland, United Kingdom
- 3Queen’s University Marine Laboratory, Queen’s University, Portaferry, Northern Ireland, United Kingdom
- 4Marine Scotland Science, Aberdeen, Scotland, United Kingdom
- 5Institut National des Sciences Appliquées de Lyon, Université de Lyon, Lyon, France
Tidal stream environments exhibit fast current flows and unique turbulent features occurring at fine spatio-temporal scales (metres and seconds). There is now global recognition of the importance of tidal stream environments for marine megafauna. Such areas are also key to the development of marine renewable energy due to the reliable and predictable nature of tidally driven flows. Bed-derived turbulent features, such as kolk-boils, transport organic material to the surface and may increase the availability of prey species (fish) for foraging marine megafauna (seabirds and marine mammals). Quantification of animal association and interactions with turbulent features is required to understand potential environmental impacts of tidal energy developments in these sites. Downward-facing unmanned aerial vehicle (UAV) imagery was collected within the Pentland Firth, UK. Resulting imagery was used to quantify the density distribution of pursuit-diving seabirds, called auks (of the family Alcidae), distribution in comparison relation to concurrent surface imagery of kolk-boils and, analyse evaluate spatial relationships with individual kolk-boil features, and quantify body orientation relative to the water flow. Although variability was present, auk density distribution was generally correlated with that of kolk-boils throughout the study area; however, spatial analysis highlighted an overall trend of finer-scale dispersion between individual auks and kolk-boils. Auk orientation on the surface was primarily observed across the flow throughout ebb and flood tidal phases. These results suggest that auks may be associating with kolk-boil peripheries. Similarly, it may be energetically beneficial to orientate across the flow while maintaining observation of current flow or searching for shallow prey species and potential threats in the environment. This work demonstrates that UAV imagery was appropriate for quantification of fine-scale biophysical interactions. It allowed for concurrent measurement of hydrodynamic and predator metrics in a challenging environment and provided novel insights not possible to collect by conventional survey methodology. This technique can increase the evidence base for assessment of potential impacts of marine renewable energy extraction on key marine species.
1 Introduction
Tidal stream environments are of importance to anthropogenic developments, in the form of marine renewable energy (MRE) or tidal energy converters. While many turbine designs exist, the predominant form of tidal energy converters, representing around 70 % of global research and development efforts, are bottom-mounted horizontally orientated turbines (Fraenkel, 2006; Isaksson et al., 2020). For tidal stream projects to be economically viable it has globally, and consistently, been stated that locations must generally exhibit current flow speeds greater than 2 m/s (Fraenkel, 2006; Johnson and Pride, 2010; Vyshnavi et al., 2021). In turn, this restricts locations of development to areas such as straits and shallows around headlands (tidal stream environments) which accelerate current flow to the necessary velocities (Fraenkel, 2006; Adcock, 2015; McIlvenny et al., 2021).
These environments are also of importance to marine megafauna (seabirds and marine mammals) which utilise them for foraging, transport and breeding purposes (Benjamins et al., 2015). Seabirds in particular exploit tidal stream environments for foraging purposes, with breeding colonies often being in proximity (Johnston et al., 2018). The UK has several important seabird populations, with a legal responsibility to protect them through the EU Habitats Directive (92/43/EEC) and the EU Birds Directive (2009/147/EEC) (European Union, 1992; Mitchell et al., 2004). This is increasingly imperative with climate change, lack of prey and predation causing breeding populations within the UK to decline (Langston, 2010). Tidal energy developments, that may overlap with key seabird usage areas, could increase pressure on populations (Isaksson et al., 2020). To minimise this, further understanding of tidal stream environments, the extent of overlap between seabirds and tidal energy developments, and resulting environmental impacts is required (Grecian et al., 2010).
Tidal stream environments occur in coastal areas, usually in narrow channels or between headlands, that exhibit fast current flow repeatedly exceeding 2 m/s and contain complex turbulent features (Benjamins et al., 2015). Turbulent features are three-dimensional constructs of water that diverge from the general water body, thus creating identifiable structures (Benjamins et al., 2015). These features occur over fine spatio-temporal scales (metres and seconds) and are visible at the water surface in a number of different forms (kolk-boils, eddies, wakes and jets) (Benjamins et al., 2015). They are created by constraints imposed on the water flow by coastal features (headlands and islands) and seabed topography or as a result of vertical/horizontal wave kinematics (Filipot et al., 2015). Seabed-derived turbulence is of particular biological importance, as it transports plankton and fish species towards the water surface (Embling et al., 2012). These turbulent features, referred to as kolk-boils from hereon, are created by fast-flowing currents interacting with uneven bathymetry, resulting in upward vortices through the water column that eject at the surface, establishing areas of upwelling (Thorpe et al., 2008). While kolk-boils may predominantly act as a transport mechanism, moving sediment and organisms from the seabed to near the surface, it is speculated that they also have a disorientating effect on prey species (fish) which are caught within (Waggitt et al., 2016b). It is therefore theorised that kolk-boils create highly localised, repeating, periods (seconds) and areas (metres) of enhanced foraging opportunity for seabirds (Zamon, 2003; Benjamins et al., 2015).
Further quantification of faunal habitat usage is required to understand potential environmental impacts resulting from spatio-temporal overlap of seabirds and tidal energy developments (Waggitt et al., 2017; Whitton et al., 2020). Pursuit-diving seabird species are thought to be most vulnerable to potential impacts from tidal energy devices (for example collision and habitat displacement) owing to using the full extent of the water column (Isaksson et al., 2020). Kolk-boils, and other turbulent features, are likely to dictate pursuit-diving seabird spatial usage patterns, as a result of their hypothesized influence on prey species, with these relationships key to informing the extent of environmental impacts when scaled up to a population level (Scott et al., 2014; Abrahms et al., 2018). However, knowledge regarding pursuit-diving seabird usage of tidal stream environments remains at a broad scale of association (500 m), with only proxy variables for turbulence available rather than fine-scale empirical measurement of features (Waggitt et al., 2016b). Previous investigation into habitat usage have highlighted associations with a range of horizontal current velocities and areas of high turbulence when foraging (Waggitt et al., 2016b; Waggit et al., 2016a). However, there has yet to be an investigation into fine-scale pursuit-diving seabird behaviour (< 1 min and < 1 m) in relation to current flow and associations with individual, empirically characterised, turbulent features such as kolk-boils.
Small, multirotor, unmanned aerial vehicles (UAVs), commonly known as drones, can provide novel insight into these relationships due to their ability to hover (providing a top-down view), collect high-resolution imagery (< 1 s and < 1 m) and survey in logistically complex locations (Chabot and Francis, 2016; Palomino‐González et al., 2021). Within the field of seabird ecology, a recent review identified that UAVs are increasingly being used for monitoring purposes, expanding beyond nest or individual count surveys (Edney and Wood, 2020). Within tidal stream environments, UAVs have been used for fine-scale examination of surface-foraging seabird associations with individual turbulent features, and anthropogenic wakes, providing evidence that the former are important environmental cues for foraging (Lieber et al., 2019; Lieber et al., 2021).
This study demonstrating the ability of UAV imagery to quantify imagery to investigate fine-scale pursuit-diving seabird associations with fine-scale hydrodynamic variables and detailed interactions with individual turbulent features within a tidal stream environment. Seabirds that undertake pursuit diving were chosen due to the species’ hypothesised greater risk of impacts from tidal stream renewables. Four pursuit-diving seabird species were investigated that fall within the auk (Alcidae) family, comprising the black guillemot (Cepphus grille), common guillemot (Uria aalge), razorbill (Alca torda) and Atlantic puffin (Fratercula arctica). These species use wing and foot propulsion to catch prey within the water column and regularly dive to depths exceeding 30 m for sustained durations (over 20 seconds) (Wanless et al., 1988; Furness et al., 2012). Specific objectives of this study are to 1) demonstrate the ability of UAV imagery to quantify auk orientation relative to the flow, in relation to hydrodynamic variables (current velocity and tidal phase), and 2) demonstrate the ability of UAV imagery to quantify relationships between auks and individual turbulent features.
2 Materials and Methods
2.1 Study Site
UAV measurements were carried out in the Pentland Firth, UK, and included an active tidal stream energy lease site. The Pentland Firth is a 20-km long channel of water in the north of Scotland that connects the North Atlantic Ocean to the North Sea (Figure 1). Due to large differences in water elevation at different tidal phases when moving from either entrance of the channel, as well as topographic restrictions, current velocities often exceed 4 m/s (Neill et al., 2017). The Inner Sound is a channel within the Pentland Firth, with an average depth of 35 m, and is located between the Scottish mainland and the Island of Stroma (Figure 1) (Goddijn-Murphy et al., 2013). During flood spring tides, current speeds of 6 m/s have been recorded within the Inner Sound, with an energy potential of approximately 1.9 GW predicted (Adcock et al., 2013; Neill et al., 2017). The Inner Sound is the location of the MeyGen tidal stream energy project with a total planned capacity of 398 MW, operated by SIMEC Atlantis Energy (SIMEC) (SIMEC, 2018). Surveys within the Inner Sound were conducted post-installation (2018) of four 1.5 MW turbines (Slingsby et al., 2021a).
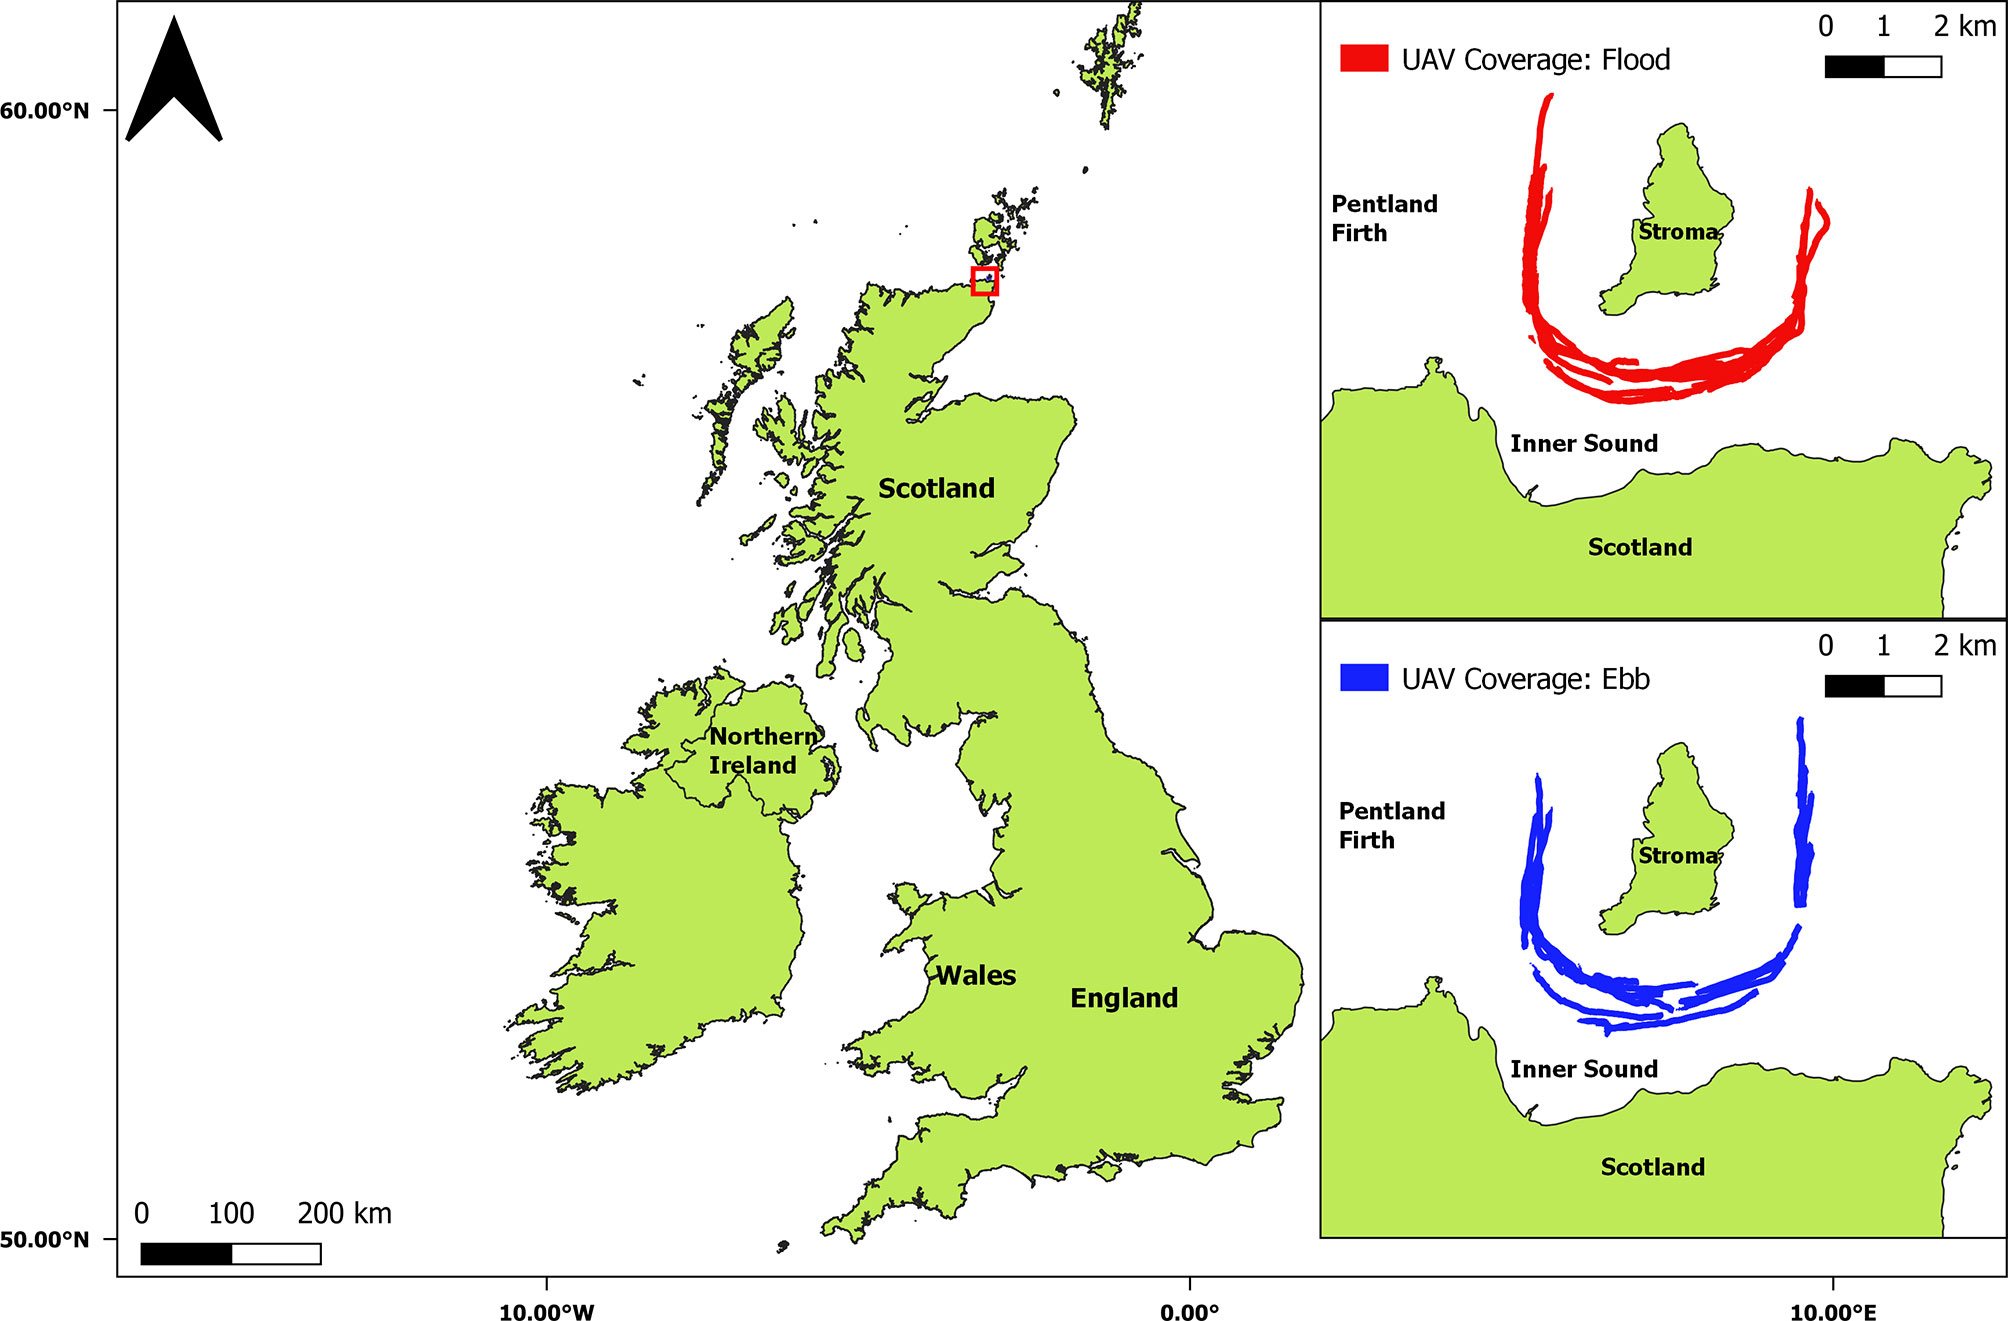
Figure 1 The United Kingdom and the Inner Sound of the Pentland Firth with UAV survey coverage displayed.
2.2 Data Collection
Thirty-eight UAV surveys were conducted between 21-24th July 2018 from a moving vessel (MRV Scotia) sailing continuously around the Island of Stroma (Figure 1). Surveys focused on the central area of the Inner Sound with flights occurring, weather permitting, during daylight hours and across different locations, times and hydrodynamic conditions (Slingsby et al., 2021a). Although surveys were taken at spatially different locations throughout the survey period, there was a comparable number of surveys (nineteen) carried out in flood and ebb phases, during and shortly after neap tides. All flights were undertaken according to Civil Aviation Authority regulations for UAV operation, as well as following best practice guidelines, detailed by Hodgson and Koh, 2016), for UAV usage during environmental research (Civil Aviation Authority, 2019). This minimised any potential effect on target and non-target species (Hodgson and Koh, 2016). Vessel-based observers recorded the times when UAV surveys were being undertaken and monitored for potential disturbance behaviour (vigilance, diving or flight responses) resulting from either flight operations or vessel activity (McEvoy et al., 2016). Disturbance was only noted when birds were within 20 m of the vessel itself which was closer than the distance of the UAV from the boat. It was therefore deemed that no disturbance, resulting from either the UAV or vessel, was present at the operational range of the UAV.
During UAV operation, all surveys were manually flown at a consistent speed, and altitude (70 m), over ground while also maintaining a consistent position ahead of the vessel (100 m). This was achieved by monitoring onboard GPS speed readouts. Surveys were conducted at windspeeds < 5 m/s for safety, and to remain within capability specified by the UAV manufacturer (DJI, 2020). All surveys were conducted against the prevailing current direction to avoid double counting objects of interest. Survey durations ranged between 10-30 minutes, with an average of 200 JPEG images taken during each survey. The inter-image sampling period was set to 5 seconds, with UAV and camera specifications detailed in Table 1. Image overlap was calculated to be 80 % over water, allowing for complete coverage.
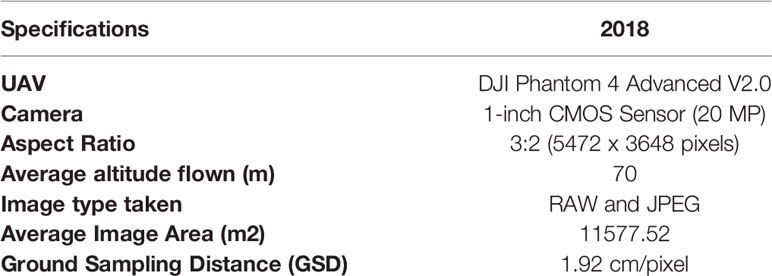
Table 1 UAV and camera specifications of surveys.
2.3 Data Processing
Images were assigned a position in space and georectified to allow for conversion of image units (pixels to metres) using previously described methods (Slingsby et al., 2021b). This permitted calculation of latitude and longitude values for the centre point of each auk, their surface orientation angle and ground survey coverage. Kolk-boil distributions were obtained using the same imagery, from previous data processing efforts (Slingsby et al., 2021a). The methodology for kolk-boil data extraction is further detailed within Slingsby et al. (2021a).
A graphical user interface (GUI), created by Slingsby et al. (2021b), was used to process, review and collate the multiple images taken within each survey. The GUI created an output file for each survey that included the extracted variables from detected auks and relevant telemetry information (Table 2). Telemetry information was collected from onboard GPS data. Methodology on how corrections were made to report the correct altitude values are detailed in Slingsby et al. (2021a). Auk behaviour was classified as flying (visibly above the water with wings outstretched), sitting (visibly sat on the water surface) or diving (visibly breaking the water surface, or having appeared in an image without being there in the previous one). Still images allowed for these to be distinguishable and avoid misidentification. User observation time (effort) per image was kept consistent by using a grid system to systematically search through each image for seabirds. If the same auk was present in consecutive images, this was recorded as part of the classification process. Once started, a survey was processed in one operation by the same user to maintain consistency and avoid between-user bias. The same user was maintained throughout all surveys to also avoid between-survey bias.

Table 2 UAV and seabird variables stored within GUI output file.
To ensure a high degree of certainty regarding behaviour and family identification, and to ensure only positive targets, a confidence score (out of 3) was given to each target within an image. This was based on the user’s certainty of identification. This corresponded to high (3), good (2) and poor (1) quality. The confidence score was applied visually, by the same user, to minimise inconsistencies and subjectivity. An auk was deemed ‘high’ quality if both a family and species level of identification could be achieved, ‘good’ quality if just a family level of identification was possible and ‘poor’ quality if neither were discernible (Supplementary Figure 1).
2.4 Post-Processing
Hydrodynamic variables (current velocity, current direction, and ebb/flood tidal phase) were obtained from a depth-averaged TELEMAC-2D model output for the location and timestamp of each image (Lang et al., 2014; McIlvenny et al., 2021). While current velocity and current direction values were taken directly from the hydrodynamic model for each image, tidal phase categorisation (either ebb or flood) was assigned from the average current velocity and current direction across each survey, with flood tide corresponding to flow in an easterly direction.
This study further characterised auk distribution and orientation relative to the flow direction. Distribution was obtained from latitude and longitude values of the central point of each auk. Auk orientation was obtained by calculating the angle of the bird (a line measured from each auk’s head to its tail using the GUI) relative to the forward orientation of the image (Figure 2). This was designated as auk orientation within the image, and then relative to north by accounting for the yaw of the UAV. Instantaneous flow direction was then incorporated to calculate auk orientation relative to the flow. This was calculated by subtraction of auk orientation from current direction, to work out an angle difference, and then implementing two absolute transformations to obtain a nonnegative value within the range of 0 – 180°.
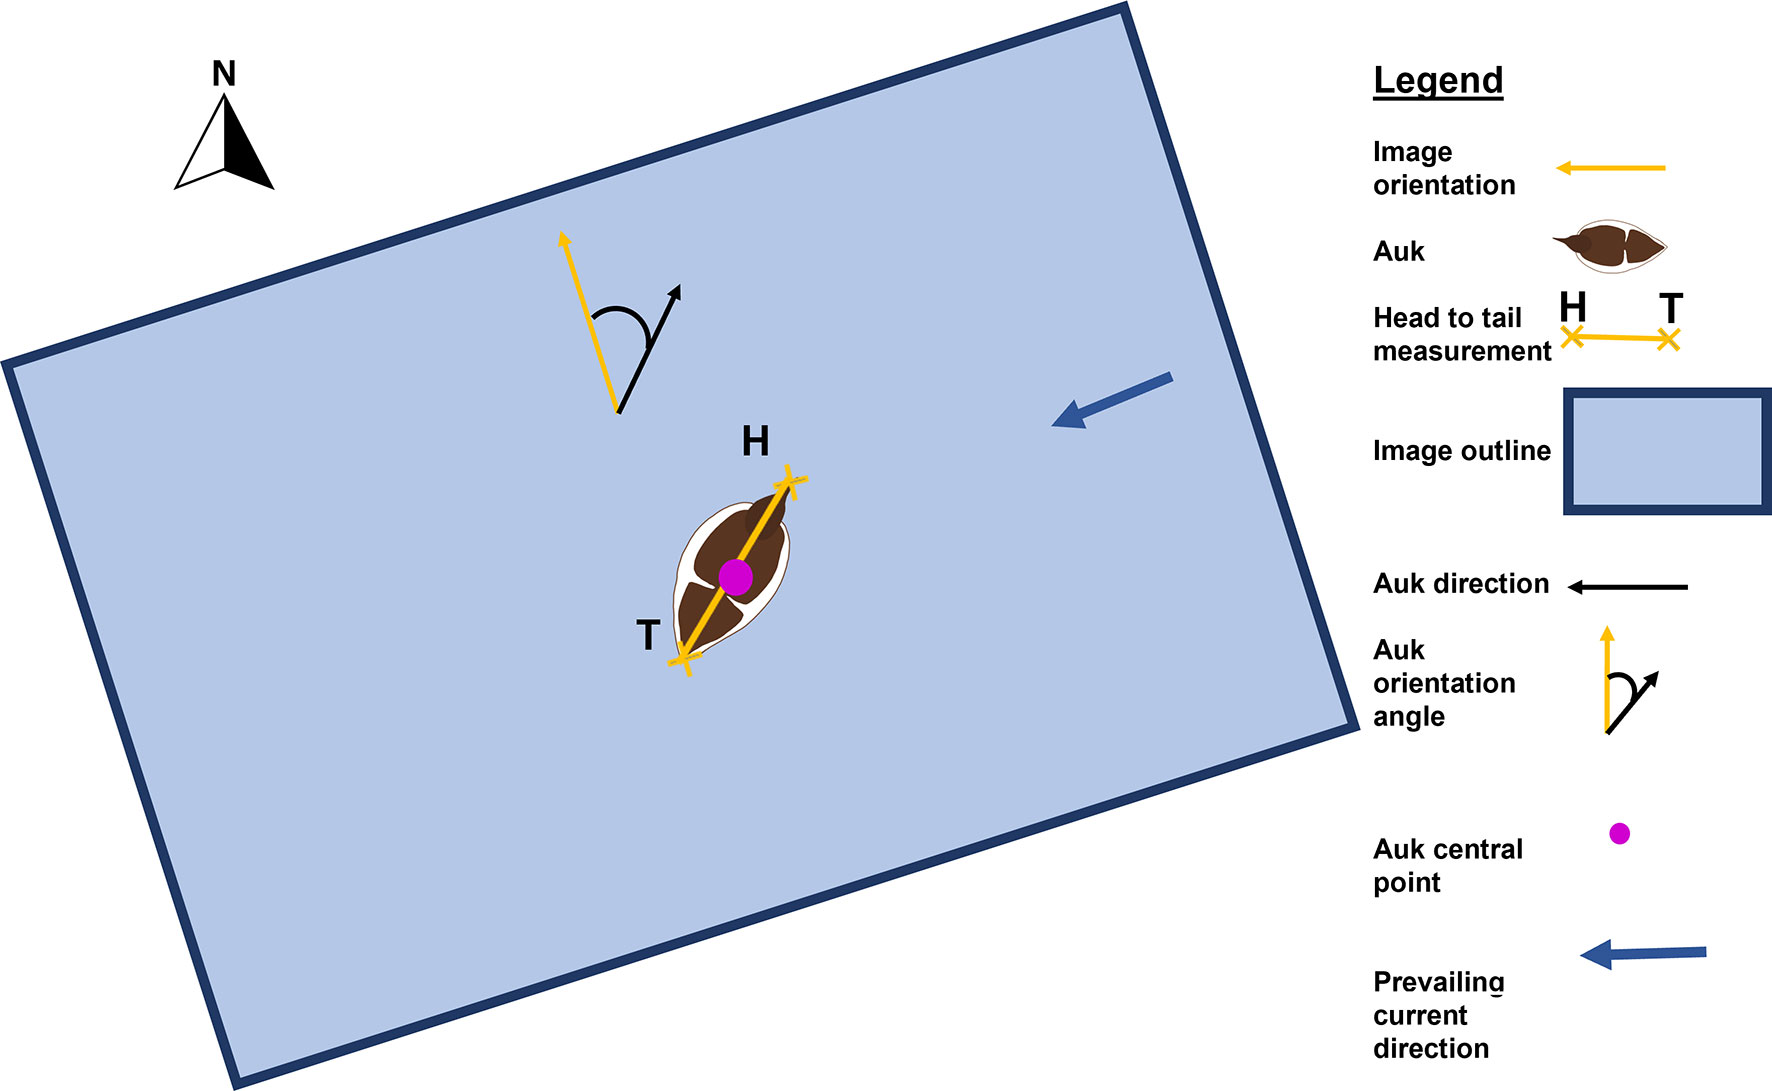
Figure 2 Metrics obtained from UAV imagery including bird central point, head (H) to tail (T) measurements and orientation angle.
Categories were used to represent auk relative orientation and formed three classifications: with the flow (> 0 – ≤ 45°), across the flow (> 45 – ≤ 135°) and against the flow (> 135 – ≤ 180°) (Figure 3). Orientation relative to the flow was then examined in relation to hydrodynamic covariates (tidal phase and current velocity). Auk distribution was analysed in relation to kolk-boils present at the surface, detected within concurrent imagery, and the same hydrodynamic variables.
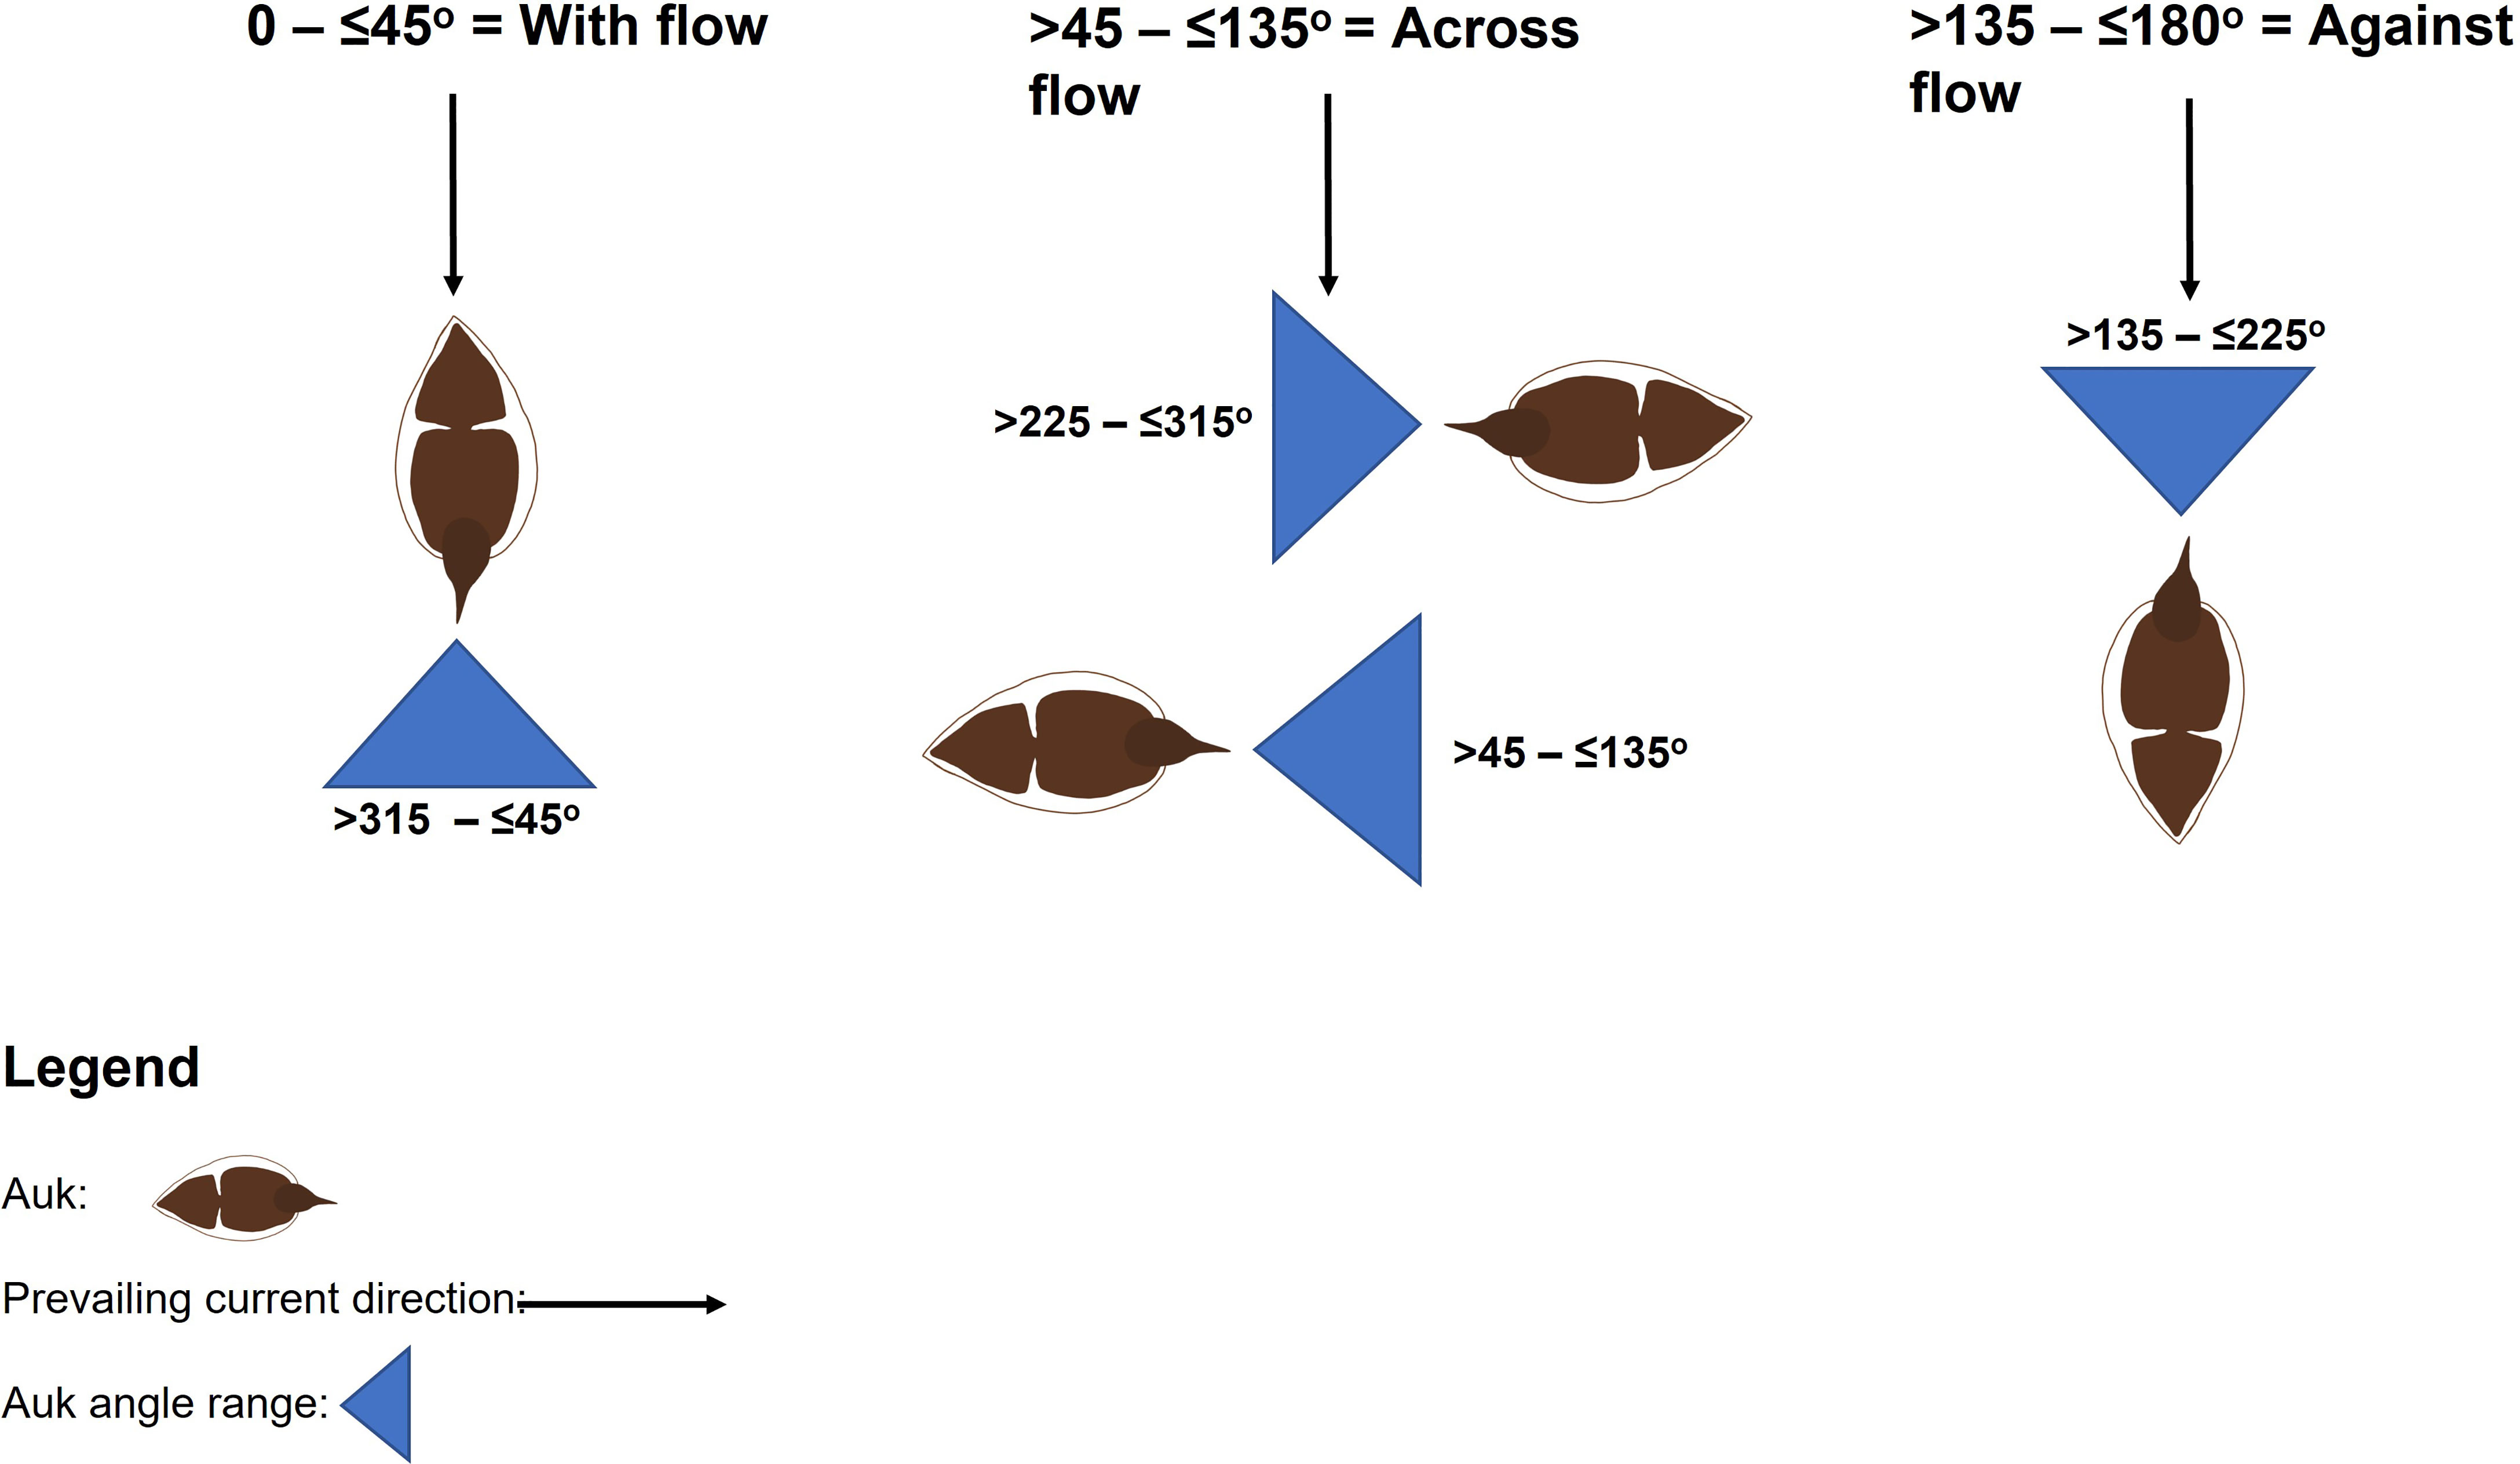
Figure 3 Classifications of auk orientation relative to flow.
Birds deemed to be visually poorly defined (family identification confidence score = 1) were excluded at this point due to an inability to accurately classify to a family level. This excluded 20 potential auks from an initial 262 individuals. The final data set was then subset to only include auks classified as sitting due to this being the most likely behavioural state to interact with turbulent features at the surface and tidal energy devices below the water. All detected auk individuals were then blind verified by a second, independent, observer with experience in seabird identification to confirm each family level of identification and provide a species level where possible. To resolve potential errors in species identification, and due to the low numbers in each relevant species group (160), with some individuals (82) not being able to be accurately classified at this higher resolution, all analysis remained at a family level of identification. Secondary evaluation confirmed that all individuals logged as being within the auk family were correctly identified. However, had this not been the case, falsely identified auks would have been removed from the dataset at this point.
The output files for each survey were collated and merged into a single dataset. This included bird central point position, bird orientation (degrees), a confidence value of family level identification, kolk-boil central point, telemetry data, and relevant explanatory variables taken from the central point of each image: current velocity (m/s), current direction (degrees) and tidal phase (assigned based on the average current velocity and direction).
2.5 Data Analysis
All analysis was carried out within the software R 2020 (R Core Team, 2020). To analyse kolk-boil and auk spatial distribution, and associations, the package “spatstat” was used (Baddeley et al., 2015). Data were transformed into a point pattern process (PPP). This allowed for the addition of categorical marks, which could be assigned to each point (auk or kolk-boil), and the designation of a custom window in which they could be assessed (a shape file of the Inner Sound and surrounding sides of the Island of Stroma). To visually assess spatial density distribution of auk and kolk-boils, kernel smoothed intensity plots were implemented with an isotropic smoothing bandwidth (sigma) of 200 m for the scale of analysis. This value was chosen to capture all fine-scale spatial associations within the entirety of the area surveyed (Inner Sound channel and Island of Stroma).
A multitype pairwise correlation function (MPCF) was used to analyse spatial associations between individual auks and kolk-boils. The method is a bivariate derivation of Ripley’s K function and measures spatial association within rings instead of cumulative circles. This allows for the denotation of whether points are clustered, dispersed or randomly distributed between marks throughout a study area (Gillan and Gonzalez, 2012). The approach allowed analysis of a PPP between the distances of each circle, instead of just within a larger area, by looking at a neighbourhood of points surrounding the specified radius. This is achieved by giving greater importance to points close to the radius, and less to those further away, through the implementation of a defined bandwidth value (Gillan and Gonzalez, 2012).
A marked correlation function, which detects correlations amongst categorical marks in PPPs, was used to determine the bandwidth value for analysis and highlight an overall distance at which there is significant correlation (either clustering or dispersion) between points. Beyond this point was deemed to be non-meaningful as it is unlikely that points would influence each other beyond that spatial range. In this case, a significant relationship, of some description, was observable between kolk-boils and auks up to 500 m (Supplementary Figure 2). The focus of kolk-boil and auk interaction was therefore between 0 - 500 m within the following results.
A bandwidth of 40 m was chosen to best highlight potential relationships within this 500 m range. The choice of bandwidth is an important consideration in MPCF plots, as too large a value will create information loss and too small a figure will create large fluctuations (Binder and Simpson, 2015). There is also limited information within the literature on the correct procedure to calculate this value (Illian et al., 2008). Therefore, the bandwidth was increased in 10-m increments, from 0 m, until the output created a smooth line. Finally, MPCF analysis was carried out within a simulation envelope to investigate if relationships observed were significant. This approach compared observed patterns against a number of simulations (n = 100) based upon the null model, creating 95 % confidence intervals, with observed relationships being significant if exceeding upper and lower bounds (Szmyt, 2014).
A Chi-squared test of homogeneity, with a significance level of p ≤ 0.05, was used to assess if overall counts of relative orientation (across flow, against flow and with flow) were distributed identically within the classifications or if significant variation was present. Within this, and prior analysis, the assumption that auks were acting independently of each other was made. While this cannot be statistically proven, literature does highlight the prevalence of individualistic behaviour within auk species (Johnston et al., 2018). For relative orientation, with regard to tidal phase and current velocity (Table 3), a Gaussian finite mixture model was implemented to estimate modality of the density of distributions using the R package “mclust” (Scrucca et al., 2016).
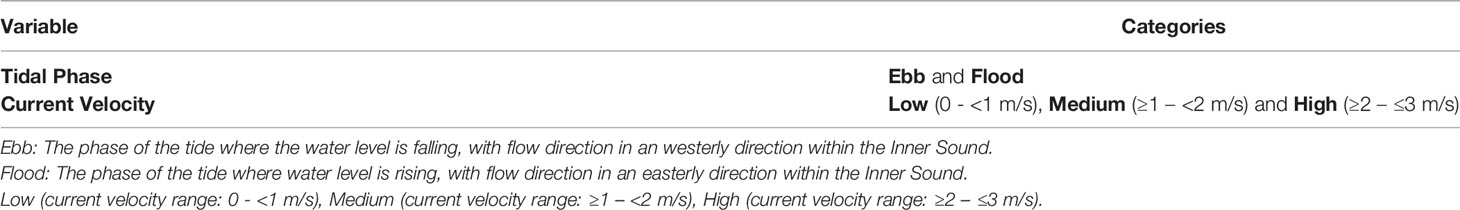
Table 3 Hydrodynamic variables used in examination of relative orientation, density distribution and multitype pairwise correlation function.
3 Results
3.1 Spatial Association With Kolk-Boils
3.1.1 Density Distribution
A total of 242 auks, comprising 118 common guillemots (Uria aalge), 35 razorbills (Alca torda), 7 puffins (Fratercula arctica) and 82 unidentifiable auks, were detected sitting on the water surface within UAV imagery. Throughout all tidal states the highest densities of auks (max density > 5x10⁻⁵ individuals/m2) and kolk-boils (max density > 7x10⁻⁵ individuals/m2) were observed within images taken in the Inner Sound channel (Figure 4). Kolk-boil and auk coverage were predominantly within the channel, with some auks detected on the eastern and western sides of the island of Stroma.
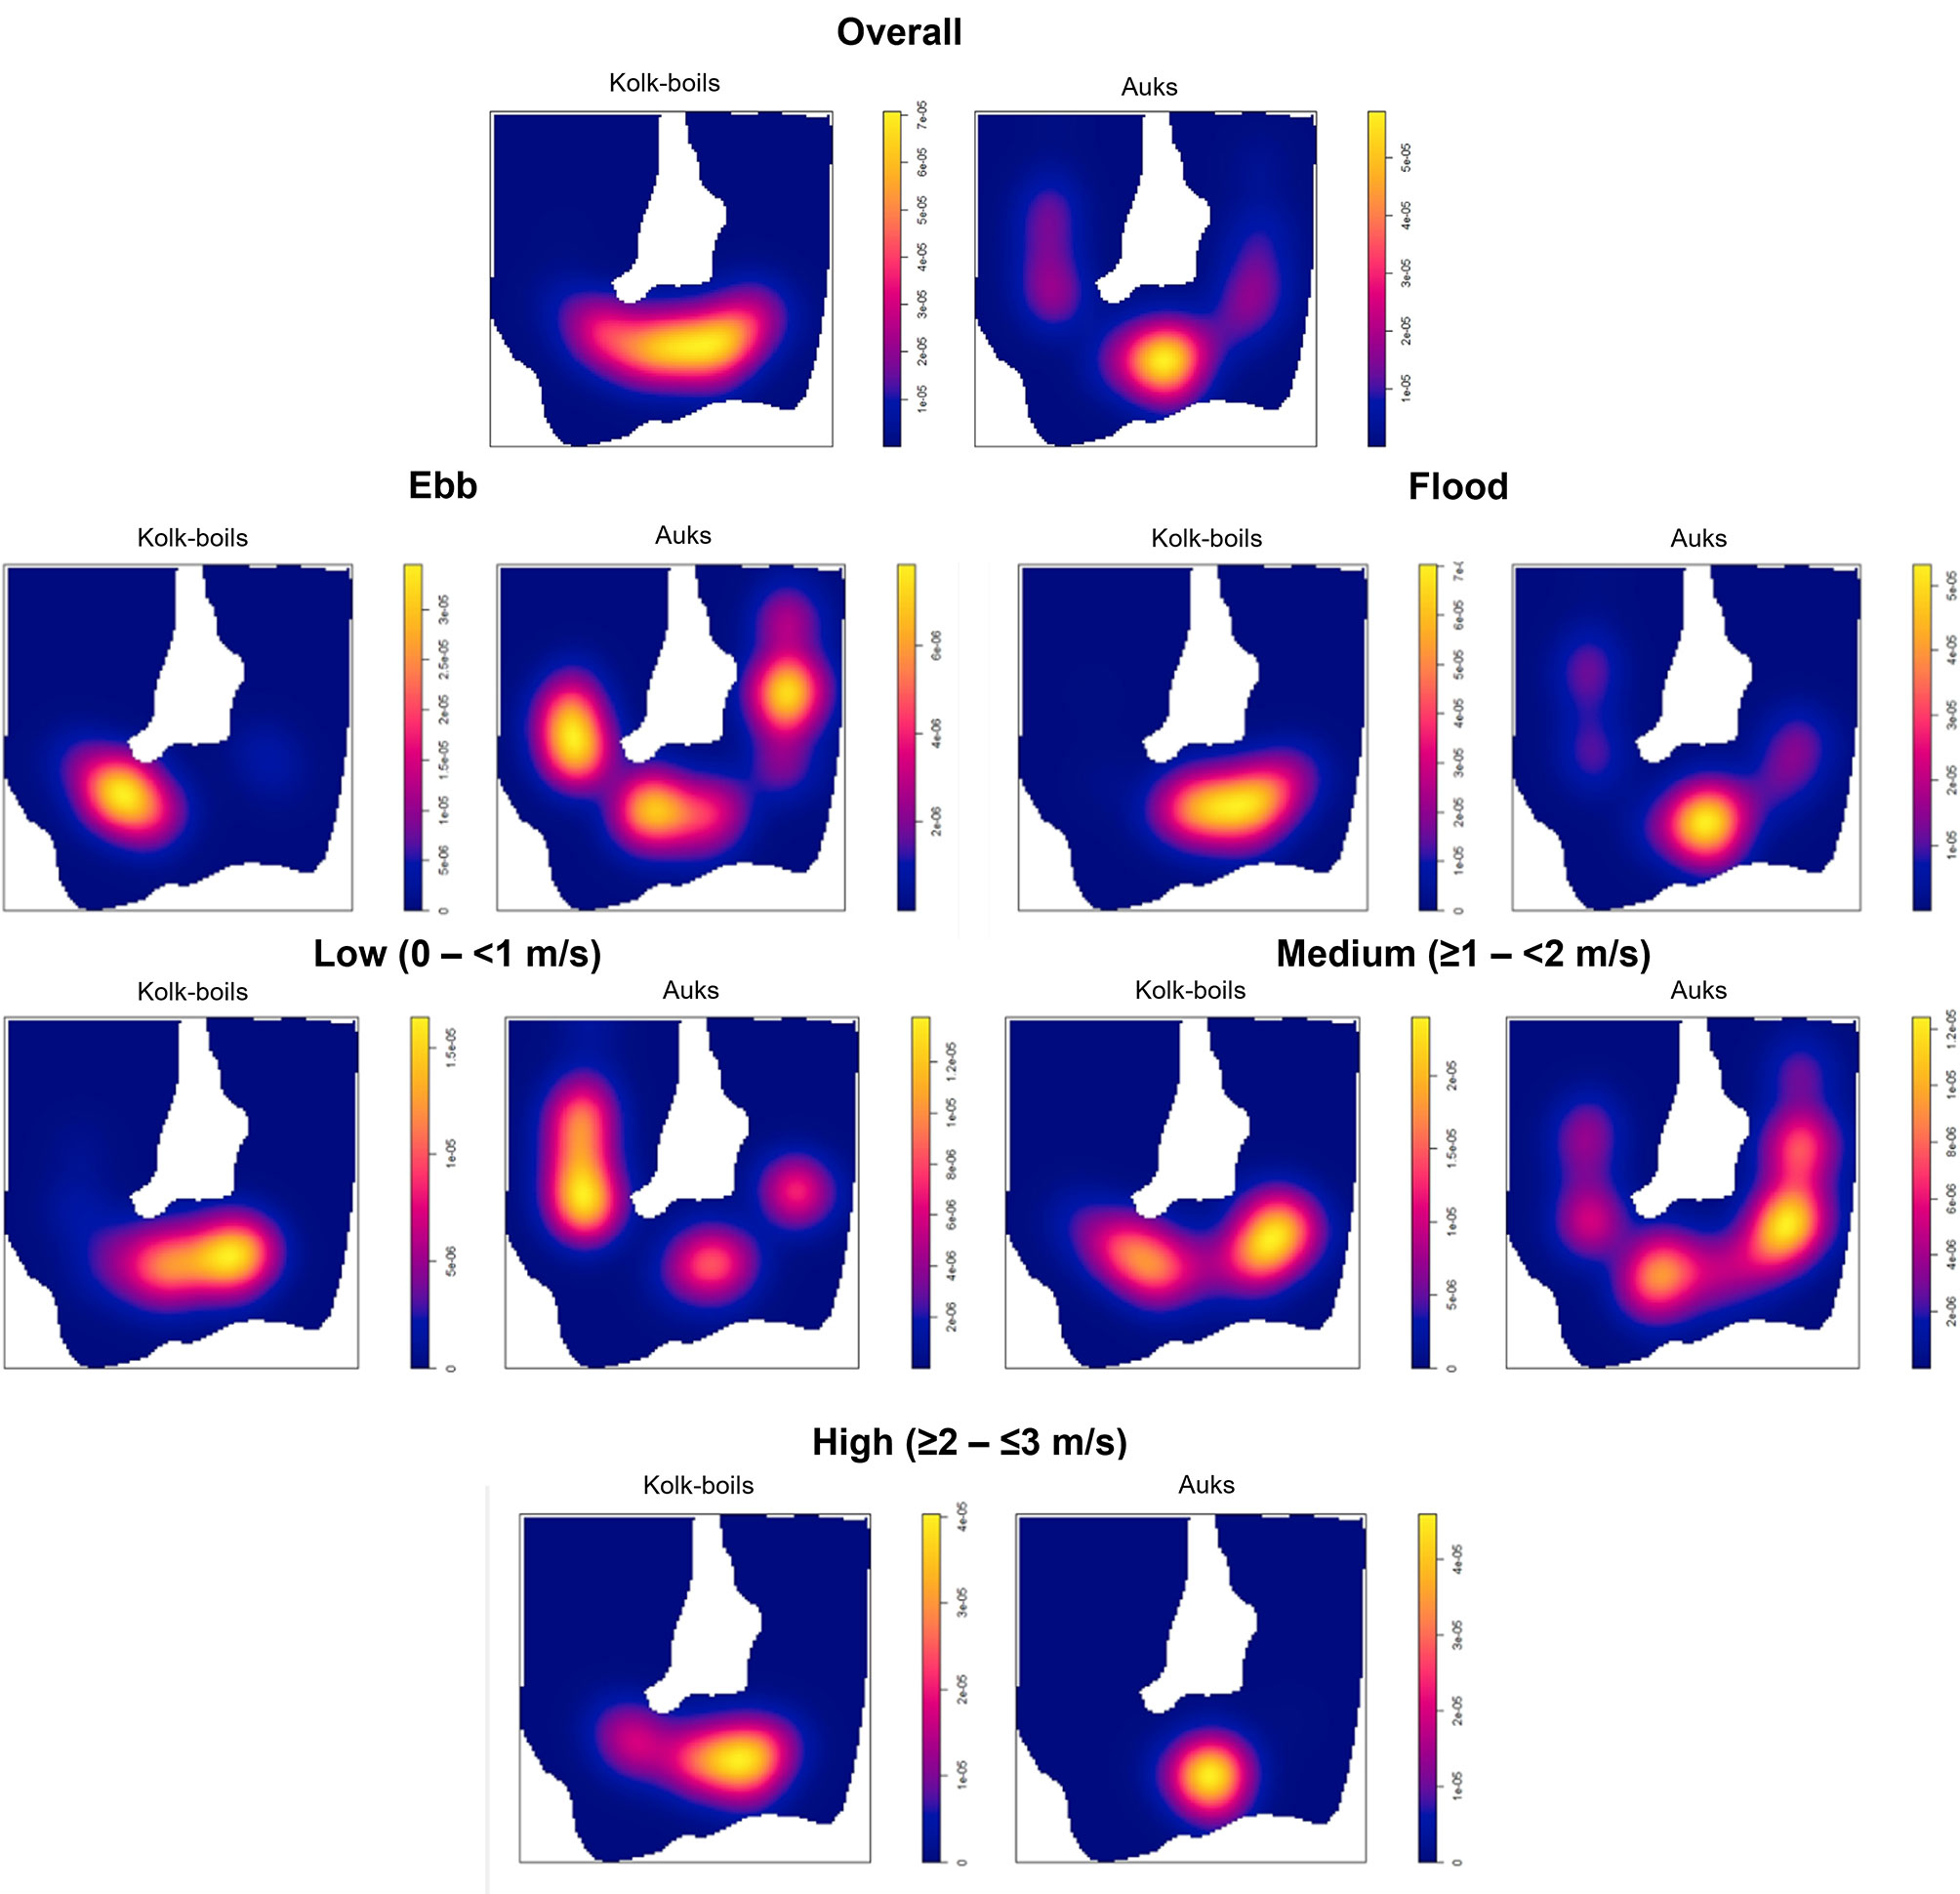
Figure 4 Density distributions (individuals/m²) of kolk-boils and auks overall, across ebb and flood tidal phases and at differing current velocity ranges (at 200 m bandwidth) across the Inner Sound and island of Stroma areas of the Pentland Firth.
When subset by tidal phase, kolk-boil density distribution was greatest in the central to eastern areas of the Inner Sound on the flood phase (max density > 7x10⁻⁵ individuals/m²) and further west on the ebb phase (max density > 3x10⁻⁵ individuals/m²) (Figure 4). Auk density was more variable on the ebb phase (max density > 6x10⁻⁶ individuals/m²). On the flood phase clustering of auk density distribution (max density > 5x10⁻⁵ individuals/m²) was observed at the central area of the Inner Sound, slightly to the south of corresponding kolk-boil density.
When subset by current velocity, kolk-boil density distribution was predominantly clustered within the central channel area of the Inner Sound across all velocities surveyed (low = max density > 1.5x10⁻⁵ individuals/m², medium = max density > 2x10⁻⁵ individuals/m², high = max density > 4x10⁻⁵ individuals/m²) (Figure 4). Auk density was evenly distributed both within the Inner Sound, and around the island of Stroma, in low (max density > 1.2x10⁻⁵ individuals/m²) and medium (max density > 1.2x10⁻⁵ individuals/m²) flow speeds. However, at fast velocities, auk density became highly clustered in the central area of the channel (max density > 4x10⁻⁵ individuals/m²).
3.1.2 Multitype Pairwise Correlation Function
Analysis highlighted that although auks and kolk-boils (r-range = 0 – 4.2) were slightly dispersed, at < 100 m this relationship was not deemed to be significant and fell within the simulated values indicating random distribution (Figure 5). However, significant dispersal between auks and kolk-boils was observed between 100 – 500 m.
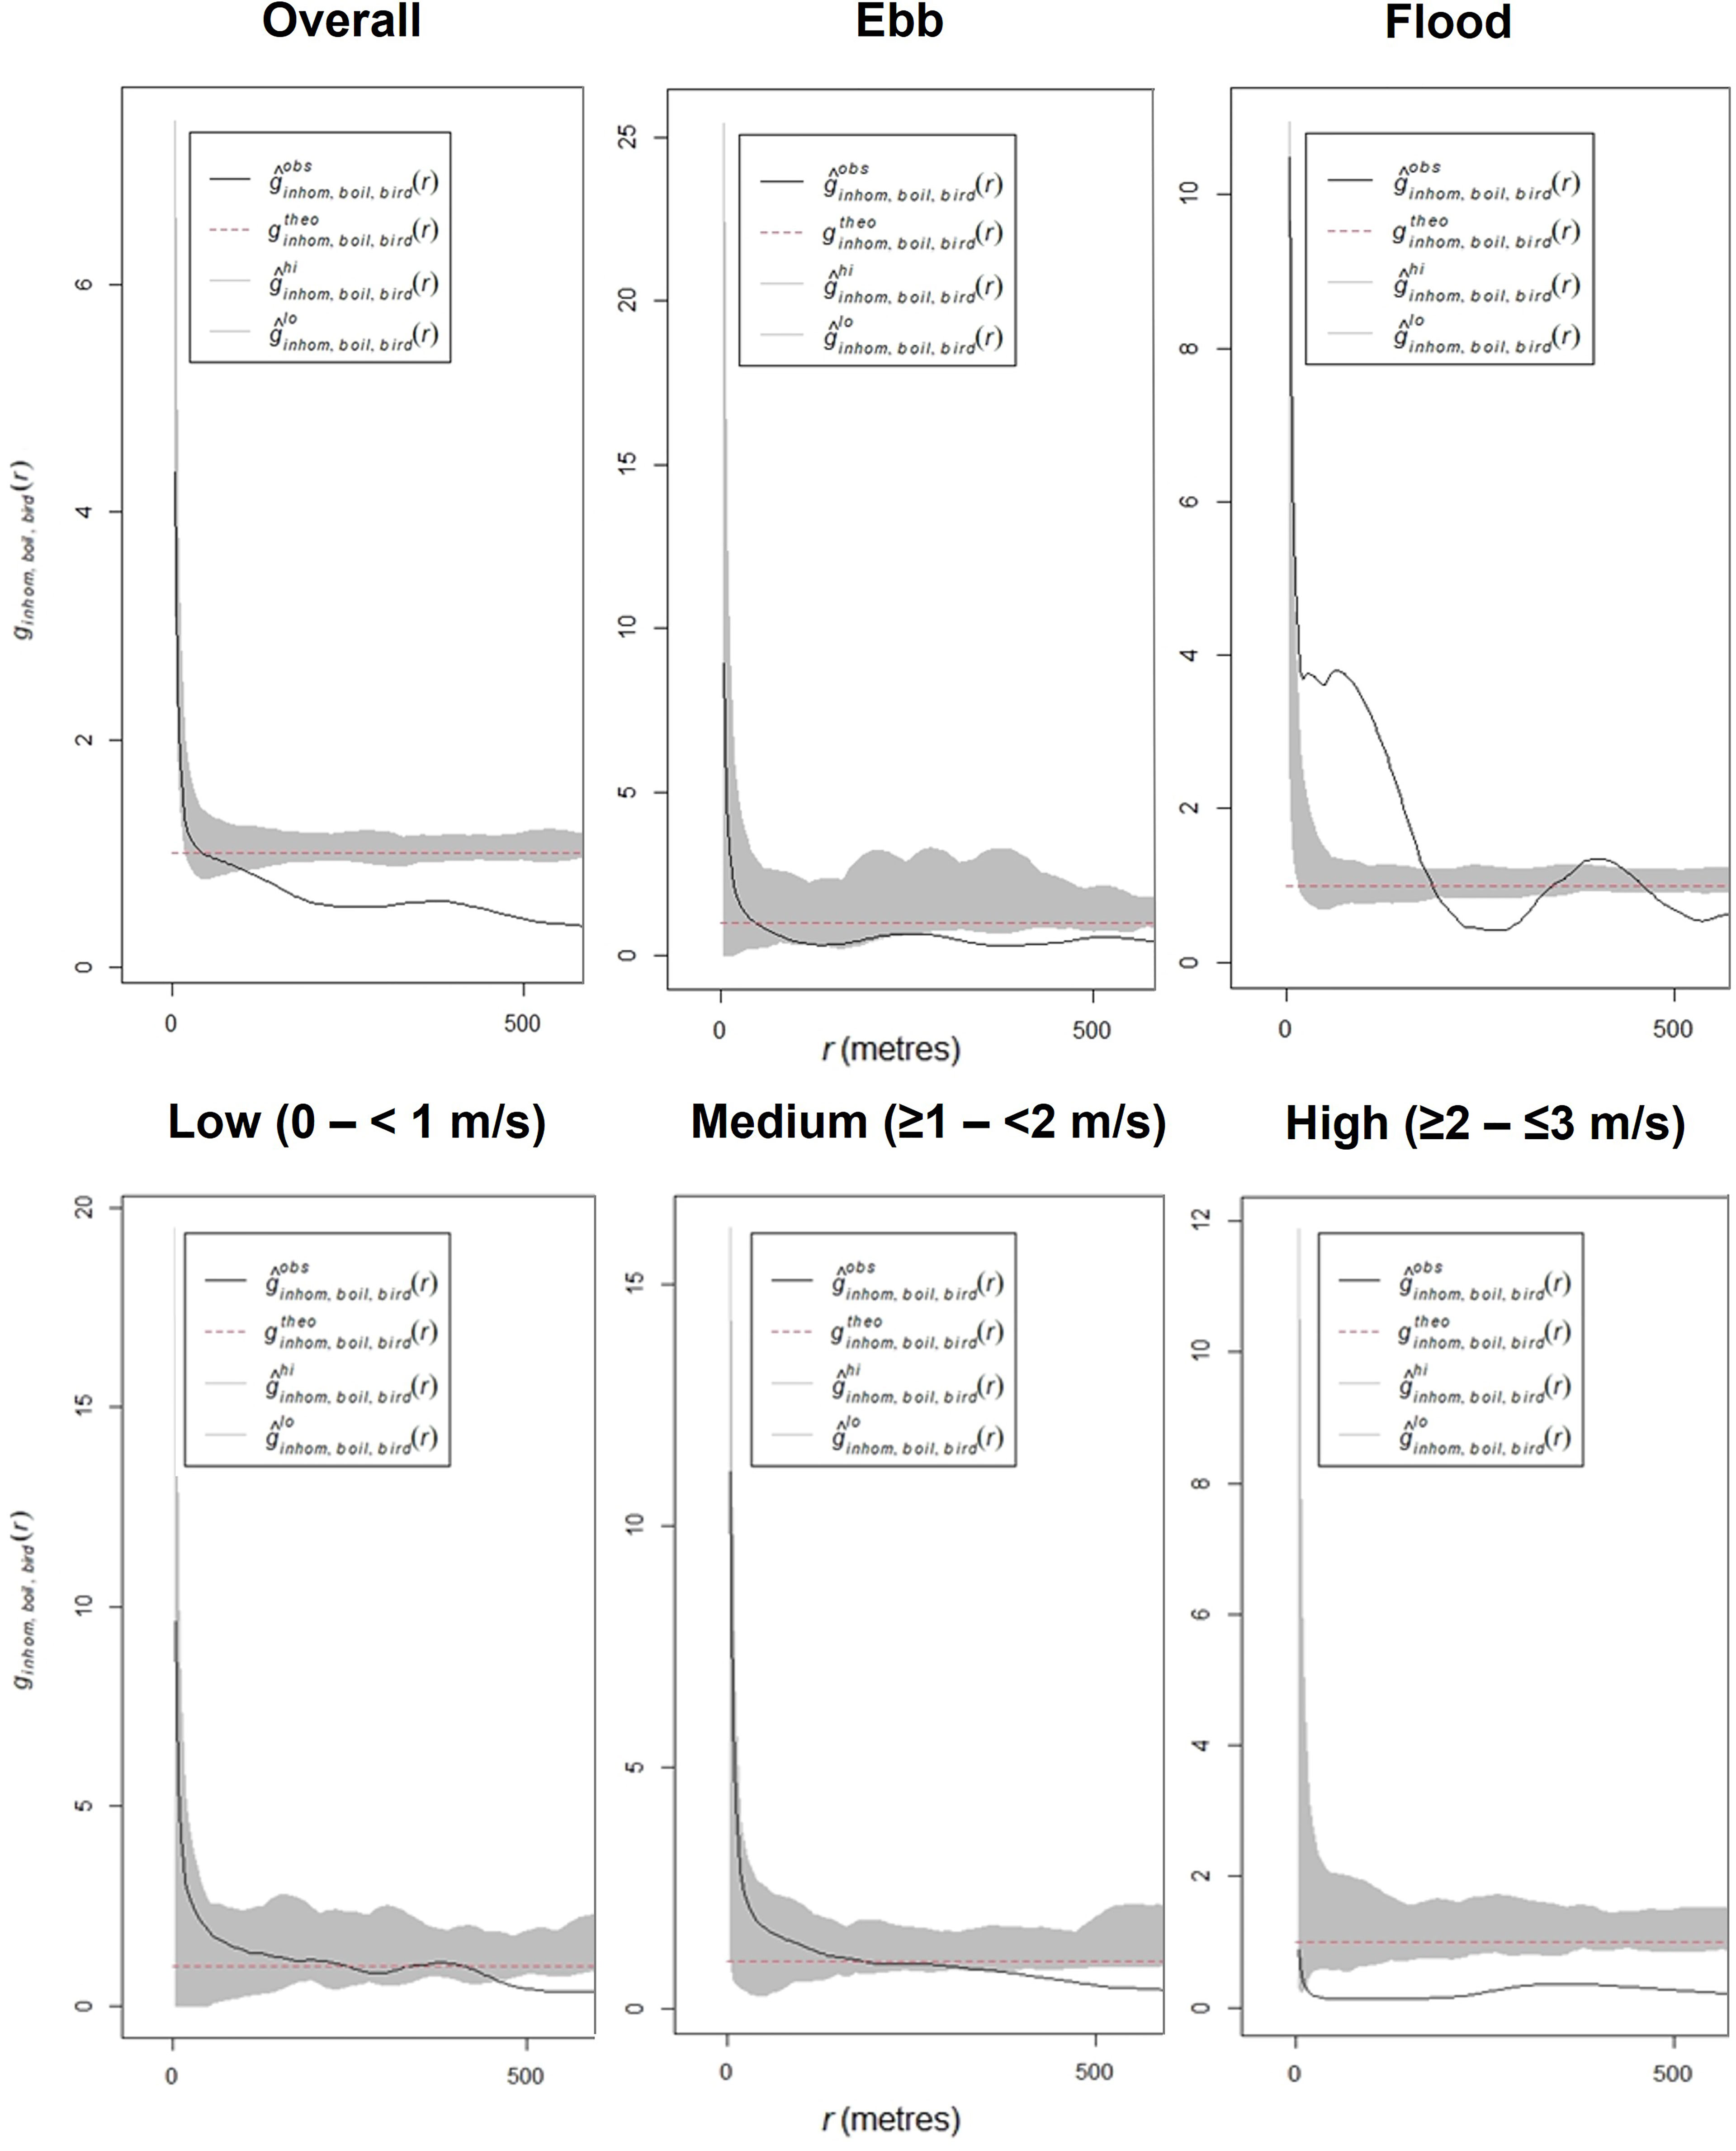
Figure 5 Multitype pairwise correlation function plot of kolk-boil and auk point associations overall, across ebb and flood tidal phases and at differing current velocity ranges (at 40 m bandwidth), across the Inner Sound and island of Stroma areas of the Pentland Firth. Grey shaded area (hi, lo) represents 95 % confidence intervals, black line (obs) the observed values and red dashed line (theo) indicates the theoretical value.
When subset by tidal phase, on the ebb phase (r-range = 0 – 9.6), significant dispersion was observed between auks and kolk-boils beyond approximately 250 m (Figure 5). However, on the flood phase (r-range = 0 – 7.2), increased variability in the relationship was noted, with significant clustering between kolk-boils and auks between approximately 50 – 250 m. However, significant dispersion was then observed between approximately 250 – 400 m, with significant clustering with individuals at 450 m.
When subset by current velocity, significant dispersion was only observed between auks and kolk-boils at low flow speeds (r-range = 0 – 9.8), at approximately 500 m (Figure 5). At medium flow speeds (r-range = 0 – 11.0), the distance at which significant dispersion was observed between auks and kolk-boils reduced to beyond approximately 400 m. At high current velocities (r-range = 0 – 0.9), significant deviation between auks and kolk-boils was observed from beyond approximately 10 m.
3.2 Auk Orientation
Across all detected auks, 191 (79 %), were orientated across the flow (Figure 6). This was significantly higher than with the flow (14 %), and against the flow (7 %), classifications (X2 = 227.76, DF = 2, p < 0.001).
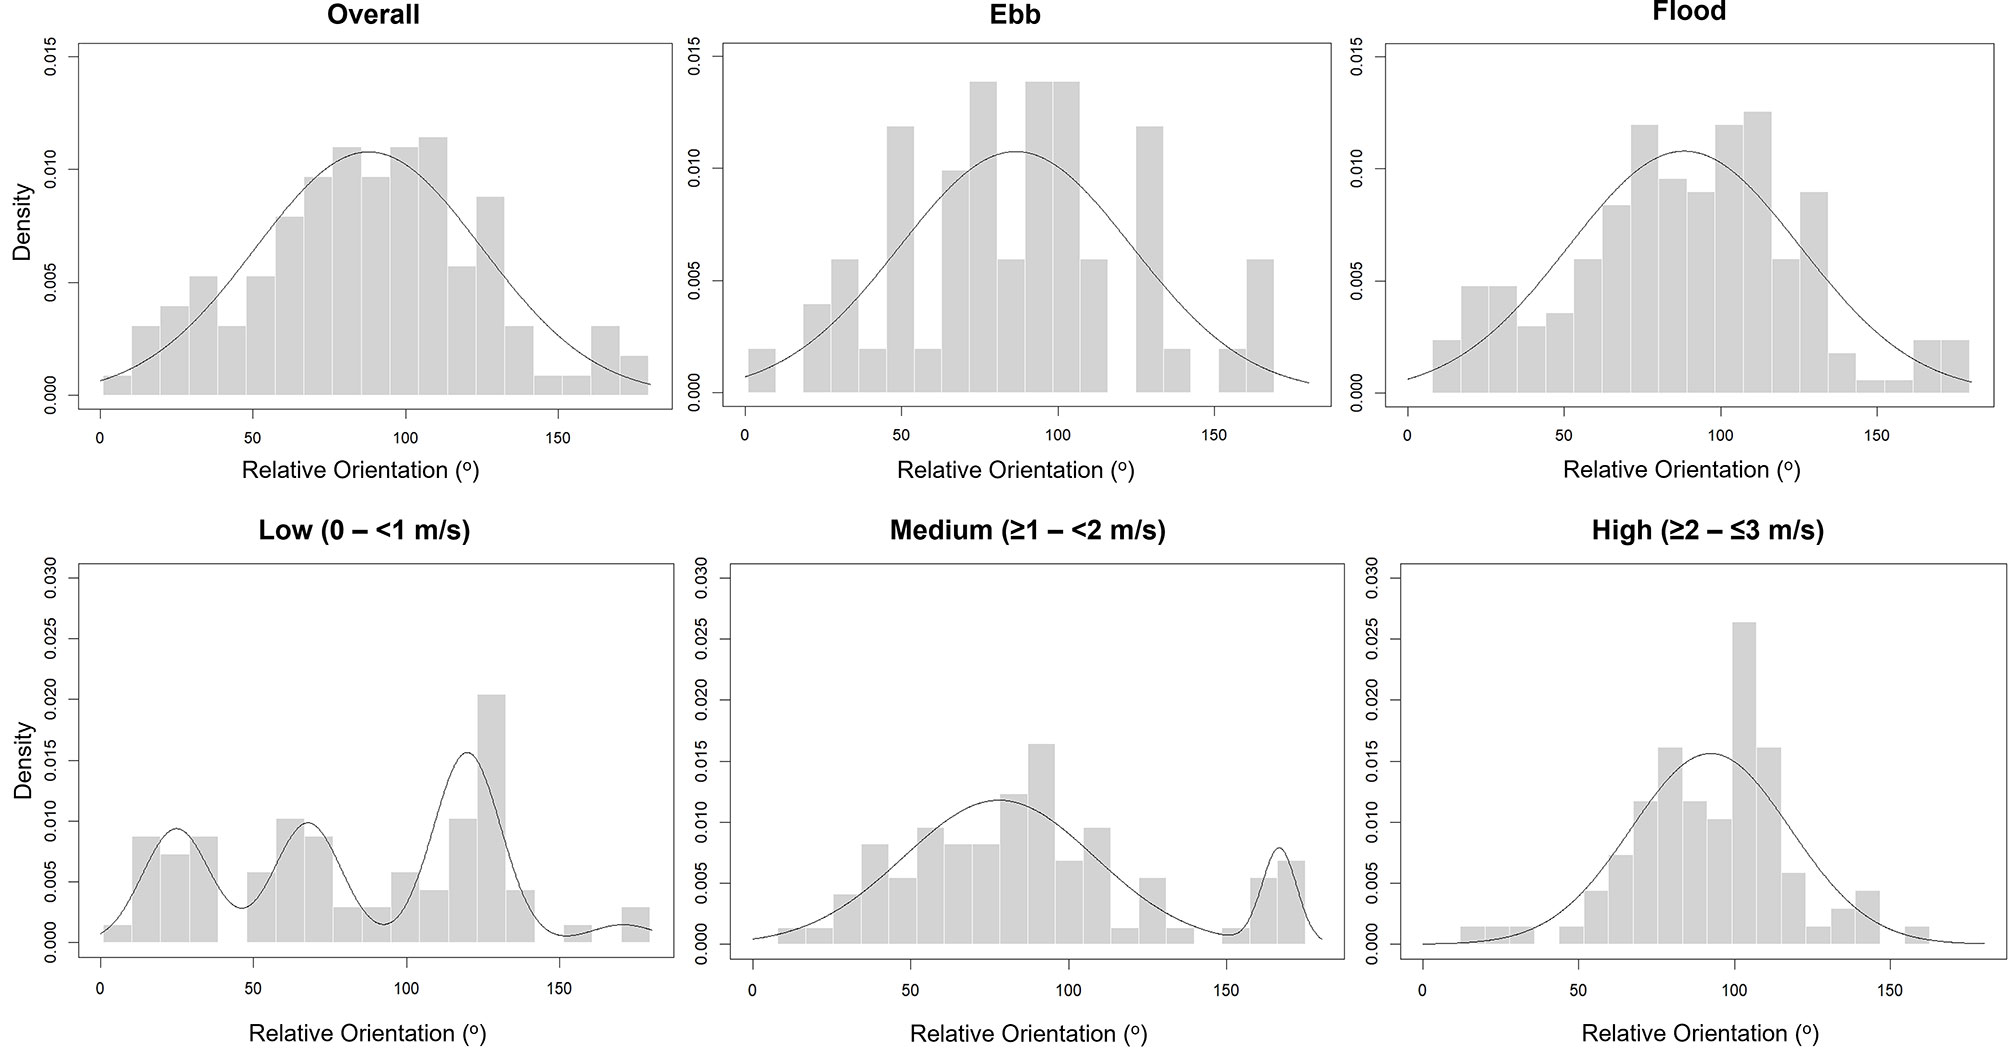
Figure 6 Observed densities of auk orientation relative to flow (grey bars) overall, split by ebb and flood tidal phase and across differing current velocity ranges, with Gaussian mixture-based density estimate curves (black line).
Significantly more auks were detected within the flood phase (185) compared to ebb (57) (X2 = 67.70, DF = 1, p < 0.001). Significantly more auks were orientated “across flow” during both flood (X2 = 174.37, DF = 2, p < 0.001) and ebb (X2 = 53.47, DF = 2, p < 0.001) than with/against flow, with both flood and ebb distributions displaying a unimodal distribution (Figure 6).
The highest percentage of auk orientation was observed within the “across flow” category when examined at low (X2 = 51.808, DF = 2, p < 0.001), medium (X2 = 60.31, DF = 2, p < 0.001) and high (X2 = 127.42, DF = 2, p < 0.001) current velocities (Figure 6). However, greater variation in auk orientation occurred at low and medium flow velocities compared to high, as indicated by probability density estimates.
4 Discussion
This study demonstrates the capability of using UAV imagery to characterise fine-scale bird species orientation and associations with kolk-boils at the sea surface. It also uniquely found that auk species predominantly orientated themselves across the flow irrespective of tidal phase, and at current velocity > 2 m/s. The density distribution of auk species was influenced by current velocity and tidal phase, and often coincided with that of kolk-boils. However, spatial analysis generally highlighted a negative correlation between individual auks and kolk-boils. These findings offer novel insights into fine-scale auk habitat usage via examination of correlations with empirically quantified turbulent features and incorporation of auk orientation. These results highlight the need for an increased evidence base for tidal energy developers, and regulators, to inform environmental impact assessments (EIAs) and post-construction impact monitoring.
4.1 Seabird Associations
4.1.1 Spatial Associations with Kolk-Boils
Literature suggests that many foraging auks display a “moderate to strong” association with high current velocities, > 2 m/s, with this plateauing and then declining above 3 m/s (Benjamins et al., 2015; Waggitt et al., 2016b; Waggit et al., 2016a). It is therefore likely that auks will correlate, or associate, with kolk-boils which are highly prevalent at the surface when velocities exceed 2 m/s (Slingsby et al., 2021a). Results from this study showed that spatial patterns between auks and kolk-boils were present, with auk densities similarly located to those of kolk-boils (Figure 4). However, a significant dispersion between individual auks and kolk-boils, when within 100 – 500 m of each other, was indicated (Figure 5). At highly localised scales (10 – 100 m) areas of upwelling, produced by kolk-boils, may provide important environmental cues to auks in terms of foraging site selection, as has already been observed in foraging tern species in areas of high current flow (Lieber et al., 2021). This could explain why there were observed similarities in overall distributions of both auk and kolk-boils, but why significant dispersion was then recorded between individual auk and kolk-boils. However, unlike aerial foraging seabirds such as terns, auks must consider the energy requirements needed to approach, and move within, kolk-boils due to primary foraging strategies involving the pursuit of prey through the water column (Nol and Gaskin, 1987; Johnston et al., 2018). This juxtaposition becomes more apparent when examining the interaction of auk species and kolk-boils in relation to current velocity and tidal phase.
In relation to current velocity, density distribution plots showed concentrations of auks and kolk-boils to be spatially similar within the study site at the highest flow velocity category sampled (Figure 4). However, the overall relationship between individual auks and kolk-boils, at the same velocity category, was that of significant dispersion (Figure 5). For animals utilising tidal stream environments the energetic demands are high, particularly in areas of increased depth, current velocity and turbidity (Waggitt et al., 2016b). The disparity between overall density distribution and individual relationships indicates that the areas surrounding, or the edges of kolk-boils themselves, may be preferentially targeted by auks due to yielding high enough densities of prey species to actively associate with. Prey species at the peripheries of kolk-boils may still be disorientated from interacting directly with it, requiring less energy to catch, or have the opportunity to resume shoaling behaviour (where individuals swim in close proximity, in the same direction, in a coordinated manner) (Liao, 2007). This would make prey increasingly aggregated and more detectable by foraging auks in these areas (Waggitt et al., 2016b). The peripheries of kolk-boils, characterised by waves and bubbles, could also provide a form of cover for foraging auks to approach prey species and avoid detection due to increased turbidity in the water (Haney and Stone, 1988). However, these areas may concurrently lower an auk’s ability to detect prey items. While the exact nature of these relationships is unclear, this work highlights the continued importance of integrating fine-scale prey metrics into assessments of marine megafauna usage of tidal stream environments. A focus on fish associations with turbulence, alongside inter-species (auks) differences in habitat associations, is of paramount importance moving forwards to fully describe the complex bio-physical interactions occurring.
Overall, auk and kolk-boil densities were similarly distributed across differing tidal phases (flood and ebb) although increased variation was observed on the ebb (Figure 4). Between individual auks and kolk-boils, a pattern of dispersion was evident on the ebb phase, while significant clustering was observed on the flood (Figure 5). While the latter contrasts the overall trend of dispersion between individual auks and boils, it may not be in direct contradiction. Previous work has shown that within the Inner Sound of the Pentland Firth, kolk-boils are more localised during the ebb phase due to the prevailing current direction (Slingsby et al., 2021a). This results in a predominant presence at the western (downstream) extent of the channel throughout the ebb phase, but across the majority of the channel in the flood (Slingsby et al., 2021a). Therefore, while clustering was present on the flood phase, this may be correlation but not necessarily causation, and could still fit similar observed trends of fine-scale dispersion. It is likely that the increased spatial distribution of kolk-boils, throughout the flood phase, may mean that these turbulent features are unavoidable to foraging auks, as opposed to the ebb phase where their coverage is more localised. In this circumstance, the need to forage may outweigh the energetic cost of traversing through or in the vicinity of kolk-boils. Further study is needed to fully characterise these relationships, including the differing associations noted at contrasting tidal phases and site-specific differences.
4.1.2 Orientation
Auks are considered to be pursuit divers that propel themselves after prey species underwater, using wings or feet, from a stationary position at the sea’s surface (Haney and Stone, 1988). This has been deemed to be an “energetically costly” form of locomotion to hunt prey, meaning energetic efficiency is key to successful foraging and reproductive strategies (Cairns et al., 1987). When foraging within tidal stream environments, which are themselves energetically challenging, auks exhibit a tendency to dive against the prevailing flow direction (Wade, 2015; Cole et al., 2019). While this method would not be without high energetic costs, it is perhaps the most efficient to pursue targets underwater, as prey species also exhibit a similar response in fast current flows (Wade et al., 2013; Williamson et al., 2021).
Within this study auk orientation was primarily across the tidal flow, with this pattern apparent regardless of tidal phase and at the highest sampled current velocities (Figure 6). Therefore, with a high cost associated in diving against the flow within a highly turbulent environment, orientation at the surface may play a key role in offsetting the resultant energy expenditure. Auks orientating across the flow will have the largest surface area facing the prevailing current direction, creating increased hydrodynamic drag, meaning that an individual would be more likely to travel with the flow at no energetic cost (Mattos et al., 2007). This is likely to be part of what has been described as the “conveyor-belt” foraging theory which is a particular strategy employed by several pursuit-diving seabird species within tidal stream environments (Isaksson et al., 2020). Specifically, it is when individuals drift passively into an area, using the prevailing current, followed by flying upstream and diving against the flow before the process repeats itself (Johnston et al., 2018). UAV imagery allows for further characterisation of the drifting periods of this strategy and highlights the importance of orientation in gaining maximum benefit of passive travel from the prevailing current direction.
Auk orientation across the prevailing current direction may also be linked to bird visual ranges. Auks, like most bird species, rely heavily on visual information to guide foraging and other activities (Martin and Crawford, 2015). While pursuit-diving seabirds experience restrictions on vision when underwater, due to changes in visual fields from effects of immersion causing increased reliance on tactile or auditory cues, this is not the case at the surface (Cantlay et al., 2020). Although it must be stated that there are clear interspecific differences, in terms of visual fields and eye placement, the same general characteristics are present in all auk species (Martin and Wanless, 2015). Environmental cues at the surface, biological cues just below the surface, and aerial threats from above may be examples of visual drivers that could determine orientation (Martin and Wanless, 2015; Lieber et al., 2019; Lieber et al., 2021). Auks, similarly to other predatory bird species, utilise both lateral and binocular vision when interacting with the environment, with the former generally used when searching for prey or threats (Martin, 2017). Thus, orientating across the prevailing flow direction may provide the greatest visual range for auk species to observe and react to cues, as a perpendicular angle could allow for a greater volume of water to pass by an individual, comparative to facing with or against it. However, further work would be required to evaluate whether this rationale is supported.
4.1.3 Implications for Environmental Impact Assessments
For robust EIAs to be carried out, it is necessary to properly characterise the proposed development site and quantify the utilisation of it by species of potential concern. The fine-scale associations between seabirds and surface features can be difficult to study as tidal stream environments are logistically, and physically, challenging to survey within due to high flow velocities (Kregting et al., 2016). This results in a lack of detailed assessments and an increased uncertainty on potential environmental impacts identified in EIAs. This can also have ramifications after EIAs have been carried out, with it of paramount importance that pre-construction and post-construction data collection and methodology is as closely aligned as possible for consistency (British Standards Institution, 2015).
UAV usage allows for a potential way to achieve this through the simplification of data collection methods, as both objects of interest (seabirds and turbulent features) were sampled concurrently at identical spatio-temporal scales. Combined methodologies can reduce differences in monitoring approaches, that may be hindering the overall accuracy of EIAs, and reduce the associated risks of surveying within a challenging environment (Fox et al., 2018). UAV surveys offer a streamlined approach to alleviate these risks while providing the necessary resolution of data required to accurately assess the environmental impact of tidal energy developments (Roche et al., 2016). In relation to seabirds, this is a necessity, with a number of species described as having a “high vulnerability” to tidal turbine impacts (Furness et al., 2012). However, there would be a requirement for additional studies, incorporating the use of this methodology, to demonstrate it is reliable for direct use in EIA assessments to mitigate risks to project timescales and financing. The priority regarding this would be to increase the volume of UAV imagery data available to fully explore the fine-scale relationships observed within this work over increased temporal cycles. In doing so, this would provide more relevant information on the potential interactions between seabirds and tidal energy devices.
UAV imagery also provides the capability for novel fine-scale insights not possible to capture with existing survey methods. This includes seabird orientation, relative to the flow, and the analysis of spatial associations with kolk-boils. These metrics can aid in the continued understanding of drivers behind auk foraging, and in doing so, increase the ability to quantify seabird sensitivity to tidal energy developments (Johnston et al., 2018), such as alteration to hydrodynamic habitat, collision risk and prey availability (Haverson et al., 2018). The development and incorporation of novel techniques, such as displayed within this study, is essential in continuing to fill knowledge gaps that may aid in further developing increasingly representative EIAs. This should include the investigation of seasonal changes to the relationships detailed within this work, as these may potentially vary on an annual basis.
Although UAV imagery was used to capture fine-scale seabird associations with turbulent features at the surface, it is one small segment of a much larger data collection effort. To target the variety of relevant variables occurring at differing spatio-temporal scales, a conceptual framework by Isaksson et al. (2020) suggested a combination of survey tools is required. A multi-faceted approach, comprised of vantage point (VP), active acoustic, and UAV surveys would address key knowledge gaps remaining within the field. Incorporation of active acoustic surveys would allow for the full coverage of fine-scale turbulent features (in the water column and at the surface), and the characterisation of auk prey species (fish) (Williamson et al., 2017). VP surveys would offer the ability to carry out species identification to a higher degree of accuracy. This would allow for examination into potentially contrasting inter-species relationships with turbulent features. By continuing to develop this it will provide robust, evidence-based, data necessary for effective decision making and planning across all stages of tidal energy developments (ORJIP, 2020). Investigating site-specific differences and data collection around operational turbines will improve understanding of potential impacts and their severity on key species.
5 Conclusion
The quantification of seabird spatial usage patterns, in relation to flow conditions and turbulent features, was made possible with the use of UAV imagery. This study further demonstrated the ability of UAVs as a survey platform within tidal streams and highlighted new insights into seabird behaviour in relation to flow conditions and usage of turbulent features.
Overall, auk species displayed a preference for areas where kolk-boils were present, yet a significant trend of finer-scale avoidance between individual birds and features. This could indicate that species are targeting the peripheries of kolk-boils as potential areas for increased prey capture, while avoiding the energetic costs of direct association. Auk species also showed a predominant trend of orientating across the flow in a range of current velocities and at differing tidal phases.
The methodology and results of the study highlight the continued need for development and standardisation of EIA techniques within the tidal energy sector. This includes increasing accuracy, by capturing the full extent of bio-physical interactions occurring, and streamlining methodologies to allow for more effective data comparisons throughout project lifespans. Moving forwards, data highlighting fine-scale faunal usage of tidal stream environments should be assessed in comparison to surface and below surface measurements of turbulence and prey, to further investigate these biophysical links.
Data Availability Statement
The raw data supporting the conclusions of this article will be made available by the authors, without undue reservation.
Ethics Statement
The animal study was reviewed and approved by University of the Highlands and Islands: Animal Welfare and Environment Committee.
Author Contributions
JS, BS, LK, JM, JW and BW contributed to the conception and design of the study. JS, JM, MY and BW contributed with methodology and software development. JS, SL and BW contributed to data curation and statistical analysis. BS, LK, JM, JW and BW contributed to funding acquisition. JS wrote the first draft of the manuscript. BS, LK, JM, JW and BW contributed to project supervision. All authors contributed to manuscript revision, read, and approved the submitted version.
Funding
This work was funded by the Bryden Centre project, supported by the European Union’s INTERREG VA Programme, and managed by the Special EU Programmes Body (SEUPB). The views and opinions expressed in this paper do not necessarily reflect those of the European Commission or the Special EU Programmes Body (SEUPB). Aspects of this research were also funded by a Royal Society Research Grant [RSG\R1\180430], the NERC VertIBase project [NE/N01765X/1], the UK Department for Business, Energy, and Industrial Strategy’s offshore energy Strategic Environmental Assessment programme and EPSRC Supergen ORE Hub [EP/S000747/1].
Conflict of Interest
The authors declare that the research was conducted in the absence of any commercial or financial relationships that could be construed as a potential conflict of interest.
Publisher’s Note
All claims expressed in this article are solely those of the authors and do not necessarily represent those of their affiliated organizations, or those of the publisher, the editors and the reviewers. Any product that may be evaluated in this article, or claim that may be made by its manufacturer, is not guaranteed or endorsed by the publisher.
Acknowledgments
We gratefully acknowledge the support of colleagues at Marine Scotland Science, the crew and scientists of the MRV Scotia 2018 cruise (particularly Chief Scientist Adrian Tait) and ERI interns: Gael Gelis and Martin Forestier. We gratefully acknowledge the constructive comments from reviewers. Finally, we also want to thank Ella Benninghaus for providing the auk illustrations used within the paper.
Supplementary Material
The Supplementary Material for this article can be found online at: https://www.frontiersin.org/articles/10.3389/fmars.2022.820722/full#supplementary-material
References
Abrahms B., Scales K. L., Hazen E. L., Bograd S. J., Schick R. S., Robinson P. W., et al. (2018). Mesoscale Activity Facilitates Energy Gain in a Top Predator. Proc. R. Soc B Biol. Sci. 285, 1–9. doi: 10.1098/rspb.2018.1101
Adcock T. A. A. (2015). On Tidal Stream Turbines Placed Off Headlands. J. Renew. Sustain. Energy 7, 1–9. doi: 10.1063/1.4936361
Adcock T. A. A., Draper S., Houlsby G. T., Borthwick A. G. L., Serhadlioğlu S. (2013). The Available Power From Tidal Stream Turbines in the Pentland Firth. Proc. R. Soc A Math. Phys. Eng. Sci. 469, 1–20. doi: 10.1098/rspa.2013.0072
Baddeley A., Rubak E., Turner R. (2015). Spatial Point Patterns. (Boca Raton, Florida: CRC Press). doi: 10.1201/b19708
Benjamins S., Dale A., Hastie G., Waggitt J. J., Lea M.-A., Scott B. E., et al. (2015). Confusion Reigns? A Review of Marine Megafauna Interactions With Tidal-Stream Environments. Oceanogr. Mar. Biol. Annu. Rev. 53, 1–54. doi: 10.1201/b18733-2
Binder B. J., Simpson M. J. (2015). Spectral Analysis of Pair-Correlation Bandwidth: Application to Cell Biology Images. R. Soc Open Sci. 2, 1–15. doi: 10.1098/rsos.140494
British Standards Institution (2015) PD 6900:2015 Environmental Impact Assessment for Offshore Renewable Energy Projects – Guide. Available at: https://shop.bsigroup.com/products/environmental-impact-assessment-for-offshore-renewable-energy-projects-guide.
Cairns D. K., Bredin K. A., Montevecchi W. A. (1987). Activity Budgets and Foraging Ranges of Braeding Common Murres. Auk 104, 218–224. doi: 10.1093/auk/104.2.218
Cantlay J. C., Bond A. L., Wells-Berlin A. M., Crawford R., Martin G. R., Rouxel Y., et al. (2020). Ineffectiveness of Light Emitting Diodes as Underwater Deterrents for Long-Tailed Ducks Clangula Hyemalis. Glob. Ecol. Conserv. 23, e01102. doi: 10.1016/j.gecco.2020.e01102
Chabot D., Francis C. M. (2016). Computer-Automated Bird Detection and Counts in High-Resolution Aerial Images: A Review. J. F. Ornithol. 87, 343–359. doi: 10.1111/jofo.12171
Civil Aviation Authority (2019). UK CAA Drone Code. 1–2. Available at: https://dronesafe.uk/wp-content/uploads/2019/11/Drone-Code_October2019.pdf.
Cole E.-L., Waggitt J. J., Hedenstrom A., Piano M., Holton M. D., Börger L., et al. (2019). The Ornithodolite as a Tool to Quantify Animal Space Use and Habitat Selection: A Case Study With Birds Diving in Tidal Waters. Integr. Zool. 14, 4–16. doi: 10.1111/1749-4877.12327
DJI (2020) DJI Phantom 4 Pro – Specs, Tutorials & Guides – DJI. Available at: https://www.dji.com/uk/phantom-4-pro/info#specs (Accessed July 17, 2020).
Edney A. J., Wood M. J. (2020). Applications of Digital Imaging and Analysis in Seabird Monitoring and Research. Ibis (Lond. 1859). 163, 317–337. doi: 10.1111/ibi.12871
Embling C. B., Illian J., Armstrong E., van der Kooij J., Sharples J., Camphuysen K. C. J., et al. (2012). Investigating Fine-Scale Spatio-Temporal Predator-Prey Patterns in Dynamic Marine Ecosystems: A Functional Data Analysis Approach. J. Appl. Ecol. 49, 481–492. doi: 10.1111/j.1365-2664.2012.02114.x
European Union (1992). Council Directive 92/43/EEC of 21 May 1992 on the Conservation of Natural Habitats and of Wild Fauna and Flora. Off. J. Eur. Union 206, 7–50.
Filipot J. F., Prevosto M., Maisondieu C., Le Boulluec M., Thomson J (2015). Wave and Turbulence Measurements at a Tidal Energy Site. 2015 IEEE/OES 11th Curr. Waves Turbul. Meas. CWTM 2015, 1–9. doi: 10.1109/CWTM.2015.7098128
Fox C. J., Benjamins S., Masden E. A., Miller R. (2018). Challenges and Opportunities in Monitoring the Impacts of Tidal-Stream Energy Devices on Marine Vertebrates. Renew. Sustain. Energy Rev. 81, 1926–1938. doi: 10.1016/j.rser.2017.06.004
Fraenkel P. L. (2006). Tidal Current Energy Technologies. Ibis (Lond. 1859). 148, 145–151. doi: 10.1111/j.1474-919X.2006.00518.x
Furness R. W., Wade H. M., Robbins A. M. C., Masden E. A. (2012). Assessing the Sensitivity of Seabird Populations to Adverse Effects From Tidal Stream Turbines and Wave Energy Devices. ICES J. Mar. Sci 69, 1466–1479. doi: 10.1093/icesjms/fss131
Goddijn-Murphy L., Woolf D. K., Easton M. C. (2013). Current Patterns in the Inner Sound (Pentland Firth) From Underway ADCP Data. J. Atmos. Ocean. Technol. 30, 96–111. doi: 10.1175/JTECH-D-11-00223.1
Grecian W. J., Inger R., Attrill M. J., Bearhop S., Godley B. J., Witt M. J., et al. (2010). Potential Impacts of Wave-Powered Marine Renewable Energy Installations on Marine Birds. Ibis (Lond. 1859). 152, 683–697. doi: 10.1111/j.1474-919X.2010.01048.x
Haney C. J., Stone A. (1988). Seabird Foraging Tactics and Water Clarity: Are Plunge Divers Really in the Clear? Mar. Ecol. Prog. Ser. 49, 1–9. doi: 10.3354/meps049001
Haverson D., Bacon J., Smith H. C. M., Venugopal V., Xiao Q. (2018). Modelling the Hydrodynamic and Morphological Impacts of a Tidal Stream Development in Ramsey Sound. Renew. Energy 126, 876–887. doi: 10.1016/j.renene.2018.03.084
Hodgson J. C., Koh L. P. (2016). Best Practice for Minimising Unmanned Aerial Vehicle Disturbance to Wildlife in Biological Field Research. Curr. Biol. 26, R404–R405. doi: 10.1016/j.cub.2016.04.001
Illian J., Penttinen A., Stoyan H., Stoyan D. (2008). Statistical Analysis and Modelling of Spatial Point Patterns Vol. 70 (Chichester, England: John Wiley & Sons, Ltd). Available at: https://books.google.co.uk/books. hl=en&lr=&id=_U6BER2stYsC&oi=fnd&pg=PR5&dq=Statistical+Analysis+and+Modelling+of+Spatial+Point+Patterns&ots=rXRo2RTTcW&sig=XgjVM630WsaY84mOX5YFdnJqaA4&redir_esc=y#v=onepage&q=Statistical Analysis and Modelling of Spatial P.
Isaksson N., Masden E. A., Williamson B. J., Costagliola-Ray M. M., Slingsby J., Houghton J. D. R., et al. (2020). Assessing the Effects of Tidal Stream Marine Renewable Energy on Seabirds: A Conceptual Framework. Mar. Pollut. Bull. 157, 1–13. doi: 10.1016/j.marpolbul.2020.111314
Johnson J. B., Pride D. J. (2010) River, Tidal, and Ocean Current Hydrokinetic Energy Technologies: Status and Future Opportunities in Alaska Prepared for the Alaska Energy Authority By the Alaska Center for Energy and Power. Available at: https://acep.uaf.edu/programs/alaska-hydrokinetic-energy-research-center/publications.aspx.
Johnston D. T., Furness R. W., Robbins A. M. C., Tyler G., Taggart M. A., Masden E. A. (2018). Black Guillemot Ecology in Relation to Tidal Stream Energy Generation: An Evaluation of Current Knowledge and Information Gaps. Mar. Environ. Res. 134, 121–129. doi: 10.1016/j.marenvres.2018.01.007
Kregting L., Elsaesser B., Kennedy R., Smyth D., O’Carroll J., Savidge G. (2016). Do Changes in Current Flow as a Result of Arrays of Tidal Turbines Have an Effect on Benthic Communities? PloS One 11, e0161279. doi: 10.1371/journal.pone.0161279
Lang P., Desombre J., Ata R., Goeury C., Michel Hervouet J. (2014) TELEMAC-2d Software User Manual (EDF-R&D). Available at: http://www.nrc-cnrc.gc.ca/eng/ibp/chc/software/kenue/blue-kenue.html (Accessed October 26, 2021).
Langston R. H. W. (2010) Offshore Wind Farms and Birds: Round 3 Zones, Extensions to Round 1 & Round 2 Sites & Scottish Territorial Waters. Available at: http://mhk.pnl.gov/sites/default/files/publications/Langston_2010.pdf.
Liao J. C. (2007). A Review of Fish Swimming Mechanics and Behaviour in Altered Flows. Philos. Trans. R. Soc B Biol. Sci. 362, 1973–1993. doi: 10.1098/rstb.2007.2082
Lieber L., Langrock R., Nimmo-Smith A. (2021). A Bird’s Eye View on Turbulence: Seabird Foraging Associations With Evolving Surface Flow Features. Proc. R. Soc 288, 1–10. doi: 10.1098/rspb.2021.0592
Lieber L., Nimmo-Smith W. A. M., Waggitt J. J., Kregting L. (2019). Localised Anthropogenic Wake Generates a Predictable Foraging Hotspot for Top Predators. Commun. Biol. 2, 123. doi: 10.1038/s42003-019-0364-z
Martin G. R. (2017). What Drives Bird Vision? Bill Control and Predator Detection Overshadow Flight. Front. Neurosci. 11. doi: 10.3389/fnins.2017.00619
Martin G. R., Crawford R. (2015). Reducing Bycatch in Gillnets: A Sensory Ecology Perspective. Glob. Ecol. Conserv. 3, 28–50. doi: 10.1016/j.gecco.2014.11.004
Martin G. R., Wanless S. (2015). The Visual Fields of Common Guillemots Uria Aalge and Atlantic Puffins Fratercula Arctica: Foraging, Vigilance and Collision Vulnerability. Ibis (Lond. 1859). 157, 798–807. doi: 10.1111/ibi.12297
Mattos P. H., Dalla Rosa L., Fruet P. F. (2007). Activity Budgets and Distribution of Bottlenose Dolphins (Tursiops Truncatus) in the Patos Lagoon Estuary, Southern Brazil. Lat. Am. J. Aquat. Mamm. 6, 161–169. doi: 10.5597/lajam00121
McEvoy J. F., Hall G. P., McDonald P. G. (2016). Evaluation of Unmanned Aerial Vehicle Shape, Flight Path and Camera Type for Waterfowl Surveys: Disturbance Effects and Species Recognition. PeerJ 2016, e1831. doi: 10.7717/peerj.1831
McIlvenny J., Williamson B. J., MacDowall C., Gleizon P., O’Hara Murray R. (2021). Modelling Hydrodynamics of Fast Tidal Stream Around a Promontory Headland. Estuar. Coast. Shelf Sci. 259, 107474. doi: 10.1016/j.ecss.2021.107474
Mitchell P. I., Newton S. F., Ratcliffe N., Dunn T. E. (2004) Seabird Populations of Britain and Ireland: Results of the Seabird 2000 Censu-2002) (Poyser, London: T and A.D). Available at: http://www.jncc.defra.gov.uk/page-1530.TofindoutmoreaboutJNCCvisithttp://www.jncc.defra.gov.uk/page-1729 (Accessed May 7, 2019).
Neill S. P., Vögler A., Goward-Brown A. J., Baston S., Lewis M. J., Gillibrand P. A., et al. (2017). The Wave and Tidal Resource of Scotland. Renew. Energy 114, 3–17. doi: 10.1016/j.renene.2017.03.027
Nol E., Gaskin D. E. (1987). Distribution and Movements of Black Guillemots (Cepphus Grylle) in Coastal Waters of the Southwestern Bay of Fundy, Canada. Can. J. Zool. 65, 2682–2689. doi: 10.1139/z87-407
ORJIP (2020) Wave and Tidal Stream Critical Evidence Needs (ORJIP Ocean Energy). Available at: http://www.orjip.org.uk/sites/default/files/ORJIPOceanEnergy critical evidence needs document_V2.pdf (Accessed January 29, 2021).
Palomino-González A., Kovacs K. M., Lydersen C., Ims R. A., Lowther A. D. (2021). Drones and Marine Mammals in Svalbard, Norway. Mar. Mammal Sci 37, 1212–1229. doi: 10.1111/mms.12802
R Core Team (2020) R: The R Project for Statistical Computing. Available at: https://www.r-project.org/ (Accessed May 11, 2021).
Roche R. C., Walker-Springett K., Robins P. E., Jones J., Veneruso G., Whitton T. A., et al. (2016). Research Priorities for Assessing Potential Impacts of Emerging Marine Renewable Energy Technologies: Insights From Developments in Wales (Uk). Renew. Energy 99, 1327–1341. doi: 10.1016/j.renene.2016.08.035
Scott B. E., Langton R., Philpott E., Waggitt J. J. (2014). “Ch 7: Seabirds and Marine Renewables: Are We Asking the Right Questions?” in Marine Renewable Energy Technology and Environmental Interactions )Dordrecht, Netherlands: Springer Science and Business Media), 81–92. doi: 10.1007/978-94-017-8002-5
Scrucca L., Fop M., Murphy T. B., Raftery A. E. (2016). Mclust 5: Clustering, Classification and Density Estimation Using Gaussian Finite Mixture Models. R J. 8, 289–317. doi: 10.32614/rj-2016-021
SIMEC (2018) MeyGen | Tidal Projects | SIMEC Atlantis Energy. Available at: https://simecatlantis.com/projects/meygen/ (Accessed July 17, 2020).
Slingsby J., Scott B. E., Kregting L., Mcilvenny J., Wilson J., Couto A., et al. (2021a). Surface Characterisation of Kolk-Boils Within Tidal Stream Environments Using UAV Imagery. J. Mar. Sci. Eng. 9, 484. doi: 10.3390/jmse9050484
Slingsby J., Scott B., Kregting L., Mcilvenny J., Wilson J., Yanez M., et al. (2021b). The Bigger Picture: Developing a Graphical User Interface to Process UAV Imagery of Tidal Stream Environments. In EWTEC Proceedings. International Marine Energy Journal.
Szmyt J. (2014). Spatial Statistics in Ecological Analysis: From Indices to Functions. Silva Fenn. 48, 1–31. doi: 10.14214/sf.1008
Thorpe S. A., Green J. A. M., Simpson J. H., Osborn T. R. (2008). And Nimmo Smith, WBoils and Turbulence in a Weakly Stratified Shallow Tidal Sea. A. M. J. Phys. Oceanogr. 38, 1711–1730. doi: 10.1175/2008JPO3931.1
Vyshnavi P., Venkatesan N., Samad A., Avital E. J. (2021). Tidal Current Energy for Indian Coastal Lines – A State Art of Review. J. Phys. Conf. Ser. 1716. doi: 10.1088/1742-6596/1716/1/012008
Wade H. M. (2015). Investigating the Potential Effects of Marine Renewable Energy Developments on Seabirds. BOU Proceedings - Marine Renewables and Birds. Available at: https://pure.uhi.ac.uk/portal/files/3084588/Helen_Wade_PhD_thesis.pdf (Accessed January 24, 2019).
Wade H. M., Masden E. A., Jackson A. C., Furness R. W. (2013). Which Seabird Species Use High-Velocity Current Flow Environments ? Investigating the Potential Effects of Tidal-Stream Renewable Energy Developments. 1–5. doi: 10.13140/2.1.2530.6885
Waggitt J. J., Cazenave P. W., Torres R., Williamson B. J., Scott B. E. (2016a). Predictable Hydrodynamic Conditions Explain Temporal Variations in the Density of Benthic Foraging Seabirds in a Tidal Stream Environment. ICES J. Mar. Sci. 73, 2677–2686. doi: 10.1093/icesjms/fsw100
Waggitt J. J., Cazenave P. W., Torres R., Williamson B. J., Scott B. E. (2016b). Quantifying Pursuit-Diving Seabirds’ Associations With Fine-Scale Physical Features in Tidal Stream Environments. J. Appl. Ecol. 53, 1653–1666. doi: 10.1111/1365-2664.12646
Waggitt J. J., Robbins A. M. C., Wade H. M., Masden E. A., Furness R. W., Jackson A. C., et al. (2017). Comparative Studies Reveal Variability in the Use of Tidal Stream Environments by Seabirds. Mar. Policy 81, 143–152. doi: 10.1016/j.marpol.2017.03.023
Wanless S., Morris A., Harris M. P. (1988). Diving Behaviour of Guillemot Uria Aalge, Puffin Fratercula Arctica and Razorbill Alca Torda as Shown by Radio-Telemetry. J. Zool. 216, 73–81. doi: 10.1111/j.1469-7998.1988.tb02416.x
Whitton T. A., Jackson S. E., Hiddink J. G., Scoulding B., Bowers D., Powell B., et al. (2020). Vertical Migrations of Fish Schools Determine Overlap With a Mobile Tidal Stream Marine Renewable Energy Device. J. Appl. Ecol. 57, 729–741. doi: 10.1111/1365-2664.13582
Williamson B. J., Blondel P., Williamson L. D., Scott B. E. (2021). Application of a Multibeam Echosounder to Document Changes in Animal Movement and Behaviour Around a Tidal Turbine Structure. ICES J. Mar. Sci 78, 1253–1266. doi: 10.1093/icesjms/fsab017
Williamson B. J., Fraser S., Blondel P., Bell P. S., Waggitt J. J., Scott B. E. (2017). Multisensor Acoustic Tracking of Fish and Seabird Behavior Around Tidal Turbine Structures in Scotland. IEEE J. Ocean. Eng. 42, 948–965. doi: 10.1109/JOE.2016.2637179
Keywords: turbulence, drones (UAV), alcidae, remote sensing, tidal energy converter
Citation: Slingsby J, Scott BE, Kregting L, McIlvenny J, Wilson J, Yanez M, Langlois S and Williamson BJ (2022) Using Unmanned Aerial Vehicle (UAV) Imagery to Characterise Pursuit-Diving Seabird Association With Tidal Stream Hydrodynamic Habitat Features. Front. Mar. Sci. 9:820722. doi: 10.3389/fmars.2022.820722
Received: 23 November 2021; Accepted: 02 March 2022;
Published: 29 March 2022.
Edited by:
Daniel James Hasselman, Fundy Ocean Research Centre for Energy (FORCE), CanadaReviewed by:
Simon Waldman, University of Hull, United KingdomChandra Paulina Salgado Kent, Edith Cowan University, Australia
Copyright © 2022 Slingsby, Scott, Kregting, McIlvenny, Wilson, Yanez, Langlois and Williamson. This is an open-access article distributed under the terms of the Creative Commons Attribution License (CC BY). The use, distribution or reproduction in other forums is permitted, provided the original author(s) and the copyright owner(s) are credited and that the original publication in this journal is cited, in accordance with accepted academic practice. No use, distribution or reproduction is permitted which does not comply with these terms.
*Correspondence: James Slingsby, amFtZXMuc2xpbmdzYnlAdWhpLmFjLnVr