 Gema Hernan1*
 Alexandra K. Dubel1
 Jennifer E. Caselle2
 David J. Kushner3
 Robert J. Miller2
 D. C. Reed2
 Joshua L. Sprague3
 Andrew Rassweiler1
- 1Department of Biological Science, Florida State University, Tallahassee, FL, United States
- 2Marine Science Institute, University of California, Santa Barbara, Santa Barbara, CA, United States
- 3Channel Islands National Park, Ventura, CA, United States
Monitoring is a crucial tool for measuring the progress and success of environmental policies and management programs. While many studies have evaluated the effectiveness of biodiversity sampling methods, few have compared their efficiency, which is crucial given the funding constraints present in all conservation efforts. In this study we demonstrate how existing analytical tools can be applied to (i) assess the relationship between sampling effort and resulting confidence in biodiversity metrics, and (ii) compare the efficiency of different methods for monitoring biodiversity. We tested this methodology on data from marine fish surveys, including: roving surveys within permanent areas, randomly placed belt transects, and randomly placed transects conducted by citizen scientists using a reduced species list. We constructed efficiency curves describing how increasing effort spent on each method reduced uncertainty in biodiversity estimates and the associated ability to detect change in diversity. All programs produced comparable measurements of species diversity for all metrics despite substantial differences in the species being surveyed by each method. The uncertainty of diversity estimations fell faster and reached a lower level for the roving diver method. Strikingly, the transect method conducted by citizen scientists performed almost identically to the more taxonomically resolved transect method conducted by professional scientists, suggesting that sampling strategies that recorded only a subset of species could still be effective, as long as the excluded species were chosen strategically. The methodology described here can guide decisions about how to measure biodiversity and optimize the resources available for monitoring, ultimately improving management outcomes.
Introduction
Monitoring is a crucial tool for assessing the state of an ecosystem and measuring the success of environmental policies and management (Lovett et al., 2007). One key variable for assessing ecosystem health is biodiversity, and efforts are underway to develop Essential Biodiversity Variables (EBV) that standardize biodiversity measurements across the globe (Proença et al., 2017). Many monitoring programs report indices of species diversity as a primary indicator because these indices are simple to interpret and because changes in species abundance and distribution have critical consequences for ecosystem functions (Tilman et al., 2012). While a range of species diversity metrics are widely used, each metric exhibits a different sensitivity to biodiversity change. The most commonly used metrics (e.g., richness, Shannon diversity, Simpson’s diversity) have been unified within a mathematical framework based on Hill numbers (Jost, 2006) that differ based on the relative importance of rare species. Low-order biodiversity metrics (e.g., richness, 0D) place a high importance on the presence of rare species, while higher-order biodiversity metrics are more sensitive to the relative abundance of common species. The sampling methodology selected for a monitoring program should yield biodiversity metrics that are relevant to conservation and management targets, but if estimates have high uncertainty (i.e., low confidence), changes in biodiversity in time or space will be poorly detected and thus effectiveness of management actions will be difficult to evaluate.
Besides compatibility with the chosen biodiversity metrics, sampling efficiency, defined as effectiveness for a given investment of effort (or cost), is one of the key attributes of a monitoring program. New monitoring methods have been developed to increase efficiency, reduce costs, or increase sampling comprehensiveness in space and time, all crucial attributes of EBV (Proença et al., 2017). For example, satellite imagery and environmental DNA (eDNA) can contribute to monitoring programs at various temporal and spatial scales (Gasc et al., 2013; Luque et al., 2018; Ruppert et al., 2019). Similarly, soundscape recordings of terrestrial vocalizing organisms such as birds can be sensitive enough to produce biodiversity estimates (Celis-Murillo et al., 2009; Farina et al., 2011). In many cases, these new methods sacrifice taxonomic resolution for speed, cost, or spatial extent. This could be an acceptable tradeoff for answering questions relying on higher-order diversity metrics, but less appropriate for answering questions regarding lower-order metrics, which are more sensitive to the presence of rare species. Therefore, a range of biodiversity metrics and sampling strategies may be appropriate depending on the questions being asked.
To address cost issues and fill spatial gaps in existing monitoring, biodiversity sampling has increasingly been performed by both professionals and amateur observers through citizen science (CS) programs. CS programs can result in better efficiency due to lower costs (Schmeller et al., 2008; Gardiner et al., 2012; Pocock et al., 2018), as well as greater spatial and temporal coverage (Chandler et al., 2017) as long as the sampling methodologies are well designed for public participation. CS programs can provide high-quality data, especially when participants are trained and professionals review the collected data (Schmeller et al., 2008). However, citizen scientists with limited taxonomic expertise can miss rare or cryptic species. Even the most successful citizen science programs such as the Audubon Christmas bird program have known limitations in their capacity to survey hard to identify species (Butcher et al., 2010). Therefore, CS is often focused only on common species that are easy to observe and may have limited ability to detect rare species and changes due to climate-induced ranges shifts, invasive species, or other anthropogenic impacts. Furthermore, the varied experience of amateur observers could result in lower precision. Despite the importance of efficiency for biodiversity monitoring programs, few examples exist in the literature evaluating this attribute of CS programs (Goldstein et al., 2014).
Uncertainty in the precision of biodiversity estimates decreases with increasing sampling effort. However, the shape of this relationship has rarely been the focus of studies evaluating methods, even though it is critical for choosing methods and sampling effort. The degree of uncertainty, measured here as the width of the confidence interval (CI), relates directly to the ability to detect changes in biodiversity over time or space, and the necessary investment in sampling effort to detect a change or trend with a given degree of confidence. Previous studies have evaluated the performance of different sampling methods by comparing biodiversity estimates (e.g., mean number of taxa) among methods (Buffington and Redak, 1998; Baker et al., 2016) or examining how estimates vary with sampling effort (King and Porter, 2005; Azevedo et al., 2014; Madalozzo et al., 2017). Such studies typically aim to maximize estimated biodiversity while minimizing sampling effort, and rarely consider how the uncertainty of estimates differs between sampling methods or as a function of effort (Carlson and Schmiegelow, 2002; Reynolds et al., 2011).
Biodiversity monitoring has a long record in terrestrial ecosystems; however, marine monitoring has a shorter history (National Research Council [NRC], 2001), and correspondingly fewer assessments of sampling strategies have been performed. Yet underwater data collection can be exceptionally expensive, so a better understanding of the relationship between cost or effort and performance of sampling methods in this context is essential. Previous studies have analyzed the performance of different underwater sampling methods to estimate fish biodiversity (e.g., Schmitt et al., 2002; Colvocoresses and Acosta, 2007; Minte-Vera et al., 2008). However, fewer works have assessed the efficiency of fish sampling methodologies and their ability to detect change (Langlois et al., 2010; Bosch et al., 2017) and none evaluated precision of biodiversity estimates or included CS programs. Most previous studies also used one-time sampling campaigns, instead of long-term monitoring data, which can reveal the performance of monitoring strategies under a wider range of ecological conditions.
In this paper, we applied a resampling approach with existing rarefaction methods to evaluate the efficiency of monitoring programs. Our aim is to assess how useful this methodology can be in real-world applications. To this end, we used data from three different sampling methods for monitoring fish communities on rocky reefs and assess how effective sampling was at describing biodiversity. We address two key questions when considering marginal costs related to sampling strategies: (1) for a given sampling method, how much effort must be invested to reach a desired uncertainty (CI/mean) and ability to detect change?, and (2) when considering alternative sampling methods, which more efficiently yields information about biodiversity? We focus on commonly used diversity metrics, but the same methodology can be extrapolated to monitoring programs with different objectives. Our approach can help in the sampling design of new programs or refine protocols in existing programs.
Materials and Methods
Ecological Data
To demonstrate how useful the methodology can be in a real-world context, we analyzed data collected by three monitoring programs with different goals that perform annual underwater visual fish surveys in both rocky reefs and kelp forests during summer and fall at the northern Santa Barbara Channel Islands of San Miguel, Santa Rosa, Santa Cruz, and Anacapa (Supplementary Monitoring Data 1, Figure 1): the Channel Islands National Park’s Kelp Forest Monitoring Program (KFMP), the Partnership for Interdisciplinary Studies of Coastal Oceans (PISCO), and the CS program Reef Check California (RC).

Figure 1. Sites sampled in the Channel Islands National Park, California, United States.
KFMP conducts roving diver counts in a 2,000 m2 permanently marked area at sites between 6 and 16 m depth. Divers perform a timed search throughout the entire water column along one side of a 100 m long fixed transect (oriented parallel to shore). For about 15 min divers swim in a zigzag pattern counting all non-cryptic fish encountered within 10 m of the transect line. Then, they swim 15 min following a similar pattern on the other side of the transect. At each sampling event (i.e., day of sampling at one site; 522 sampling events in 27 sites between 2000 and 2017), divers perform three to eight of these roving diver counts (Kushner et al., 2013).
The PISCO program conducts fish surveys using 30 m × 2 m belt-transects sampled by divers swimming at a constant speed. Transects are randomly placed within each site, run parallel to the shoreline, and are stratified by depth (5–20 m). Divers count all non-cryptic fish within 2 m of the substrate, the water column and in the kelp canopy and during each sampling event divers performed 24 transects at each site (referred as PISCO24), which are spatially subdivided into subsites. Because the spatial distribution of replicates is an important aspect of a sampling strategy, we also analyzed this data by treating all subsites with eight transects as a site (referred as PISCO8; Supplementary Figure 1). Between 2000 and 2016 PISCO8 represents 585 sampling events and PISCO24, represents 544 sampling events across 73 sites.
RC trains volunteer divers to perform randomly placed belt-transect surveys parallel to shoreline up to 18 m deep with same dimensions as PISCO. In these, divers swim approximately 35 cm from the substrate counting fish from a fixed list of 33 species and perform 18 transects per sampling event (117 sampling events in 17 sites between 2006 and 2017).
We calculated sampling effort for each replicate in terms of diver-hours, accounting only for the time a dive team spent sampling. KFMP performed each timed roving count in 30 diver-min, while RC took 12 diver-min per transect. PISCO8 and PISCO24 spent 16 diver-min per transect. Our analyses focused on the marginal cost (in time units) of each additional sample, we did not account for other time spent diving, preparing, traveling or any other costs of the programs.
Comparisons between the efficiency of each program will reflect differences in the field methods used by each program (professional vs. citizen scientist, roving surveys vs. transects), but also other differences in sampling strategies, including differences in the fraction of the water column searched, the placement of transects (fixed vs. haphazard) and area sampled. Further details on monitoring data and environmental context are provided in Supplementary Monitoring Data 1.
Calculating Biodiversity Estimates, Uncertainty, and Effort in Simulated Communities and Monitoring Data
To compare diversity across sampling methods we calculated Hill number-based diversity metrics using rarefaction (Gotelli and Colwell, 2001). We calculated diversity for each sampling event using all subsamples (3–8 roving counts for KFMP, 24 Transects for PISCO24, 8 transects for PISCO8 or18 transects for RC) and produced individual-based rarefaction curves extrapolated to 100 individuals (i.e., individual fish; Figure 2A). Biodiversity estimates and associated uncertainties (CI/mean) were calculated for the first three Hill numbers (Chao et al., 2014) with the iNext package (Hsieh et al., 2016) in R. We analyzed the differences in mean values of 0D, 1D, 2D among the different sampling methods with Kruskal-Wallis tests followed by post-hoc Dunn tests since residuals were homoscedastic, but non-normal.
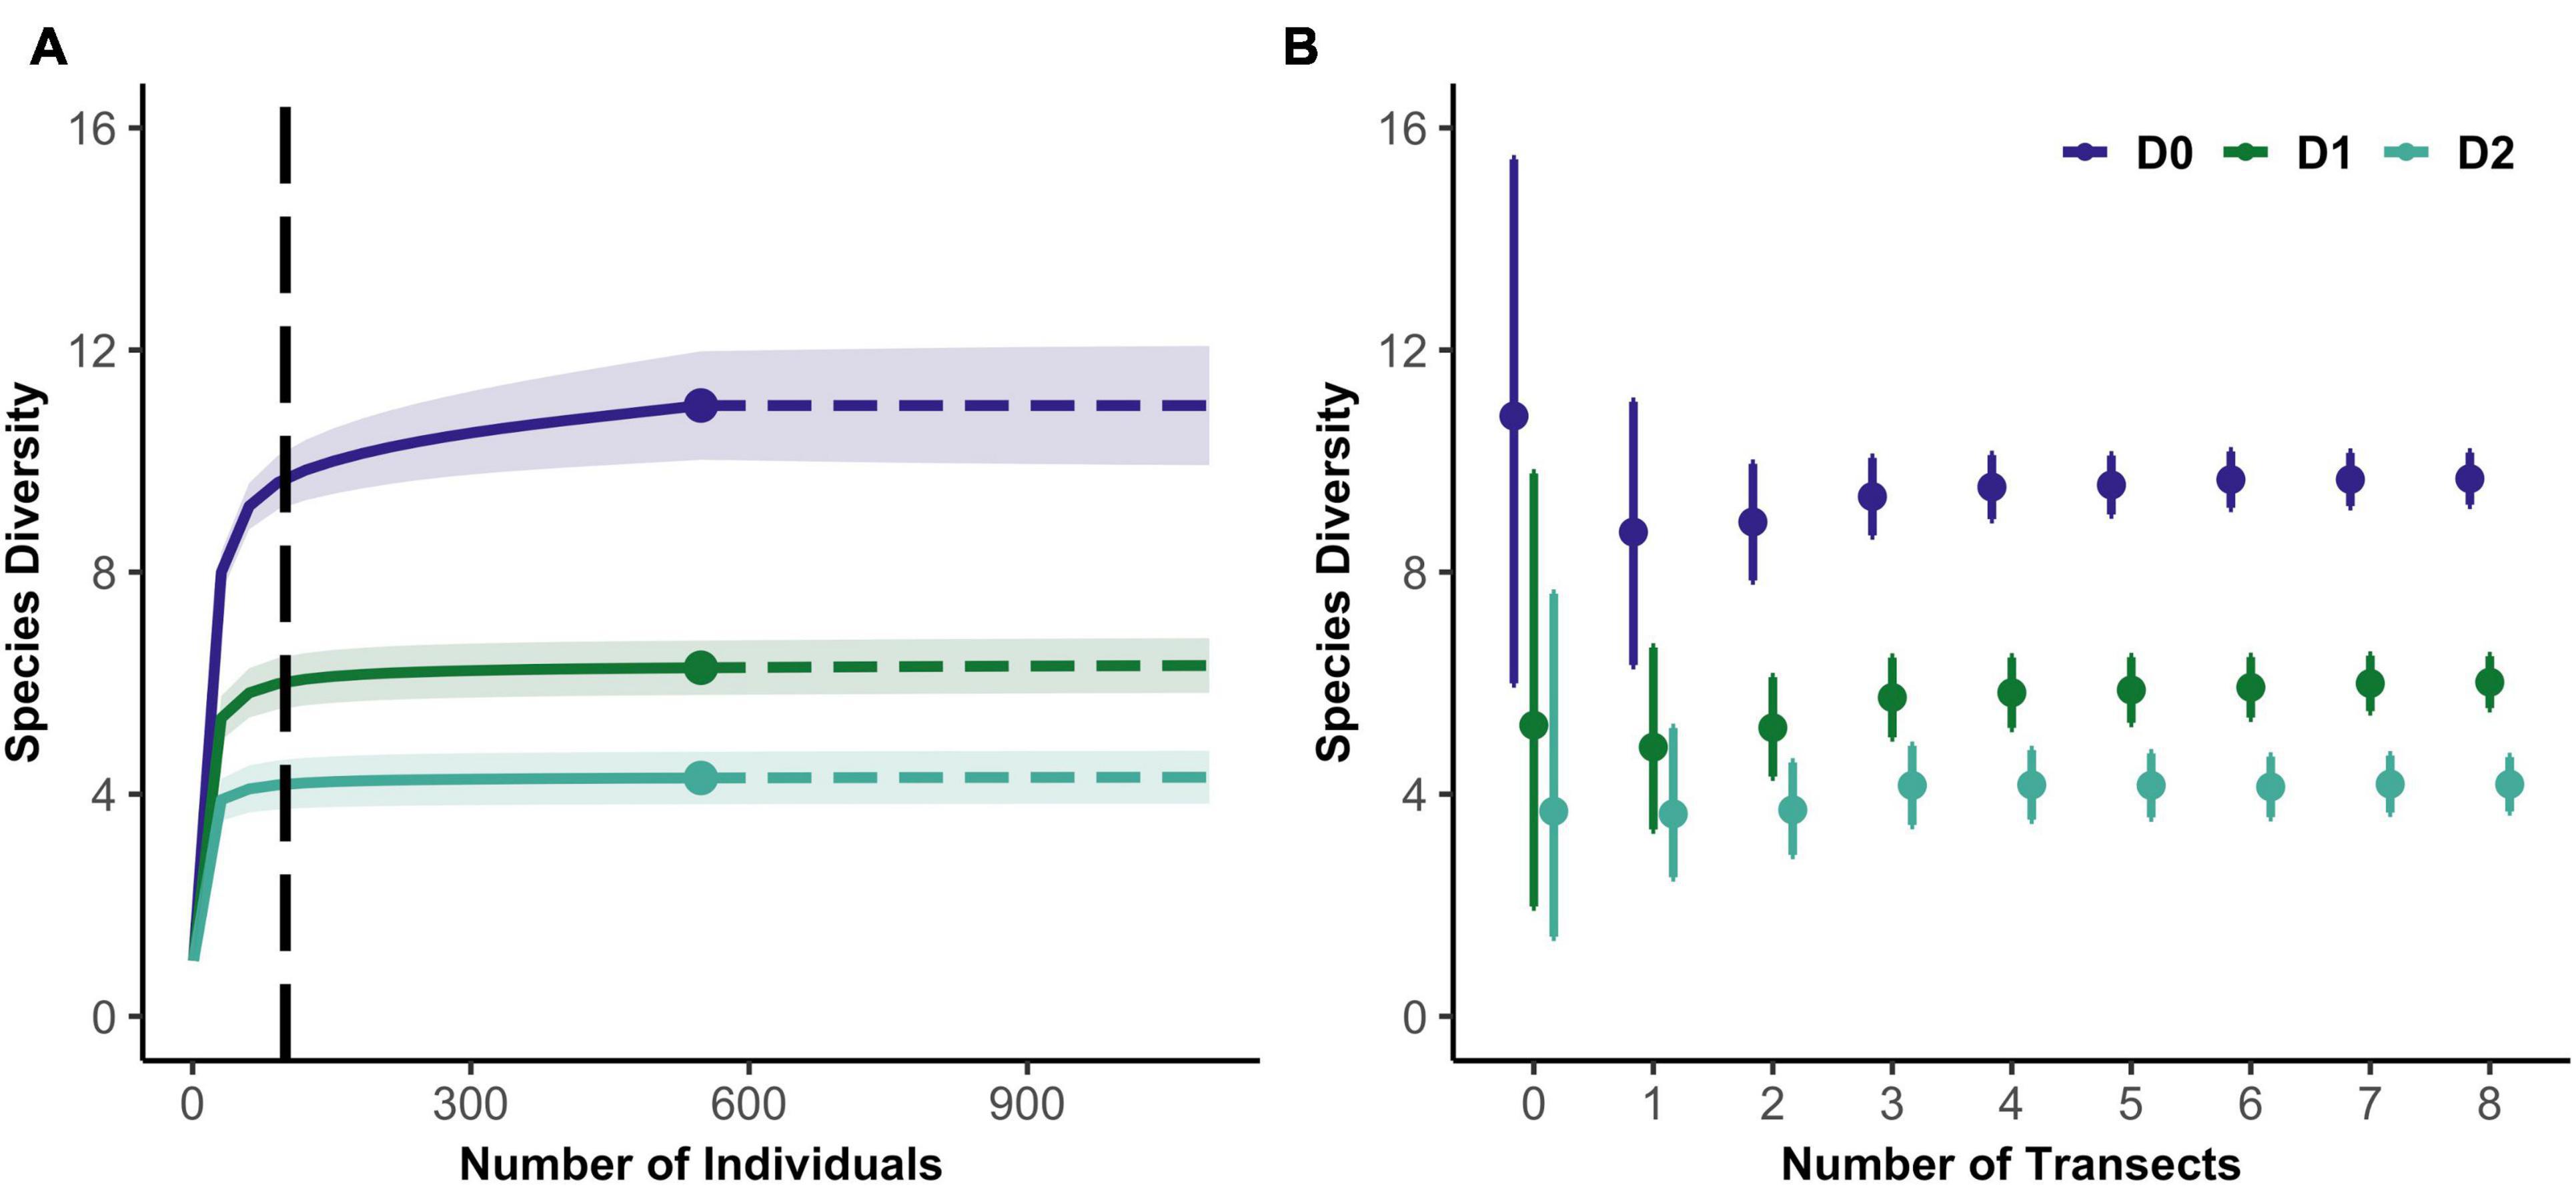
Figure 2. (A) Example of an individual-based rarefaction curve for the first three Hill numbers from a PISCO sample. Vertical dashed line indicates the extrapolation value to 100 individuals. (B) Example of 200 random resamples of data from the same sampling event. 95% confidence intervals shown.
We then subsampled the data, calculating biodiversity estimates and associated confidence intervals as a function of sampling effort. To obtain these relationships, we calculated diversity metrics and uncertainty expected in each sampling event if fewer replicates had been sampled. For example, for sites with 12 transects, we created 200 replicate datasets of one transect each, randomly sampled (without replacement) from the 12, then 200 datasets of two transects and so on. For each replicate dataset, we produced rarefaction curves for 0D, 1D, 2D. We averaged over all resampled datasets with a given number of replicates (diver counts or transects) to yield expected diversity metrics and confidence intervals for that level of effort (Figure 2B). As the sampling effort at a site increases, diversity estimates converge toward values that characterize that site, and confidence intervals shrink.
In cases where few individual fish were present in a sampling event, estimates of biodiversity at that site were inferred from what is known about diversity in the region. We derived regional estimates from the distribution of biodiversity estimates across all sites surveyed by each sampling method (or all simulated sites; Baseline estimates S2). The baseline estimates were substituted for estimates based on in situ data when fewer than 50 individuals occurred in a sampling event, because the rarefaction approach cannot reliably extrapolate diversity estimates if less than half of the target number of individuals have been observed (Supplementary Table 1; Chao et al., 2014). We chose to rarify to 100 individuals to minimize the number of sampling events for which we had to substitute regional baseline estimates (Supplementary Figure 2).
Comparing Uncertainty and Ability to Detect Changes in Monitoring Data
Fish density influences the amount of biodiversity information that each sample provides since observers encounter fish more rapidly at higher density sites. It has been previously shown that fish density estimates are not comparable among the monitoring programs (Rassweiler et al., 2020), therefore we compared performance of each program at sites where fish abundance was typical for the program (i.e., within the 40th–60th percentile). In addition, the list of species counted in each sampling method differed; KFM and PISCO with an open list observed 72 species while RC counted a closed list of 33 species. This contrast offers an opportunity to test whether sacrifices in taxonomic completeness might result in reduced or less reliable biodiversity estimates (for any of the three metrics calculated). Hence, the following analyses were performed with both the full species list and a shared dataset of 31 overlapping taxa.
We compared how the uncertainty of biodiversity metrics differed among the sampling methods and how it changed as a function of sampling effort. We calculated uncertainty as the scaled CI of the different biodiversity metrics, normalizing this value with the mean (CI/mean). The number of transects and roving counts were converted into number of diver hours for monitoring data, while replicates were used as a measure of effort for simulated communities.
Finally, to compare the sampling effort needed to reach a certain ability to detect change across the different methodologies, we calculated the ability of each sampling strategy to detect a change, and how that changed as effort increased (Milner-Gulland and Shea, 2017). For these calculations, we included all sampling events and determined the percentage of those events that yielded a CI small enough that a 25 or 50% change in the metric would fall outside that interval. Because CI’s were approximately symmetrical, an interval width of 50% of the mean (i.e., 25% over and under the mean) indicated that a 25% change could be reliably detected at the given confidence level (alpha = 0.05). Similarly, an interval width equal to the mean indicated that a 50% change could be detected.
Results
We found estimates of biodiversity were comparable across the different monitoring strategies, despite differences in species lists (Figure 3A). In fact, the lower-order biodiversity estimates (0D), which are more sensitive to the presence of rare species, had very similar distributions in each dataset, with an average about 10 species (in a sample of 100 fish) for most programs (PISCO24 was slightly higher). Higher-order diversity estimates from PISCO24 and RC were similar and slightly higher than KFMP and PISCO8 (Table 1 and Figure 3A). This result is possible because fish species that are counted by PISCO and KFMP but excluded from RC’s species list are rarely observed in practice. In fact, it was rare for the more taxonomically resolved programs to observe more than three species not counted by RC in a single event (<20% of events, Supplementary Figure 3). When considering only these 31 shared species, estimates of biodiversity were also similar (Supplementary Figure 4). For 0D, PISCO8 yielded slightly lower diversity estimates, and for higher diversity orders KFMP and PISCO8 had slightly lower values (Table 1 and Supplementary Figure 4).
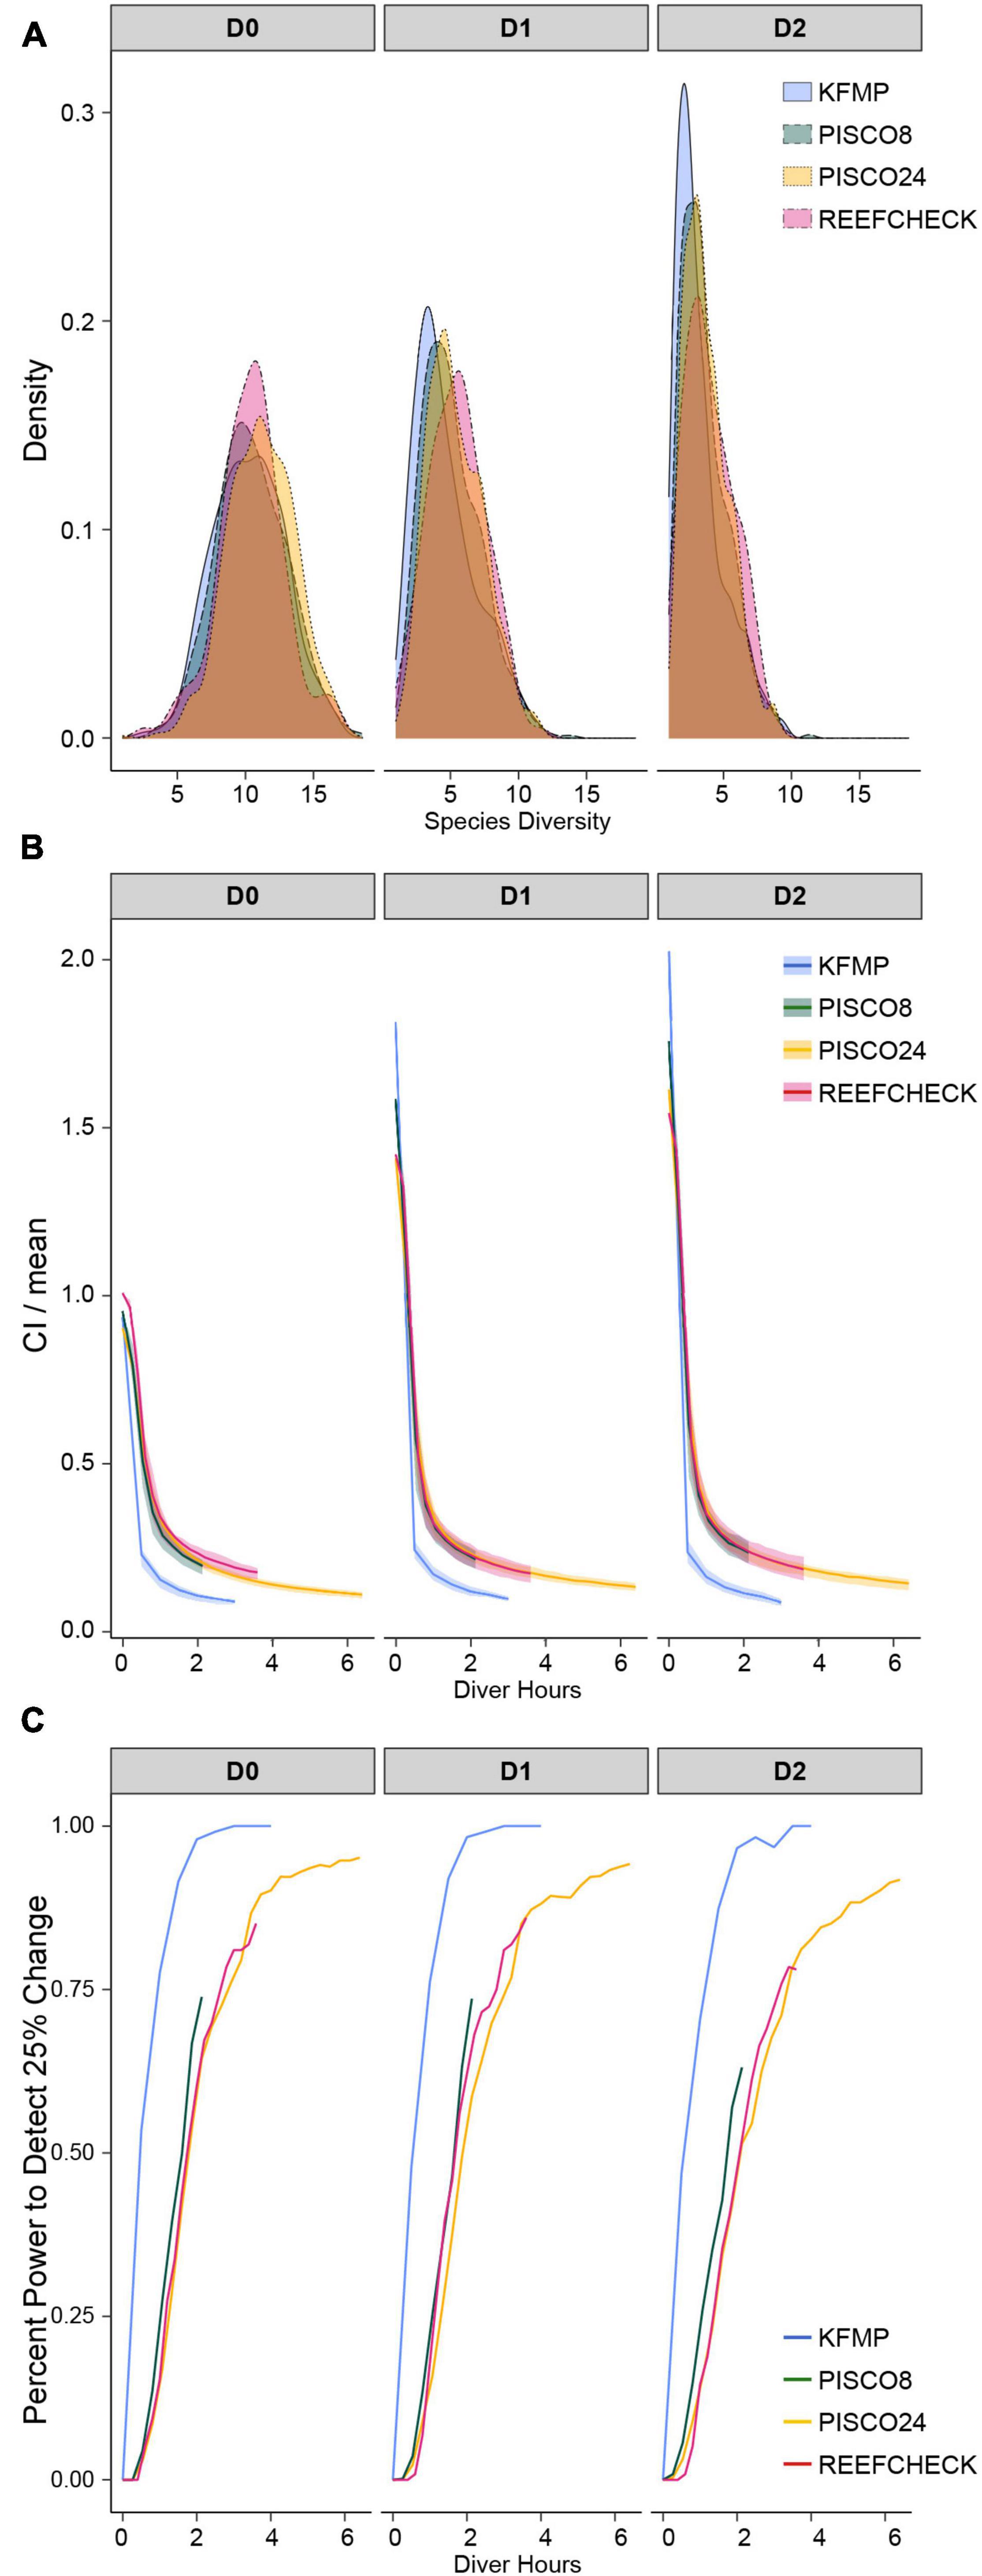
Figure 3. (A) Distribution of species diversity estimates across sampling events; (B) confidence interval curves as a function of sampling effort calculated from sampling events at sites with typical fish density (40–60th percentile for each program) as a function of sampling effort; (C) probability of obtaining confidence that biodiversity is within 25% of the estimated value as a function of sampling effort. All for the first three Hill numbers calculated from the full sampling events including the full taxa list for each monitoring program.
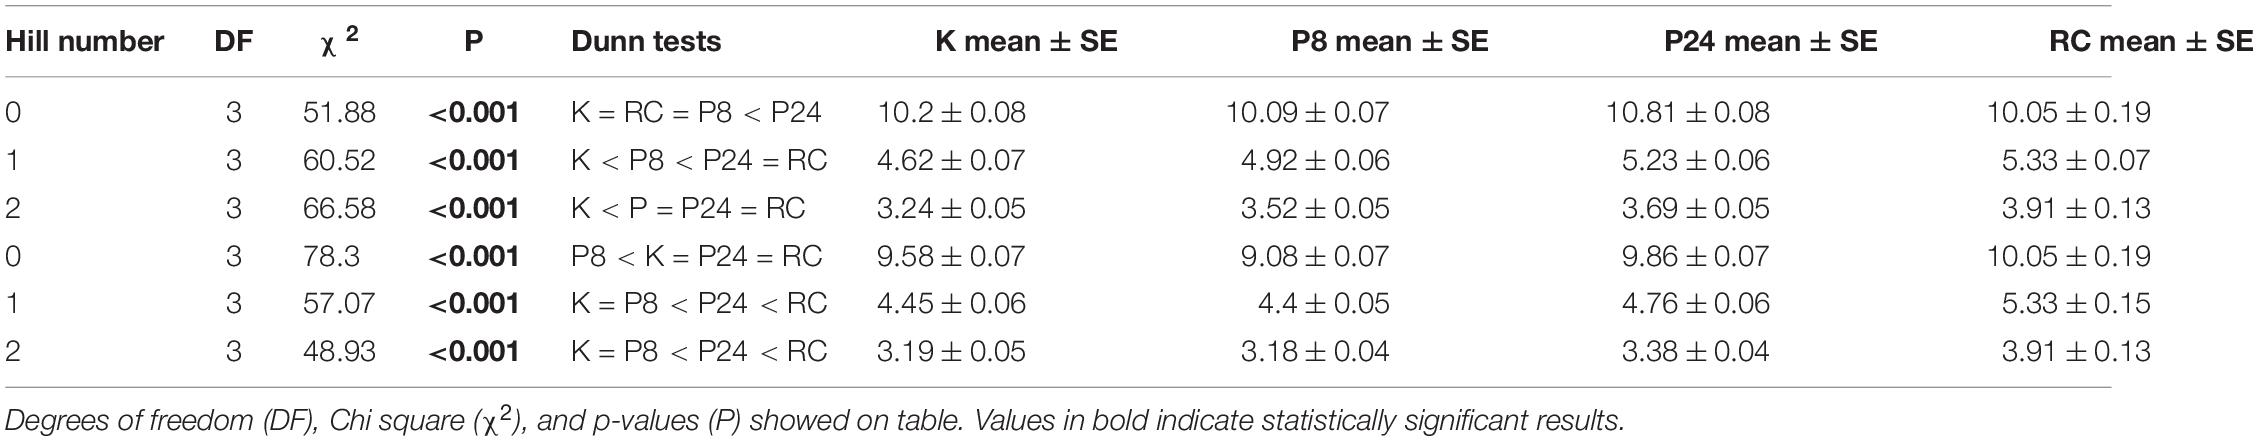
Table 1. Results of Kruskall Wallis and post-hoc Dunn test for 0D, 1D, 2D calculated from the monitoring programs both the full taxa list (Full, 72 taxa for KFMP, K, and PISCO, P, and 33 for Reef Check, RC) and the shared list (Shared, 31 sp., in all programs).
We found a consistent qualitative relationship between number of fish per sample, sampling effort and uncertainty for all monitoring programs and metrics. Uncertainty shrank as sampling effort increased and was lower when more fish were present. Indeed, when number of fish per sample was low, increases in effort yielded little confidence in biodiversity metrics (Figure 4).
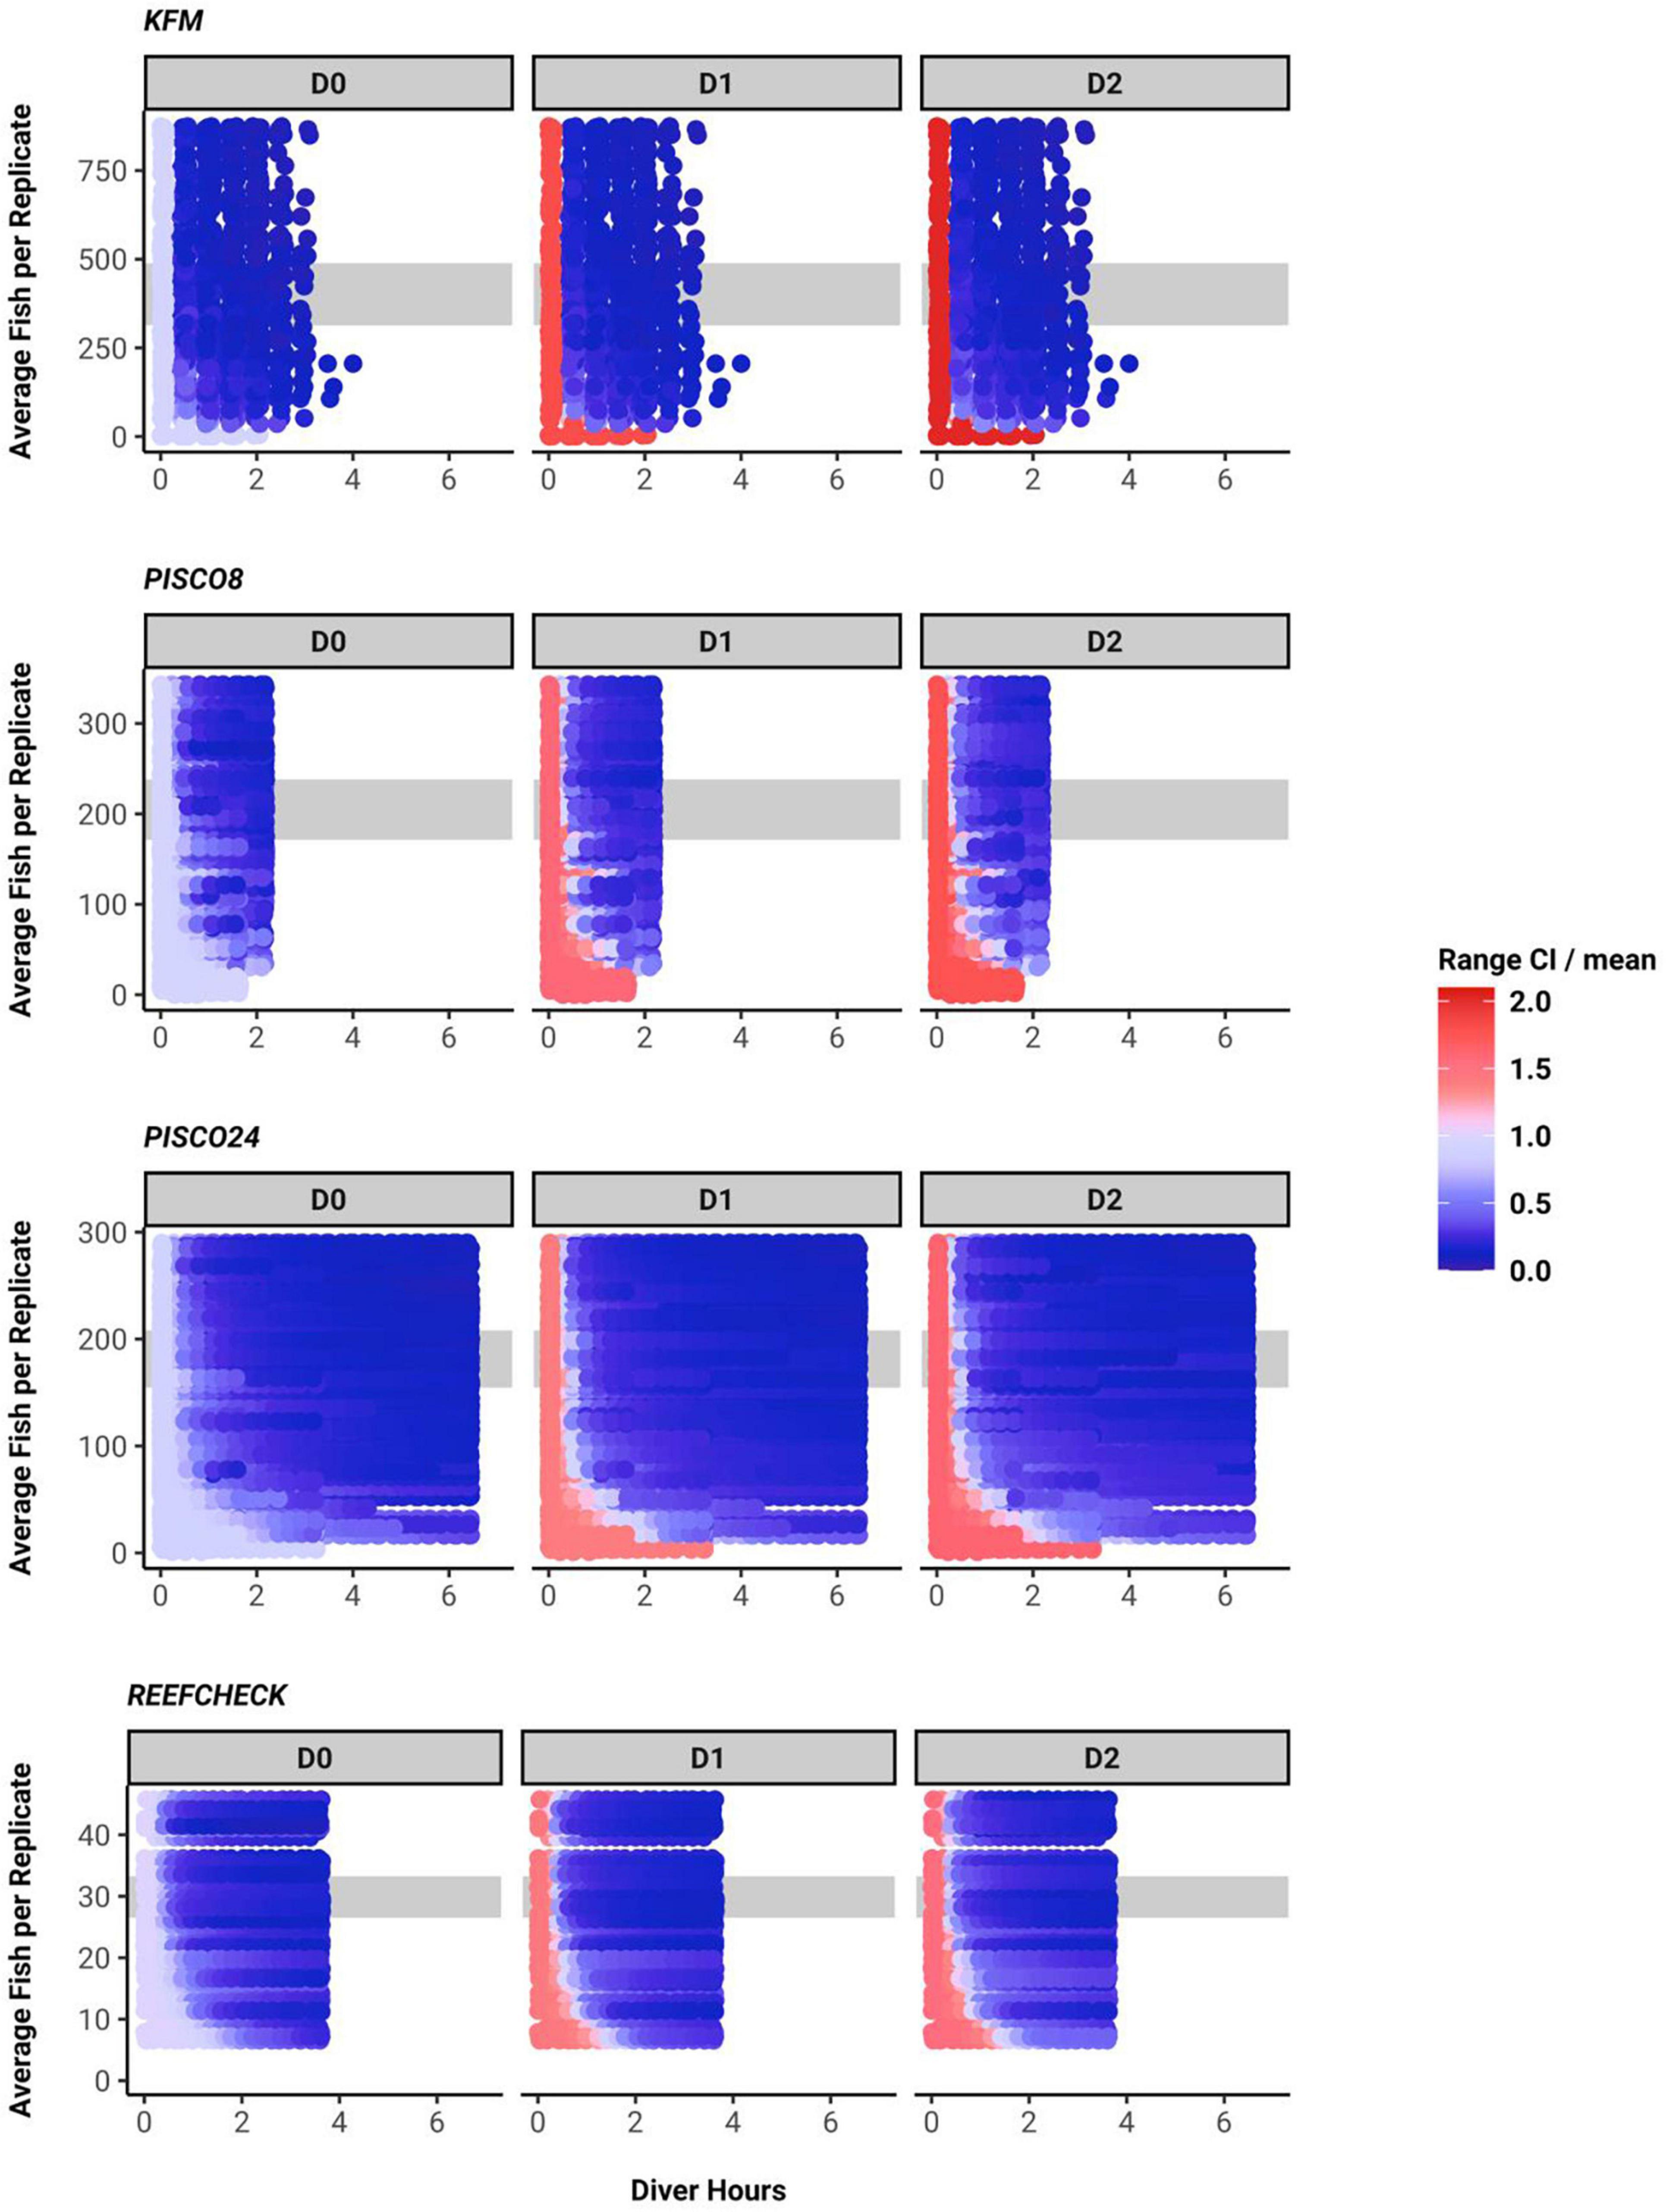
Figure 4. Confidence interval width for each diversity metric, plotted as across a gradient of sampling effort (x axis) and as a function of the abundance of fish (of the species recorded) at the site (data truncated at the 80th percentile). Gray band indicates the 40–60th fish density percentile.
Efficiency curves for the monitoring methods at sites with typical fish density for each program (40th–60th percentile; Figure 4) showed similar shapes, but uncertainty declined at different rates (Figure 3B). We found that the uncertainty in diversity estimates decreased rapidly over the first hour of diving for all programs, with more gradual improvements over the next 2 h (Figure 3B). The shape of the relationship was similar across all methods and metrics, but uncertainty decreased faster and earlier and reached the lowest level (approximately 10%) for the KFMP method. Uncertainty in PISCO24 and RC estimates declined more slowly than PISCO8, needing approximately 1 h more of sampling to shrink the CI to 20% of the mean, despite their ability to observe fish at the same rate as PISCO8 (Figure 3B). However, PISCO24 ultimately reached a lower uncertainty than either RC or PISCO8 once accounting for all 24 transects. Uncertainty tended to be higher for 1D, 2D for a given effort level, as was observed in the simulated community, and plateaued with confidence intervals 10–30% of the mean across all methods (Figure 3B and Supplementary Figure 6). We observed similar results when comparing the programs using the shared species list (Supplementary Figures 7, 8).
We found that sampling method and effort affected the ability to detect a 25% change in biodiversity which could represent a change through time at a site, or a comparison with another site (Figure 3C). KFMP exhibited the highest ability to detect change, being more than 95% likely to obtain an estimate with confidence limits smaller than 25% of the mean after 2 diver hours of effort. PISCO8 reached its maximum ability to detect change at 74% after 2 h, while PISCO24 and RC required almost 1 h more of sampling to reach the same value. PISCO24 reached the second highest ability to detect change, plateauing after 4 h at 95%, while RC achieved its maximum ability at 85% after 3.5 h. For PISCO and RC, ability to detect change was lower for higher-order diversity metrics (Figure 3C). However, all programs performed similarly for the probability of obtaining confidence limits within 50% of the mean, reaching 100% likelihood after 3 h of sampling (2 h for KFMP, Supplementary Figure 9).
Discussion
We show how the relationship between sampling effort and information gained can be estimated and how to evaluate the precision and ability to detect changes of alternative strategies for observing biodiversity. This approach can help managers and scientists choose whether to adopt new biodiversity sampling strategies and how to allocate sampling effort. Monitoring and research programs are frequently constrained by budget limitations, so managers need innovative, low-cost sampling strategies such as those employing citizen scientists or novel technologies. However, CS is often seen as less rigorous due to simplified sampling methods, and many novel technologies (e.g., acoustics) are limited in their taxonomic coverage or resolution. Our approach of constructing sampling efficiency curves for comparing expected uncertainty (CI/mean) and ability to detect changes for a given level of sampling effort can guide the design of monitoring programs and help managers and scientists determine how much sampling is necessary to achieve their goals.
We had hypothesized that using a restricted species lists would result in depressed estimates of biodiversity, particularly for lower-order diversity metrics that are most sensitive to rare species. Surprisingly the CS dataset we analyzed did not yield depressed biodiversity estimates. RC’s diversity estimates closely agreed with PISCO’s and KFMP’s, even for 0D, despite RC counting fewer than half the species observed by the other programs, thus missing rare species by design.
We observed that the species excluded from RC’s sampling were infrequently encountered and had relatively little effect on biodiversity estimates. This could be a general feature of restricted sampling lists, as the excluded taxa are often rare species that are infrequently encountered and thus provide few opportunities to train data recorders, whether human or machine (Willi et al., 2019). We explored the consequences of using a restricted species list by repeating our analyses with simulated communities and found that sampling with a reduced species list resulted in lower diversity estimates and higher uncertainty for any level of sampling effort. However, the magnitude of this effect was highly dependent on which species were excluded. If the rarest 50% of species were excluded from sampling, instead of excluding species at random, the negative effect on both biodiversity estimates and uncertainty was reduced (see Supplementary Methodology applied to simulated community S3). In RC, only a few of the species ignored are encountered in a typical sampling event by other programs (Supplementary Figure 3) and any resulting reduction in biodiversity was small relative to other sources of systematic variation.
These other sources of variation, including differences in search strategy and the portion of the water column being surveyed, complicate any comparison of mean biodiversity metrics. KFMP’s roving divers mostly stay near the bottom but are free to search and swim throughout the whole water column, while RC and PISCO divers swim closer to the substrate, potentially finding more species usually more difficult to detect from afar (Schmitt et al., 2002; Bozec et al., 2011). Unlike PISCO, which performs a stratified sampling including water column and kelp canopy, RC divers only count fish near the substrate and so are sampling a somewhat different community than the other two methods.
More generally, we showed that sampling methods capturing only a subset of target taxa may still effectively monitor biodiversity for particular applications. This result likely depends on the particular species missed by the sampling method and on the structure of the community being observed, but supports the potential utility of novel methods that offer increases in efficiency at a cost to accuracy or completeness. Of course, biodiversity sampling has many potential uses beyond community-level diversity metrics. Documenting the presence of rare species is often valuable for conservation and management applications even when such species have little effect on community-scale metrics. Rare species can sometimes be invasive or indicators of ecosystem change since they can be more sensitive to perturbations than common species as has been pointed out for birds, amphibians and corals (Foden et al., 2013). Therefore, monitoring key rare species and common taxa could still be a priority for a monitoring program, despite their limited effect on biodiversity metrics.
Besides revealing the utility of taxonomically limited methods, this methodology can help researchers determine how much sampling is necessary to confidently estimate biodiversity metrics. We found that the three monitoring programs all achieve low levels of uncertainty, reaching a point of diminishing returns within the first 1–2 h of sampling. These monitoring programs are investing 2 h+ of effort per sampling event, so sampling is more than adequate for this particular objective (Figure 3B). However, the frequency of sampling will also depend in the goals of the monitoring program (e.g., rapid detection of changes, assessing long term trends or resolve seasonal patterns as well). Our analyses also reveal how much sampling is necessary to detect temporal or spatial changes in biodiversity. Assessing the ability to detect changes in diversity over space or time can guide the design of new monitoring programs or improve the design of ongoing programs and is crucial for the development of adaptation and mitigation plans. In the monitoring data assessed here, KFMP is nearly certain to detect 25% change in biodiversity with the present levels of effort, while PISCO and RC could still increase their ability to detect change by investing more effort (Figure 3C). In our simulated data, sampling strategies that neglect a large fraction of the species are less able to detect change, especially when the species are randomly excluded from sampling rather than when the rarest species are excluded (see Supplementary Methodology applied to simulated community S3). In the monitoring programs, the sites where these programs cannot detect change, however, are likely sites with few fish (Figure 4), so they may be locations where detecting change in fish biodiversity is less important. All three research programs have multiple objectives, so these results alone do not indicate that the programs should increase or decrease their sampling effort. But they do set expectations about the utility of existing sampling and serve as part of a broader decision-making process about program design. Although the ecosystem we focus on here is relatively species poor, our analyses of simulated datasets suggests these methods will apply in more diverse systems, and an important next step is to test this method across a border array of ecosystems.
The differences between the three real programs reflect both the survey methods used and the broader sampling design. The programs differ in the rate at which they reduce uncertainty about local biodiversity as sampling effort increases. KFMP outperformed PISCO and RC in terms of uncertainty and sensitivity. It takes the latter programs twice as much sampling effort to achieve a confidence level 25% of the mean compared to KFMP. Over the whole program, this represents a substantial sampling time, and even though sampling is a marginal piece of the cost of a monitoring program, it can represent an important cost difference (Gardiner et al., 2012). One advantage of the roving diver method is the higher number of fish encountered (Supplementary Figure 5). This method was conceived as a flexible searching method to rapidly sample fish, and it performed well in this regard. PISCO and RC’s transect-based methods are almost identical in terms of the rate at which they encounter fish. However, the three methods differ fundamentally in the way the reef is sampled. PISCO and RC scattered their randomly placed transects over the reef. Thus, each additional transect increases the area covered, adding variability in habitats sampled and species encountered permitting inferences about the larger reef area. Meanwhile, the roving divers with KFMP repeatedly sample a permanent area at each site, adding information about that fish community without adding new spatial variability. Additional replicates add inter-observer variability and sometimes temporal variability in all three programs. We can examine the role of spatial scale by examining the differences between PISCO8 and PISCO24. These use the same methods and data, analyzed at smaller (PISCO8) and larger (PISCO24) spatial scales (Supplementary Figure 1). We found that PISCO24 required more effort to get to a similar confidence to detect change than PISCO8. However, PISCO24 covers three times the area, hence provides information about a more representative sample of habitats. Therefore, efficiency differences in each program can be due to the survey method (roving diver vs. transects), the sampling strategy (fixed vs. random placement), and the spatial scale.
A surprising outcome of our analysis was the relatively high performance of CS methods. The most direct comparison is with PISCO because the two programs share a similar survey method. In fact, RC protocols were developed from the PISCO protocols and experience with PISCO surveys was used to strategically select common and recognizable species to train volunteers and perform surveys more easily. This might explain why the sensitivity of both PISCO24 and RC are almost identical. Also, the RC program includes the participation of many former PISCO observers and thus represents an excellent way to add value to the PISCO monitoring, extending coverage of data collection while making use of PISCO’s expertise both in design and in training of volunteers. CS programs have emerged as an increasingly viable way to conduct biodiversity monitoring at a lower cost (e.g., Pocock et al., 2018) and our results show that well-planned CS programs, could fill spatial or temporal gaps and leverage more professional sampling programs while still collecting accurate data.
Obtaining reliable information with the limited funding available to invest in biodiversity monitoring calls for the design and implementation of biodiversity monitoring programs with high cost-effectiveness. The methodology applied in this study can be a useful tool for evaluating the best design according to the objectives of a monitoring program.
Data Availability Statement
Publicly available datasets were analyzed in this study. The datasets analyzed in this study can be found in: Miller R., Rassweiler, A, Reed, D. Lafferty, K., Kui L. and O’Brien, M. (2018). “Santa Barbara Channel Marine BON: Nearshore Kelp Forest Integrated Fish, 1981-Ongoing.” Environmental Data Initiative. https://doi.org/10.6073/pasta/0976f9969ef2789b77b659e9337c4c0c, Carr, M. H. and Caselle, J. E. (2009). PISCO: Subtidal: Community Surveys: Fish Survey doi:10.6085/AA/pisco_subtidal.150.2 and http://data.reefcheck.us/.
Author Contributions
GH, AD, and AR conceived the work. JC, DK, RM, DR, and JS acquired and curated the data. GH drafted the article. All authors contributed to critically revise the article.
Funding
This research was funded by the National Parks Service (P14A01661), NASA Biodiversity and Ecological Forecasting Program (NNX-14AR62A), the Bureau of Ocean and Energy Management Ecosystem Studies program (MC15AC00006), and NOAA in support of the Santa Barbara Channel Biodiversity Observation Network. PISCO was funded by the David and Lucile Packard Foundation.
Conflict of Interest
The authors declare that the research was conducted in the absence of any commercial or financial relationships that could be construed as a potential conflict of interest.
Publisher’s Note
All claims expressed in this article are solely those of the authors and do not necessarily represent those of their affiliated organizations, or those of the publisher, the editors and the reviewers. Any product that may be evaluated in this article, or claim that may be made by its manufacturer, is not guaranteed or endorsed by the publisher.
Acknowledgments
We thank all the divers who collected the data and the monitoring programs for making data available. We also thank D. Okamoto, K. Davis Koehn, A. Parsons-Field, and C. Molitor for help assembling data.
Supplementary Material
The Supplementary Material for this article can be found online at: https://www.frontiersin.org/articles/10.3389/fmars.2022.820790/full#supplementary-material
References
Azevedo, G. H. F., Faleiro, B. T., Magalhaes, I. L. F., Benedetti, A. R., Oliveira, U., Pena-Barbosa, J. P. P., et al. (2014). Effectiveness of Sampling Methods and Further Sampling for Accessing Spider Diversity: a Case Study in a Brazilian Atlantic Rainforest Fragment. Insect Conserv. Divers. 7, 381–391. doi: 10.1111/icad.12061
Baker, D. G., Eddy, T. D., McIver, R., Schmidt, A. L., Thériault, M. H., Boudreau, M., et al. (2016). Comparative Analysis of Different Survey Methods for Monitoring Fish Assemblages in Coastal Habitats. PeerJ 4:e1832. doi: 10.7717/peerj.1832
Bosch, N. E., Gonçalves, J. M. S., Erzini, K., and Tuya, F. (2017). How’ and ‘What’ Matters: sampling Method Affects Biodiversity Estimates of Reef Fishes. Ecol. Evol. 7, 4891–4906. doi: 10.1002/ece3.2979
Bozec, Y. M., Kulbicki, M., Laloë, F., Mou-Tham, G., and Gascuel, D. (2011). Factors Affecting the Detection Distances of Reef Fish: implications for Visual Counts. Mar. Biol. 158, 969–981. doi: 10.1007/s00227-011-1623-9
Buffington, M. L., and Redak, R. A. (1998). A Comparison of Vacuum Sampling versus Sweep-Netting for Arthropod Biodiversity Measurements in California Coastal Sage Scrub. J. Insect Conserv. 2, 99–106.
Butcher, G. S., Fuller, M. R., McAllister, L. S., and Geissler, P. H. (2010). An Evaluation of the Christmas Bird Count for Monitoring Population Trends of Selected Species. Wildl. Soc. Bull. 18, 129–134.
Carlson, M., and Schmiegelow, F. (2002). Cost-Effective Sampling Design Applied to Large-Scale Monitoring of Boreal Birds. Ecol. Soc. 6:11.
Celis-Murillo, A., Deppe, J. L., and Allen, M. F. (2009). Using Soundscape Recordings to Estimate Bird Species Abundance, Richness, and Composition. J. Field Ornithol. 80, 64–78. doi: 10.1111/j.1557-9263.2009.00206.x
Chandler, M., See, L., Copas, K., Bonde, A. M. Z., López, B. C., Danielsen, F., et al. (2017). Contribution of Citizen Science towards International Biodiversity Monitoring. Biol. Conserv. 213, 280–294. doi: 10.1016/j.biocon.2016.09.004
Chao, A., Gotelli, N. J., Hsieh, T. C., Sander, E. L., Ma, K. H., Colwell, R. K., et al. (2014). Rarefaction and Extrapolation with Hill Numbers: a Framework for Sampling and Estimation in Species Diversity Studies. Ecol. Monogr. 84, 45–67. doi: 10.1890/13-0133.1
Colvocoresses, J., and Acosta, A. (2007). A Large-Scale Field Comparison of Strip Transect and Stationary Point Count Methods for Conducting Length-Based Underwater Visual Surveys of Reef Fish Populations. Fish. Res. 85, 130–141. doi: 10.1016/j.fishres.2007.01.012
Farina, A., Pieretti, N., and Piccioli, L. (2011). The Soundscape Methodology for Long-Term Bird Monitoring?: a Mediterranean Europe Case-Study. Ecol. Inform. 6, 354–363. doi: 10.1016/j.ecoinf.2011.07.004
Foden, W. B., Butchart, S. H. M., Stuart, S. N., Vié, J. C., Akçakaya, H. R., Angulo, A., et al. (2013). Identifying the World’s Most Climate Change Vulnerable Species: a Systematic Trait-Based Assessment of All Birds, Amphibians and Corals. PLoS One 8:e65427. doi: 10.1371/journal.pone.0065427
Gardiner, M. M., Allee, L. L., Brown, P. M. J., Losey, J. E., Roy, H. E., and Smyth, R. R. (2012). Lessons from Lady Beetles?: accuracy of Monitoring Data from US and UK Citizen- Science Programs. Front. Ecol. Environ. 10, 471–476. doi: 10.1890/110185
Gasc, A., Sueur, J., Jiguet, F., Devictor, V., Grandcolas, P., Burrow, C., et al. (2013). Assessing Biodiversity with Sound: do Acoustic Diversity Indices Reflect Phylogenetic and Functional Diversities of Bird Communities? Ecol. Indic. 25, 279–287. doi: 10.1016/j.ecolind.2012.10.009
Goldstein, E. A., Lawton, C., Sheehy, E., and Butler, F. (2014). Locating Species Range Frontiers?: a Cost and Efficiency Comparison of Citizen Science and Hair-Tube Survey Methods for Use in Tracking an Invasive Squirrel. Wildl. Res. 41, 64–75. doi: 10.1071/WR13197
Gotelli, N. J., and Colwell, R. K. (2001). Quantifying Biodiversity: procedures and Pitfalls in the Measurement and Comparison of Species Richness. Ecol. Lett. 4, 379–391.
Hsieh, T. C., Ma, K. H., and Chao, A. (2016). INEXT: an R Package for Rarefaction and Extrapolation of Species Diversity (Hill Numbers). Methods Ecol. Evol. 7, 1451–1456. doi: 10.1111/2041-210X.12613
King, J. R., and Porter, S. D. (2005). Evaluation of Sampling Methods and Species Richness Estimators for Ants in Upland Ecosystems in Florida. Environ. Entomol. 34, 1566–1578.
Kushner, D., Moore, K., Mooney, E., Ibarra, S., Grunden, J., and Metzger, J. R. (2013). Channel Islands National Park Kelp Forest Monitoring Program Annual Report 2009 Natural Resource Data Series NPS/MEDN/NRDS-2013/581. Fort Collins, Colorado: National Park Service
Langlois, T. J., Harvey, E. S., Fitzpatrick, B., Meeuwig, J. J., Shedrawi, G., and Watson, D. L. (2010). Cost-Efficient Sampling of Fish Assemblages: comparison of Baited Video Stations and Diver Video Transects. Aquat. Biol. 9, 155–168. doi: 10.3354/ab00235
Lovett, G. M., Burns, D. A., Driscoll, C. T., Jenkins, J. C., Mitchell, M. J., Rustad, L., et al. (2007). Who Needs Environmental Monitoring? Front. Ecol. Environ. 5, 253–260. doi: 10.1890/1540-929520075[253:WNEM]2.0.CO;2
Luque, S., Pettorelli, N., Vihervaara, P., and Wegmann, M. (2018). Improving Biodiversity Monitoring Using Satellite Remote Sensing to Provide Solutions towards the 2020 Conservation Targets. Methods Ecol. Evol. 9, 1784–1786. doi: 10.1111/2041-210X.13057
Madalozzo, B., Santos, T. G., Santos, M. B., Both, C., and Cechin, S. (2017). Biodiversity Assessment: selecting Sampling Techniques to Access Anuran Diversity in Grassland Ecosystems. Wildl. Res. 44, 78–91. doi: 10.1071/WR16086
Milner-Gulland, E. J., and Shea, K. (2017). Embracing Uncertainty in Applied Ecology. J. Appl. Ecol. 54, 2063–2068. doi: 10.1111/1365-2664.12887
Minte-Vera, C. V., Leão De Moura, R., and Francini-Filho, R. B. (2008). Nested Sampling: an Improved Visual-Census Technique for Studying Reef Fish Assemblages. Mar. Ecol. Prog. Ser. 367, 283–293. doi: 10.3354/meps07511
National Research Council [NRC] (2001). Marine Protected Areas: tools for Sustaining Ocean Ecosystem. Washington, D.C: The National Academies Press, doi: 10.17226/9994
Pocock, M. J. O., Chandler, M., Bonney, R., Thornhill, I., Albin, A., August, T., et al. (2018). “A Vision for Global Biodiversity Monitoring With Citizen Science,” in Next Generation Biomonitoring: part 2. Accur, eds D. A. Bohan, A. J. Dumbrell, G. Woodward, and M. Jackson (Amsterdam: Elsevier Ltd), doi: 10.1016/bs.aecr.2018.06.003
Proença, V., Martin, L. J., Pereira, H. M., Fernandez, M., McRae, L., Belnap, J., et al. (2017). Global Biodiversity Monitoring: from Data Sources to Essential Biodiversity Variables. Biol. Conserv. 213, 256–263. doi: 10.1016/j.biocon.2016.07.014
Rassweiler, A., Dubel, A. K., Hernan, G., Kushner, D. J., Caselle, J. E., and Sprague, J. L. (2020). Roving Divers Surveying Fish in Fixed Areas Capture Similar Patterns in Biogeography but Different Estimates of Density When Compared With Belt Transects. Front. Mar. Sci. 7:272. doi: 10.3389/fmars.2020.00272
Reynolds, J. H., Thompson, W. L., and Russell, B. (2011). Planning for Success: identifying Effective and Efficient Survey Designs for Monitoring. Biol. Conserv. 144, 1278–1284. doi: 10.1016/j.biocon.2010.12.002
Ruppert, K. M., Kline, R. J., and Rahman, S. (2019). Past, Present, and Future Perspectives of Environmental DNA Metabarcoding: a Systematic Review in Methods, Monitoring and Applications of Global EDNA. Glob. Ecol. Conserv. 17:e00547. doi: 10.1016/j.gecco.2019.e00547
Schmeller, D. S., Henry, P.-Y., Julliard, R., Gruber, B., Clobert, J., Dziock, F., et al. (2008). Advantages of Volunteer-Based Biodiversity Monitoring in Europe. Conserv. Biol. 23, 307–316. doi: 10.1111/j.1523-1739.2008.01125.x
Schmitt, F., Sluka, D., and Sullivan-Sealey, K. M. (2002). Evaluating the Use of Roving Diver and Transect Surveys to Assess the Coral Reef Fish Assemblage off Southeastern Hispaniola. Coral Reefs 21, 216–223. doi: 10.1007/s00338-002-0216-y
Tilman, D., Isbell, F., and Cowles, J. M. (2012). Biodiversity and Ecosystem Function. Science 335, 174–175. doi: 10.1126/science.1217245
Keywords: biodiversity sampling, confidence, sampling effort, underwater visual census, citizen science, hill numbers, uncertainty
Citation: Hernan G, Dubel AK, Caselle JE, Kushner DJ, Miller RJ, Reed DC, Sprague JL and Rassweiler A (2022) Measuring the Efficiency of Alternative Biodiversity Monitoring Sampling Strategies. Front. Mar. Sci. 9:820790. doi: 10.3389/fmars.2022.820790
Received: 23 November 2021; Accepted: 24 January 2022;
Published: 16 February 2022.
Edited by:
Tito Monteiro da Cruz Lotufo, University of São Paulo, BrazilReviewed by:
Russell ‘Rusty’ Brainard, Red Sea Development Company, Saudi ArabiaJan Vanaverbeke, Royal Belgian Institute of Natural Sciences, Belgium
Katherine Cure, Australian Institute of Marine Science (AIMS), Australia
Copyright © 2022 Hernan, Dubel, Caselle, Kushner, Miller, Reed, Sprague and Rassweiler. This is an open-access article distributed under the terms of the Creative Commons Attribution License (CC BY). The use, distribution or reproduction in other forums is permitted, provided the original author(s) and the copyright owner(s) are credited and that the original publication in this journal is cited, in accordance with accepted academic practice. No use, distribution or reproduction is permitted which does not comply with these terms.
*Correspondence: Gema Hernan, Z2VtYS5oZXJuYW5tQGdtYWlsLmNvbQ==