 Joshua Bennett-Williams
 Christina Skinner
 Alex S. J. Wyatt
 Rona A. R. McGill
 Trevor J. Willis
- 1Department of Ocean Science, The Hong Kong University of Science and Technology, Kowloon, Hong Kong SAR, China
- 2Southern Marine Science and Engineering Guangdong Laboratory (Guangzhou), Guangzhou, China
- 3Natural Environment Research Council (NERC) Life Sciences Mass Spectrometry Facility, Scottish Universities Environmental Research Centre, Glasgow, United Kingdom
- 4Department of Integrative Marine Ecology, Stazione Zoologica Anton Dohrn, Fano Marine Centre, Fano, Italy
The application of stable isotope analysis (SIA) is increasing in elasmobranch trophic ecology, but inconsistency remains in terms of the tissue pre-treatment methods chosen to remove biases introduced by lipids and urea. SIA of a range of non-lethally extracted tissues from a diverse group of elasmobranchs, including mesopredators, is increasing, yet most studies assume that isotope biases from lipid and urea are the same across tissues and species. To determine tissue- and species-specific isotope biases across treatment methods, three tissues and their components [muscle, fin, and blood separated into plasma and red blood cells (RBC)] were non-lethally extracted from three species of mesopredatory elasmobranchs and subjected to one of three treatment methods: (1) deionized water rinse [DW], (2) chloroform/methanol lipid extraction [LE], or (3) deionized water followed by chloroform/methanol [DW+LE]. In muscle δ13C, all treatments displayed minimal variation (∼ 0‰) but large increases in δ15N (∼ 1‰) indicated urea removal. Fin δ13C values decreased with DW but increased with LE and DW+LE, whilst all treatments increased fin δ15N (∼ 0.5‰), suggesting removal of both lipid and urea. Plasma δ13C and δ15N displayed high individual variation; large decreases in δ13C (∼−0.8‰) across all treatments, but particularly DW, suggested the removal of 13C-enriched compounds while a small increase in δ15N (∼ 0.2‰) suggested minimal urea removal. In RBC, all treatments showed small δ13C declines (∼−0.5‰), with no difference in δ15N, suggesting minimal removal of 13C-enriched compounds and urea. For muscle and fin, DW+LE is the most appropriate treatment to standardize δ13C and δ15N consistently across individuals and tissues. The large individual variation in treatment effects on plasma suggests it is unsuitable for current treatment methods. Consistent treatment effects for RBC allow for DW+LE standardization, however, broader species-specific effects are unknown. The importance of treatment choice for accurately estimating prey contributions to elasmobranch diet was highlighted using Bayesian stable isotope mixing model comparisons, with prey contributions varying significantly among treatments. This variability suggests that ecological inferences from elasmobranch tissue SIA are not robust to different treatment methods. It is recommended that studies employ standardized corrections using a combined DW+LE treatment where applicable.
Introduction
The ecology of many elasmobranch species is poorly understood because research efforts have primarily focused on a small group of iconic or threatened species. Elasmobranch mesopredators in particular are an often overlooked group despite their substantial influence on food web dynamics (Prugh et al., 2009). Understanding the diet and trophic ecology of elasmobranchs that shape food webs is essential to determine appropriate conservation and management strategies at both a species and ecosystem level. To this end, the use of stable isotope analysis (SIA) has been rapidly expanding as it provides a relatively low cost and low effort method to study elasmobranch trophodynamics (Boecklen et al., 2011). This is because stable isotopes from prey sources are incorporated into a consumer’s tissues, which chemically reflect dietary sources (Gannes et al., 1997). Isotope ratios of carbon (δ13C) vary between primary production sources but are relatively constant between prey and consumers, allowing the determination of the consumer’s original dietary carbon source (Deniro and Epstein, 1981; Peterson and Fry, 1987), whereas nitrogen isotope ratios (δ15N) display stepwise enrichment between prey and consumer, providing knowledge of trophic relationships (Post, 2002). To reveal the trophic ecology of elasmobranchs, SIA of both δ13C and δ15N has been applied to a range of ecological questions (Shiffman et al., 2012) such as diet composition (Caut et al., 2013), foraging strategies (Fisk et al., 2002; Albo-Puigserver et al., 2015) movement (Hussey et al., 2012a; Munroe et al., 2015), multi-species interactions (Heithaus et al., 2013; Kiszka et al., 2015), reproduction (McMeans et al., 2009), and trophic position (Estrada et al., 2006; Hussey et al., 2015).
To date, elasmobranch SIA studies have focused primarily on muscle tissue, partly as it can be extracted non-lethally but also as it has additional uses, e.g., for investigating stock structure and physiology (Benavides et al., 2011; Meyer et al., 2018). While the use of other non-lethal tissues such as fin, whole blood, or its components [plasma and red blood cells (RBC)] is increasing, few SIA studies utilize multiple tissues, despite the additional temporal information they can convey. Different tissues incorporate dietary isotopes across different time frames, known as turnover rates (MacNeil et al., 2006; Wyatt et al., 2019). Muscle and fin are considered to be long-term tissues representing a dietary timeframe of months to years, while blood (and its components) are considered short-term tissues representing timeframes of weeks to months (Kim and Koch, 2012; Wyatt et al., 2019). Comparisons of isotope values between short-term and long-term tissues have been used to infer seasonal migrations and temporal changes (or lack thereof) in feeding specialization and strategies (Matich and Heithaus, 2014; Madigan et al., 2015; Wyatt et al., 2019). However, turnover rates are correlated to metabolic rates and can vary substantially with size and growth rates, as well as between species and tissues (Kim and Koch, 2012; Wyatt et al., 2019). It should be noted that elasmobranch “fin” is generally composed of multiple tissues (cartilage, muscle, and skin) that may have differing turnover rates, and tend to be sampled inconsistently (Hussey et al., 2011; Willis et al., 2013). This also causes variable assimilation preference between tissue types from the enrichment of heavy isotopes of consumed prey, known as the diet-tissue discrimination factor (DTDF) (Olin et al., 2013). When the turnover rate and DTDF have been accounted for and corrected, it has been assumed that different tissues can be isotopically compared both inter and intra-specifically (Tilley et al., 2013; Matich and Heithaus, 2014; Matich et al., 2015; Ferreira et al., 2017; Whitehead et al., 2020). However, this does not account for the tissue-specific influence of isotopic biasing (or bias inducing) compounds such as lipids and urea (Fisk et al., 2002).
Lipids in tissues influence δ13C values due to 13C-depletion relative to proteins and carbohydrates (Wessels and Hahn, 2010), potentially causing organism δ13C values to be negatively biased relative to their diet with increasing lipid content. Lipid content varies significantly between tissues and species (Bone and Roberts, 1969; Hussey et al., 2012b; Carlisle et al., 2017) and needs to be corrected and standardized to allow for accurate intra- and inter-species comparisons. Tissue pre-treatments in elasmobranchs are strongly recommended over mathematical equations to correct lipid isotope biases based on carbon-to-nitrogen (C:N) ratios (Hussey et al., 2012b; Churchill et al., 2015), as C:N corrections are not validated for all species (Fagan et al., 2011). To further complicate attempts to account for lipid-induced isotope variations, high concentrations of urea in elasmobranch tissues can independently influence C:N ratios and thus confound mathematical lipid corrections (Carlisle et al., 2017). Despite this, mathematical corrections continue to be used in elasmobranch SIA studies (e.g., Estupiñán-Montaño et al., 2021). The consensus, however, is that lipids should be removed, and as mathematical calculations are unviable this has to be carried out via a pre-treatment method (Carlisle et al., 2017). The two most common treatment methods in elasmobranch SIA studies are a chloroform/methanol rinse (LE) and petroleum ether (PE) (Folch et al., 1957; Kim and Koch, 2012; Li et al., 2016). While the effect of both lipid extraction methods is well documented in elasmobranch muscle tissue (Hussey et al., 2012b; Connan et al., 2019), only one study also considered whole blood (Connan et al., 2019). Effects of PE, but not LE, have been investigated for plasma and RBC (Kim and Koch, 2012) but, to our knowledge, there are no studies addressing treatment effects for fin tissue. Furthermore, in addition to lipid removal, both PE and LE treatments have been shown to affect elasmobranch muscle tissue δ15N values, which could be due to the removal of non-lipid compounds such as urea (Sweeting et al., 2006; Kim and Koch, 2012; Li et al., 2016; Connan et al., 2019) or the loss of proteins associated with structural lipids (Sweeting et al., 2006).
Urea and trimethylamine oxide (collectively referred to as “urea” hereafter) present another complication to interpreting elasmobranch tissue isotope values. Urea is a critical component of the elasmobranch osmoregulatory system (Hamlett, 1999). It is soluble and 15N-depleted so it lowers δ15N values (Fisk et al., 2002; Kim and Koch, 2012; Churchill et al., 2015). Urea concentrations can fluctuate inter and intra-specifically, in different ecosystems, at varying life-history stages, and between different tissues (Ballantyne, 1997; Pillans et al., 2005). Urea removal from elasmobranch muscle tissue has been extensively researched—a deionized water rinse (DW) is recommended (Kim and Koch, 2012; Li et al., 2016; Carlisle et al., 2017). For other tissues, DW has been shown to have no significant effect on dermis tissue δ15N of two stingray species (Shipley et al., 2017) and urea extraction on blood and its components is not recommended as it decreases δ15N values (Kim and Koch, 2012; Crook et al., 2019), potentially due to the removal of free-form amino acids (Kim and Koch, 2012) found in plasma (Bedford, 1983). The combination of urea and lipid extraction is well investigated with recommendations provided for elasmobranch muscle for multiple species (Li et al., 2016) and whole blood from one species (Connan et al., 2019), but effects on fin, plasma, and RBC remain understudied.
Stable isotope data are frequently used in Bayesian mixing models to statistically constrain the contribution of certain diets or habitats to consumers (e.g., Tilley et al., 2013; Navarro et al., 2014; Tamburin et al., 2019; Reum et al., 2020). However, these models are dependent on accurate isotope values for both consumer and prey δ13C and δ15N as well as knowledge of trophic discrimination factors, with highly inaccurate inferences possible from poorly constrained models (Willis et al., 2017; Wyatt et al., 2019). As such, failure to appropriately account for δ13C and δ15N biases due to lipid and urea could be expected to lead to inaccurate modeling of diets. Whilst many studies recognize the potential influence of lipids and urea on elasmobranch tissues, there is a lack of consistency in the methods and treatments used. Additionally, no study has yet investigated treatment effects on a range of non-lethally extracted tissues from the same individual to demonstrate the significance of individual isotopic variations due to lipid and urea content. The varying feeding strategies and lifestyles of smaller mesopredators suggest that lipid and urea content, and thus treatment effects, may differ from previously studied elasmobranchs. Therefore, this study aimed to determine: (1) the effect of treatment method on δ13C and δ15N values of three non-lethally sampled tissues and components across three different demersal shark species; (2) how specific treatment methods compare at the individual-level by considering δ13C and δ15N offsets (δcontrol—δtreatment); and (3) the ecological implications of treatment choice on Bayesian mixing model outputs and thus the importance of standardized tissue treatments for robust ecological inferences.
Materials and Methods
Sampling Methods
All sampling was conducted non-lethally from three species of coastal demersal shark: Haploblepharus pictus (dark shyshark), Poroderma pantherinum (leopard catshark) and Poroderma africanum (pajama shark). Sharks were hand caught (freediving and gripping the dorsal muscle) in the northern section of Walker Bay, South Africa (34°25′16.80″S, 19°14′38.71″E). Each individual was immediately transferred into a free flow holding tank with ambient environmental conditions (temperature: 13.4–17.2°C, salinity: 35.5–35.8 ppt, dissolved oxygen: 8.0–9.4 mg/l). Each shark was sampled within 1 h of being transferred into the holding tank. For each individual, total length (TL ± 1 mm) was measured from the snout to the top of the caudal fin. Three tissues and their components were sampled: muscle, fin, plasma, and red blood cells (RBC). White muscle tissue was excised from the left epaxial muscle adjacent to the dorsal fin using a 5 mm3 biopsy punch and skin tissue was removed prior to storage. An approximate 1 cm long section of fin was taken from the trailing edge of the second dorsal fin, composed primarily of cartilage with trace amounts of skin and muscle tissue (Hussey et al., 2011). Three ml of whole blood was extracted using a 25-gauge (TL < 60 cm) or 18-gauge needle (TL > 60 cm) and a 5-cc syringe. Whole blood was immediately centrifuged (Hermle—Z206A) at 10,000 RPM for 10 min and the plasma and RBC separated. All samples were stored in 2 ml Eppendorf tubes and frozen at −20°C. Each tissue sample was handled with sterile equipment to ensure no contamination between tissues or individuals occurred. Final sample numbers were H. pictus: muscle and plasma n = 6, fin and RBC n = 5; P. africanum: muscle and plasma n = 7, fin and RBC n = 6; P. pantherinum: muscle and plasma n = 10, fin n = 5, RBC n = 6.
Sample Preparation
All samples were initially oven-dried in the field at 50°C for a minimum of 18 h preparatory to international transport and subsequently freeze-dried at −50°C for 24 h prior to homogenization using a sterilized mortar and pestle. Each powdered sample was divided into four 2 mg aliquots and assigned a treatment method based on Li et al. (2016) before analysis. Treatment methods were: (1) no treatment (“Control”); (2) Urea removal with distilled water (“DW”): the aliquot was immersed with 1.4 ml of distilled water in a 1.5 ml Eppendorf tube and vortexed for 5 min, left undisturbed for 24 h in a water bath at 30°C, centrifuged at 2,000 RPM for 10 min and then the excess water decanted. This was repeated twice and then the sample was freeze-dried; (3) Lipid extraction (“LE”): the aliquot was immersed in 1.4 ml of a 2:1 chloroform and methanol mixture in a 1.5 ml Eppendorf tube. The mixture was vortexed for 1 min then left undisturbed for 24 h in a water bath at 30°C, centrifuged at 2,000 RPM for 10 min and decanted. The whole process was carried out three times and then the sample was left in a fume cupboard overnight to allow any excess solvent to evaporate; (4) combined urea removal and lipid extraction (“DW+LE”): following the methods described above with the urea removal carried out first followed by the lipid removal.
Stable Isotope Analysis
Approximately ∼1.0 mg of each treated tissue was weighed into 3 × 5 mm tin capsules and analyzed for δ13C and δ15N using an Elementar (Hanau, Germany) Vario PYRO Cube elemental analyser (EA) attached to a Thermo Fisher Scientific (Bremen, Germany) Delta Plus XP Mass Spectrometer at the Scottish University Environmental Research Centre, United Kingdom. The isotopic ratios are expressed in the δ (delta) notation in parts per thousand (‰):
where X = 13C or 15N and Rsample and Rstandard correspond to 13C/12C and 15N/14N ratios of the samples. Precision was measured from standard deviation of replicate analysis of internal and international standards (Supplementary Table 1). The international standard USGS40 (SD, δ13C = 0.17, δ15N = 0.13) was run four times per day and the internal standards GEL (SD, δ13C = 0.09, δ15N = 0.09), ALAGEL (SD, δ13C = 0.07, δ15N = 0.04) and GLYGEL (SD, δ13C = 0.07, δ15N = 0.09) were repeated every ten samples to correct for linearity and instrument drift.
Statistical Analysis
All statistical analyses were carried out in R 4.1.0 (R Core Team, 2021) interfaced with RStudio 1.4.1717 (RStudio Team, 2020). Initial relationships between shark bulk δ13C and δ15N values, and individual sex and body size (and their interaction) were investigated using linear mixed-effects models [R packages: lme4 (Bates et al., 2014) and lmerTest (Kuznetsova et al., 2017)]. For each species, sex (male/female) and body size (total length, TL) were fixed effects, with tissue type included as a random effect. Separate models were run for bulk δ13C and δ15N for each species. ANOVA F-tests and p-values for the fixed effects were calculated using Satterthwaite’s method for denominator degrees-of-freedom and F-statistic. No body size and sex-related interaction effects were identified on bulk δ13C and δ15N values (Supplementary Table 2), so all subsequent analyses were carried out at the species level.
Effects of Treatment Method
To determine whether the treatment method affected the δ13C and δ15N of each tissue type, a linear mixed-effects model was run for each tissue type with either δ13C or δ15N as the response variable, treatment method as a fixed effect, and species as a random effect. Patterns in δ13C and δ15N ratios among tissues, and how these varied with treatment method, were investigated for individual sharks within each species. While the individual patterns in the δ13C and δ15N ratios between tissues remained consistent with treatment method, there was substantial variation among individuals potentially due to their varying lipid and urea content. To account for this, the difference in δ13C and δ15N values between the control and each treatment (δcontrol–δtreatment) was calculated for each sample (hereafter referred to as the Δ13C and Δ15N offsets). Subsequent analyses were carried out on these offsets. Treatment effects on Δ13C or Δ15N offsets were assessed for each tissue type with a linear mixed-effects model with either Δ13C or Δ15N offsets as the response variable, treatment method as a fixed effect and species as a random effect. As above, significance of the fixed effect of Treatment was tested for each model using ANOVA F-tests and p-values calculated using Satterthwaite’s method for denominator degrees-of-freedom and F-statistic. For all models, model assumptions were verified by plotting the model residuals; residuals were assessed for normality and homogeneity and plotted against the predictor variables to ensure independence.
Mixing Models to Assess the Ecological Implications of Tissue Treatment
To determine how treatment method affected prey contribution estimates, stable isotope mixing models (SIMMs) were run on the muscle tissue data for each species. Inputs for the model were consumer (shark) muscle tissue and source [mean ± standard deviation (SD) prey] muscle tissue δ13C and δ15N values. Prey mean ± SD values for the region were taken from De Necker (2017), with four potential dietary items selected based on known catshark feeding ecology; inshore teleosts (δ13C −15.0 ± 0.4‰.; δ15N 14.9 ± 0.3‰), small offshore teleosts (δ13C −15.5 ± 0.3‰; δ15N 12.6 ± 0.4‰), crayfish (δ13C −13.7 ± 0.3‰; δ15N 11.8 ± 0.1‰) and squid (δ13C −16.3 ± 0.3‰; δ15N 14.4 ± 0.5‰). As no sample sizes were available for each prey group, the total number of prey samples taken in the study (n = 161) was averaged across the number of groups (n = 10), assuming even sampling spread (i.e., n = 16 for each prey group).
SIMMs require appropriate trophic discrimination factors (TDF, Δ). TDF is a broader but less accurate terminology for a DTDF. Consequently, from here on in, TDF values (extracted from previous studies) will be referred to as DTDFs. Currently, there are no species-specific DTDFs for the three focal species herein, so models were run using DTDFs from the published literature. Model outputs presented in the results use non-lipid extracted, prey-specific, DTDF from nursehound Scyliorhinus stellaris, applied to samples from all treatment methods [inshore and small offshore teleosts: Δ13C 1.5 ± 0.1‰, Δ15N 1.8 ± 0.1‰; crayfish: Δ13C 0.7 ± 0.2‰, Δ15N 1.8 ± 0.0‰; and squid: Δ13C −0.5 ± 0.3‰, Δ15N 2.5 ± 0.3‰; (Caut et al., 2013)]. To account for differences arising from using different DTDFs, the same models were also run using (1) classic DTDF derived from the literature: Δ13C 0.4 ± 1.3‰, Δ15N 3.4 ± 1.0‰ (Post, 2002); (2) non-lipid extracted muscle DTDF, applied to Control and DW treatments: Δ13C 1.1 ± 0.4‰, Δ15N 2.8 ± 0.0‰, and lipid-extracted muscle DTDF, applied to LE and DW+LE treatments: Δ13C 1.8 ± 0.3‰, Δ15N 3.2 ± 0.4‰ (McCutchan et al., 2003); and (3) non-lipid-extracted DTDF for large sharks, applied to control and DW treatments: Δ13C 0.5 ± 0.3‰, Δ15N 2.0 ± 0.3‰, and lipid-extracted DTDF for large sharks, applied to LE and DW+LE treatment methods: Δ13C 0.9 ± 0.3‰, Δ15N 2.3 ± 0.2‰ (Hussey et al., 2010a; Supplementary Figure 1). For all models, the standard deviation was increased to 1.0 to provide the models with additional parameter space and ensure conservative contribution estimates.
All models were run using MixSIAR (Stock and Semmens, 2016). Individual models were run for each species with treatment method as a fixed factor. Models were run with crossed error terms (process × residual) to account for variation among consumers or sampling, and no informative priors were included. Model Markov chain Monte Carlo parameters were set to “normal” (chain length = 100,000; burn = 50,000; thin = 50; chains = 3) and model convergence was assessed using Gelman-Rubin and Geweke diagnostics (variables < 1.1 and less than 5% of the variables outside the 95% CI, respectively). Differences in the mean contribution of each food source between treatments among species were tested using a permutation test of independence with distribution approximated via Monte Carlo resampling [R package: coin (Hothorn et al., 2008)]. The SIMM estimated mean was the response variable, with treatment method nested within species as the predictor variable.
Results
Treatments
Treatment method effects on tissue δ13C and δ15N values followed similar trends across all species (Figure 1). For muscle, mean δ13C values were similar to the control, with DW resulting in the largest decrease in mean δ13C for all species (0.5‰). Treatment methods had a much greater effect on muscle δ15N values across all species, with large increases in mean muscle δ15N values across all treatments (0.9–1.3‰) (Table 1). Fin δ13C increased after LE (0.3–0.6‰) in all three species. Effects of DW and DW+LE on fin δ13C were more variable (−0.3 to 0.3‰), there was a larger decrease in H. pictus than for P. africanum δ13C, while in P. pantherinum DW decreased but DW+LE increased δ13C (Table 1). For fin δ15N, all treatments in all species showed a positive increase (0.3–0.8‰), with the largest for P. africanum (Table 1). Compared to the other tissues, fin was also the most isotopically distinct (Figure 1). For plasma δ13C, all treatments across all species caused a large negative shift (Figure 1), with DW displaying the largest changes (1.3–1.6‰) followed by LE (0.5–0.7‰) and DW+LE (0.2–0.4‰). Plasma mean δ15N values increased for all treatments and species (0.3–0.4‰), except H. pictus where both DW and DW+LE displayed a mean negative change (Table 1). For RBC, mean δ13C decreased for all treatments and species (0.2–0.8‰), with DW producing the largest difference in H. pictus, followed by P. pantherinum and P. africanum. There were minor shifts in RBC mean δ15N compared to the control (−0.3 to 0.3‰), with H. pictus showing small positive shifts with all treatments, but small negative shifts for P. africanum and P. pantherinum (Table 1). Treatments had a greater effect on carbon values and offsets when compared to nitrogen. All treatment methods exhibited significant effects on δ13C values and D13C offsets across all tissues and their components, whereas only δ15N values in muscle and fins were affected by treatment method (Table 2).
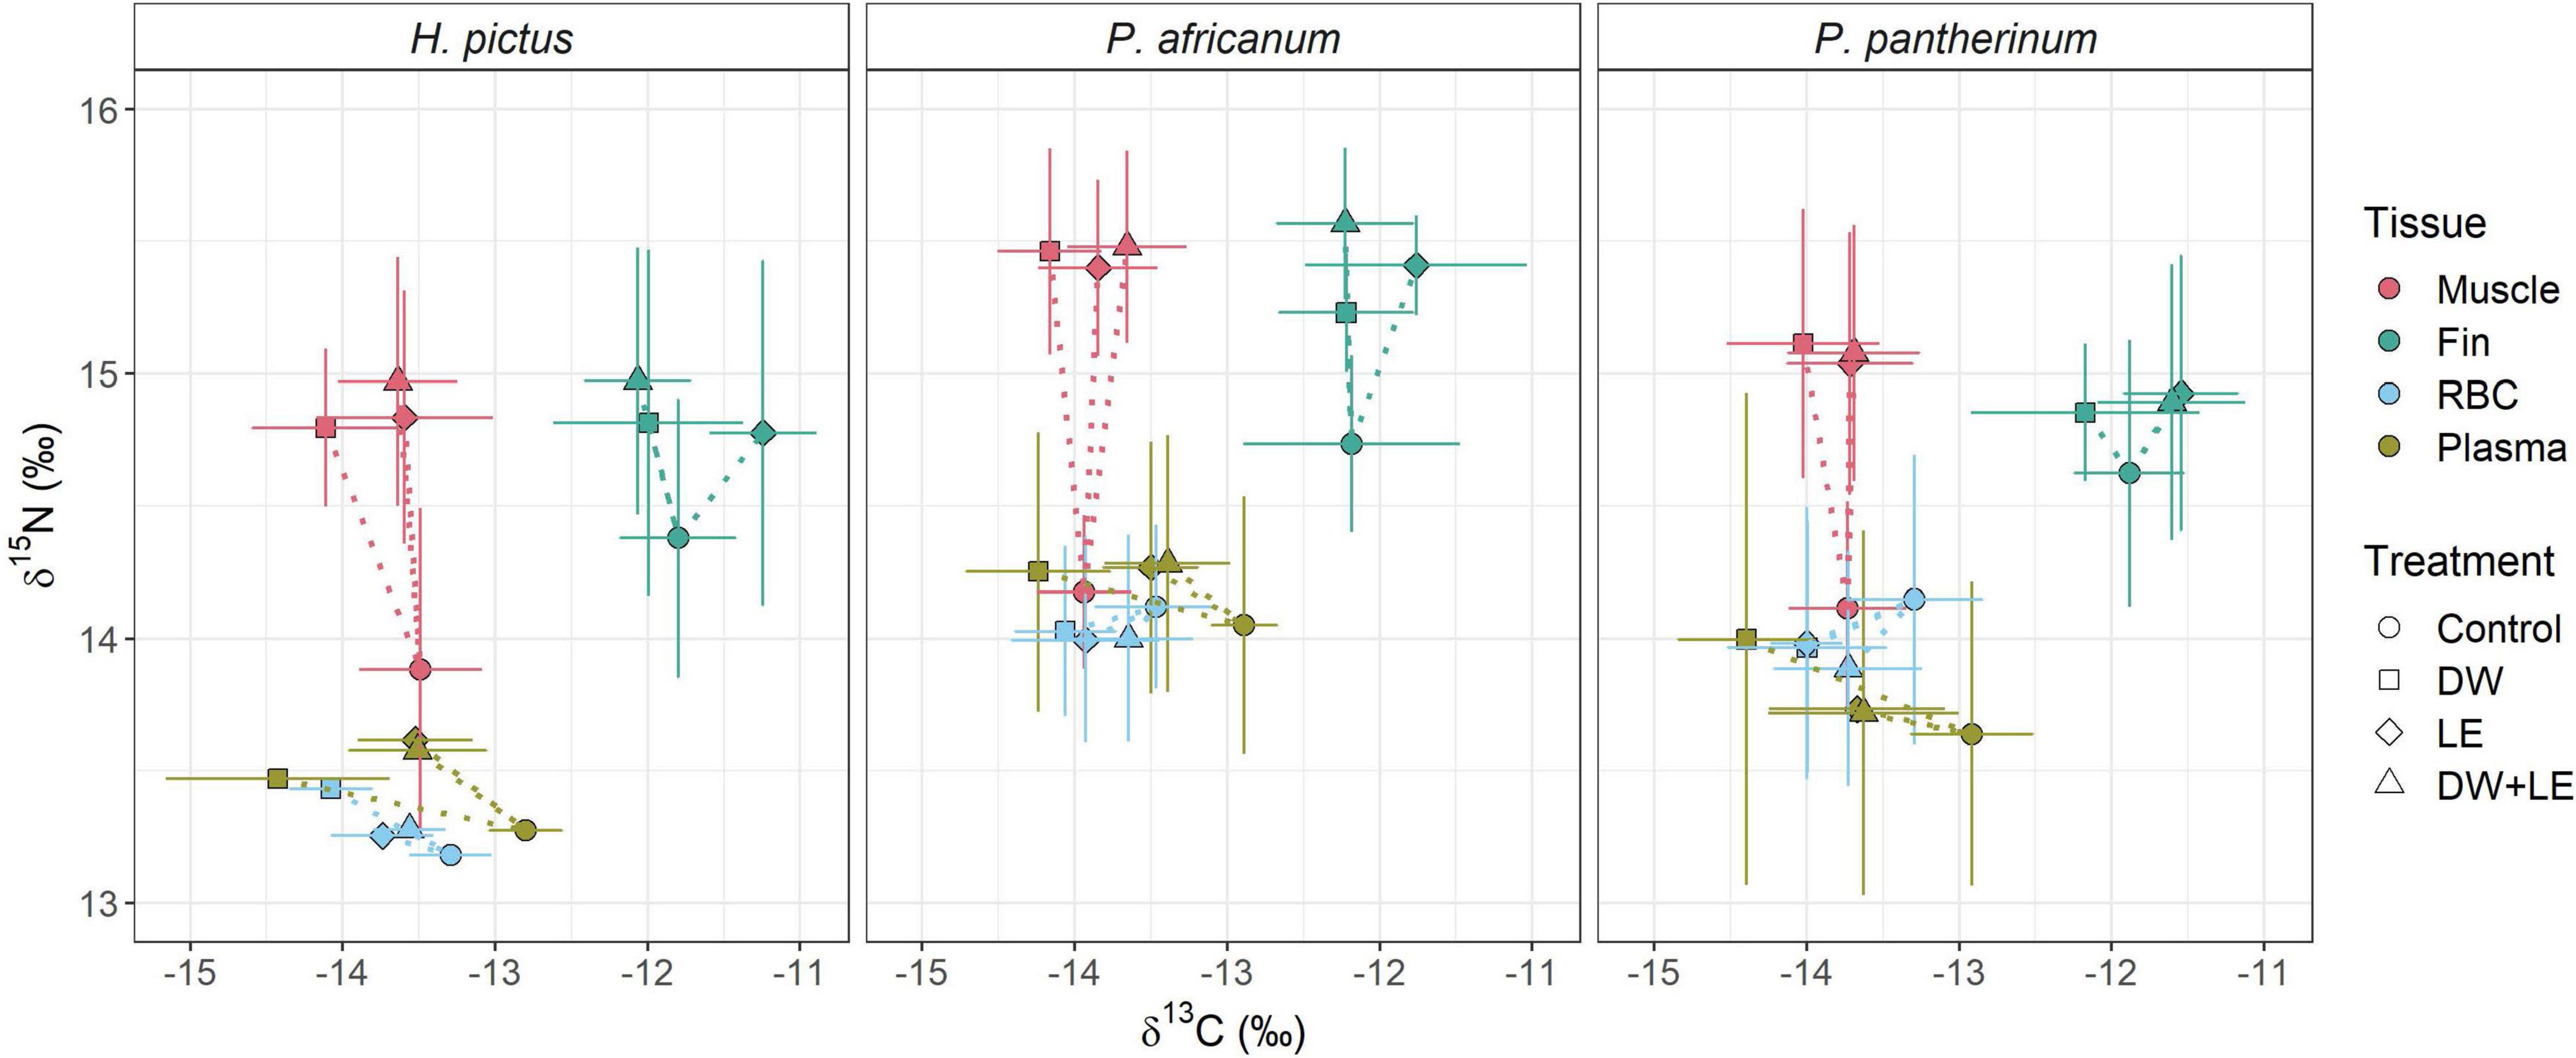
Figure 1. Mean (± standard deviation)δ13C and δ15N bulk isotope values of three different shark tissues and components sampled from three species and subjected to four different treatments. RBC, red blood cells; Control, no treatment; DW, deionized water rinse; LF, lipid extraction; DW+LE, water rinse followed by lipid extraction. Dotted lines indicate shifts in mean isotope values relative to the control.
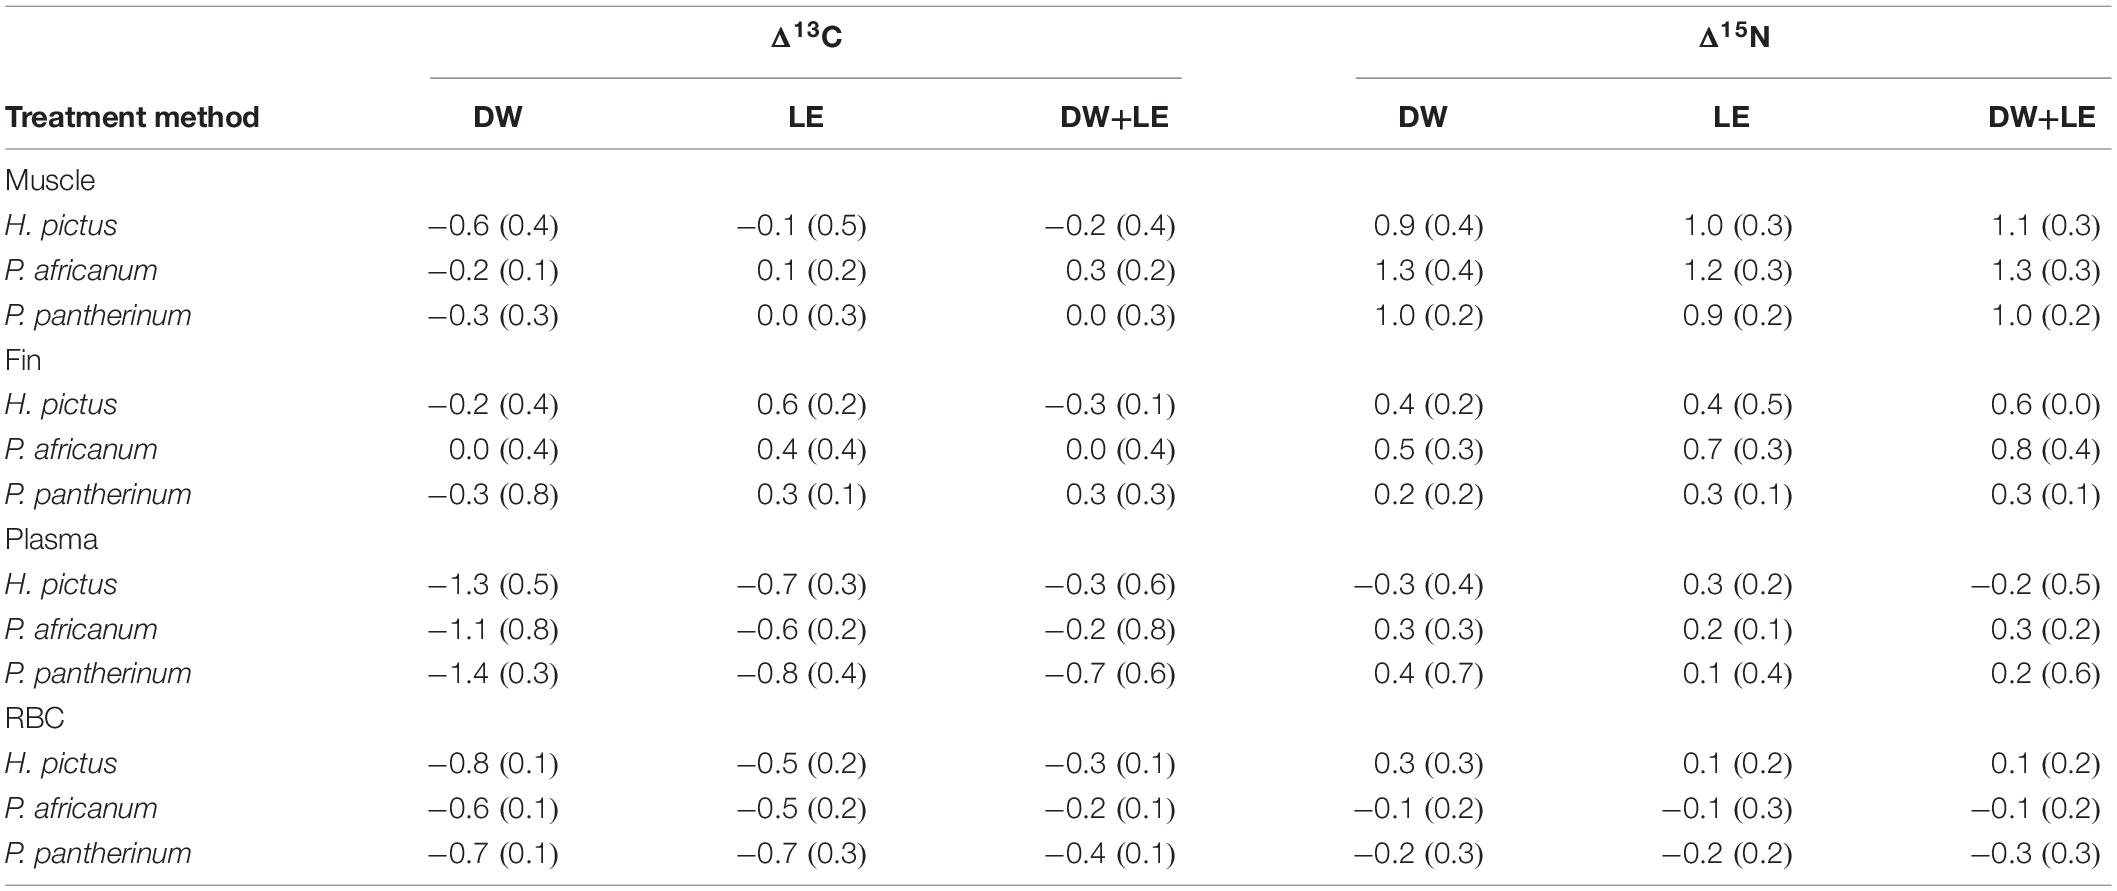
Table 1. Mean values (and standard deviations) of calculated Δ13C and Δ15N offsets (‰) (δcontrol–δtreatment) for each treatment method in muscle, fin, plasma, and red blood cell (RBC).
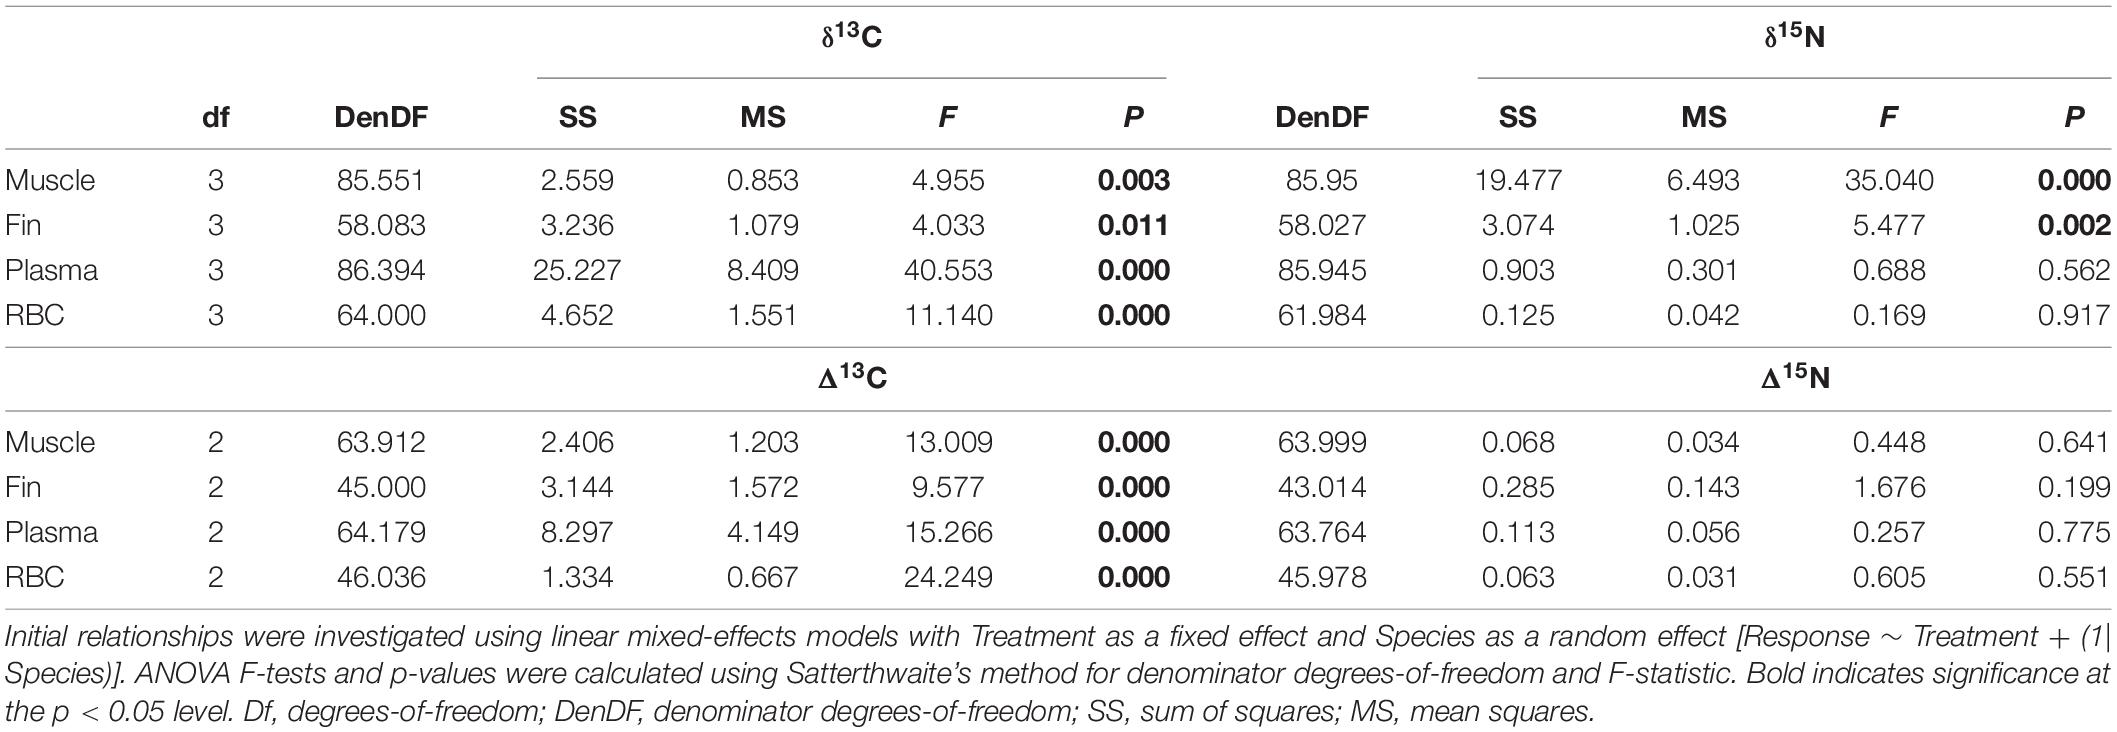
Table 2. Results of ANOVAs investigating treatment method effects on muscle, fin, plasma, and red blood cell (RBC) δ13C and δ15N ratios and Δ13C and Δ15N offsets (δcontrol–δtreatment).
Patterns in δ13C and δ15N values between tissues remained consistent with treatment method for individual sharks, but there was substantial variation in δ13C and δ15N values among individuals, likely arising from varying lipid and urea content (Figure 2). In muscle, DW displayed a negative change in δ13C values with LE and DW+LE not differing from the control values, whilst large shifts in δ15N were displayed between the control and all treatments, with LE and DW+LE showing similar effects among individuals (Figure 2). In fin, the effects of treatments on δ13C were consistent for H. pictus and P. pantherinum, however, P. africanum displayed higher individual variation with treatment method. δ15N values increased in fin for all treatments, with consistent variation among treatments (Figure 2). For plasma, DW produced the largest negative δ13C offsets with the most individual variation of any treatment method. δ15N value displayed consistent treatment effects among individuals with P. pantherinum displaying the largest individual variation for treatments on plasma (Figure 2). Plasma Δ15N offsets from all treatment methods across all species displayed high individual variation with a large range between the extreme values (Δ13C–2.6‰, Δ15N–2.8‰) (Figure 3). In RBC, δ13C values displayed small negative shifts across all treatments with little individual variation among all species. H. pictus displayed either no change or a small positive shift in δ15N values for all treatments, whilst P. africanum and P. pantherinum displayed small negative shifts in δ15N values (Figure 2). The offsets in RBC were less variable than plasma with the range being less than half of those in plasma (Δ13C–0.9‰, Δ15N–1.3‰) (Figure 3).
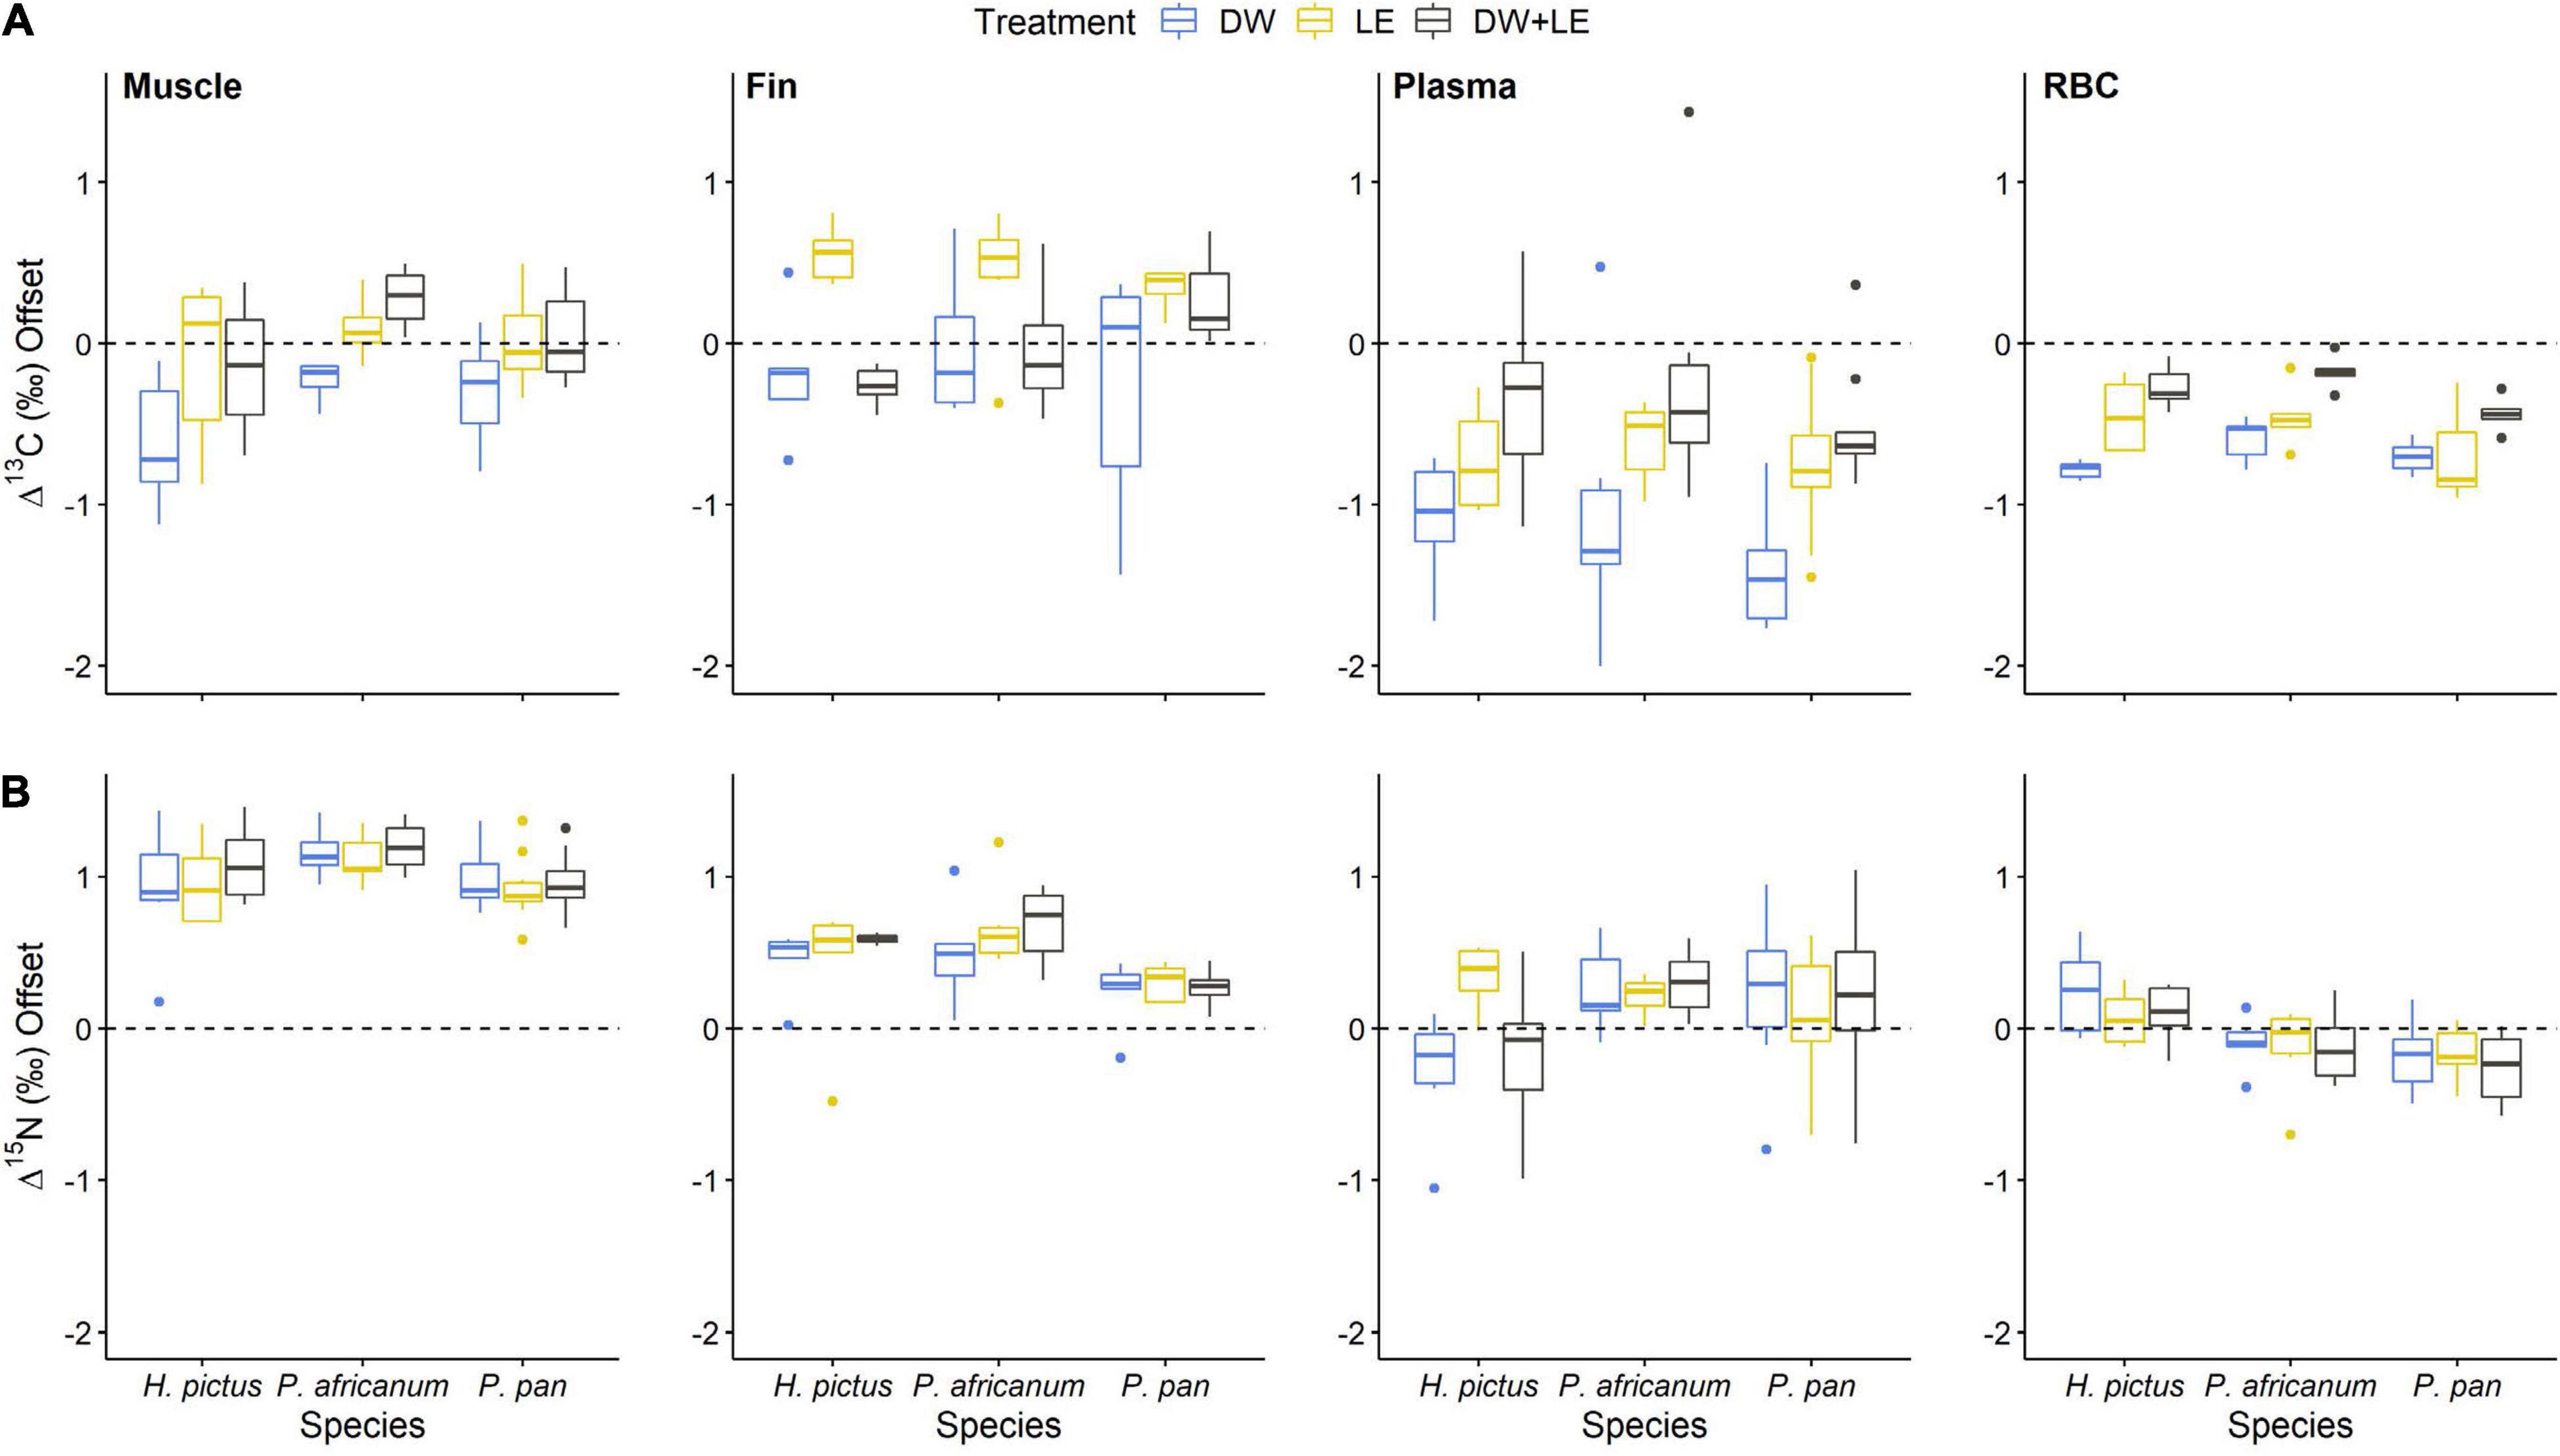
Figure 2. (A) Δ13C and (B) Δ13C offsets for all treatments in muscle, fin, plasma, and RBC across the three shark species. Single-colored points indicate offsets are outside of the grouped range. Boxes display median values (horizontal line) with upper and lower quartile ranges (upper and lower end of box), and maximum and minimum values (whiskers). P. pan, P. pantherinum.
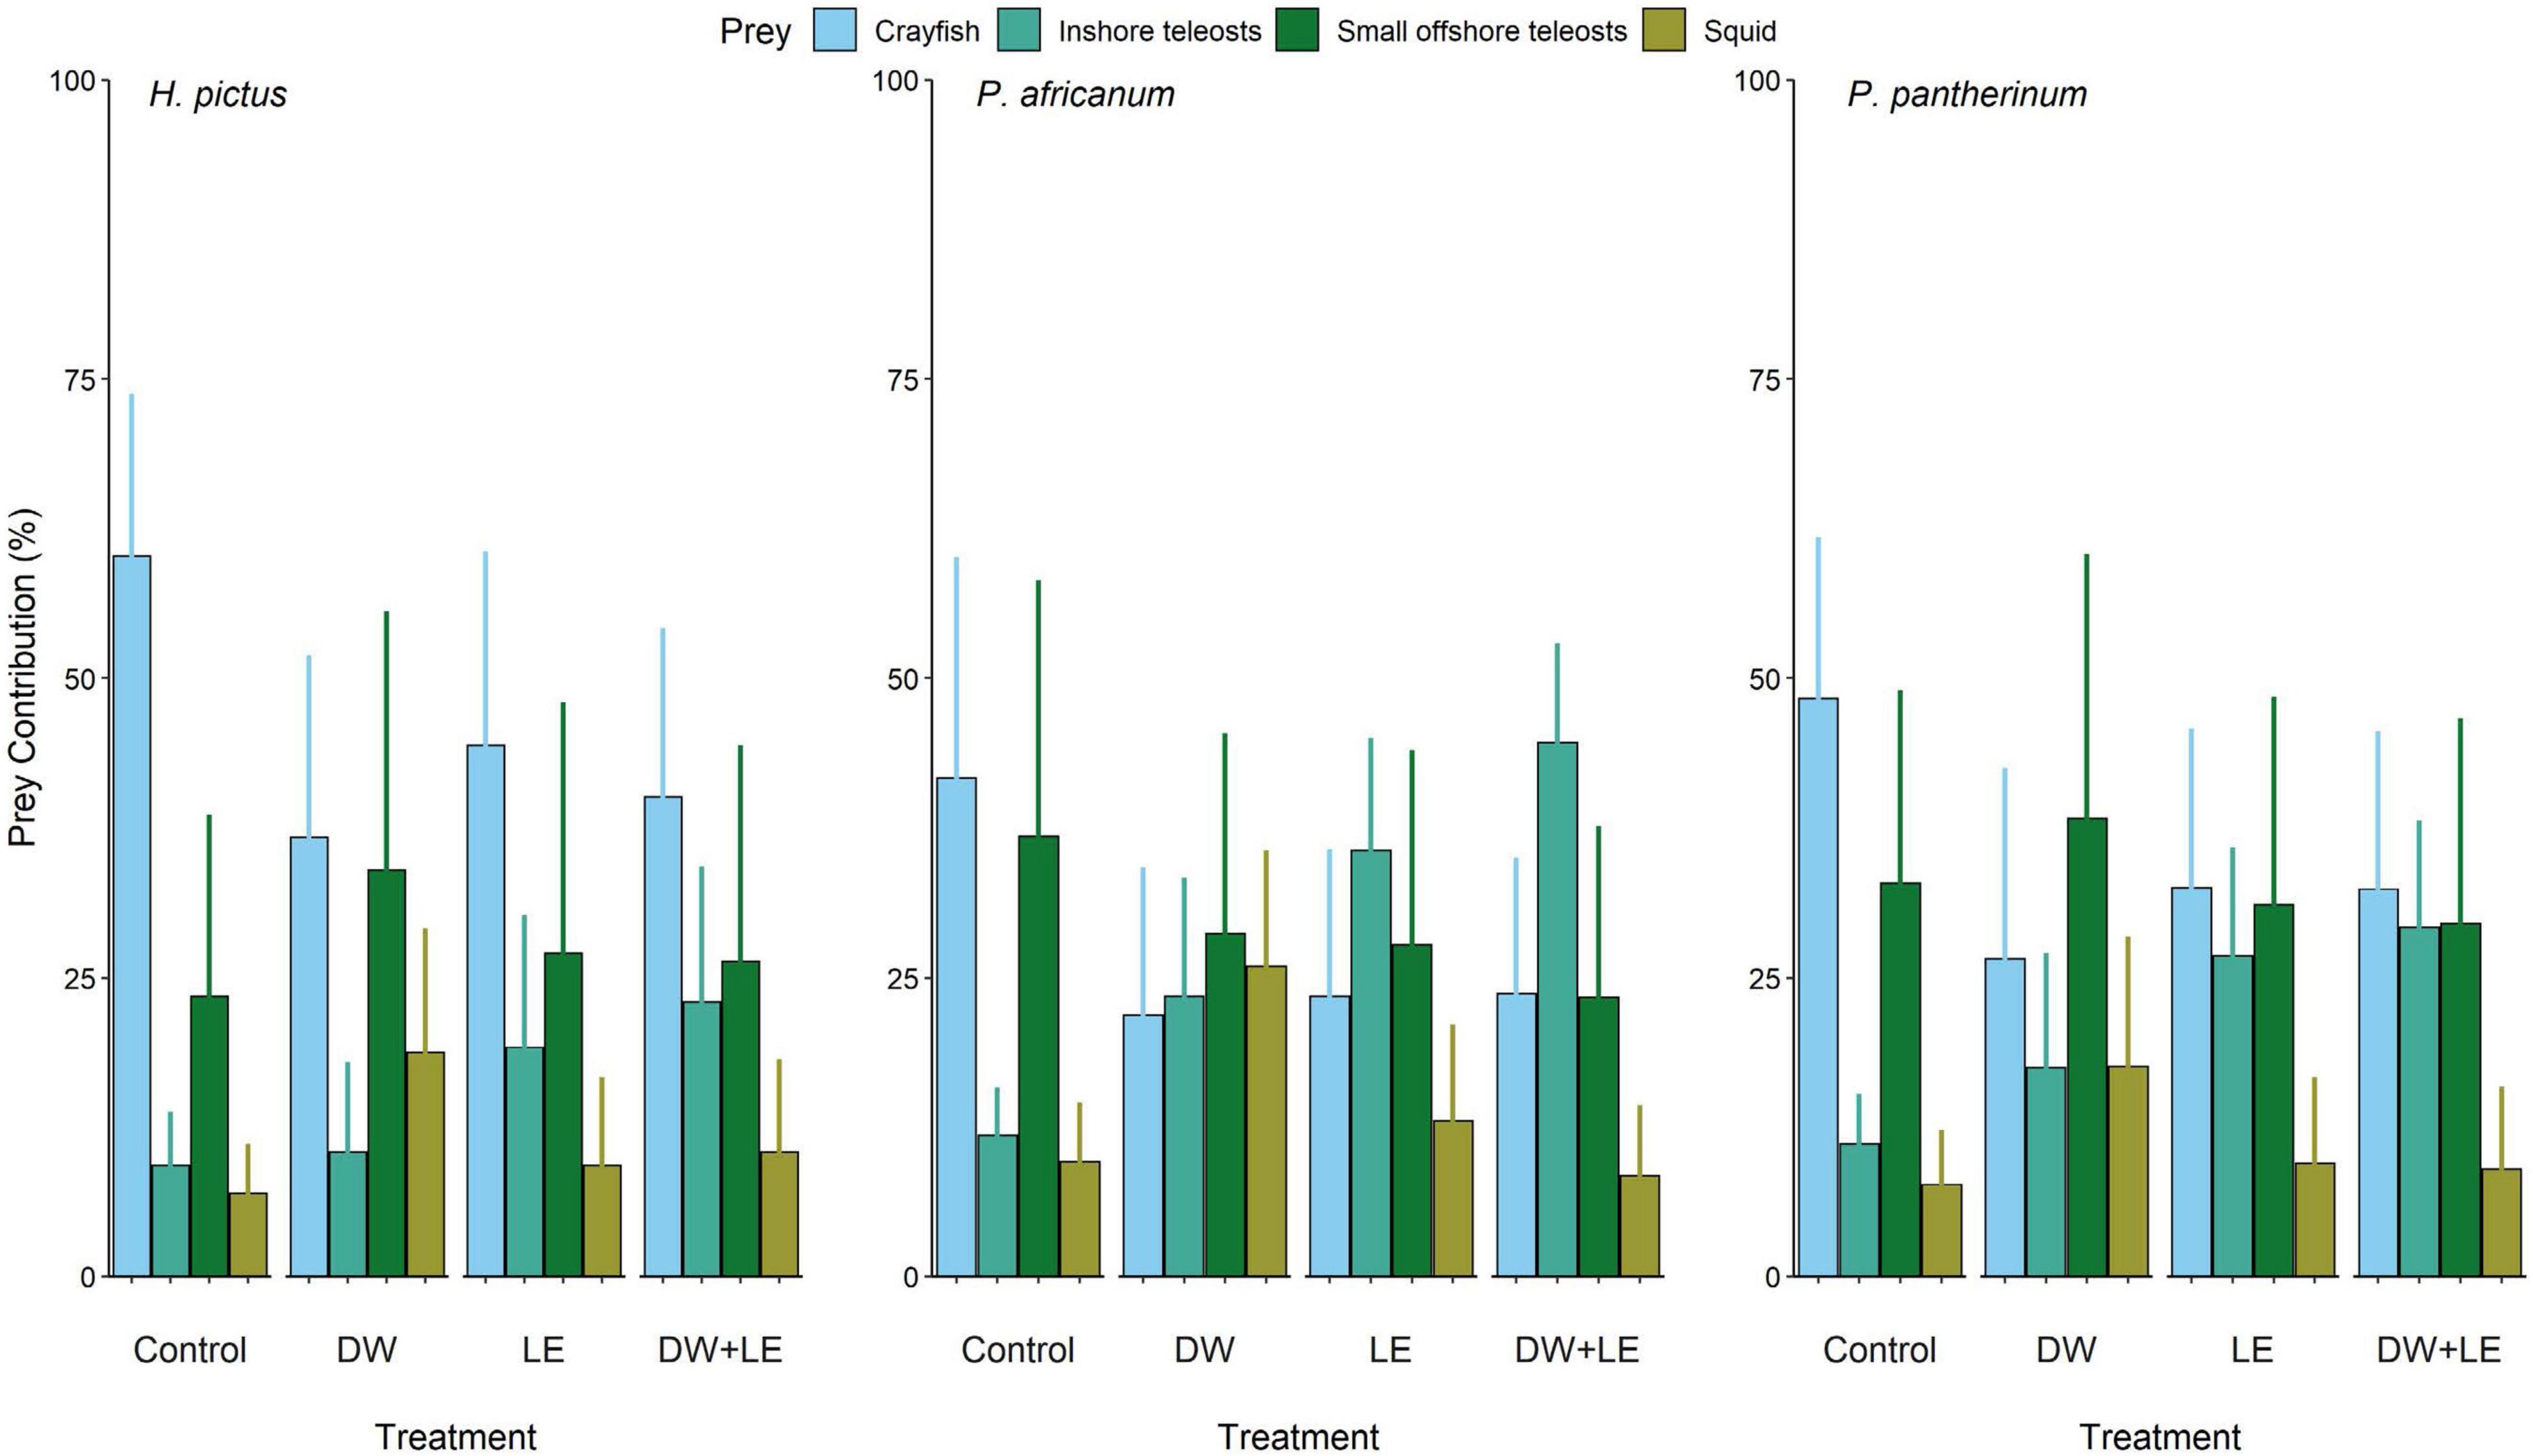
Figure 3. Prey contributions to each shark species for each treatment method estimated by Bayesian stable isotope mixing models. Bars are mean ± standard deviation derived from Bayesian credibility intervals. Diet tissue discrimination factors (DTDF) are non-lipid extracted, prey specific, DTDF from nursehound Scyliorhinus stellaris (Caut et al., 2013).
Bayesian Mixing Models
Prey contribution estimates differed significantly among treatment methods, regardless of the DTDF value used (Figure 3 and Supplementary Figure 1). The models using the nursehound DTDFs are presented herein (Figure 3), while the models using the other DTDFs are presented in Supplementary Figure 1. In each model for all DTDFs, both LE and DW+LE treatments displayed similar changes to contribution when compared to DW (Figure 3 and Supplementary Figure 1). All treatments changed the estimated diet contributions for all species, across all models, suggesting treatment choice requires as much consideration as applying the correct DTDF when using mixing models.
Mean contributions of the predominant prey group, crayfish, varied significantly among treatment methods for all three species (permutation test of independence, MaxT = 2.551, p = 0.038). In all cases the estimated contributions of crayfish to the diet were reduced in treated samples relative to the controls (H. pictus: control = 60.2%, treatments = 36.7–44.4%; P. africanum: control = 41.7%, treatments = 21.9–23.7%; P. pantherinum: control = 48.3%, treatments = 26.6–32.5%). As estimated crayfish contributions decreased, there was a significant increase in estimated mean contributions of inshore teleosts among treatments (permutation test of independence, MaxT = 2.244, p = 0.037). In all species, DW produced the smallest increase in estimates of inshore teleost contributions, followed by LE, and then DW+LE. Estimated contributions from small offshore teleosts showed no significant change with treatment compared to the control. H. pictus was the only species where all treatments increase small offshore teleost contribution, whilst all treatments increase contribution in P. africanum, LE and DW+LE also increase contribution in P. pantherinum but DW caused a decrease. Mean squid contribution was not significant different with treatment, however, squid contribution in both H. pictus and P. pantherinum, increased with all treatments when compared to the control; DW showed the largest increase, then LE, and then DW+LE (H. pictus: control = 5.8%, treatments = 6.6–20 %; P. pantherinum: control = 6.9%, treatments = 7.2–21.9%). In P. africanum, DW also displayed a large increase in estimated mean squid contributions, followed by a small increase with LE. Conversely, DW+LE resulted in a decrease in mean squid contributions compared to the control (P. africanum: control = 9.6%, treatments = 8.8–27.7%).
Discussion
In general, all three treatments (lipid extraction, water rinse, and both procedures together) caused small increases in δ13C and large increases in δ15N for both muscle and fin suggesting that DW+LE can be applied to theses tissue types to standardize and remove bias. In plasma the treatments produced large decreases in δ13C but little difference to mean δ15N values, although with large individual variation, potentially causing inaccurate values. Therefore, treatments and standardization are not recommended for plasma. Treatments on RBC displayed small decreases in δ13C and no significant effects on δ15N and more consistent variance among individuals, potentially suggesting that RBC could be standardized, although further research is required to do so.
Tissue stable isotope analyses offer considerable potential to enhance the understanding of elasmobranch trophic ecology but are dependent on the removal of known biases such as lipids and urea. Removal of these biases is essential for the accurate application of stable isotope data to statistical mixing models and allowing standardization for accurate comparisons of different elasmobranch populations or species, especially across distinct geographical regions with varying isotopic baselines (Bird et al., 2018; Madigan et al., 2021). Effects of tissue treatments on isotope offsets:
Muscle
Despite presumed low lipid levels, DW treatment of muscle led to a decrease in δ13C values in all species by up to 0.5‰, which might be due to the removal of urea (Carlisle et al., 2017) that is enriched in 13C relative to lipids (DeNiro and Epstein, 1977). However, in contrast, δ13C values of muscle treated with both LE and DW+LE were similar to the control δ13C value, suggesting that 13C-depleted compounds such as lipids are being removed and potentially countering the decrease in δ13C values caused by the removal of urea. All treatments in all species resulted in a large increase in muscle δ15N values (0.9–1.3‰) displaying the same range of values as a variety of other elasmobranch species (Burgess and Bennett, 2017; Marcus et al., 2017; Martin and Jaquemet, 2019) confirming previous findings that muscle needs to be treated for urea regardless of species and size (Kim and Koch, 2012; Li et al., 2016; Carlisle et al., 2017). However, LE had a similar effect on δ15N values as DW, suggesting that LE is removing the same amount of urea as DW. This conflicts with previous studies that found no effect of LE on δ15N (Burgess and Bennett, 2017; Carlisle et al., 2017) or a small positive shift (Hussey et al., 2010b; Martin and Jaquemet, 2019) but agrees with large increases in δ15N found by Logan and Lutcavage (2010) and Marcus et al. (2017). As LE and DW have the same effect on δ15N, but LE and DW+LE cause a more positive δ13C value relative to DW, this suggests that some lipid removal is taking place. This is more distinct in P. africanum, with LE+DW displaying a positive δ13C value compared to the control, suggesting a higher lipid content in this species compared to H. pictus and P. pantherinum. Therefore, to remove both urea and lipid bias in elasmobranch muscle tissue of any species, DW+LE is required.
Fin
In fin, LE was the only consistent treatment across all species, with an increase in Δ13C offsets for all three species suggesting consistent removal of lipids. DW displayed a similar trend of negative Δ13C offsets, suggesting the removal of urea but not lipids, whilst DW+LE offsets were closer to DW values but marginally higher, suggesting some removal of both urea and lipids. All treatments displayed positive Δ15N offsets across all species suggesting the removal of urea by all treatments. Δ15N offsets in fin were ≈40% of the Δ15N offsets observed in muscle. This aligns with the expected percentage of the fin tissue that is muscle, suggesting urea removal from the muscle component of the fin. Potential urea removal by LE on Δ15N offsets contradicts the positive Δ13C offsets produced. This could be caused by LE removing additional 13C-depleted compounds with no nitrogen content. However, the specific compounds removed by LE are unknown. For both slow turnover tissues, lipid and urea removal is required with DW+LE suggested as the best treatment for both muscle and fin. When considering which slow turnover tissue to use, muscle might be preferred due to the lower individual variation from treatments. The higher individual variation seen in fin compared to muscle could be due to fin samples containing varying quantities of multiple components (such as dermis, muscle, and cartilage). These individual differences may make fin unreliable for inter and intra-species comparisons; careful consideration is required when using elasmobranch fin tissue.
Plasma
In plasma, DW produced an approximate twofold negative shift in δ13C values compared to the other treatments in all species. The shift suggests DW is removing compounds that are 13C-enriched exacerbating their influence on the δ13C value. The large decreases in δ13C correlate with previous studies on elasmobranch plasma (Kim and Koch, 2012; Crook et al., 2019). As LE and DW+LE have an almost identical effect but a smaller shift in δ13C, this suggests that the LE component is potentially also removing lipids or other 13C-depleted compounds. The large negative shifts of DW on δ13C could be due to the removal of amino acids (Kim and Koch, 2012), as some are known to be 13C-enriched (Takizawa et al., 2020). Plasma δ15N values are extremely variable across the treatments, but they do display a general positive shift. Increases in δ15N have also been displayed in leopard sharks (Triakis semifasciata) (Kim and Koch, 2012), whereas two batoid species displayed decreases in δ15N (Crook et al., 2019). This might indicate that 15N-depleted urea is being removed from the plasma, but the removal of 15N-enriched amino acids is masking the effect of urea removal on the δ15N value. Low diet quality causes an increase in amino acid 15N-enrichment (McMahon and McCarthy, 2016) and prey availability, abundance and prey sources can all influence diet quality (Pratchett et al., 2004; Berumen et al., 2005; Hondorp et al., 2005). Urea concentrations are also known to fluctuate heavily in elasmobranch plasma depending on feeding quantity and time (Haywood, 1973; Wood et al., 2010). As mesopredators are opportunistic scavengers, they likely have large individual variation in diet quality, quantity and feeding time, which would influence amino acid 15N-enrichment and urea concentrations, potentially explaining the high variation observed in both Δ13C and Δ15N offsets in plasma.
Red Blood Cells
The treatment effects on RBC values follow a similar pattern to plasma, but with a smaller negative shift in the δ13C values and far less variation in δ15N value fluctuations. Kim and Koch (2012) previously displayed smaller negative shifts in RBC, but with small increases in δ15N. The lower variance may be caused by lower concentrations of urea in red blood cells (Murdaugh et al., 1964) and a much lower effect of amino acid removal by DW when compared to plasma [absolute mole percentage differences of 8.8% in RBC, 35.7% in plasma (Kim and Koch, 2012)]. The lower variability among individual sharks and consistent effect of all treatments suggest that RBC can undergo lipid and urea removal, allowing standardized comparisons between long-term (muscle) and short-term (RBC) tissues for bulk isotope analysis. However, further research is required to determine the specific compounds DW+LE is removing from RBC as well as the effect on other elasmobranch species with different feeding ecology traits to determine if the displayed low individual variability of DW+LE on RBC applies to other species. Whilst plasma does have a shorter turnover rate than RBC (32-day half-life of plasma compared with a 60-day half-life of RBC; (Kim and Koch, 2012) and provides a smaller dietary window, the higher variability and large amino acid removal from the use of current pre-treatment methods may not be entirely effective. This indicates that plasma may be unsuitable for SIA tissue comparison studies due to the inability to remove biases without having a detrimental impact on isotope values. Despite this, plasma is recommended for compound-specific isotope analysis (CSIA), a higher resolution method that negates the impacts of lipid and urea bias (Larsen et al., 2009, 2013). Further research is required to define a method that can accurately treat plasma without the removal of free-forming amino acids.
Species Differences
The effects of the different treatments across the three species were consistent with more variation seen within individuals, among species. However, small differences in the variation and range of Δ13C and Δ15N offsets revealed some differences between species; P. africanum displayed the most positive Δ13C offset changes suggesting a larger amount of lipids being removed compared to the other species, which could be due to their larger body size. P. pantherinum exhibited the greatest variability in offsets across all tissues and the largest standard deviation ranges in the corrected isotope values, suggesting high individual variability of isotope biasing compounds compared to the other two species, potentially signifying a more varied feeding ecology among individuals. P. africanum generally displayed the largest Δ15N offsets, suggesting higher urea content compared to the other species. The large individual variation of known biases must be taken into consideration when carrying out elasmobranch isotope studies and further research investigating lipid and urea concentrations of different tissues would be useful to determine if there is a correlation between body size and lipid or urea concentration.
Ecological Implications
With the increased use of ecological models to examine aspects of trophic ecology (e.g., diet composition, provisioning, and niche partitioning) based on isotope data gathered from tissues subjected to a variety of treatments (Navarro et al., 2014; Abrantes et al., 2018; Reum et al., 2020), it is important to understand what effects pre-treatment choice have on model outputs. This is imperative where model estimates may be used to suggest specific management strategies. Inaccurate model outputs from erroneous data input could have significant consequences for the study species, but also other species interconnected in the retrospective food webs.
The Bayesian mixing models presented here clearly demonstrate that variations in δ13C and δ15N values arising from different pre-treatment methods can drastically alter the model outputs and dominant prey contribution estimates. Across all species, crayfish contributions for the control were substantially greater than for any treatment, but different treatments resulted in different prey contribution estimates. For example, DW had a noticeable effect on the estimated prey contributions when compared with LE and DW+LE, increasing the squid contribution estimates by ∼ 9.9–16.4% compared to the other treatments (LE and DW+LE: −1.2 to 3.5%). For inshore teleosts, DW+LE produced the biggest increase in contribution estimates across all species, closely followed by LE, and then DW. Whilst all three treatments produced large changes in prey contribution estimates compared to the control, LE and DW+LE values were more closely related to each other than with DW. Often the effect of treatments on prey contribution estimates also varied among species. For example, in offshore teleosts, DW caused an increase in prey contribution estimates for H. pictus and P. pantherinum, but a decrease for P. africanum. This supposed increase in feeding on offshore teleosts indicated by DW is unlikely due to the small inshore range of these three species.
Based on the control results, around 80% or more of each species’ diet would come from crayfish and offshore teleosts (H. pictus: 60.2 + 23.5%, P. africanum: 41.7 + 36.8%, P. pantherinum: 48.3 + 32.9%) suggesting that they are specialized predators primarily hunting crayfish with a small preference for offshore teleosts. However, based on the DW+LE results, around 90% of their diets come from a more even contribution of crayfish, inshore and offshore teleosts (H. pictus: 40.1 + 23.0 + 26.4%, P. africanum: 23.7 + 44.6 + 23.4%, P. pantherinum: 32.4 + 29.2 + 29.5%), suggesting they are opportunistic predators. This demonstrates how differences in prey contribution estimates can influence our perception of species trophic ecology and might lead to incorrect management strategies. For example, if the three shark species were facing population declines, it might be inferred that this was linked to reduced or declining prey populations. Based on the model results using the control values, crayfish were the sharks’ largest diet contribution and would be the primary species on which to focus management (e.g., by controlling or limiting crayfish catches). However, if the DW+LE model results were followed instead, where the crayfish diet percentage is much lower and prey contribution estimates are more evenly spread across various prey groups, this would require alternative management approaches with a different suite of economic and ecosystem impacts.
Differences from using treated and non-treated sample data in models may also influence our perception of behavior. Abrantes et al. (2018) reported no significant evidence of provisioned food being incorporated into the diets of a bull shark population in Viti Levu, Fiji (only 1–9% dietary contribution), despite 200 kg of tuna heads being fed to sharks five times per week, with up to 75 individual sharks present per dive. However, as the muscle tissue in their study was not pre-treated before modeling, their mixing model outputs may have been influenced by urea and/or lipid biases, giving inaccurate estimates of the impact of provisioning on this shark population. These findings, which imply little or no impact of provisioning on the shark population, could also have wider ecological implications. For example, if provisioning was suddenly stopped, but the diet contributions were underreported, the sharks would lose a substantial component of their diet with potential negative consequences for their populations. Finally, aside from careful consideration of the consumer data in mixing models, known biases to the isotope values of the prey sources should also be taken into account as lipid extracted and non-lipid extracted prey tissues can have different DTDF values (Hussey et al., 2010a), affecting mixing model results. Further research is required to determine if potential biases in prey items such as lipid, urea or carbonate should be removed and how treated and non-treated prey values may impact mixing models results.
Conclusion
Most stable isotope studies of elasmobranchs rely on tissue C:N values to determine if lipid or urea extraction is required. We reiterate Carlisle et al.’s (2017) warning against this approach and highlight the need for a standardized treatment method across tissues and species regardless of C:N ratios. Our analysis suggests that combination treatment with DW+LE is recommended for muscle and fin tissue, whilst further research is required to find an alternative treatment for plasma and to validate the use of DW+LE in RBC. Tissue treatment is an important consideration when making inferences from Bayesian mixing models, and the isotope effect of the chosen treatment should be made clear in the context of its potential to influence model outputs. The potential variation in mixing model diet estimates resulting from treatment choice that we have demonstrated strongly suggests a need to standardize tissue treatments across studies that use stable isotopes to explore the trophic ecology of elasmobranchs.
Data Availability Statement
The original contributions presented in the study are included in the article/Supplementary Material, further inquiries can be directed to the corresponding author/s.
Ethics Statement
The animal study was reviewed and approved by the South African Department of Agriculture, Forestry and Fisheries: Branch Fisheries Management and Department of Environmental Affairs: Branch Oceans and Coasts.
Author Contributions
JB-W and TW designed the study. JB-W collected the samples and wrote the initial draft. JB-W and RM processed the samples. JB-W and CS analyzed the data. CS, AW, and TW contributed to drafting the manuscript. All authors contributed to revisions of the manuscript and approved the final submitted version.
Funding
Consumables and boat usage were partially funded by the South African Shark Conservancy. JB-W, CS, and AW were supported by funding from the Hong Kong Branch of the Southern Marine Science and Engineering Guangdong Laboratory (Guangzhou) (SMSEGL20SC01) during data analysis and manuscript preparation.
Conflict of Interest
The authors declare that the research was conducted in the absence of any commercial or financial relationships that could be construed as a potential conflict of interest.
Publisher’s Note
All claims expressed in this article are solely those of the authors and do not necessarily represent those of their affiliated organizations, or those of the publisher, the editors and the reviewers. Any product that may be evaluated in this article, or claim that may be made by its manufacturer, is not guaranteed or endorsed by the publisher.
Acknowledgments
We thank to the South African Shark Conservancy Director, Meaghen McCord, Operations manager, Natalia Drobniewska, Program Manager Guy Paulet, and all interns and volunteers for their help and assistance during the fieldwork.
Supplementary Material
The Supplementary Material for this article can be found online at: https://www.frontiersin.org/articles/10.3389/fmars.2022.821478/full#supplementary-material
References
Abrantes, K. G., Brunnschweiler, J. M., and Barnett, A. (2018). You are what you eat: examining the effects of provisioning tourism on shark diets. Biol. Conserv. 224, 300–308. doi: 10.1016/j.biocon.2018.05.021
Albo-Puigserver, M., Navarro, J., Coll, M., Aguzzi, J., Cardona, L., and Sáez-Liante, R. (2015). Feeding ecology and trophic position of three sympatric demersal chondrichthyans in the northwestern Mediterranean. Mar. Ecol. Prog. Ser. 524, 255–268. doi: 10.3354/meps11188
Ballantyne, J. S. (1997). Jaws: the inside story. the metabolism of elasmobranch fishes. Comp. Biochem. Physiol. B Biochem. Mol. Biol. 118, 703–742. doi: 10.1016/S0305-0491(97)00272-1
Bates, D., Mächler, M., Bolker, B., and Walker, S. (2014). Fitting Linear Mixed-Effects Models using lme4. J. Stat. Softw. 67, 1–48.
Bedford, J. J. (1983). The composition of the fluid compartments of two chondrichthyans, Callorhyncus millii and Squalus acanthias. Comp. Biochem. Physiol. A Physiol. 76, 75–80. doi: 10.1016/0300-9629(83)90295-5
Benavides, M. T., Horn, R. L., Feldheim, K. A., Shivji, M. S., Clarke, S. C., Wintner, S., et al. (2011). Global phylogeography of the dusky shark Carcharhinus obscurus: implications for fisheries management and monitoring the shark fin trade. Endanger. Species Res. 14, 13–22. doi: 10.3354/esr00337
Berumen, M. L., Pratchett, M. S., and McCormick, M. I. (2005). Within-reef differences in diet and body condition of coral-feeding butterflyfishes (Chaetodontidae). Mar. Ecol. Prog. Ser. 287, 217–227. doi: 10.3354/meps287217
Bird, C. S., Veríssimo, A., Magozzi, S., Abrantes, K. G., Aguilar, A., Al-Reasi, H., et al. (2018). A global perspective on the trophic geography of sharks. Nat. Ecol. Evol. 2, 299–305. doi: 10.1038/s41559-017-0432-z
Boecklen, W. J., Yarnes, C. T., Cook, B. A., and James, A. C. (2011). On the use of stable isotopes in trophic ecology. Annu. Rev. Ecol. Evol. Syst. 42, 411–440. doi: 10.1146/annurev-ecolsys-102209-144726
Bone, Q., and Roberts, B. L. (1969). The density of elasmobranchs. J. Mar. Biol. Assoc. U.K. 49, 913–937. doi: 10.1017/S0025315400038017
Burgess, K. B., and Bennett, M. B. (2017). Effects of ethanol storage and lipid and urea extraction on δ15 N and δ13 C isotope ratios in a benthic elasmobranch, the bluespotted maskray Neotrygon kuhlii. J. Fish Biol. 90, 417–423. doi: 10.1111/jfb.13164
Carlisle, A. B., Litvin, S. Y., Madigan, D. J., Lyons, K., Bigman, J. S., Ibarra, M., et al. (2017). Interactive effects of urea and lipid content confound stable isotope analysis in elasmobranch fishes. Can. J. Fish. Aquat. Sci. 74, 419–428. doi: 10.1139/cjfas-2015-0584
Caut, S., Jowers, M. J., Michel, L., Lepoint, G., and Fisk, A. T. (2013). Diet- and tissue-specific incorporation of isotopes in the shark Scyliorhinus stellaris, a North Sea mesopredator. Mar. Ecol. Prog. Ser. 492, 185–198. doi: 10.3354/meps10478
Churchill, D. A., Heithaus, M. R., and Dean Grubbs, R. (2015). Effects of lipid and urea extraction on δ15N values of deep-sea sharks and hagfish: Can mathematical correction factors be generated? Deep Sea Res. 2 Top. Stud. Oceanogr. 115, 103–108. doi: 10.1016/j.dsr2.2014.12.013
Connan, M., Hall, G., and Smale, M. (2019). Effects of pre-treatments on bulk stable isotope ratios in fish samples: a cautionary note for studies comparisons. Rapid Commun. Mass Spectrom. 33, 291–302. doi: 10.1002/rcm.8344
Crook, K. A., Barnett, A., Sheaves, M., and Abrantes, K. (2019). Effects of lipid and urea extraction on stable isotope values (δ 13 C and δ 15 N) of two batoids: a call for more species-specific investigations. Limnol. Oceanogr. Methods 17, 565–574. doi: 10.1002/lom3.10333
De Necker, L. (2017). The Trophic Dynamics of the Broadnose Sevengill Shark (Notorynchus cepedianus) in False Bay, South Africa, using Multiple Tissue Stable Isotope Analysis. Ph.D. thesis. Cape Town: University of Cape Town.
DeNiro, M. J., and Epstein, S. (1977). Mechanism of carbon isotope fractionation associated with lipid synthesis. Science 197, 261–263. doi: 10.1126/science.327543
Deniro, M. J., and Epstein, S. (1981). Influence of diet on the distribution of nitrogen isotopes in animals. Geochim. Cosmochim. Acta 45, 341–351. doi: 10.1016/0016-7037(81)90244-1
Estrada, J. A., Rice, A. N., Natanson, L. J., and Skomal, G. B. (2006). Use of isotopic analysis of vertebrae in reconstructing ontogenetic feeding ecology in white sharks. Ecology 87, 829–834. doi: 10.1890/0012-9658200687[829:uoiaov]2.0.co;2
Estupiñán-Montaño, C., Tamburin, E., and Delgado-Huertas, A. (2021). Stable isotope evidence for movements of hammerhead sharks Sphyrna lewini, connecting two natural protected areas in the Colombian Pacific. Mar. Biodivers. 51:74. doi: 10.1007/s12526-021-01215-7
Fagan, K.-A., Koops, M. A., Arts, M. T., and Power, M. (2011). Assessing the utility of C:N ratios for predicting lipid content in fishes. Can. J. Fish. Aquat. Sci. 68, 374–385. doi: 10.1139/f10-119
Ferreira, L. C., Thums, M., Heithaus, M. R., Barnett, A., Abrantes, K. G., Holmes, B. J., et al. (2017). The trophic role of a large marine predator, the tiger shark Galeocerdo cuvier. Sci. Rep. 7:7641. doi: 10.1038/s41598-017-07751-2
Fisk, A. T., Tittlemier, S. A., Pranschke, J. L., and Norstrom, R. J. (2002). Using anthropogenic contaminants and stable isotopes to assess the feeding ecology of Greenland sharks. Ecology 83, 2162–2172.
Folch, J., Lees, M., and Sloane Stanley, G. H. (1957). A simple method for the isolation and purification of total lipides from animal tissues. J. Biol. Chem. 226, 497–509.
Gannes, L. Z., O’Brien, D. M., and del Rio, C. M. (1997). Stable isotopes in animal ecology: assumptions, caveats, and a call for more laboratory experiments. Ecology 78, 1271–1276.
Hamlett, W. C. (1999). Sharks, Skates, and Rays: The Biology of Elasmobranch Fishes. Baltimore, MD: Johns Hopkins University Press.
Haywood, G. P. (1973). Hypo-osmotic regulation coupled with reduced metabolic urea in the dogfish Poroderma africanum: an analysis of serum osmolarity, chloride, and urea. Mar. Biol. 23, 121–127. doi: 10.1007/BF00389169
Heithaus, M. R., Vaudo, J. J., Kreicker, S., Layman, C. A., Krützen, M., Burkholder, D. A., et al. (2013). Apparent resource partitioning and trophic structure of large-bodied marine predators in a relatively pristine seagrass ecosystem. Mar. Ecol. Prog. Ser. 481, 225–237. doi: 10.3354/meps10235
Hondorp, D. W., Pothoven, S. A., and Brandt, S. B. (2005). Influence of diporeia density on diet composition, relative abundance, and energy density of planktivorous fishes in southeast Lake Michigan. Trans. Am. Fish. Soc. 134, 588–601. doi: 10.1577/T04-107.1
Hothorn, T., Bretz, F., and Westfall, P. (2008). Simultaneous inference in general parametric models. Biom. J. 50, 346–363. doi: 10.1002/bimj.200810425
Hussey, N. E., Brush, J., McCarthy, I. D., and Fisk, A. T. (2010a). δ15N and δ13C diet–tissue discrimination factors for large sharks under semi-controlled conditions. Comp. Biochem. Physiol. A Mol. Integr. Physiol. 155, 445–453. doi: 10.1016/j.cbpa.2009.09.023
Hussey, N. E., MacNeil, M. A., and Fisk, A. T. (2010b). The requirement for accurate diet-tissue discrimination factors for interpreting stable isotopes in sharks. Hydrobiologia 654, 1–5. doi: 10.1007/s10750-010-0361-1
Hussey, N. E., Chapman, D. D., Donnelly, E., Abercrombie, D. L., and Fisk, A. T. (2011). Fin-icky samples: an assessment of shark fin as a source material for stable isotope analysis. Limnol. Oceanogr. Methods 9, 524–532. doi: 10.4319/lom.2011.9.524
Hussey, N. E., MacNeil, M. A., Olin, J. A., McMeans, B. C., Kinney, M. J., Chapman, D. D., et al. (2012a). Stable isotopes and elasmobranchs: tissue types, methods, applications and assumptions. J. Fish Biol. 80, 1449–1484. doi: 10.1111/j.1095-8649.2012.03251.x
Hussey, N. E., Olin, J. A., Kinney, M. J., McMeans, B. C., and Fisk, A. T. (2012b). Lipid extraction effects on stable isotope values (δ13C and δ15N) of elasmobranch muscle tissue. J. Exp. Mar. Bio. Ecol. 43, 7–15. doi: 10.1016/j.jembe.2012.07.012
Hussey, N. E., MacNeil, M. A., Siple, M. C., Popp, B. N., Dudley, S. F. J., and Fisk, A. T. (2015). Expanded trophic complexity among large sharks. Food Webs 4, 1–7. doi: 10.1016/j.fooweb.2015.04.002
Kim, S. L., and Koch, P. L. (2012). Methods to collect, preserve, and prepare elasmobranch tissues for stable isotope analysis. Environ. Biol. Fishes 95, 53–63. doi: 10.1007/s10641-011-9860-9
Kiszka, J. J., Aubail, A., Hussey, N. E., Heithaus, M. R., Caurant, F., and Bustamante, P. (2015). Plasticity of trophic interactions among sharks from the oceanic south-western Indian Ocean revealed by stable isotope and mercury analyses. Deep Sea Res. Part I 96, 49–58. doi: 10.1016/j.dsr.2014.11.006
Kuznetsova, A., Brockhoff, P. B., and Christensen, R. H. B. (2017). lmerTest package: tests in linear mixed effects models. J. Stat. Softw. 82, 1–26.
Larsen, T., Taylor, D. L., Leigh, M. B., and O’Brien, D. M. (2009). Stable isotope fingerprinting: a novel method for identifying plant, fungal, or bacterial origins of amino acids. Ecology 90, 3526–3535. doi: 10.1890/08-1695.1
Larsen, T., Ventura, M., Andersen, N., O’Brien, D. M., Piatkowski, U., and McCarthy, M. D. (2013). Tracing carbon sources through aquatic and terrestrial food webs using amino acid stable isotope fingerprinting. PLoS One 8:e73441. doi: 10.1371/journal.pone.0073441
Li, Y., Zhang, Y., Hussey, N. E., and Dai, X. (2016). Urea and lipid extraction treatment effects on δ(15)N and δ(13)C values in pelagic sharks. Rapid Commun. Mass Spectrom. 30, 1–8. doi: 10.1002/rcm.7396
Logan, J. M., and Lutcavage, M. E. (2010). Stable isotope dynamics in elasmobranch fishes. Hydrobiologia 644, 231–244. doi: 10.1007/s10750-010-0120-3
MacNeil, M. A., Drouillard, K. G., and Fisk, A. T. (2006). Variable uptake and elimination of stable nitrogen isotopes between tissues in fish. Can. J. Fish. Aquat. Sci. 63, 345–353. doi: 10.1139/f05-219
Madigan, D. J., Brooks, E. J., Bond, M. E., Gelsleichter, J., Howey, L. A., Abercrombie, D. L., et al. (2015). Diet shift and site-fidelity of oceanic whitetip sharks Carcharhinus longimanus along the Great Bahama Bank. Mar. Ecol. Prog. Ser. 529, 185–197. doi: 10.3354/meps11302
Madigan, D. J., Shipley, O. N., Carlisle, A. B., Dewar, H., Snodgrass, O. E., and Hussey, N. E. (2021). Isotopic tracers suggest limited trans-oceanic movements and regional residency in north pacific blue sharks (Prionace glauca). Front. Mar. Sci. 8:489. doi: 10.3389/fmars.2021.653606
Marcus, L., Virtue, P., Nichols, P. D., Meekan, M. G., and Pethybridge, H. (2017). Effects of sample treatment on the analysis of stable isotopes of carbon and nitrogen in zooplankton, micronekton and a filter-feeding shark. Mar. Biol. 164:124. doi: 10.1007/s00227-017-3153-6
Martin, U. M., and Jaquemet, S. (2019). Effects of urea and lipid removal from Carcharhinus leucas and Galeocerdo cuvier white muscle on carbon and nitrogen stable isotope ratios. West. Indian Ocean J. Mar. Sci. 18, 47–56. doi: 10.4314/wiojms.v18i1
Matich, P., and Heithaus, M. R. (2014). Multi-tissue stable isotope analysis and acoustic telemetry reveal seasonal variability in the trophic interactions of juvenile bull sharks in a coastal estuary. J. Anim. Ecol. 83, 199–213. doi: 10.1111/1365-2656.12106
Matich, P., Kiszka, J. J., Heithaus, M. R., Mourier, J., and Planes, S. (2015). Short-term shifts of stable isotope (δ13C, δ15N) values in juvenile sharks within nursery areas suggest rapid shifts in energy pathways. J. Exp. Mar. Biol. Ecol. 465, 83–91. doi: 10.1016/j.jembe.2015.01.012
McCutchan, J. H. Jr., Lewis, W. M. Jr., Kendall, C., and McGrath, C. C. (2003). Variation in trophic shift for stable isotope ratios of carbon, nitrogen, and sulfur. Oikos 102, 378–390. doi: 10.1034/j.1600-0706.2003.12098.x
McMahon, K. W., and McCarthy, M. D. (2016). Embracing variability in amino acid δ15N fractionation: mechanisms, implications, and applications for trophic ecology. Ecosphere 7:e01511. doi: 10.1002/ecs2.1511
McMeans, B. C., Olin, J. A., and Benz, G. W. (2009). Stable-isotope comparisons between embryos and mothers of a placentatrophic shark species. J. Fish Biol. 75, 2464–2474. doi: 10.1111/j.1095-8649.2009.02402.x
Meyer, L., Fox, A., and Huveneers, C. (2018). Simple biopsy modification to collect muscle samples from free-swimming sharks. Biol. Conserv. 228, 142–147. doi: 10.1016/j.biocon.2018.10.024
Munroe, S. E. M., Heupel, M. R., Fisk, A. T., Logan, M., and Simpfendorfer, C. A. (2015). Regional movement patterns of a small-bodied shark revealed by stable-isotope analysis. J. Fish Biol. 86, 1567–1586. doi: 10.1111/jfb.12660
Murdaugh, H. V., Robin, E. D., and Hearn, C. D. (1964). Urea: apparent carrier-mediated transport by facilitated diffusion in dogfish erythrocytes. Science 144, 52–53. doi: 10.1126/science.144.3614.52
Navarro, J., López, L., Coll, M., Barría, C., and Sáez-Liante, R. (2014). Short- and long-term importance of small sharks in the diet of the rare deep-sea shark Dalatias licha. Mar. Biol. 161, 1697–1707. doi: 10.1007/s00227-014-2454-2
Olin, J. A., Hussey, N. E., Grgicak-Mannion, A., Fritts, M. W., Wintner, S. P., and Fisk, A. T. (2013). Variable δ(15)N diet-tissue discrimination factors among sharks: implications for trophic position, diet and food web models. PLoS One 8:e77567. doi: 10.1371/journal.pone.0077567
Peterson, B. J., and Fry, B. (1987). Stable isotopes in ecosystem studies. Annu. Rev. Ecol. Syst. 18, 293–320. doi: 10.1146/annurev.es.18.110187.001453
Pillans, R. D., Good, J. P., Anderson, W. G., Hazon, N., and Franklin, C. E. (2005). Freshwater to seawater acclimation of juvenile bull sharks (Carcharhinus leucas): plasma osmolytes and Na+/K+-ATPase activity in gill, rectal gland, kidney and intestine. J. Comp. Physiol. B 175, 37–44. doi: 10.1007/s00360-004-0460-2
Post, D. M. (2002). Using stable isotopes to estimate trophic position: models, methods, and assumptions. Ecology 83, 703–718.
Pratchett, M. S., Wilson, S. K., Berumen, M. L., and McCormick, M. I. (2004). Sublethal effects of coral bleaching on an obligate coral feeding butterflyfish. Coral Reefs 23, 352–356. doi: 10.1007/s00338-004-0394-x
Prugh, L. R., Stoner, C. J., Epps, C. W., Bean, W. T., Ripple, W. J., Laliberte, A. S., et al. (2009). The rise of the Mesopredator. Bioscience 59, 779–791. doi: 10.1525/bio.2009.59.9.9
R Core Team (2021). R: A Language and Environment for Statistical Computing. Vienna: R Foundation for Statistical Computing. Available online at: https://www.R-project.org/
RStudio Team (2020). RStudio: Integrated Development for R. Boston, MA: RStudio, PBC. Available online at: http://www.rstudio.com/
Reum, J. C. P., Williams, G. D., Harvey, C. J., Andrews, K. S., and Levin, P. S. (2020). Trophic ecology of a large-bodied marine predator, bluntnose sixgill shark Hexanchus griseus, inferred using stable isotope analysis. Environ. Biol. Fishes 103, 147–162. doi: 10.1007/s10641-019-00941-z
Shiffman, D. S., Gallagher, A. J., Boyle, M. D., Hammerschlag-Peyer, C. M., and Hammerschlag, N. (2012). Stable isotope analysis as a tool for elasmobranch conservation research: a primer for non-specialists. Mar. Freshw. Res. 63, 635–643. doi: 10.1071/MF11235
Shipley, O. N., Murchie, K. J., Frisk, M. G., Brooks, E. J., O’Shea, O. R., and Power, M. (2017). Low lipid and urea effects and inter-tissue comparisons of stable isotope signatures in three nearshore elasmobranchs. Mar. Ecol. Prog. Ser. 579, 233–238. doi: 10.3354/meps12264
Stock, B. C., and Semmens, B. X. (2016). Unifying error structures in commonly used biotracer mixing models. Ecology 97, 2562–2569. doi: 10.1002/ecy.1517
Sweeting, C. J., Polunin, N. V. C., and Jennings, S. (2006). Effects of chemical lipid extraction and arithmetic lipid correction on stable isotope ratios of fish tissues. Rapid Commun. Mass Spectrom. 20, 595–601. doi: 10.1002/rcm.2347
Takizawa, Y., Takano, Y., Choi, B., Dharampal, P. S., Steffan, S. A., Ogawa, N. O., et al. (2020). A new insight into isotopic fractionation associated with decarboxylation in organisms: implications for amino acid isotope approaches in biogeoscience. Prog. Earth Planet. Sci. 7:50. doi: 10.1186/s40645-020-00364-w
Tamburin, E., Kim, S. L., Elorriaga-Verplancken, F. R., Madigan, D. J., Hoyos-Padilla, M., Sánchez-González, A., et al. (2019). Isotopic niche and resource sharing among young sharks (Carcharodon carcharias and Isurus oxyrinchus) in Baja California, Mexico. Mar. Ecol. Prog. Ser. 613, 107–124.
Tilley, A., López-Angarita, J., and Turner, J. R. (2013). Diet reconstruction and resource partitioning of a Caribbean marine mesopredator using stable isotope bayesian modelling. PLoS One 8:e79560. doi: 10.1371/journal.pone.0079560
Wessels, F. J., and Hahn, D. A. (2010). Carbon 13 discrimination during lipid biosynthesis varies with dietary concentration of stable isotopes: implications for stable isotope analyses. Funct. Ecol. 24, 1017–1022. doi: 10.1111/j.1365-2435.2010.01716.x
Whitehead, D. A., Murillo-Cisneros, D., Elorriaga-Verplancken, F. R., Hacohen-Domené, A., De La Parra, R., Gonzalez-Armas, R., et al. (2020). Stable isotope assessment of whale sharks across two ocean basins: gulf of California and the Mexican Caribbean. J. Exp. Mar. Biol. Ecol. 527:151359. doi: 10.1016/j.jembe.2020.151359
Willis, T. J., Berglöf, K. T. L., McGill, R. A. R., Musco, L., Piraino, S., Rumsey, C. M., et al. (2017). Kleptopredation: a mechanism to facilitate planktivory in a benthic mollusc. Biol. Lett. 13:20170447. doi: 10.1098/rsbl.2017.0447
Willis, T. J., Sweeting, C. J., Bury, S. J., Handley, S. J., Brown, J. C. S., Freeman, D. J., et al. (2013). Matching and mismatching stable isotope (δ13C and δ15N) ratios in fin and muscle tissue among fish species: a critical review. Mar. Biol. 160, 1633–1644. doi: 10.1007/s00227-013-2216-6
Wood, C. M., Walsh, P. J., Kajimura, M., McClelland, G. B., and Chew, S. F. (2010). The influence of feeding and fasting on plasma metabolites in the dogfish shark (Squalus acanthias). Comp. Biochem. Physiol. A Mol. Integr. Physiol. 155, 435–444. doi: 10.1016/j.cbpa.2009.09.006
Keywords: trophic ecology, pre-treatment, muscle, fin, plasma, red blood cells, elasmobranch, sharks
Citation: Bennett-Williams J, Skinner C, Wyatt ASJ, McGill RAR and Willis TJ (2022) A Multi-Tissue, Multi-Species Assessment of Lipid and Urea Stable Isotope Biases in Mesopredator Elasmobranchs. Front. Mar. Sci. 9:821478. doi: 10.3389/fmars.2022.821478
Received: 24 November 2021; Accepted: 11 February 2022;
Published: 24 March 2022.
Edited by:
Oliver Nicholas Shipley, University of New Mexico, United StatesReviewed by:
John Logan, Massachusetts Division of Marine Fisheries, United StatesYunkai Li, Shanghai Ocean University, China
Copyright © 2022 Bennett-Williams, Skinner, Wyatt, McGill and Willis. This is an open-access article distributed under the terms of the Creative Commons Attribution License (CC BY). The use, distribution or reproduction in other forums is permitted, provided the original author(s) and the copyright owner(s) are credited and that the original publication in this journal is cited, in accordance with accepted academic practice. No use, distribution or reproduction is permitted which does not comply with these terms.
*Correspondence: Joshua Bennett-Williams, andpbGxpYW1zQGNvbm5lY3QudXN0Lmhr