 Inga Kristiansen
 Hjálmar Hátún
 Jan Arge Jacobsen
 Sólvá K. Eliasen
 Hildur Petursdottir
 Eilif Gaard
- 1Faroe Marine Research Institute, Tórshavn, Faroe Islands
- 2Marine and Freshwater Research Institute, Hafnarfjörður, Iceland
The abundant and ecologically important copepods Calanus finmarchicus and Calanus hyperboreus within the Norwegian and Iceland Seas are key prey species of Norwegian spring spawning herring. The volume flux of East Icelandic Water, which carries the mentioned zooplankton species into the southern Norwegian Sea, is highly variable. The years 1996–2002 have previously been characterized as high influx years, 2003–2016 as low influx years and since 2017 a reversal to higher influx has been apparent. Hydrographic and zooplankton data, as well as fish data on herring (size and diet content), from the International Ecosystem Surveys in the Nordic Seas in May have been used in this study. Focus is on the south-western Norwegian Sea, where herring has regularly been observed in May since 2005 and where changes in plankton availability and in the hydrographic environment have also been observed. Diet biomass from 2017–2020 (higher influx period) showed higher stomach fullness compared to 2007–2011 (lower influx period). Furthermore, the highest stomach fullness is observed in the westernmost feeding region—referred to as the Feeding Spot. The scrutinized diet content showed a notably higher biomass of ingested C. hyperboreus in 2020 compared to 2007–2011, indicating a preference for the larger and more nutritious copepod. Zooplankton analysis from May 2020 revealed that the core of the western feeding region, i.e., the area with highest zooplankton biomass, was located within the subarctic waters immediately north/west of the junction between the Iceland-Faroe Front and the Jan Mayen Front. The core area was mainly represented by overwintering stages and the derived adult stages of C. finmarchicus and C. hyperboreus. Interplay between food availability and accessibility, in terms of temperature, to the Feeding Spot, is discussed.
Introduction
The Norwegian Spring Spawning herring (Clupea harengus) is the largest herring stock in the world. Due to the sheer stock size, remarkable dynamic structure and high economic value, this stock continues to be a favorite subject of scientific study with many remaining unanswered questions. The variable feeding migration is one important aspect of the stock dynamics, and this is the focus of the present paper.
The general herring migration route is performed in a clockwise pattern that covers warm northward flowing Atlantic water (AW) in the eastern Norwegian Sea and cold Arctic and subarctic waters flowing in a south-easterly direction in the western Norwegian Sea and northeastern Icelandic Sea (Figure 1; Holst et al., 2004). After spawning along the Norwegian coast in February-March (Holst and Slotte, 1998), the herring enters the Norwegian Sea with a progressive westward feeding migration. In the classical view, the main feeding season extends from early May to late July, which herring use to fill its energy reserves for subsequent overwintering and spawning (Bachiller et al., 2016).
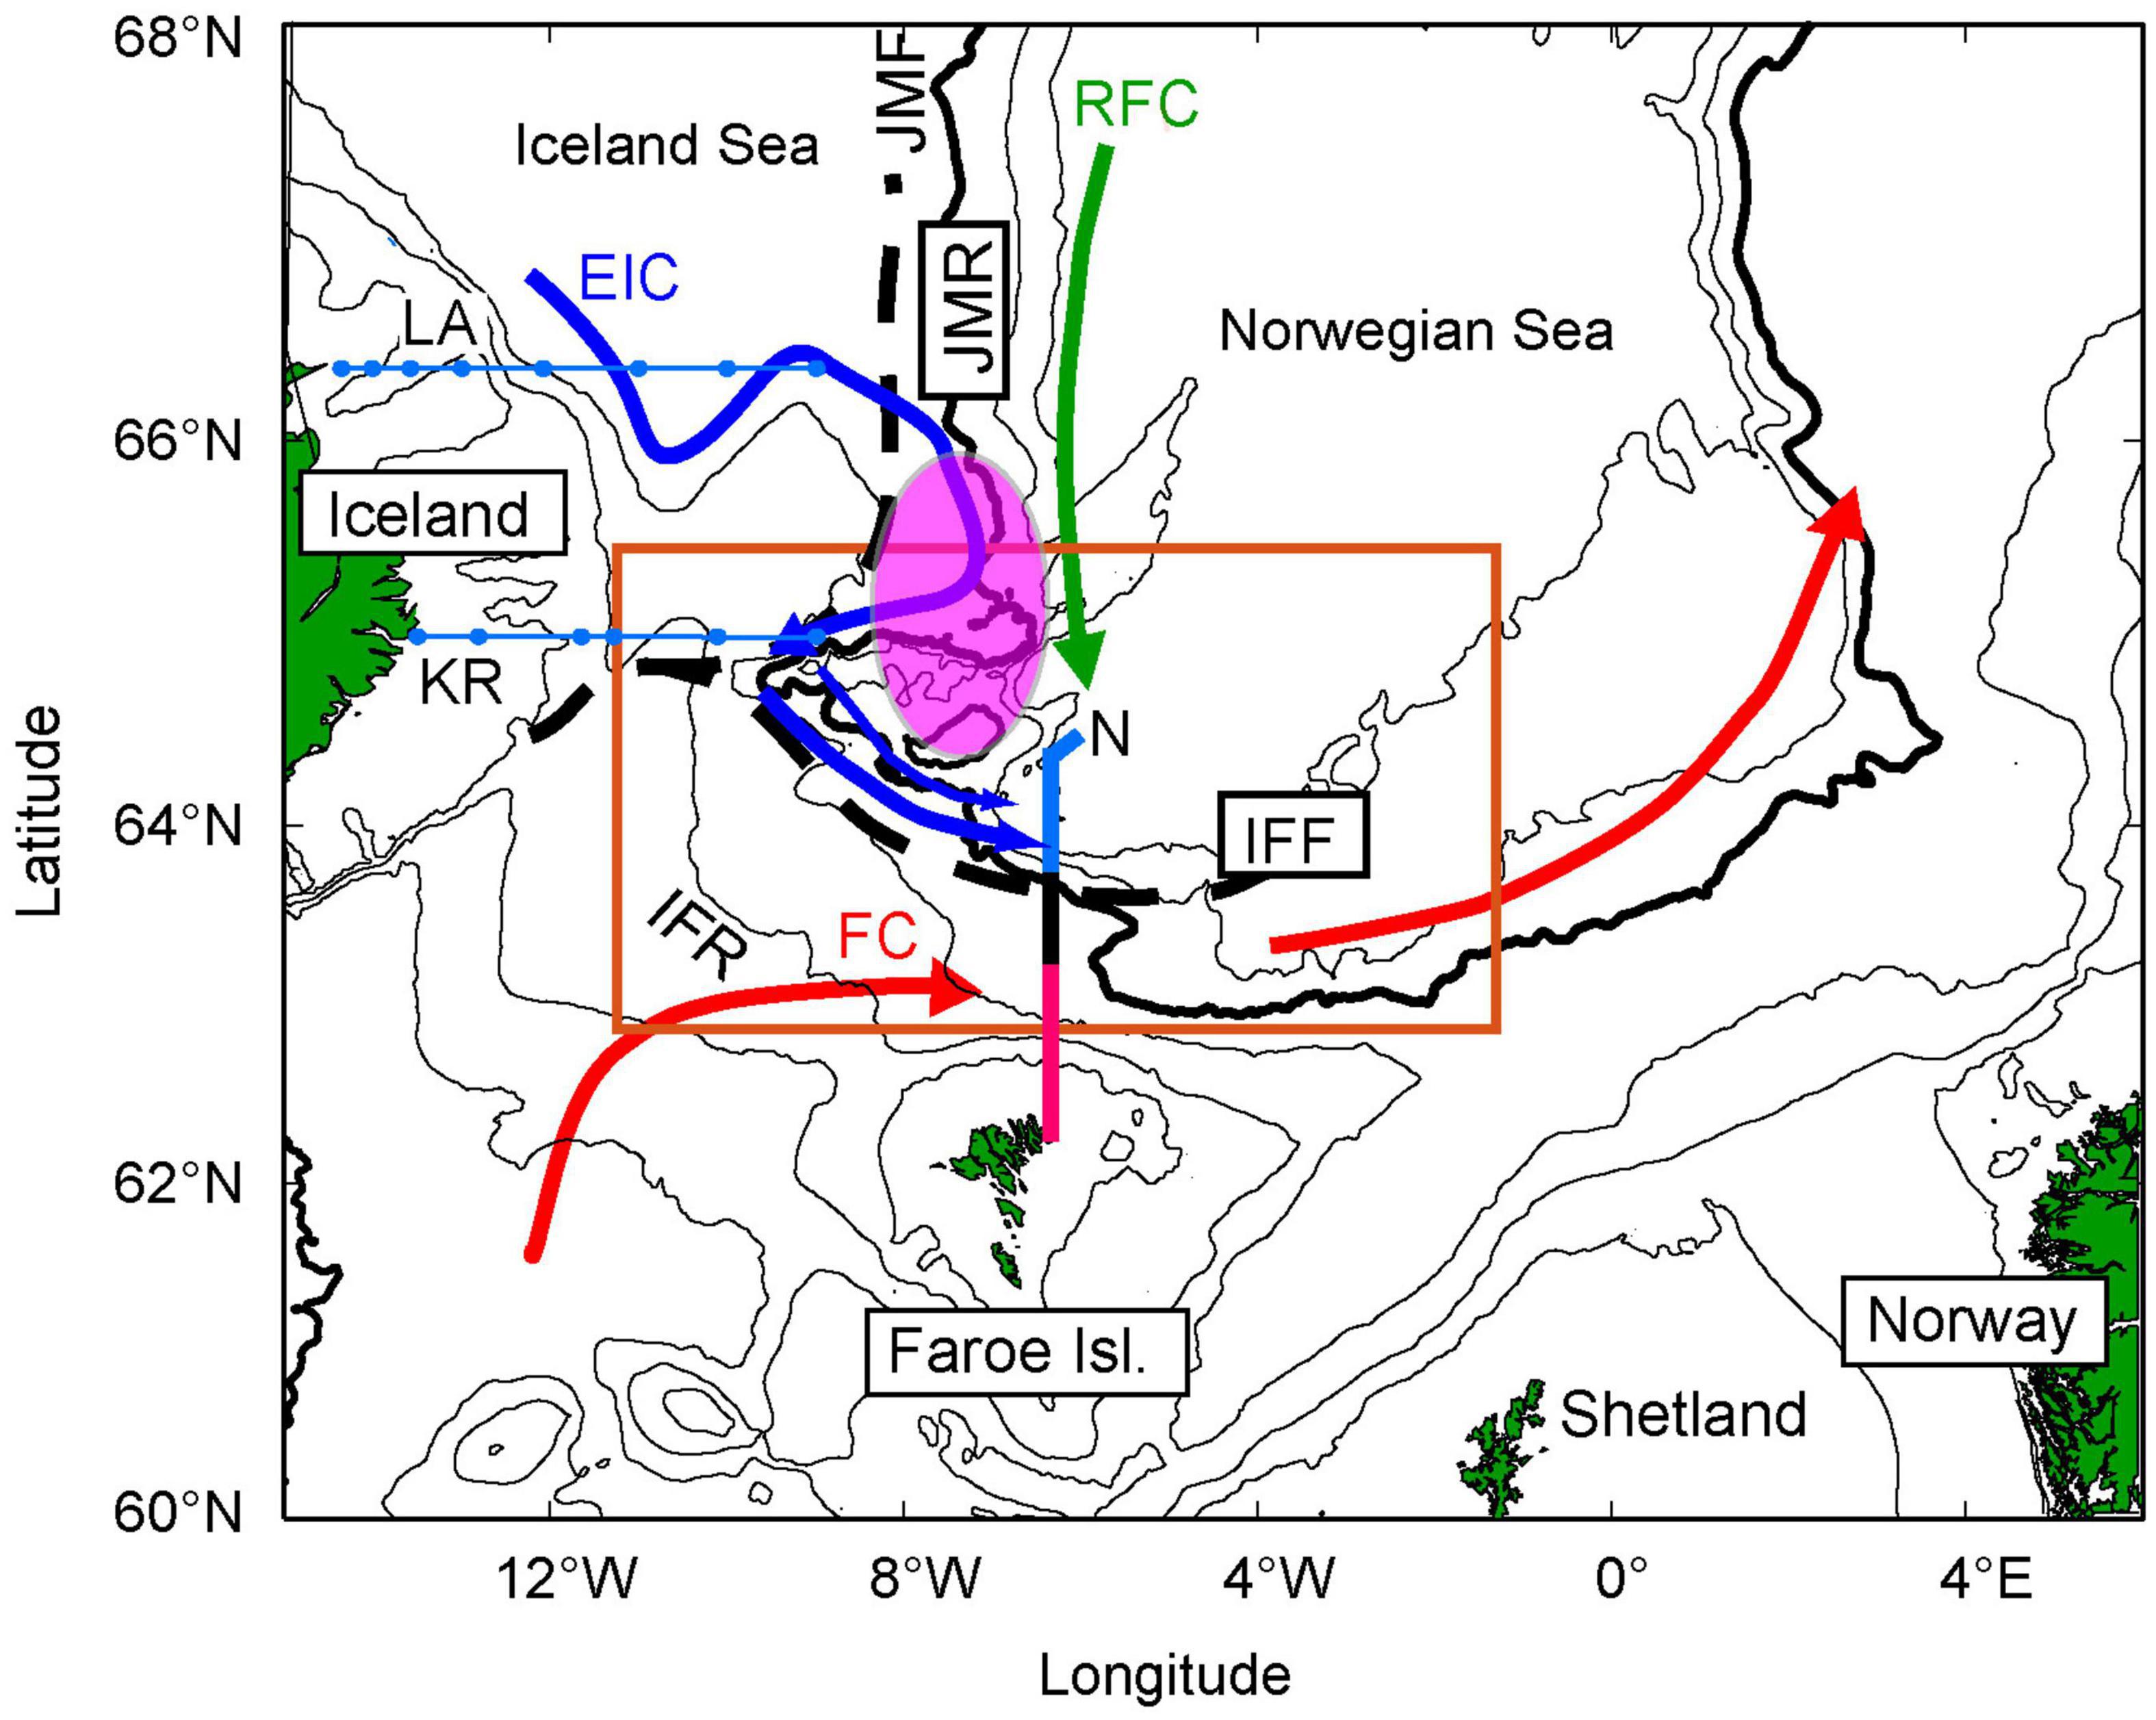
Figure 1. Map of the study region. The orange box defines the main study area. The black stippled lines show the approximate position of the Iceland-Faroe Front (IFF) and Jan Mayen Front (JMF), separating the south-eastward flowing East Icelandic Current (EIC) (blue) and poleward flowing Atlantic Waters (red). The purple circle illustrates the area where the densest aggregation of older herring is observed since around 2003, in May (Eliasen et al., 2021). The Icelandic monitoring sections (KR and LA) are shown in blue, while the Faroese section (N) is divided into an Atlantic (red), frontal (black), and subarctic (blue) regions. FC, Faroe Current; RFC, Recirculated Faroe Current (green); IFR, Iceland Faroe Ridge; JMR, Jan Mayen Ridge; KR, Krossanes; and LA, Langanes East. The 200, 500, 1,000, 2,000 (bold), 2,500, and 3,000 m isobaths are shown in black.
As reviewed by Skjoldal et al. (2004), the herring stock underwent three major shifts in their migration pattern from the early 1950s to the early 1990s. During the warm period, from 1950–1964, the feeding region stretched from north and east of Iceland to Jan Mayen. It was the adult herring that were paving the migratory route (Pavshtiks, 1956), feeding in the heated surface layer within the East Icelandic Current in May and June (Østvedt, 1965; Jakobsson and Østvedt, 1996). During the latter half of the 1960s, the water temperature became unusually low north of Iceland and feeding conditions deteriorated within this region (Thórdardóttir, 1977). During the same period, the stock size decreased dramatically and finally collapsed. A new migration pattern emerged in the early 1970s, when the herring remained along the Norwegian coast during the feeding period. When a large year class emerged in 1983, the need for a larger feeding area increased and from 1986 the herring was again feeding over large parts of the Norwegian Sea (Holst et al., 2002).
Since the mid-1990s, different herring feeding patterns, in May, have also emerged. During the years 1996–1998, the herring mainly migrated along the eastern side of the Jan Mayen Front (JMF) (Misund et al., 1998; Holst et al., 2002). In 1999, the herring stock became abruptly confined north of 66°N (Holst et al., 1999, 2004), with nearly no herring east of Iceland (Eliasen et al., 2021). After 2003, and more persistently since 2005 to present, the herring stock did again adopt a southwestern migration toward the southwestern Norwegian Sea. Adult herring are presently densely aggregating against the slope of the Jan Mayen Ridge (Eliasen et al., 2021) (∼65.5°N, 5°W in Figure 1), which the authors refer to as the “feeding hotspot”—hereafter simply the Feeding Spot (FS). Homrum et al. (in review) has shown that the best growth conditions of herring, during this early feeding period, are observed in the southwestern Norwegian Sea, which might reflect the abundant food availability in this region.
Copepods of the genus Calanus, including the larger copepodite stages of Calanus finmarchicus and the larger Calanus hyperboreus, of Arctic origin, are considered to be the main prey of herring (Dalpadado et al., 2000; Gislason and Astthorsson, 2002; Melle et al., 2020). C. finmarchicus is the dominant zooplankton species, both numerically and in terms of biomass, within the Norwegian Sea and most herring-prey discussions have therefore focused on this species (e.g., Broms et al., 2012; Utne et al., 2012; Melle et al., 2020). However, C. hyperboreus dominates the zooplankton biomass in the southeastern part of the Iceland Sea in May (Astthorsson and Gislason, 2003; Strand et al., 2020; Gislason et al., 2021). This larger and more nutritious copepod is increasingly preyed upon further westwards during the migration in May (Dalpadado et al., 2000; Melle et al., 2020), and its abundance might therefore have larger impact on the herring feeding distribution than previously anticipated.
The East Icelandic Current advects C. hyperboreus and large stages of C. finmarchicus, into the southwestern Norwegian Sea (Figure 1; Kristiansen et al., 2019; Skagseth et al., in review). The typical view of the East Icelandic Current as a broad flow from the Icelandic Sea into the Norwegian Sea must, however, be nuanced. Ocean currents in this region closely follow the bathymetry, and the flow of cold and low-saline East Icelandic Water (EIW) is actually channeled by two branches: a shallow branch (∼750 m bottom depths) along the Iceland slope and directly continuing southeastward along the northern flank of the Iceland-Faroe Ridge, and a deeper branch (∼1,100 m bottom depths), which veers clockwise around the northeastward protruding plateau from the Icelandic continental slope (see the 1,000 m isobath in Figure 1). The deep branch merges with the southward flow along the Jan Mayen Ridge (Semper et al., 2020; Hátún et al., 2021) in the vicinity of the FS.
Although the deep flows are topographically controlled, stratification in the water column allows the near-surface waters to shift laterally. East of Iceland, the frontal zones are characterized by inter-annual fluctuations in longitudinal position which are related to a variable volume of EIW (Blindheim, 2004; Kristiansen et al., 2016, 2019). Before reverting back to zooplankton and herring, we summarize the most distinct oceanographic changes since the mid-1990s (Malmberg and Valdimarsson, 2003; Macrander et al., 2014; Kristiansen et al., 2019; Holliday et al., 2020; ICES, 2020).
After a drop in the North Atlantic Oscillation (NAO) index during the winter 1995–1996 (Holliday et al., 2008), the subpolar gyre weakened markedly (Häkkinen and Rhines, 2004), resulting in increased temperature and salinities in the AW flowing into the Nordic Seas (Hátún et al., 2005). Around the same time, from 1996–1998, the Arctic waters approaching Iceland from the northwest cooled and became fresher. These years are also known as the Polar Years north of Iceland (Malmberg and Valdimarsson, 2003). These two concurrent events resulted in contrasting oceanographic conditions northeast of Iceland during the late 1990s. In 2003, the circulation of both the subpolar gyre (Hátún et al., 2005) and the Norwegian Sea gyre (Hátún et al., 2021) were particularly weak. The weakened Norwegian Sea gyre reduced the eastward transport of the EIW into the Norwegian Sea (Serra et al., 2010). Simultaneously, the further weakening of the subpolar gyre lead to an even stronger increase in temperature and salinity in the Modified North Atlantic Water (MNAW; Hátún et al., 2005; Larsen et al., 2012) which propagated throughout the Nordic Seas (Malmberg and Valdimarsson, 2003; Holliday et al., 2008; Richter and Maus, 2011). These cascading events coincide with a more westward broadening of the AW currents (Blindheim et al., 2000) as well as reduced abundance of C. hyperboreus and the larger copepodite stages of C. finmarchicus (Kristiansen et al., 2019). This reversed after 2015 to this present period. This period is characterized by an intensifying subpolar gyre (Hátún and Chafik, 2018) and the largest drop in seawater salinities ever observed in the northeast Atlantic (Holliday et al., 2020), and together with an increased influx of EIW (Kristiansen et al., 2019), the Norwegian Sea has freshened. However, due to reduced heat loss from the region, the Norwegian Sea has simultaneously experienced warming (Mork et al., 2019).
ICES (2020) has reported historically low zooplankton concentrations since 2003, although it has been slightly increasing again after 2015. This coincides with an increased abundance and expansion of the herring stock during spring and summer (Utne et al., 2012). However, it remains difficult to evaluate the effect of feeding pressure on zooplankton biomass in May, since the zooplankton sampling and trawling occur at the same time. Understanding herring behavior is complicated as multiple factors may influence stock structure, such as temperature, food availability, recruitment, stock size and inherent learned behavior between generations (Misund et al., 1997; Fernö et al., 1998; Skjoldal et al., 2004). However, Eliasen et al. (2021) find no link between internal stock dynamics such as the entrance of strong year classes and changes in the distribution pattern in May, and thus concluded that the observed major distribution shifts of old herring are primarily induced by the external factors such as temperature and/or food abundance.
The present work is done in parallel with the following four papers: Eliasen et al. (2021); Hátún et al. (2021), Homrum et al. (in review), and Skagseth et al. (in review) in association with a Research Topic in Frontiers in Marine Science. We here provide information on some key aspects of temperature, zooplankton composition and abundance and herring stomach content in the vicinity of the FS. Combined with key findings from the other papers, this will be used to assess the most plausible drivers underlying the variable distribution of herring in May. In our discussion, we pose two hypothesis: The abundance of adult herring at the FS in May is determined by: Hyp (I) accessibility to the FS (thermal restriction) and/or Hyp (II) food abundance between Norwegian slope and the FS.
Methods
Sea Surface Temperature
In order to show the long-term average temperature conditions for zooplankton and herring in May, sea surface temperatures (SST) in May from 2003 to 2020, based on remotely sensed data with 4.64 km resolution (from MODIS, NASA Goddard Space Flight Centre, Ocean Ecology Laboratory, Ocean Biology Processing Group), were downloaded from http://marine.copernicus.eu and averaged. In addition, daily SST (from multisensory merged, level 3 satellite observations, with a 0.02 degrees latitudinal and longitudinal resolution) was also used to estimate the oceanic conditions. The period under investigation is from 30th April to 9th May 2020, which coincides with the International Ecosystem Survey in the Nordic Seas (IESNS). Temperature and salinity at 100 and 200 m depth, measured with a Conductivity, Temperature, Depth (CTD) during the IESNS survey, are included in the Supplementary material (Supplementary Figure 1). This period also concurs with available microscopic analysis of zooplankton (see Section Zooplankton Distribution in May 2020) and herring stomach analysis (see Section Herring Diet Composition).
Hydrographic Conditions at Two Eastern Icelandic Sections
Two standard monitoring sections, Krossanes (KR) and Langanes East (LA) (Figure 1 and Supplementary Figures 2, 3), enabled a detailed investigation of the hydrographic conditions, in May, in the vicinity of the FS. A CTD was used to collect the temperature and salinity data from 1991 to 2020. To examine the potential time varying thermal restriction to the FS, a temperature and salinity time series of the two outermost stations at section LA (LA7 and LA8) was created by taking the average over the 80–120 m depth levels. This was done in order to avoid the rapidly changing influence of surface stratification. Data is not available at LA in 1998. A Hovmöller (depth-time) diagram from KR6, which is the station closest to the FS, reveals long-term temperature changes through the water column, just downstream of the FS.
Calanus finmarchicus and Calanus hyperboreus at Section N
Section N is located north of the Faroe Islands, from 62°20’N to 64°50’N and at longitude between 6°00’W and 6°05’W (Figure 1). The zooplankton time-series at Section N covers 25 years of observations in May, starting in 1993. No data are available for 1996, 1998, and 2006. Zooplankton samples were collected by vertical hauls from 50 m depth to the surface using a WP-2 net, with a mesh size of 200 μm. The towing speed was 0.5 m s–1. On board, the samples were preserved with 4% formaldehyde. In the laboratory, the samples were divided into subsamples with a Motoda cylinder splitter, and an aliquot of around 200–300 animals from each sample was identified and counted. C. finmarchicus copepodites were also classified into developmental stages. For this purpose, averages from stations located within the subarctic region (Figure 1) are included in this study. Calanus glacialis, which is also distributed with the East Icelandic Current, is morphological very similar to C. finmarchicus. However, as C. glacialis is an arctic shelf species and only comprises less than 1% of the zooplankton biomass within the East Icelandic Current (Astthorsson and Gislason, 2003; Strand et al., 2020), molecular studies were not used to discriminate between these two species.
Zooplankton Distribution in May 2020
Co-occurring with CTD stations during the IESNS survey, zooplankton samples were collected according to the same method as stated in Section Calanus finmarchicus and Calanus hyperboreus at Section N. Each sample was split in two, where one half was preserved in 4% buffered formalin and identified to lowest taxonomic level possible using a stereomicroscope. The larger zooplankton species including krill and amphipods are not sampled representatively using a WP-2 net and are therefore excluded from this data analysis. The most common zooplankton species that were found in herring stomachs were selected for further investigation (Supplementary Table 1). The numbers were converted to biomass (Table 1) and were gridded onto a regular grid of 1° longitude by 0.5° latitude using objective mapping (Böhme and Send, 2005).
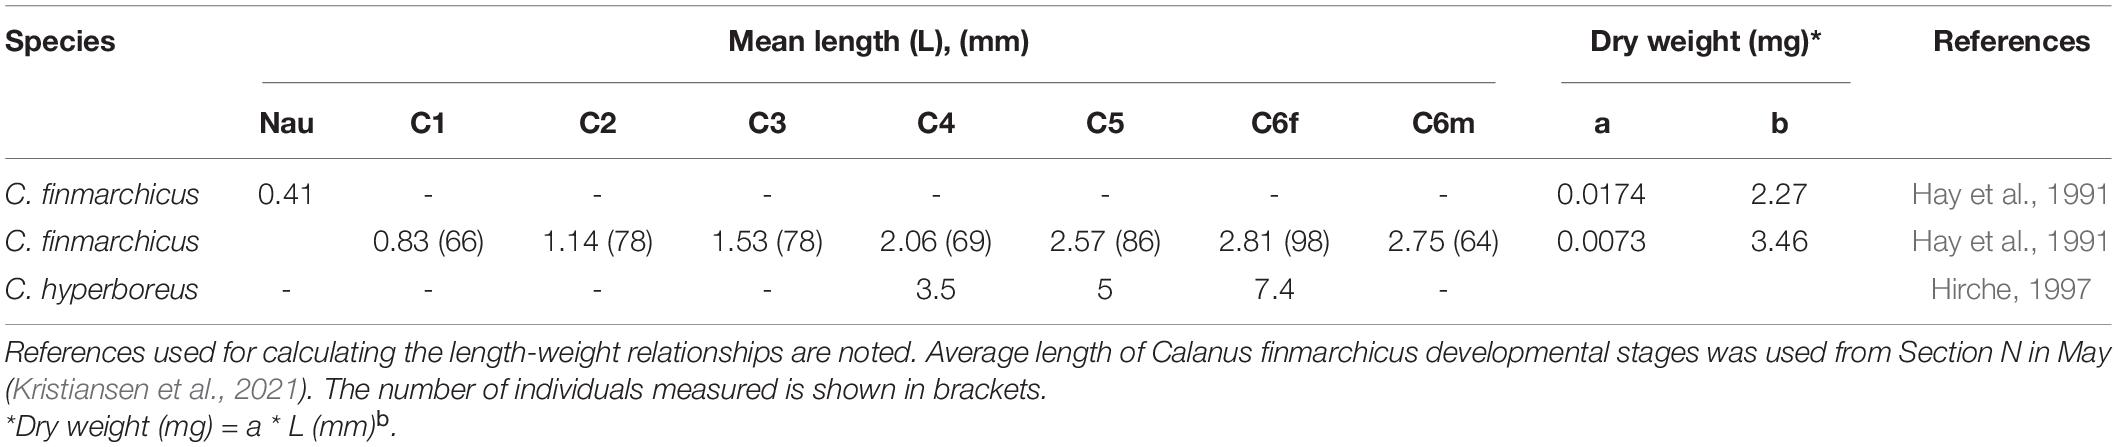
Table 1. Mean length and regression coefficients (a) and exponents (b) for converting length (mm) to dry weight (mg) of dominant prey species in the environment and in the herring stomach content.
Zooplankton Biomass Within the Norwegian and Iceland Seas
The zooplankton biomass used in our analysis is collected in May from 1996 to 2020 during the IESNS survey. Samples were collected within the uppermost 200 m with WP-2 nets of 180 or 200 μm mesh size and subsequently split into two, where one half was dried and weighed to measure total biomass. Data are presented as g dry weight per m2 (ICES, 2020). The survey data were gridded as described in Section Zooplankton Distribution in May 2020. Areas with sparse sampling, where the associated error map exceeded the selected threshold of less than 7 years sampled within a grid cell during the 25-year long sampling period, were excluded from further analysis. The average biomass within the region is divided into the following four periods: 1996–1998, 1999–2002, 2003–2016, and 2017–2020. The selected periods are chosen based on a combination of information including the herring distribution, in May, since the mid-1990s (Eliasen et al., 2021), hydrographic changes described by Skagseth et al. (in review) and Calanus spp. abundance within the subarctic region of Section N (Kristiansen et al., 2019).
Herring Diet Composition
Lengths of 100 herring were randomly obtained from a sub-sample taken at each trawl station during the IESNS survey in May. Trawling for herring occurred on regular intervals based on the acoustic readings. Stomach samples of the first 10 fishes were collected and immediately frozen. Analysis of diet composition of stomachs collected in 2007 to 2011 and in 2020 was carried out within 6 months after sampling. Each stomach was cleared of the remaining debris on the outside and was subsequently weighted before and after emptying the stomach content as wet weight. Stomachs were carefully opened with scissors and the consumed prey was identified to lowest taxonomic level possible using a stereomicroscope. A Metoda Splitter was used to create sub-samples when the prey became too numerous to count. The prey content in herring stomachs collected from 2017 to 2019 was only weighted as wet weight, without examining the prey composition, as these had been frozen for more than 18 months. These were used, together with stomachs collected from 2007 to 2011 and 2020, to determine the stomach fullness index (SFI). SFI was calculated as wet weight of the stomach content (g) divided by fish length (cm) cubed and multiplied by 103 (Deblois and Rose, 1995). The biomass, as dry weight, of the dominant ingested prey groups was calculated using length-weight relationships from literature (Hay et al., 1991; Hirche, 1997; Table 1). Average length of C. finmarchicus developmental stages was based on measurements from Section N, within the upper 200 m, in May (Kristiansen et al., 2021).
Statistical Analysis
R Core Team and Matlab were used interchangeable to analyze data while the statistical analysis was only conducted in R. All data were checked for normality before a statistical test was applied. The non-parametric Kruskal-Wallis test was used to confirm whether the phenology shift of C. finmarchicus and the abundance of C. hyperboreus could be defined according to the most distinct oceanographic changes since the mid-1990s. These are divided into three periods, 1993–2002, 2003–2014, and 2015–2020. For the SFI data, the non-parametric Mann-Whitney U-test was used to test whether there was a significant difference between two periods, 2007–2011 versus 2017–2020. A linear regression analysis was used to document changes in temperature before versus after 2003 and the average increase in temperature since 2004.
Results
Variable Influx of Large Calanus Into the Southern Norwegian Sea
We follow and update the approach by Kristiansen et al. (2016, 2019), and proxy the variable influx of zooplankton from the Icelandic tongue into the southern Norwegian Sea using data from the thoroughly sampled standard monitoring Section N (Kristiansen et al., 2016, 2019).
Larger individuals of C. finmarchicus, including the juveniles, i.e., stages C4 and C5 and the adults (C6), dominated the population (>80%, Figure 2) during 1993–2002 (cold and low-saline high influx period), followed by a sudden phenological shift in 2003, which persisted until 2014 (warming and more saline low influx period). During the lower volume influx period, the numbers of juveniles and adults decreased to around 30% while the abundance of the recruits, i.e. stage C1–C3, increased to 70%. The environmental shift back to a fresher, but still warm, high influx after ∼2015 (Mork et al., 2019) resulted in dominance of C. finmarchicus juveniles and adults comparable to the previous high influx period. Calculating the ratio between the older (C4–C6) and younger (C1–C3) stages, followed by the Kruskal-Wallis test, confirms significant changes in the population structure during the three periods, 1993–2002, 2003–2014, and 2015–2020 (p < 0.05). The abundance of C. hyperboreus did also increase during the recent shift, although not to the same high values as observed during the earliest high influx period (Figure 2A). Nevertheless, there is a significant difference in the population abundance of C. hyperboreus during the three periods mentioned above (Kruskal-Wallis test, p < 0.05).
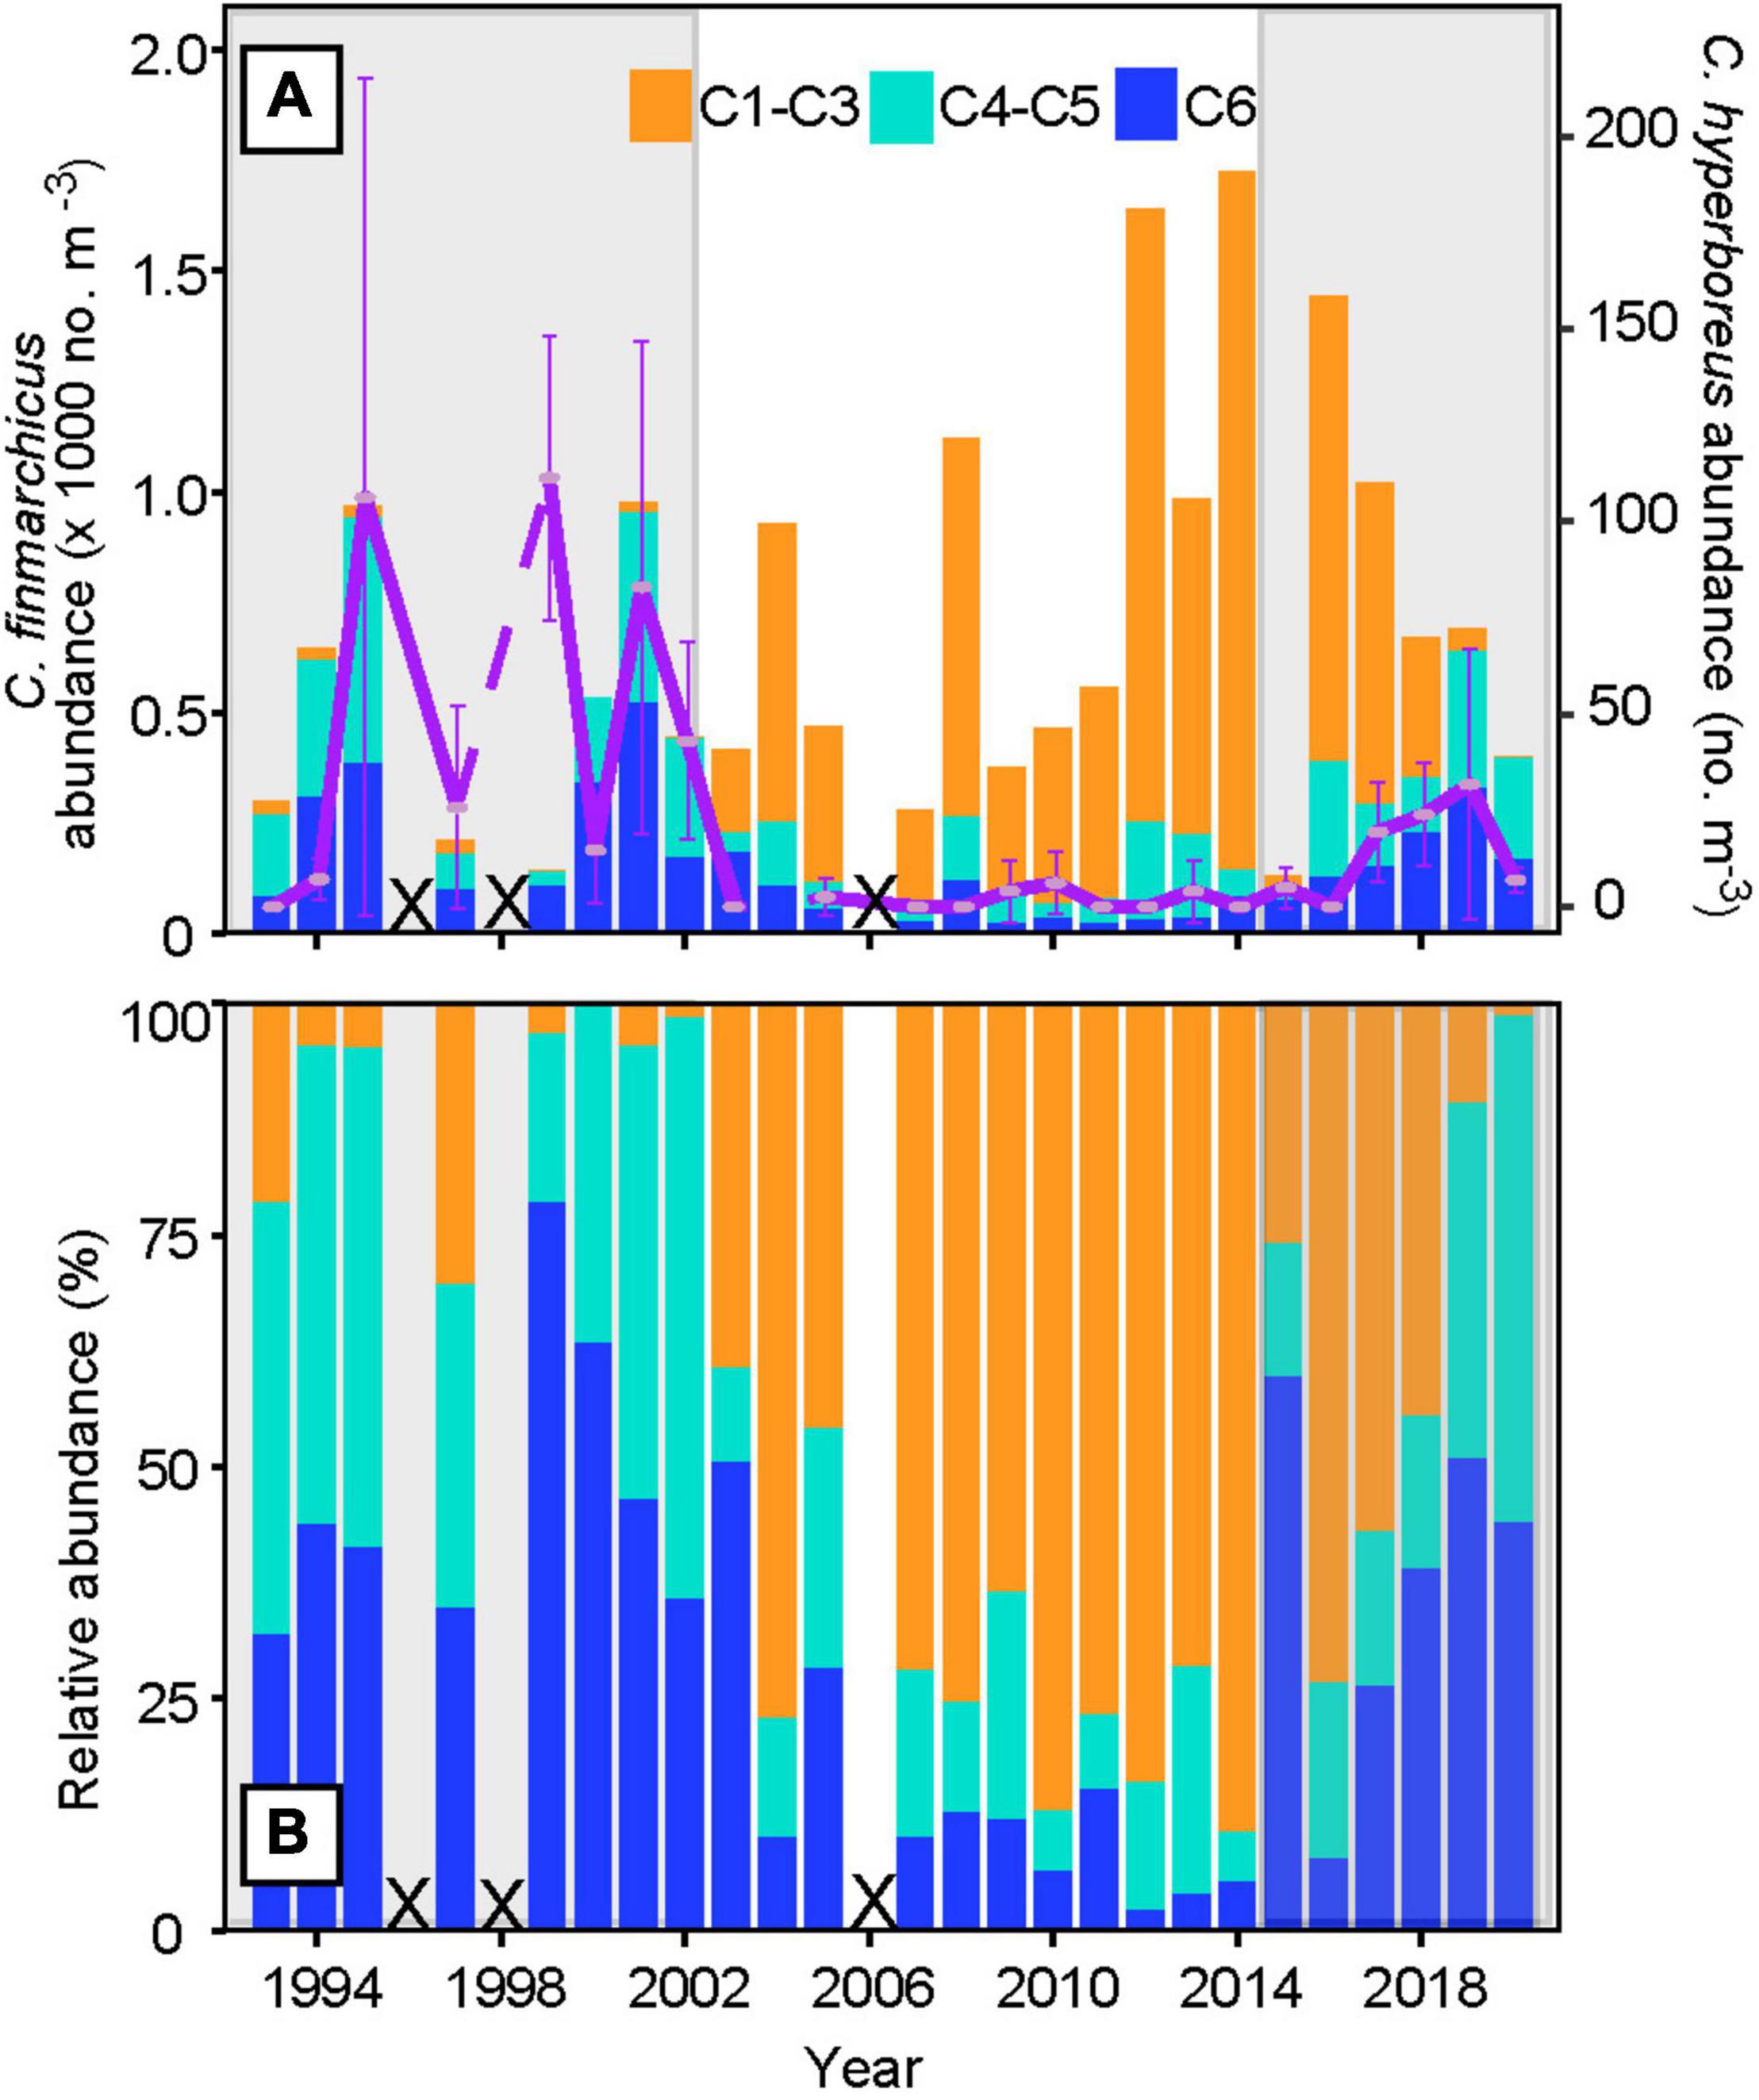
Figure 2. Stage composition of Calanus finmarchicus and mean abundance of Calanus hyperboreus within the subarctic region at Section N [(A), blue line in Figure 1] and [(B) relative abundance of C. finmarchicus, from 1993 to 2020]. The developmental stages of C. finmarchicus are grouped into recruits (C1–C3, orange), juveniles (C4–C5, light blue), and adults (C6, dark blue), while the mean abundance of all C. hyperboreus stages is shown in purple, together with the 95% confidence interval. The periods from 1993–2002 and 2015 to 2020 are highlighted in gray to illustrate co-occurring increased influx of arctic water into the southwestern Norwegian Sea (Skagseth et al., in review). Years with missing data are marked with crosses.
Herring Stomach Fullness and Diet Composition
To investigate whether the variable influx of zooplankton has any impact on the herring feeding dynamics, the estimated SFI is first gridded for each year (May), and subsequently the low influx period (2007–2011) is contrasted against the recent high influx period (2017–2020) using composite analysis (Figure 3). The gridded values are based on the values presented in Supplementary Figure 4. SFI was very low throughout the Norwegian Sea during the low influx period, with slightly elevated values only in the Icelandic tongue, upstream of the FS (Figure 3A). During the higher influx period, SFI significantly increased (Mann Whitney U-test, p < 0.05). Values were particularly high near Iceland and southwest of the FS (Figure 3B). There was also a marked increase along the Faroe Current, in and south of the IFF, and a marked “blob” with high values is evident in the eastern part of the study region (∼65°N, 0°W).
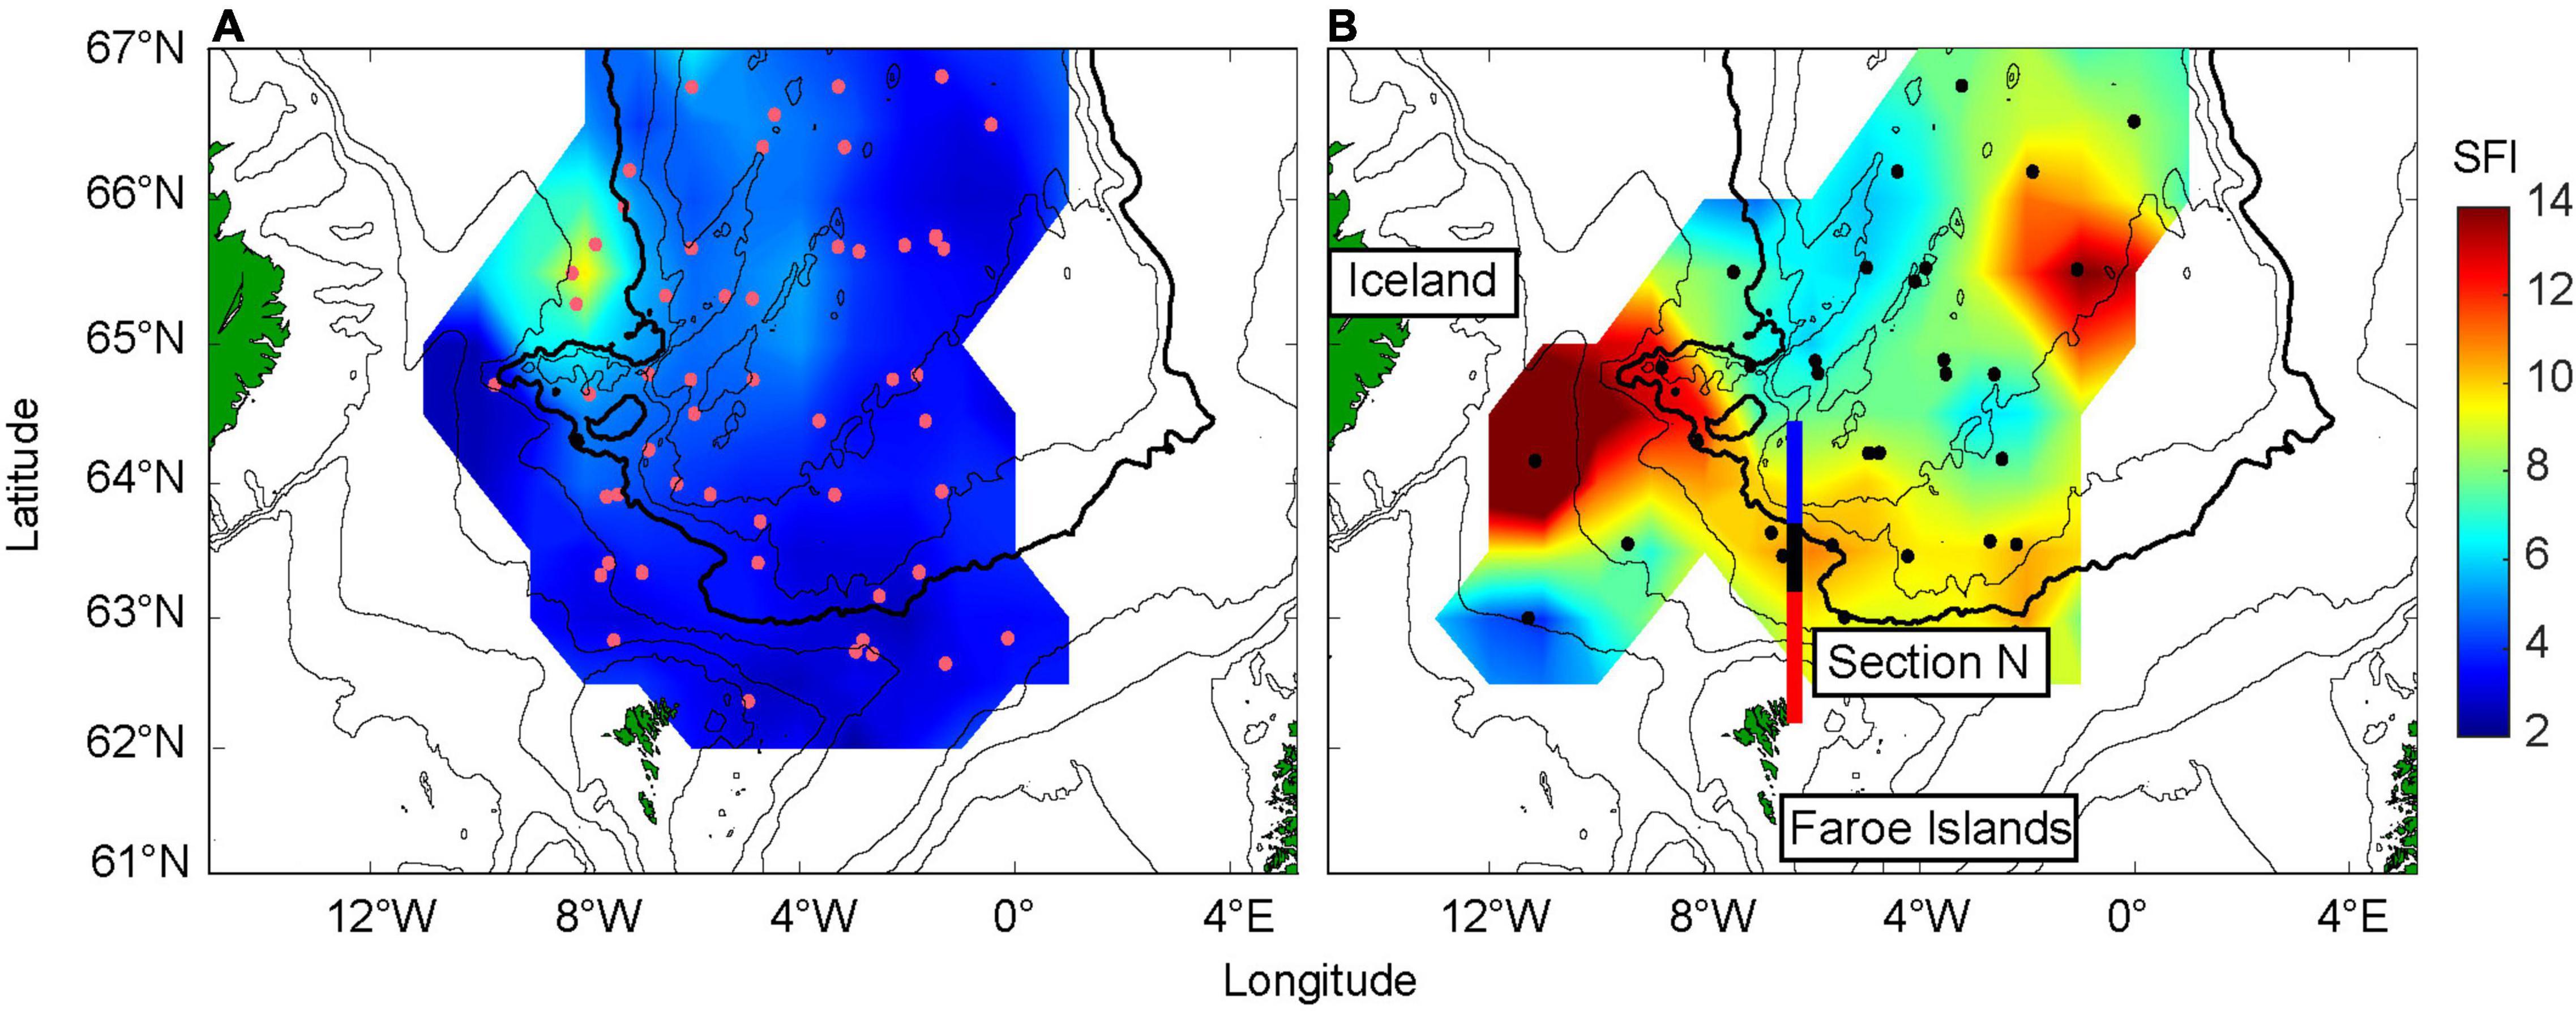
Figure 3. Stomach fullness index (SFI) values averaged over contrasting periods [(A), low influx period] 2007–2011 versus [(B), high influx period] 2017–2020. The data have been gridded for each year, and the fields are subsequently averaged over the mentioned years. The colored regions along Section N are described in Figure 1. The purple (A) and black (B) dots show the positions where stomach samples were collected. The 200, 500, 1,000, 2,000 (bold), 2,500, and 3,000 m depth contours are shown.
Stomach content was generally higher in the western area compared to the eastern area (Figure 4). The years 2008 and 2009 account for the higher values during the low influx period, with the stomach content being dominated by both Calanus spp. (see also Supplementary Figures 5B,C). However, in 2020, krill resulted in the highest wet weight value, which releases the highest SFI value near Iceland in Figure 3B (see also Supplementary Figures 4I, 5F). The high values, marking the “blob” in the eastern region, are from 2017 and 2019. The stomachs from these years were only weighed, and thus the diet composition is unknown.
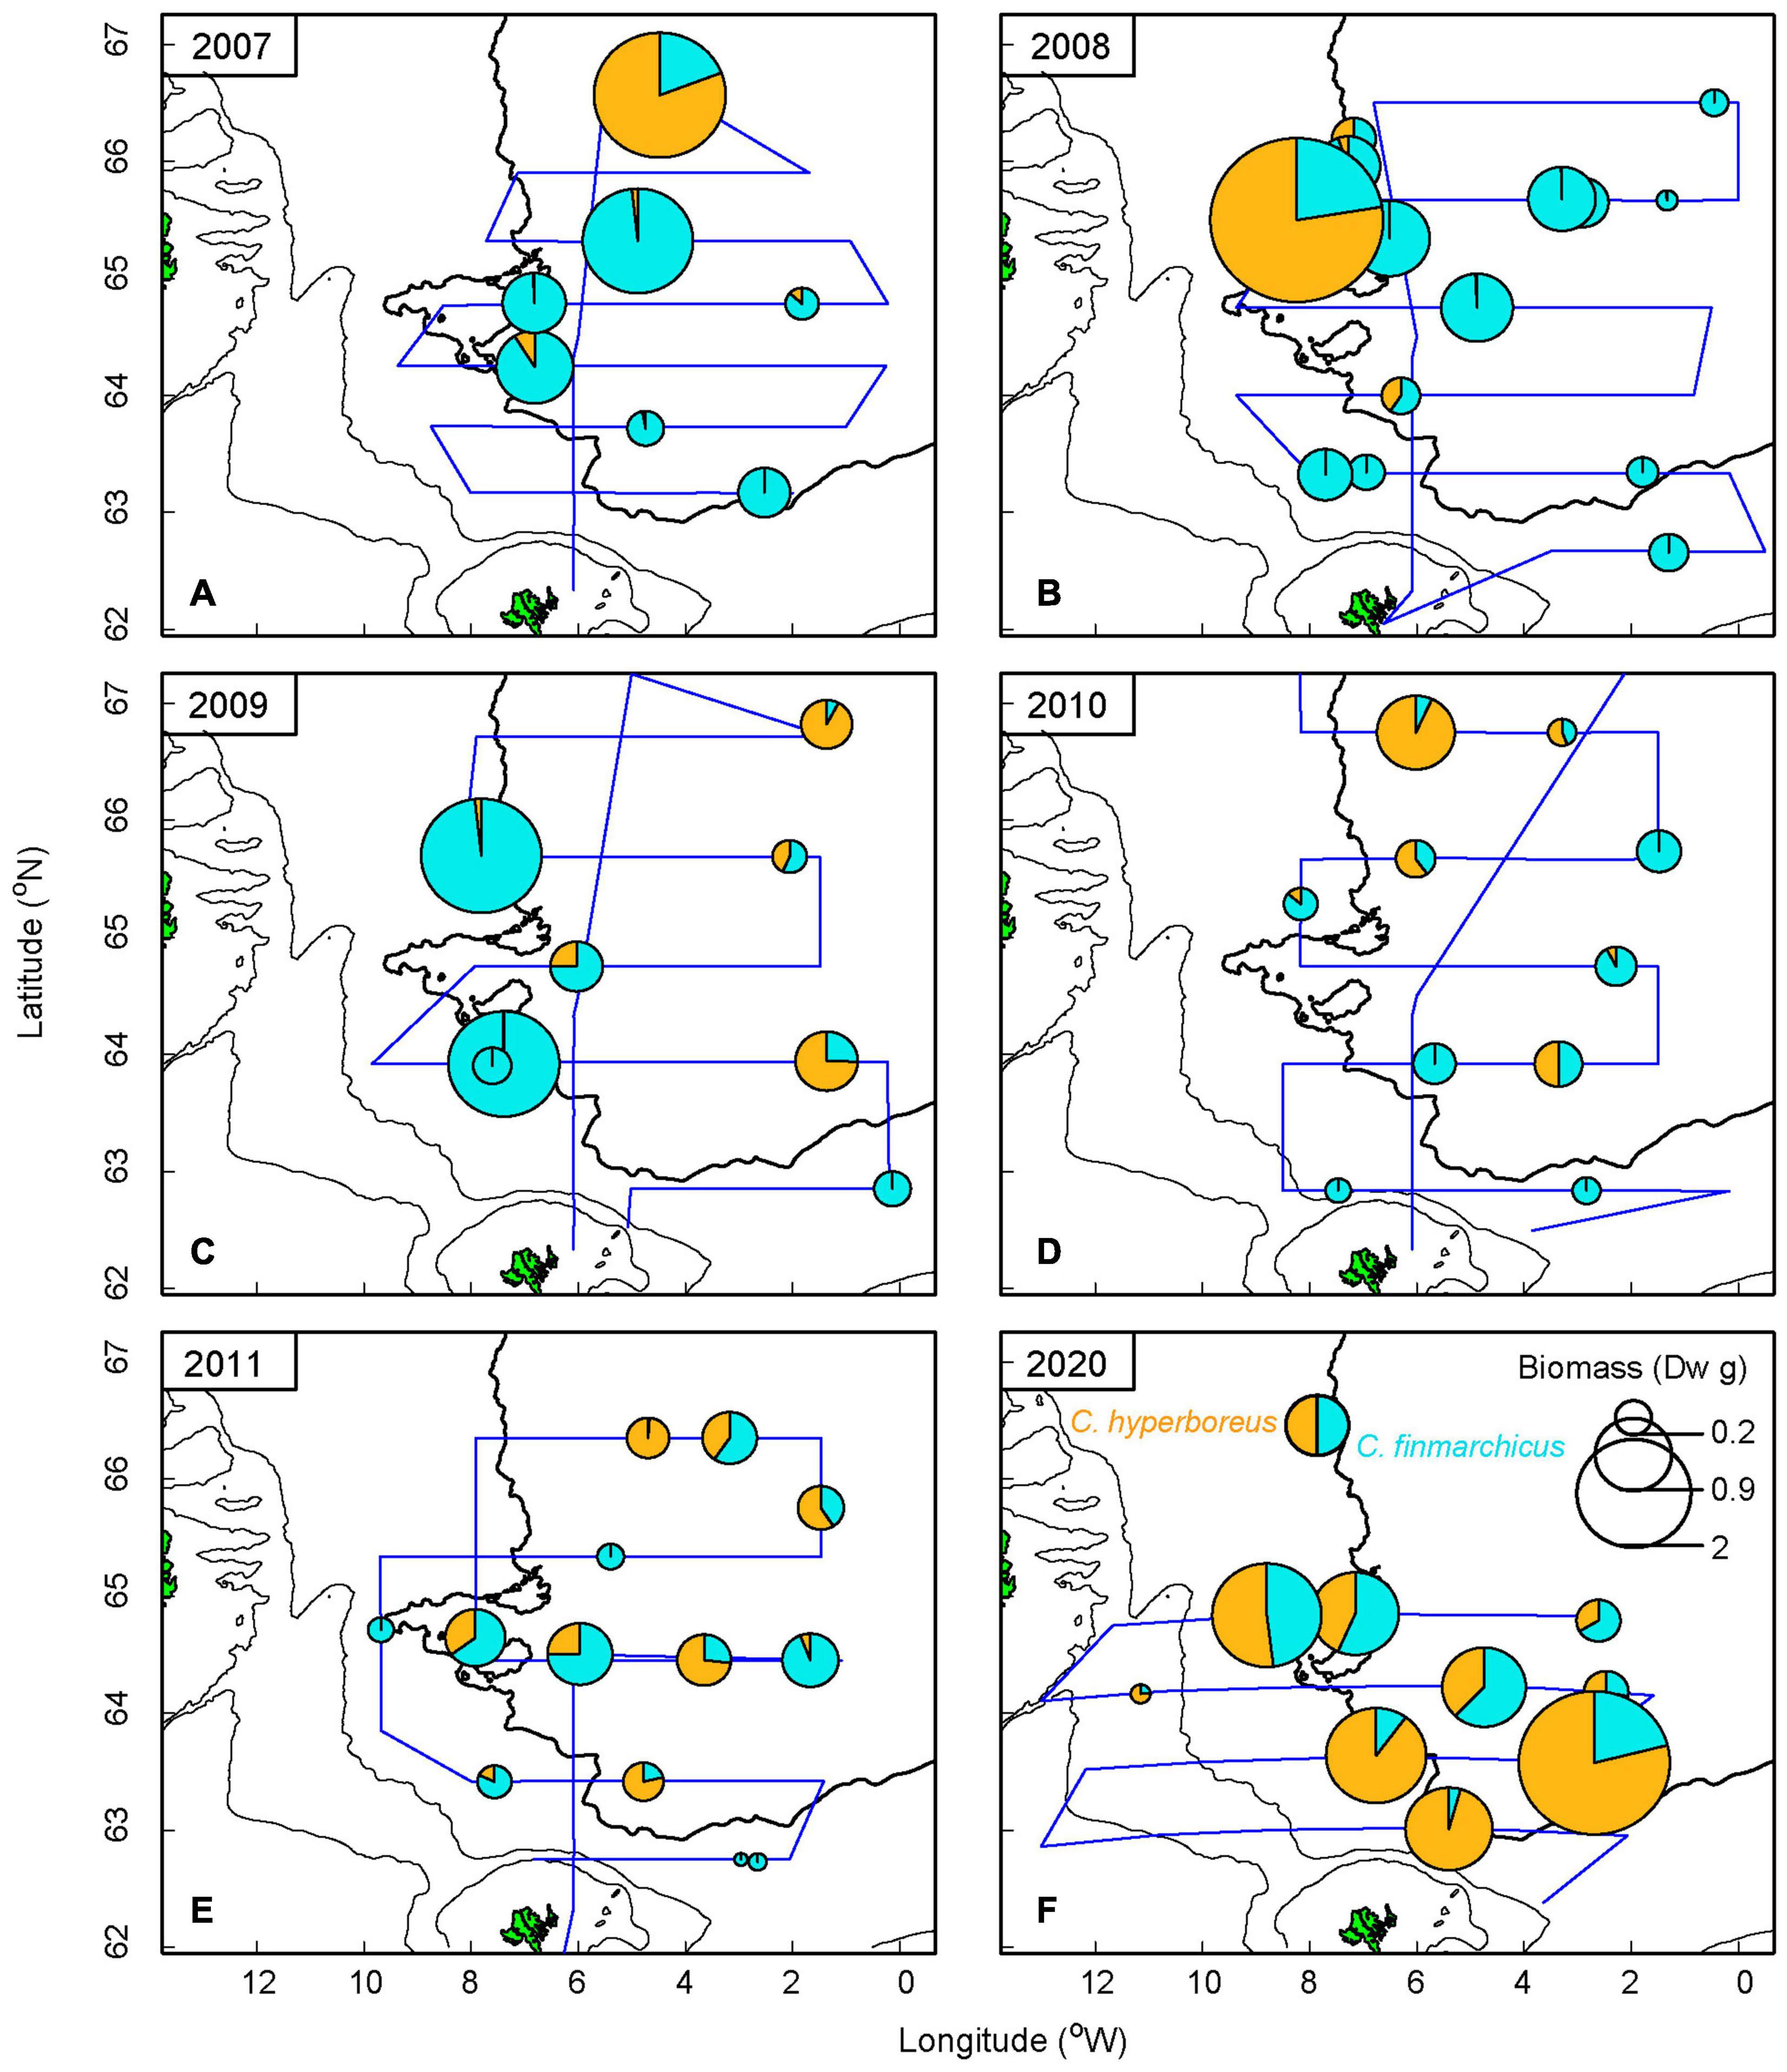
Figure 4. Dry weight (Dw) of diet composition of the most common copepods—Calanus finmarchicus and Calanus hyperboreus—found in herring stomachs. Observations are from 2007 to 2011 (A–E) and 2020 (F). The blue line represents cruise tracks each year. Data analysis on diet composition is not available for the years 2017–2019. The 2,000 m depth contour is shown in bold.
Out of 104 analyzed herring stomachs, we found that the number of C. finmarchicus was, by far, the most common ingested species (Supplementary Table 1). C. hyperboreus, Metridia spp., krill and amphipods were also frequently encountered during the diet analysis. As krill and amphipods vary in size and weight, and dry weight data of these species were not available from 2007–2011, these were excluded from the biomass analysis of herring diet. When converted to biomass, using the length-weight relationship in Table 1, C. finmarchicus and C. hyperboreus clearly dominated while the others became unnoticeable. Therefore only the Calanus spp. are presented in Figure 4. During the low influx years of EIW, majority of the stomach biomass was dominated by C. finmarchicus, although highest values in 2007 and 2008 were represented by C. hyperboreus. In contrast, during the high volume influx in 2020, C. hyperboreus was found at all stations and more than 50% of the ingested content was represented by C. hyperboreus.
Zooplankton Distribution and Composition in May 2020
To get a better view of the prey abundance near the FS, zooplankton samples collected during the IESNS cruise (Figure 5A), were differentiated to species level. The biomass distribution of C. finmarchicus and C. hyperboreus in May, are presented in Figures 5B–D. Sharply contrasting hydrographic conditions characterized this region, with stations 1 and 2 being located at the edge of pure EIW, stations 4, 5, 9, 10, 13, and 14 are located in AW, stations 3, 6, and 7 are taken in recirculated Norwegian North Atlantic Water (NNAW, yellow-green colors in Figure 6A), while the rest are taken in more mixed near-front waters (Figure 5A, see Figure caption for stations numbers). The highest concentrations of the overwintered C. finmarchicus population (G0) (stages C4 and C6) is sampled in the southward flow along the Jan Mayen Ridge (station 2, Figure 5A). However, high biomass values are also recorded at station 1 and 3 (Figure 5C).
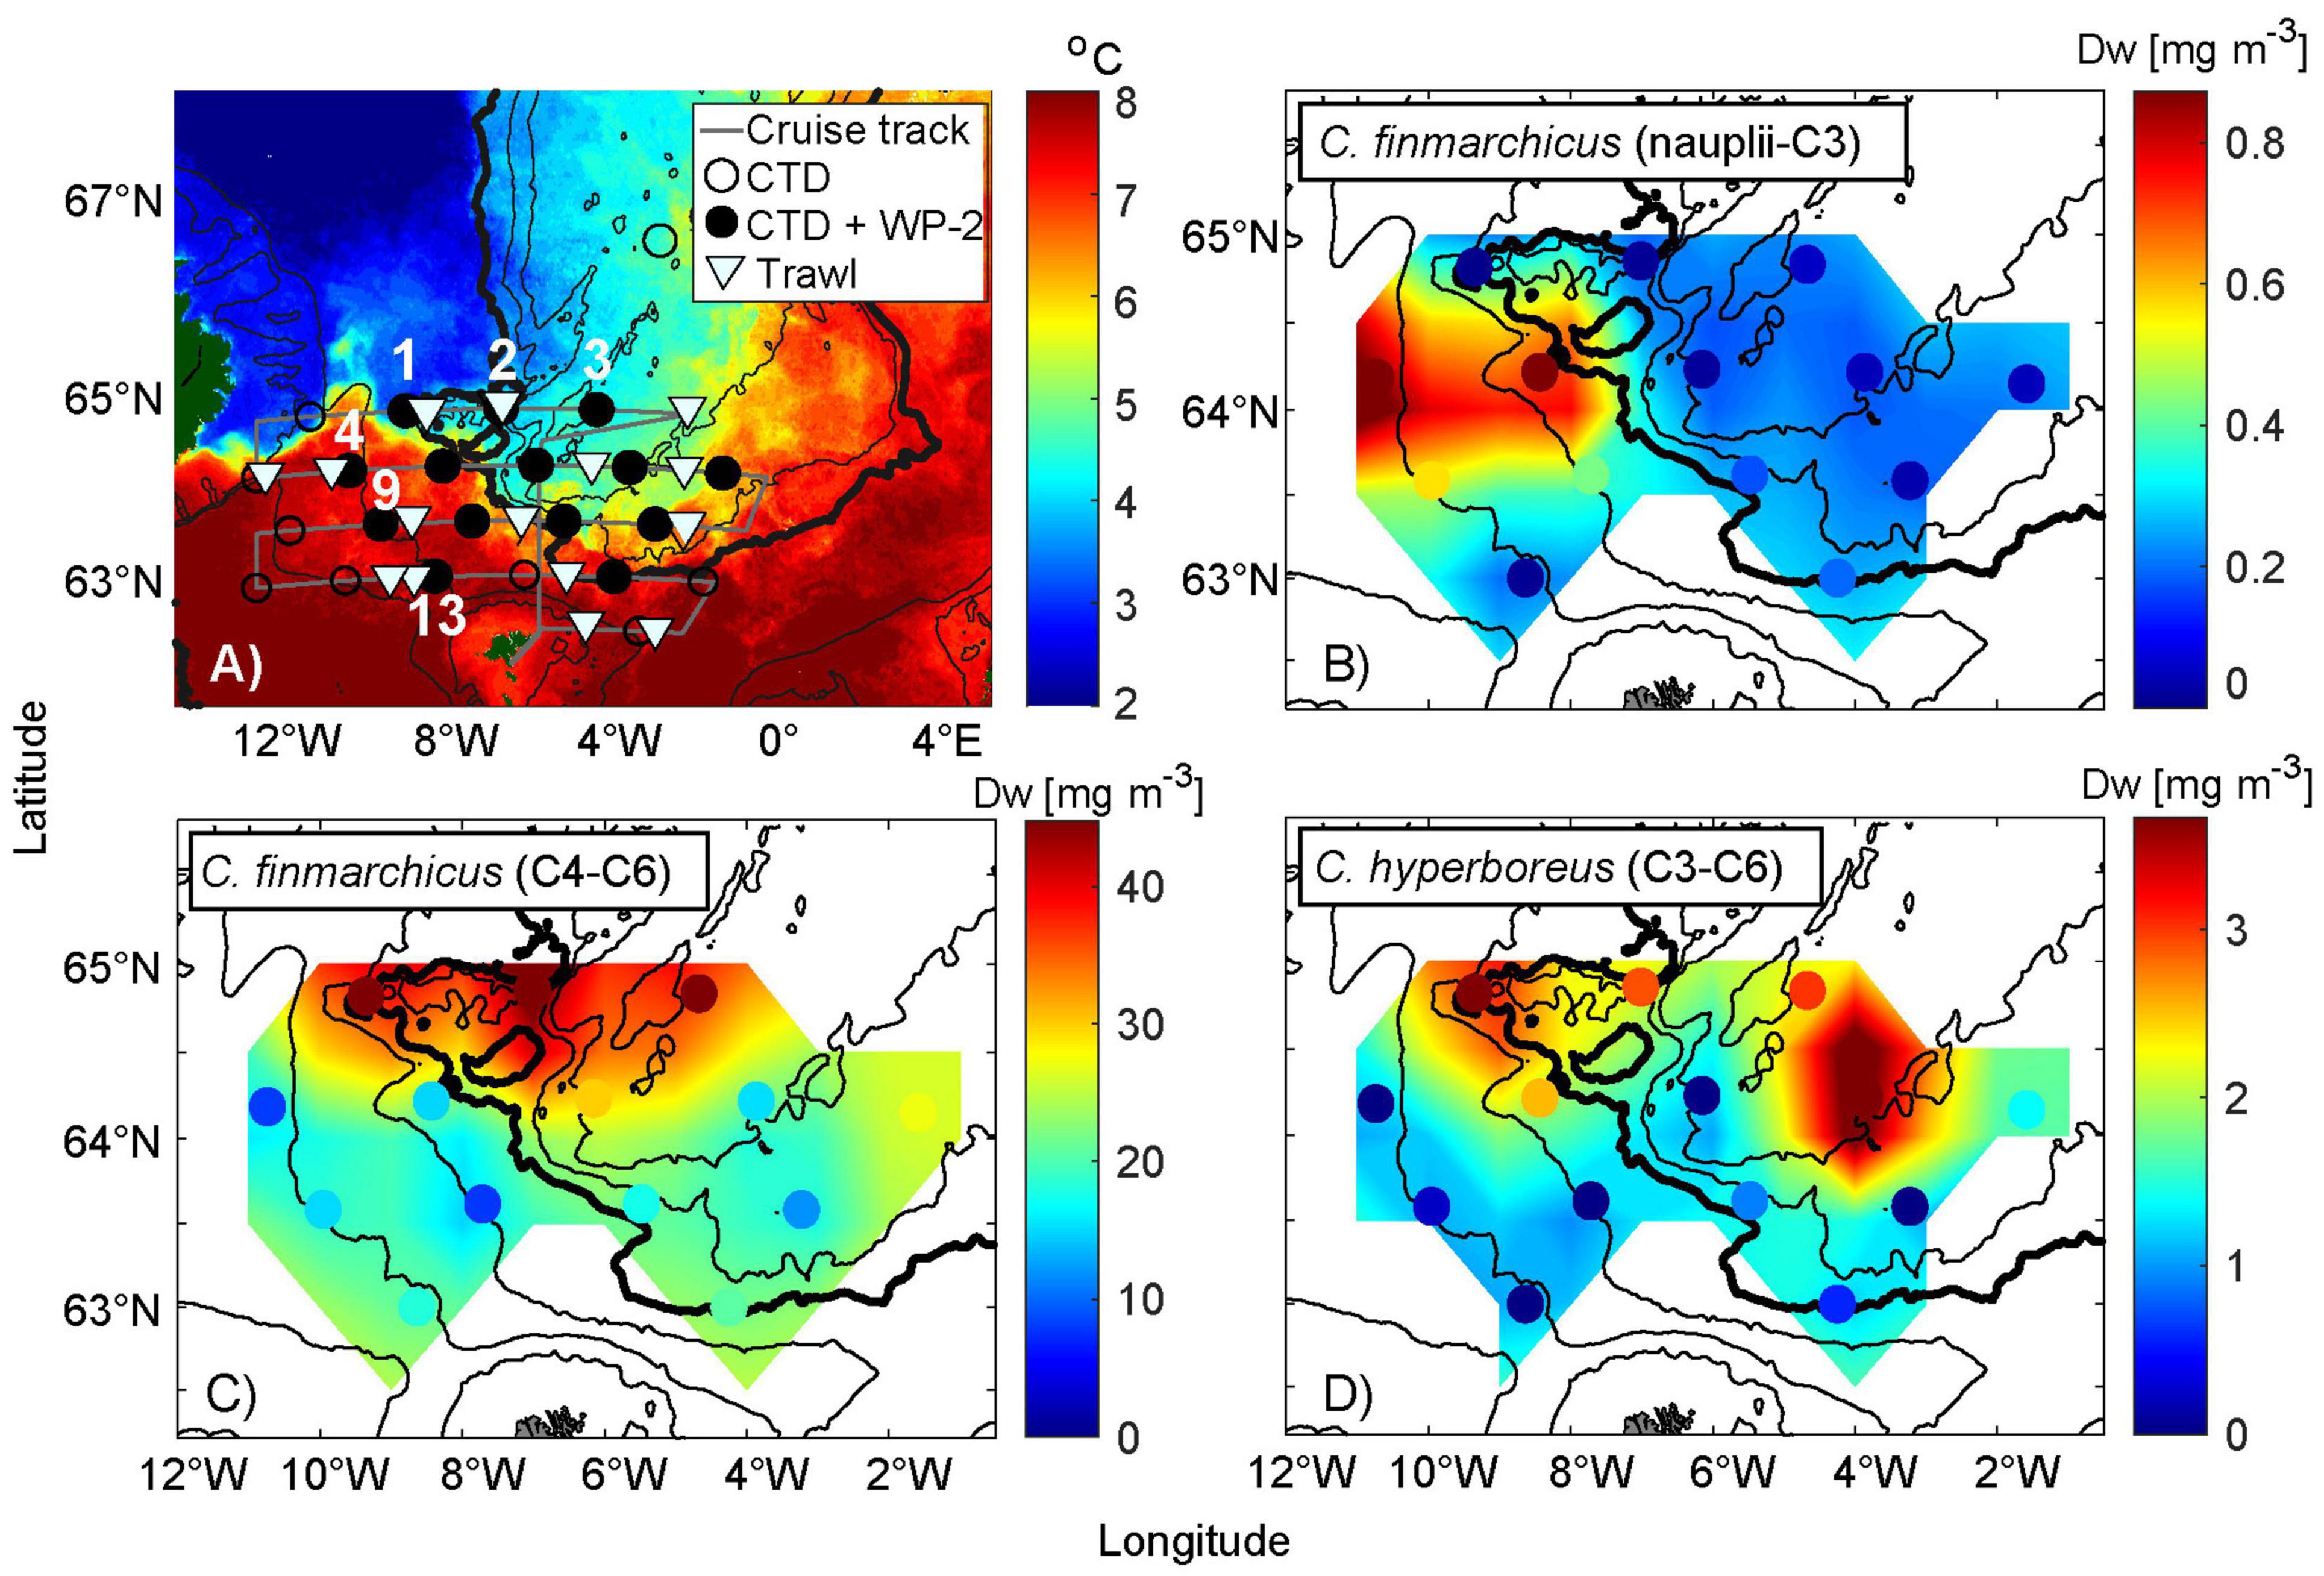
Figure 5. Biomass distribution of Calanus spp. in relation to hydrographic conditions in May 2020. (A) Average satellite-based sea surface temperature from 30th April to 9th May, (B) biomass of Calanus finmarchicus developmental stages nauplii-C3 (dry weight, Dw), (C) Calanus finmarchicus C4–C6, and (D) Calanus hyperboreus. The colored dots represent the sampling position as well as actual value. Detailed information is displayed in (A) including the sampling positions of only CTD measurements (circled dots) and CTD measurements together with counted zooplankton data (black dots) and average trawling positions (triangles). The black dotted stations along the cruise track (gray) are numbered from left to right. The northernmost track line contains stations from 1 to 3. Below are stations 4–8, followed by stations 9–12. The stations along the southernmost track line include 13–14. Stations 1 and 2 in (A) are in a region of particular interest. The 200, 500, 1,000, 2,000 (bold), 2,500, and 3,000 m depth contours are shown. Note that the map scale in (A) is different from the other three subplots. The scales of Calanus spp. concentrations also vary.
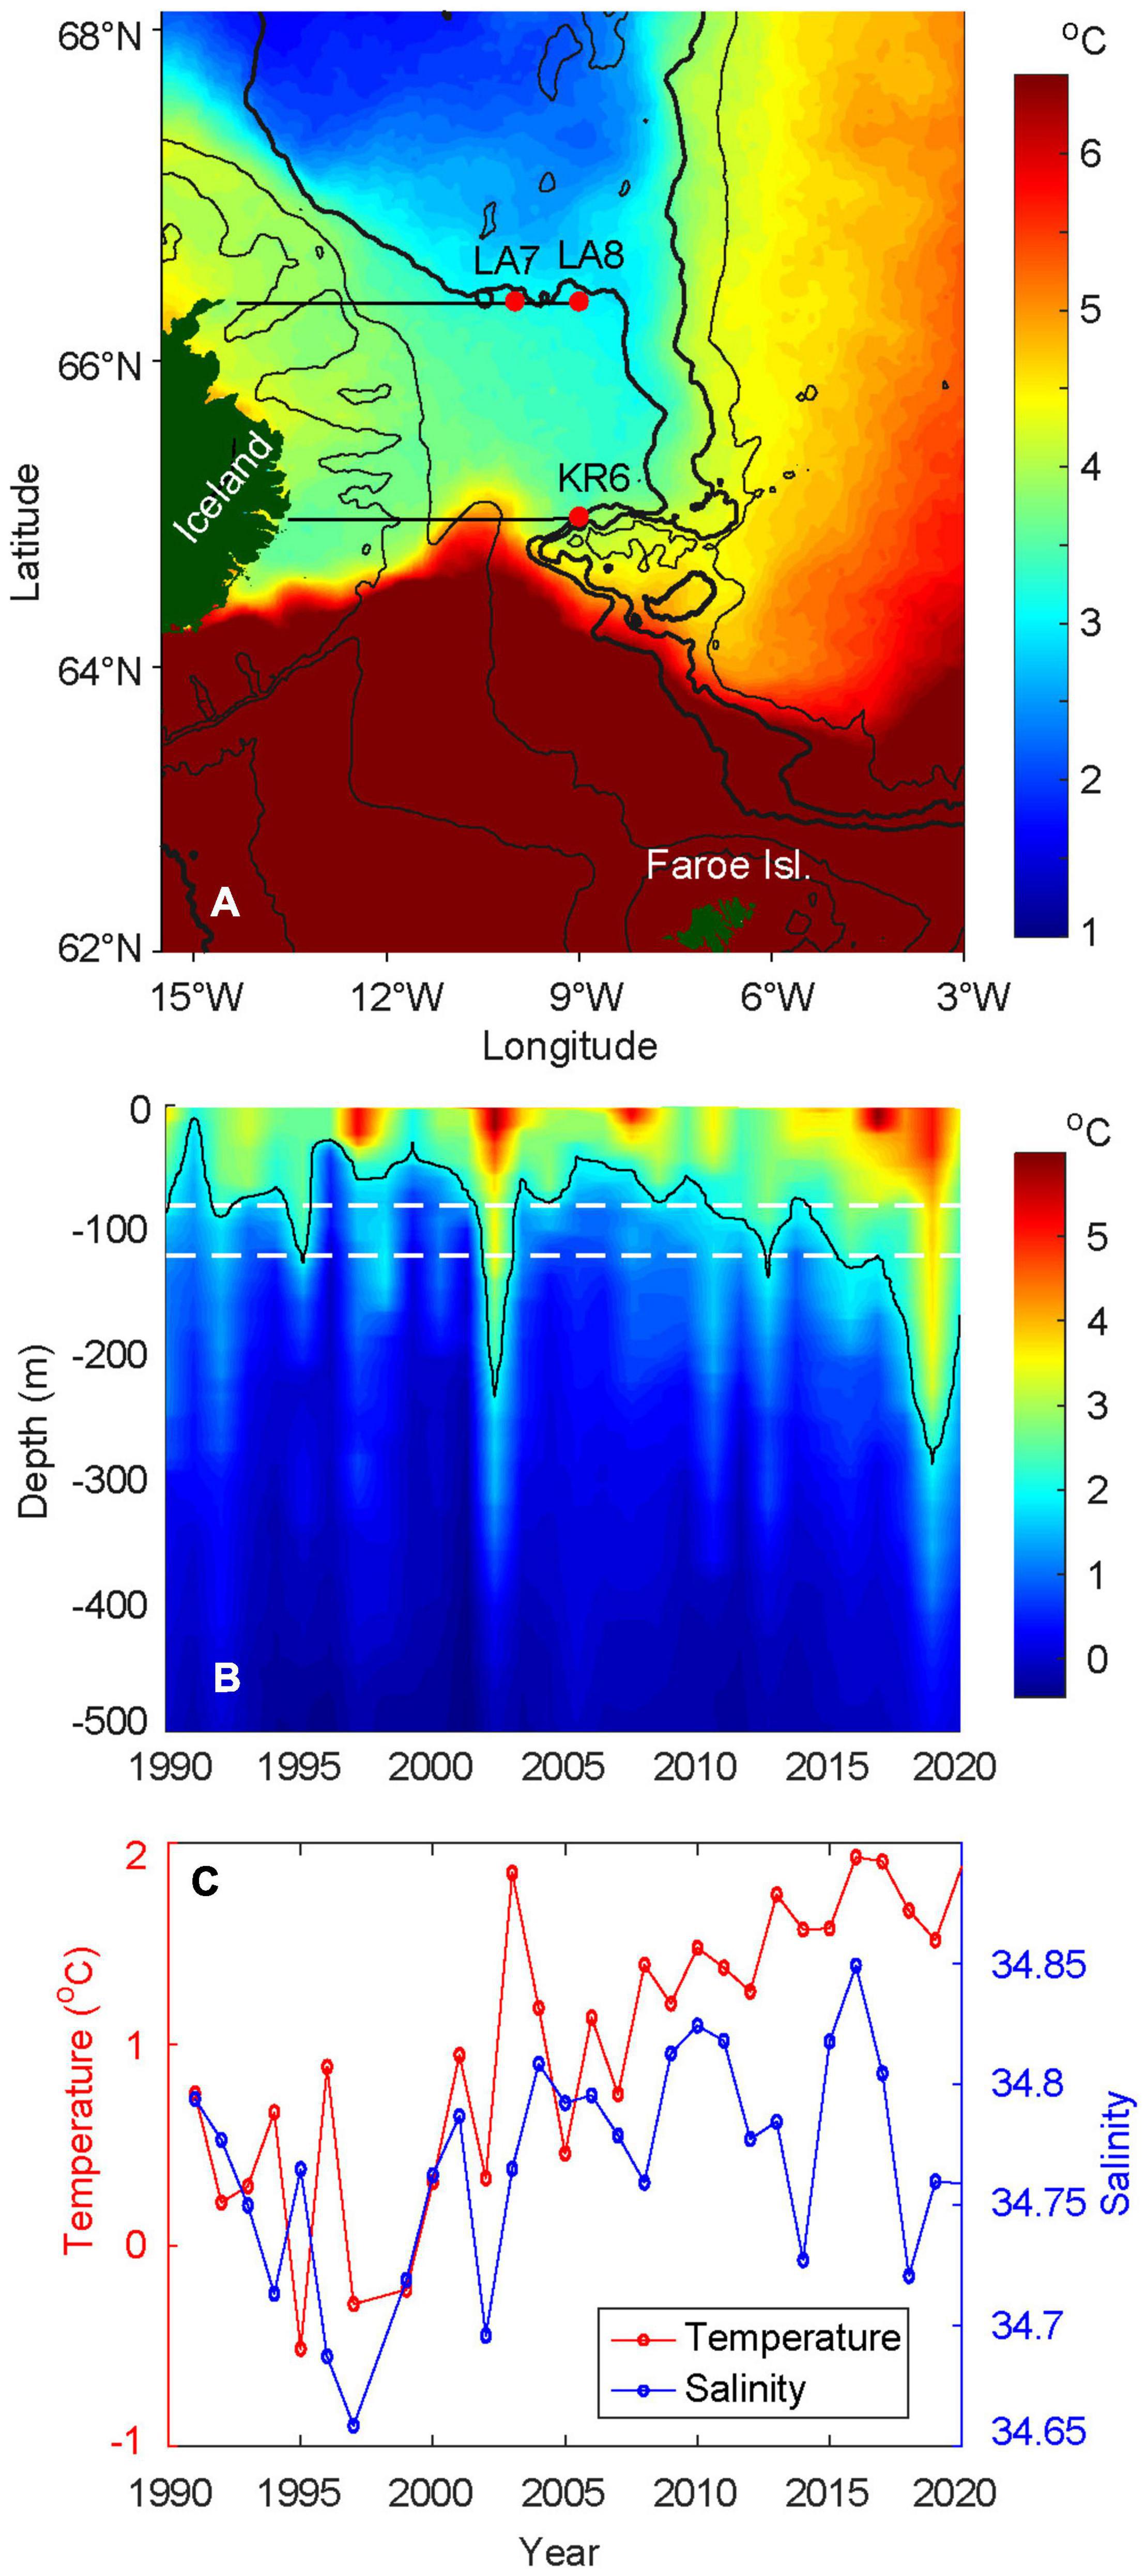
Figure 6. Hydrographic conditions near the feeding spot. (A) Average sea surface temperatures, in May, from 2003–2020, (B) depth-time plot of temperature, at KR6 from 1991 to 2020, and (C) average temperature and salinity conditions in May at LA7 and LA8, from 1991 to 2020, at depth between 80 and 120 m [white dashed lines in (B)]. See Supplementary Figures 2, 3 for detailed hydrographic conditions for the selected Icelandic sections. In (C), data is not available in 1998. The red dots in (A) are the positions of the selected Icelandic sections. The 200, 500, 1,400 (bold), 2,000 (bold), and 2,500 m isobaths are shown in black. In (B), the 2°C isothermal limit is displayed in black.
The highest abundances of C. hyperboreus (stages C3–C6) were sampled at station 1 (Figure 5), within the eastward extension of the arctic water from the Iceland Sea and—maybe surprisingly—farther east at station 8 (Figure 5D). Relatively high values are also observed between these locations (stations 2, 3, and 5). Increased concentrations of C. hyperboreus therefore roughly coincide with the G0 and adult C. finmarchicus population.
Although the younger stages of C. finmarchicus (nauplii and stages C1-C3) are not preferred herring food, they are also included in order to illustrate the contrast between subarctic water and AW (Figure 5B). High abundances were exclusively limited to stations 4 and 5, which is in the direct inflow of AW from the Iceland Basin. Since these likely represent the first generation (G1), this illustrates the earlier phenological cycle in these warmer waters. We should also bear in mind that the actual nauplii number are likely to be higher in the environment as the 200 μm WP-2 used undersamples the small-sized nauplii.
Hydrographic Boundaries and Inter-Annual Changes
Horizontal Temperature Distribution (Sea Surface Temperatures Maps)
A climatological SST map over the FS (2003–2020, Figure 6A) shows that the Icelandic tongue contains cold surface water (1–2°C) on average in May, and the southeastern tip of this tongue veers clockwise around the underwater plateau which extends eastwards from Iceland. This suggests that topographically controlled deep flows influence the hydrography all the way to the surface, at least during May. The steep escarpment between this plateau and previously mentioned underwater valley blocks direct southward flow, and thus redirects these currents west toward the head of the valley, before these cold waters are allowed to continue toward the Faroe slope. This establishes the JMF between pure EIW and NNAW, which begins at the steep northern slope of this valley and continues north along the Jan Mayen Ridge.
The marked SST contrast at 64.5–65.0°N near Iceland (and at monitoring station KR5, see Supplementary Figures 2, 3) shows the sharpest part of the IFF, which separates AW from the subarctic waters from the north. The northernmost limit of AW is observed at 10–11°W, and this retroflection of the AW flow is likely guided by the shallower part of the plateau (see 500 m isobaths in Figure 6A). East of the constriction point at the head of the underwater valley, the IFF—now as a slightly more diffuse front between AW and NNAW—continues toward the southeast, roughly following the 2000 m isobath.
Interannual Temperature Variability Near the Feeding Spot
The depth-time plot of temperatures at standard hydrographic station KR6 (Figure 6B), shows the environment which the herring has experienced in May, shortly before continuing its westward migration across the JMF and into the FS. Characteristic temperature peaks are observed in 1998, 2003, 2008, and 2017, which are also evident throughout the Nordic Seas (Malmberg and Valdimarsson, 2003; Hátún et al., 2005; Mork et al., 2019). Since around 2005, and more evidently since 2008, the depth of the 2°C isotherm has been increasing, between 30 and 120 m depths before 2003 to 80–280 m depths after 2005.
There is a significant difference in temperature before versus after 2003 (Welch t-test, p < 0.05). From the early 1990s to early 2000s, the temperature fluctuated at lower levels, with peaks observed in 1993 and 1996 (Figure 6C). In 2003, the temperature increased sharply by about 1.3°C. The following year, the temperature dropped again, although it continued to remain warmer than prior to 2003. The temperature has thereafter steadily increased, with a slight drop in 2019 and 2020. A regression analysis for the period 2004–2020 confirmed a significant positive trend with p < 0.05 and an average increase in temperature of 0.06°C per year. The salinity roughly follows the temperature pattern by being fresher during the colder years and more saline during the warmer years. After fluctuating at a higher level for a decade, the salinity dropped in 2014 and again in 2018 to 2020. In these years, the temperature did not decline with the salinity values.
Discussion
Combining our results with key findings from Eliasen et al. (2021); Hátún et al. (2021), Homrum et al. (in review), and Skagseth et al. (in review), we discuss the most plausible drivers underlying the highly variable herring migration in May. Since Eliasen et al. (2021) find that the observed major distribution shifts of old herring are primarily induced by external factors such as temperature and/or food abundance, we limit the discussion to these two parameters.
The Feeding Spot
The FS frames the focus of the present study (Figure 1). Argo floats from the Iceland Sea (Hátún et al., 2021) and calculations of the arctic water thickness and its eastward distribution from the Iceland Sea and into the Norwegian Sea (Skagseth et al., in review) consistently demonstrate how closely arctic water is confined along the 2,000 m depth contour along the Jan Mayen Ridge, which at its southern end turns sharply west into a deep sea “valley” (at ∼65°N), and then continues southeastwards. The marine environment north/west of the 2,000 m isobaths (the Icelandic tongue) is therefore very different from the water east/south of this isobaths. A northward “leakage” of AW from the northernmost retroflection point of the warm current (at 10–11°W, Figures 5, 6A) has an impact on the environment on the plateau which extends eastward from Iceland (65–66°N). We propose that the FS actually is a band of undiluted subarctic water veering clockwise between the 1,400 and 2,000 m isobaths, as is evident by bluish colors in the climatological SST map (Figure 6A). Our snap-shot view of both SST and in situ zooplankton in this region reveals the strong contrasts—high concentrations of overwintering C. finmarchicus (G0) and C. hyperboreus and absence of small C. finmarchicus (G1) in the subarctic water, and vice versa for the AW. This underscores the importance of respecting oceanographic boundaries, when carrying out such surveys, and subsequently analyzing the data. We also show that herring stomachs are persistently full within this particular region, and that stomach content almost solely is composed of the mentioned copepods. In addition, Homrum et al. (in review) demonstrate that herring occupying the western feeding area have the highest somatic condition. As the diet comprised increased abundance of C. hyperboreus during increased availability, suggests that C. finmarchicus may not be the only driver for the east to west migration during the feeding season. A unique aspect of the FS is that it consistently hosts large abundances of C. hyperboreus, and the recurrent congregation at this spot therefore strongly suggests that biomass of C. hyperboreus becomes increasingly more influential as the herring progresses further westwards during the feeding migration in May. These observations suggest that the FS is a highly persistent/dependable food source for Norwegian spring spawning herring in May.
Drivers for the Herring Occupancy of the Feeding Spot
Interannual variability in the influx of cold and zooplankton-rich waters into the Norwegian Sea strongly impacts the zooplankton community structure at the north Faroe slope (Section N, Figure 2; Kristiansen et al., 2016, 2019) as well as along the Norwegian slope (Svinøy Section, Skagseth et al., in review). This synchrony confirms a spatially extended biological influence from the western region. We here consider the idealistic perspective that the FS represents the dominant food (zooplankton) source within the Norwegian Sea, and that lower zooplankton abundances in west and/or reduced eastward water transport (influx) results in lower abundances of the overwintered C. finmarchicus and C. hyperboreus in the central and eastern part of the Norwegian Basin.
After spawning, adult herring migrate toward regions with higher food concentrations (Pavshtiks, 1956; Broms et al., 2012; Melle et al., 2020), and they could therefore be influenced by “enviroregulation,” as has been suggested for mackerel (Reid et al., 1997). Thus, decreasing overall zooplankton abundances would, decreasing overall zooplankton abundances would therefore compel herring to migrate closer to this source, i.e., the FS. We therefore consider the zooplankton abundance between the spawning grounds along the Norwegian shelf and the FS as a potential driver for westward migration. It is also well-known that the entrance of herring to the FS is limited by the local sea temperatures (Jakobsson and Østvedt, 1996; Misund et al., 1997). Since the relative importance of variable temperature and zooplankton abundance is not well understood, we will discuss the following hypotheses: The abundance of adult herring at the FS in May is determined by: Hypothesis I (Hyp I) accessibility to the FS (thermal restriction) and/or Hypothesis II (Hyp II) food abundance between Norwegian slope and the FS.
These hypotheses are discussed against the backdrop of contrasting herring distribution periods, 1996–1998, 1999–2002, and 2003–2016, inspired by Eliasen et al. (2021), in addition to the increase in subarctic waters masses (Mork et al., 2019; Holliday et al., 2020; Skagseth et al., in review) and the increase in C. hyperboreus and the large stages of C. finmarchicus in the southwestern Norwegian Sea, 2017–2020, shown herein. To compliment the spatio-temporally limited zooplankton and stomach data, presented in the present study, we also utilize the total zooplankton biomass from the IESNS survey, vertically averaged over the upper 200 m and temporally averaged over the periods mentioned above (Figure 7, with the raw data presented in Supplementary Figure 6).
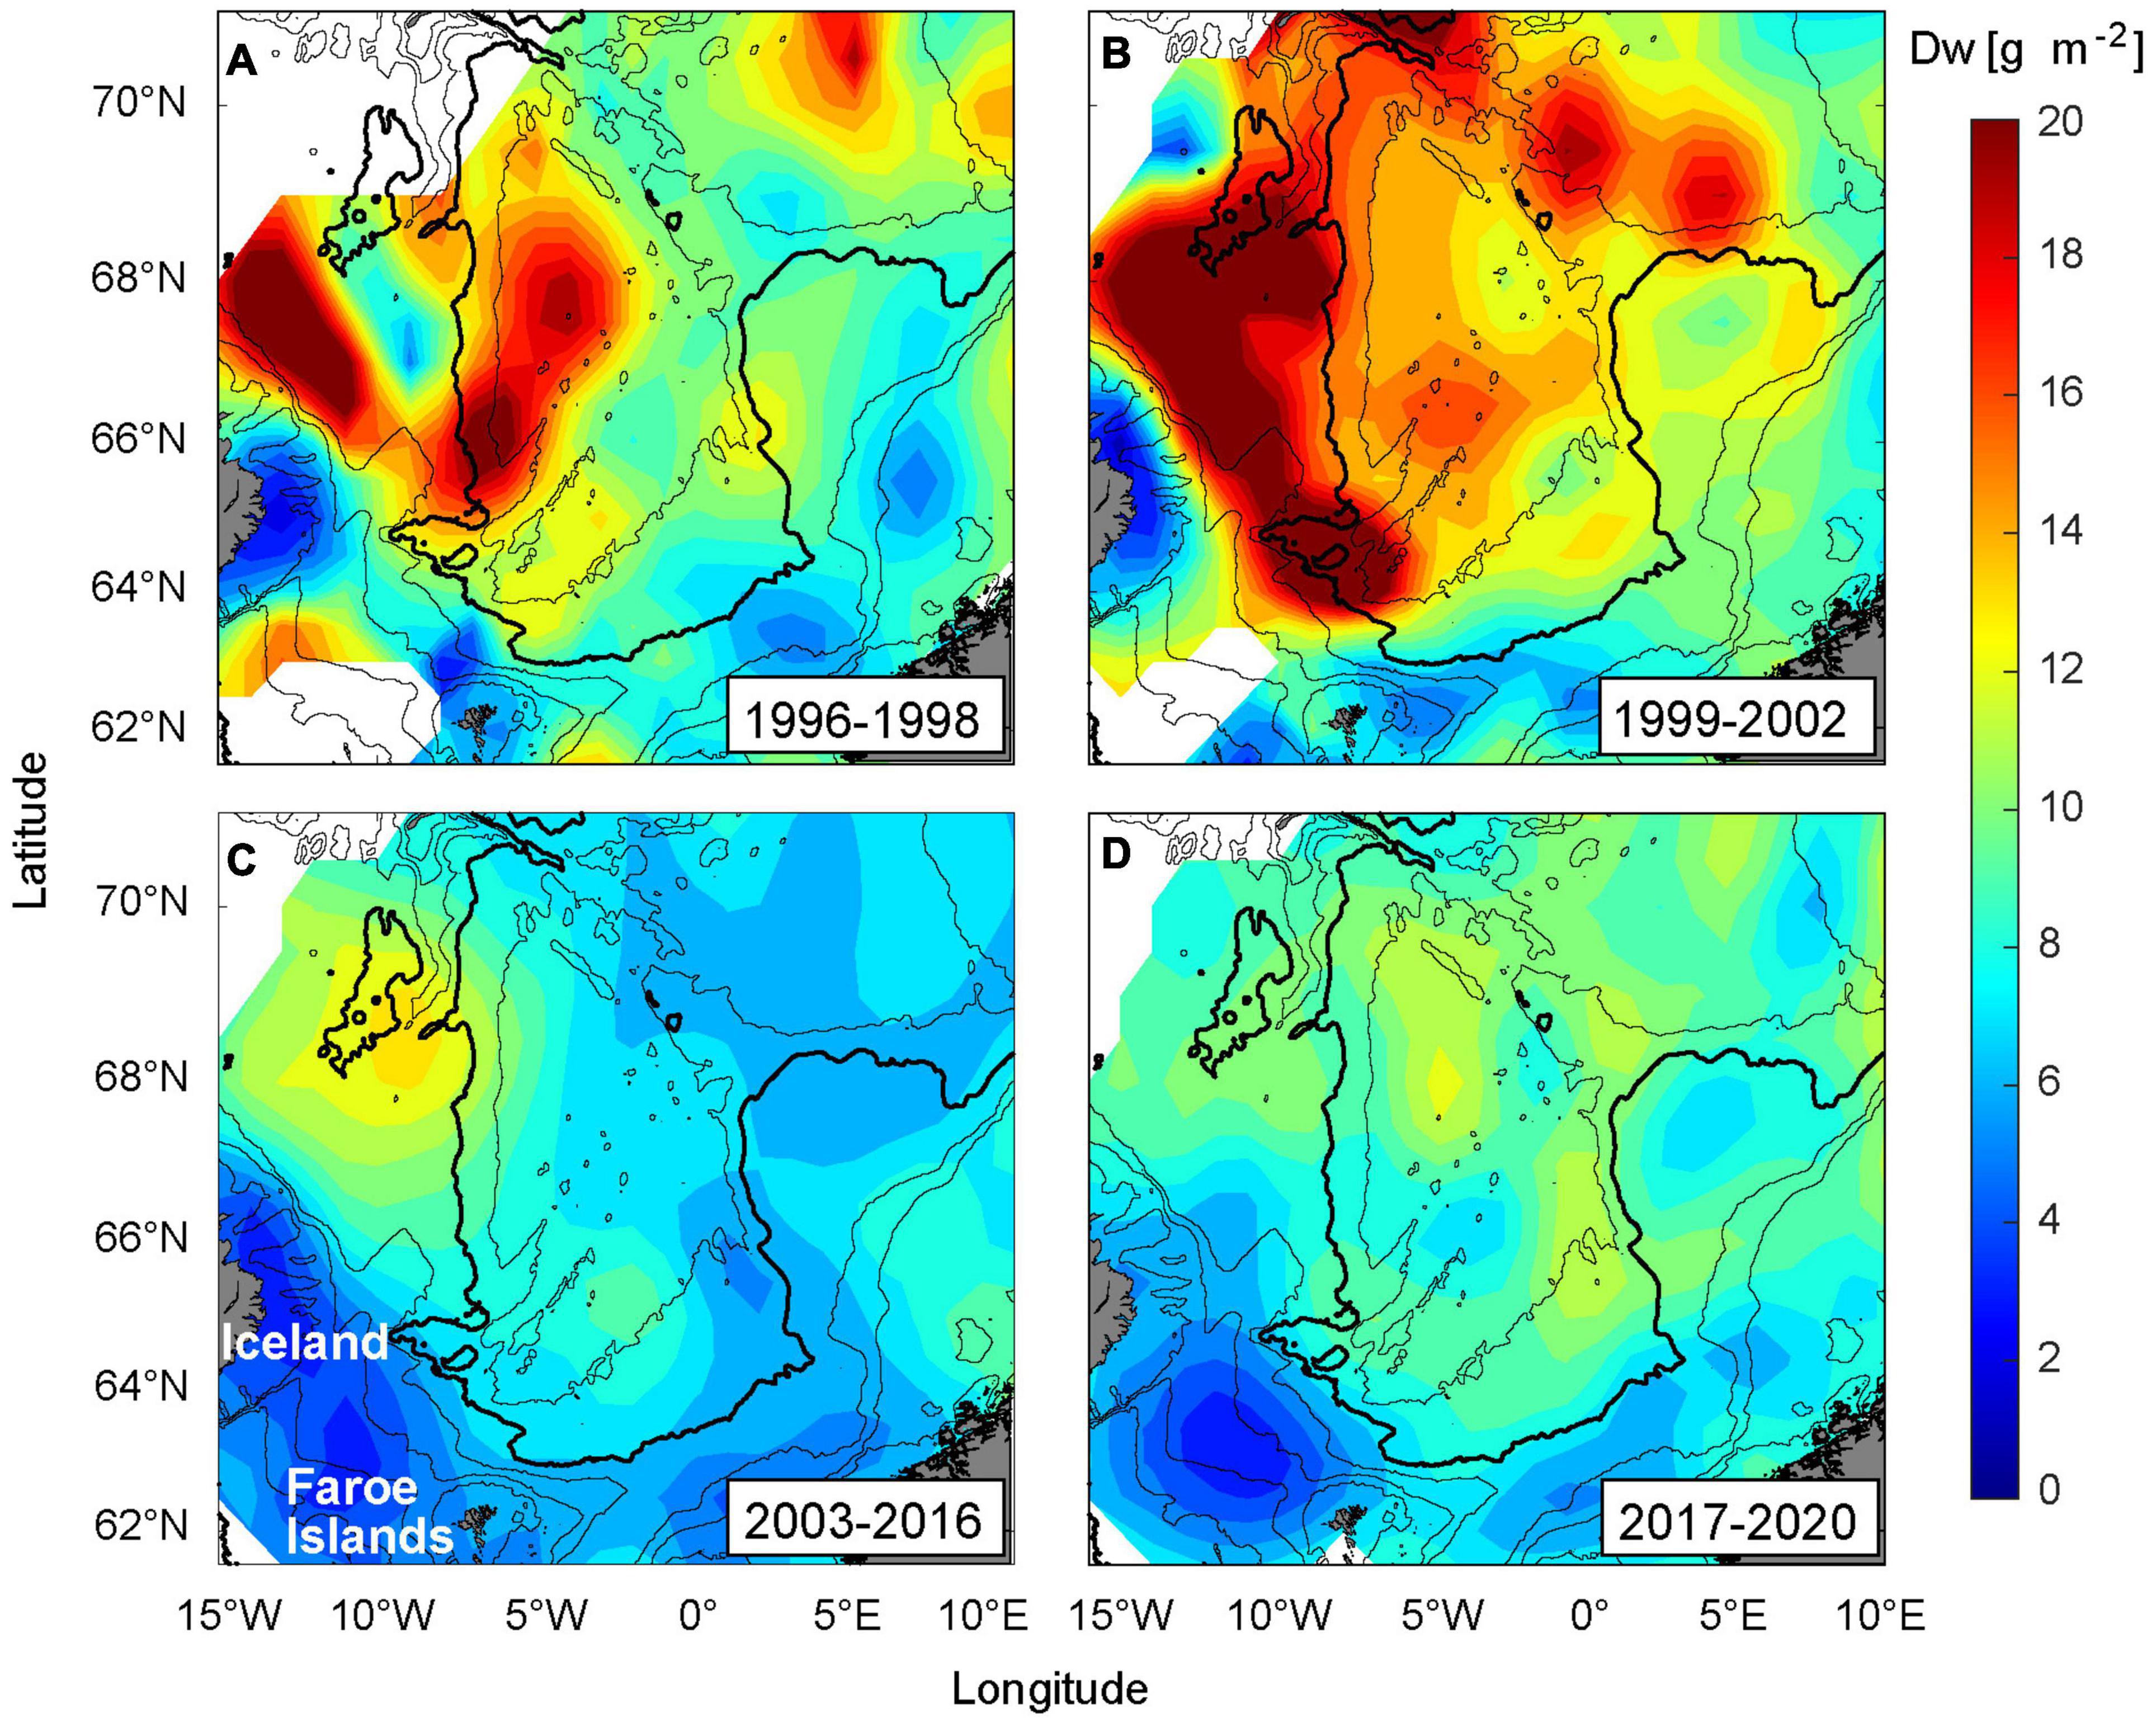
Figure 7. Biomass of zooplankton (dry weight, Dw) distribution in May, averaged over the upper 200 m, and divided into the following four periods. (A) 1996–1998, (B) 1999–2002, (C) 2003–2016, and (D) 2017–2020. The 200, 500, 1,000, 2,000 (bold), and 3,000 m depth contours are shown.
The parameters used to assess the overall conditions for each period (see Table 2) are: Herring distribution (8 + years old) (Eliasen et al., 2021, their Figure 6), Temperature near the FS (Figure 6C, details below), Influx of subarctic water masses (EIW and Arctic Intermediate Water) to the southern Norwegian Sea (Kristiansen et al., 2019; Skagseth et al., in review), Calanus sizes at Sections N (Figure 2) and the Svinøy Section (Skagseth et al., in review), where “large” refers to high abundance of the large C. finmarchicus stages (C4–C6) and high abundances of C. hyperboreus, and “small” refers to high abundance of the smaller C. finmarchicus stages (C1–C3), and low abundances of C. hyperboreus, Food west (Iceland Sea and western Norwegian Sea) and Food East (eastern Norwegian Sea). Prior to 2007, the food abundance estimates are purely based on the IESNS survey (Figure 7), while intermittently from 2007–2011, and again from 2017–2020, the evaluation of these data is complemented by stomach data (Figures 3, 4).
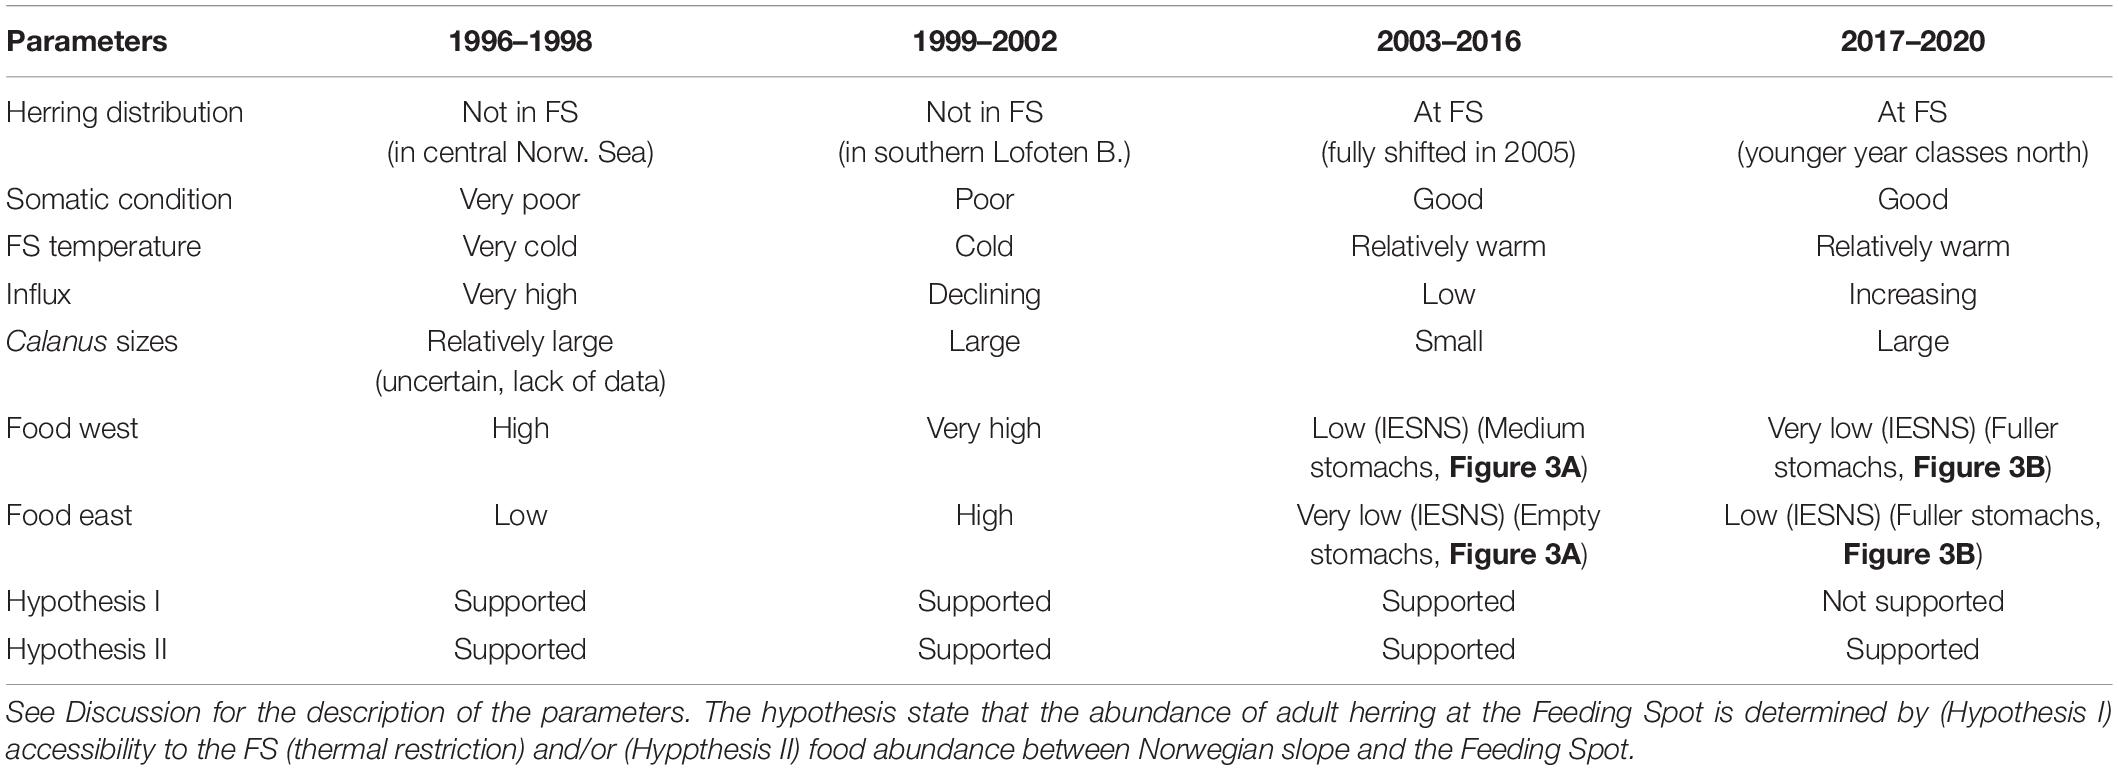
Table 2. Overview over relevant parameters for assessing the posed hypotheses during the four contrasting periods.
The waters at KR6 are thermally stratified in May in the upper ∼150 m, with upper temperatures higher than 2°C, which is tolerable for herring. On top of the general warming through the observation period (1991–2020) rides strong interannual variability, likely induced by variable intrusions of AW, as well as air-sea heat exchanges. At the upstream LA stations, there is a thin and likely intermittent thermal stratification, with average near-surface temperatures just over 2°C and thus near the herring tolerance limit. Our “Temperature near the FS” parameter (Table 2) is estimated by a depth-average under the spring mixed layer (80–120 m) (ICES, 2016) at stations LA7 and LA8. This sensitive region experienced sub-zero temperatures during the late 1990s, but has warmed by about 2°C since then.
1996–1998
Adult herring congregated in the central and northern Norwegian Sea and were largely absent from the FS (Eliasen et al., 2021). Both temperatures and salinities were at their lowest through the observation period, supporting Hyp I. The influx of subarctic waters into the Norwegian Sea was very high (Kristiansen et al., 2019; Skagseth et al., in review), and the transported Calanus sizes were probably relatively large. This metric is, however, uncertain due to lack of data at Section N in 1996 and 1998. Food abundance was high on the western side, and much lower on the eastern side (Figure 7A), which supports Hyp II. The conditions for the four periods are summarized in Table 2.
1999–2002
Herring occupied the southern Lofoten Basin, and were totally absent from the FS (the literature references are hereafter as in the previous paragraph, if not stated otherwise). The northeastward displacement coincided with a continuous high influx, although declining throughout the period. The sustained high flow of nutrient-rich waters from the west contained increased zooplankton concentrations (Figure 7B), which likely boosted the secondary production the following consecutive years during spring. The transported Calanus sizes were at their largest during the observation period and the zooplankton biomass was also at its highest throughout the study region, including along the Norwegian slope and in the Lofoten Basin. This supports Hyp II. We suggest that the continued low temperature hindered herring in entering the FS, which supports Hyp I.
2003–2016
Herring started to shift southwards in 2003, and were congregating at the FS from 2005 and afterward. There was a marked temperature increase in 2003, and after a slight decline in 2005, the temperatures steadily increased until 2016, which strongly supports Hyp I. The influx was much reduced, and only small Calanus sizes were transported eastwards during this period. The food availability had reduced drastically throughout the Norwegian and the Iceland Seas (Figure 7C), which was also reflected in the somatch content (Figure 3A). Moderate values of both zooplankton biomass and SFI were only observed at, and upstream of, the FS, which thus strongly supports Hyp II.
2017–2020
Adult herring were still congregating at the FS. Despite a salinity decline, the temperatures at the FS remained high (Figure 6B), which supports Hyp I. The EIW influx and the Calanus sizes increased at both the north Faroe and Norwegian slopes, although not to the pre-2003 levels. The food on the western side was still relatively low, while a moderate increase had taken place on the eastern side (Figure 7D). The SFI maps, however, suggest a marked increase (compared to the 2007–2011 period), and species differentiated stomach data reveal a large consumption of C. hyperboreus in the southeastern, as well as in the southwestern, Norwegian Sea (Figure 4F). Hyp II is therefore not supported.
Although this tentative evaluation does not provide final proofs, it suggests that the FS is indeed important for the condition of the herring stock, and that low temperatures can restrict herring from utilizing this important region. We also find that generally high abundances of zooplankton in the Norwegian Sea reduces the motivation to seek the FS.
Some Remaining Questions
Absence of herring from the FS in May (1996–2002, Table 2) is associated with poor somatic conditions during autumn (Homrum et al., in review), while the somatic conditions improved after 2003, when herring persistently congregated near the FS. While this supports our view of FS being an important and persistent feeding region, it also poses the apparent conundrum: poor conditions coincide with large zooplankton influx, while good conditions follow years with reduced influx. The improving somatic conditions after 2003 are likely due to more persistent feeding activity in Icelandic waters into the autumn months (Homrum et al., in review). This information fuels us with a second question: Is this temporally extended western occupation a prosperous sign of the increased abundance of a second C. finmarchicus generation during recent years (Strand et al., 2020), or is this an impoverished sign of reduced feeding conditions during spring and summer?
While temperature and food abundances clearly are important drivers for herring post-spawning migration dynamics, closer scrutiny of the feeding dynamics should include aspects like “learning” as the stock is able to gather in regions with high zooplankton densities due to their memory capabilities (Corten, 2000) as well as social learning (Corten, 2002).
It is, furthermore, tempting to ask if the temporally extended stay in Icelandic waters could influence recruitment at the spawning grounds along the Norwegian shelf. More than a hundred years ago Helland-Hansen and Nansen (1909) postulated that increased influx of subarctic waters toward the Norwegian shelf could have beneficial impact on e.g., herring recruitment. It is therefore noteworthy that recent good year-classes were spawned in 2002 and 2016, when high abundances of C. hyperboreus and larger C. finmarchicus developmental stages (Figure 2) were transported toward Norway, while the intermediate years, with mainly smaller individuals of C. finmarchicus and hardly any C. hyperboreus, did not provide any really good year classes. A thorough treatment of these questions is, however, beyond the scope of the present work whose focus is on conditions in May.
Conclusion
Our assessment, based on results presented herein, and in four other parallel papers, suggest that there is an optimal Feeding Spot (FS) for Norwegian spring spawning herring east of Iceland, in a region where confluence of cold subarctic waters from the Iceland Sea and south along the Jan Mayen Ridge lead to persistent supply of Calanus hyperboreus and large overwintered Calanus finmarchicus. Herring stomachs are persistently full in this region, and when a large part of the herring stock congregates at this location, the somatic conditions are high. Low temperatures can, however, restrict herring from entering this region, which results in deteriorated somatic conditions. There are also indications that zooplankton abundance in the Norwegian Sea regulates the motivation of herring to swim all the way from the spawning grounds along the Norwegian shelf to the FS. This food-driven “enviroregulation” would predict an eastward shifted herring distribution in May after 2016. However, this was not evident as the older herring remained in the FS, indulging on elevated food concentrations whilst temperature conditions remained suitable.
Data Availability Statement
The original contributions presented in the study are included in the article/Supplementary Material, further inquiries can be directed to the corresponding author.
Author Contributions
IK and HH composed the story. IK did the data analysis and led the writing process. HH, SE, JJ, and EG provided input to the data, analysis, and discussion. HP provided invaluable Icelandic data. All co-authors have read, commented, and agreed to the manuscript before submission.
Funding
This study was funded by the Fisheries Research Fund of the Faroe Islands (project number 19/00645), and comprised a part of a Ph.D. project on the ecology of C. finmarchicus in relation to environmental conditions in the southwestern Norwegian Sea.
Conflict of Interest
The authors declare that the research was conducted in the absence of any commercial or financial relationships that could be construed as a potential conflict of interest.
Publisher’s Note
All claims expressed in this article are solely those of the authors and do not necessarily represent those of their affiliated organizations, or those of the publisher, the editors and the reviewers. Any product that may be evaluated in this article, or claim that may be made by its manufacturer, is not guaranteed or endorsed by the publisher.
Acknowledgments
We are grateful for the help and constructive comments from co-workers, WGINOR members, and reviewers. We also wish to extend our gratitude to getting access to the PGNAPES database and to Solveig Olafsdottir for providing and discussing hydrographic data from the two Icelandic monitoring sections.
Supplementary Material
The Supplementary Material for this article can be found online at: https://www.frontiersin.org/articles/10.3389/fmars.2022.823006/full#supplementary-material
References
Astthorsson, O. S., and Gislason, A. (2003). Seasonal variations in abundance, development and vertical distribution of Calanus finmarchicus, C. hyperboreus and C. glacialis in the East Icelandic Current. J. Plankton Res. 25, 843–854. doi: 10.1093/plankt/25.7.843
Bachiller, E., Skaret, G., Nøttestad, L., and Slotte, A. (2016). Feeding ecology of northeast atlantic mackerel, norwegian spring-spawning herring and blue whiting in the norwegian sea. PLoS One 2:25. doi: 10.5061/dryad.f5r7f
Blindheim, J. (2004). “Oceanography and climate,” in The Norwegian Sea Ecosystem, ed. H. R. Skjoldal (Trondheim: Tapir Academic Press), 65–96.
Blindheim, J., Borovkov, V., Hansen, B., Malmberg, S., and Turrell, W. R. (2000). Upper layer cooling and freshening in the Norwegian Sea in relation to atmospheric forcing. Deep Sea Res. I 47, 655–680. doi: 10.1016/s0967-0637(99)00070-9
Böhme, L., and Send, U. (2005). Objective analyses of hydrographic data for referencing profiling float salinities in highly variable environments. Deep Sea Res. II 52, 651–664. doi: 10.1016/j.dsr2.2004.12.014
Broms, C., Melle, W., and Horne, J. K. (2012). Navigation mechanisms of herring during feeding migration: the role of ecological gradients on an oceanic scale. Mar. Biol. Res. 8, 461–474. doi: 10.1080/17451000.2011.640689
Corten, A. (2000). A possible adaptation of herring feeding migrations to a change in timing of the Calanus finmarchicus season in the eastern North Sea. ICES J. Mar. Sci. 57, 1261–1270. doi: 10.1006/jmsc.2000.0812
Corten, A. (2002). The role of “conservatism” in herring migrations. Rev. Fish Biol. Fish. 11, 339–361.
Dalpadado, P., Ellertsen, B., Melle, W., and Dommasnes, A. (2000). Food and feeding conditions of Norwegian spring-spawning herring (Clupea harengus) through its feeding migrations. ICES J. Mar. Sci. 57, 843–857. doi: 10.1006/jmsc.2000.0573
Deblois, E. M., and Rose, G. A. (1995). Effect of foraging activity on the shoal structure of cod (Gadus morhua). Can. J. Fish. Aquat. Sci. 52, 2377–2387. doi: 10.1139/f95-830
Eliasen, S. K., Homrum, E. I., Jacobsen, J. A., Kristiansen, I., Óskarsson, G. J., Salthaug, A., et al. (2021). Spatial distribution of different age groups of herring in Norwegian Sea, May 1996-2020. Front. Mar. Sci. 8:778725. doi: 10.3389/fmars.2021.778725
Fernö, A., Pitcher, T. J., Melle, W., Nøttestad, L., Mackinson, S., Hollingworth, C., et al. (1998). The challenge of the herring in the Norwegian Sea: making optimal collective spatial decisions. Sarsia 83, 149–167. doi: 10.1080/00364827.1998.10413679
Gislason, A., and Astthorsson, O. S. (2002). The food of Norwegian spring-spawning herring in the western Norwegian Sea in relation to the annual cycle of zooplankton. Sarsia 87, 236–247. doi: 10.1080/00364820260294860
Gislason, A., Gudmundsson, K., Olafsdottir, S. R., and Petursdottir, H. (2021). Inter-annual and decadal variability of Calanus finmarchicus and C. hyperboreus in Subarctic waters north of Iceland 1990-2020. ICES J. Mar. Sci. 79:246. doi: 10.1093/icesjms/fsab218
Häkkinen, S., and Rhines, P. B. (2004). Decline of subpolar North Atlantic circulation during the 1990s. Science 304, 555–559. doi: 10.1126/science.1094917
Hátún, H., and Chafik, L. (2018). On the recent ambiguity of the North Atlantic Subpolar Gyre Index. J. Geophys. Res. 123, 1–5. doi: 10.1029/2018JC014101
Hátún, H., Chafik, L., and Larsen, K. M. H. (2021). The Norwegian Sea Gyre – a regulator of iceland-scotland ridge exchanges. Front. Mar. Sci. 8:694614. doi: 10.3389/fmars.2021.694614
Hátún, H., Sandø, A. B., Drange, H., Hansen, B., and Valdimarsson, H. (2005). Influence of the Atlantic subpolar gyre on the thermohaline circulation. Science 309, 1841–1844. doi: 10.1126/science.1114777
Hay, S., Kiørboe, T., and Matthews, A. (1991). Zooplankton biomass and production in the North Sea during the Autumn Circulation Experiment, October 1987-March 1988. Cont. Shelf Res. 11, 1453–1476. doi: 10.1016/0278-4343(91)90021-W
Helland-Hansen, B., and Nansen, F. (1909). The Norwegian Sea - Its Physical Oceanography Based Upon the Norwegian Researches 19001904. Kristiania: Det Mallingske Bogtrykkeri.
Hirche, H. J. (1997). Life cycle of the copepod Calanus hyperboreus in the Greenland Sea. Mar. Biol. 128, 607–618. doi: 10.1007/s002270050127
Holliday, N. P., Bersch, M., Berx, B., Chafik, L., Cunningham, S., Florindo-López, C., et al. (2020). Ocean circulation causes the largest freshening event for 120 years in eastern subpolar North Atlantic. Nat. Commun. 11:585. doi: 10.1038/s41467-020-14474-y
Holliday, N. P., Hughes, S. L., Bacon, S., Beszczynska-Möller, A., Hansen, B., Lavín, A., et al. (2008). Reversal of the 1960s to 1990s freshening trend in the northeast North Atlantic and Nordic Seas. Geophys. Res. Lett. 35:L03614. doi: 10.1029/2007GL032675
Holst, J. C., Blindheim, J., Couperus, B., Hammer, C., Jákupsstovu, H., Melle, W., et al. (1999). Report on Surveys of the Distribution, Abundance and Migrations of the Norwegian Spring-Spawning Herring, Other Pelagic Fish and the Environment of the Norwegian Sea and Adjacent Waters in Late Winter, Spring and Summer of 1999. Available online at: https://www.hav.fo/PDF/Ritgerdir/2001/PGSPFN_report_2001.pdf (accessed April 1, 2021).
Holst, J. C., Dragesund, O., Hamre, J., Misund, O. A., and Østvedt, O. J. (2002). Fifty years of herring migrations in the Norwegian Sea. ICES Mar. Sci. Symp. 215, 352–360.
Holst, J. C., Røttingen, I., and Melle, W. (2004). “The Herring,” in The Norwegian Sea Ecosystem, ed. H. R. Skjoldal (Trondheim: Tapir Academic Press), 203–226.
Holst, J. C., and Slotte, A. (1998). Effects of juvenile nursery on geographic spawning distribution in Norwegian spring-spawning herring (Clupea harengus L.). ICES J. Mar. Sci. 55, 987–996. doi: 10.1006/jmsc.1998.0371
Homrum, E. I., Óskarsson, G. J., Ono, K., Hølleland, S., and Slotte, A. (in review). Large-scale changes in the spatiotemporal distribution of Norwegian spring spawning herring (Clupea harengus) following warming and freshening of the Norwegian Sea: effects on somatic condition and gonad development. Front. Mar. Sci.
ICES (2016). Report of the Working Group of International Pelagic Surveys (WGIPS), 18-22 January, Dublin, Ireland. ICES CM 2016/SSGIEOM:05. (Dublin: ICES), 433.
ICES (2020). Working group on the integrated assessments of the Norwegian Sea (WGINOR; outputs from 2020 meeting). ICES Sci. Rep. 3:114. doi: 10.17895/ices.pub.8021
Jakobsson, J., and Østvedt, O. J. (1996). A Preliminary Review of Joint Investigations on the Distribution of Herring in the Norwegian and Iceland Seas 1950-1970. Available online at: https://imr.brage.unit.no/imr-xmlui/bitstream/handle/11250/105621/CM_1996_H_14.pdf?sequence=1&isAllowed=y (accessed April 1, 2021).
Kristiansen, I., Gaard, E., Hátún, H., Jónasdóttir, S., and Ferreira, A. S. A. (2016). Persistent shift of Calanus spp. in the southwestern Norwegian Sea since 2003, linked to ocean climate. ICES J. Mar. Sci. 73, 1319–1329. doi: 10.1038/278097a0
Kristiansen, I., Hátún, H., Petursdottir, H., Gislason, A., Broms, C., Melle, W., et al. (2019). Decreased influx of Calanus spp. into the south-western Norwegian Sea since 2003. Deep. Res. Part I Oceanogr. Res. Pap. 149:103048. doi: 10.1016/j.dsr.2019.05.008
Kristiansen, I., Jónasdóttir, S. H., Gaard, E., Eliasen, S. K., and Hátún, H. (2021). Seasonal variations in population dynamics of Calanus finmarchicus in relation to environmental conditions in the southwestern Norwegian Sea. Deep Sea Res. Part I Oceanogr. Res. Pap. 171:103508. doi: 10.1016/j.dsr.2021.103508
Larsen, K. M. H., Hátun, H., Hansen, B., and Kristiansen, R. (2012). Atlantic water in the Faroe area: sources and variability. ICES J. Mar. Sci. 69, 802–808. doi: 10.1093/icesjms/fst048
Macrander, A., Valdimarsson, H., and Jónsson, S. (2014). Improved transport estimate of the East Icelandic Current 2002–2012. J. Geophys. Res. 119, 3407–3424. doi: 10.1002/2013JC009517
Malmberg, S. A., and Valdimarsson, H. (2003). Hydrographic conditions in Icelandic waters, 1990-1999. ICES J. Mar. Sci. 219, 50–60.
Melle, W., Klevjer, T., Strand, E., Wiebe, P. H., Slotte, A., and Huse, G. (2020). Fine-scale observations of physical and biological environment along a herring feeding migration route. Deep Res. Part II 180:104845. doi: 10.1016/j.dsr2.2020.104845
Misund, O. A., Melle, W., and Fernö, A. (1997). Migration behaviour of norwegian spring spawning herring when entering the cold front in the norwegian sea. Sarsia 82, 107–112. doi: 10.1080/00364827.1997.10413644
Misund, O. A., Vilhjálmsson, H., Jákupsstovu, S. H. Í, Røttingen, I., Belikov, S., Asthorsson, O., et al. (1998). Distribution, migration and abundance of norwegian spring spawning herring in relation to the temperature and zooplankton biomass in the Norwegian Sea as recorded by coordinated surveys in spring and summer 1996. Sarsia 83, 117–127. doi: 10.1080/00364827.1998.10413677
Mork, K. A., Skagseth, Ø., and Søiland, H. (2019). Recent warming and freshening of the Norwegian Sea observed by Argo data. J. Clim. 32, 3695–3705. doi: 10.1175/JCLI-D-18-0591.1
Østvedt, O. J. (1965). The migration of Norwegian herring to Icelandic waters and the environmental conditions in May-June 1961-1964. Fisk. Skr. Ser. Havundersøkelser 13, 29–47.
Pavshtiks, E. A. (1956). Seasonal changes in plankton and feeding migrations of herring. Herring North Eur. Basin Adjac. Seas 1, 104–139. doi: 10.1890/08-1817.1
Reid, D. G., Turrell, W. R., Walsh, M., and Corten, A. (1997). Cross-shelf processes north of Scotland in relation to the southerly migration of Western mackerel. ICES J. Mar. Sci. 54, 168–178. doi: 10.1006/jmsc.1996.0202
Richter, K., and Maus, S. (2011). Interannual variability in the hydrography of the Norwegian Atlantic Current: frontal versus advective response to atmospheric forcing. J. Geophys. Res. Oceans 116:C12031. doi: 10.1029/2011JC007311
Semper, S., Pickart, R. S., Våge, K., Larsen, K. M. H., Hátún, H., and Hansen, B. (2020). The Iceland-Faroe Slope Jet: a conduit for dense water toward the Faroe Bank Channel overflow. Nat. Commun. 11:5390. doi: 10.1038/s41467-020-19049-5
Serra, N., Käse, R. H., Köhl, A., Stammer, D., and Quadfasel, D. (2010). On the low-frequency phase relation between the Denmark Strait and the Faroe-Bank Channel overflows. Tellus A 62, 530–550. doi: 10.1111/j.1600-0870.2010.00445.x
Skagseth, Ø., Broms, C., Gundersen, K., Hátún, H., Kristiansen, I., Mork, K. A., et al.. (in review). Atlantic and Arctic waters in the Norwegian Basin, between year variability and potential ecosystem implication. Front. Mar. Sci.
Skjoldal, H. R., Saetre, R., Faernö, A., Misund, O. A., and Røttingen, I. (eds) (2004). The Norwegian Sea Ecosystem. Trondheim: Tapir Academic Press.
Strand, E., Bagøien, E., Edwards, M., Broms, C., and Klevjer, T. (2020). Spatial distributions and seasonality of four Calanus species in the Northeast Atlantic. Prog. Oceanogr. 185:102334. doi: 10.1016/j.pocean.2020.102344
Thórdardóttir, T. (1977). “Primary production in north Icelandic waters in relations to recent climatic changes,” in Polar Oceans, ed. M. J. Dunbar (Calgary: Arctic Institute-North America), 655–665.
Keywords: East Icelandic Current, Calanus hyperboreus, Calanus finmarchicus, zooplankton biomass, diet composition, NSSH herring, feeding distribution, temperature
Citation: Kristiansen I, Hátún H, Jacobsen JA, Eliasen SK, Petursdottir H and Gaard E (2022) Spatial Variability of the Feeding Conditions for the Norwegian Spring Spawning Herring in May. Front. Mar. Sci. 9:823006. doi: 10.3389/fmars.2022.823006
Received: 26 November 2021; Accepted: 04 February 2022;
Published: 10 March 2022.
Edited by:
Martin Edwards, Plymouth Marine Laboratory, United KingdomReviewed by:
Terry Whitledge, Retired, Fairbanks, AK, United StatesDaria Martynova, Zoological Institute (RAS), Russia
Copyright © 2022 Kristiansen, Hátún, Jacobsen, Eliasen, Petursdottir and Gaard. This is an open-access article distributed under the terms of the Creative Commons Attribution License (CC BY). The use, distribution or reproduction in other forums is permitted, provided the original author(s) and the copyright owner(s) are credited and that the original publication in this journal is cited, in accordance with accepted academic practice. No use, distribution or reproduction is permitted which does not comply with these terms.
*Correspondence: Inga Kristiansen, aW5nYWtAaGF2LmZv