 Yali Cao1
 Rong Bi1,2*
 Xingchen Wang1Xi Chen1,3Jingwen Hu1Yaoyao Wang1
 Yiqing Jiang1
 Hailong Zhang1
 Lei Xing1,2
 Meixun Zhao1,2*
- 1Frontiers Science Center for Deep Ocean Multispheres and Earth System, Key Laboratory of Marine Chemistry Theory and Technology, Ministry of Education, Ocean University of China, Qingdao, China
- 2Laboratory for Marine Ecology and Environmental Science, Qingdao National Laboratory for Marine Science and Technology, Qingdao, China
- 3Tianjin Marine Environmental Monitoring Central Station, State Oceanic Administration, Tianjin, China
The ecological functions and biogeochemical processes of continental marginal seas are important for the global carbon cycle. In the eastern China marginal seas (ECMS), phytoplankton productivity has increased significantly in recent decades, but the sources and burial processes of marine organic carbon (OC) remain under-studied. We analyzed the contents of marine lipid biomarkers (brassicasterol, dinosterol, and C37 alkenones) in surface suspended particles obtained from seven cruises between 2010 and 2015, and in surface sediments from eight cruises between 2006 and 2012 in the ECMS, to estimate marine OC sources and burial. The correlations between lipid biomarkers and environmental factors were quantified to reveal controlling factors. The study area was divided into four regions according to cluster analysis conducted based on sediment parameters. Our results showed that the concentrations of marine lipid biomarkers in surface water were high near large estuaries such as the Changjiang River Estuary and the Yellow River Estuary, but those in surface sediments were high in mud areas. Nutrient concentration was a key factor controlling phytoplankton biomass in surface water, with high nutrients enhancing the growth of diatoms and dinoflagellates, while haptophytes were more abundant in low-nutrient, high-salinity and cold environments. High marine OC contents calculated from total OC δ13C were mainly associated with fine sediments transported by coastal currents, and finally deposited in mud areas. The proto-burial efficiency of marine OC in the ECMS (7–19%) was markedly higher than the mean value in global marginal seas, with high values being located in the western coast of the ECMS. The proto-burial efficiency of total marine lipid biomarkers (6–24%) was quantified for the first time in our study, with overall values and spatial patterns similar to that of marine OC. A key parameter for marine OC and marine biomarker proto-burial efficiency was sediment grain size. The smaller the sediment grain size was, the better the marine OC and marine biomarker were retained. Our study provides an important basis to elucidate spatial distribution patterns and forcing mechanisms of marine OC in surface water (production process) and surface sediments (burial process), and to estimate carbon budgets in large marginal seas.
Introduction
The ocean is a large carbon reservoir, absorbing about 30% of CO2 released by human activities in the recent global carbon budget, with an average absorption rate of about 2.6 Pg C yr–1 (DeVries, 2014; Gruber et al., 2019), and thus it plays a key role in the global carbon cycle. As a link between land and ocean, marginal seas are important for the production, transport, storage and mineralization of organic carbon (OC). Although marginal seas only occupy about 20% of ocean surface area, about 80–90% of global marine sediment OC is stored there, thus constituting an important OC reservoir on the earth’s surface (Burdige, 2007; Keil, 2017). There are two main sources of OC in marginal seas, i.e., terrestrial OC transported by river runoff and dust deposition, and marine OC produced by marine primary producers in the euphotic zone (Zonneveld et al., 2010). About half of the world’s net photosynthesis takes place in the ocean, and about 10–15% of this net photosynthesis occurs in the marginal seas (Muller-Karger et al., 2005). And only a small fraction of marine OC is “permanently” preserved in sediments, as the average proto-burial efficiency of marine OC was <1.3% in marginal seas (Hedges and Keil, 1995; Burdige, 2005). Thus, the role of marine OC in the carbon cycle cannot be ignored. This is particularly because human activities have induced serious eutrophication in marginal seas, especially in river estuaries (Anderson et al., 2002). Moreover, high sedimentation rates in marginal seas contribute to high OC burial efficiency (Burdige, 2007). It has been revealed that the global marine OC burial is about 100 Tg C yr–1, being about two times higher than that of terrestrial OC (Burdige, 2005). Previous studies have focused on the sources and burial processes of terrestrial OC (Burdige, 2005; Karlsson et al., 2011; Fang et al., 2015; Smith et al., 2015; Zhao et al., 2021), while these processes of marine OC in marginal seas have not been fully understood.
Generally, marine OC experiences four stages from production to burial, i.e., euphotic layer stage, water column stage, bottom water–sediment interface stage and surface sediment stage (Zhang Y. et al., 2017). In addition to the degradation and mineralization in the process of vertical transport, marine OC produced at the euphotic layer is also affected by the horizontal transport such as ocean currents and tides, especially in marginal seas. Marine OC deposited in the seabed would also undergo the processes of resuspension and oxidative degradation, before eventually been buried in sediments (Alldredge and Gotschalk, 1989; Aller, 2004). Le Guitton et al. (2015) studied the vertical and lateral transport pathways of marine OC in the southern North Sea by comparing the OC, pigments and phospholipid derived fatty acids in surface suspended particles and surface sediments, and found that more degraded OC was mainly deposited in the north of the study area with high silt contents. Due to the continuing and rapid economic development, the eastern China marginal seas (ECMS), as one of the widest continental shelf seas in the world, are profoundly affected by terrestrial inputs and anthropogenic disturbances (He et al., 2015). However, comprehensive understanding is still lack on the sources and burial processes of marine OC in the ECMS, which is an important part of continental shelf carbon cycle.
The ECMS locates in the western Pacific Ocean, and includes the Bohai Sea (BS), the Yellow Sea (YS), and the East China Sea (ECS) (Figure 1). The ecological and sedimentary environments of the ECMS are affected by not only hydrodynamic processes such as ocean currents and tides, but also terrestrial inputs from the Changjiang River and the Yellow River. Several mud areas have formed with high sedimentation rates and continuous deposition, which is very beneficial to OC burial (Qiao et al., 2017). Intense human activities during the last few decades have increased nutrient input and changed nutrient composition, which caused harmful algal blooms and the shift of phytoplankton community structure in the ECMS (Tang et al., 2003; Li et al., 2014; Xin et al., 2019). Phytoplankton productivity has increased in the coastal area of the ECS during the past 50 years (Xing et al., 2016b). It has been shown that the annual carbon fixation of phytoplankton in this area accounts for ∼2% of global marine phytoplankton carbon fixation and ∼6% of global marginal seas (Song et al., 2008b), but sedimentary OC burial in the ECMS accounts for ∼10% of global marginal seas (Zhao et al., 2017). Therefore, the ECMS plays an important role in global carbon cycle, thus characterizing the distribution patterns and forcing mechanisms of marine OC in surface water and sediments would provide an important basis for studies of coastal ecosystems and organic carbon cycle in marginal seas.
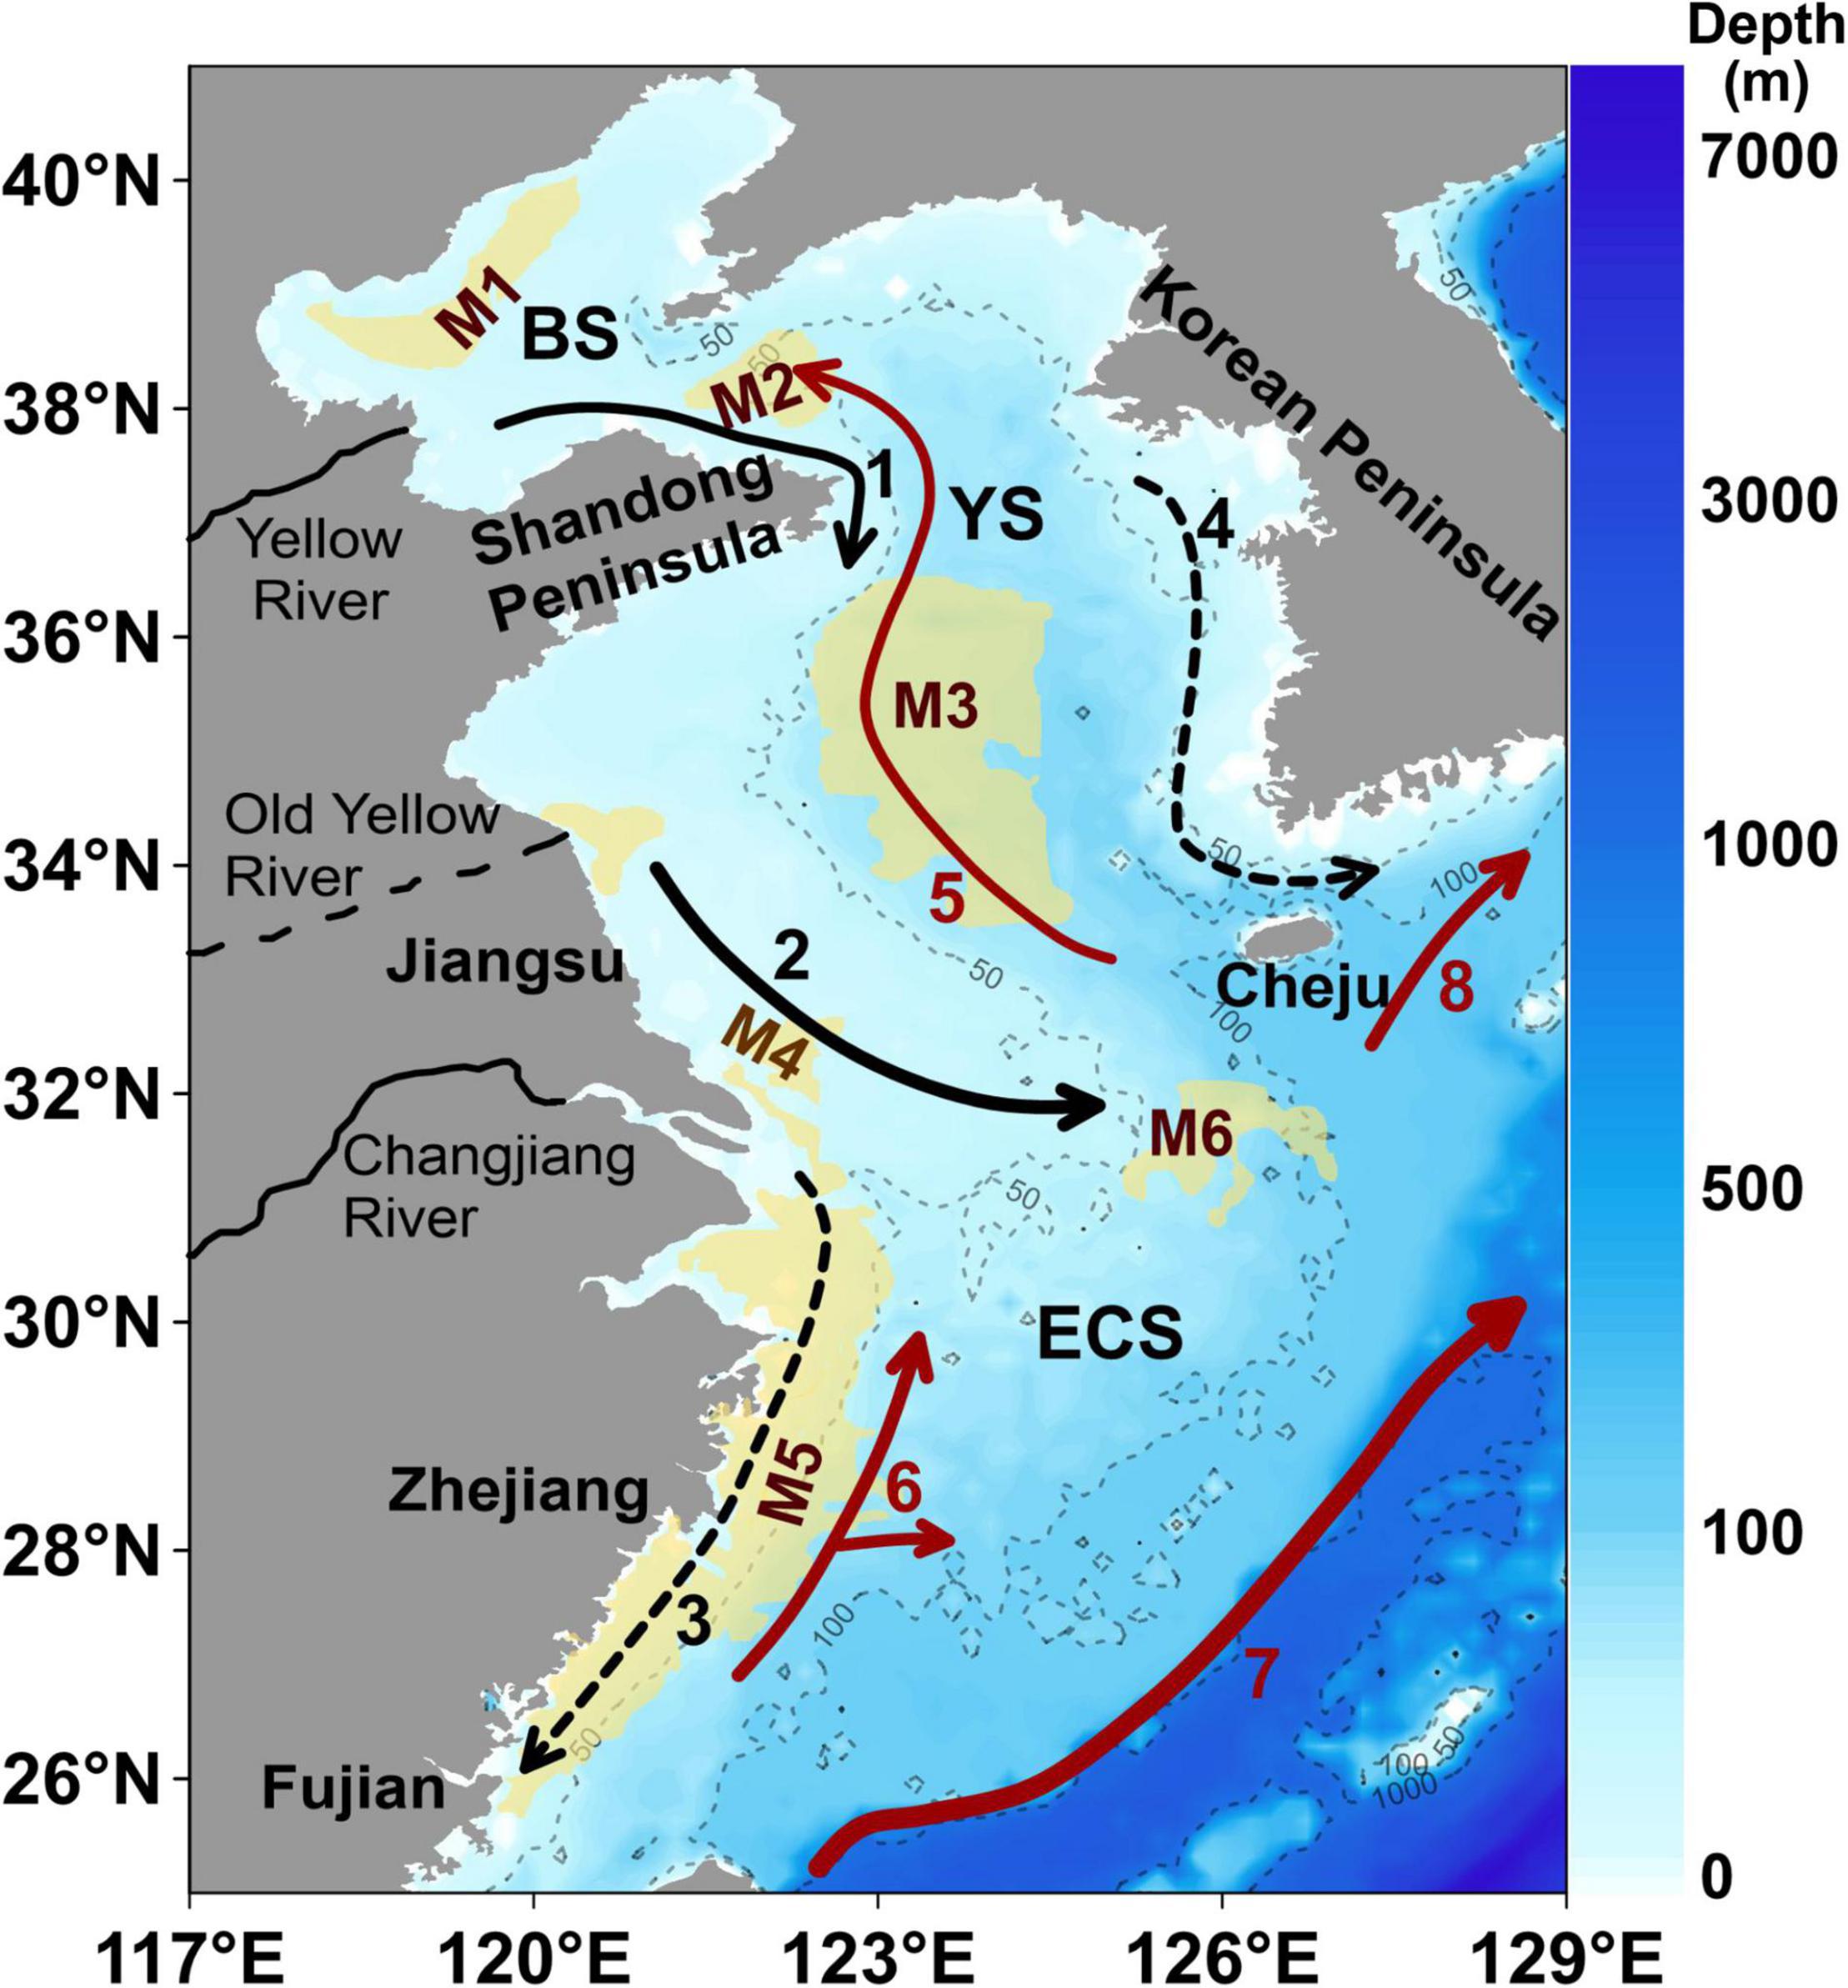
Figure 1. The water depth (m) and location of the Bohai Sea (BS), the Yellow Sea (YS), and the East China Sea (ECS); and the generalized currents and the location of mud areas in the eastern China marginal seas. The arrows with black and red lines denote the direction of ocean currents: the black ones refer to the BS Coastal Current (#1), the YS Coastal Current (#2), the ECS Coastal Current (#3) and the Western Korea Coastal Current (#4); the red ones refer to the YS Warm Current (#5), the Taiwan Warm Current (#6), the Kuroshio Current (#7), and the Tsushima Warm Current (#8). The width of lines represents current strength. Note that the arrows with solid lines represent currents that flow in the same direction all year round, while those with dotted lines indicate the direction in winter which flow in the opposite direction in summer. The yellow areas denote mud deposits: the central BS mud deposits (M1), the northern YS mud deposits (M2), the southern YS mud deposits (M3), the Changjiang River Estuary mud deposits (M4), the Fujian-Zhejiang coastal mud deposits (M5), and mud deposits southwest of the Cheju Island (M6). This figure is modified after Bian et al. (2013); Lian et al. (2016), and Yu et al. (2018).
Several studies have investigated the source, distribution, transport and burial of marine OC, as well as the controlling factors in the ECMS, usually focusing on seawater or sediment separately. For example, microscopic studies, field measurements of chlorophyll a (Chl a) and remote sensing are commonly used to investigate phytoplankton dynamics in the modern ocean (Wei et al., 2004, 2017; Sun et al., 2010; Chen and Liu, 2015; Liu et al., 2016). In general, most studies have found that phytoplankton productivity is higher in summer in the ECMS, which is mainly induced by high nutrients from river inputs and upwellings (Gong et al., 2003; Chen and Liu, 2015; Liu et al., 2016; Zhang H. et al., 2017). The average primary productivity in summer was about three times higher than that in other seasons in the ECS in 1997–1998 (Gong et al., 2003). Zhang H. et al. (2017) also found that the satellite-derived surface Chl a from 2000 to 2012 was the highest in summer in the BS. The common methods to study the burial of marine OC include measurements of total organic carbon (TOC) combined with isotopes of C and N, biogenic silica and pigments in sediments (Liu et al., 2015; Wang L. et al., 2015; Hu L. et al., 2016; Yoon et al., 2016; Zhao et al., 2021). In the BS, the high content of marine OC calculated by δ13C and biogenic silica was located in fine-grain sediments, with an important contribution of authigenic OC derived from primary productivity at the upper layers, while the values were low in the Bohai Strait with coarse grain deposition (Liu et al., 2015). Wu et al. (2020) studied the burial flux of marine OC in surface sediments of the ECS, and found a decreasing trend from inner shelf to offshore, and the enrichment of OC in the fine-grain mud areas indicated the controlling effects of sedimentary processes on the burial of OC. Most of previous studies have focused on the local areas, while few investigations have been carried to reveal the distribution patterns of marine OC between the seawater and sediments by the same indices at a large spatial scale. In addition, the controlling mechanisms of the production, distribution and burial efficiency of marine OC are still not entirely clear in the ECMS.
Lipid biomarkers are suitable proxies to trace the sources of organic matter in marine environment, and to reconstruct environment changes, as they have relatively high stability, similar diagenetic properties and specific sources (Hinrichs et al., 1999; Bianchi and Canuel, 2011). Brassicasterol (24-methylcholesta-5,22E-dien-3β-ol), dinosterol (4α,23,24-trimethyl-5α-cholest-22-en-3β-ol), and C37 alkenones have been applied as OC source proxies of diatoms, dinoflagellates and haptophytes, respectively, and the sum of the three lipid biomarkers (ΣPB) has been used as a proxy of total biomass in the Arabian Sea, the Atlantic off northwest Africa, Indian Ocean, Tasman Sea, around the Crozet plateau in the Southern Ocean (Schubert et al., 1998; Schulte and Bard, 2003; Calvo et al., 2004; Zhao et al., 2006; Hernandez et al., 2008), and certain areas of the ECMS (Xing et al., 2011, 2016b; Wu et al., 2016; Bi et al., 2018). For example, marine lipid biomarkers have been analyzed in surface sediments in the ECS, showing high values in the upwelling area off the Changjiang River Estuary (CRE) and Zhejiang-Fujian coastal zone with fine-grain sediments (Xing et al., 2011). Wu et al. (2016) analyzed spatiotemporal variations of phytoplankton lipid biomarkers in surface suspended particles of the ECS and the southern YS, and the results validated the applicability of lipid biomarkers as proxies of phytoplankton productivity and community structure in the study area. But little is known about the relationship between production and burial processes of lipid biomarkers as proxies of marine OC in suspended particles and surface sediments.
In this study, we simultaneously investigated the concentrations and distribution of marine lipid biomarkers (brassicasterol, dinosterol, and C37 alkenones) in surface suspended particles at 334 stations and in surface sediments at 258 stations using new data (107 suspended particle samples) and published data (227 surface suspended particle samples and 258 sediment samples) in the ECMS (Supplementary Figure 1). Combining with marine lipid biomarkers, we also used published data of TOC contents, stable carbon isotope values (δ13CTOC), the contents of terrestrial biomarkers [Σ(C27 + C29 + C31) n-alkanes; n = 226], and new data of Σ(C27 + C29 + C31) n-alkane (n = 32) to firstly quantify marine OC content and then to estimate its proto-burial efficiency, which refers to the burial potential in the earliest burial stages of marine OC in the surface mixed layer of marine sediments. We aim to reveal spatial distribution patterns and their driving mechanisms of marine OC production and burial processes, and to quantitatively estimate accumulation rates and proto-burial efficiencies of marine OC in different regions of the ECMS.
Materials and Methods
Study Area
The water depth gradually deepens from northwest to southeast in the ECMS (Figure 1). The BS in the northwest is an inner basin of China with an average depth of only 18 m and a flat terrain (Wang et al., 2014). The YS, with an average depth of 44 m, is a semi-closed shallow sea. The YS trough is a long and narrow depression extending from the Cheju Island to the northern YS (34°–38°N, 124°–125°E), with a water depth of 60–80 m (Wang et al., 2014). The ECS includes both shallow and deep areas. The shelf includes the inner and outer shelf, and accounts for 2/3 of the total area of the ECS mostly within 200 m. And the water depth can reach 2,719 m in the Okinawa Trough (Wang et al., 2014).
The Yellow River and the Changjiang River, as the second and fourth largest rivers in the world in terms of sediment transport, are the main sources of sediments and nutrients to the ECMS, transporting 72,200 × 104 t yr–1 and 39,000 × 104 t yr–1 sediment load, and 301.40 × 10⁸ m3 yr–1 and 8,964.00 × 108 m3 yr–1 water discharge during 1950s–2010s, respectively (Qiao et al., 2017). In addition, there are also 47 small rivers with a length of more than 100 km discharging into the ECMS (Qiao et al., 2017). The ECMS is also affected by the East Asian monsoon, including the East Asian winter and summer monsoon. The winter monsoon is relatively strong, and the wind speed can reach 5–10 m s–1, while the relatively weak summer monsoon has an average wind speed of 4–7 m s–1 (Wang et al., 2005; Bian et al., 2013).
Due to the interactions of river runoff, monsoon, the Kuroshio Current and topography, subtidal current systems are very complex in the ECMS (Figure 1). The BS Coastal Current originates from the Yellow River Estuary (YRE) and flows along the northern coast of Shandong Peninsula perennially. In the YS, the northward YS Warm Current is strong in winter, but disappears in summer. The southward YS Coastal Current and the Western Korea Coastal Current are also strong in winter, and weak in summer (Chen, 2009; Li et al., 2016). Thus, the seasonal bottom YS cold water mass (<10°C) forms in the middle of the YS in summer (Li et al., 2016). In the ECS, the dominant currents include the Kuroshio Current, the Taiwan Warm Current, the ECS Coastal Current, the Tsushima Current, and the Changjiang Diluted Water (CDW). The Kuroshio Current is a strong and persistent western boundary current and flows northward all year around. The Taiwan Warm Current flows northward overall, with mean speed being lower in winter and higher in summer (Chen, 2003b; Guan and Fang, 2006). The directions of the coastal currents and the CDW change seasonally (Chen, 2009; Li et al., 2016).
The fluvial sediments carried by the Changjiang River and Yellow River to the ECMS have deposited into several mud areas (Figure 1), including the central BS mud deposits, northern YS mud deposits, southern YS mud deposits, CRE mud deposits, Fujian-Zhejiang coastal mud deposits and the mud deposits southwest of the Cheju Island (Qiao et al., 2017; Yu et al., 2018). In addition, there are mud areas formed by the old Yellow River discharging into the sea during 1,128–1,855 near the northern coast of Jiangsu Province (Tao et al., 2016). These mud areas provide favorable conditions for OC burial. Maximum tidal current speed can reach to 150 cm s–1 in coastal areas such as near the mouth of the Changjiang River (Bian et al., 2013), thus the estuarine and nearshore sediments are prone to resuspension and re-deposition frequently which affects OC burial.
Sample and Data Collection
Brassicasterol, dinosterol, and C37 alkenones were determined in surface suspended particles (0–5 m) at 334 stations from seven cruises in summer of 2010–2015, and in surface sediments (0–3, 0–5, or 0–10 cm) at 258 stations from eight cruises in 2006–2012 (Supplementary Figure 1 and Supplementary Tables 1, 2). Most lipid biomarker data were collected from previous studies (n = 227 for surface suspended particles, and n = 258 for surface sediments) (Zhang et al., 2008; Jiang et al., 2012; Tao et al., 2012; Zhao et al., 2013; Fan et al., 2014a,b, 2015; Xing et al., 2014, 2016a; Hu J. et al., 2016; Wu et al., 2016; Chen X. et al., 2017; Wang et al., 2019), while some were measured in this study, i.e., marine lipid biomarkers in surface suspended particles from the BS and northern YS in the June of 2011, part of the samples in the ECS and southern YS in June of 2010 and July of 2013, respectively, and the CRE in July of 2013 (n = 107). In addition, most data of the following parameters were collected from published results: sea surface temperature (n = 273, from five cruises in summer of 2010–2015), salinity (n = 273, from five cruises in summer of 2010–2015), nutrient concentrations [dissolved inorganic nitrogen (DIN), dissolved inorganic phosphorus (DIP) and silicate (Si)] (n = 133, from three cruises in summer of 2011 and 2015) and Chl a (n = 255, from five cruises in summer of 2010–2014) in the surface water (Jiang et al., 2012; Yang et al., 2015; Hu J. et al., 2016; Wu et al., 2016; Chen X. et al., 2017; Tian et al., 2019; Wang et al., 2019), as well as terrestrial biomarker [Σ(C27 + C29 + C31) n-alkanes] contents (n = 226), TOC (n = 200), δ13CTOC, mean grain size and sedimentation rate in surface sediments (Zhao et al., 2011, 2013, 2021; Jiang et al., 2012; Tao et al., 2012; Fan et al., 2014a,b, 2015; Xing et al., 2014, 2015, 2016a; Bao et al., 2016; Qiao et al., 2017). Some data were measured using in situ CTD instrument in this study: sea surface temperature and salinity in the ECS in June 2010 and July 2013 (n = 54), and Chl a in the YRE in August 2015 (n = 33). The contents of Σ(C27 + C29 + C31) n-alkanes in the southern YS in April 2012 (n = 32) were measured in this study. δ13CTOC, mean grain size and sedimentation rate were recalculated and extended to the whole study area based on the Kriging interpolation.
Lipid Biomarker Analysis
Surface seawater samples were collected by submersible pumps, and suspended particle samples were obtained by filtering on Whatman GF/F filters. Surface sediments were collected by multiple corers or stainless-steel grab samplers. All suspended particles and sediment samples were stored at −20°C until analysis.
The procedures of lipid biomarker analysis have been provided in detail by Zhao et al. (2006) and Wu et al. (2016). Briefly, the freeze-dried samples were extracted with the solvent of dichloromethane/methanol (3:1, vol/vol) for several times, and the obtained total extracts were hydrolyzed with 6% KOH in methanol. Subsequently, alkanes, sterols and alkenones were separated from the neutral lipid fraction by eluting with n-hexane and dichloromethane/methanol (95:5, vol/vol) on silica gel columns. The alkane fraction and derivatized sterol and alkenone fraction (containing brassicasterol, dinosterol, and C37 alkenones) were analyzed by gas chromatograph (Agilent 6890N), with C19 n-alkanol and n-C24D50 as internal standards and H2 as carrier gas, and detected by a flame ionization detector (FID). The GC column was HP-1 capillary column (50 m × 0.32 mm × 0.17 μm, Agilent J&W). The temperature program was 80 to 200°C ramping at 25°C min–1, then 4°C min–1 to 250°C, and then 1.8°C min–1 to 300°C, and holding isothermal for 5 min. The average relative standard deviation (RSD) of reproducibility was within 10%.
Accumulation Rate and Proto-Burial Efficiency of Marine Organic Carbon and Lipid Biomarkers
TMBR (Terrestrial and Marine Biomarker Ratio) is an index to estimate the relative contribution of terrestrial and marine OC to marine sediments, which is defined as the ratio of Σ(C27 + C29 + C31) n-alkanes to the sum of Σ(C27 + C29 + C31) n-alkanes and ΣPB (Xing et al., 2011). In this index, Σ(C27 + C29 + C31) n-alkanes and ΣPB are biomarkers of terrestrial and marine OC, respectively. In addition, δ13CTOC has been also commonly used to estimate the relative contribution and calculate the proto-burial efficiency of terrestrial and marine OC (Deng et al., 2006; Xing et al., 2011; Wang J. et al., 2015; Cui et al., 2016; Faust and Knies, 2019).
We applied a binary mixing model to calculate marine OC contents (MOC, wt.%) by employing two proxies: TMBR and δ13CTOC (Weijers et al., 2009; Xing et al., 2014; Liu et al., 2015):
where fTerr and fMar are the contributions of terrestrial and marine OC to TOC, respectively (as % of TOC). XSample is the measured value of each proxy in the samples, and XMar and XTerr are the marine and terrestrial end-member values of each proxy, respectively. Note that MOC and TOC in this study are expressed as percentage of dry weight. To calculate the relative contribution of marine OC (fMar) using δ13CTOC, a global average value of −20.0‰ was selected as the marine end-member (XMar) in our study, which is the most widely used marine end-member in previous studies (Zhang et al., 2007; Weijers et al., 2009; Wang J. et al., 2015; Zhao et al., 2021). The average value of δ13CPOC in the modern Yellow River is −26.5‰ (Cai et al., 2003). Both the Changjiang River basin and the Yellow River basin are dominated by C3 plants, with a very small proportion of C4 plants (Guo et al., 2006; Wu et al., 2007). Therefore, −26.5‰ was selected as the terrestrial end-member (XTerr) here. In addition, XMar and XTerr for TMBR were assigned as 0 and 1, respectively, in this study according to previous work (Xing et al., 2011, 2014).
The accumulation rate of marine OC and marine lipid biomarkers were calculated using the following equation (Zhao et al., 2006):
where accumulation rate is in t C km–2 yr–1 for marine OC and kg km–2 yr–1 for marine lipid biomarkers. Sediment component content is in wt. % and ng g–1 for marine OC and marine lipid biomarkers, respectively. The accumulation rate of marine lipid biomarkers was estimated based on the contents of ΣPB. SR is the 210Pb-derived sedimentation rate (cm yr–1), ranging from 0.05 to 4.2 cm yr–1 over the entire study area, which was obtained from Qiao et al. (2017) and references therein (Supplementary Table 3). ρd is the dry bulk density of the sediments (g cm–3), which was measured according to the Specification of soil test (SL237-1999) (Xu, 2012), and assigned an average value of 0.95 g cm–3 to the whole area (Zhao et al., 1991; Li and Shi, 1995; Qiao et al., 2017).
The proto-burial efficiency (%) of marine OC and marine lipid biomarkers (i.e., ΣPB) was estimated by dividing the accumulation rate by the input flux :
where input flux is in t C km–2 yr–1 and kg km–2 yr–1 for marine OC and ΣPB, respectively. For the proto-burial efficiency of marine OC, the average primary productivity was used as the input flux of marine OC in each marginal sea, i.e., 112, 159, and 204 t C km–2 yr–1 in the BS, YS, and ECS, respectively (Tang et al., 2003; Deng et al., 2006; Song et al., 2008a). It has been observed that the annual primary production in the northwestern region of the ECS shelf was very similar with the southeastern region of the shelf (Gong et al., 2003), thus the same primary productivity (204 t C km–2 yr–1) was used in the calculation of marine OC burial in the whole area of the ECS. For the proto-burial efficiency of ΣPB, the input flux is defined as the total ΣPB produced in the upper water column per unit area of the surface sediment per unit time, and it was estimated by multiplying the average sinking rate of phytoplankton (m day–1) in the water column by the depth-averaged concentrations of ΣPB (ng L–1) in suspended particles in the whole water column (Guo et al., 2016). The sinking rate of 0.48 m day–1 was used for the BS and YS, and 0.71 m day–1 for the ECS (Guo et al., 2016; Li, 2017, 2018). As phytoplankton abundance and biomass in surface water were overall two times as high as the depth-averaged values (Jiang et al., 2015; Li, 2017, 2018), half of the ΣPB concentrations in surface suspended particles was used to represent the depth-averaged concentrations of ΣPB in our study.
Statistical Analysis
Hierarchical clustering is one of the general clustering algorithms that can effectively excavate the spatial distribution patterns of the ecological and geographical features (Clarke et al., 2016). For the hierarchical clustering, the similarity between nodes is calculated by a certain similarity measure, and the nodes are gradually reconnected according to the order of similarity from high to low. To clearly reveal and assess the spatial distribution patterns and driving mechanisms of marine OC in the ECMS, hierarchical cluster analysis was performed using IBM SPSS Statistics 26 software on 200 sediment samples from which TOC contents were measured, considering the parameters of ΣPB contents, TOC contents, depth and the geographical position. The raw data matrix was Z-scoring standardized prior to analysis. Cosine and Between-groups linkage were used to calculate the cosine of the angle between two vectors and the average distance between each point in one cluster to every point in the other cluster in order to combine the two classes to minimize the average distance between all classes. Clustering coefficient, the mean values of every parameter in each areas and Kruskal-Wallis test were used to examine the spatial variability.
To reveal the main controlling factors on the distribution of marine lipid biomarkers, Spearman’s rank correlations with a two-tailed test (significant level for p < 0.05) were conducted to investigate the relationship between marine lipid biomarkers in surface suspended particles and sea surface temperature (and salinity and nutrients). The same analysis was done for the correlations between marine lipid biomarkers in sediments and TOC (and mean grain size, sedimentation rate and water depth). Correlation analysis was performed using the “corrplot” function available through the package “corrplot” in the statistical software R (version 3.6.1), and the heatmaps of correlation matrix were exported.
Results
Marine Lipid Biomarkers, Chl a, Nutrients and Hydrological Parameters in Surface Water
The concentrations of brassicasterol and dinosterol ranged from 2.6 to 5,861 ng L–1 (mean value: 487 ng L–1) and 0.8 to 1,433 ng L–1 (mean value: 64.8 ng L–1), respectively, in the ECMS (Supplementary Table 4). High values of both brassicasterol and dinosterol occurred mainly off the CRE and YRE (Figures 2A,B). The concentrations of C37 alkenones ranged from 0 to 476 (mean value: 37.6 ng L–1) and were mainly detected in the central BS, and the central and northern YS (Figure 2C). ΣPB (3.4–7,294 ng L–1; mean value: 584 ng L–1) had high values off the CRE and YRE, resembling the distribution of brassicasterol and dinosterol (Figure 2D). Similarly, high values of Chl a (0.03–18.0 μg L–1; mean value: 1.5 μg L–1) also occurred off the CRE and YRE, as well as in coastal areas of the Shandong Peninsula (Figure 2E).
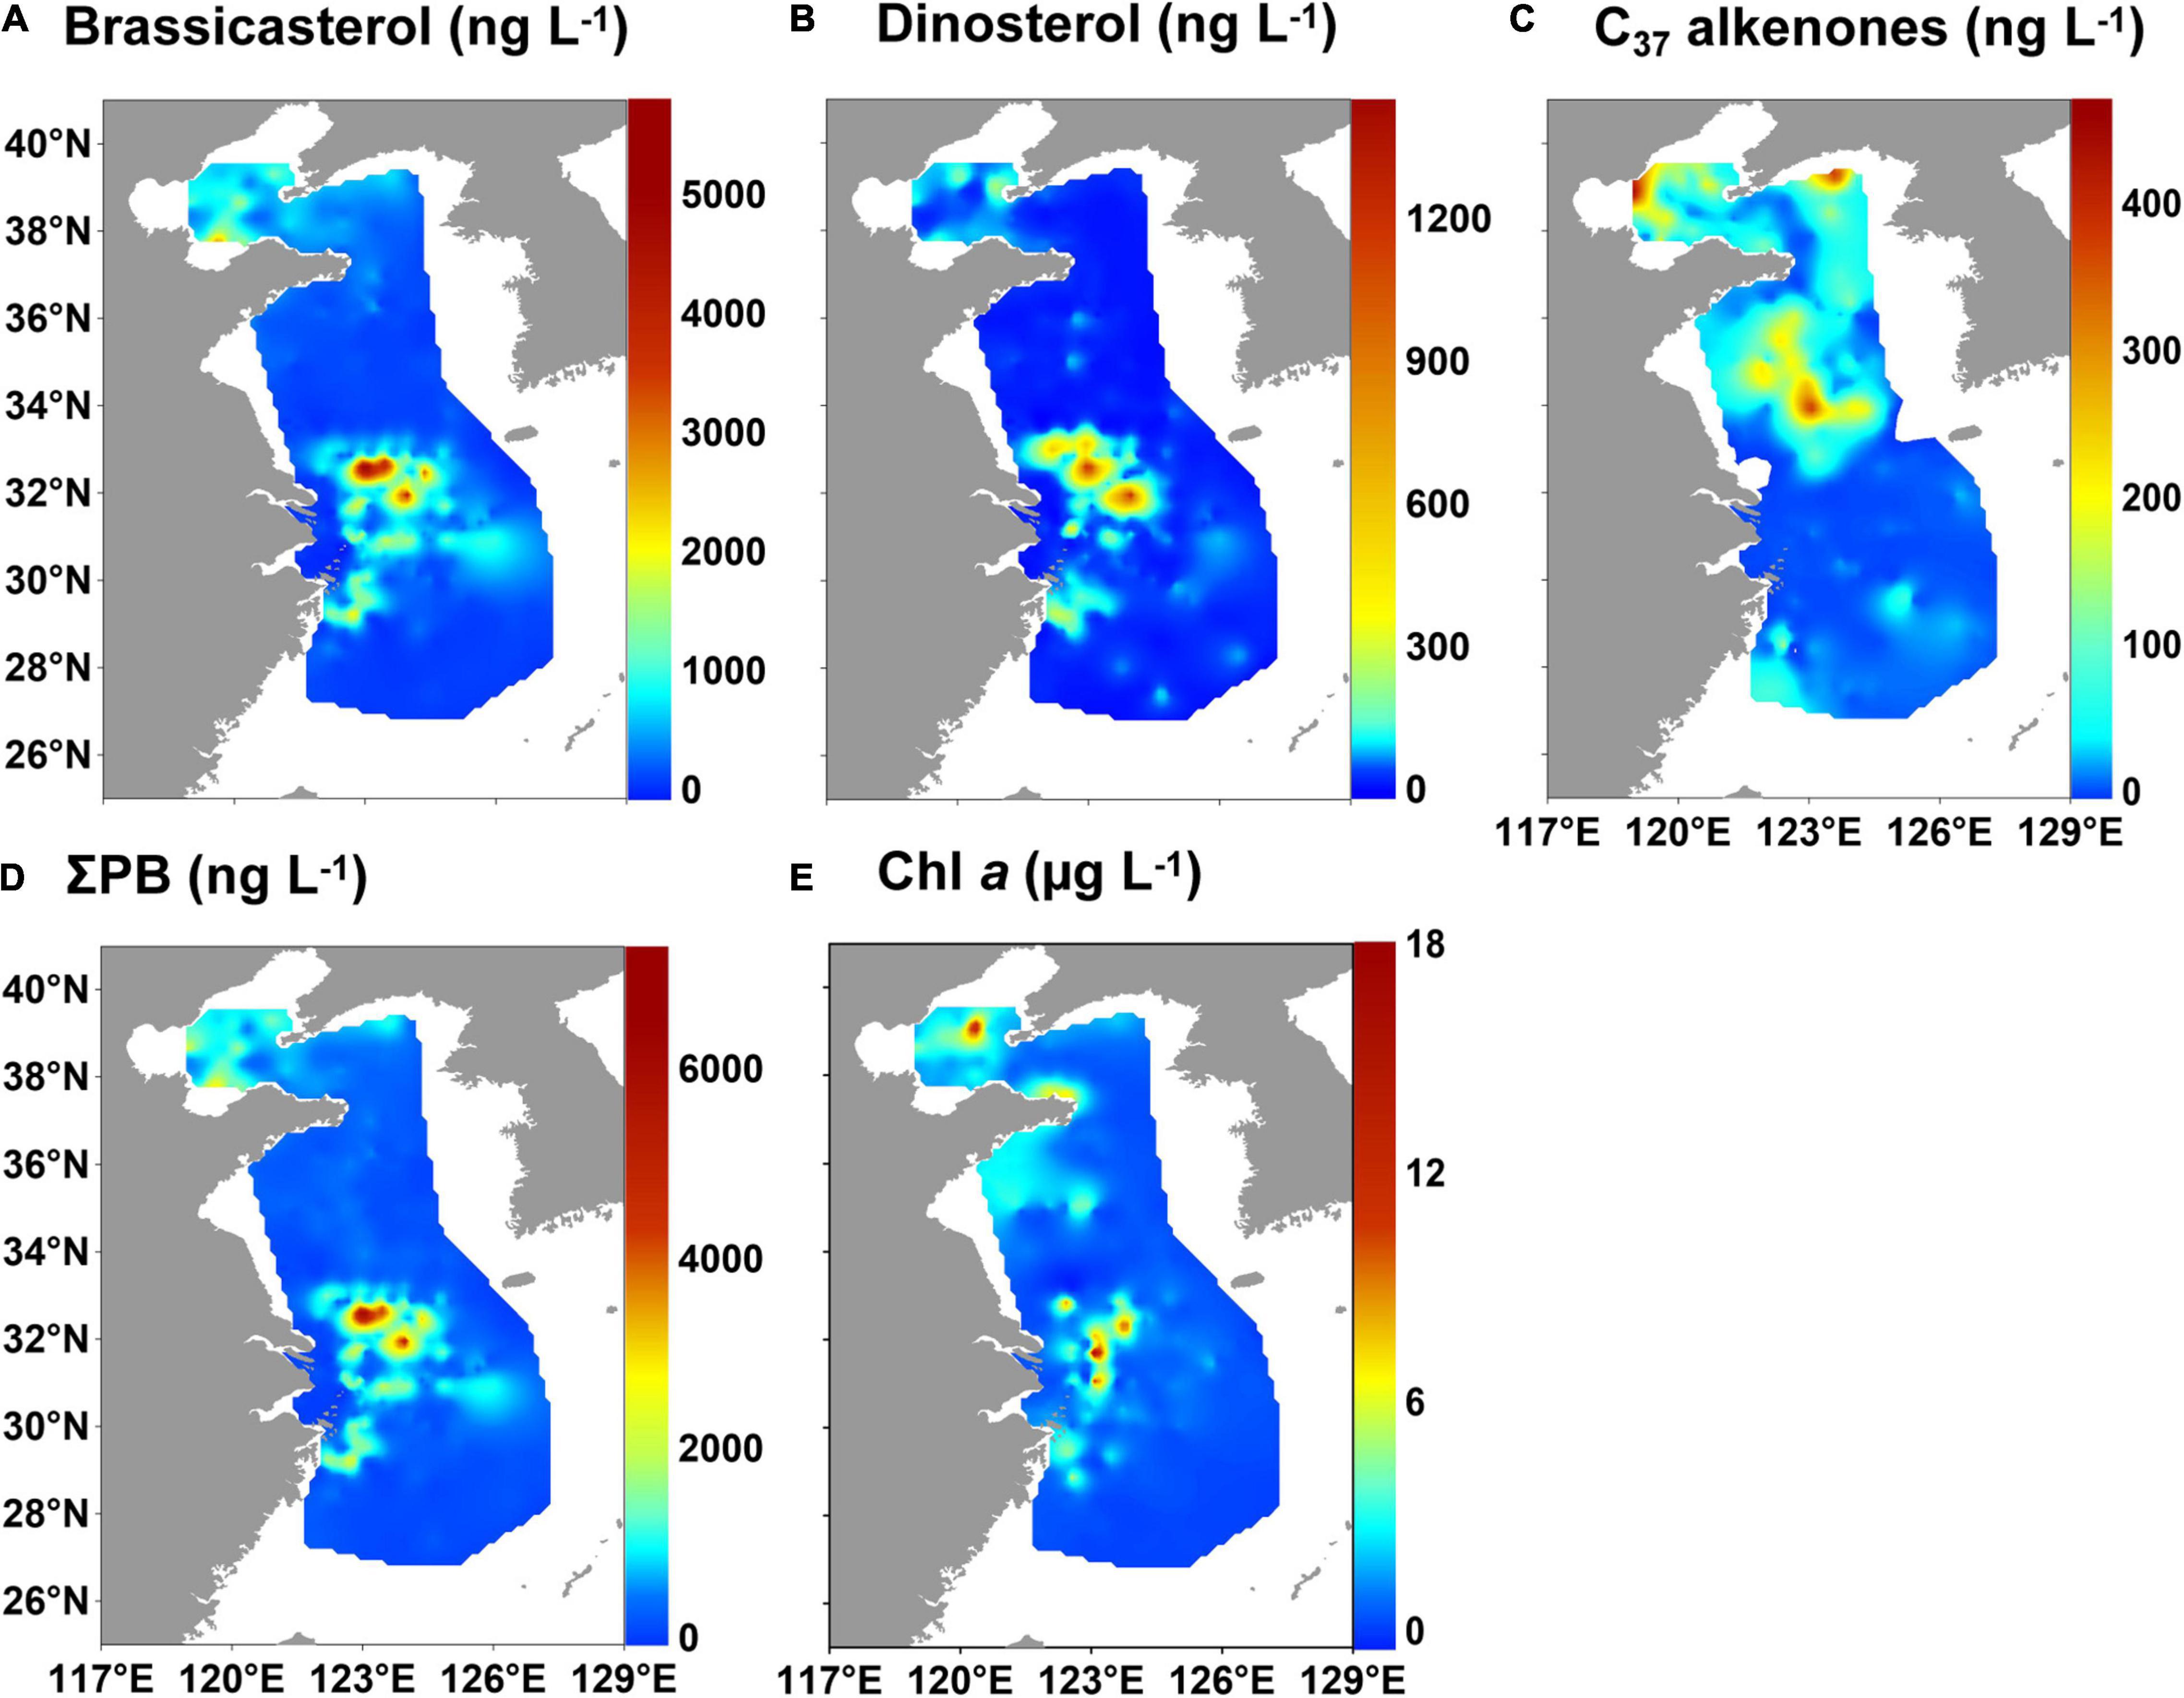
Figure 2. Distribution of marine lipid biomarkers and chlorophyll a (Chl a) in surface suspended particles in the eastern China marginal seas in summer of 2010–2015: (A) brassicasterol, (B) dinosterol, (C) C37 alkenones, (D) ΣPB (brassicasterol + dinosterol + C37 alkenones), and (E) Chl a.
The concentrations of DIN, DIP and Si were 0.2–111.2 μmol L–1, 0.002–2.4 μmol L–1 and 0.02–116.3 μmol L–1 (mean value: 7.1, 0.2, and 7.6 μmol L–1), respectively (Supplementary Table 4 and Figures 3A–C). The highest concentrations were near the CRE.
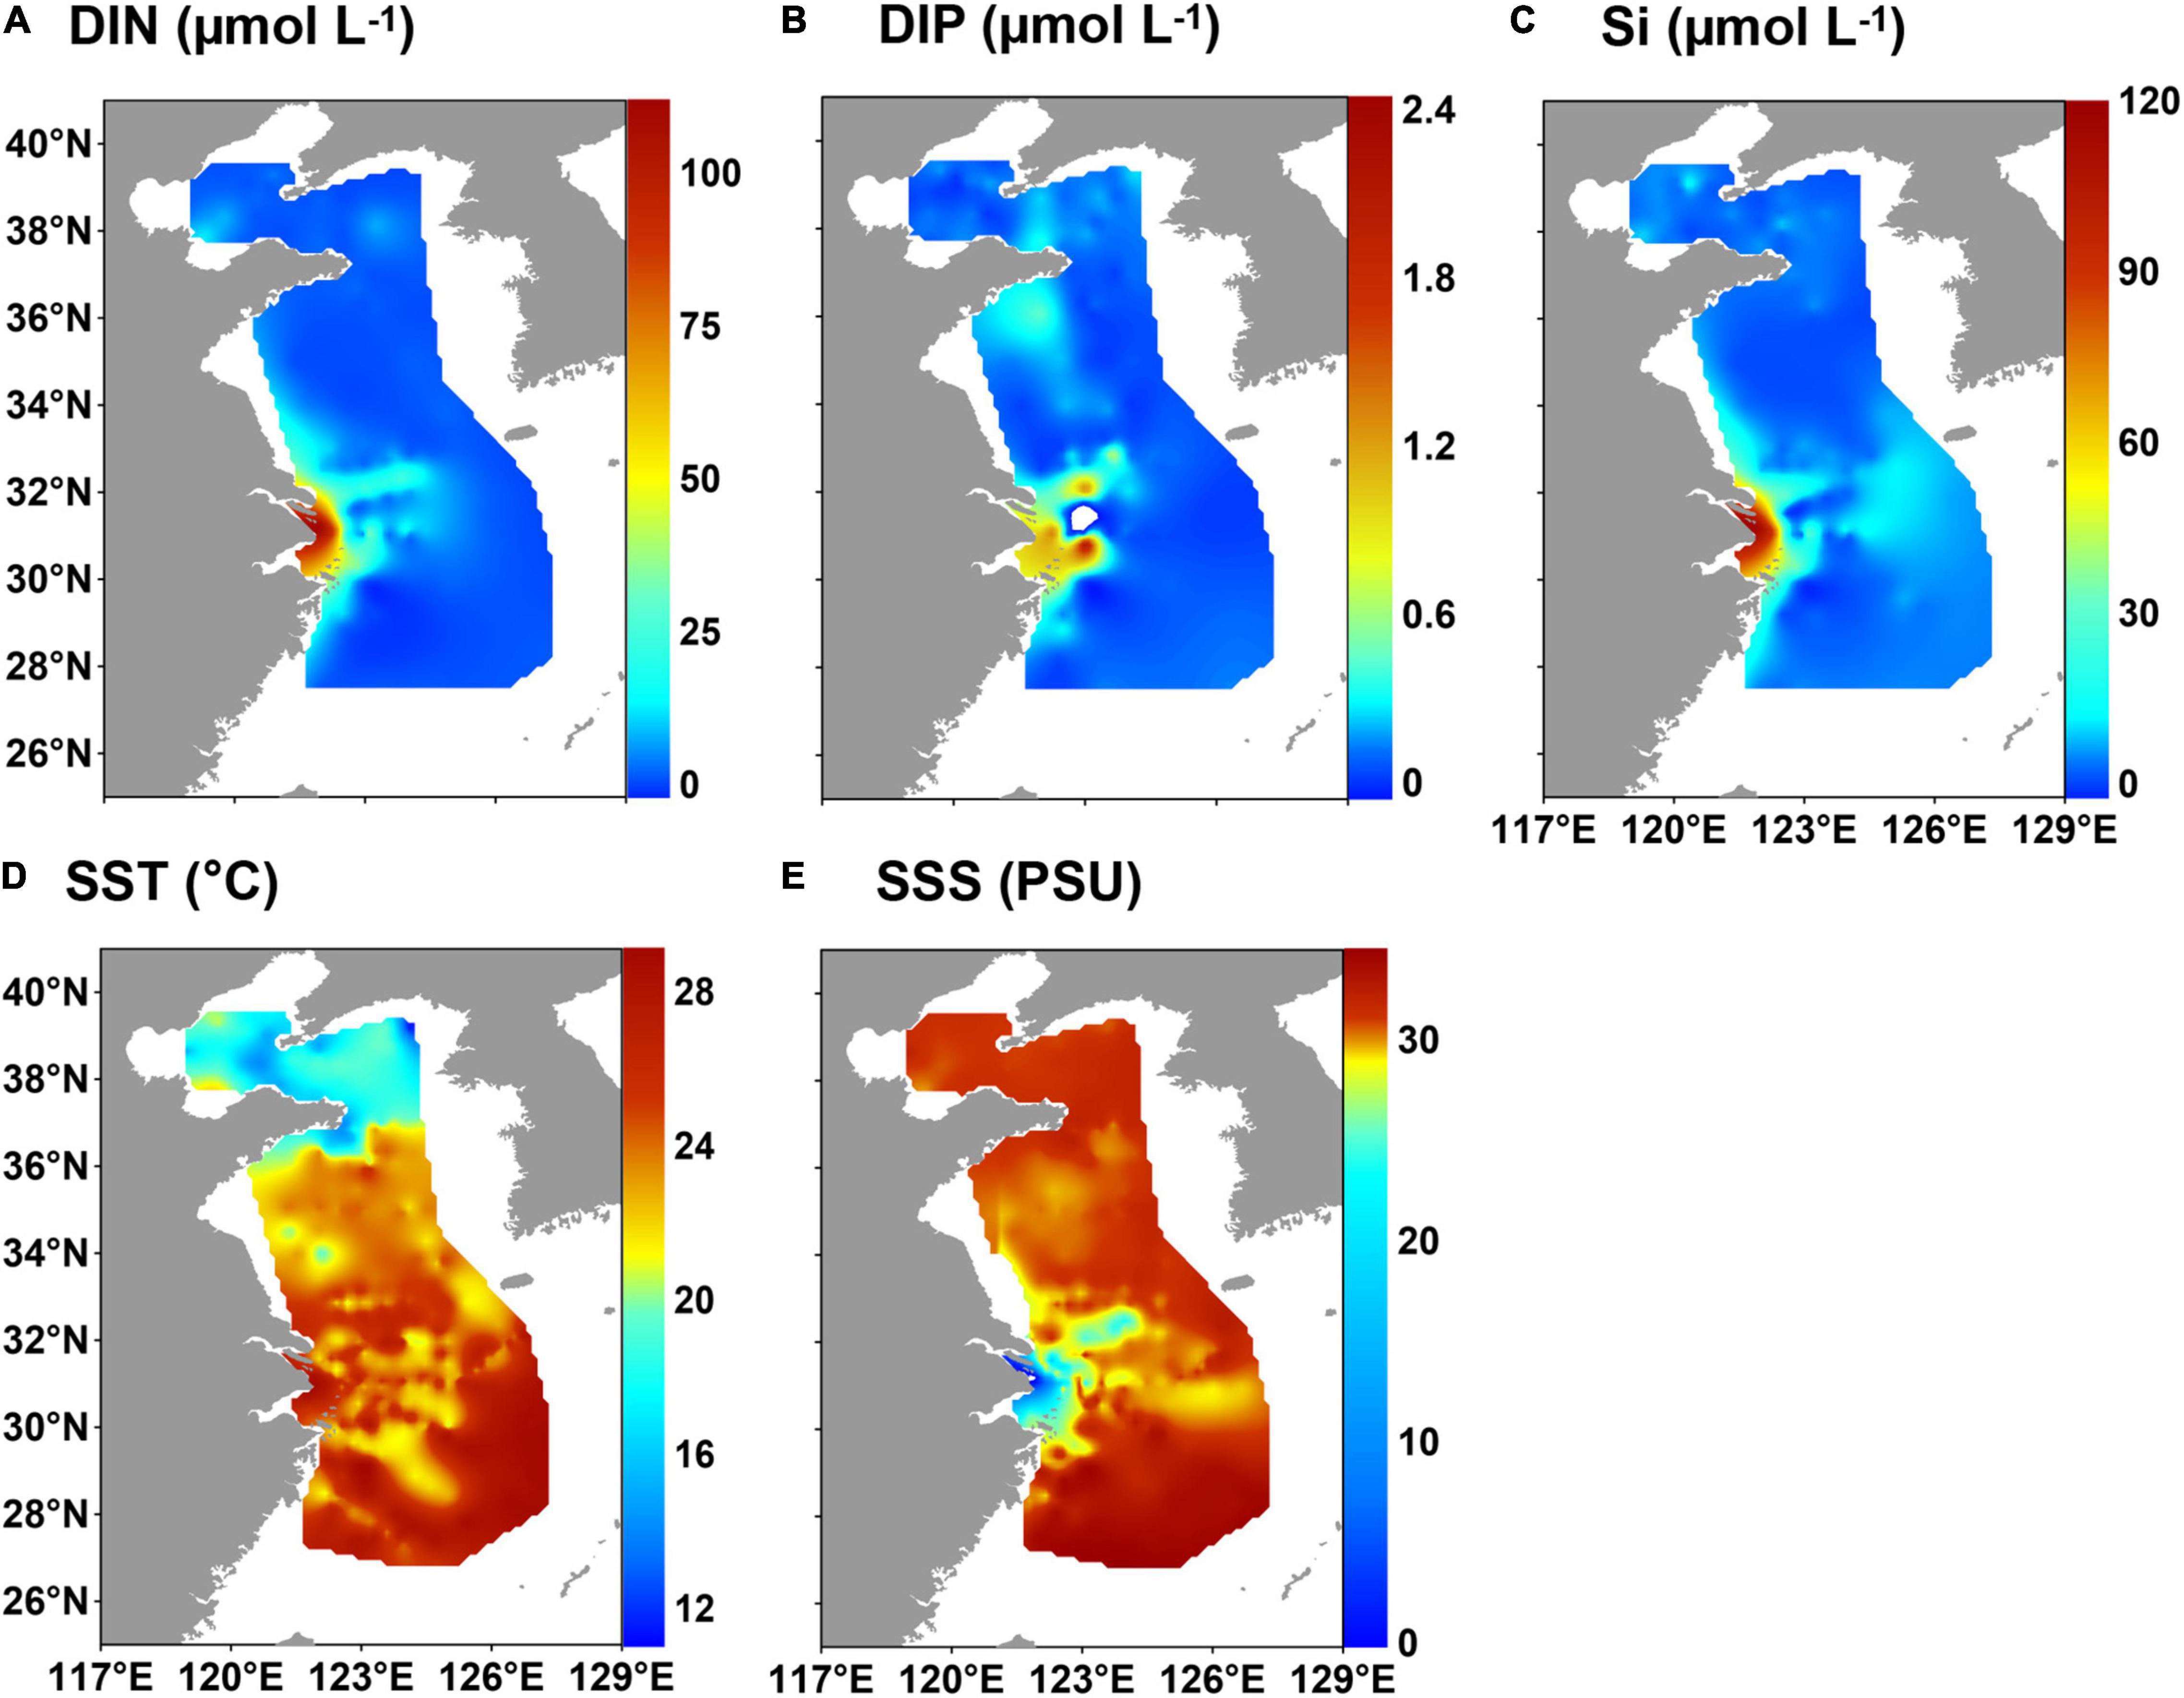
Figure 3. Distribution of hydrological parameters and nutrients in surface water in the eastern China marginal seas in summer of 2010–2015: (A) dissolved inorganic nitrogen (DIN), (B) dissolved inorganic phosphorus (DIP), (C) silicate (Si), (D) sea surface temperature (SST), and (E) sea surface salinity (SSS).
Sea surface temperature in the ECMS ranged from 11.2 to 29.1°C (mean value: 23.4°C), and salinity varied from 0.1 to 34.5 practical salinity unit (PSU), with a mean value of 29.8 PSU (Supplementary Table 4). The temperature generally decreased from south to north, with high values in the southeast of the ECS (Figure 3D). Fresh water with low salinity was clearly observed in the CRE (Figure 3E). The CDW spreads northeastward and southward from the CRE, and it can reach the southwest of the Cheju Island in summer (Li et al., 2016).
Brassicasterol, dinosterol, and ΣPB correlated positively with DIN concentrations, DIN/DIP and DIN/Si (Spearman’s rank correlation, p ≤ 0.01; Figure 4 and Supplementary Table 5) and negatively with salinity and water depth (p < 0.001). In contrast, C37 alkenones correlated negatively with nutrient concentrations and ratios (DIN, Si, DIN/Si, and DIN/DIP) and temperature (p ≤ 0.03), and positively with salinity and water depth (p ≤ 0.03). In addition, ΣPB showed significant positive correlations with Chl a (Spearman’s rank correlation coefficient r = 0.394, p < 0.001).
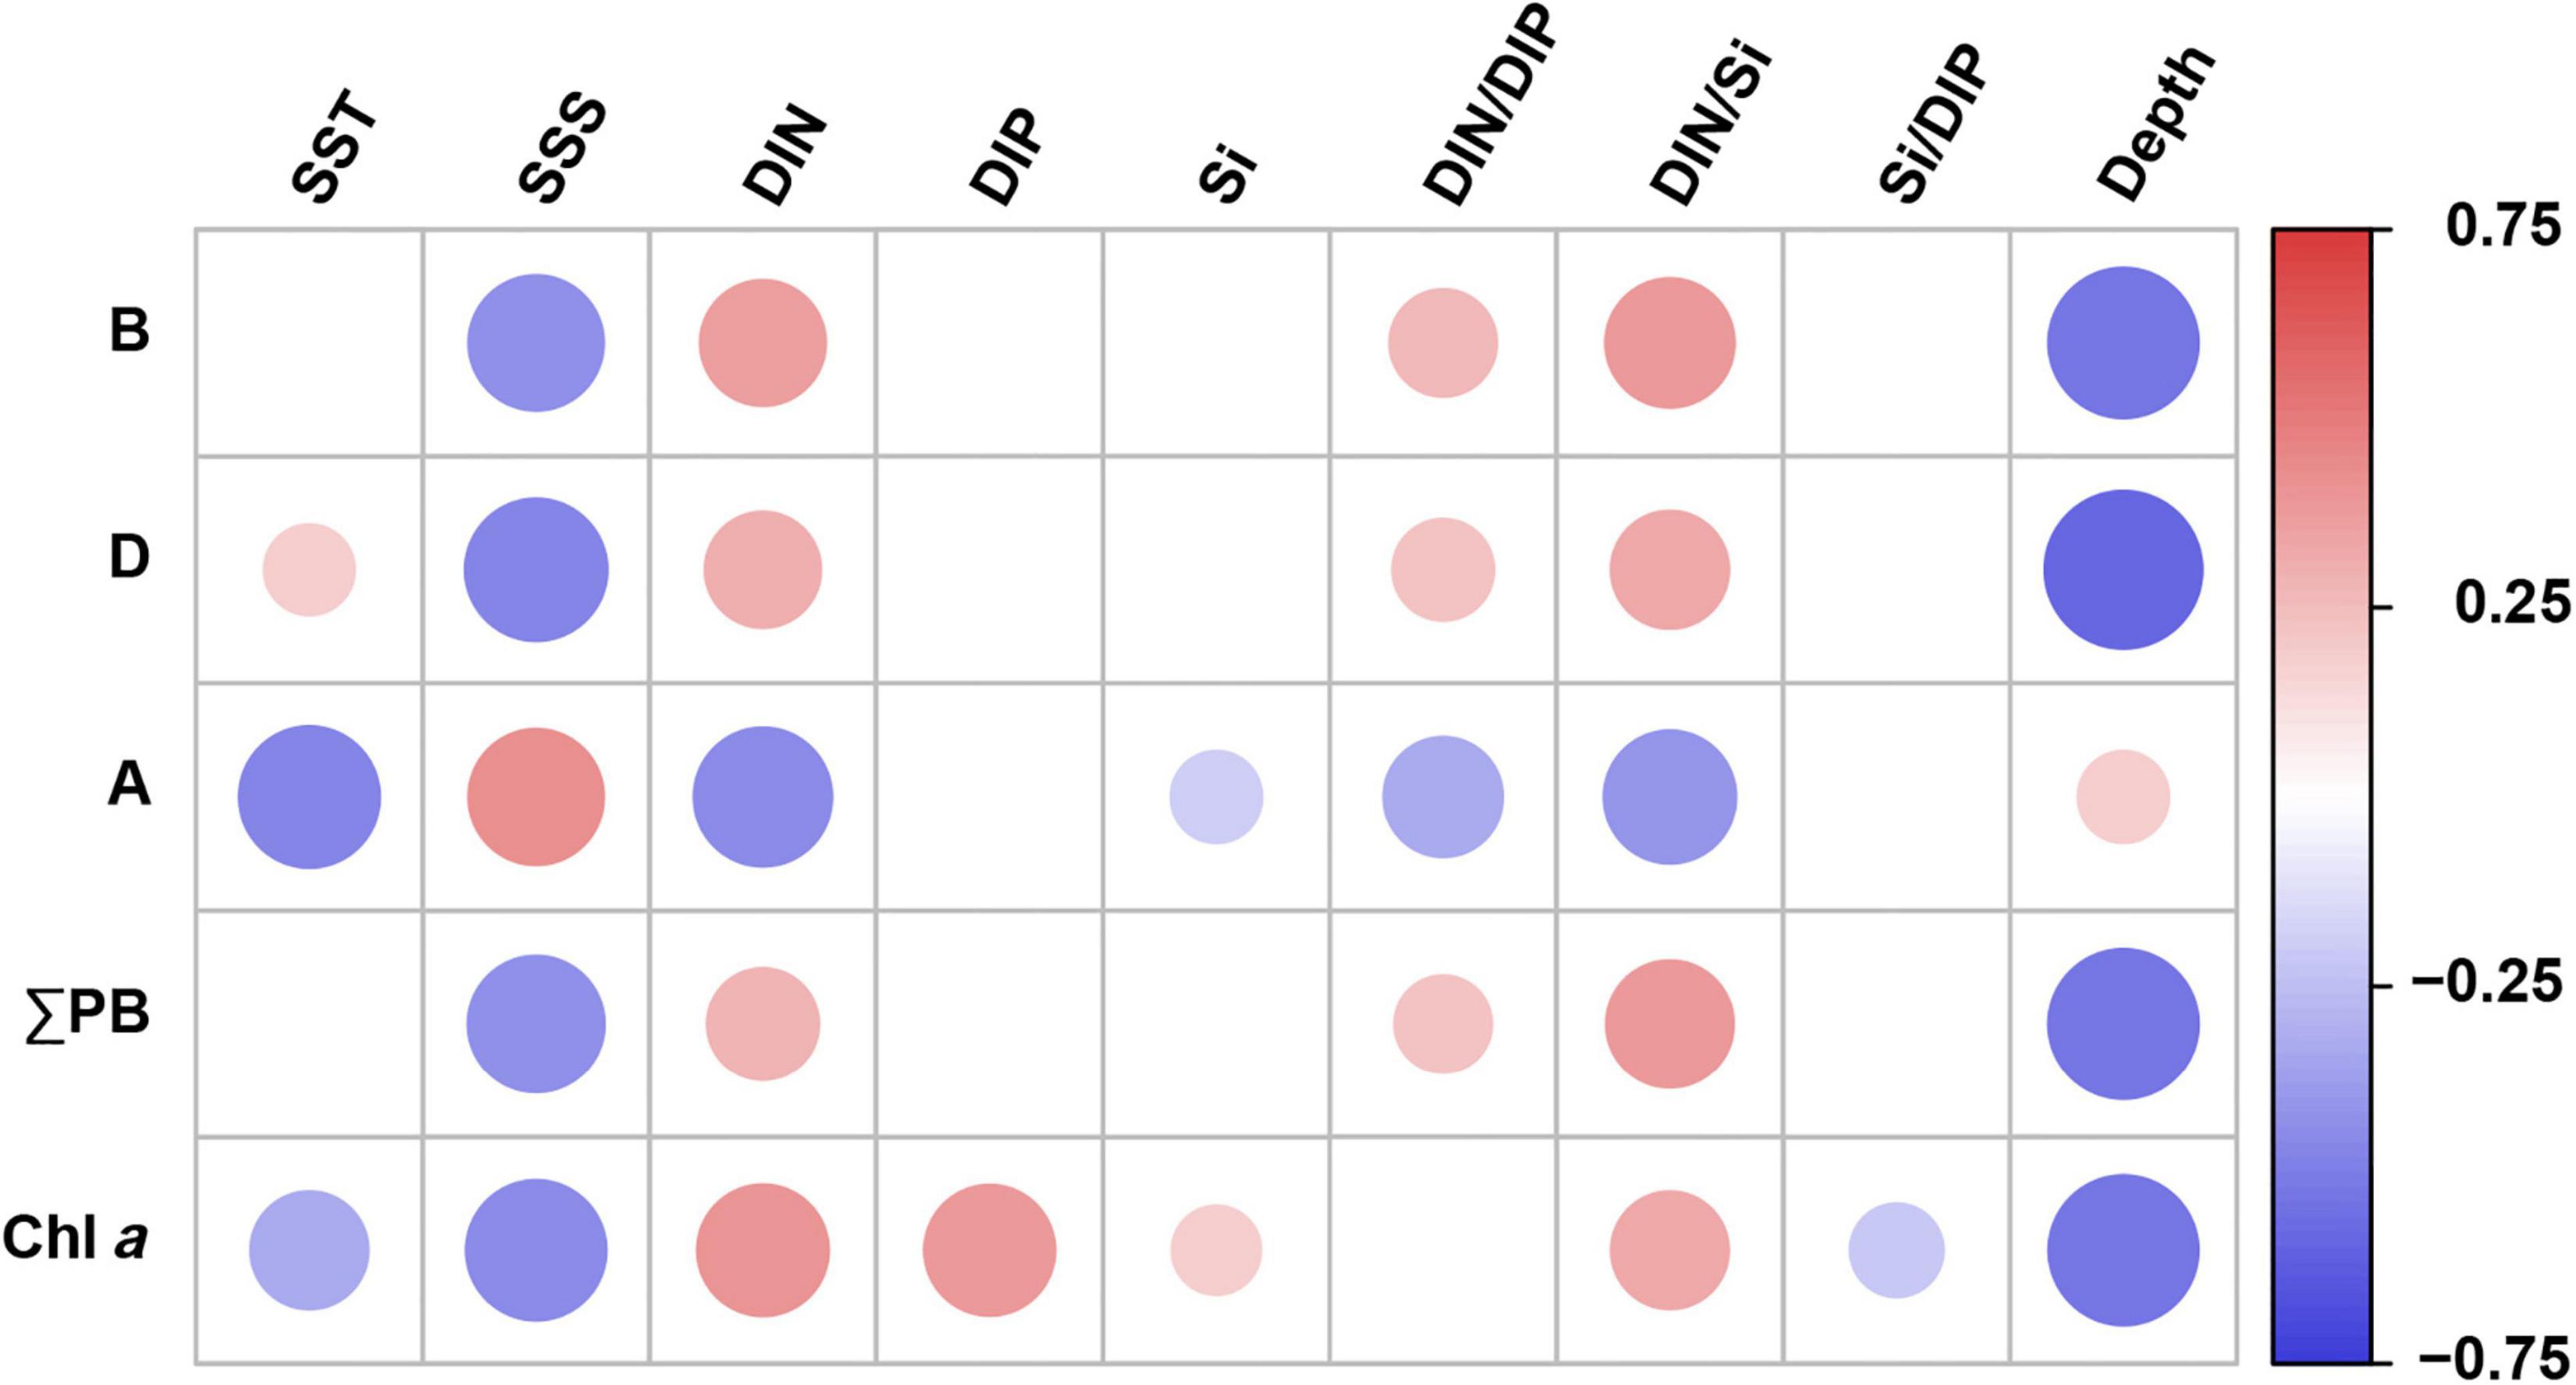
Figure 4. Spearman’s rank correlation coefficients between lipid biomarker concentrations (and Chl a) and environmental parameters in surface water in the eastern China marginal seas. Significant correlations at p < 0.05; B: brassicasterol; D: dinosterol; A: C37 alkenones; ΣPB: the sum of brassicasterol, dinosterol, and C37 alkenones. SST, sea surface temperature; SSS, sea surface salinity; DIN, dissolved inorganic nitrogen; DIP, dissolved inorganic phosphorus; Si, silicate. Red and blue solid circles refer to significant positive and negative correlations, respectively, with different diameters representing the differences in correlation coefficients. See also Supplementary Table 5 for the results of Spearman’s rank correlations.
Marine Lipid Biomarkers in Surface Sediments
The contents of brassicasterol, dinosterol and C37 alkenones in surface sediments varied from 17.0 to 1,657 ng g–1, 12.5–2,647 ng g–1, and 0–1,359 ng g–1 (mean value: 432, 553, and 108 ng g–1), respectively (Supplementary Table 3). The distribution patterns of brassicasterol, dinosterol and ΣPB (29.5–5,605 ng g–1; mean value: 1,093 ng g–1) were similar, showing high values in the southern and northern YS mud deposits, Fujian-Zhejiang coastal mud deposits, the mud deposits southwest the Cheju Island, and CRE mud deposits (Figures 5A,B,D). High values of brassicasterol and ΣPB also occurred in the central BS mud deposits. High values of C37 alkenones were in the northern and southern mud deposits of the YS and the mud deposits southwest of Cheju Island, but it was not detected at some stations in the ECS (Figure 5C).
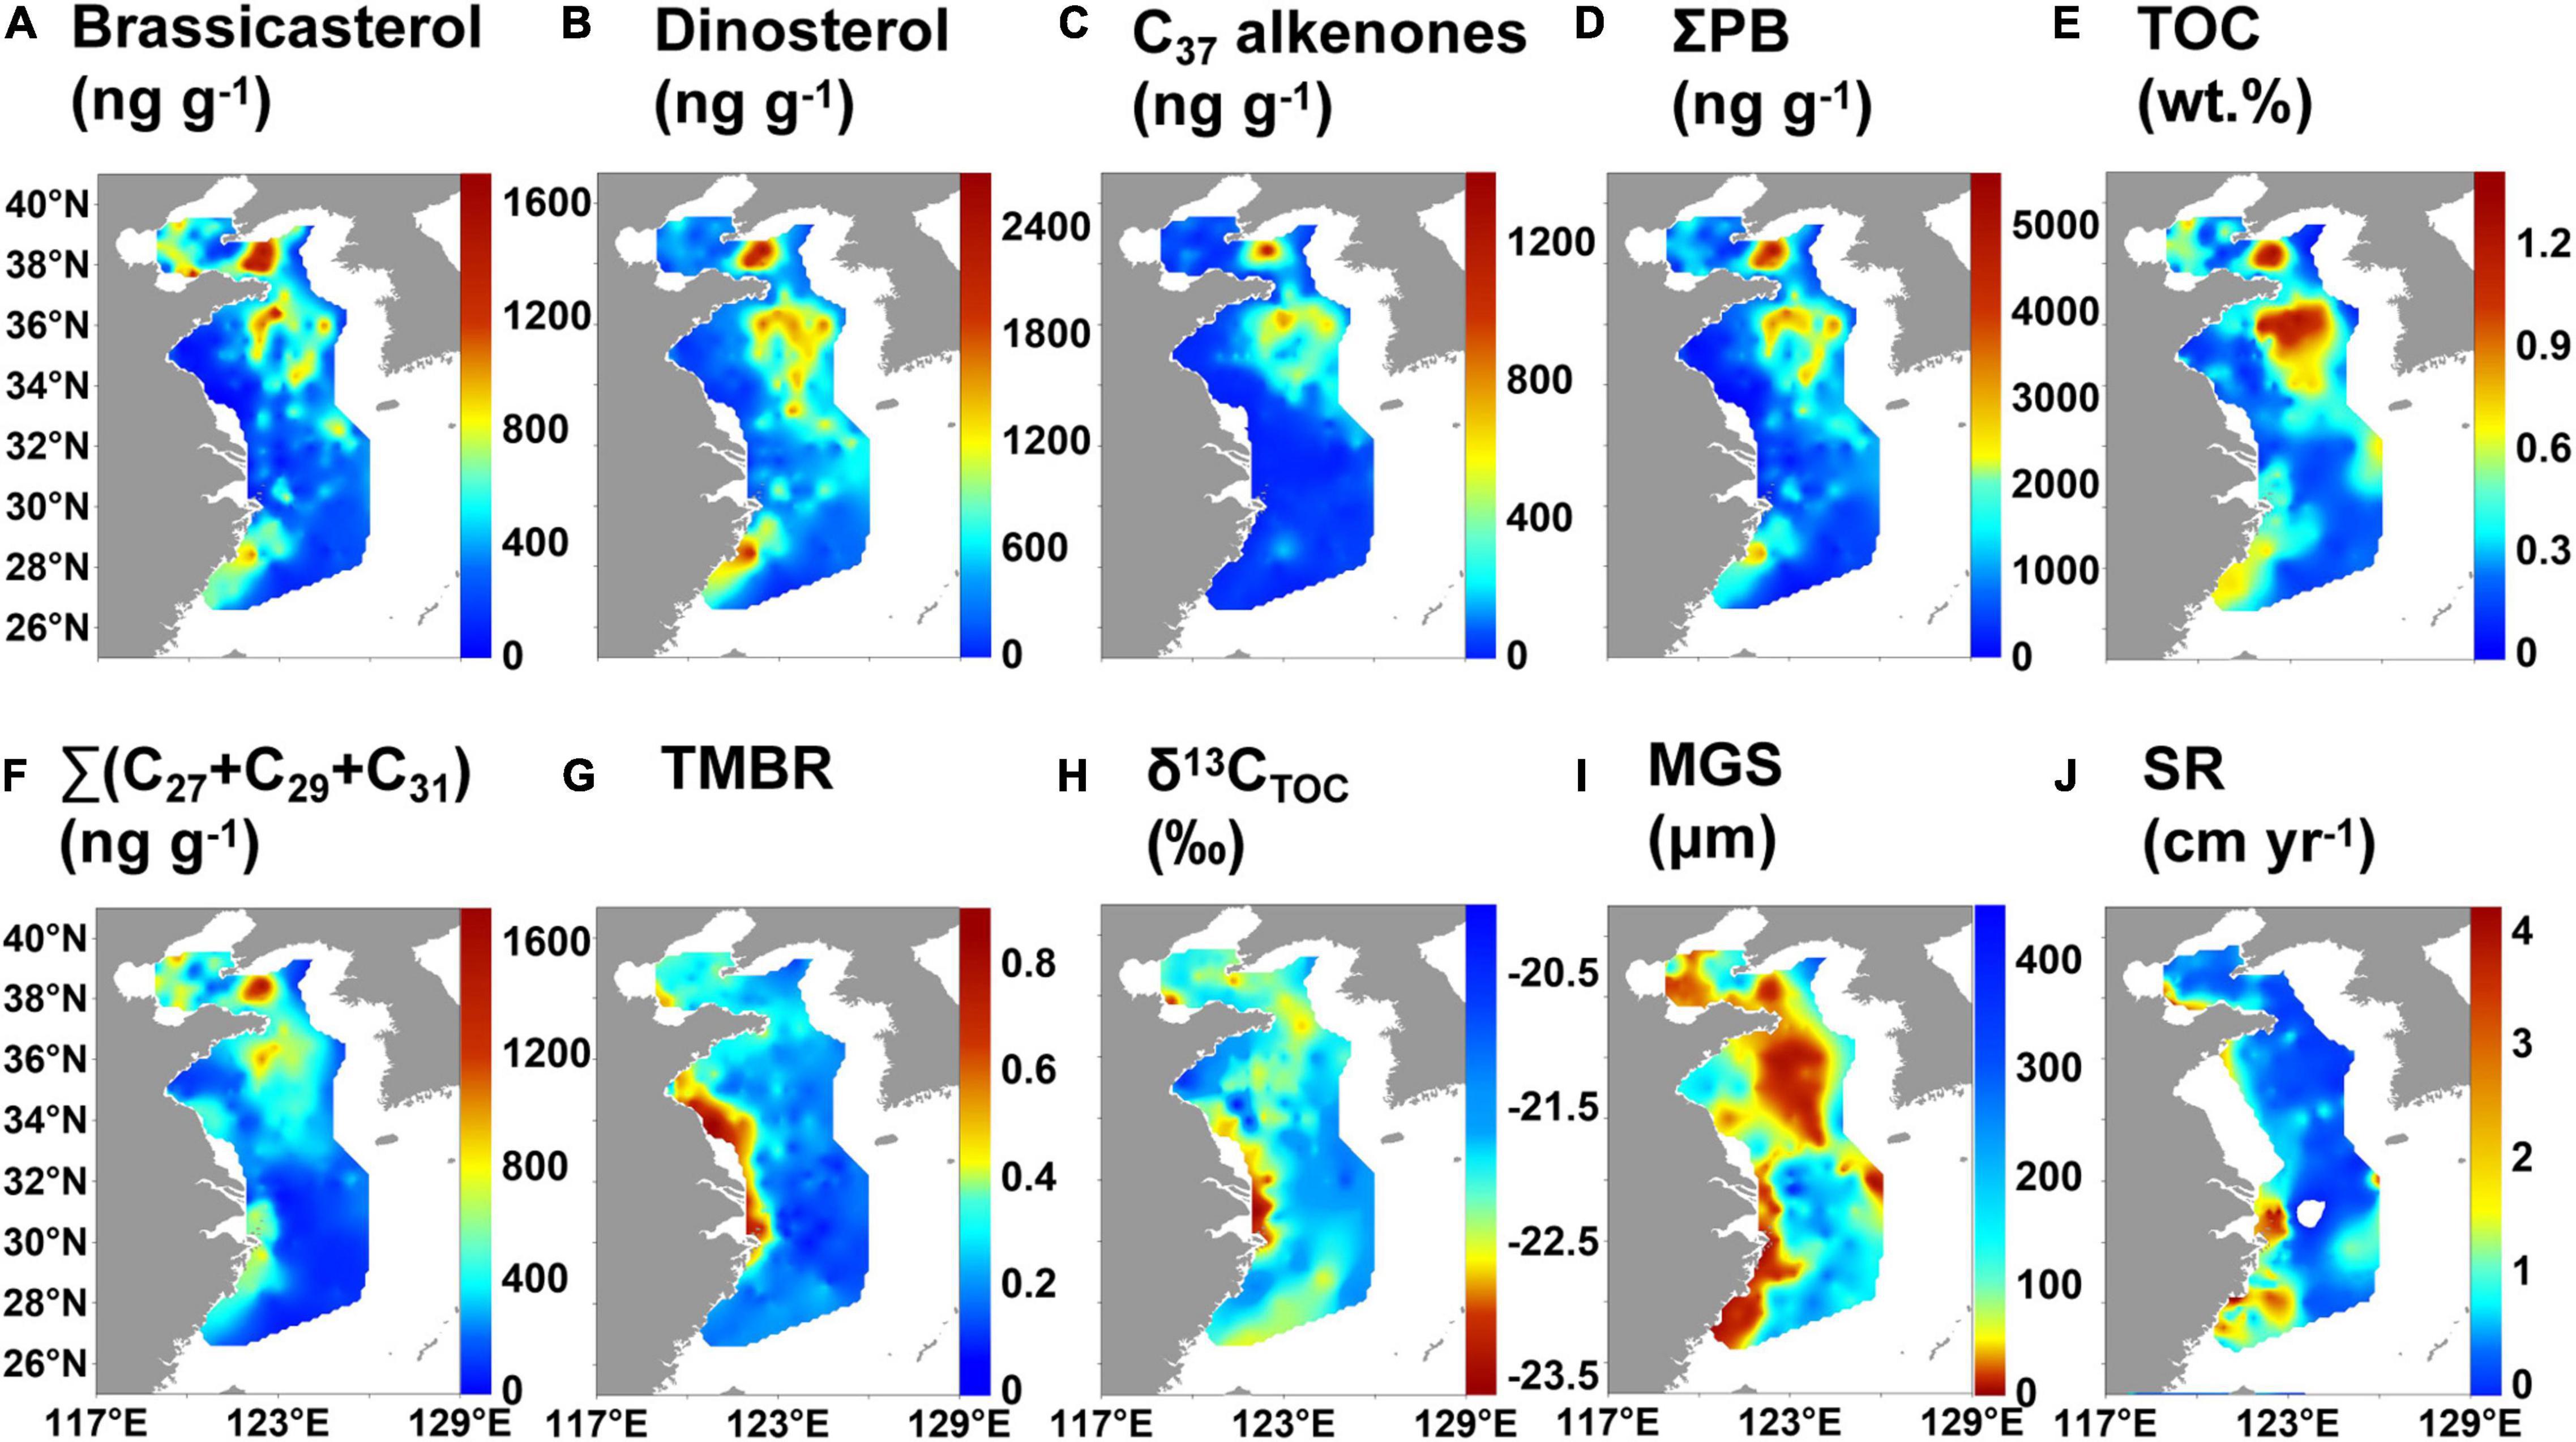
Figure 5. Distribution of lipid biomarkers and geographical variations in bulk properties of surface sediments in the eastern China marginal seas: (A) brassicasterol, (B) dinosterol, (C) C37 alkenones, (D) ΣPB, (E) TOC, (F) Σ(C27 + C29 + C31) n-alkanes, (G) terrestrial and marine biomarker ratio (TMBR), (H) δ13CTOC, (I) mean grain size (MGS), and (J) sedimentation rate (SR).
The ranges of TOC were 0.04–1.34% (mean value: 0.41%), and those of Σ(C27 + C29 + C31) n-alkanes were 15.5–1,714 ng g–1 (mean value: 346 ng g–1) (Supplementary Table 3). The distribution patterns of TOC and Σ(C27 + C29 + C31) n-alkanes were broadly similar with that of ΣPB (Figures 5D–F), but Σ(C27 + C29 + C31) n-alkanes had no high values southwest of the Cheju Island. TMBR varied from 0.06 to 0.85, with an average of 0.27 and showing a decreasing trend from the nearshore to the offshore (Supplementary Table 3 and Figure 5G). δ13CTOC (range: −23.5 to −20.0‰, mean value: −22.0‰) broadly increased seaward, but there were high values in the southern coastal areas of the Shandong Peninsula (Supplementary Table 3 and Figure 5H). The mean grain size was low in the mud areas of the ECMS (Figure 5I); the sedimentation rate was high in the CRE, the coastal areas of Fujian and Zhejiang and the YRE (Figure 5J).
To partially eliminate the influence of grain size and deposition rate on biomarker contents, the distribution patterns of TOC-normalized marine lipid biomarkers were also reported (Supplementary Figure 2). TOC-normalized contents of lipid biomarkers showed an overall increasing trend seaward. In contrast, TOC-normalized contents of Σ(C27 + C29 + C31) n-alkanes showed a decreasing trend seaward.
The contents of three marine lipid biomarkers and ΣPB showed significant positive correlations with TOC contents and negative ones with the mean grain size (Spearman’s rank correlation, p < 0.001; Figure 6 and Supplementary Table 6). Significant negative correlations were also observed between dinosterol (and C37 alkenones) and sedimentation rate (p ≤ 0.04), and positive ones between dinosterol (and C37 alkenones and ΣPB) and depth (p ≤ 0.004).
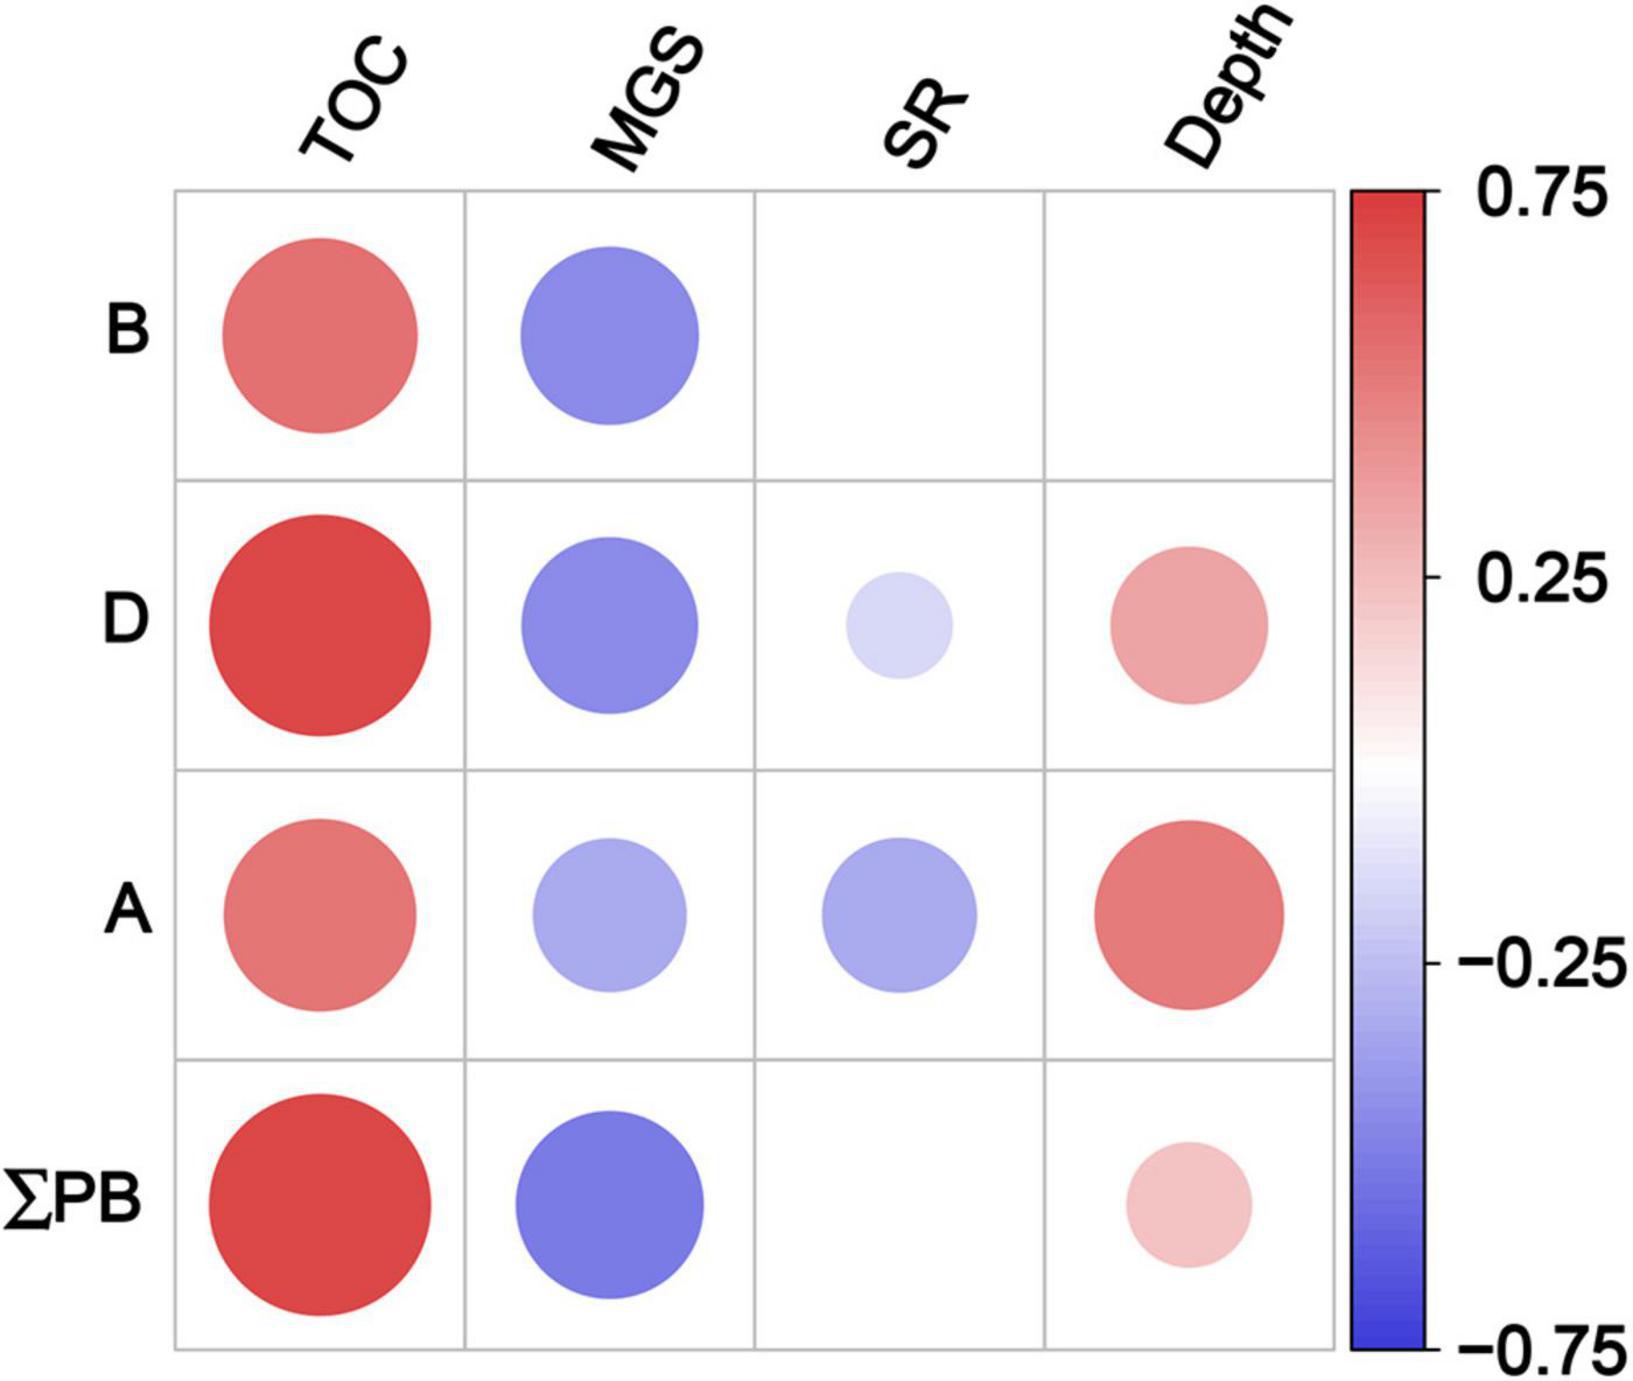
Figure 6. Spearman’s rank correlation coefficients between lipid biomarker contents and geographical parameters in surface sediments in the eastern China marginal seas. Significant correlation at p < 0.05; B: brassicasterol; D: dinosterol; A: C37 alkenones; ΣPB: the sum of brassicasterol, dinosterol and C37 alkenones. TOC, total organic carbon; MGS, mean grain size; SR, sedimentation rate. Red and blue solid circles refer to significant positive and negative correlations, respectively, with different diameters representing the differences in correlation coefficients. See also Supplementary Table 6 for the results of Spearman’s rank correlations.
End-Member Mixing Models
The ranges of fMar calculated by the binary mixing models of TMBR and δ13CTOC indices were 15–94% (mean value: 71%) and 45–100% (mean value: 69%), respectively (Supplementary Table 3). MOC (wt. %) calculated by TMBR and δ13CTOC ranged from 0.02 to 1.03% (mean value: 0.30%) and 0.03–0.86% (mean value: 0.28%), respectively (Figure 7). The distribution patterns of MOC (wt. %) calculated by the two indices were similar, showing high values in the mud areas, with the highest ones in the two mud deposits of the YS.
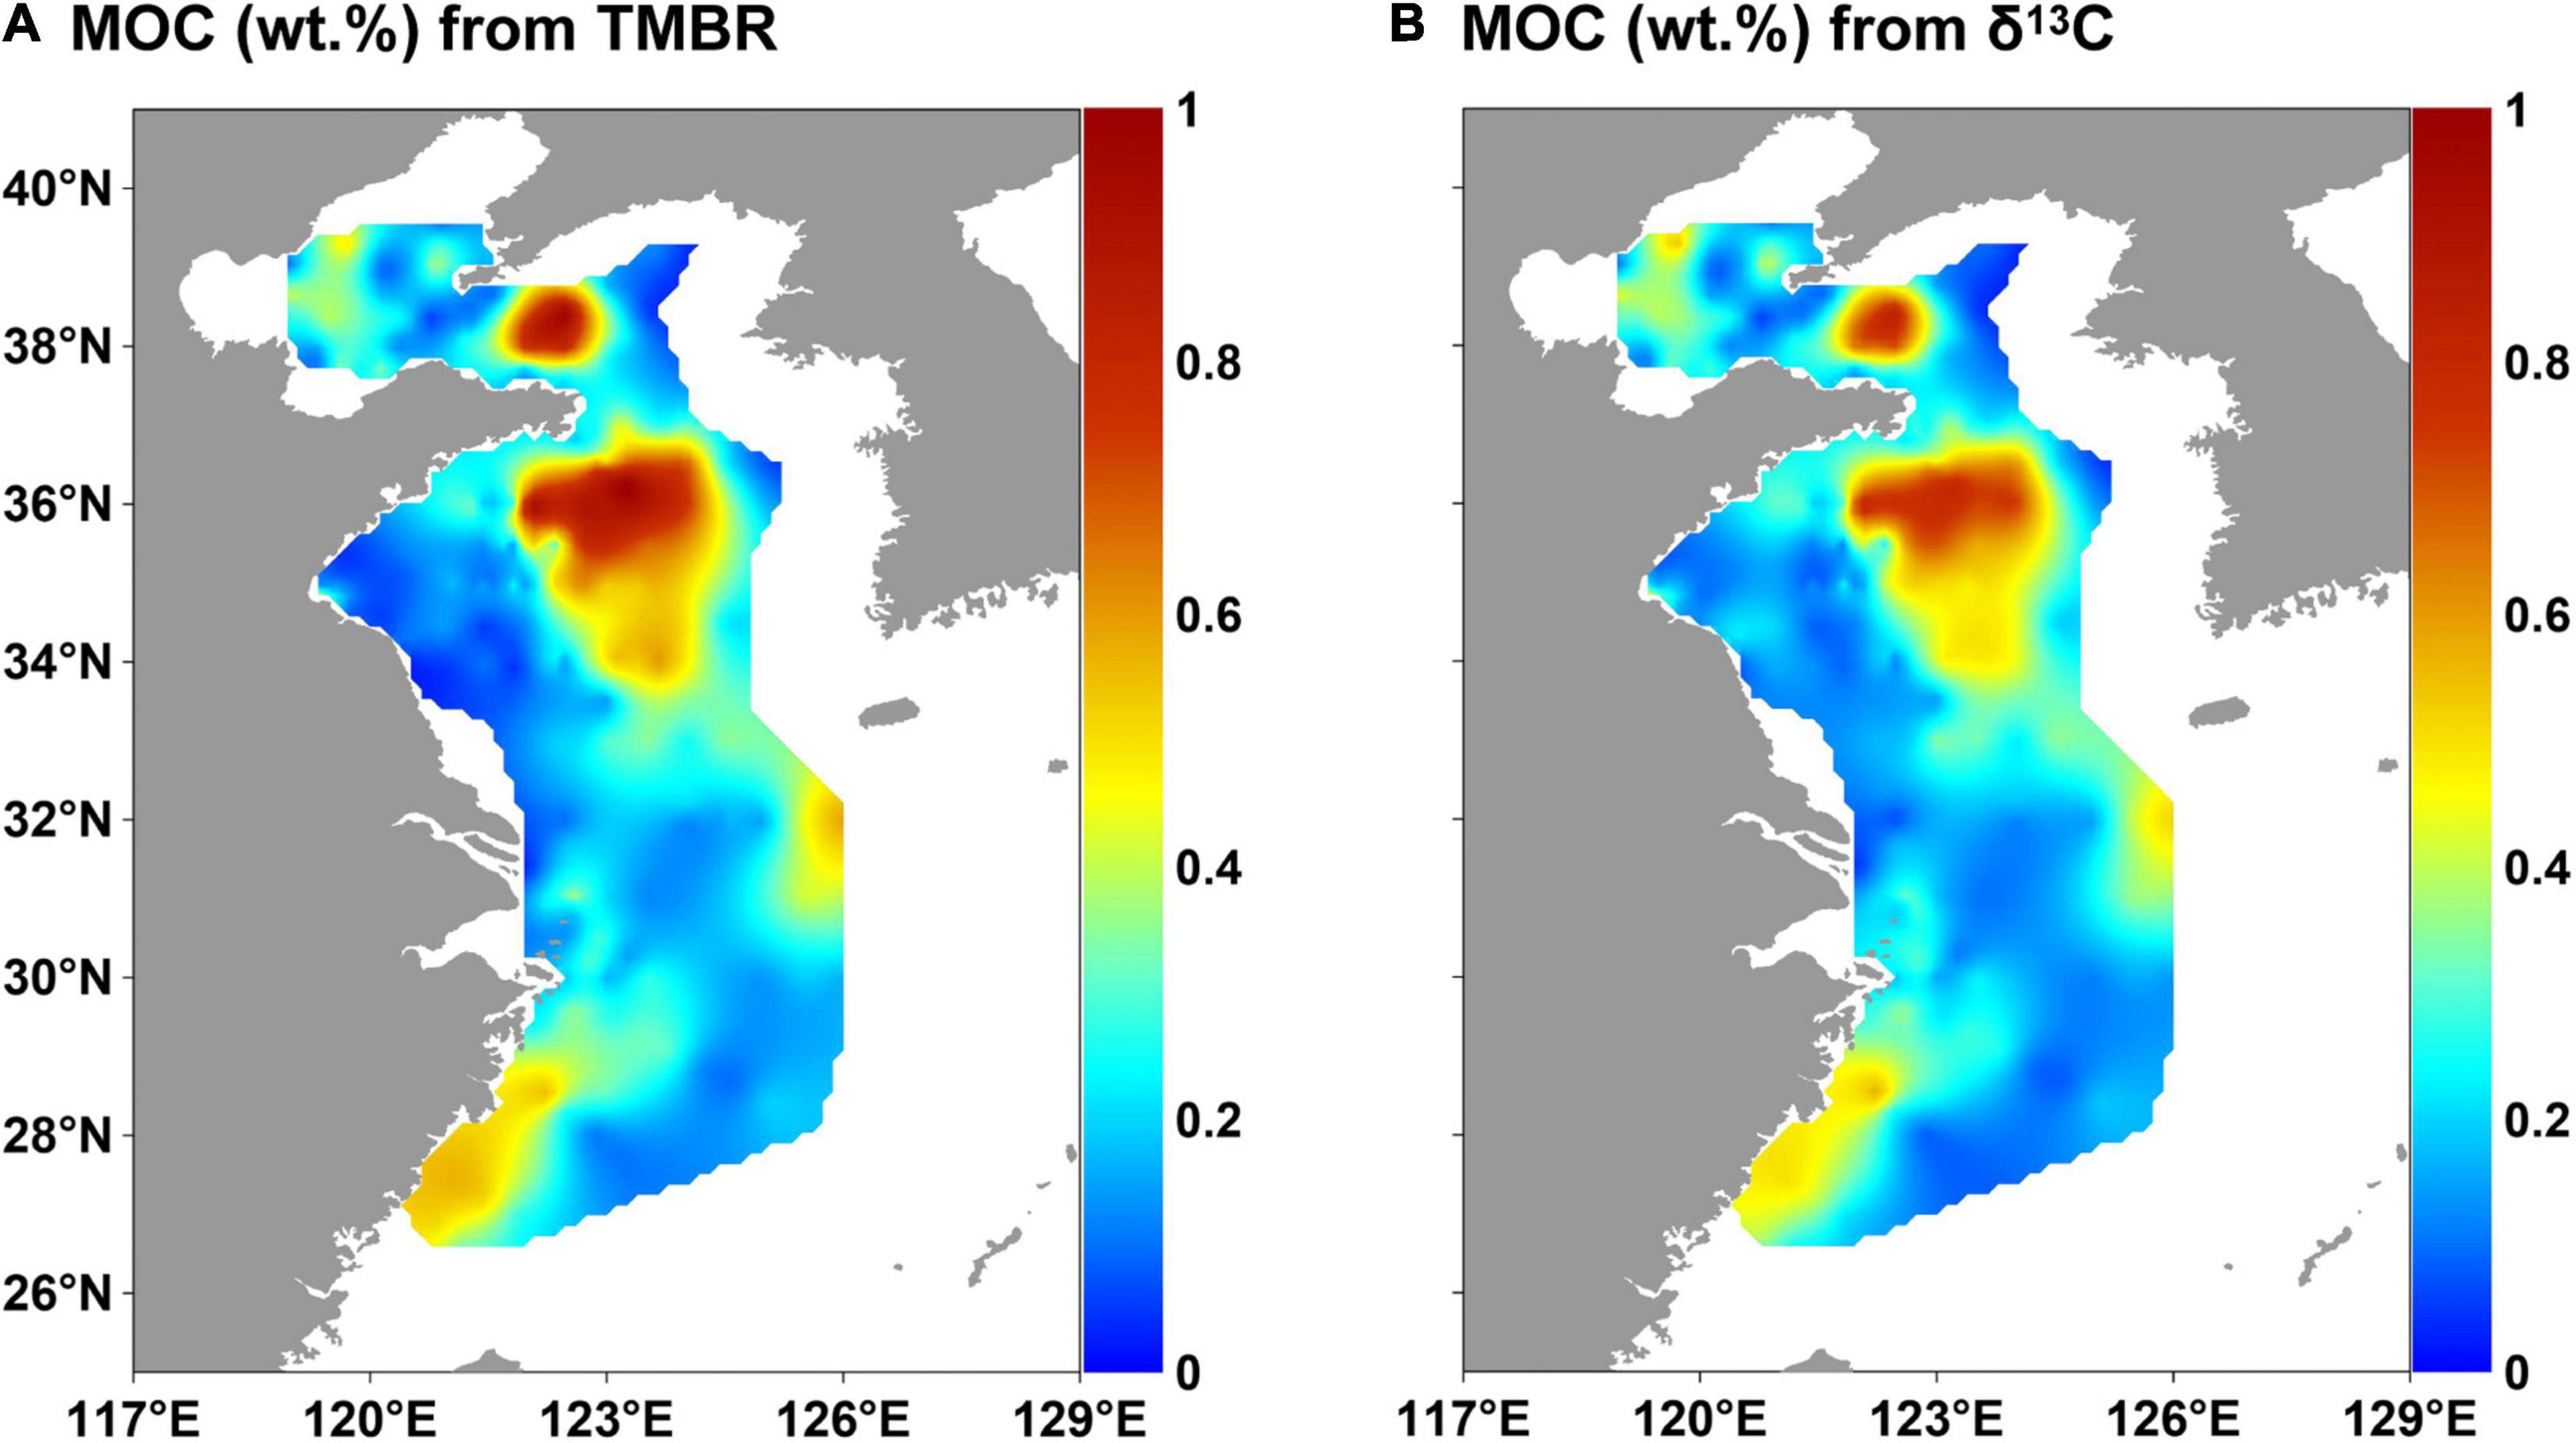
Figure 7. Distributions of MOC (marine organic carbon contents) calculated by TMBR (A) and δ13C (B) in surface sediments in the eastern China marginal seas.
Cluster Analysis
The clustering coefficients varied greatly with three or four clusters (Supplementary Figure 3). Non-parametric test showed significant results for all parameters when the number of clusters was four (Supplementary Table 7), indicating significant differences between the four regions. Moreover, the division with four clusters can well present the geographic continuity and independence of each region (Region 1, 2, 3, and 4; Figure 8), which was thus chosen in our study.
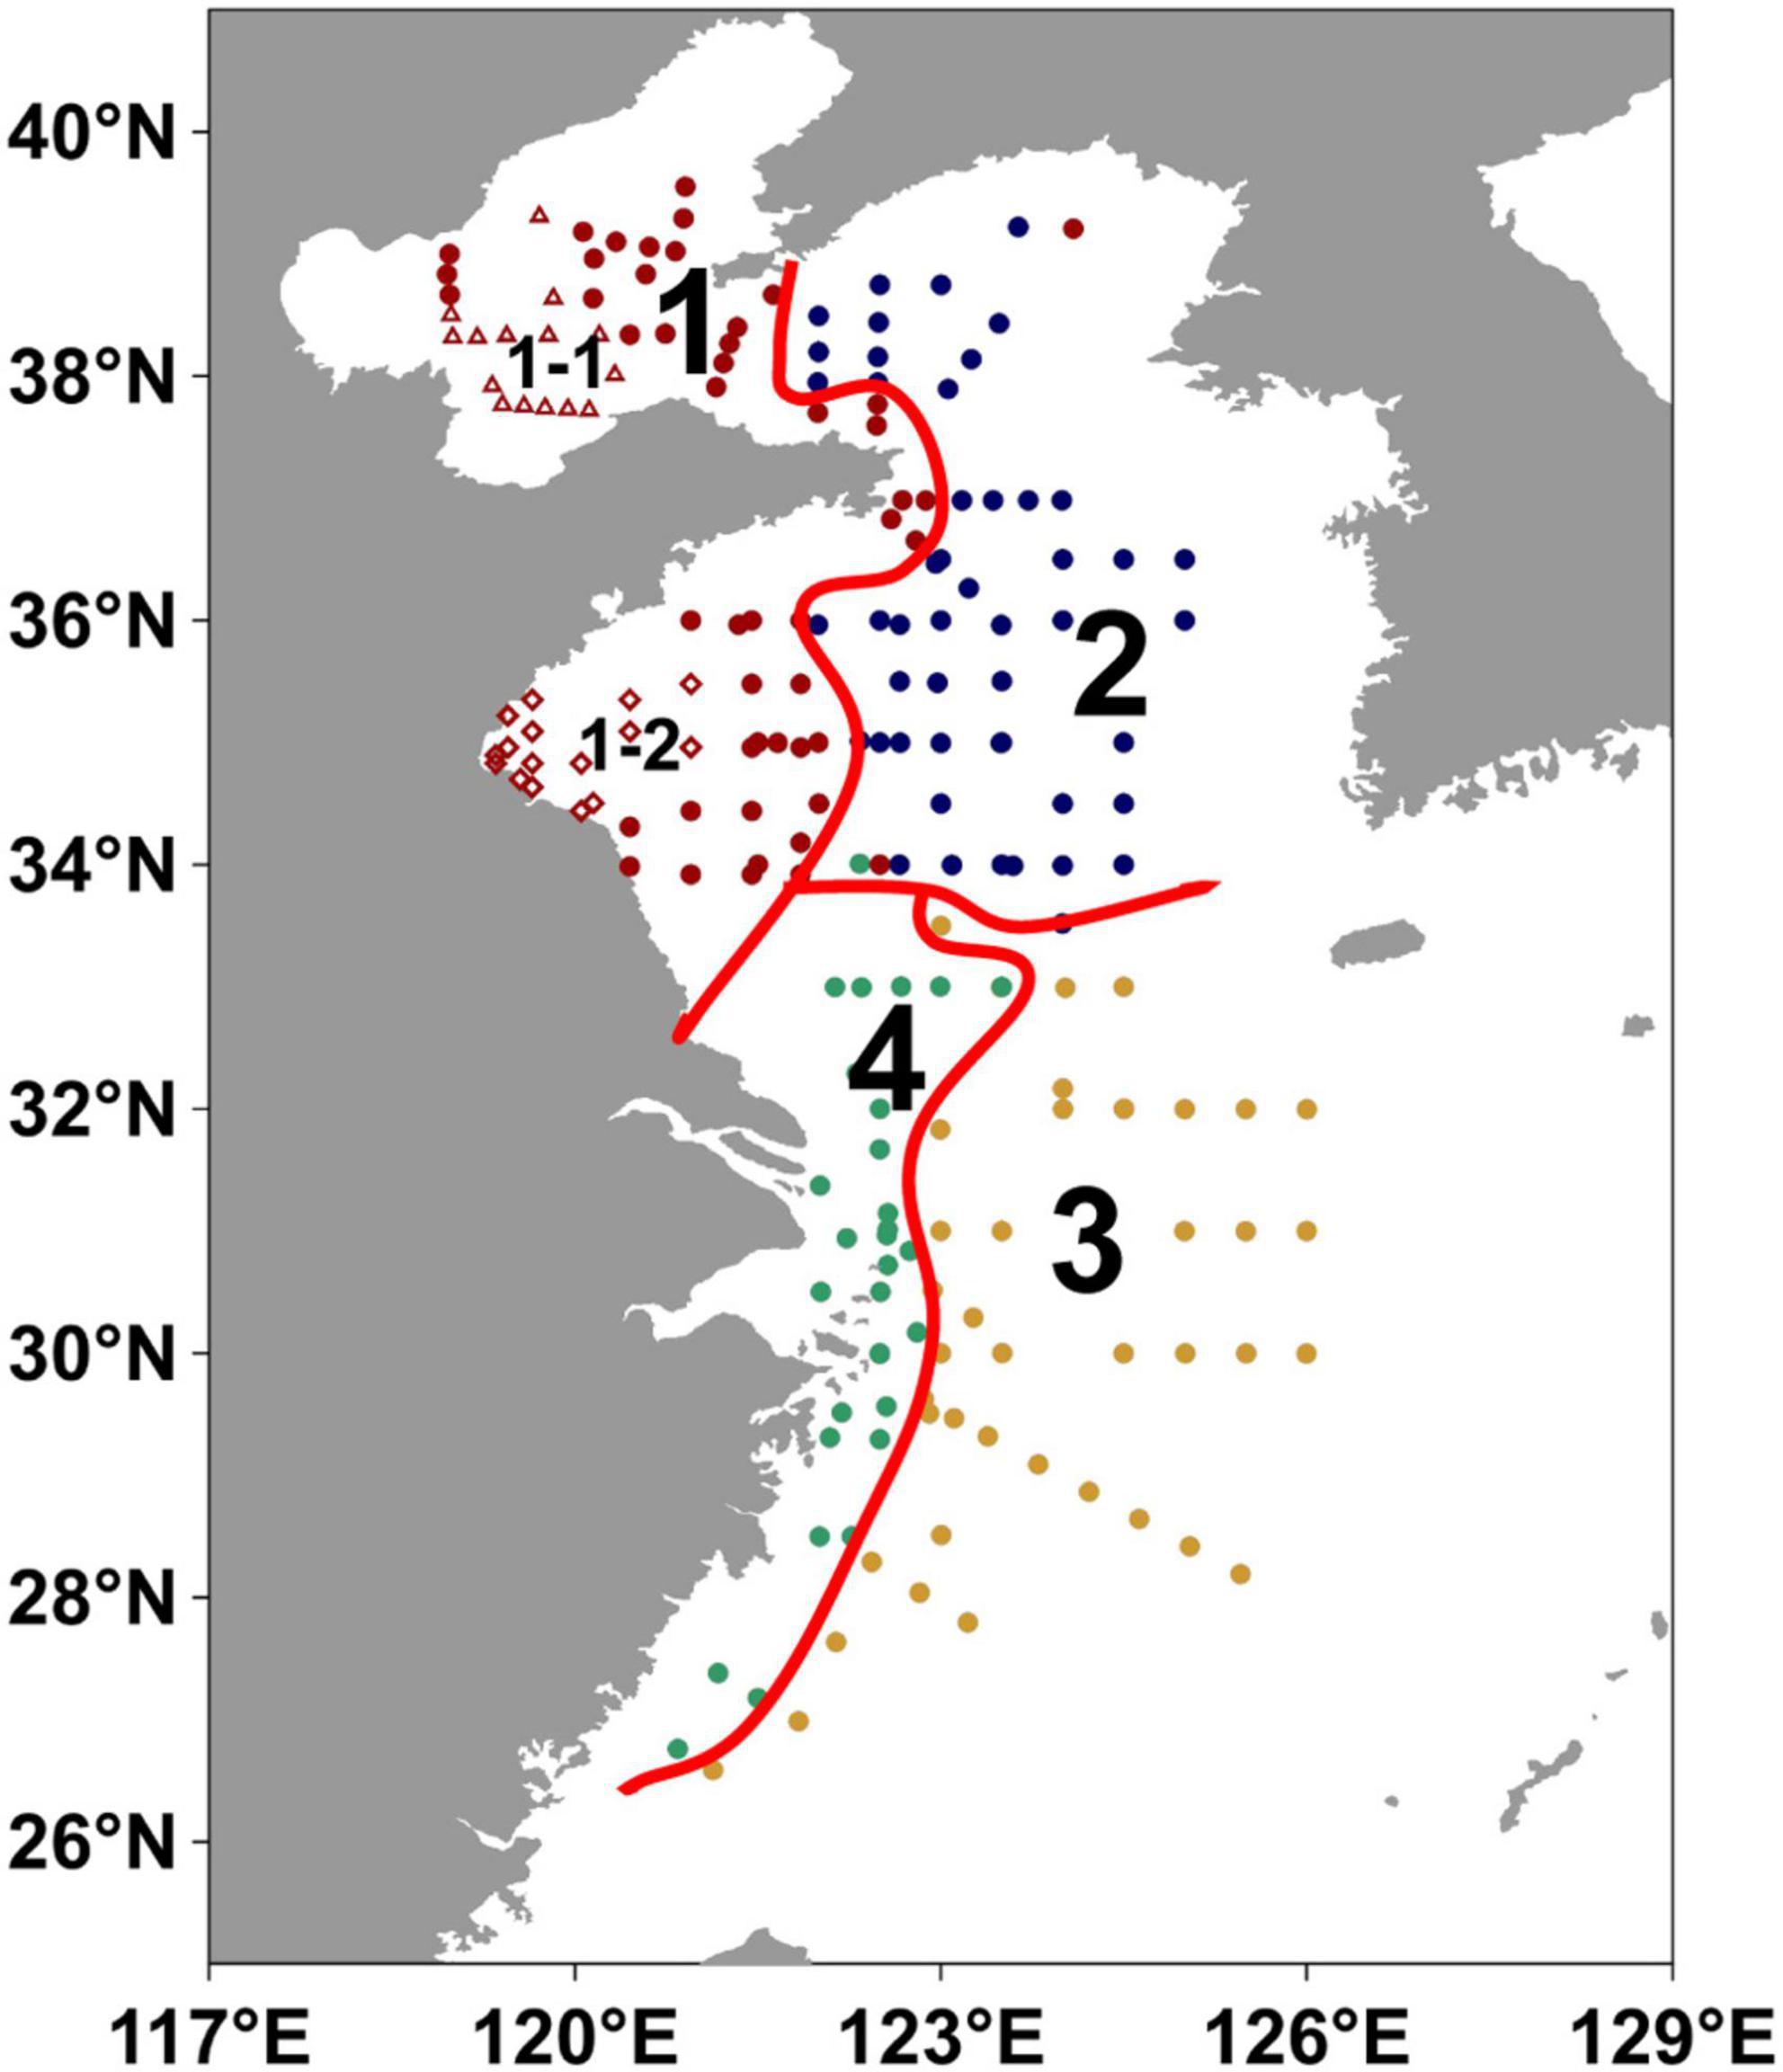
Figure 8. Partitions in the eastern China marginal seas by hierarchical clustering algorithm. The regions 1–4 refer to Yellow River impact region, North-central YS region, Mid shelf of the ECS and Inner shelf of the ECS, respectively. The hollow red triangles represent the stations located in the central Bohai Sea mud deposits (sub-Region 1-1), and hollow red diamonds represent the stations located in the western Yellow Sea sandy deposits in Region 1 (sub-Region 1-2).
Region 1 (Yellow River impact region) was located in the BS and the western YS and affected by the Yellow River input (Figure 8), with shallow water depths (mean value: 31 m), relatively low contents of TOC (mean value: 0.29%) and ΣPB (mean value: 743 ng g–1) in surface sediments, and relatively high mean grain size and sedimentation rate (mean value: 79.2 μm and 0.9 cm yr–1) (Figures 9H–L and Supplementary Table 3). In surface suspended particles, ΣPB concentrations in this region ranged from 33.2 to 3,069 ng L–1 (mean value: 776 ng L–1) (Figure 9D and Supplementary Table 4).
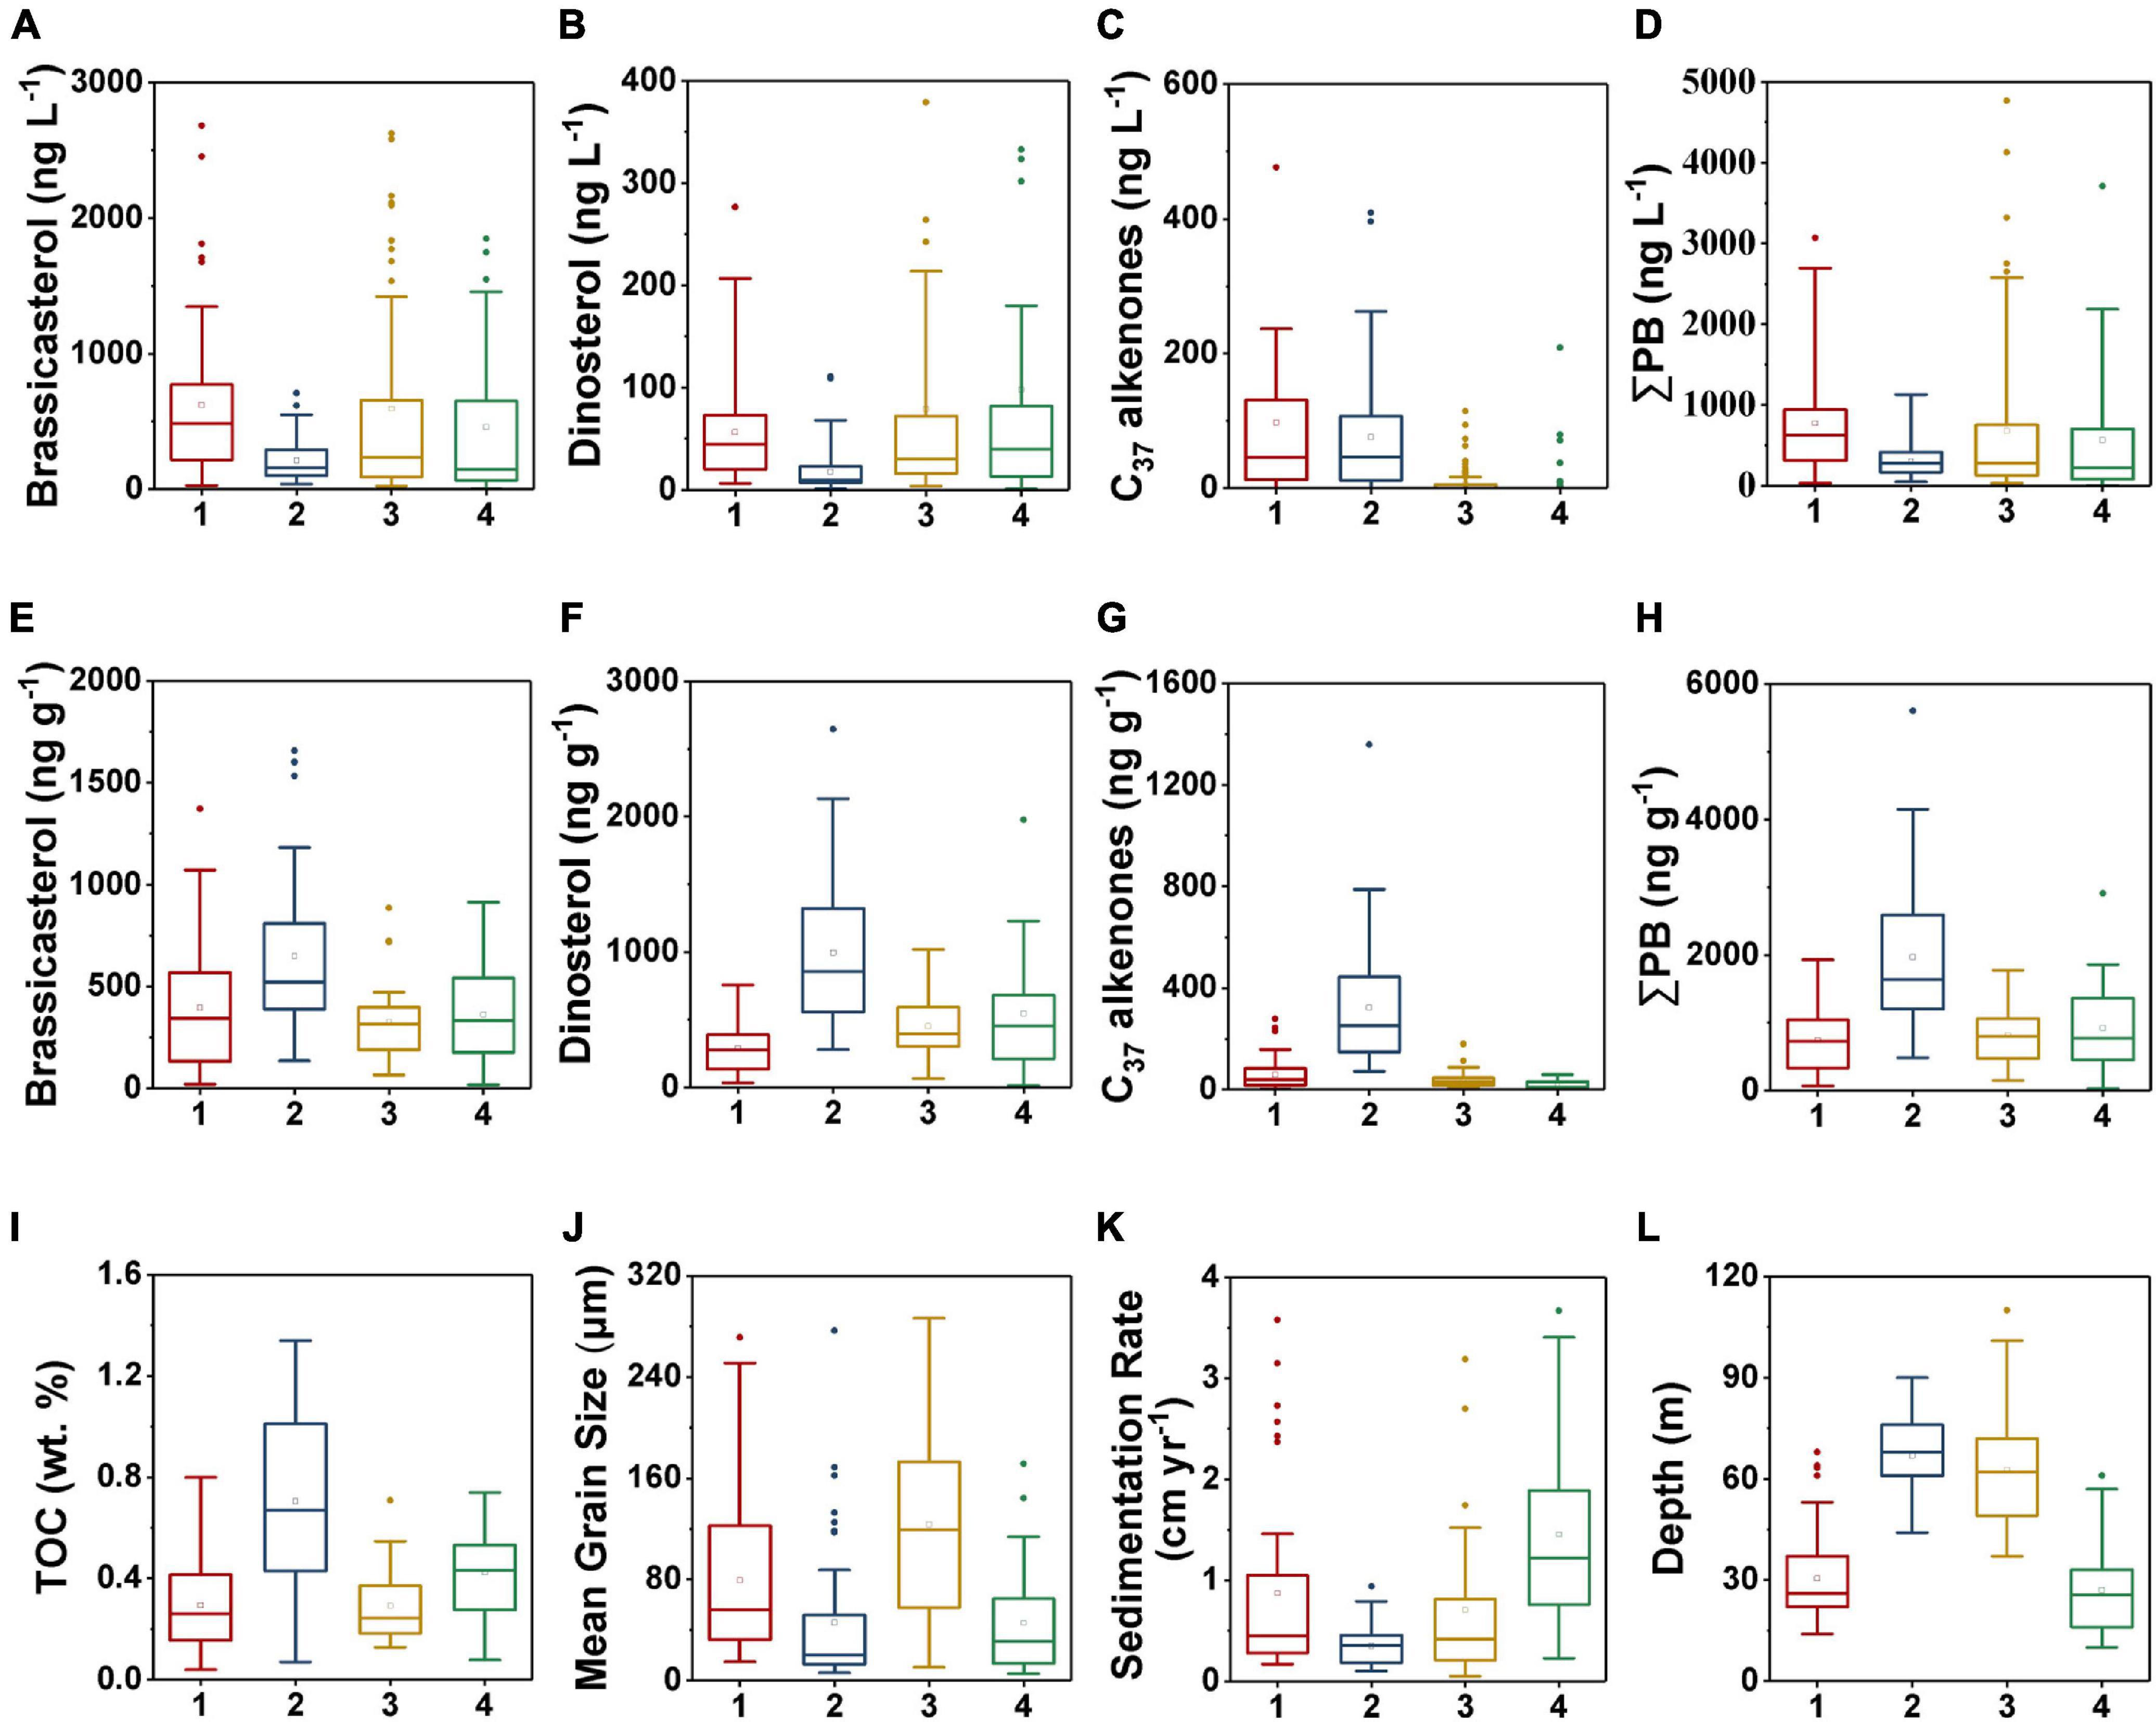
Figure 9. Boxplots of marine lipid biomarkers in each region as demarcated by the hierarchical clustering algorithm in surface suspended particles (A–D) and surface sediments (E–H): (A,E) brassicasterol, (B,F) dinosterol, (C,G) C37 alkenones, and (D,H) ΣPB; and boxplots of the various geochemical parameters per partition in surface sediments (I–L): (I) TOC, (J) mean grain size, (K) sedimentation rate, and (L) depth. The numbers 1–4 refer to the regions 1–4, respectively. The bottom and top of the box present the lower and upper quartile, respectively, with the dividing line indicating the median and the hollow square indicating the mean value. The ends of whiskers indicate the lowest and highest values, and the points are outliers. Note that some extreme outliers are not displayed here to clearly show the differences between the four regions.
Region 2 (North-central YS region), was characterized by relatively deep water (mean value: 67 m), highest TOC contents (mean value: 0.71%) and ΣPB (mean value: 1,967 ng g–1) in surface sediments (Figures 8, 9H,I,L, and Supplementary Table 3). The sedimentation rate (mean value: 0.4 cm yr–1) was lowest among the four regions, and the mean grain size was small (45.9 μm) (Figures 9J,K). The concentrations of ΣPB ranged from 50.2 to 1,129 ng L–1, with a minimum mean value (305 ng L–1) in surface suspended particles (Figure 9D and Supplementary Table 4).
Region 3 (Mid shelf of the ECS) was characterized by deeper water (mean value: 63 m), and relatively low TOC (mean value: 0.29%) and ΣPB (mean value: 813 ng g–1) (Figures 8, 9H,I,L and Supplementary Table 3). This region had the highest mean grain size (mean value: 123.5 μm) and a relatively low sedimentation rate (mean value: 0.7 cm yr–1) (Figures 9J,K). The range of ΣPB concentrations was 31.4–7,294 ng L–1 (mean value: 679 ng L–1) in surface suspended particles (Figure 9D and Supplementary Table 4).
Region 4 (Inner shelf of the ECS) mainly included the CRE and Fujian-Zhejiang coastal mud deposits (Figure 8). The region was characterized by the shallowest water depth (mean value: 27 m) and relatively high values of TOC (mean value: 0.42%) and ΣPB (mean value: 922 ng g–1) (Figures 9H,I,L and Supplementary Table 3). The mean sedimentation rate value was highest (1.5 cm yr–1), but the mean grain size (mean value: 45.6 μm) was very small (Figures 9J,K). In surface suspended particles, ΣPB concentrations ranged from 3.4 to 3,712 ng L–1 (mean value: 566 ng L–1) (Figure 9D and Supplementary Table 4).
Accumulation Rate and Proto-Burial Efficiency of Marine Organic Carbon and Marine Lipid Biomarkers
The average accumulation rates of marine OC ranged from 15.5 to 38.8 t C km–2 yr–1 and from 14.2 to 38.1 t C km–2 yr–1 by TMBR and δ13CTOC, respectively, over the entire ECMS (Table 1). In each region, the accumulation rates of marine OC were comparable between the two indices, showing higher values in Region 4 (mean value: 38.8 and 38.1 t C km–2 yr–1, respectively). Similarly, the proto-burial efficiencies of marine OC in each region were also comparable between the two indices (8–19% for TMBR index, and 7–19% for δ13CTOC, respectively), showing higher values in Region 4 (Table 1). For marine lipid biomarkers, the accumulation rates and proto-burial efficiencies ranged from 5.5 to 12.8 kg km–2 yr–1 and 6 to 24%, respectively, showing higher values of proto-burial efficiencies in Region 2 (mean value: 24%) and Region 4 (mean value: 17%) (Table 2).
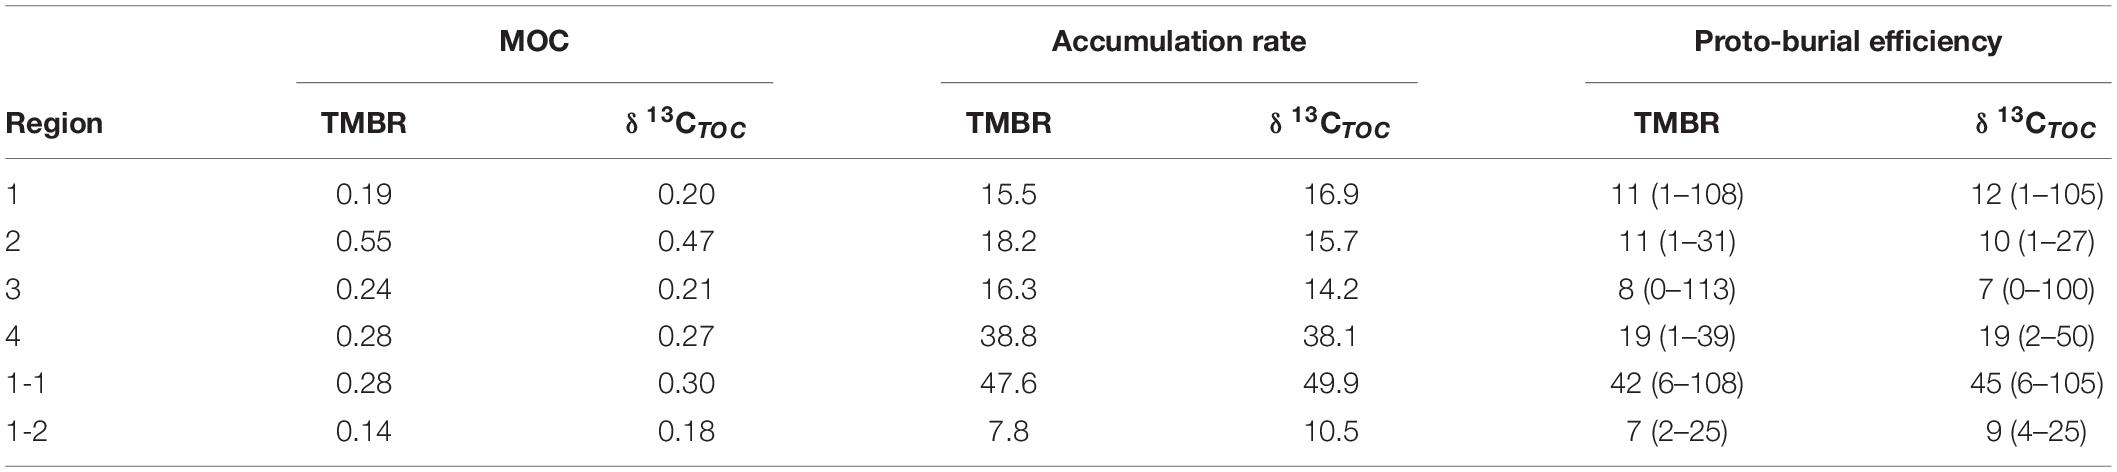
Table 1. The mean values of MOC (marine organic carbon contents; wt. %) and accumulation rate (t C km–2 yr–1), and the mean values (ranges) of proto-burial efficiency (%) of marine organic carbon calculated by TMBR and δ13CTOC in the four regions, and sub-Region 1-1 (central Bohai Sea mud deposits) and sub-Region 1-2 (western Yellow Sea sandy deposits) of the eastern China marginal seas.
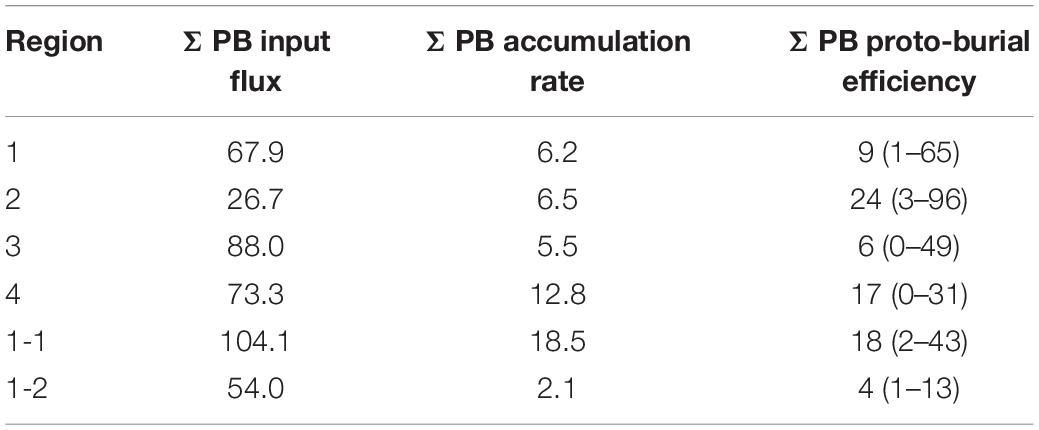
Table 2. The mean values of input flux (kg km–2 yr–1) and accumulation rate (kg km–2 yr–1), and the mean values (ranges) of proto-burial efficiency (%) of ΣPB (brassicasterol + dinosterol + C37 alkenones) in the four regions, and sub-Region 1-1 and sub-Region 1-2 of the eastern China marginal seas.
Discussion
Spatial Distribution of Marine Lipid Biomarkers
The concentrations of ΣPB in surface suspended particles had high values off the CRE, Zhejiang coastal upwelling area and the central BS, broadly consistent with the distribution of Chl a (Figures 2D,E). Previous studies have demonstrated the applicability of lipid biomarkers as proxies of phytoplankton biomass and community structure in the ECS, the YS and the Western Tsushima Strait (Wu et al., 2016; Bi et al., 2018). Our results provide further evidence for the application of these proxies at a much larger spatial scale of the ECMS. Notably, the distribution of brassicasterol and dinosterol overall resembled that of ΣPB in surface suspended particles (Figures 2A,B,D); but it was different for C37 alkenones, which had high concentrations in the YS and the BS, and lower values in the ECS (Figure 2C). These different distribution patterns of the three lipid biomarkers are consistent with previous results from microscopic observations (Jiang et al., 2015, 2019a; Luan et al., 2018), implying different controlling mechanisms for the production of different phytoplankton groups. Specifically, we observed that nutrient concentrations and structure play important roles in regulating phytoplankton biomass, especially for diatoms and dinoflagellates, as revealed by the significant positive correlations between ΣPB (and brassicasterol and dinosterol) and DIN (and DIN/DIP and DIN/Si) (Figure 4). This result is consistent with previous findings in the CRE, the ECS and the southern YS in summer (Jiang et al., 2015; Wu et al., 2016), because sufficient nutrients from the Changjiang River induce high phytoplankton biomass in these areas, and the runoff of the Changjiang River is much higher in summer, with the large influencing area of the CDW and forming the fronts beyond 125°E and 33°N (Figure 3E; Wei et al., 2015; Jiang et al., 2019b). In contrast, C37 alkenones showed significant negative correlations with nutrients and temperature, but positive ones with salinity and depth (Figure 4). These results are consistent with the prediction of Margalef (1978) and previous observations (Sawada et al., 1996; Yang et al., 2004), suggesting that diatoms and dinoflagellates favored high nutrients, but coccolithophores at oligotrophic and high-salinity conditions. The negative correlations between C37 alkenones and temperature may be attributed to the relatively low optimal temperature of haptophytes, e.g., 20°C for the growth of Gephyrocapsa oceanica and Emiliania huxleyi, which decreases rapidly when temperature is higher than 25°C (Rhodes et al., 1995). Similarly, previous studies also showed that temperature was the crucial factor in controlling haptophyte abundance, with peak values occurring at 15.7°C in the ECS in spring 2009 (Lin et al., 2014). Indeed, high temperature (>25°C) widely occurred in the ECS, where the concentrations of C37 alkenones were relatively low and undetected at some stations in our study (Figure 2C and Supplementary Table 4). It should be noted that the data of hydrological parameters and nutrients were collected in the summer in different years. Previous studies have shown that the distribution patterns of these parameters are overall similar in summers between different years in certain areas of the ECMS (Chen, 2008; Guo et al., 2014; Jiang et al., 2015; Wu et al., 2016; Chen X. et al., 2017; Xu et al., 2020), thus it is reasonable to assume that the values of these parameters were relatively stable in the surface water in the summers between 2010 and 2015 in this preliminary study.
The content of the individual lipid biomarkers in surface sediments showed broadly similar distribution patterns, with high values in the mud deposits (Figures 5A–D). This result is consistent with previous work in our study area and other sites, showing that high marine OC values usually occurred in the fine-grain sediments (Deng et al., 2006; Hu et al., 2013; Hu L. et al., 2016; Liu et al., 2020). Similar spatial patterns were also observed for the MOC (wt. %) calculated by the indices of TMBR and δ13CTOC in our study (Figure 7), further demonstrating the applicability of lipid biomarkers as proxies of marine OC in surface sediments. The OC contents in marine sediments are influenced by many environmental factors in addition to the productivity of the overlying water, such as hydrodynamic sorting of sediments during deposition, local deposition rates and the oxygen concentrations in the overlying water. In our study, marine biomarkers showed significant positive correlations with TOC and negative ones with mean grain size, but non-significant correlations with sedimentation rate (Figure 6), suggesting that grain size was a main controlling factor for the distribution of OC in surface sediments. Similarly in Peru margin sediments, Bergamaschi et al. (1997) also suggested that grain size might be the main factor determining the composition and distribution of OC, because OC contents in sediments were directly related to mineral surface area, as the adsorption of OC on mineral surface can protect it from remineralization. In the mid and outer shelf of the ECS, the sediments are mainly composed of coarse-grained quartz and biogenic carbonate sand. Marine OC in this area is diluted and rapidly oxidized (Lin et al., 2000, 2002) and both processes result in lower OC preservation in coarse-grained sand areas. Hydrodynamic conditions control the distribution of sediments with different grain size, and hence the contents of OC buried in the seafloor (Bergamaschi et al., 1997). The TOC-normalized contents of marine biomarkers, which can minimize the effects of grain size, sedimentation rate and degradation, showed low values in the coastal areas, and broadly increased offshore (Supplementary Figure 2). In contrast, the contents of TOC-normalized Σ(C27 + C29 + C31) n-alkanes were higher in the coastal areas and lower offshore, indicating that the contribution of terrestrial OC to TOC was relatively low in the offshore areas.
In summary, the concentration of marine lipid biomarkers in surface suspended particles had high values in the estuaries and upwelling areas, but their contents in surface sediments had high values in mud areas of both coastal and basin areas. In order to reveal the controlling mechanisms of the spatial distributions of marine OC in both surface suspended particles and surface sediments, four regions were identified (Figure 8) mainly based on ΣPB, TOC, depth and the geographical position. Region 2 highlighted a contrast pattern where it was characterized by particularly high biomarker values in surface sediments but low ones in surface suspended particles (Figures 9A–H). Thus, the different distribution patterns of lipid biomarkers between surface water and sediments can be attributed to complex processes from generation to burial of marine OC, e.g., the lateral transport and degradation of OC in the water column, and the preservation with different particle size sediments (Bianchi et al., 2002; Jeng and Huh, 2004; Le Guitton et al., 2015). In addition, lipid biomarkers in surface sediments reflected phytoplankton production and community structure at a longer time scale of several decades with sedimentation rate ranging from 0.05 to 4.2 cm yr–1 (Supplementary Table 3) compared to that in surface suspended particles (Tao et al., 2012), with the latter controlled by environmental conditions during sampling cruises. Although surface suspended particles were collected from different cruises over several years (2010–2015), high concentrations of marine lipid biomarkers in the YS and the ECS were all located off the CRE. Moreover, we observed an overall increase in the mean ΣPB concentrations off the CRE over time, consistent with previous observations which showed an increasing trend in satellite-derived Chl a concentrations off the CRE during bloom season (May to June) from 1998 to 2014 (Chen C. et al., 2017).
Transportation and Burial Processes of Marine Organic Carbon
Region 1 covered the BS (Figure 8) and was characterized by high lipid biomarker concentrations in both surface suspended particles and surface sediments (Figures 2A–D, 5A,D,E). As the water discharge of the Yellow River was much lower than the Changjiang River (Qiao et al., 2017), nutrient concentrations in the YRE were much lower than the CRE, but they were still higher compared with other areas without river input (Figure 3A; Yang et al., 2015). Yellow River discharge with high DIN caused high primary production in the YRE and the central BS, and resulted in suspended particles containing high marine OC. This result is consistent with the surface distribution of Chl a in summer in this study (Figure 2E) and satellite-derived data by Zhang H. et al. (2017). The central BS mud deposits were formed under weak tidal currents, and about 20% of suspended particles from river input were deposited here (Zhu and Chang, 2000; Qiao et al., 2017).
Region 2 mainly included the northern YS mud deposits and southern YS mud deposits. As mentioned above, the biomarker contents in Region 2 were lowest in the surface water and highest in surface sediments among the four regions (Figures 9A–H). Due to the lack of strong riverine input, and the YS cold water mass hinders the upward transport of nutrients in the bottom, the primary production in the surface water was low (Li et al., 2019). Therefore, the contribution of marine OC from other regions was relatively higher in the sediments in Region 2. Bi et al. (2011) found that the annual sediment flux transport through the southern Bohai Strait was up to 4 × 10⁷ t yr–1 in winter, carried by the BS Coastal Current and the YS Coastal Current, which was about four times greater than that in summer. The YS Coastal Current forms a counterclockwise (cyclonic) gyre with the northward YS Warm Current, and the fine-grain sediments with high marine OC are mainly deposited in the northern YS mud deposits and southern YS mud deposits in Region 2 (Li et al., 2016), but marine OC is also subjected to continuous oxidative degradation during transportation. Previous studies on fine-grain sediments transport from the Yellow River have also suggested that the BS Coastal Current can transport suspended particles from the YRE and the central BS to the southern YS and form mud areas in the YS trough, but rarely to the outer shelf (Yang and Liu, 2007; Bian et al., 2013). Therefore, in addition to vertical settling and deposition, the remaining marine particulate OC from Region 1 can be transported to the east and south by the BS Coastal Current and the YS Coastal Current, and reach Region 2 eventually.
Both Region 3 and Region 4 contained high lipid biomarker concentrations in surface suspended particles in the northern areas (Figures 2A,B,D), while biomarker contents in surface sediments were relatively low in Region 3 but high in Region 4 (Figures 5A,B,D, 9E,F,H). The northern areas of these two regions are mainly affected by the CDW and the Zhejiang coastal upwelling in summer, and thus with high phytoplankton biomass in these areas. The extension of the CDW in the ECS is influenced by both freshwater discharge and southwesterly wind in summer (Bai et al., 2014), which can affect the distribution of fine-grain particles. Thus, in summer most of marine OC are produced and most of the sediments are discharged by the Changjiang River, while they are transported southward when the northeast winds prevail in winter, as revealed by sediment types, geochemical indices and terrestrial biomarkers (Chen C. -T. A. et al., 2017). During the transportation, these biogenic and resuspended sediments meet the northward Taiwan Warm Current with low suspended particles, resulting in about 70–90% of the particles with high marine OC deposited along the coast of Zhejiang and Fujian (Li et al., 2016; Duan et al., 2017), i.e., Region 4 in this study. Due to the shoal topography off the CRE, the southward YS Coastal Current flows toward southeast, which also forms a counterclockwise circulation with the southern YS Warm Current, forming the southwest mud area near the Cheju Island (Liu et al., 2007; Bian et al., 2013), where fine-grain particles can be deposited (Liu et al., 2007) and thus high marine biomarker contents were observed southwest the Cheju Island in the present study. In addition, a small portion of sediments from the CRE can be transported to the YS trough (Bian et al., 2013), potentially resulting in high lipid biomarkers in surface sediments in Region 2.
In summary, marine OC in surface sediments in Region 1, 3, and 4 was mainly generated in situ in each region. In Region 2, in addition to the in-situ production, high marine OC in sediments was from suspended particles transported from the BS and the CRE, which were deposited in Region 2 under the action of hydrodynamic sorting. Therefore, ocean currents can transport suspended particles with high marine OC from estuaries and upwelling areas to mud areas, causing the differences of lipid biomarker distribution patterns between surface suspended particles and sediments in this study.
Proto-Burial Efficiency of Marine Organic Carbon
Due to degradation and lateral transport, only a small fraction of marine OC is buried in sediments eventually (Hedges and Keil, 1995; Burdige, 2005). In our study, the estimated average proto-burial efficiencies of marine OC in the four regions by TMBR (8–19%) and δ13CTOC (7–19%) (Table 1) were very similar, we thus use the δ13CTOC estimated values for discussions and comparison in the following sections. Spatially, the proto-burial efficiency of marine OC in Region 4 (19%) was the highest, followed by that in Region 1 (12%), Region 2 (10%) and Region 3 (7%) (Table 1). Higher proto-burial efficiencies in Region 4 and Region 1 were a result of the combination of several factors, including higher in-situ production and settling of marine OC, shallow water (Figures 2D, 9D,L) and high sedimentation rates (Figures 5J, 9K) which enhanced the preservation of OC. In contrast, lower sedimentation rate and deeper water environment in Region 2 (Figures 5J, 9K,L) resulted in longer oxygen exposure time for marine OC, which strengthened the oxidative degradation of marine OC in the sedimentation process and caused a low proto-burial efficiency. In Region 3, the combination of lower marine OC production, coarse grain size and deeper water environment resulted in the lowest marine OC proto-burial efficiency among the four regions (Figures 2D, 9J,L and Table 1).
Our proto-burial efficiency estimates are broadly comparable to previous findings from the ECMS, but there are also major differences. For example, an average burial efficiency of 11% has been reported for the mud areas of ECMS (Zhao et al., 2021). Another study found a burial efficiency of 10% in the whole ECS (Duan et al., 2017) and 14% in the mud areas of the ECS (Zhao et al., 2021). However, Zhao et al. (2021) revealed a burial efficiency of 46% for marine OC in the mud areas of the BS, and Tao et al. (2021) estimated a burial efficiency of ca. 63% for in-situ marine OC at the bottom water-surface sediment interface in the BS based on biomarker proxies. These values are much higher than that of our Region 1. On the other hand, Deng et al. (2006) reported a burial efficiency of 5.5% for marine OC in the ECS, which is much lower than our result from Region 4 but is comparable to that of Region 3. One major reason for these differences is the role of mineral protection of OC which can be expressed by sediment grain size, with OC being better preserved in fine-grain mud areas. Thus, the high burial efficiency values in Zhao et al. (2021) may be attributed to a better preservation of marine OC in fine-grain sediments of their focused study area in the BS. In contrast, the low burial efficiency in Deng et al. (2006) was a result of their sampling stations on the mid- to outer shelf with much coarser sediments and much lower sediment rates.
Hence, our division of the four regions may not be ideal for evaluating marine OC proto-burial efficiency, as it was mainly based on the parameters of ΣPB, TOC, depth, and the geographical position. To emphasize the importance of gain size on burial efficiency, we selected 15 stations in the central BS mud area (sub-Region 1-1) and 18 stations in the western YS sandy area (sub-Region 1-2) among the Region 1 stations (Figure 8), and calculated proto-burial efficiencies of marine OC accordingly. The proto-burial efficiency for sub-Region 1-1 was 45% (Table 1), which was much higher than the Region 1 average and was similar to previous estimates for the BS mud areas (Tao et al., 2021; Zhao et al., 2021). On the other hand, the proto-burial efficiency for sub-Region 1-2 was only 9% (Table 1), which was much lower than the Region 1 average and was similar to the value of our Region 3 (sandy area) and previous estimates for the ECS mid- to outer shelf (Deng et al., 2006).
We also calculated the accumulation rate and proto-burial efficiency of marine lipid biomarkers (ΣPB) in the ECMS. Spatially, the proto-burial efficiency in Region 2 (24%) was the highest, followed by that in Region 4 (17%), Region 1 (9%), and Region 3 (6%) (Table 2). The proto-burial efficiency of ΣPB was similar to that of marine OC in Region 3 and Region 4, lower than that of marine OC in Region 1, but higher than that of marine OC in Region 2. Within Region 1, a similar sub-regional pattern was also revealed for the distribution of proto-burial efficiency of marine OC, with a higher value for ΣPB (∼18%) in sub-Region 1-1 and a lower value (∼4%) in the sub-Region 1-2 (Table 2). However, the absolute proto-burial efficiency of ΣPB in sub-Region 1-1 was much lower than that of marine OC. One possible reason is that the region’s euphotic layer is shallow and the Yellow River diluted water causes high turbidity. Thus, the production rates of biomarkers may be overestimated, because half of the biomarker contents in surface suspended particles in summer were used to represent the average concentration of biomarkers in the whole water column. In contrast, proto-burial efficiency of marine lipid biomarkers in Region 2 may be overestimated, as the net marine primary productivity in the YS in Region 2 was higher than the BS (112 and 159 t C km–2 yr–1 for the BS and the YS, respectively) (Deng et al., 2006; Song et al., 2008a), while we observed a lower ΣPB in surface suspended particles in Region 2 than in Region 1 (Figure 9D). Our estimation of ΣPB proto-burial efficiency did not consider several important aspects of phytoplankton production. The first is seasonal variations in phytoplankton production. Previous studies have shown that obvious algal blooms often occur in the central YS in spring (Sun et al., 2013), and high concentrations of ΣPB have been also observed in the southern YS in spring (Wu et al., 2016). Another consideration is that phytoplankton production also varies vertically. For example, in the central YS primary production was highest at the interface of the upper water and the YS cold water mass with rich nutrients, and it was generally low in the surface water under nutrient deficient conditions (Li et al., 2019). Therefore, the input rate of ΣPB was likely to be underestimated, and thus proto-burial efficiency may be overestimated in Region 2. Further work on vertical distribution of lipid biomarkers would provide additional evidence for a better understanding of carbon burial processes in the ECMS.
Overall, the ranges of proto-burial efficiency for marine OC and for marine biomarker ΣPB were similar (Tables 1, 2). This is a significant result and suggests that both approaches can be used to estimate OC preservation and burial in marginal sea sediments. While total OC content and δ13C can be easily measured and widely applied for OC source and burial estimates, biomarkers are better carbon source indicators which can eliminate interferences from other carbon pools (Eglinton et al., 1997). On the other hand, biomarkers generally comprise only a small portion of total marine OC and their use for estimating total marine OC burial efficiency can be biased by the selection of specific biomarkers. Our results suggested that our selected lipid biomarkers have similar burial efficiency as total marine OC, and can be applied for future studies in marine OC preservations, in addition to their application for source indicators.
Finally, the proto-burial efficiencies of marine OC and marine biomarkers in our study area are markedly higher than the average value in the world ocean (∼0.25%) and in marginal seas (<1.3%) (Burdige, 2005), which may be attributed to the high sedimentation rate and shallow water depth in the ECMS, confirming the importance of the ECMS in the global carbon sequestration (Song et al., 2008b; Zhao et al., 2017).
In addition to OC burial, other proxies such as new production and export production are also key determinants in the oceanic carbon cycle (Eppley and Peterson, 1979; Chen, 2003a). On a short time scale, the oceanic currents, seasonality and the wind field preliminarily control the distribution of phytoplankton production, which also strongly link to new production and export production. However, on geological time scale marine OC burial may not be correlated strongly with export production, but correlated with geochemical proxies such as sedimentation rate (Lopes et al., 2015) and lateral transport (Inthorn et al., 2006). Since the observation in surface sediments is an expression of marine OC and lipid biomarkers at decadal scale or longer, it is thus reasonable to use an average value of each parameter, e.g., accumulation rate, primary productivity and lipid biomarker contents, to quantitatively evaluate the proto-burial efficiency. Such an approach has been widely used to assess OC burial efficiency in marginal seas (Deng et al., 2006; Guerra et al., 2015; Włodarska-Kowalczuk et al., 2019; Zhao et al., 2021). Indeed, sedimentation rates, primary productivity and marine lipid biomarker production may vary seasonally and interannually in each region of the ECMS. Also, marine OC can be subjected to strong lateral transport in marginal seas. For example, the proto-burial efficiencies of marine OC and lipid biomarkers in Region 1 and 4 may be underestimated, because of a decrease in marine OC and biomarker concentrations in upper layers due to lateral transport and corresponding overestimates of marine OC and lipid biomarker input flux. It has been suggested that timescales for OC lateral transport within the inner shelf of the ECS are centuries to millennia, and the effects of lateral transport on OC burial are complex and require further consideration (Bao et al., 2019). Although these processes may introduce uncertainties in the calculation of OC proto-burial efficiency, our study still provides valuable insights about marine OC generation and burial in the large areas of the ECMS.
Conclusion
Our study revealed the spatial distributions of marine lipid biomarkers in a large area of the ECMS by simultaneously analyzing summertime surface suspended particles and surface sediments from 334 stations and 258 stations, respectively. Our results showed that marine OC generation was higher in estuaries and upwelling areas, which was mainly controlled by nutrient concentrations, while marine OC deposition and burial mainly occurred in mud areas with less dynamic sedimentary environments. Marine OC contents were calculated using OC δ13C and TMBR, and its proto-burial efficiency ranged from 7 to 19% with large spatial variations. Overall, the proto-burial efficiency was very high in the ECMS, but significant spatial differences were also found. Higher proto-burial efficiency was found in Region 1 which included the BS and the western YS, and in Region 4 which included the area off the CRE and the inner shelf of the ECS. Lower ones were in the northern and central YS (Region 2) and the mid shelf of the ECS (Region 3). Sediment grain size has been found to be a key parameter for OC burial efficiency, thus the mud area within the Bohai Sea (sub-Region 1-1) had the highest proto-burial efficiency (45%) for marine OC, while Region 3 of the mid- to outer ECS shelf with much coarser sediments had the lowest value (7%). The proto-burial efficiency of marine biomarker ΣPB was estimated for the first time in our study, with spatial patterns being similar to that of marine OC in most areas of the ECMS. Our study from the ECMS provides important approaches to interpret sedimentary records and to estimate carbon budgets in marginal sea systems.
Data Availability Statement
The original contributions presented in the study are included in the article/Supplementary Material, further inquiries can be directed to the corresponding authors.
Author Contributions
RB and MZ conceived and designed the study, provided comments on data analysis, and revised the manuscript. YC, XW, XC, JH, YW, and YJ performed the experiments, with assistance from HZ and LX. YC organized and analyzed the database, wrote the original draft, and prepared the tables and figures. All authors contributed to the article and approved the submitted version.
Funding
This research was funded by the National Natural Science Foundation of China (Grant Nos. 41630966 and 41876118), and the Youth Talent Support Program of the Laboratory for Marine Ecology and Environmental Science, the Pilot National Laboratory for Marine Science and Technology (Qingdao) (Grant No. LMEES-YTSP-2018-02-01).
Conflict of Interest
The authors declare that the research was conducted in the absence of any commercial or financial relationships that could be construed as a potential conflict of interest.
Publisher’s Note
All claims expressed in this article are solely those of the authors and do not necessarily represent those of their affiliated organizations, or those of the publisher, the editors and the reviewers. Any product that may be evaluated in this article, or claim that may be made by its manufacturer, is not guaranteed or endorsed by the publisher.
Acknowledgments
We thank Li Li, Guie Jin, Yang Ding, Jiaokai Wang, and Zongshan Zhao for data analysis and technical assistance. We also thank Honghai Zhang for sharing nutrient data in the Yellow Sea and Bohai Sea. We are particularly grateful to Xin Liu for his comments on data analysis and to the three reviewers whose comments greatly improved this article. This is MCTL (Key Laboratory of Marine Chemistry Theory and Technology) contribution #270.
Supplementary Material
The Supplementary Material for this article can be found online at: https://www.frontiersin.org/articles/10.3389/fmars.2022.824181/full#supplementary-material
References
Alldredge, A. L., and Gotschalk, C. C. (1989). Direct observations of the mass flocculation of diatom blooms: characteristics, settling velocities and formation of diatom aggregates. Deep Sea Res. Pt. A 36, 159–171. doi: 10.1016/0198-0149(89)90131-3
Aller, R. C. (2004). Conceptual models of early diagenetic processes: the muddy seafloor as an unsteady, batch reactor. J. Mar. Res. 62, 815–835. doi: 10.1357/0022240042880837
Anderson, D. M., Glibert, P. M., and Burkholder, J. M. (2002). Harmful algal blooms and eutrophication: nutrient sources, composition, and consequences. Estuaries 25, 704–726. doi: 10.1007/BF02804901
Bai, Y., He, X., Pan, D., Chen, C. A., Kang, Y., Chen, X., et al. (2014). Summertime Changjiang River plume variation during 1998-2010. J. Geophys. Res. 119, 6238–6257. doi: 10.1002/2014JC009866
Bao, R., McIntyre, C., Zhao, M., Zhu, C., Kao, S., and Eglinton, T. I. (2016). Widespread dispersal and aging of organic carbon in shallow marginal seas. Geology 44, 791–794. doi: 10.1130/G37948.1
Bao, R., Zhao, M., McNichol, A., Galy, V., McIntyre, C., Haghipour, N., et al. (2019). Temporal constraints on lateral organic matter transport along a coastal mud belt. Org. Geochem. 128, 86–93. doi: 10.1016/j.orggeochem.2019.01.007
Bergamaschi, B. A., Tsamakis, E., Keil, R. G., Eglinton, T. I., Montluçon, D. B., and Hedges, J. I. (1997). The effect of grain size and surface area on organic matter, lignin and carbohydrate concentration, and molecular compositions in Peru Margin sediments. Geochim. Cosmochim. Acta 61, 1247–1260. doi: 10.1016/S0016-7037(96)00394-8
Bi, N., Yang, Z., Wang, H., Fan, D., Sun, X., and Lei, K. (2011). Seasonal variation of suspended-sediment transport through the southern Bohai Strait. Estuar. Coast. Shelf Sci. 93, 239–247. doi: 10.1016/j.ecss.2011.03.007
Bi, R., Chen, X., Zhang, J., Ishizaka, J., Zhuang, Y., Jin, H., et al. (2018). Water mass control on phytoplankton spatiotemporal variations in the northeastern East China Sea and the western Tsushima Strait revealed by lipid biomarkers. J. Geophys. Res. 123, 1318–1332. doi: 10.1002/2017JG004340
Bian, C., Jiang, W., and Greatbatch, R. J. (2013). An exploratory model study of sediment transport sources and deposits in the Bohai Sea, Yellow Sea, and East China Sea. J. Geophys. Res. Oceans 118, 5908–5923. doi: 10.1002/2013JC009116
Bianchi, T. S., and Canuel, E. A. (2011). Chemical Biomarkers In Aquatic Ecosystems. Princeton, NJ: Princeton University Press.
Bianchi, T. S., Rolff, C., Widbom, B., and Elmgren, R. (2002). Phytoplankton pigments in Baltic Sea seston and sediments: seasonal variability, fluxes, and transformations. Estuar. Coast. Shelf Sci. 55, 369–383. doi: 10.1006/ecss.2001.0911
Burdige, D. J. (2005). Burial of terrestrial organic matter in marine sediments: a re-assessment. Glob. Biogeochem. Cycle 19:B4011. doi: 10.1029/2004GB002368
Burdige, D. J. (2007). Preservation of organic matter in marine sediments: controls, mechanisms, and an imbalance in sediment organic carbon budgets? Chem. Rev. 107, 467–485. doi: 10.1021/cr050347q
Cai, D., Shi, X., Zhou, W., Liu, W., Zhang, S., Cao, Y., et al. (2003). Sources and transportation of suspended matter and sediment in the southern Yellow Sea: evidence from stable carbon isotopes. Chinese Sci. Bull. 48, 21–29. doi: 10.1007/BF02900936
Calvo, E., Pelejero, C., Logan, G. A., and De Deckker, P. (2004). Dust-induced changes in phytoplankton composition in the Tasman Sea during the last four glacial cycles. Paleoceanography 19, A2020. doi: 10.1029/2003PA000992
Chen, C., Mao, Z., Tang, F., Han, G., and Jiang, Y. (2017). Declining riverine sediment input impact on spring phytoplankton bloom off the Yangtze River Estuary from 17-year satellite observation. Cont. Shelf Res. 135, 86–91. doi: 10.1016/j.csr.2017.01.012
Chen, C.-T. A. (2003a). Rare northward flow in the Taiwan Strait in winter: a note. Cont. Shelf Res. 23, 387–391. doi: 10.1016/S0278-4343(02)00209-1
Chen, C.-T. A. (2003b). New vs. export production on the continental shelf. Deep Sea Res. Part II Top. Stud. Oceanogr. 50, 1327–1333. doi: 10.1016/S0967-0645(03)00026-2
Chen, C.-T. A. (2008). Distributions of nutrients in the East China Sea and the South China Sea connection. J. Oceanogr. 64, 737–751. doi: 10.1007/s10872-008-0062-9
Chen, C.-T. A. (2009). Chemical and physical fronts in the Bohai, Yellow and East China seas. J. Mar. Syst. 78, 394–410. doi: 10.1016/j.jmarsys.2008.11.016
Chen, C.-T. A., Kandasamy, S., Chang, Y., Bai, Y., He, X., Lu, J., et al. (2017). Geochemical evidence of the indirect pathway of terrestrial particulate material transport to the Okinawa Trough. Quat. Int. 441, 51–61. doi: 10.1016/j.quaint.2016.08.006
Chen, J., and Liu, J. (2015). The spatial and temporal changes of chlorophyll-a and suspended matter in the eastern coastal zones of China during 1997-2013. Cont. Shelf Res. 95, 89–98. doi: 10.1016/j.csr.2015.01.004
Chen, X., Bi, R., Zhang, H., and Zhao, M. (2017). Contrastive analysis of biomarkers in suspended particles in the southern Yellow Sea and East China Sea between the summer of 2013 and 2011. Period. Ocean Univ. China 47, 103–111.
Clarke, K. R., Somerfield, P. J., and Gorley, R. N. (2016). Clustering in non-parametric multivariate analyses. J. Exp. Mar. Biol. Ecol. 483, 147–155. doi: 10.1016/j.jembe.2016.07.010
Cui, X., Bianchi, T. S., Savage, C., and Smith, R. W. (2016). Organic carbon burial in fjords: terrestrial versus marine inputs. Earth Planet. Sci. Lett. 451, 41–50. doi: 10.1016/j.epsl.2016.07.003
Deng, B., Zhang, J., and Wu, Y. (2006). Recent sediment accumulation and carbon burial in the East China Sea. Glob. Biogeochem. Cycle 20:B3014. doi: 10.1029/2005GB002559
DeVries, T. (2014). The oceanic anthropogenic CO2 sink: storage, air-sea fluxes, and transports over the industrial era. Glob. Biogeochem. Cycle 28, 631–647. doi: 10.1002/2013GB004739
Duan, L., Song, J., Yuan, H., Li, X., Li, N., and Peng, Q. (2017). The use of sterols combined with isotope analyses as a tool to identify the origin of organic matter in the East China Sea. Ecol. Indic. 83, 144–157. doi: 10.1016/j.ecolind.2017.07.042
Eglinton, T. I., Benitez-Nelson, B. C., Pearson, A., McNichol, A. P., Bauer, J. E., and Druffel, E. R. M. (1997). Variability in radiocarbon ages of individual organic compounds from marine sediments. Science 277, 796–799. doi: 10.1126/science.277.5327.796
Eppley, R. W., and Peterson, B. J. (1979). Particulate organic matter flux and planktonic new production in the deep ocean. Nature 282, 677–680. doi: 10.1038/282677a0
Fan, Y., Lan, J., Li, H., Cao, Y., Zhao, Z., Wang, J., et al. (2014a). Use of lipid biomarkers for identification of regional sources and dechlorination characteristics of polychlorinated biphenyls in the East China Sea. Sci. Total Environ. 490, 766–775. doi: 10.1016/j.scitotenv.2014.05.054
Fan, Y., Lan, J., Li, H., Li, G., Cao, Y., Zhao, Z., et al. (2014b). Spatial distributions of methoxylated and hydroxylated polybrominated diphenyl ethers in the East China Sea-A seaward increasing trend. Chemosphere 114, 247–254. doi: 10.1016/j.chemosphere.2014.04.103
Fan, Y., Lan, J., Wang, J., Zhao, Z., Zhao, M., and Jiang, G. (2015). Methoxylated and hydroxylated polybrominated diphenyl ethers in surface sediments from the southern Yellow Sea: spatial distribution and potential producers. Environ. Chem. 12:366. doi: 10.1071/EN14243
Fang, Y., Chen, Y., Tian, C., Lin, T., Hu, L., Huang, G., et al. (2015). Flux and budget of BC in the continental shelf seas adjacent to Chinese high BC emission source regions. Glob. Biogeochem. Cycle 29, 957–972. doi: 10.1002/2014GB004985
Faust, J. C., and Knies, J. (2019). Organic matter sources in North Atlantic fjord sediments. Geochem. Geophy. Geosyst. 20, 2872–2885. doi: 10.1029/2019GC008382
Gong, G., Wen, Y., Wang, B., and Liu, G. (2003). Seasonal variation of chlorophyll a concentration, primary production and environmental conditions in the subtropical East China Sea. Deep Sea Res. Pt. II 50, 1219–1236. doi: 10.1016/S0967-0645(03)00019-5
Gruber, N., Clement, D., Carter, B. R., Feely, R. A., van Heuven, S., Hoppema, M., et al. (2019). The oceanic sink for anthropogenic CO2 from 1994 to 2007. Science 363, 1193–1199. doi: 10.1126/science.aau5153
Guan, B., and Fang, G. (2006). Winter counter-wind currents off the southeastern China coast: a review. J. Oceanogr. 62, 1–24. doi: 10.1007/s10872-006-0028-8
Guerra, R., Righi, S., and Garcia-Luque, E. (2015). Modern accumulation rates and sources of organic carbon in the NE Gulf of Cádiz (SW Iberian Peninsula). J. Radioanal. Nucl. Chem. 305, 429–437. doi: 10.1007/s10967-015-3991-y
Guo, S., Feng, Y., Wang, L., Dai, M., Liu, Z., Bai, Y., et al. (2014). Seasonal variation in the phytoplankton community of a continental-shelf sea: the East China Sea. Mar. Ecol. Prog. Ser. 516, 103–126. doi: 10.3354/meps10952
Guo, S., Sun, J., Zhao, Q., Feng, Y., Huang, D., and Liu, S. (2016). Sinking rates of phytoplankton in the Changjiang (Yangtze River) estuary: a comparative study between Prorocentrum dentatum and Skeletonema dorhnii bloom. J. Mar. Syst. 154, 5–14. doi: 10.1016/j.jmarsys.2015.07.003
Guo, Z., Li, J., Feng, J., Fang, M., and Yang, Z. (2006). Compound-specific carbon isotope compositions of individual long-chain n-alkanes in severe Asian dust episodes in the North China coast in 2002. Chinese Sci. Bull. 51, 2133–2140. doi: 10.1007/s11434-006-2071-7
He, Q., Bertness, M. D., Bruno, J. F., Li, B., Chen, G., Coverdale, T. C., et al. (2015). Economic development and coastal ecosystem change in China. Sci. Rep. 4:5995. doi: 10.1038/srep05995
Hedges, J. I., and Keil, R. G. (1995). Sedimentary organic matter preservation: an assessment and speculative synthesis. Mar. Chem. 49, 81–115. doi: 10.1016/0304-4203(95)00008-F
Hernandez, M. T., Mills, R. A., and Pancost, R. D. (2008). Algal biomarkers in surface waters around the Crozet plateau. Org. Geochem. 39, 1051–1057. doi: 10.1016/j.orggeochem.2008.04.015
Hinrichs, K. U., Schneider, R. R., Müller, P. J., and Rullkötter, J. (1999). A biomarker perspective on paleoproductivity variations in two Late Quaternary sediment sections from the Southeast Atlantic Ocean. Org. Geochem. 30, 341–366. doi: 10.1016/S0146-6380(99)00007-8
Hu, J., Zhang, H., Li, L., Wang, Y., and Zhao, M. (2016). Seasonal changes of organic matter origins and anammox activity in the Changjiang Estuary deduced from multi-biomarkers in suspended particulates. Sci. China Earth Sci. 59, 1339–1352. doi: 10.1007/s11430-016-5286-8
Hu, L., Shi, X., Bai, Y., Qiao, S., Li, L., Yu, Y., et al. (2016). Recent organic carbon sequestration in the shelf sediments of the Bohai Sea and Yellow Sea, China. J. Marine Syst. 155, 50–58. doi: 10.1016/j.jmarsys.2015.10.018
Hu, L., Shi, X., Guo, Z., Wang, H., and Yang, Z. (2013). Sources, dispersal and preservation of sedimentary organic matter in the Yellow Sea: the importance of depositional hydrodynamic forcing. Mar. Geol. 335, 52–63. doi: 10.1016/j.margeo.2012.10.008
Inthorn, M., Wagner, T., Scheeder, G., and Zabel, M. (2006). Lateral transport controls distribution, quality, and burial of organic matter along continental slopes in high-productivity areas. Geology 34, 205–208. doi: 10.1130/G22153.1
Jeng, W., and Huh, C. (2004). Lipids in suspended matter and sediments from the East China Sea Shelf. Org. Geochem. 35, 647–660. doi: 10.1016/j.orggeochem.2003.12.002
Jiang, Y., Lei, X., Zhang, P., Zhang, H., and Zhao, M. (2012). Comparisons of lipid biomarkers from suspended particulates and sediments in the Changjiang Estuary and the East China Sea shelf. J. Earth Environ. 3, 982–994. doi: 10.7515/JEE201204008
Jiang, Z., Chen, J., Gao, Y., Zhai, H., Jin, H., Zhou, F., et al. (2019a). Regulation of spatial changes in phytoplankton community by water column stability and nutrients in the Southern Yellow Sea. J. Geophys. Res. 124, 2610–2627. doi: 10.1029/2018JG004785
Jiang, Z., Chen, J., Zhai, H., Zhou, F., Yan, X., Zhu, Y., et al. (2019b). Kuroshio shape composition and distribution of filamentous diazotrophs in the East China Sea and Southern Yellow Sea. J. Geophys. Res 124, 7421–7436. doi: 10.1029/2019JC015413
Jiang, Z., Chen, J., Zhou, F., Shou, L., Chen, Q., Tao, B., et al. (2015). Controlling factors of summer phytoplankton community in the Changjiang (Yangtze River) Estuary and adjacent East China Sea shelf. Cont. Shelf Res. 101, 71–84. doi: 10.1016/j.csr.2015.04.009
Karlsson, E. S., Charkin, A., Dudarev, O., Semiletov, I., Vonk, J. E., Sánchez-García, L., et al. (2011). Carbon isotopes and lipid biomarker investigation of sources, transport and degradation of terrestrial organic matter in the Buor-Khaya Bay SE Laptev Sea. Biogeoscience 8, 1865–1879. doi: 10.5194/bg-8-1865-2011
Keil, R. (2017). Anthropogenic forcing of carbonate and organic carbon preservation in marine sediments. Annu. Rev. Mar. Sci. 9, 151–172. doi: 10.1146/annurev-marine-010816-060724
Le Guitton, M., Soetaert, K., Sinninghe Damsté, J. S., and Middelburg, J. J. (2015). Biogeochemical consequences of vertical and lateral transport of particulate organic matter in the southern North Sea: a multiproxy approach. Estuar. Coast. Shelf Sci. 165, 117–127. doi: 10.1016/j.ecss.2015.09.010
Li, F., and Shi, Y. (1995). Accumulation rates of sediment and sedimentary environment in the south Bohai Sea. J. Oceanogr. Huanghai Bohai Seas 13, 33–37.
Li, G., Qiao, L., Dong, P., Ma, Y., Xu, J., Liu, S., et al. (2016). Hydrodynamic condition and suspended sediment diffusion in the Yellow Sea and East China Sea. J. Geophys. Res. Oceans 121, 6204–6222. doi: 10.1002/2015JC011442
Li, H., Tang, H., Shi, X., Zhang, C., and Wang, X. (2014). Increased nutrient loads from the Changjiang (Yangtze) river have led to increased harmful algal blooms. Harmful Algae 39, 92–101. doi: 10.1016/j.hal.2014.07.002
Li, W., Wang, Z., and Huang, H. (2019). Relationship between the southern Yellow Sea Cold Water Mass and the distribution and composition of suspended particulate matter in summer and autumn seasons. J. Sea Res. 154, 101812. doi: 10.1016/j.seares.2019.101812
Li, X. (2017). The Study Of Phytoplankton Sinking Rate In The Yellow Sea And Bohai Sea. Ph.D. thesis. Tianjin: Tianjin University of Science and Technology.
Li, Z. (2018). Phytoplankton Community And Its Related Carbon Sinking In The Changjiang (Yangtze River) Estuary And Adjacent Waters. Ph.D. thesis. Beijing: University of Chinese Academy of Sciences.
Lian, E., Yang, S., Wu, H., Yang, C., Li, C., and Liu, J. T. (2016). Kuroshio subsurface water feeds the wintertime Taiwan Warm Current on the inner East China Sea shelf. J. Geophys. Res. 121, 4790–4803. doi: 10.1002/2016JC011869
Lin, S., Hsieh, I., Huang, K., and Wang, C. (2002). Influence of the Yangtze River and grain size on the spatial variations of heavy metals and organic carbon in the East China Sea continental shelf sediments. Chem. Geol. 182, 377–394. doi: 10.1016/S0009-2541(01)00331-X
Lin, S., Huang, K., and Chen, S. (2000). Organic carbon deposition and its control on iron sulfide formation of the southern East China Sea continental shelf sediments. Cont. Shelf Res. 20, 619–635. doi: 10.1016/S0278-4343(99)00088-6
Lin, Y. C., Chung, C. C., Gong, G. C., and Chiang, K. P. (2014). Diversity and abundance of haptophytes in the East China Sea. Aquat. Microb. Ecol. 72, 227–240. doi: 10.3354/ame01697
Liu, D., Li, X., Emeis, K., Wang, Y., and Richard, P. (2015). Distribution and sources of organic matter in surface sediments of Bohai Sea near the Yellow River Estuary, China. Estuar. Coast. Shelf Sci. 165, 128–136. doi: 10.1016/j.ecss.2015.09.007
Liu, J. P., Xu, K. H., Li, A. C., Milliman, J. D., Velozzi, D. M., Xiao, S. B., et al. (2007). Flux and fate of Yangtze River sediment delivered to the East China Sea. Geomorphology 85, 208–224. doi: 10.1016/j.geomorph.2006.03.023
Liu, X., Tang, D., and Ge, C. (2020). Distribution and sources of organic carbon, nitrogen and their isotopic composition in surface sediments from the southern Yellow Sea, China. Mar. Pollut. Bull. 15:110716. doi: 10.1016/j.marpolbul.2019.110716
Liu, X., Xiao, W., Landry, M. R., Chiang, K., Wang, L., and Huang, B. (2016). Responses of phytoplankton communities to environmental variability in the East China Sea. Ecosystems 19, 832–849. doi: 10.1007/s10021-016-9970-5
Lopes, C., Kucera, M., and Mix, A. C. (2015). Climate change decouples oceanic primary and export productivity and organic carbon burial. Proc. Natl. Acad. Sci. U.S.A. 112, 332–335. doi: 10.1073/pnas.1410480111
Luan, Q., Kang, Y., and Wang, J. (2018). Long-term changes on phytoplankton community in the Bohai Sea (1959~2015). Prog. Fish. Sci. 39, 9–18.
Margalef, R. (1978). Life-forms of phytoplankton as survival alternatives in an unstable environment. Oceanol. Acta 1, 493–509. doi: 10.1016/0302-184X(78)90008-2
Muller-Karger, F. E., Varela, R., Thunell, R., Luerssen, R., Hu, C., and Walsh, J. J. (2005). The importance of continental margins in the global carbon cycle. Geophys. Res. Lett. 32:L01602. doi: 10.1029/2004GL021346
Qiao, S., Shi, X., Wang, G., Zhou, L., Hu, B., Hu, L., et al. (2017). Sediment accumulation and budget in the Bohai Sea, Yellow Sea and East China Sea. Mar. Geol. 390, 270–281. doi: 10.1016/j.margeo.2017.06.004
Rhodes, L. L., Peake, B. M., Mackenzie, A. L., and Marwick, S. (1995). Coccolithophores Gephyrocapsa oceanica and Emiliania huxleyi (Prymnesiophyceae = Haptophyceae) in New Zealand’s coastal waters: characteristics of blooms and growth in laboratory culture. New Zeal. J. Mar. Freshw. 29, 345–357. doi: 10.1080/00288330.1995.9516669
Sawada, K., Handa, Y., Shiraiwa, Y., Danbara, A., and Montani, S. (1996). Long-chain alkenones and alkyl alkenoates in the coastal and pelagic sediments of the northwest North Pacific, with special reference to the reconstruction of Emiliania huxleyi and Gephyrocapsa oceanica ratios. Org. Geochem. 24, 751–764. doi: 10.1016/S0146-6380(96)00087-3
Schubert, C. J., Villanueva, J., Calvert, S. E., Cowie, G. L., Rad, U. V., Schulz, H., et al. (1998). Stable phytoplankton community structure in the Arabian Sea over the past 200,000 years. Nature 394, 563–566. doi: 10.1038/29047
Schulte, S., and Bard, E. (2003). Past changes in biologically mediated dissolution of calcite above the chemical lysocline recorded in Indian Ocean sediments. Quat. Sci. Rev. 22, 1757–1770. doi: 10.1016/S0277-3791(03)00172-0
Smith, R. W., Bianchi, T. S., Allison, M., Savage, C., and Galy, V. (2015). High rates of organic carbon burial in fjord sediments globally. Nat. Geosci. 8, 450–453. doi: 10.1038/ngeo2421
Song, J., Xu, Y., and Hu, W. (2008a). Biogeochemistry Of Carbon In China Seas And Lakes. Beijing: Science Press.
Song, J., Li, X., Yuan, M., Zheng, G., and Yang, Y. (2008b). Carbon fixed by phytoplankton and cultured algae in China coastal seas. Acta Ecol. Sin. 28, 551–558.
Sun, J., Feng, Y., Wang, D., Song, S., Jiang, Y., Ding, C., et al. (2013). Bottom-up control of phytoplankton growth in spring blooms in Central Yellow Sea, China. Deep Sea Res. Pt. II 97, 61–71. doi: 10.1016/j.dsr2.2013.05.006
Sun, J., Yu, Z., Gao, Y., Zhou, Q., Zhen, Y., Chen, H., et al. (2010). Phytoplankton diversity in the East China Sea and Yellow Sea measured by PCR-DGGE and its relationships with environmental factors. Chinese J. Oceanol. Limnol. 28, 315–322. doi: 10.1007/s00343-010-9285-x
Tang, Q., Jin, X., Wang, J., Zhuang, Z., Cui, Y., and Meng, T. (2003). Decadal-scale variations of ecosystem productivity and control mechanisms in the Bohai Sea. Fish. Oceanogr. 12, 223–233. doi: 10.1046/j.1365-2419.2003.00251.x
Tao, K., Xu, Y., Wang, Y., Wang, Y., and He, D. (2021). Source, sink and preservation of organic matter from a machine learning approach of polar lipid tracers in sediments and soils from the Yellow River and Bohai Sea, eastern China. Chem. Geol. 582:120441. doi: 10.1016/j.chemgeo.2021.120441
Tao, S., Eglinton, T. I., Montluçon, D. B., McIntyre, C., and Zhao, M. (2016). Diverse origins and pre-depositional histories of organic matter in contemporary Chinese marginal sea sediments. Geochim. Cosmochim. Acta 191, 70–88. doi: 10.1016/j.gca.2016.07.019
Tao, S., Xing, L., Luo, X., Wei, H., Liu, Y., and Zhao, M. (2012). Alkenone distribution in surface sediments of the southern Yellow Sea and implications for the the thermometer. Geo Mar. Lett. 32, 61–71. doi: 10.1007/s00367-011-0251-1
Tian, Y., Xue, C., Liu, C., Yang, G., Li, P., Feng, W., et al. (2019). Nitric oxide (NO) in the Bohai Sea and the Yellow Sea. Biogeosciences 16, 4485–4496. doi: 10.5194/bg-16-4485-2019
Wang, J., Yao, P., Bianchi, T. S., Li, D., Zhao, B., Cui, X., et al. (2015). The effect of particle density on the sources, distribution, and degradation of sedimentary organic carbon in the Changjiang Estuary and adjacent shelf. Chem. Geol. 402, 52–67. doi: 10.1016/j.chemgeo.2015.02.040
Wang, L., Zhang, C., and Shi, X. (2015). The burial of biogenic silica, organic carbon and organic nitrogen in the sediments of the East China Sea. J. Ocean Univ. China 14, 464–470. doi: 10.1007/s11802-015-2522-3
Wang, P., Clemens, S., Beaufort, L., Braconnot, P., Ganssen, G., Jian, Z., et al. (2005). Evolution and variability of the Asian monsoon system: state of the art and outstanding issues. Quat. Sci. Rev. 24, 595–629. doi: 10.1016/j.quascirev.2004.10.002
Wang, Y., Li, D., Sachs, J. P., Hu, J., Cao, Y., Li, L., et al. (2019). Vertical distribution of isoprenoid GDGTs in suspended particles from the East China Sea shelf and implications for sedimentary records. Org. Geochem. 136:103895. doi: 10.1016/j.orggeochem.2019.07.004
Wei, H., Sun, J., Moll, A., and Zhao, L. (2004). Phytoplankton dynamics in the Bohai Sea-observations and modelling. J. Mar. Syst. 44, 233–251. doi: 10.1016/j.jmarsys.2003.09.012
Wei, Q., Wang, B., Chen, J., Xia, C., Qu, D., and Xie, L. (2015). Recognition on the forming-vanishing process and underlying mechanisms of the hypoxia off the Yangtze River estuary. Sci. China Earth Sci. 58, 628–648. doi: 10.1007/s11430-014-5007-0
Wei, Y., Liu, H., Zhang, X., Xue, B., Munir, S., and Sun, J. (2017). Physicochemical conditions in affecting the distribution of spring phytoplankton community. Chinese J. Oceanol. Limnol. 35, 1342–1361. doi: 10.1007/s00343-017-6190-6
Weijers, J. W. H., Schouten, S., Schefuß, E., Schneider, R. R., and Sinninghe Damsté, J. S. (2009). Disentangling marine, soil and plant organic carbon contributions to continental margin sediments: a multi-proxy approach in a 20,000 year sediment record from the Congo deep-sea fan. Geochim. Cosmochim. Acta 73, 119–132. doi: 10.1016/j.gca.2008.10.016
Włodarska-Kowalczuk, M., Mazurkiewicz, M., Górska, B., Michel, L. N., Jankowska, E., and Zaborska, A. (2019). Organic carbon origin, benthic faunal consumption, and burial in sediments of northern atlantic and arctic fjords (60–81°N). J. Geophys. Res. Biogeosci. 124, 3737–3751. doi: 10.1029/2019JG005140
Wu, P., Bi, R., Duan, S., Jin, H., Chen, J., Hao, Q., et al. (2016). Spatiotemporal variations of phytoplankton in the East China Sea and the Yellow Sea revealed by lipid biomarkers. J. Geophys. Res. 121, 109–125. doi: 10.1002/2015JG003167
Wu, X., Wu, B., Jiang, M., Chang, F., Nan, Q., Yu, X., et al. (2020). Distribution, sources and burial flux of sedimentary organic matter in the East China Sea. J. Oceanol. Limnol. 38, 1488–1501. doi: 10.1007/s00343-020-0037-2
Wu, Y., Zhang, J., Liu, S., Zhang, Z., Yao, Q., Hong, G., et al. (2007). Sources and distribution of carbon within the Yangtze River system. Estuar. Coast. Shelf Sci. 71, 13–25. doi: 10.1016/j.ecss.2006.08.016
Xin, M., Wang, B., Xie, L., Sun, X., Wei, Q., Liang, S., et al. (2019). Long-term changes in nutrient regimes and their ecological effects in the Bohai Sea, China. Mar. Pollut. Bull. 146, 562–573. doi: 10.1016/j.marpolbul.2019.07.011
Xing, L., Sachs, J. P., Gao, W., Tao, S., Zhao, X., Li, L., et al. (2015). TEX86 paleothermometer as an indication of bottom water temperature in the Yellow Sea. Org. Geochem. 86, 19–31. doi: 10.1016/j.orggeochem.2015.05.007
Xing, L., Zhang, H., Yuan, Z., Sun, Y., and Zhao, M. (2011). Terrestrial and marine biomarker estimates of organic matter sources and distributions in surface sediments from the East China Sea shelf. Cont. Shelf Res. 31, 1106–1115. doi: 10.1016/j.csr.2011.04.003
Xing, L., Zhao, M., Gao, W., Wang, F., Zhang, H., Li, L., et al. (2014). Multiple proxy estimates of source and spatial variation in organic matter in surface sediments from the southern Yellow Sea. Org. Geochem. 76, 72–81. doi: 10.1016/j.orggeochem.2014.07.005
Xing, L., Hou, D., Wang, X., Li, L., and Zhao, M. (2016a). Assessment of the sources of sedimentary organic matter in the Bohai Sea and the northern Yellow Sea using biomarker proxies. Estuar. Coast. Shelf Sci. 176, 67–75. doi: 10.1016/j.ecss.2016.04.009
Xing, L., Zhao, M., Zhang, T., Yu, M., Duan, S., Zhang, R., et al. (2016b). Ecosystem responses to anthropogenic and natural forcing over the last 100 years in the coastal areas of the East China Sea. Holocene 26, 669–677. doi: 10.1177/0959683615618248
Xu, L., Yang, D., Greenwood, J., Feng, X., Gao, G., Qi, J., et al. (2020). Riverine and oceanic nutrients govern different algal bloom domain near the Changjiang Estuary in summer. J. Geophys. Res. 125, e2020J–e5727J. doi: 10.1029/2020JG005727
Xu, Y. (2012). Study On The Differences And Geneses Of Geotechnical Properties Of Cohesive Soil In Typical Offshore Areas Of China. Ph.D. thesis. Shandong: Ocean University of China.
Yang, J., Yang, G., Zhang, H., and Zhang, S. (2015). Spatial distribution of dimethylsulfide and dimethylsulfoniopropionate in the Yellow Sea and Bohai Sea during summer. Chinese J. Oceanol. Limnol. 33, 1020–1038. doi: 10.1007/s00343-015-4188-5
Yang, T., Wei, K., Chen, M., Ji, S., Gong, G., Lin, F., et al. (2004). Summer and winter distribution and malformation of coccolithophores in the East China Sea. Micropaleontology 50, 157–170. doi: 10.2113/50.Suppl_1.157
Yang, Z. S., and Liu, J. P. (2007). A unique Yellow River-derived distal subaqueous delta in the Yellow Sea. Mar. Geol. 240, 169–176. doi: 10.1016/j.margeo.2007.02.008
Yoon, S., Kim, J., Yi, H., Yamamoto, M., Gal, J., Kang, S., et al. (2016). Source, composition and reactivity of sedimentary organic carbon in the river-dominated marginal seas: a study of the eastern Yellow Sea (the northwestern Pacific). Cont. Shelf Res. 125, 114–126. doi: 10.1016/j.csr.2016.07.010
Yu, M., Zhang, H., Li, L., and Zhao, M. (2018). Spatial distributions and potential sources of long chain (C30, C32 1,15-) alkyl diols in surface sediments from eastern China marginal seas. J. Ocean Univ. China 17, 1114–1122. doi: 10.1007/s11802-018-3686-4
Zhang, H., Qiu, Z., Sun, D., Wang, S., and He, Y. (2017). Seasonal and interannual variability of satellite-derived Chlorophyll-a (2000-2012) in the Bohai Sea, China. Remote Sens. Basel 9:582. doi: 10.3390/rs9060582
Zhang, H., Xing, L., Zhao, M., Sun, Y., and Tang, Q. (2008). Distribution of biomarkers in surface sediments of the East China and Yellow Seas and its potential for paleoecology reconstruction. Period. Ocean Univ. China 38, 992–996. doi: 10.16441/j.cnki.hdxb.2008.06.024
Zhang, J., Wu, Y., Jennerjahn, T. C., Ittekkot, V., and He, Q. (2007). Distribution of organic matter in the Changjiang (Yangtze River) Estuary and their stable carbon and nitrogen isotopic ratios: implications for source discrimination and sedimentary dynamics. Mar. Chem. 106, 111–126. doi: 10.1016/j.marchem.2007.02.003
Zhang, Y., Zhao, M., Cui, Q., Fan, W., Qi, J., Chen, Y., et al. (2017). Processes of coastal ecosystem carbon sequestration and approaches for increasing carbon sink. Sci. China Earth Sci. 60, 809–820. doi: 10.1007/s11430-016-9010-9
Zhao, B., Yao, P., Bianchi, T. S., and Yu, Z. (2021). Controls on organic carbon burial in the Eastern China Marginal Seas: a regional synthesis. Glob. Biogeochem. Cycle 35:e06608. doi: 10.1029/2020GB006608
Zhao, M., Ding, Y., and Yu, M. (2017). Sources of sedimentary organic matter in China marginal sea surface sediments and implications of carbon sink. Period. Ocean Univ. China 47, 70–76. doi: 10.16441/j.cnki.hdxb.20170003
Zhao, M., Mercer, J. L., Eglinton, G., Higginson, M. J., and Huang, C. (2006). Comparative molecular biomarker assessment of phytoplankton paleoproductivity for the last 160kyr off Cap Blanc, NW Africa. Org. Geochem. 37, 72–97. doi: 10.1016/j.orggeochem.2005.08.022
Zhao, M., Zhang, Y., Xing, L., Liu, Y., Tao, S., and Zhang, H. (2011). The composition and distribution of n-alkanes in surface sediments from the South Yellow Sea and their potential as organic matter source indicators. Period. Ocean Univ. China 41, 90–96.
Zhao, Y., Li, F., DeMaster, D. J., Nittrouer, C. A., and Milliman, J. D. (1991). Preliminary studies on sedimentation rate and sediment flux of the south Huanghai Sea. Oceanol. Limnol. Sin. 22, 38–43.
Zhao, Z., Li, H., Wang, Y., Li, G., Cao, Y., Zeng, L., et al. (2013). Source and migration of short-chain chlorinated paraffins in the coastal East China Sea using multiproxies of marine organic geochemistry. Environ. Sci. Technol. 47, 5013–5022. doi: 10.1021/es304899j
Zhu, Y., and Chang, R. (2000). Preliminary study of the dynamic origin of the distribution pattern of bottom sediments on the continental shelves of the Bohai Sea, Yellow Sea and East China Sea. Estuar. Coast. Shelf Sci. 51, 663–680. doi: 10.1006/ecss.2000.0696
Keywords: biomarkers, sterol, alkenones, marginal seas, surface water, surface sediments, proto-burial efficiency
Citation: Cao Y, Bi R, Wang X, Chen X, Hu J, Wang Y, Jiang Y, Zhang H, Xing L and Zhao M (2022) The Sources and Burial of Marine Organic Carbon in the Eastern China Marginal Seas. Front. Mar. Sci. 9:824181. doi: 10.3389/fmars.2022.824181
Received: 29 November 2021; Accepted: 03 January 2022;
Published: 26 January 2022.
Edited by:
Ying Wu, East China Normal University, ChinaReviewed by:
Chen-tung Arthur Chen, National Sun Yat-sen University, TaiwanLiyang Yang, Fuzhou University, China
Kui Wang, Zhejiang University, China
Copyright © 2022 Cao, Bi, Wang, Chen, Hu, Wang, Jiang, Zhang, Xing and Zhao. This is an open-access article distributed under the terms of the Creative Commons Attribution License (CC BY). The use, distribution or reproduction in other forums is permitted, provided the original author(s) and the copyright owner(s) are credited and that the original publication in this journal is cited, in accordance with accepted academic practice. No use, distribution or reproduction is permitted which does not comply with these terms.
*Correspondence: Rong Bi, cm9uZ2JpQG91Yy5lZHUuY24=; Meixun Zhao, bWF4emhhb0BvdWMuZWR1LmNu, bWF4emhhbzA0QHlhaG9vLmNvbQ==