- 1Dept. of Meteorology, University of Reading, Reading, United Kingdom
- 2National Centre for Earth Observation (NCEO), University of Reading, Reading, United Kingdom
It has been suggested that freshwater transports by the Atlantic Meridional Overturning Circulation (AMOC) in the South Atlantic may be a useful metric for determining the stability of the AMOC because it can lead to feedbacks onto North Atlantic salinities and hence deep water formation. In this manuscript we investigate feedbacks between South Atlantic Freshwater transports, Freshwater content and AMOC transport contributions across different Atlantic latitudes, and at different timescales in centennial runs of 10 CMIP5 climate models, with both northward and southward AMOC freshwater transports in the South Atlantic. In all models, salinity variations are more important than AMOC variations in determining South Atlantic freshwater transports, especially on longer timescales >10 years. Only in the North Atlantic do AMOC variations become important in changing the meridional freshwater transports, which might then lead to feedbacks with stability implications. Closed budgets of Freshwater content show that South Atlantic transports only influence local freshwater budgets (within ∼10° latitude) and that variations in horizontal transports by the South Atlantic gyre always dominate the overturning transports in all models and timescales. These results suggest that South Atlantic freshwater transports by the AMOC is highly unlikely to be a useful metric in determining AMOC stability as meridional freshwater transports are much less meridionally coherent than the AMOC circulation itself in all 10 CMIP5 models studied.
Introduction
The salt-advection feedback mechanism has been suggested as a mechanism potentially leading to instability in the Atlantic Meridional Overturning Circulation (AMOC), based on ideas from box models (Stommel, 1961; Rahmstorf, 1996; De Vries and Weber, 2005). In particular, this feedback has been used to argue that the AMOCs contribution in transporting freshwater into or out of the South Atlantic basin at 34°S may be critical to AMOC stability and the existence of multiple AMOC states for a given surface freshwater forcing (i.e., bistability regime). If the AMOC exports freshwater then a weakening AMOC may lead to the whole Atlantic becoming fresher, which may then reduce deep water formation leading to further AMOC weakening, and potentially to a collapse. Recovery from such a collapsed state would require large freshwater perturbations to pull the system into a regime where a strong AMOC becomes the only possible state.
With this in mind, freshwater transport by the overturning has been assessed at the southern boundary, 34°S, in the Atlantic, leading to a focus on “Fov34S” as an important metric of potential instability (Drijfhout et al., 2011; Hawkins et al., 2011). The Fov34S from observations is known to be slightly negative, appearing to support the possibility of AMOC instability. Many climate models have a bias in Fov34S, exhibiting a positive value, i.e., a freshwater transport into the Atlantic by the AMOC. It has been suggested that these models do not possess a bistable regime and are more stable to AMOC collapse than the real climate system. However, Mignac et al. (2019) argue that the observed Fov34S is, most importantly, very small so that changes in the AMOC circulation have a negligible effect on freshwater transport into and out of the Atlantic basin from the south. Dijkstra (2007) did extend the freshwater feedback stability argument to emphasize freshwater convergence, thus including AMOC transports from the Arctic into the North Atlantic, but without explicitly discounting possible influence of the southern boundary transports.
Stability studies of the AMOC in climate models have usually been addressed by introducing large freshwater anomalies (Hosing experiments) into the North Atlantic (e.g., Huisman et al., 2010; Jackson, 2013; Mecking et al., 2016). Some hosing experiments in coarse ocean-only and intermediate-complexity coupled models with negative Fov34S, do seem to sustain a collapsed AMOC state associated with a bistable regime for longer periods, and have a slower recovery than models with positive Fov34S (e.g., Rahmstorf et al., 2005). However, similar hosing experiments in more complex climate models, including eddy-permitting ocean components are less clear, revealing diverse AMOC behaviour, ranging from no evidence of an AMOC shutdown (e.g., Stouffer et al., 2006) to a situation where a collapsed AMOC was maintained for 450 years (e.g., Mecking et al., 2016). However, the sensitivity of hosing experiments to forcing timescales (Kim et al., 2021) and the strong non-linearities involved (Gent, 2018), including atmospheric feedbacks, make it difficult to study the roles of current velocity and salinity variability. Indeed, crucially, the salt-advection feedback assumes that variability in Fov34S is determined by variability of the AMOC rather than variability in the salinity distribution, i.e., (Rahmstorf, 1996). It also relies on the assumption that changes in the freshwater transport to northern water formation latitudes by other dynamics, such as the gyres or mesoscale eddies, are negligible, and these aspects cannot remain unaffected by large perturbations such as hosing.
To avoid these problems Cheng et al. (2018) instead studied the natural AMOC variability in long runs of 2 climate models and assessed the covariability between the AMOC and meridional freshwater transports throughout in the Atlantic basin. Although they found evidence for high latitude Atlantic density variability controlling AMOC strength, they found no evidence that the AMOC strength was leading to density variability through salinity transports from the South Atlantic. However, the 2 climate models used by Cheng et al. (2018), GFDL-ESM2M and CESM1, both had Fov34S > 0 and therefore would not have been expected to exhibit any positive feedback between the AMOC and the southern freshwater transports.
Following the work of Cheng et al. (2018), we here look at the internal variability of 10 multi-centennial CMIP5 simulations, covering both positive and negative Fov34S models. We seek evidence to clarify the following points: Is the southern Fov variability dominated by changes in the local circulation or in the salinities? What is the influence of southern transport by the overturning, Fov, and by the gyre, Fgyre, in contributing to freshwater content (FWC) changes and the AMOC changes throughout the Atlantic basin? In particular, how far north can Fov34S correlations be detected during internal variability?
The manuscript is organised as follows. The CMIP5 models and their main configurations are presented in Section “CMIP5 Models and Diagnostics,” along with the mathematical framework used for the investigation of the salt-advection feedback mechanisms. To set the stage, Section “CMIP5 Mean Freshwater transports in South Atlantic” evaluates the mean state of the selected CMIP5 models, particularly focusing on the sensitivity of their mean Fov to the vertical salinity distributions. Section “Time-Varying Freshwater Transports” evaluates the Fov temporal components, by calculating the contributions of meridional velocity and salinity variations to Fov anomalies on a range of timescales and across different latitudes. Freshwater budgets are calculated in Section “Atlantic Freshwater Content” to identify the main drivers of FWC changes throughout the Atlantic, from interannual to multidecadal timescales. Finally, Section “Discussion and Conclusion” discusses the findings of this work and summarises the conclusions.
CMIP5 Models and Diagnostics
Models
We have selected 10 CMIP5 pre-industrial control simulations conducted by different institutions and with distinct ocean and atmospheric models (see Table 1). These have greenhouse gas emissions, volcanic and anthropogenic aerosols, as well as radiative forcing held constant at pre-industrial levels, therefore removing any influence of external climate forcing variations. The length of these runs ranges from 300 years in IPSL-MR to 1000 years in IPSL-LR. Further CMIP5 details can be found in Taylor et al. (2012), and individual model details can be found in the references given. Models belonging to the same institution in Table 1 differ in the horizontal resolution employed, e.g., CMCC-CM has a much higher atmospheric resolution of 0.8° when compared to 3.7° for CMCC-CMS. All the ocean models employ z-level vertical coordinates, except for GFDL-ESM2G which has isopycnal coordinates, but its data are stored on z-levels in the CMIP5 database.
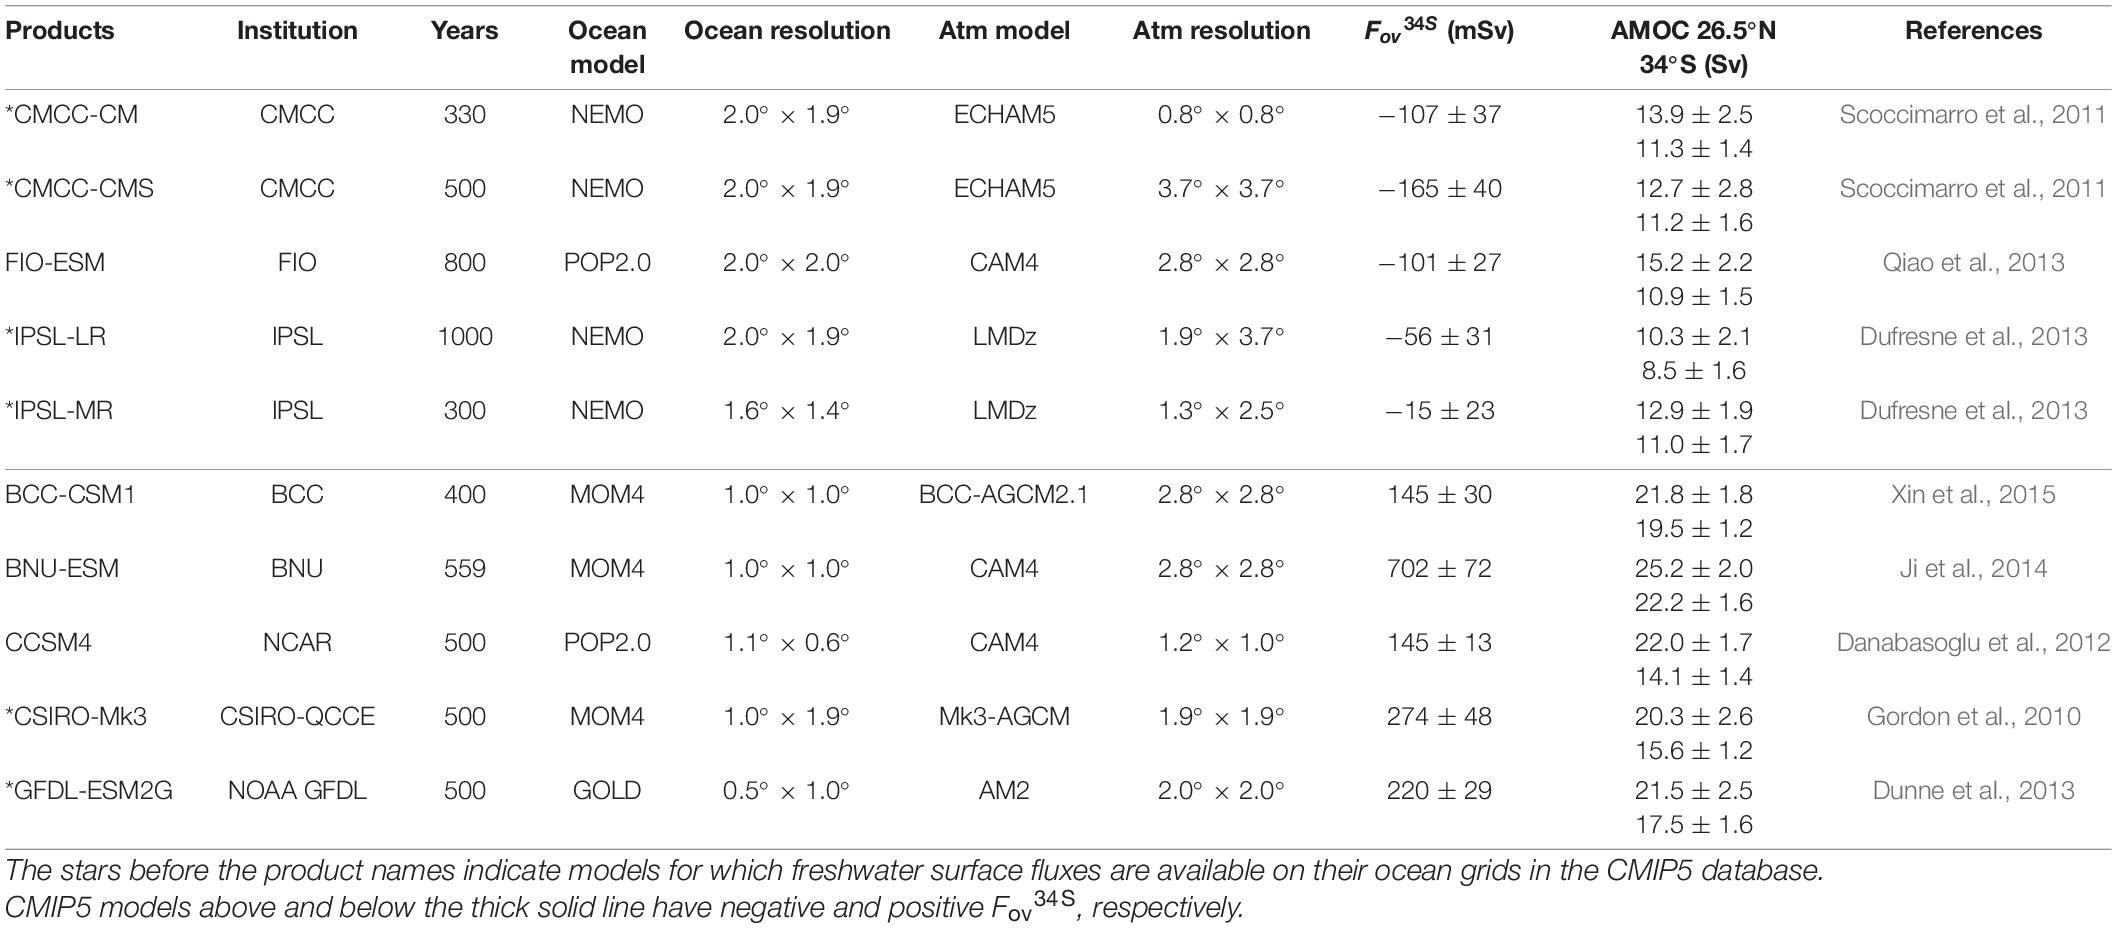
Table 1. List of selected CMIP5 products with the institution that conducted the simulations, the length of each simulation, the models and their horizontal resolutions, the Fov at 34°S and the AMOC strengths at 26.5°N and 34°S, ±their interannual variabilities.
This choice of models covers a wide range of mean Fov34S values, with 5 models having a negative Fov34S and 5 a positive, with the Fov34S range from −0.17 to +0.7 Sv, and the annual variability thereof, also shown in Table 1. It is notable that the models with positive Fov34S have slightly higher ocean resolution, although also most models with negative Fov34S use a single ocean code, NEMO.
Diagnostic Framework
In order to calculate transports across each latitudinal section, following a number of earlier studies, notably Bryden and Imawaki (2001), the mean baroclinic freshwater transport is decomposed into mean vertical (overturning) and horizontal (gyre) components:
where H is the ocean depth, W and E correspond to the western and eastern boundaries, <.> represents the zonal mean, the double prime ″ denotes deviations from zonal averages, is the section averaged salinity (other reference salinity choices are possible), and v* corresponds to deviations of the zonal mean meridional velocity at each depth from its section averaged values.
Fov and Fgyre are calculated using monthly mean model output, and the derived monthly fields are averaged over each year to produce annual-mean time series. Temporal variability in the annual-mean time series of Fov is also decomposed into contributions from meridional velocity and salinity variations using the following equations:
where y corresponds to each latitude, the overbar represents the long-term mean, the prime represents deviations from the long-term mean, and the top-to-bottom integrals of v and -<S>/ in Eq. 1 are simplified to v and S, respectively. Since the term will be shown to have negligible contribution in the analyses, the final equation can then be approximated to:
The left-hand side of Eq. 5 is the Fov (y) anomaly with its long-term mean removed at each latitude. The first and second terms on the right-hand side of Eq. 5 represent, respectively, the contributions from salinity and velocity anomalies from their long-term means, whereas the last term denotes the covariations between salinity and velocity anomalies.
Fields of FWC are also obtained on a monthly basis and are then averaged over each year, according to the equation:
where salinity anomalies, relative to section averaged values () at each latitude, are integrated from the bottom to the surface of the ocean and over a domain enclosed by two latitudes y1 and y2, and by the western (W) and eastern (E) boundaries.
The Atlantic freshwater budget is calculated for the 6 models which have the surface freshwater fluxes already available on their ocean grids in the CMIP5 database. These models have a star before their names in Table 1. Annual FWC changes are estimated as the difference between two successive Januaries, following the Deshayes et al. (2014) CMIP5 intercomparison of North Atlantic freshwater budgets. Changes in FWC can be attributed to combinations of surface fluxes, advective, and diffusive fluxes of freshwater across all lateral boundaries of the budget domain. As in Deshayes et al. (2014), a budget residual term is considered due to missing components in the CMIP5 database: (i) diffusive fluxes are not available for any models in Table 1; and (ii) the parameterised contributions of mesoscale processes to tracer advection, i.e., Gent-McWilliams (GM) parameterization (Gent and McWilliams, 1990), are also not available for any model. The freshwater budget equation is described as follows:
where ΔFWC is the temporal change, FN and FS, respectively, correspond to the total freshwater transports into the basin at the northern and southern boundaries, E-P-R represents the evaporation minus precipitation and runoff (each considered positive), and RES is the residual term.
To evaluate the main drivers of FWC changes between any two latitudes in the Atlantic the covariance of each budget term with FWC changes is normalised by the variance of FWC changes, and will satisfy the following equation:
It is worth noting that all the analyses are performed on the original model grid and the time-series have their linear trends removed.
CMIP5 Mean Freshwater Transports in the South Atlantic
Figures 1A,B show the zonal and run averaged salinity between 34°S and 20°S, as a function of depth, for the two CMIP5 groups based on Fov34S sign. The observed zonal and time averaged salinity from EN4.2.1 is also shown on both plots. Models with positive Fov34S (Figure 1A) are much fresher than the observations through the top 500 m and have a mainly salty bias below 1200 m, with quite a large spread of values. The zonal mean AMOC flow reverses around 1200 m so this vertical salinity distribution explains the northward freshwater transport of the AMOC in these models. In contrast the models with negative Fov34S (Figure 1B) match observed salinities much better in the top 500 m: they have a small 0.4 psu salty bias between 500 and 1200 m but otherwise fit the observations well below 1200 m with only a small spread. For convenience we follow Mignac et al. (2019) and define ΔS1200m as the zonal mean difference between salinities averaged in the top 1200 m and averaged below 1200 m.
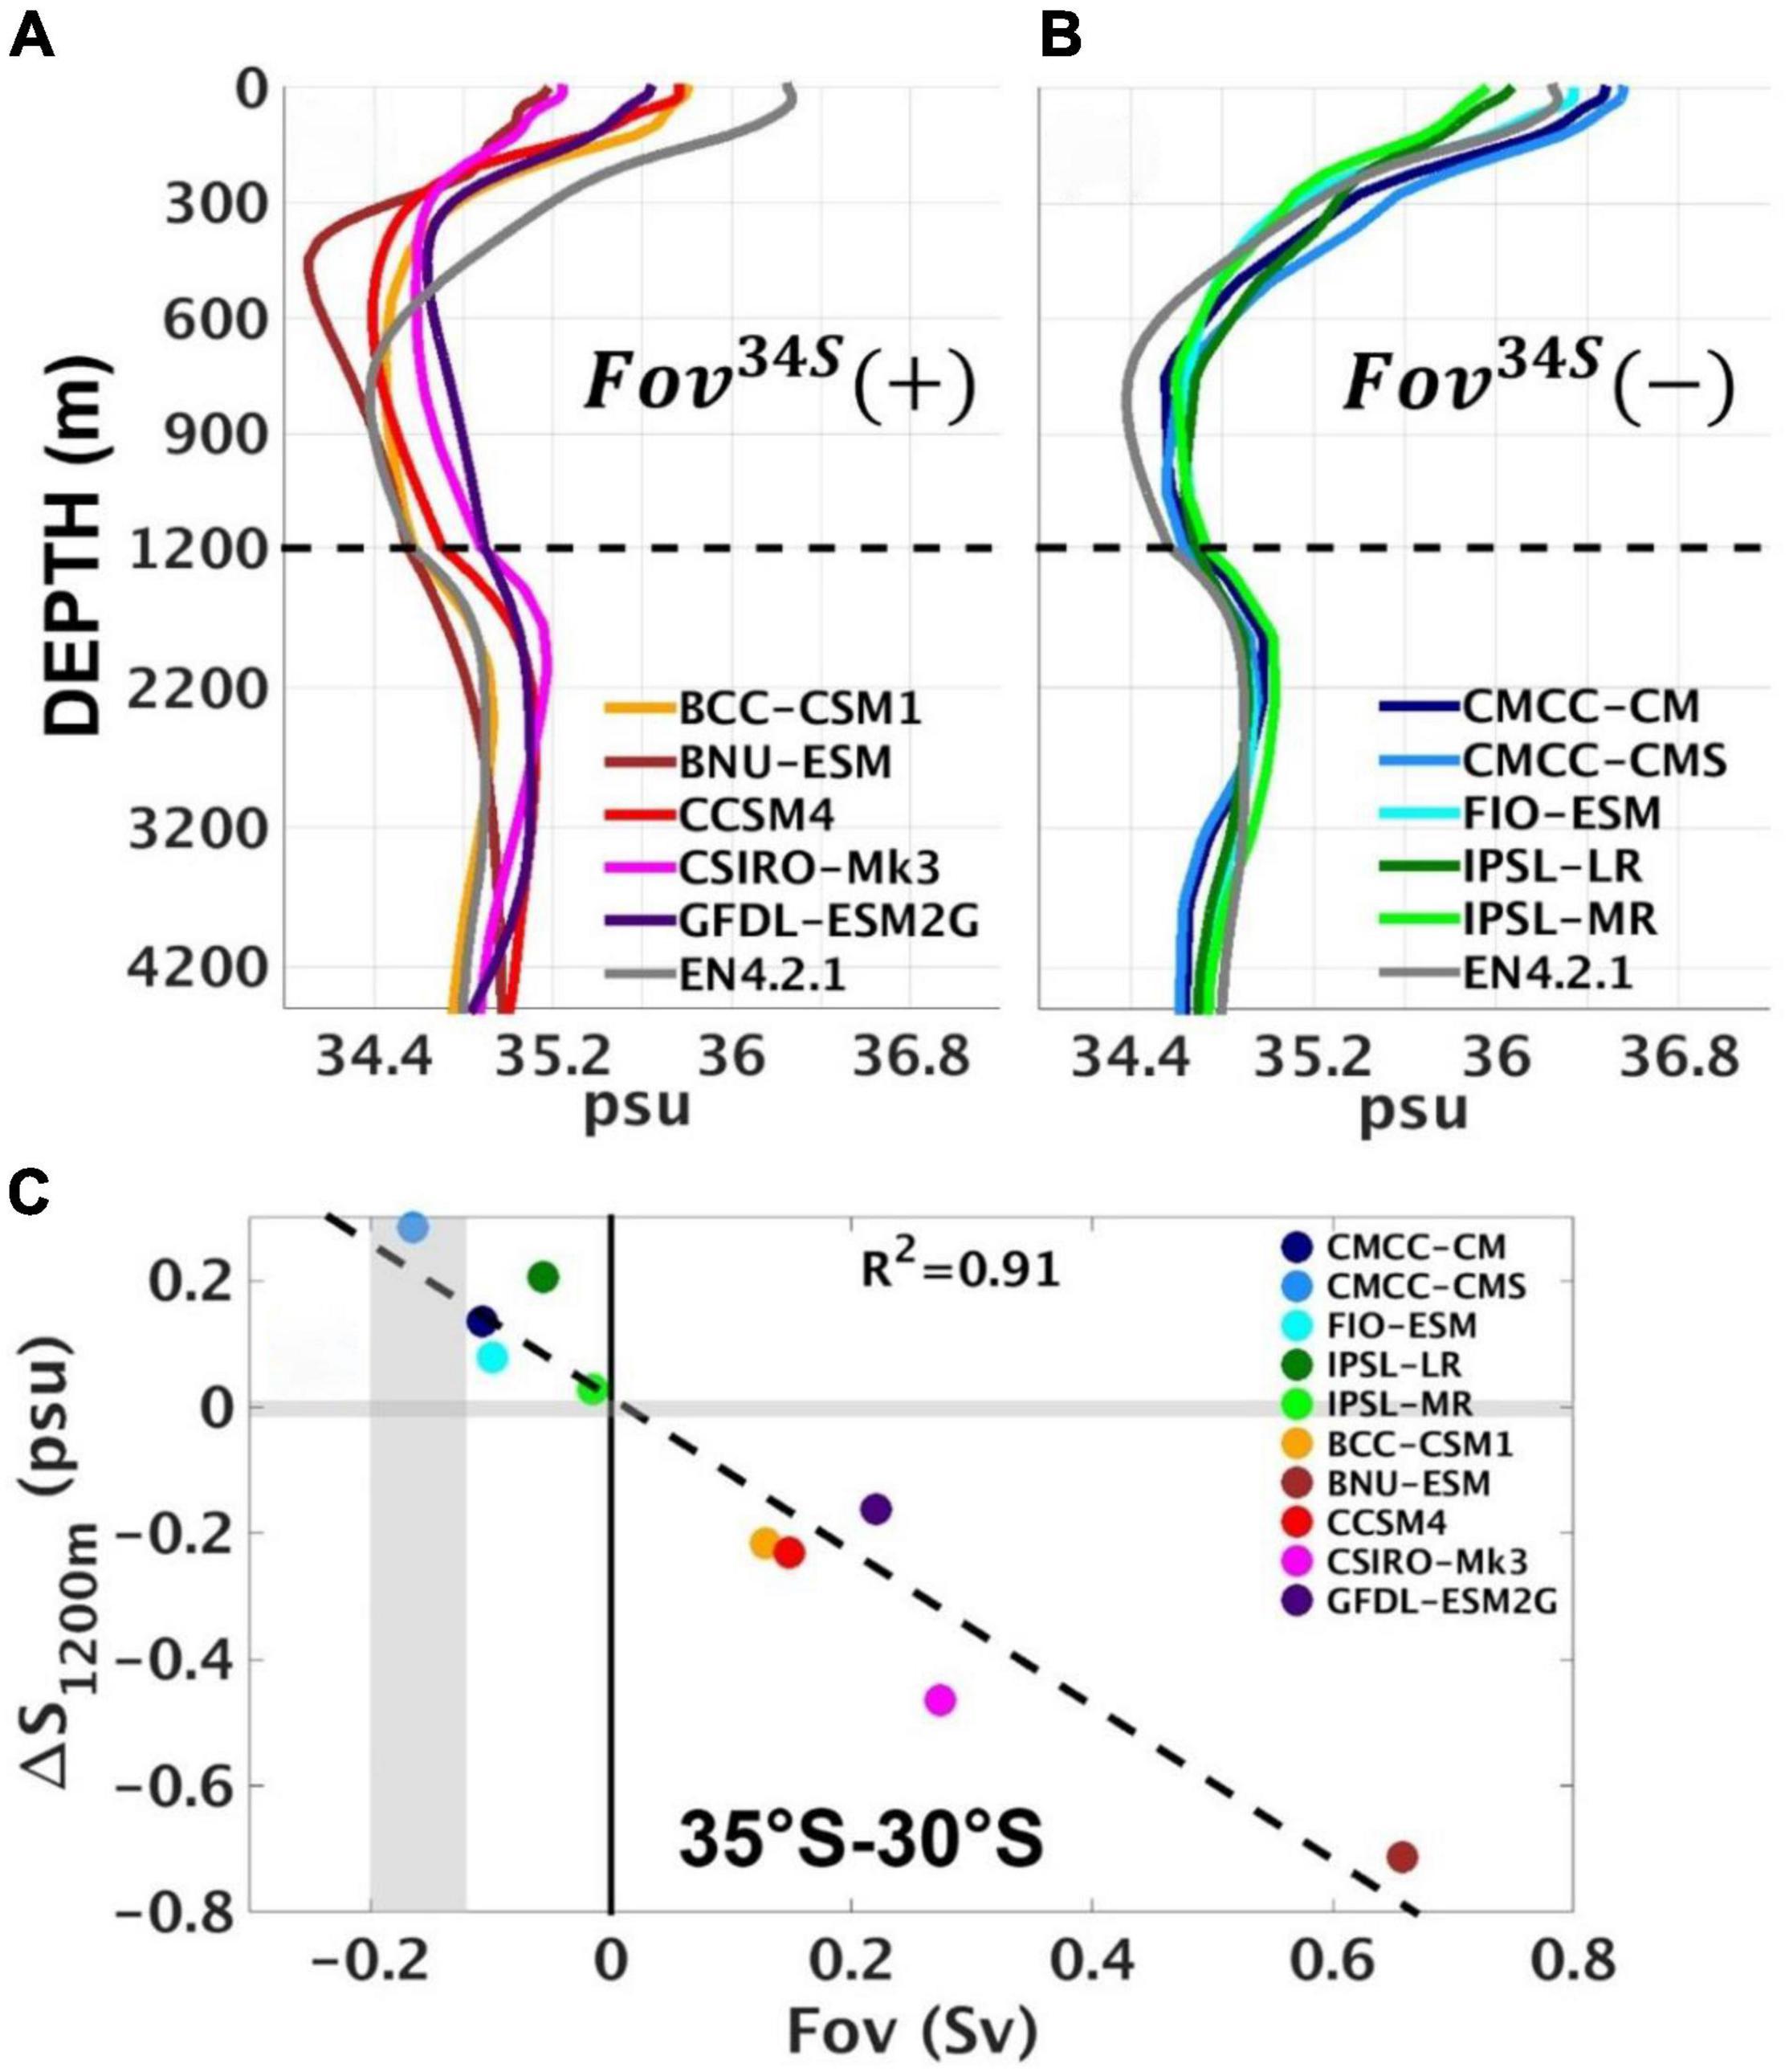
Figure 1. The zonally averaged salinity profiles between 34°S and 20°S for the 10 chosen CMIP5 models, divided into groups with (A) positive and (B) negative Fov34S. The EN4.2.1 observations are also shown for comparison. Note the stretched vertical axis in (A,B) between 0 and 1200 m, compared to 1200 and 4500 m. (C) Scatter plot of mean ΔS1200m and Fov between 35°S and 30°S for the 10 chosen CMIP5 models. The vertical grey shading represents Fov observational range in the southern Atlantic from Garzoli et al. (2013), whereas the horizontal grey shading corresponds to the small annual range of EN4.2.1 ΔS1200m ∼ 0.02 psu.
The positive and negative S biases within different depth ranges may be associated with salinity discrepancies in the formation regions of water masses (Sallée et al., 2013; Zhu et al., 2018). For example, all models with positive Fov34S have their salinity minimum between 300 and 600 m indicating a shallow AAIW layer, with a strong fresh bias at these levels which also extends right up to the surface. This shallow AAIW minimum, with too fresh waters reaching the surface, along with too salty waters below 1200 m. produces the positive Fov34S bias. The models with negative Fov34S better reproduce the AAIW minimum position, and although the AAIW does not extend deeply enough the transports between 500 and 1200 m are weak enough not to cause large Fov34S bias.
Figure 1C shows the very tight relationship between ΔS1200m and Fov35–30S, with a linear regression coefficient of 0.91 amongst all these models. This is consistent with the key role of salinity differences in controlling Fov, as also noted by Mignac et al. (2019) when comparing ocean reanalysis datasets (ORA) and free running models (FRM). This also explains the large sensitivity of Fov34S when salinity bias corrections are applied in the CMIP5 models (Mecking et al., 2017).
The influence of ΔS1200m over Fov extends throughout the Atlantic basin. Figure 2 shows ΔS1200m and Fov, as a function of latitude throughout the Atlantic basin. The positive Fov34S models (Figure 2, left), show that the greater spread in ΔS1200m, and Fov34S seen in Figure 1A relative to Figure 1B, extends throughout the Atlantic basin. Although ΔS1200m controls the Fov34S strength, Table 1 shows that the models with positive Fov34S also have larger AMOC strengths than models with negative Fov34S. Mecking et al. (2017) also noticed the inter-model correlation of 0.73 between the AMOC strength at 26.5°N and Fov34S and proposed an indirect connection whereby CMIP5 models with stronger AMOCs lead to warmer SSTs and more evaporation in the North Atlantic, making the north saltier and denser and hence able to maintain the strong AMOC. For consistency the extra evaporation in the North Atlantic then requires freshwater import by the AMOC into the southern Atlantic, a positive Fov34S, and transport up into the northern basin. Conversely, models with weak AMOCs would have less evaporation in the North Atlantic and require less import of freshwater through the southern Atlantic. We will look for any evidence of these connections in the following section.
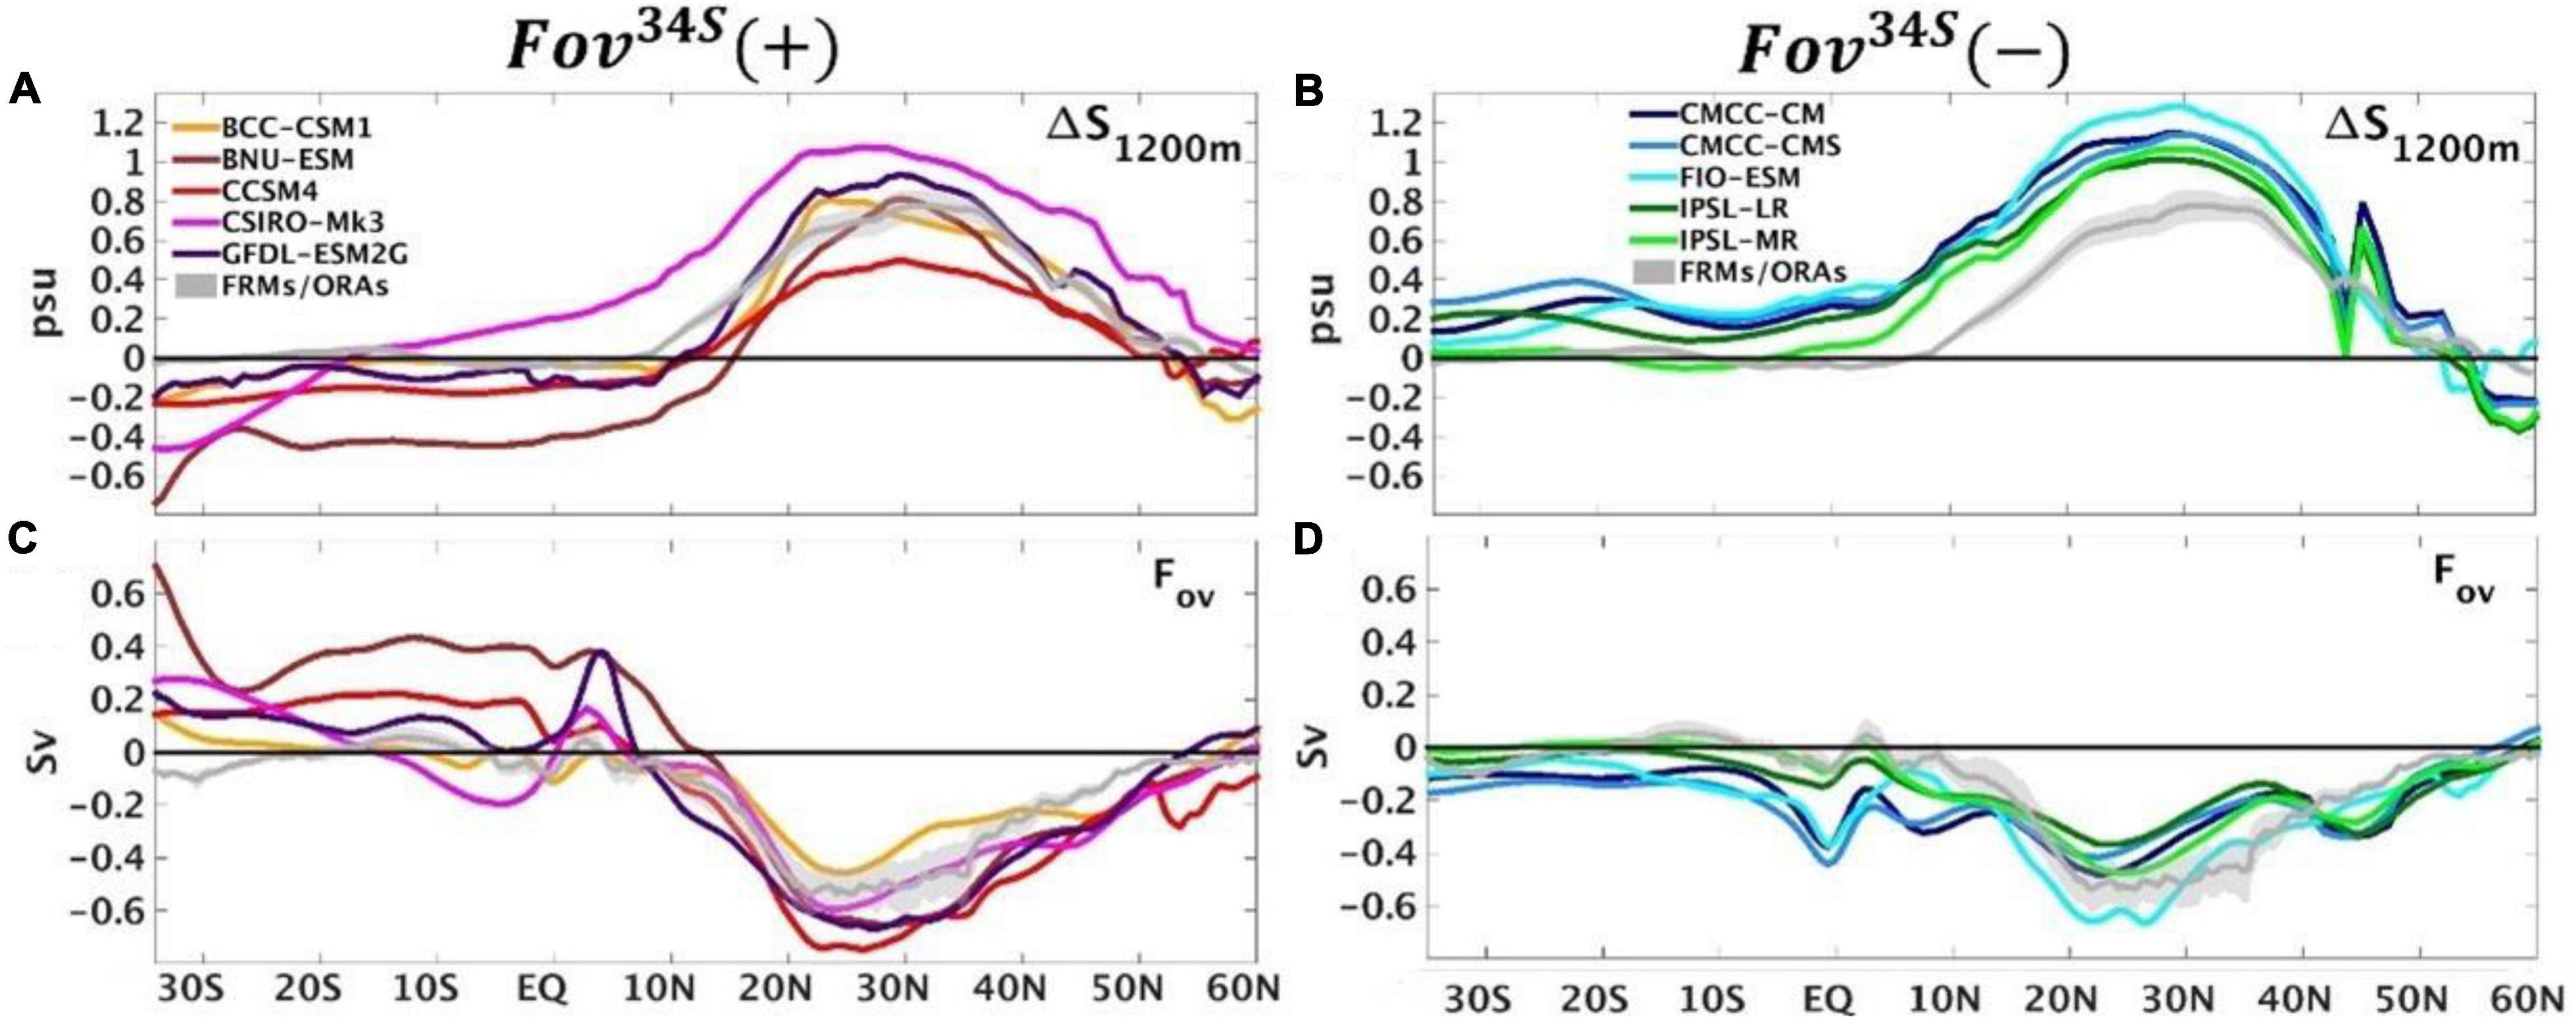
Figure 2. The mean (A,B) ΔS1200m (psu), and (C,D) Fov (Sv), divided into two CMIP5 groups of positive (left) and negative (right) Fov34S, respectively.
Time-Varying Freshwater Transports
In this section we look at the correlated variability in the AMOC and the freshwater transports in the different models. Despite the large AMOC strength differences between the two groups of CMIP5 models in Table 1, the interannual AMOC variability at 34°S and 26°N is insensitive to Fov34S, with very small linear regression coefficients of 0.05 and 0.09, respectively (Figure 3). Although interannual Ekman transports are included in AMOC variability, stability differences between models could still lead to larger AMOC variability for the more unstable models, however, there is no indication of a relationship to the mean Fov34S.
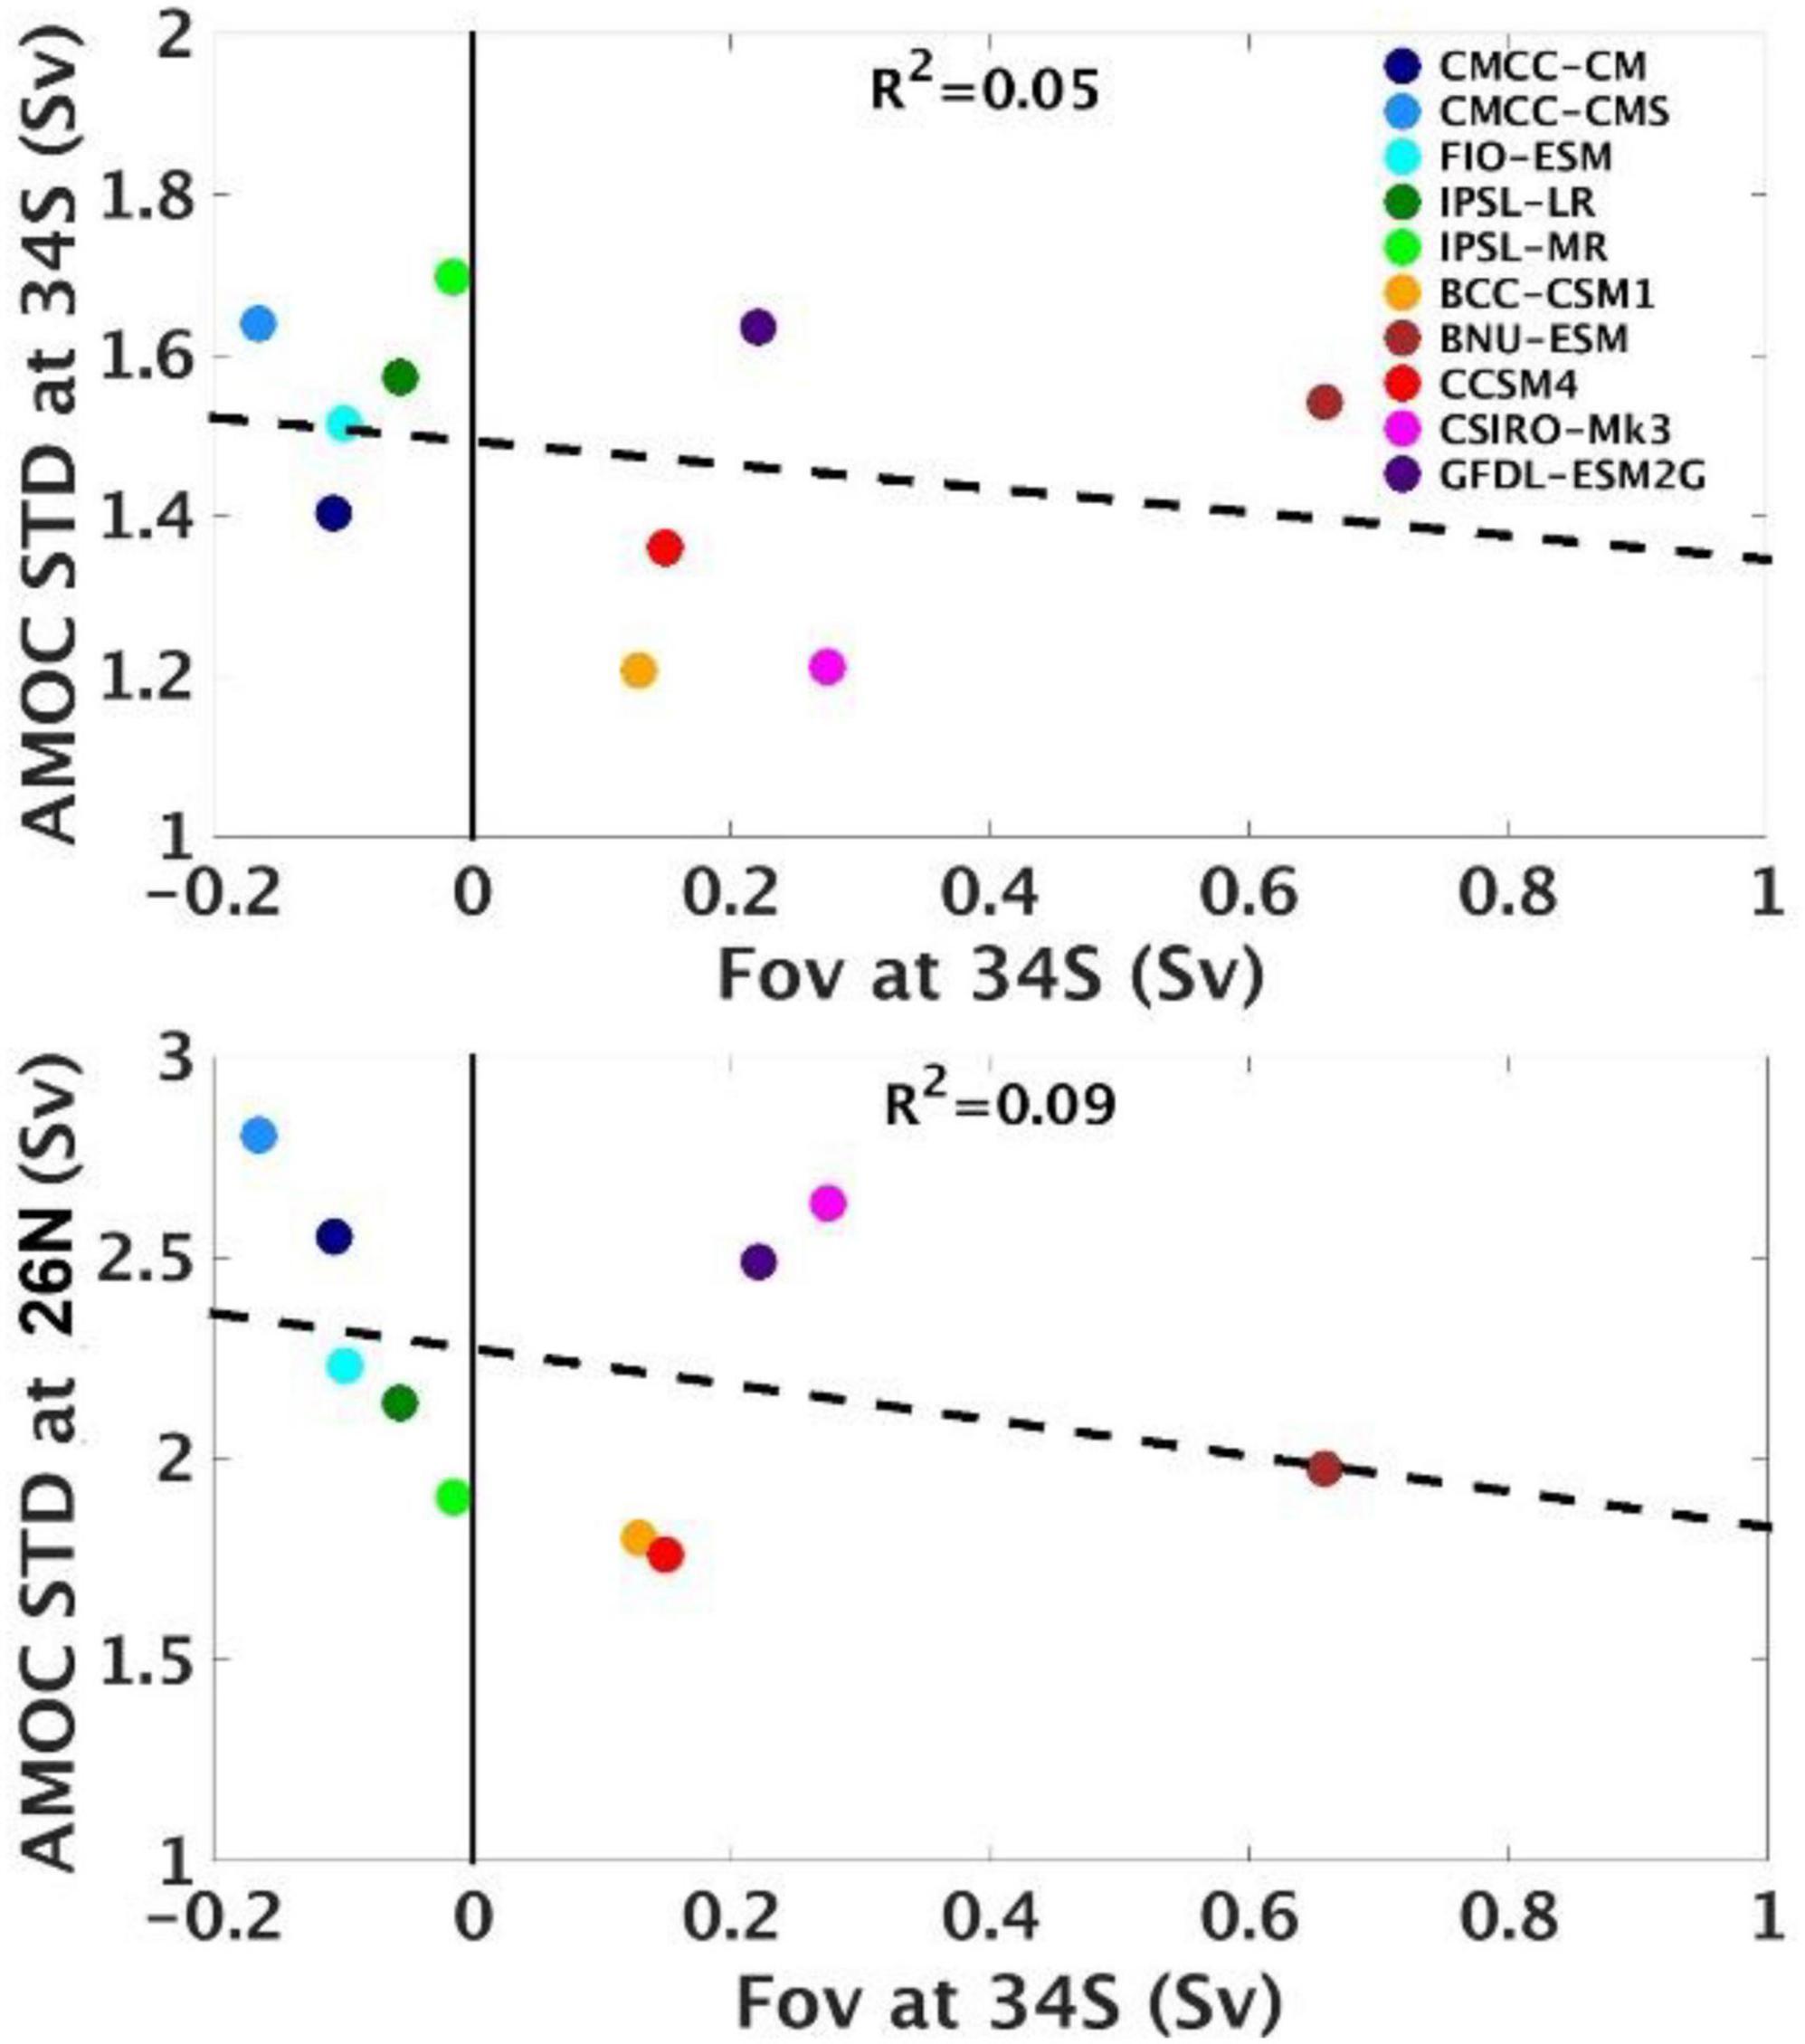
Figure 3. Scatter plot of interannual AMOC variability (Sv) at 34°S (top) and at 26°N (bottom) against Fov (Sv) at 34°S for the 10 CMIP5 models.
An implicit assumption of the salt-advection feedback is that temporal Fov variability is primarily determined by the meridional velocity variability rather than by the salinity variability throughout the Atlantic (Rahmstorf, 1996). In Figure 4 (left), the decadal timeseries variability is decomposed into contributions from salinity and velocity variations, together with the contributions due to their covariability (see Eq. 5). Regardless of Fov34S sign, 7 out of 10 CMIP5 models in Table 1 have variability more correlated (R2 on plots) with local salinity variations than with local circulation changes. For example, in BCC-CSM1 and GFDL-ESM2G, S′ has 0.93 and 0.96 correlation with southern Fov variability, much larger than the 0.28 and 0.43 correlations with v′ , respectively. Although the relative contributions of meridional velocity anomalies are slightly larger in CSIRO-Mk3, CCSM4, CMCC-CM, FIO-ESM, and IPSL-MR, these models still show a dominance of S′ over v′ on decadal timescales.
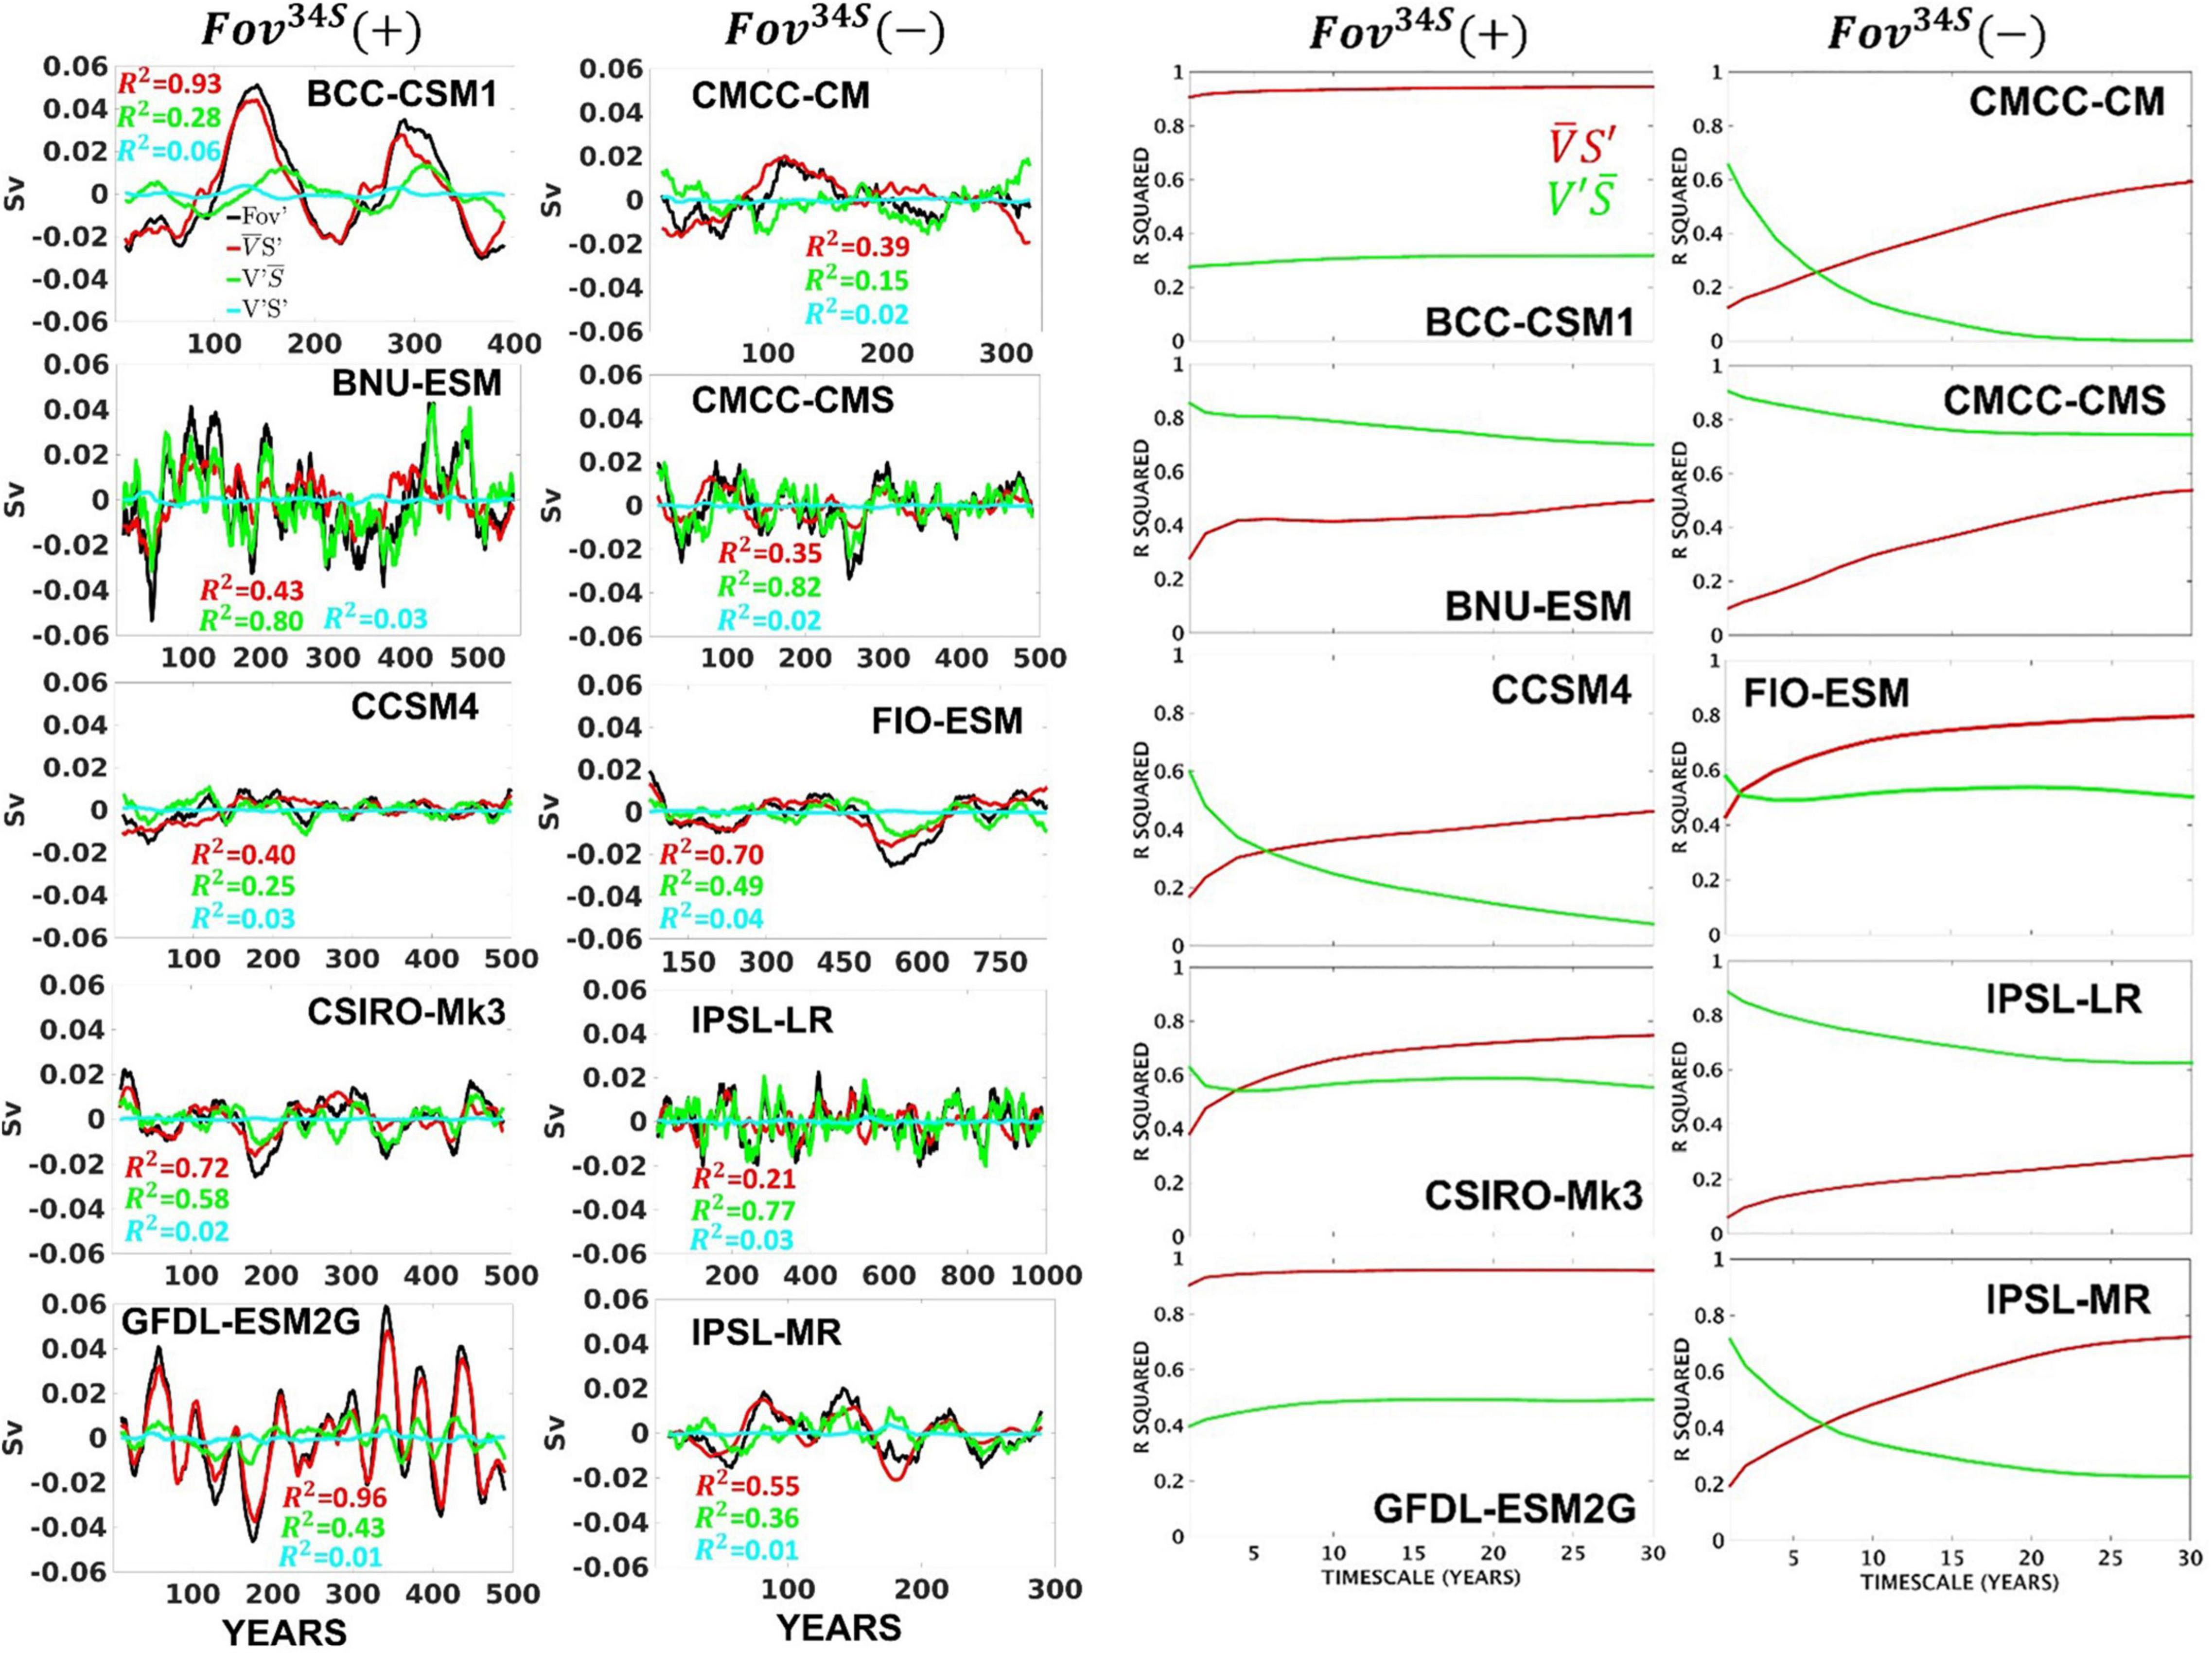
Figure 4. (Left): Eleven-point running averages of the annual-mean time series of Fov′ (black lines; Sv), with contributions from salinity (red line) and velocity (green line) variability, as well as from their covariability (cyan line) for the region between 34°S and 20°S. The R2 values between Fov′ and its components are indicated by the respective colours. Note the different time intervals for each CMIP5 model. (Right): R2 of Fov anomalies with contributions from salinity (red) and velocity (green) anomalies, as a function of timescale, for the region 34°S to 20°S. The CMIP5 models with positive and negative Fov34S are displayed on the left and right panels, respectively, in both sections.
In Figure 4 (right), the R2 coefficients of with S′ and v′ are shown as a function of timescale. Many CMIP5 models show a rapid increase (decrease) of S′ (v′ ) contributions with increasing timescale. In most models S′ becomes larger than v′ contributions on timescales greater than approximately 5 years. In models, such as BCC-CSM1 and GFDL-ESM2G, the Fov34S variability is driven almost entirely by salinity variations, with S′ dominating on all timescales. In all models and timescales, it is variability of salinity in the top 1200 m that leads to Fov′ variability, rather than salinity variability below (not shown).
The Fov variability timeseries and its components between 26°N and 40°N are shown in Figure 5 [Left]. In contrast to the South Atlantic, the north shows clear dominance of the meridional velocity variations in determining Fov variability, with contributions of salinity anomalies S′, for all the 10 CMIP5 models remaining small, or very small and comparable to v′S′. This is consistent with Cheng et al. (2018), who showed that the decadal Fov variability in the two CMIP5 models they studied was dominated by salinity variations, except in the subtropical North Atlantic (i.e., 20N–40N). The change in R2 coefficient with timescale, for the north Atlantic is shown in Figure 5 [Right], demonstrating the dominance of v′ , i.e., the local circulation changes, in controlling Fov variability on all timescales.
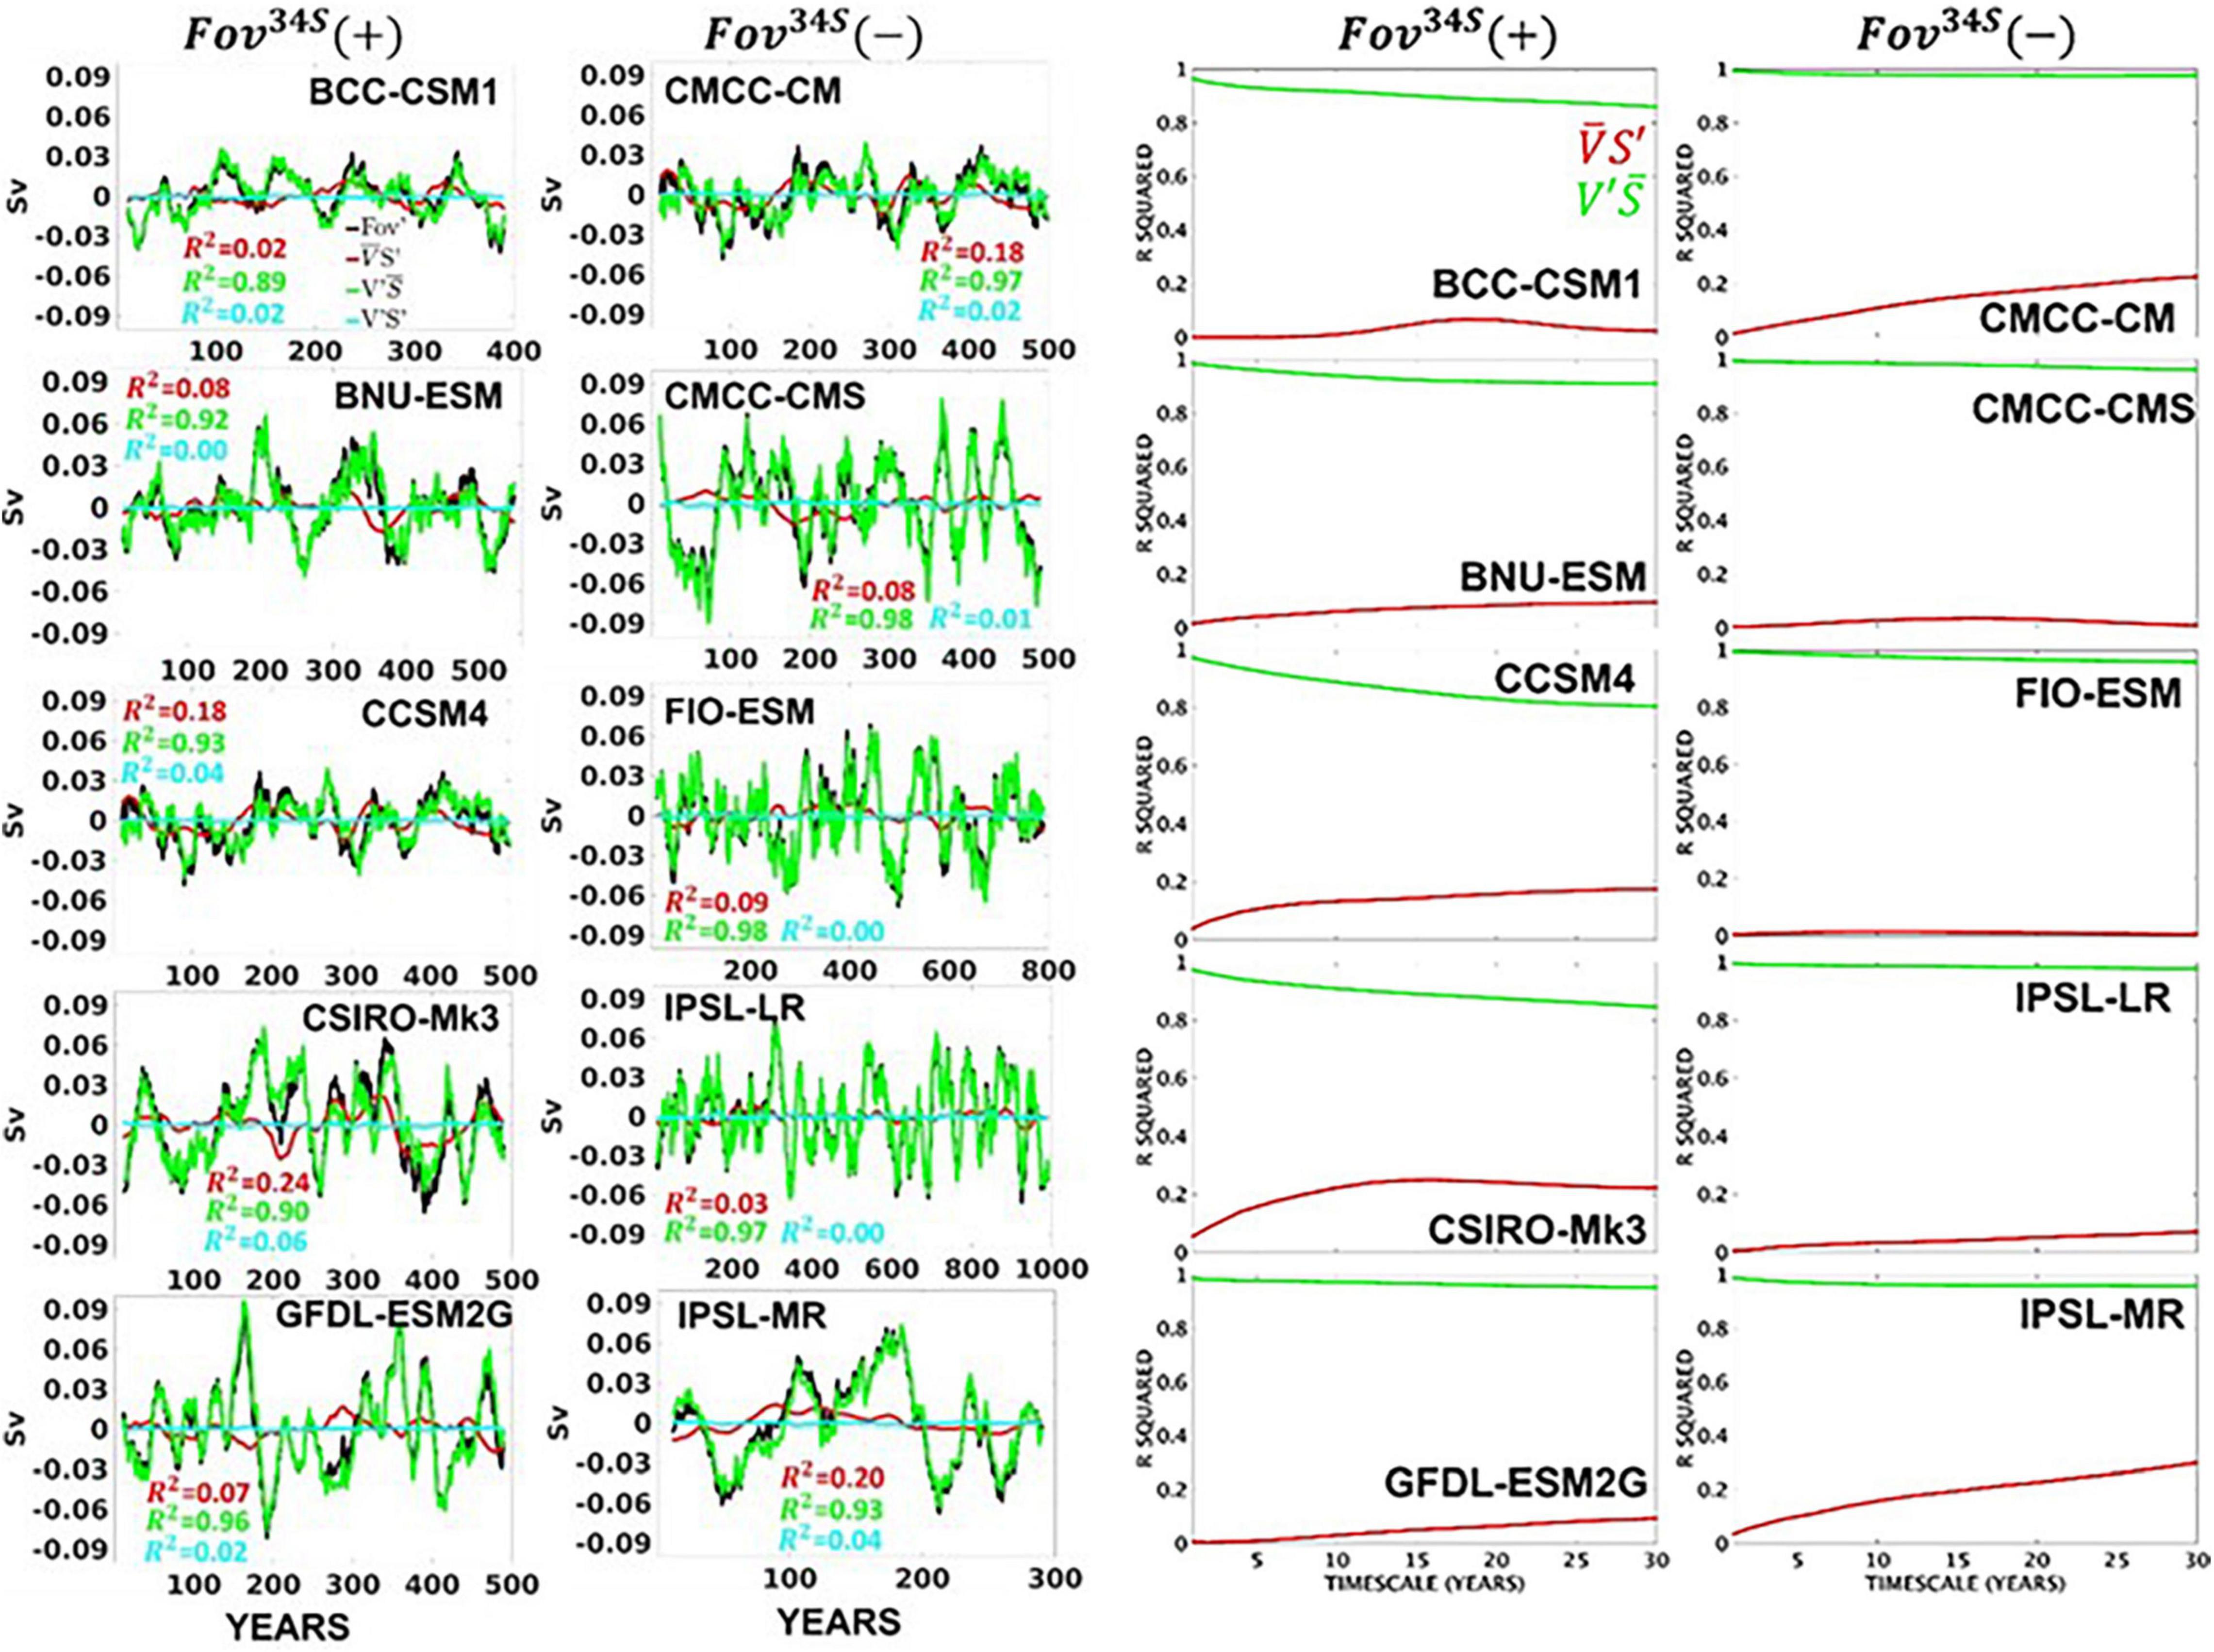
Figure 5. (Left): As in Figure 4 but for Fov′ averaged between 26°N and 40°N. The column headings are only used to classify the models into the two groups.
Atlantic Freshwater Content
In this section we look at the impact of Fov34S transport contributions to the freshwater budget integrated throughout the Atlantic basin, and any influence on the meridional FWC gradient variations that might feedback onto the AMOC. To investigate this we follow the freshwater budget approach developed previously by Deshayes et al. (2014) for the North Atlantic subpolar gyre. Table 2 shows the freshwater budget components between 34°S and 40°N, along with their variability on decadal timescales. This was only done for the 6 models denoted with * in Table 1, which provide the surface freshwater fluxes on their ocean grids. Note that the transports do not include lateral diffusion terms (Redi, 1982) or the effects of Gent and McWilliams (1990) parameterizations. Even so the budget residuals and their variability remain small, showing that the causes of freshwater changes can be well attributed in all of these models.
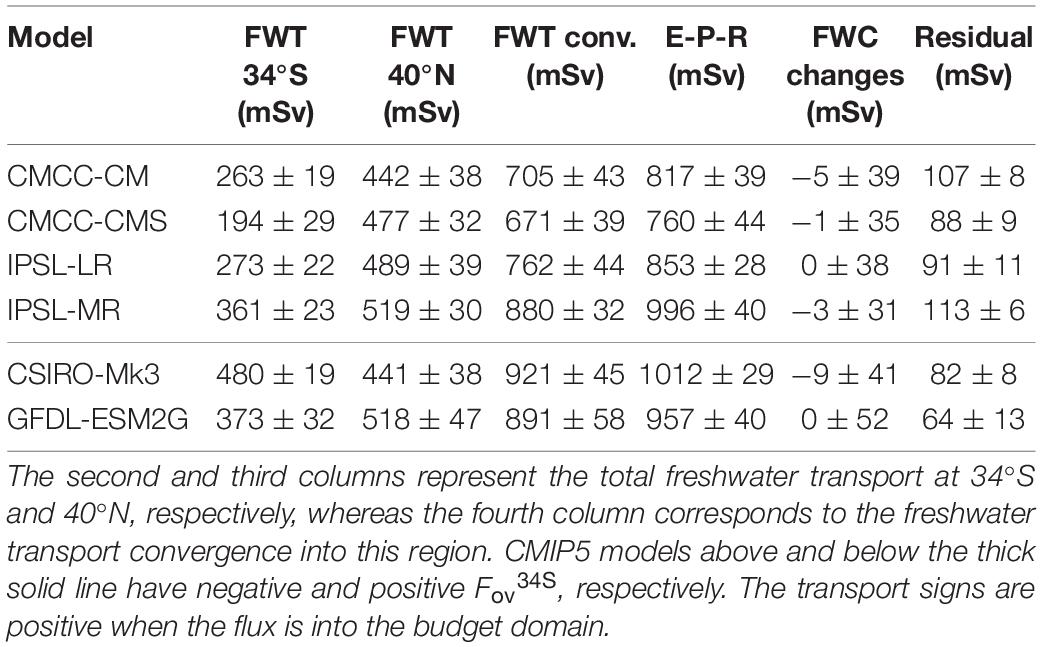
Table 2. Decadal freshwater budget components (mSv) and their decadal standard deviations between 34°S and 40°N.
To first order, the budgets show that the net evaporation over 34°S–40°N is balanced by a convergence of the FWT transports by resolved advection in all models. The residual term, accounting for parameterised eddy fluxes or the way the salinity reference, , is defined, only amounts to 5–15% of the E-P-R, while FWC change terms are negligible on these timescales. The models with positive Fov34S and stronger AMOCs (Table 1), such as CSIRO-Mk3 and GFDL-ESM2G, also have larger mean total freshwater transports at 34°S, and larger E-P-R compared to most of the models with negative Fov34S. This supports Mecking et al. (2017) suggestion that models with stronger AMOCs lead to more evaporation in the North Atlantic, along with more freshwater import in the south.
Decadal variability of the freshwater convergence, however, is dominated by northern boundary transports in almost all models, and it can also be seen from the amplitude of their decadal variability in relation to the total variability, that the southern and northern freshwater transport variations appear to be uncorrelated. There is no indication that freshwater anomalies crossing the southern boundary are connected to transports into the high latitude North Atlantic where they would be needed to affect the AMOC.
Figure 6 evaluates these FWC budget components between 34°S and 40°N on a range of timescales using the normalised covariance of each budget term with the FWC changes (Eq. 8). The total freshwater transports are also decomposed into Fov and Fgyre for a more detailed investigation of the budget contributions. The most important driver of 34°S–40°N FWC changes varies between E-P-R and the northern Fov, depending on the model and timescale. There is generally a larger contribution of the advective fluxes, particularly the northern Fov, with increasing timescale. In CMCC-CM, CMCC-CMS and IPSL-MR, the contribution of the southern Fgyre also increases with timescale, becoming the largest advective flux on multidecadal timescales.
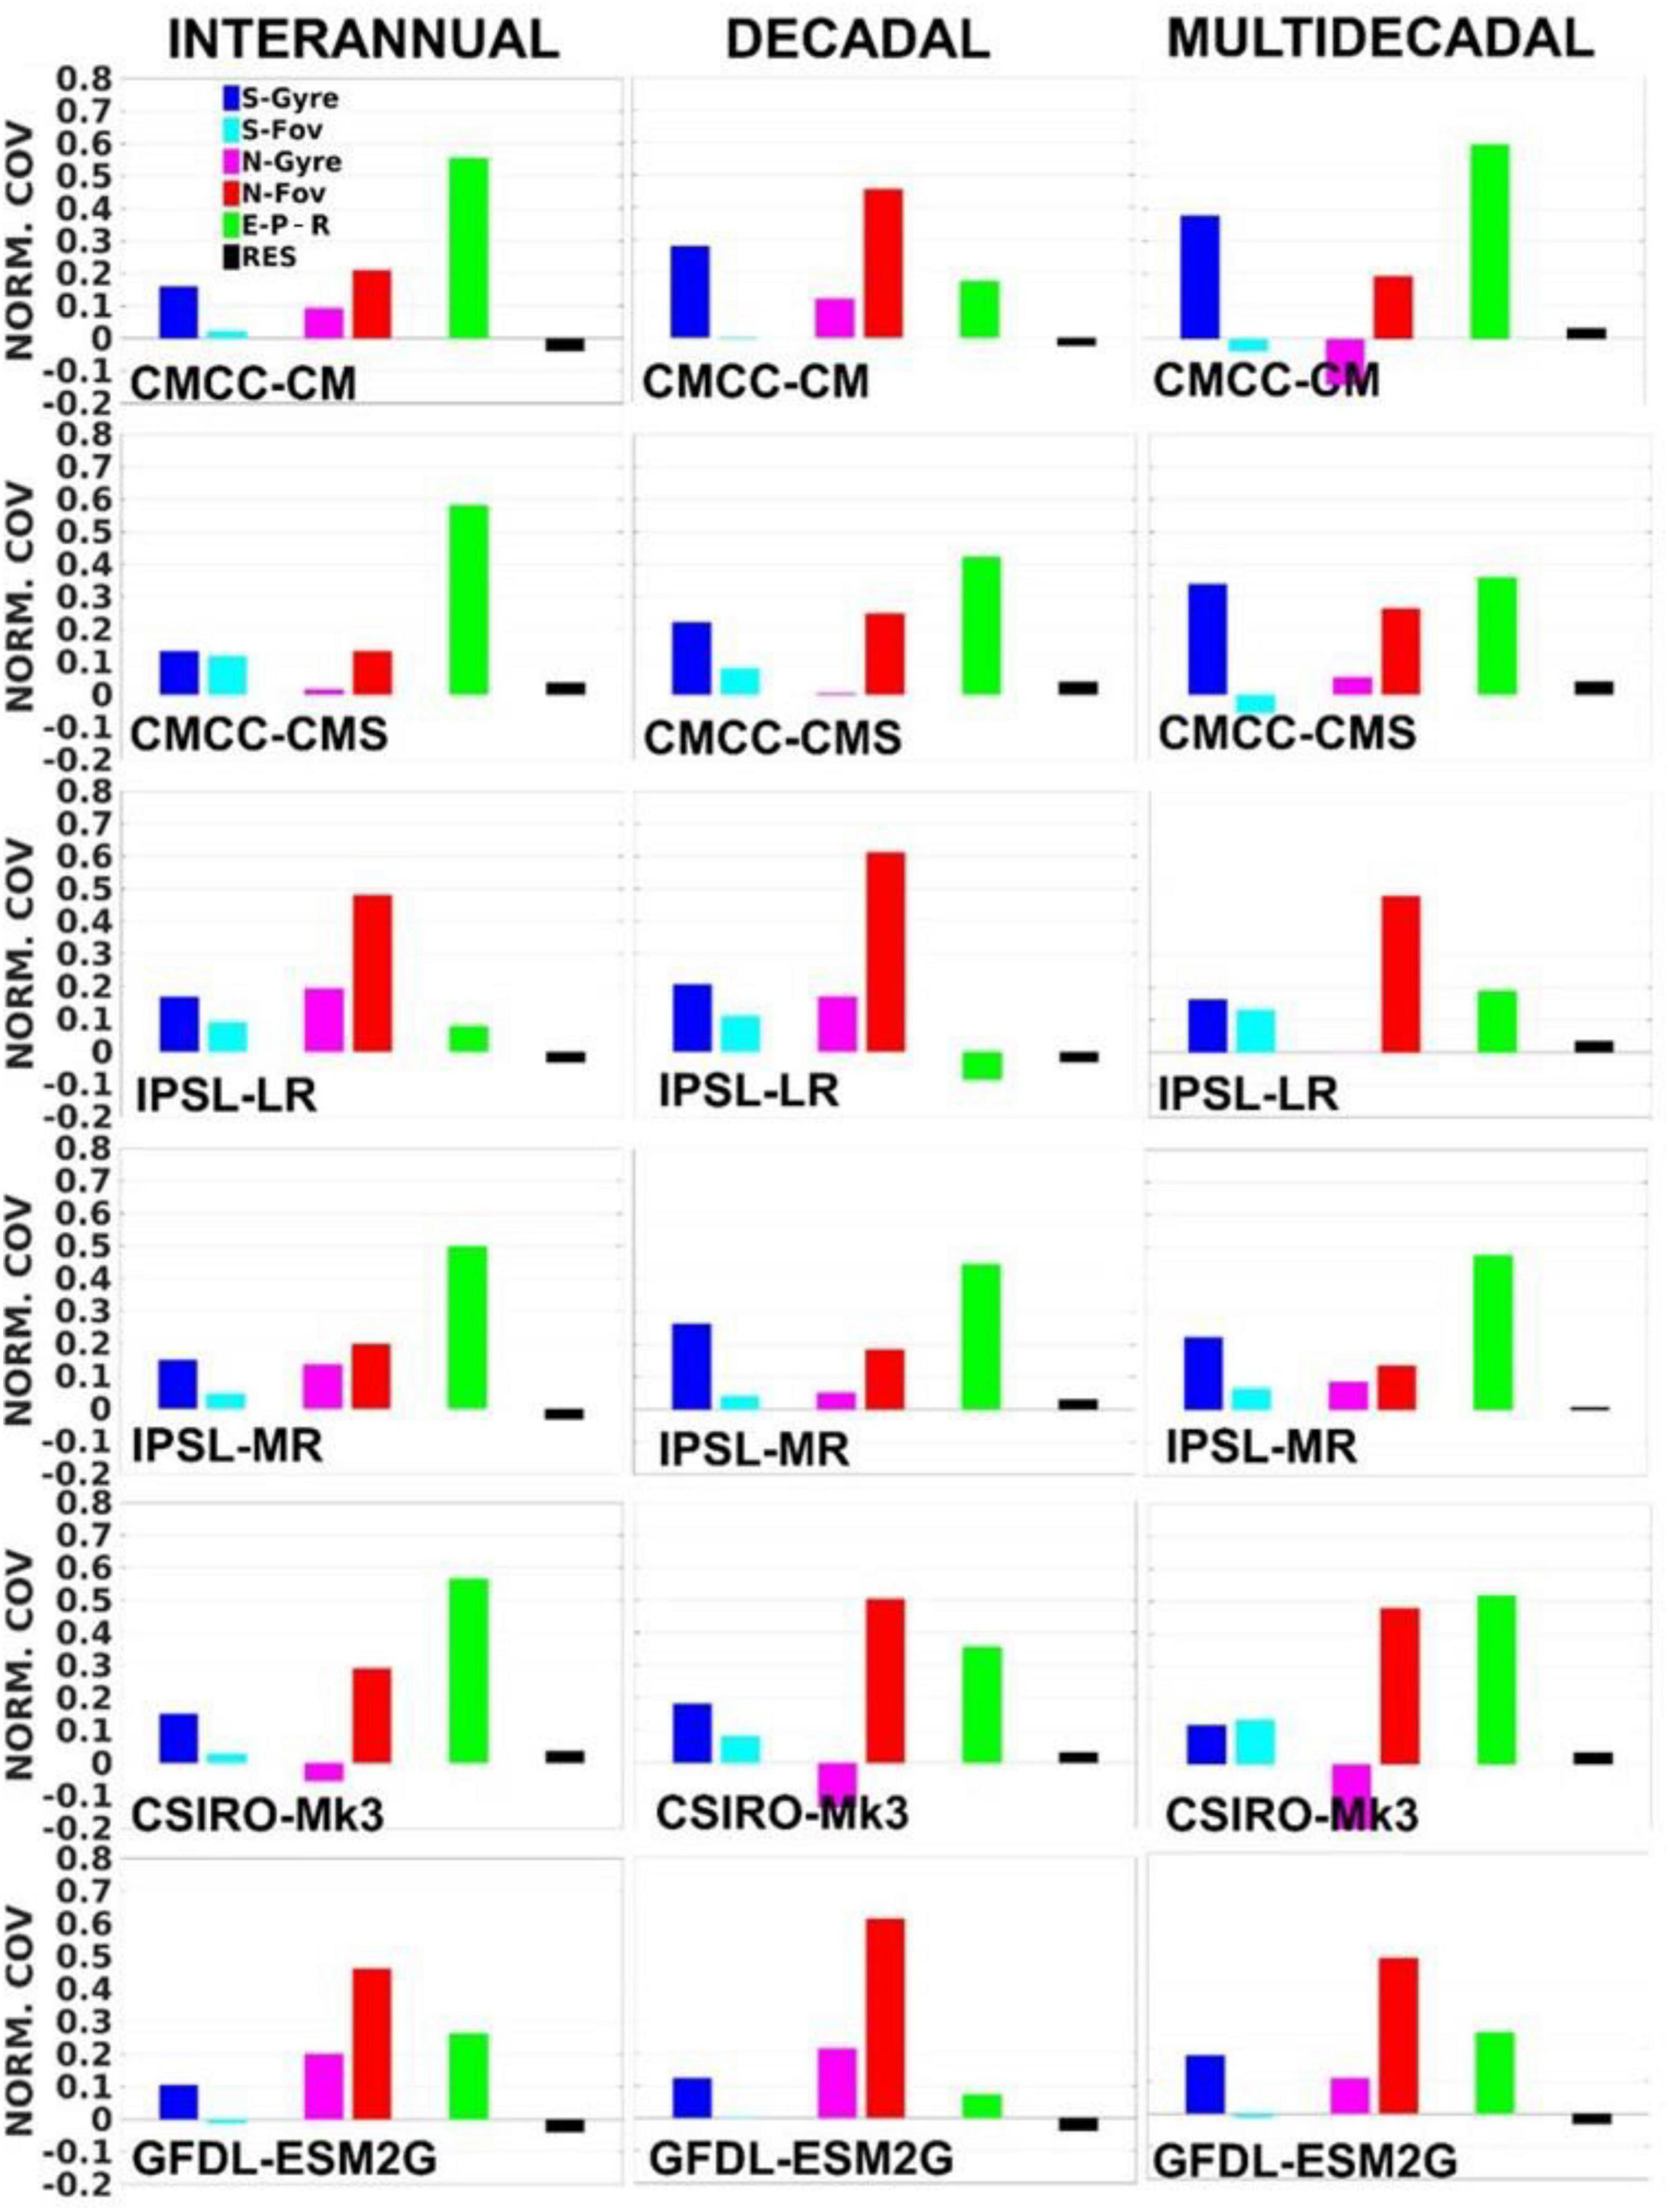
Figure 6. The covariance of each budget term with FWC changes normalised by the variance of FWC changes (Eq. 8, considering the region between 34°S and 40°N). The sum of all normalised covariances, including from the residual term, equals 1. The normalised covariances are evaluated on interannual, decadal, and multidecadal timescales. The prefixes “S-” and “N-” denote southern and northern transports, respectively.
The Fov34S explains less than 12% to FWC budget in all models, regardless of timescale, and it provides the smallest contribution to the freshwater budget variations, apart from the residual term. This strongly suggests that any influence it might have on variability in North Atlantic water formation would be very minimal. In contrast to the northern boundary transports, the southern Fgyre is always equal to, or more important than, Fov34S in Figure 6, reinforcing the key role played by the southern Fgyre in contributing to South Atlantic freshwater budgets (e.g., De Vries and Weber, 2005; Sijp, 2012; Ferreira et al., 2018). At higher resolutions additional FWC variability may come from Agulhas leakage (Biastoch et al., 2008).
In Figure 7 we can see how far into the Atlantic basin the 34°S freshwater transports Fov and Fgyre can influence the FWC on different timescales, using the normalised covariances of each budget term in Eq. 8, where the latitude determines the northern boundary of the FWC budgets down to 34°S. The contribution of Fov34S in driving FWC changes decreases rapidly as the region considered extends northward. Its contribution is always restricted to south of the equator, and is systematically smaller than Fgyre34S in all models. In contrast, the influence of Fgyre34S extends across the equator in CMCC-CM, CMCC-CMS and IPSL-MR, particularly on longer timescales. In fact, the budget contributions from the total transports at 34°S are always dominated by Fgyre rather than Fov, even for GFDL-ESM2G, which shows a strong compensation of the contributions from Fgyre34S and Fov34S through the southern Atlantic. Fgyre34S usually drives FWC changes (i.e., positive covariances) in all models, except for GFDL-ESM2G where Fgyre34S acts to dampen FWC changes (i.e., negative covariances). When the domain is limited to the southern hemisphere, Fov coming from the north show negative covariances with FWC, i.e., tending to dampen variability in FWC content south of ∼15°S (Supplementary Figure A).
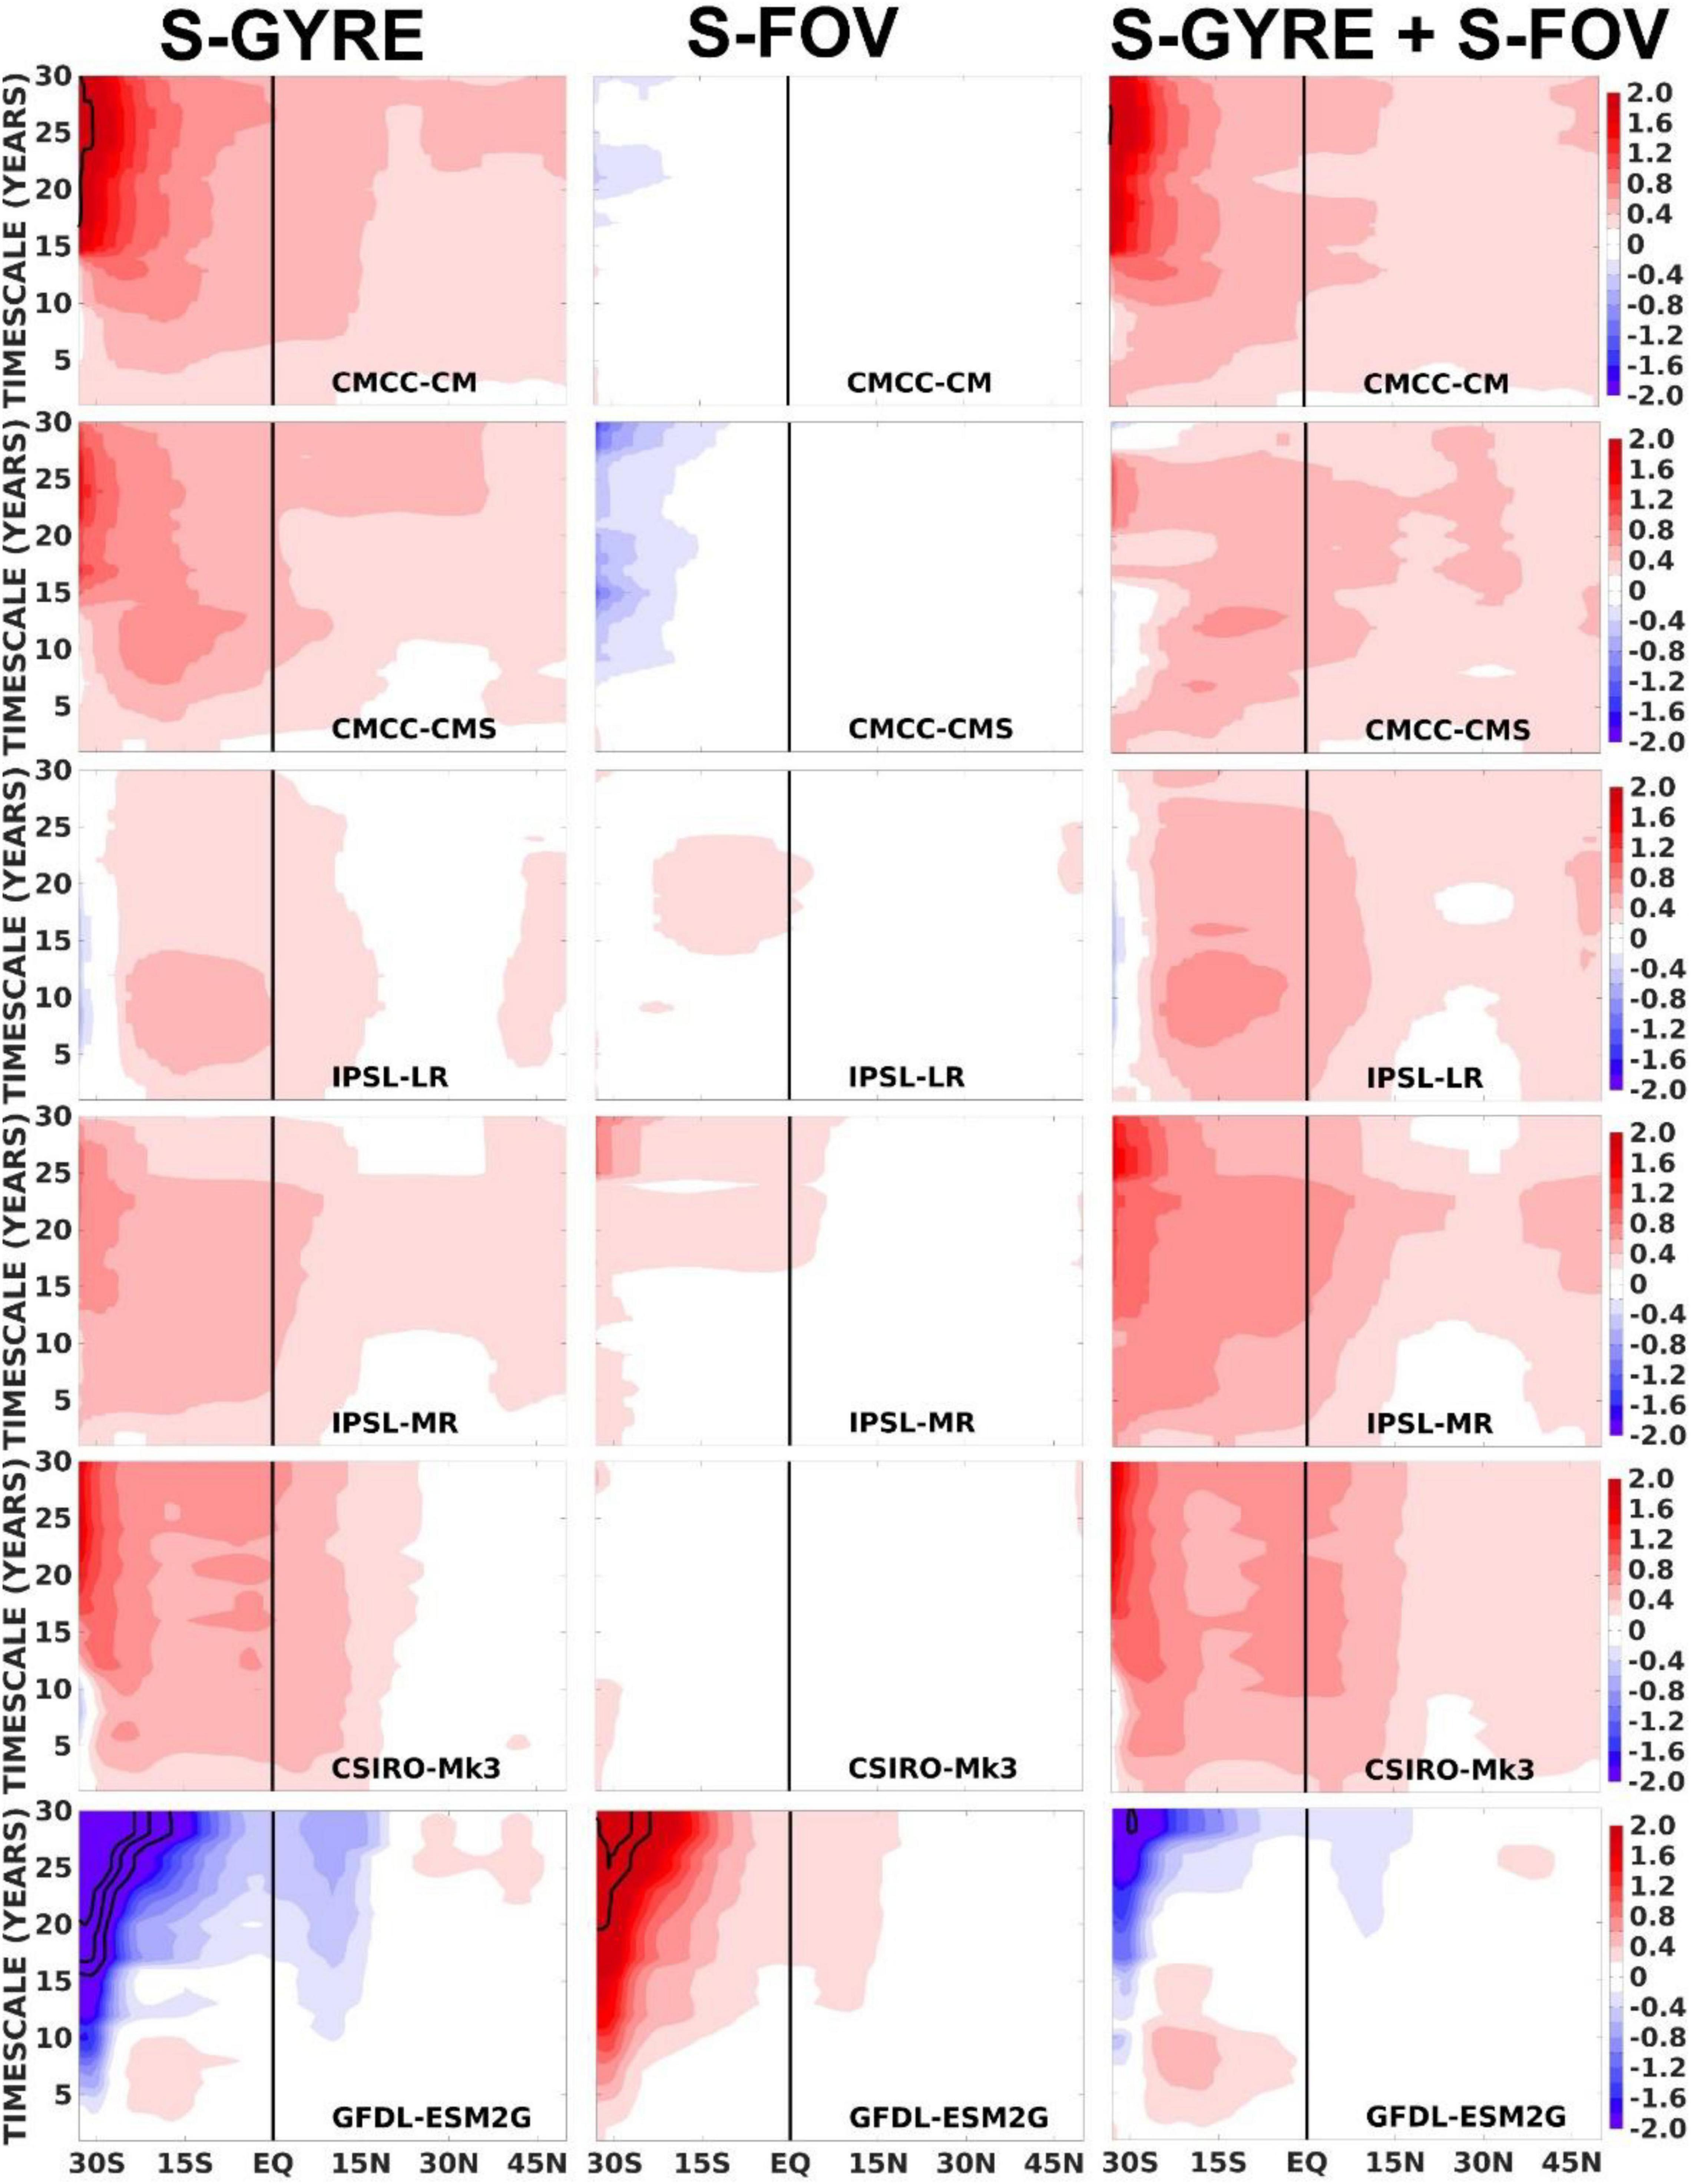
Figure 7. Normalised covariances of the southern Fgyre, Fov, and total transports with FWC changes, as in Eq. 8, considering a fixed southern boundary at 34°S and a moving northern boundary from 33°S to 50°N. The spatially varying normalised covariances are evaluated from interannual to multidecadal timescales. The black contours correspond to either negative or positive normalised covariance values of >3.
Figure 8 shows the total advective fluxes at both the southern and northern boundaries, along with E-P-R. The latitude defines the moving northern boundary representing the budget terms for the region down to 34°S. The budget residuals are not shown since they always represent <20% of the total FWC changes for all regions and timescales. E-P-R is a strong driver of FWC change (positive covariances) especially in the southern hemisphere where it is often larger than the total (overturning + gyre) transports across 34°S. Transports across the northern boundary are usually dampening the FWC variability in the southern hemisphere, especially south of 15°S. When the domain of the budget extends well into the northern hemisphere, the role of surface fluxes reverses and weakens. The dominant driver of FWC changes becomes the transport across the northern boundary, which is dominated by Fov (not shown), and the surface fluxes are then usually acting to dampen these northern transport driven FWC changes. The southern boundary transports have very weak impact on FWC changes once the budget box extends across the Equator.
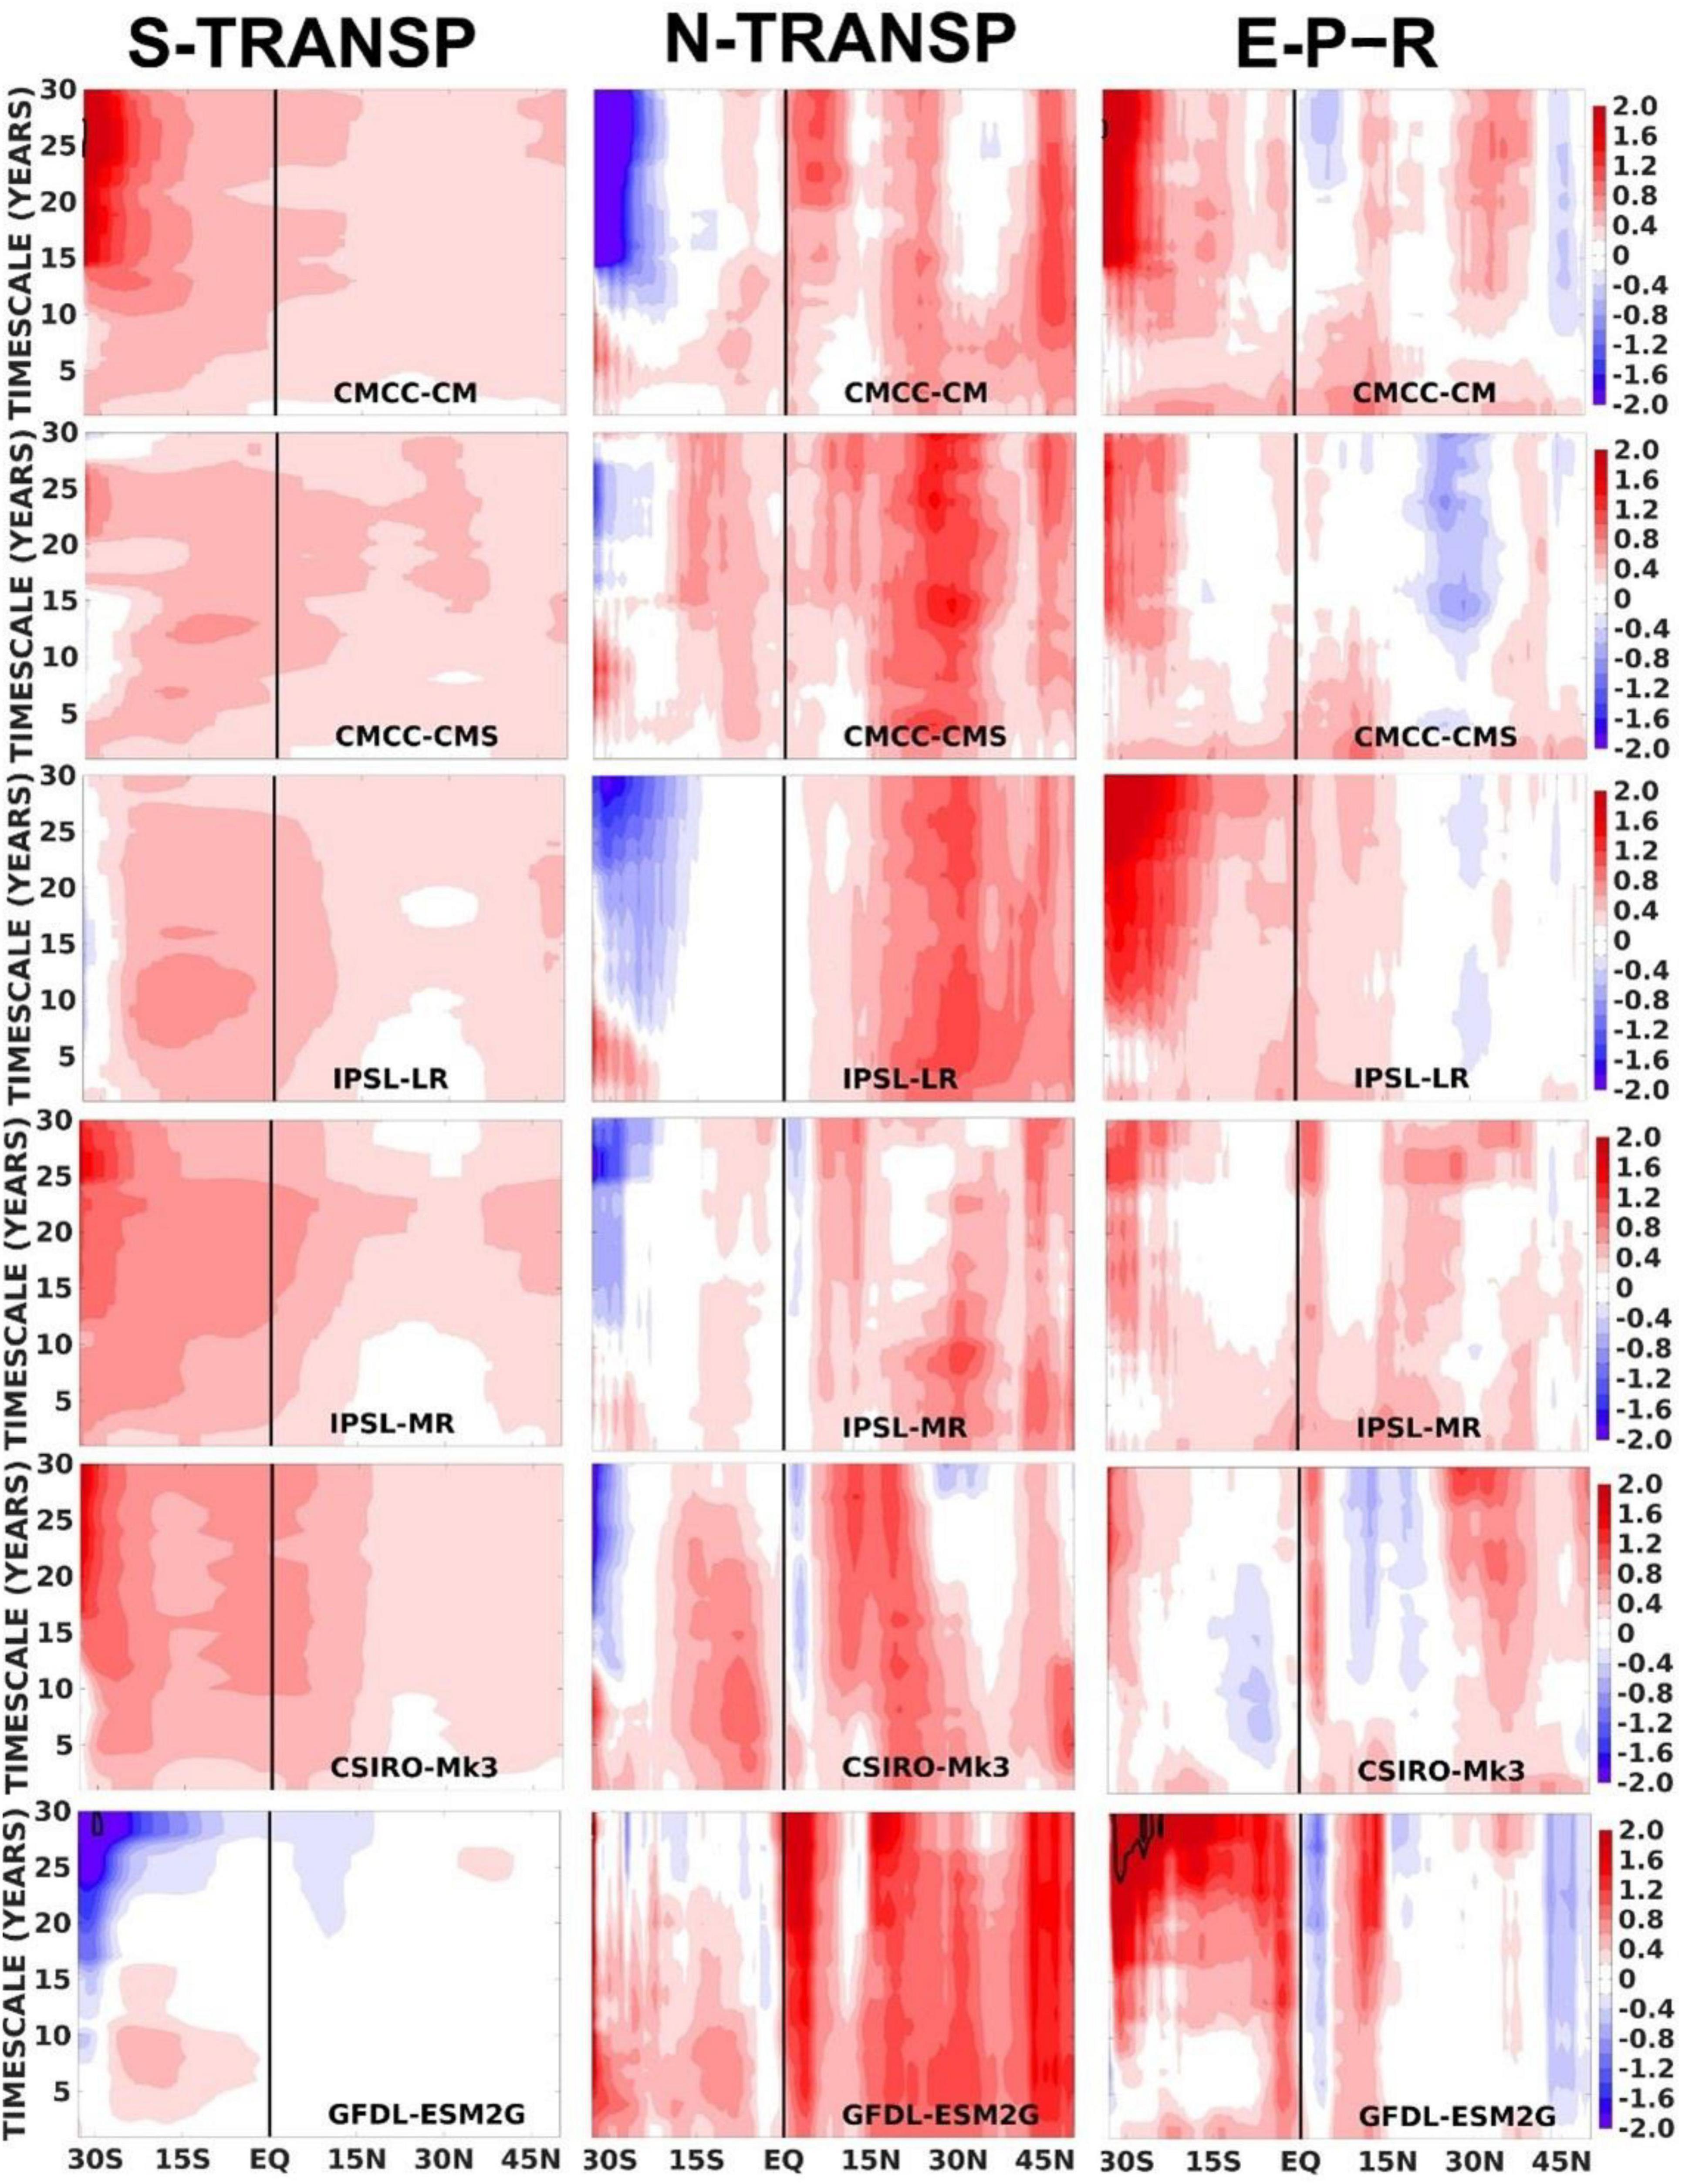
Figure 8. Normalised covariances of the total southern transports, total northern transports and E-P-R with FWC changes as in Eq. 8, considering a fixed southern boundary at 34°S and a moving northern boundary from 33°S to 50°N. The spatially varying normalised covariances are evaluated from interannual to multidecadal timescales. The black contours correspond to either negative or positive normalised co-variance values >3.
Although there are common patterns in the budgets, such as the clear dominance of Fgyre34S over Fov34S in contributing to FWC changes in the South Atlantic, it is evident that the budgets do greatly vary among these CMIP5 models. Considering only the budget domain between 34°S and 40°N (Figure 6), some models have E-P-R as the main driver of FWC changes, whereas other models have the advective fluxes, particularly the northern Fov, as the main driver. The models also show very different dominant timescales contributing to FWC variations. In the southern hemisphere, the main outlier is GFDL-ESM2G which has the role of the northern and southern boundaries reversed compared to the other models (Figure 8). However, for larger budget boxes (extending across the equator), the GFDL model shows similar behaviour to other models. Similar CMIP5 variations were also found by Deshayes et al. (2014) in the North Atlantic subpolar freshwater budgets, where the roles of surface fluxes and advection in governing FWC changes were also seen to be model-dependent.
Discussion and Conclusion
The salt-advection feedback is characterised by a feedback loop between the AMOC, the meridional advection of salt, and the meridional density gradient, which was proposed to be triggered by changes in the southern Atlantic. This basin-scale feedback has its origin in simple box models. Here, we have evaluated the internal variability in 10 pre-industrial CMIP5 simulations (Table 1) in an attempt to detect signatures of the salt-advection feedback mechanisms on different timescales.
From these 10 centennial-timescale simulations, two groups of five models are defined, with opposite signs of mean Fov34S. Supporting previous results of Jackson (2013) and Mecking et al. (2017), the Fov34S sign depends on the CMIP5 salinity biases and how they project onto the upper and lower AMOC branches (i.e., ΔS1200m) at 34°S (although these same biases are consistent in all models throughout the South Atlantic). Models with positive Fov34S have a very shallow AAIW layer, showing too fresh waters near the surface and too saline waters at depth in the South Atlantic (i.e., ΔS1200m < 0). Conversely, models with negative Fov34S are closer to observations but still tend to show the opposite bias structure, being too saline mainly in the lower thermocline, 500–1200 m, and too fresh at deeper levels (i.e., ΔS1200m > 0). In addition to the sign of Fov, ΔS1200m also controls its magnitude, explaining 90% of the inter-model spread in Fov34S. This reinforces the findings of Mignac et al. (2019) that Fov strength is primarily determined by the salinity contrasts between the upper and lower branches of the AMOC, rather than by the AMOC strength itself, throughout the South Atlantic.
The dominance of the salinity in determining the southern Fov also extends to the time variability, particularly on 5-year and longer timescales. For instance, in 7 out of 10 CMIP5 models, decadal Fov anomalies between 34°S and 20°S are determined by local salinity variations, rather than local circulation changes. In the northern subtropics (i.e., 26°N–40°N), however, it is the meridional velocity which clearly dominates Fov variability in all models and on all timescales. This evidence, built upon the variability of multiple climate models, is then not consistent with the box-model assumption that southern Fov fluctuations are primarily dominated by circulation rather than salinity changes, at least on 5-year and longer timescales.
The AMOC salt-advection feedback also relies on Fov being able to alter the N-S FWC differences on some timescale, which can then drive AMOC changes (Rahmstorf, 1996). However, FWC variability, and therefore meridional N-S FWC differences, are always dominated by FWC changes in the northern hemisphere rather than in the southern ocean in all CMIP5 models. This is shown by the role of the North Atlantic in governing the long-term variability of the north-south density gradients (Danabasoglu, 2008; de Boer et al., 2010; Cheng et al., 2018). This therefore implies that Fov34S would have to influence the FWC well into the northern hemisphere before AMOC feedbacks could occur.
We then show that the FWC budget in 6 of the models can be closed within ∼10%, neglecting GM advection and lateral diffusion terms which are not available, and that the Fov34S contribution to driving FWC changes on all timescales is restricted to the South Atlantic, and even then is always smaller than the influence of Fgyre34S. We also find that the surface fluxes, E-P-R, drive as much variability in the South Atlantic FWC as the total 34°S transports, with freshwater transports from the north tending to oppose FWC changes on longer timescales.
As the domain gets larger to include both the South and North Atlantic, the Fov in the northern hemisphere, along with E-P-R, become the most important contributors to FWC change, although Fgyre34S may also contribute weakly on 30-year timescales in some models. These general conclusion about the budgets must be seen in the context of large differences across CMIP5 models. As in Deshayes et al. (2014), the roles of surface fluxes and advection in governing basin-wide FWC changes vary greatly depending on the specific CMIP5 model.
All the evidence gathered here from the internal variability of 10 centennial-scale simulations seems to refute any role for the South Atlantic in salt-advection feedbacks effects on AMOC strength. This is the case for all CMIP5 models in Table 1, regardless of their mean sign, and it strongly suggests that is not a useful metric for assessing AMOC stability. Additional targeted numerical experiments, where the system is forced to change more systematically than the natural variability studied in these control runs, may shed more light on other feedbacks and mechanisms controlling the AMOC behaviour.
Data Availability Statement
The CMIP5 data used for this study are all freely available from global repositories, and were originally downloaded from PCMDI (https://pcmdi.llnl.gov/mips/cmip5/).
Author Contributions
All technical work and production of figures were performed by DM as part of his Ph.D. thesis. The first draft of this work appears in Mignac (2020). The rewriting of the work into a manuscript was performed by KH and DF. All authors contributed to the article and approved the submitted version.
Funding
DM like to acknowledge the financial support of the CAPES Foundation, Brazil (proc. BEX 1386/15−8) in supporting these studies. Supervisors KH and DM also acknowledge the support of NCEO strategic grant in developing this work.
Conflict of Interest
The authors declare that the research was conducted in the absence of any commercial or financial relationships that could be construed as a potential conflict of interest.
Publisher’s Note
All claims expressed in this article are solely those of the authors and do not necessarily represent those of their affiliated organizations, or those of the publisher, the editors and the reviewers. Any product that may be evaluated in this article, or claim that may be made by its manufacturer, is not guaranteed or endorsed by the publisher.
Acknowledgments
This work was performed as part of the Ph.D. research of DM.
Supplementary Material
The Supplementary Material for this article can be found online at: https://www.frontiersin.org/articles/10.3389/fmars.2022.830821/full#supplementary-material
References
Biastoch, A., Böning, C., and Lutjeharms, J. (2008). Agulhas leakage dynamics affects decadal variability in Atlantic overturning circulation. Nature 456, 489–492. doi: 10.1038/nature07426
Bryden, H. L., and Imawaki, S. (2001). “Ocean heat transport,” in Ocean Circulation and Climate, eds G. Siedler, J. Church, and J. Gould (London: Academic Press), 455–474.
Cheng, W., Weijer, W., Kim, W. M., Danabasoglu, G., Yeager, S. G., Gent, P. R., et al. (2018). Can the salt-advection feedback be detected in internal variability of the atlantic meridional overturning circulation? J. Clim. 31, 6649–6667. doi: 10.1175/JCLI-D-17-0825.1
Danabasoglu, G. (2008). On multidecadal variability of the Atlantic meridional overturning circulation in the community climate system model version 3. J. Clim. 21:55245544. doi: 10.1175/2008JCLI2019.1
Danabasoglu, G. S. C. B., Briegleb, B. P., Jayne, S. R., Jochum, M., Large, W. G., Peacock, S., et al. (2012). The CCSM4 ocean component. J. Clim. 25, 1361–1389. doi: 10.1175/jcli-d-11-00091.1
de Boer, A. M., Gnanadesikan, A., Edwards, N. R., and Watson, A. J. (2010). Meridional density gradients do not control the Atlantic overturning circulation. J. Phys. Oceanogr. 40, 368–380.
De Vries, P., and Weber, S. L. (2005). The Atlantic freshwater budget as a diagnostic for the existence of a stable shut down of the meridional overturning circulation. Geophys. Res. Lett. 32:1450. doi: 10.1029/2004GL021450
Deshayes, J., Curry, R., and Msadek, R. (2014). CMIP5 model intercomparison of freshwater budget and circulation in the North Atlantic. J. Clim. 27, 3298–3317.
Dijkstra, H. A. (2007). Characterization of the multiple equilibria regime in a global ocean model. Tellus Dyn. Meteorol. Oceanogr. 59, 695–705. doi: 10.1111/j.1600-0870.2007.00267.x
Drijfhout, S. S., Weber, S. L., and van der Swaluw, E. (2011). The stability of the MOC as diagnosed from model projections for pre-industrial, present and future climates. Clim. Dyn. 37, 1575–1586. doi: 10.1007/s00382-010-0930-z
Dufresne, J.-L., Foujols, M. A., Denvil, S., Caubel, A., Marti, O., Aumont, O., et al. (2013). Climate change projections using the IPSL-CM5 earth system model: from CMIP3 to CMIP5. Clim. Dyn. 40, 2123–2165.
Dunne, J., John, J., Shevliakova, E., Ronald, S., Krasting, J., Malyshev, S., et al. (2013). GFDL’s ESM2 global coupled climate–carbon earth system models. part II: carbon system formulation and baseline simulation characteristics. J. Clim. 26, 2247–2267. doi: 10.1175/JCLI-D-12-00150.1
Ferreira, D., Cessi, P., Coxall, H. K., de Boer, A., Dijkstra, H. A., Drijfhout, S. S., et al. (2018). Atlantic-pacific asymmetry in deep water formation. Ann. Rev. Earth Plan. Sci. 46, 327–352.
Garzoli, S. L., Baringer, M. O., Dong, S., Perez, R., and Yao, Q. (2013). South atlantic meridional fluxes. Deep Sea Res. Part I 71, 21–32. doi: 10.1038/nature05222
Gent, P. R. (2018). A commentary on the Atlantic meridional overturning circulation stability in climate models. Ocean Mod. 122, 57–66. doi: 10.1016/j.ocemod.2017.12.006
Gent, P. R., and McWilliams, J. C. (1990). Isopycnal mixing in ocean circulation models. J. Phys. Oceanogr. 20, 150–155. doi: 10.1175/1520-0485(1990)020<0150:imiocm>2.0.co;2
Gordon, H., O’Farrell, S., Collier, M., Dix, M., Rotstayn, L., Kowalczyk, E., et al. (2010). The CSIRO Mk3.5 Climate Model, CAWCR Technical Report No. 021. Available online at: www.cawcr.gov.au/technical-reports/CTR_021.pdf (accessed March 15, 2019).
Hawkins, E., Smith, R. S., Allison, L. C., Gregory, J. M., Woolings, T. J., Pohlmann, H., et al. (2011). Bistability of the Atlantic overturning circulation in a global climate model and links to ocean freshwater transport. Geophys. Res. Lett. 38:208. doi: 10.1029/2011GL047208
Huisman, S. E., den Toom, M., Dijkstra, H. A., and Drijfhout, S. S. (2010). An indicator of the multiple equilibria regime of the Atlantic meridional overturning circulation. J. Phys. Oceanogr. 40, 551–567. doi: 10.1175/2009JPO4215.1
Jackson, L. C. (2013). Shutdown and recovery of the AMOC in a coupled global climate model: the role of the advective feedback. Geophys. Res. Lett. 40, 1182–1188.
Ji, D., Wang, L., Feng, J., Wu, Q., Cheng, H., Zhang, Q., et al. (2014). Description and basic evaluation of beijing normal university earth system model (BNU-ESM) version 1. Geosci. Model Dev. 7, 2039–2064.
Kim, H.-J., An, S.-I., Kim, S.-K., and Park, J.-H. (2021). Feedback processes modulating the sensitivity of atlantic thermohaline circulation to freshwater forcing timescales. J. Clim. 34, 5081–5092. doi: 10.1175/JCLI-D-20-0897.1
Mecking, J. V., Drijfhout, S. S., Jackson, L. C., and Andrews, M. B. (2017). The effect of model bias on Atlantic freshwater transport and implications for AMOC bi-stability. Tellus 69, 1–14. doi: 10.1175/jcli-d-20-0614.1
Mecking, J. V., Drijfhout, S. S., Jackson, L. C., and Graham, T. (2016). Stable AMOC off state in an eddy-permitting coupled climate model. Clim. Dyn. 47, 2455–2470.
Mignac, D., Ferreira, D., and Haines, K. (2019). Decoupled freshwater transport and meridional overturning in the south Atlantic. GRL 46, 2178– 2186.
Mignac, D. (2020). Atlantic Transports From Free Model Runs, Reanalyses and Coupled Simulations, Ph. D, Thesis. University of Reading.
Qiao, F., Song, Z., Bao, Y., Song, Y., Shu, Q., Huang, C., et al. (2013). Development and evaluation of an earth system model with surface gravity waves. J. Geophys. Res. Oceans 118, 4514–4524. doi: 10.1002/jgrc.20327
Rahmstorf, S. (1996). On the freshwater forcing and transport of the Atlantic thermohaline circulation. Clim. Dyn. 12, 799–811.
Rahmstorf, S., Crucifix, M., Ganopolski, A., Goosse, H., Kamenkovich, I., Knutti, R., et al. (2005). Thermohaline circulation hysteresis: a model intercomparison. Geophys. Res. Lett. 35:L23605.
Redi, M. H. (1982). Oceanic isopycnal mixing by coordinate rotation. J. Phys. Oceanogr. 12, 1154–1158.
Sallée, J. B., Shuckburgh, E., Bruneau, N., Meijers, A., Wang, Z., and Bracegirdle, T. (2013). Assessment of southern ocean water mass circulation in CMIP5 models: historical bias and forcing response. J. Geophys. Res. 118, 1830–1844.
Scoccimarro, E., Gualdi, S., Bellucci, A., Sanna, A., Fogli, P. G., Manzini, E., et al. (2011). Effects of tropical cyclones on ocean heat transport in a high-resolution coupled general circulation model. J. Clim. 24, 4368–4384.
Sijp, W. P. (2012). Characterising meridional overturning bistability using a minimal set of state variables. Clim. Dyn. 39, 2127–2142. doi: 10.1007/s00382-011-1249-0
Stouffer, R. J., Yin, J., Gregory, J., Dixon, K., Spelman, M., Hurlin, W., et al. (2006). Investigating the causes of the response of the thermohaline circulation to past and future climate changes. J. Clim. 19, 1365–1387. doi: 10.1175/JCLI3689.1
Taylor, K. E., Stouffer, R. J., and Meehl, G. A. (2012). An overview of CMIP5 and the experiment design. BAMS 485–498.
Xin, X.-G., Tong-Wen, W., and Jie, Z. (2015). Introduction of CMIP5 experiments carried out with the climate system models of beijing climate center. Adv. Clim. Change Res. 4, 41–49.
Yin, J., and Stouffer, R. J. (2007). Comparison of the stability of the Atlantic thermohaline circulation in two coupled atmosphere-ocean general circulation models. J. Clim. 20, 4293–4315.
Keywords: Atlantic freshwater, AMOC stability, CMIP5 models, southern FOV, Atlantic salinity balance
Citation: Haines K, Ferreira D and Mignac D (2022) Variability and Feedbacks in the Atlantic Freshwater Budget of CMIP5 Models With Reference to Atlantic Meridional Overturning Circulation Stability. Front. Mar. Sci. 9:830821. doi: 10.3389/fmars.2022.830821
Received: 07 December 2021; Accepted: 14 February 2022;
Published: 14 March 2022.
Edited by:
Fabrice Hernandez, Institut de Recherche Pour le Développement (IRD), FranceReviewed by:
Wei Cheng, University of Washington, United StatesRobert Marsh, University of Southampton, United Kingdom
Jiang Zhu, National Center for Atmospheric Research (UCAR), United States
Shantong Sun, California Institute of Technology, United States
Copyright © 2022 Haines, Ferreira and Mignac. This is an open-access article distributed under the terms of the Creative Commons Attribution License (CC BY). The use, distribution or reproduction in other forums is permitted, provided the original author(s) and the copyright owner(s) are credited and that the original publication in this journal is cited, in accordance with accepted academic practice. No use, distribution or reproduction is permitted which does not comply with these terms.
*Correspondence: Keith Haines, ay5oYWluZXNAcmVhZGluZy5hYy51aw==
†Present address: Davi Mignac, The Met. Office, Exeter, United Kingdom
 Keith Haines
 David Ferreira
 Davi Mignac