 Tammy L. Silva1*
 Kevin D. Powers1
 Jooke Robbins2Regina Asmutis-Silvia3Timothy V. N. Cole4Alex N. Hill5
 Laura J. Howes6,7
 Charles A. Mayo2Dianna Schulte8
 Michael A. Thompson1Linda J. Welch9
 Alexandre N. Zerbini10,11
 David N. Wiley1
- 1National Oceanic and Atmospheric Administration (NOAA) Stellwagen Bank National Marine Sanctuary, Scituate, MA, United States
- 2Humpback Whale Studies Program, Center for Coastal Studies, Provincetown, MA, United States
- 3Whale and Dolphin Conservation, Plymouth, MA, United States
- 4Protected Species Branch, National Oceanic and Atmospheric Administration (NOAA) Northeast Fisheries Science Center, Woods Hole, MA, United States
- 5Dolphin Fleet Whale Watch, Provincetown, MA, United States
- 6Boston Harbor City Cruises, Boston, MA, United States
- 7Biology Department, University of Massachusetts Boston, Boston, MA, United States
- 8Blue Ocean Society for Marine Conservation, Portsmouth, NH, United States
- 9U.S. Fish and Wildlife Service Maine Coastal Islands National Wildlife Refuge (NWR), Rockland, ME, United States
- 10Cooperative Institute for Climate, Ocean, and Ecosystem Studies (CICOES), University of Washington & Marine Mammal Laboratory, Alaska Fisheries Science Center, National Oceanic and Atmospheric Administration (NOAA), Seattle, WA, United States
- 11Marine Ecology and Telemetry Research, Seabeck, WA, United States
Vessel strike and entanglement in fishing gear are global threats to large whales. United States management actions to reduce human-induced serious injury and mortality to large whales have been inadequate, partially due to static, spatial protection schemes that fail to adjust to distribution shifts of highly mobile animals. Whale conservation would benefit from dynamic ocean management, but few tools exist to inform dynamic approaches. Seabirds are often found in association with whales and can be tagged at lower cost and in higher numbers than whales. We explored the use of satellite-tagged seabirds (great shearwaters) as dynamic ocean management tools for near real-time identification of habitats where humpback and North Atlantic right whales aggregate, potentially increasing anthropogenic risk. We identified shearwater habitat use areas in the Gulf of Maine with 50% kernel density utilization distributions at yearly, monthly, and weekly scales using satellite-telemetry data from 2013-2018. We quantified overlap using whale sightings and whale satellite telemetry data at two spatial scales: Stellwagen Bank National Marine Sanctuary and the Gulf of Maine. Within the sanctuary, shearwaters overlapped with >50% of humpback sightings in 4 of 6 (67%) years, 15 of 23 (65%) months, and 50 of 89 (56%) of weeks. At the Gulf of Maine scale, shearwater use areas overlapped >50% of humpback sightings in 5 of 6 years (83%) and 16 of 22 (73%) months, and encompassed humpback 50% utilization distributions (based on satellite telemetry) in 2 of 3 (66%) years and 7/12 (58%) months analyzed. Overlap between shearwaters and right whales was much lower, with >50% overlap in only 1 of 6 (17%) years and 3 of 23 (13%) months. These initial results demonstrate that satellite-tagged shearwaters can be indicators of humpback whale habitat use in both space and time. With further study, tagged shearwaters may provide near-real time information necessary to operationalize dynamic management to mitigate human impacts on humpback whales.
Introduction
Vessel strikes and entanglement in fishing gear are global conservation concerns for baleen whales. Interactions with vessels and gear have been documented for nearly all baleen whale species (Laist et al., 2001; van der Hoop et al., 2013), are increasing in some parts of the world (Davies and Brillant, 2019; Santora et al., 2020; Saez et al., 2020) and are the leading sources of human-caused mortality (van der Hoop et al., 2013; Moore et al., 2021; NOAA, 2021a; NOAA, 2021b).
Off the NE U.S., impacts of vessel strike and entanglement to individuals and populations are best documented for humpback (Megaptera novaeangliae) and North Atlantic right whales (Eubalaena glacialis; hereafter right whales). The number of reported entanglements regularly exceed sustainable levels for both species (van der Hoop et al., 2013; Hayes et al., 2018; Hayes et al., 2021) and scar-based studies suggest that additional events go unwitnessed and unreported (Knowlton et al., 2012; Robbins, 2012). Lethal and non-lethal vessel strikes are consistently observed for both species (Wiley et al., 1995; Hill et al., 2017; NOAA, 2021a; NOAA, 2021b). Direct mortality and sub-lethal energetic impacts of entanglement have hindered population recovery for North Atlantic right whales (van der Hoop et al., 2016; van der Hoop et al., 2017; Corkeron et al., 2018; Moore et al., 2021).
Many U.S. management actions have been implemented to reduce entanglements and vessel strikes to large whales (NOAA (National Oceanic and Atmospheric Association), 2008; National Marine Fisheries Service, 2014; National Marine Fisheries Service, 2015). However, previous work, recent and/or ongoing Unusual Mortality Events for both species and the continued right whale population decline suggests serious short-comings in U.S. management (Silber et al., 2012; van der Hoop et al., 2013; van der Hoop et al., 2015; Moore et al., 2021; NOAA, 2021a; NOAA, 2021b; Pettis et al., 2022). While many factors influence outcomes of management decisions, one potential factor hindering success is the spatial and temporal mismatch between management and actual whale distributions.
Mandatory U.S. spatial management schemes do not account for distribution shifts of highly mobile animals that are responding to a dynamic ocean environment. Updates to spatial management often lag years behind actual animal distribution shifts. For example, managed areas and restricted areas aiming to reduce vessel strikes and entanglements in fixed gear fisheries, respectively, off the NE U.S. are based on the historical, seasonal distributions of right whales (Supplementary Figure 1; NOAA (National Oceanic and Atmospheric Association), 2008; National Marine Fisheries Service, 2021). Once established, managed and restricted areas remain in place for the duration of the regulatory period (two to five months or longer if whales remain in the area), even if no whales are present within the boundaries, and do not expand or shift to encompass whales outside the boundaries. In addition, the U.S. lacks mechanisms for implementing temporary, short-term, emergency management measures without a formal rule-making process when whales shift to unregulated areas, which will likely increase with climate-driven changes in oceanography and prey distributions (Davies and Brillant, 2019; Record et al., 2019). Mitigation of vessel strike and entanglement would benefit from a management scheme as fluid in space and time as ocean conditions, mobile species, and human users.
Dynamic ocean management (DOM) aims to meet this need by adaptively matching management strategies to the spatial and temporal scales of dynamic ocean processes, living marine resources, and users. DOM integrates near real-time biological, oceanographic, social and/or economic data to guide flexible management actions that rapidly shift in space and time (sensu Hobday et al., 2010). Using near real-time data to tailor management may allow temporal and spatial scales of management areas to dynamically shrink or expand, enabling the most effective protection in terms of mitigating impacts to resources and users. Coupling dynamic strategies with static management areas could preserve benefits of permanent protected areas while filling gaps in protection in response to variable species distributions (Tittensor et al., 2019). Additionally, dynamic management could occur within static protected areas, leveraging previously identified important areas but targeting management actions within them in response to real-time information. The ability to balance ecological and economic values to meet multiple objectives and reduce conflict among stakeholder groups is a major benefit of DOM (Lewison et al., 2015; Maxwell et al., 2015).
A handful of DOM tools and applications are currently in practice (Beacham et al., 2004; Howell et al., 2008; Hobday et al., 2011; Holmes et al., 2011; O’Keefe and DeCelles, 2013; Wiley et al., 2013; Howell et al., 2015; Little et al., 2015; Hazen et al., 2017; Hazen et al., 2018). All these tools collect one or more types of near real-time data and output a product to inform users and managers, but they differ in the complexity of data processing and consideration of user behavior or stakeholder input in the final product (Lewison et al., 2015; Maxwell et al., 2015). Whale Alert and EcoCast are examples of simple and more complex DOM tools, respectively (Wiley et al., 2013; Hazen et al., 2018). Other DOM tools fall within these two extremes; however, no existing DOM tools leverage near real-time locations provided by satellite-tagged animals to gather data on animal distributions that are current and most relevant for management.
Based on their unique life-history characteristics, seabirds equipped with satellite tags could serve as valuable tools for implementing dynamic management. Procellariid seabirds are highly mobile, enabling them to respond quickly to changing environmental conditions over large spatial scales and their top position in food webs means their location may indicate areas of high forage fish abundance. Their role as ecological indicators (Velarde et al., 2019) position seabirds as attractive sentinels for monitoring changes in marine ecosystems, fluctuations in abundance and distribution of forage fishes, and for identifying areas of high productivity where top predators, including whales and ocean users may congregate. Further, tags applied to seabirds are less expensive, less invasive, and can last longer than tags on large whales.
Great shearwaters (Ardenna gravis; hereafter shearwaters) are one of the most common pelagic seabirds in the Gulf of Maine (GOM) (Powers, 1983), including in Stellwagen Bank National Marine Sanctuary (SBNMS), a 2180 km2 federal marine protected area (MPA) (SBNMS unpublished data). In the sanctuary, shearwaters overlap with humpback whales. Both species consistently overlap with sand lance (Ammodytes dubius), their preferred prey in this region (Payne et al., 1986; Powers et al., 2020; Silva et al., 2020) and shearwaters are often seen foraging with surface-feeding humpback whales. Sand lance are also found in specific, sandy substrates and previous work also shows that humpbacks and shearwaters use many of the same habitats throughout the GOM (Robbins, 2007; Powers et al., 2017; Powers et al., 2020). This suggests that satellite-tagged great shearwaters could indicate humpback whale locations at wider scales, and that some of these static locations may lend themselves to dynamic management. While the idea of investigating the use of tagged shearwaters to locate humpback whale aggregations is supported by previous work, considering tagged shearwaters as indicators of right whales is also of interest for two reasons: 1) they are critically endangered and management tools to drastically reduce vessel strikes and entanglements is desperately needed and 2) right whales and sand lance in the GOM feed primarily on copepods, including Calanus finmarchicus (Wishner et al., 1995; Murison and Gaskin, 1989; Mayo and Marx, 1990; Suca et al., 2021), making it plausible that shearwaters feeding on sand lance may overlap with right whales.
Here, our goal was to explore the use of satellite-tagged great shearwaters as a near real-time dynamic management tool to identify habitats where humpback and/or right whales may aggregate and be at increased anthropogenic risk. To this end, we quantified spatial overlap between satellite-tagged shearwaters with both humpback and right whales at multiple spatial and temporal scales to explore potentially feasible management scales, where shearwater distributions could represent management areas.
Methods
Datasets
We used several existing datasets in our analysis collected throughout the GOM and within SBNMS located in the SW GOM. The Gulf of Maine represents important foraging habitat for shearwaters, humpbacks, and right whales. We also focused specifically on SBNMS based on previous work identifying strong overlap between shearwaters and humpbacks (Silva et al., 2020), availability of high-resolution sightings data, and its role in marine mammal protection as a MPA. Datasets included: 1) great shearwater satellite telemetry 2) humpback whale satellite telemetry 3) humpback whale sightings in SBNMS 4) humpback whale sightings from Gulf of Maine surveys, and 5) North Atlantic right whale sightings. A brief description of each dataset follows.
Great Shearwater Satellite Telemetry
Shearwaters were tagged off the coast of Massachusetts in the southwestern Gulf of Maine each year from 2013 to 2018 (Powers et al., 2017; Powers et al., 2020). Briefly, we used small vessels to access birds at known foraging areas and attracted birds to the vessel using cut fish and squid. Once they were close enough to the vessel, birds were caught with handled landing nets.
Solar PTT-100 tags (15 g, Microwave Telemetry, 8835 Columbia 100 Parkway, Suites K & L, Columbia, MD 21045, USA) were used with duty cycles of 24-hr [on] (i.e., continuous). Tags were attached dorsally, central to the body mass of the bird below the nape and between the wings, using four subcutaneous sutures (Prolene suture 4.0 Ethicon) as per MacLeod et al. (2008), and represented less than 3% of body mass for all tagged birds to minimize effects on flight efficiency (see Phillips et al., 2003). Tags were typically deployed in July except for 2017 when birds were tagged in August. Data from 58 birds were used in analyses.
Humpback Whale Satellite Telemetry
Humpback whales were tagged in the SW GOM in 2013, 2015, and 2018 as part of a study to evaluate the effectiveness of satellite tags and their impacts (Robbins et al., 2013). Because part of the study design involved follow-up monitoring of tagged whales to assess and evaluate impacts, individuals were prioritized for tagging based on known demographic traits and re-sighting history (Robbins et al., 2013). Therefore, tagging was not random, and we note that distributions of tagged whales may be representative of humpbacks with high fidelity to the southwestern GOM and not necessarily of the entire GOM population. Location-only, consolidated (type C, Andrews et al., 2019) implantable Argos satellite tags were deployed using a pneumatic line-thrower (Heide-Jorgensen et al., 2001) as described in Robbins et al. (2013). Tags were programmed to transmit daily from 06:00-18:00 hours GMT with a maximum of 500 transmissions per day. Data from 38 whales were used in analyses.
Humpback Sightings Within SBNMS
We used opportunistic sightings of humpback whales from whale watching trips and research cruises in SBNMS from 2013-2018. Near daily whale watching trips run from several Massachusetts ports and frequent the sanctuary. Sightings data, including identifications of individual humpbacks, are shared with and compiled by the Center for Coastal Studies Provincetown. Research cruises are run by the Center for Coastal Studies with the goal of photo-documenting and identifying as many individual humpbacks as possible. Therefore, cruises were not standardized. To eliminate duplicate sightings and over-inflation of numbers, we chose one sighting of each individual whale, per day.
Humpback Sightings From GOM Surveys
Sightings data were collected during annual humpback whale population surveys conducted by the Center for Coastal Studies’ from Nantucket, Massachusetts to Nova Scotia, Canada. We note that the survey is not standardized but designed to target historical humpback whale aggregation sites (banks, ledges, etc.) within the GOM and Bay of Fundy to photographically document as many individuals as possible. Survey effort varies somewhat each year based on weather and resources and regional effort was expended proportional to encountered whale densities. Effort was greatest in July-August and only extended into October in some years. Locations of individually identified humpback whales were used in analyses. To avoid duplicate sightings and over-inflation of numbers, we chose one sighting of each individual whale, per day. We used a 10 km buffer around ship GPS locations to create polygons to visually represent yearly survey effort.
North Atlantic Right Whale Sightings
We used right whale sightings curated by the North Atlantic Right Whale Consortium (NARWC). These data are a combination of opportunistic, aerial and shipboard sightings from 2013-2018 (North Atlantic Right Whale Consortium, 2021). Sightings data included the number of individual right whales documented at each location. To make data comparable with the humpback sightings data (number of individuals), we duplicated sightings locations based on the number of individuals recorded so that each individual whale had its own unique record.
Data Analysis
We limited our analysis to the months of July-October, months in which data were available from tagging, surveys and opportunistic platforms. Our study focused on the GOM (including Georges Bank). We defined the GOM extent as 40° - 45° latitude and west of -65° longitude and all data outside these bounds were excluded.
We included all Argos location classes from satellite telemetry data (3, 2, 1, 0, A, B) in our analysis. Bursts of points, which are common in Argos datasets when multiple location messages are received over short periods of time, were thinned to avoid bias. For each tagged individual (birds and whales), a threshold of 0.2 for the median sampling interval was used to identify a burst of points. Bursts were thinned to one location.
Utilization distributions (UDs) for 50% kernel density isopleths were derived for shearwaters and humpback whales using satellite telemetry data with the adehabitatHR package (Calenge, 2006) in R 3.6.2 (R Core Team, 2019) using Universal Transverse Mercator (UTM) projections. We combined shearwater data for each year, month, and week across the study period and created 50% UDs for each temporal scale. Since the computation of the kernel density UD is sensitive to the number of locations, we excluded weeks that had less than 100 shearwater locations. Range size for each UD and the number of Argos locations used to construct the UD was also calculated. We created 50% UDs using the same procedure for satellite tagged humpback whales in each year and month of the study period.
We quantified spatial overlap between shearwaters and whales by calculating the percentage of humpback or right whale sightings (here, each sighting is an individual) or the humpback UD that fell within the shearwater UD. We calculated overlap between shearwaters and humpback whales in each year and month at the SBNMS and GOM scales using sightings data and satellite telemetry data. The high resolution (near-daily) of sightings data within SBNMS allowed us to also calculate weekly overlap in the sanctuary. For right whales, we calculated overlap with shearwaters for each year, month, and week throughout the GOM. We chose to quantify spatial overlap with simple percentages to accommodate multiple data types and to provide an easily interpretable metric that takes advantage of the unique strength of our whale data and their applicability to near real-time management; namely, high resolution sightings of individually identified humpback whales.
Results
Numbers of shearwaters tagged each year ranged from eight to eleven (Table 1). However, the number of tags in the study area decreased over time for a variety of reasons, including birds leaving the area or tag failures (Table 2). In some years, weekly UDs relied on as few as two individuals and ~ 200 Argos locations (Supplementary Tables 1–6). Humpbacks were tagged in only three years and numbers of tagged individuals each year ranged from seven to 20 (Tables 1, 2). Humpback and right whale sightings varied across years, months and weeks (Tables 1, 2). Only one month (GOM data) and two weeks (SBNMS data) had zero humpback sightings, while many weeks had zero, one or two right whale sightings (Supplementary Tables 1–6).

Table 1 Tagging and sightings data summaries used in annual calculations for each year 2013-2018.
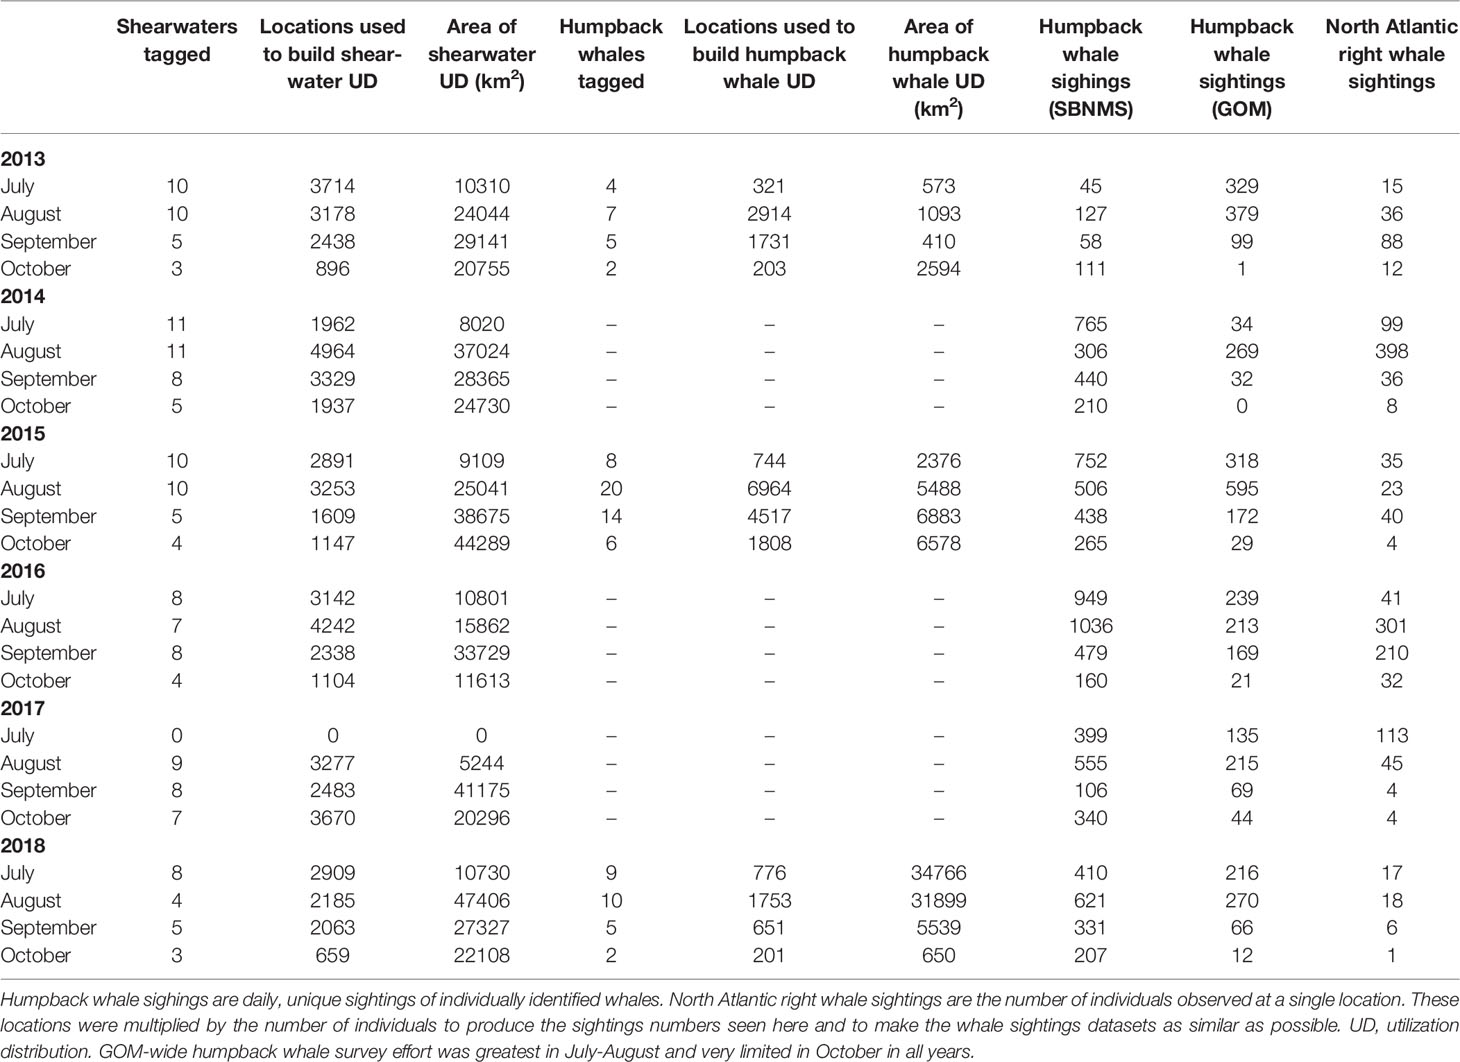
Table 2 Tagging and sightings data summaries used in monthly calculations for each month 2013-2018.
Annual Overlap
Annual overlap between shearwaters and humpbacks was high in SBNMS, except for 2013 and 2018. No tagged shearwaters used the sanctuary in 2013 and minimal use in 2018 resulted in no overlap for these years. From 2014 to 2017, 91-100% of sightings within SBNMS overlapped with great shearwater areas (Supplementary Figure 2). Similar patterns in overlap were observed in most years throughout the GOM. From 2014-2017, 77%-88% of sightings fell within shearwater UDs. The lowest overlap occurred in 2018 (26%). Overlap in 2013 was much higher (80%) at the GOM scale (Supplementary Figure 3). While the number of humpback sightings was typically greater in SBNMS, higher number of whale sightings in the GOM in 2013 (SBNMS = 341, GOM = 808) show movement of humpbacks to the south. This is supported by telemetry data, with the entire humpback UD encompassed within the shearwater UD (Supplementary Figure 4). Data collected throughout the GOM (surveys, telemetry) was able to capture humpback locations and overlap with shearwaters when animals were not using the sanctuary. In 2018, results from all three datasets indicate that humpbacks and shearwaters used different areas. Only 15% of the humpback UD overlapped with shearwater areas in 2018 (Supplementary Figure 4). Annual overlap between shearwaters and right whales was much lower. The highest overlap occurred in 2014 at 67%. Three of six years were less than 35% and two years showed 1% overlap (Supplementary Figure 5).
Monthly Overlap
Monthly overlap between shearwaters and humpbacks varied more than annual overlap. In some years monthly overlap was greater than annual overlap, largely due to shifts in numbers of tagged individuals and locations within the study areas. Highest and most consistent levels of overlap occurred throughout 2014 and 2015 in SBNMS. All months in these two years showed ≥ 95% of humpback sightings within shearwater UDs (Figure 1, Supplementary Figure 7). In 2016, overlap was ≥ 90% from July to October, but fell to 29% in October, though many whale sightings fell just outside the shearwater UD (Supplementary Figure 8). Overlap declined slightly overall in 2017, starting at 99% in August and falling to 70% and 74% in September and October, respectively (Supplementary Figure 9). Tagged shearwaters did not use the sanctuary in any month of 2013, resulting in no overlap (Supplementary Figure 6). In 2018, a single tagged bird using SBNMS in October increased overlap from 0 (July-September) to 100% (Supplementary Figure 10).
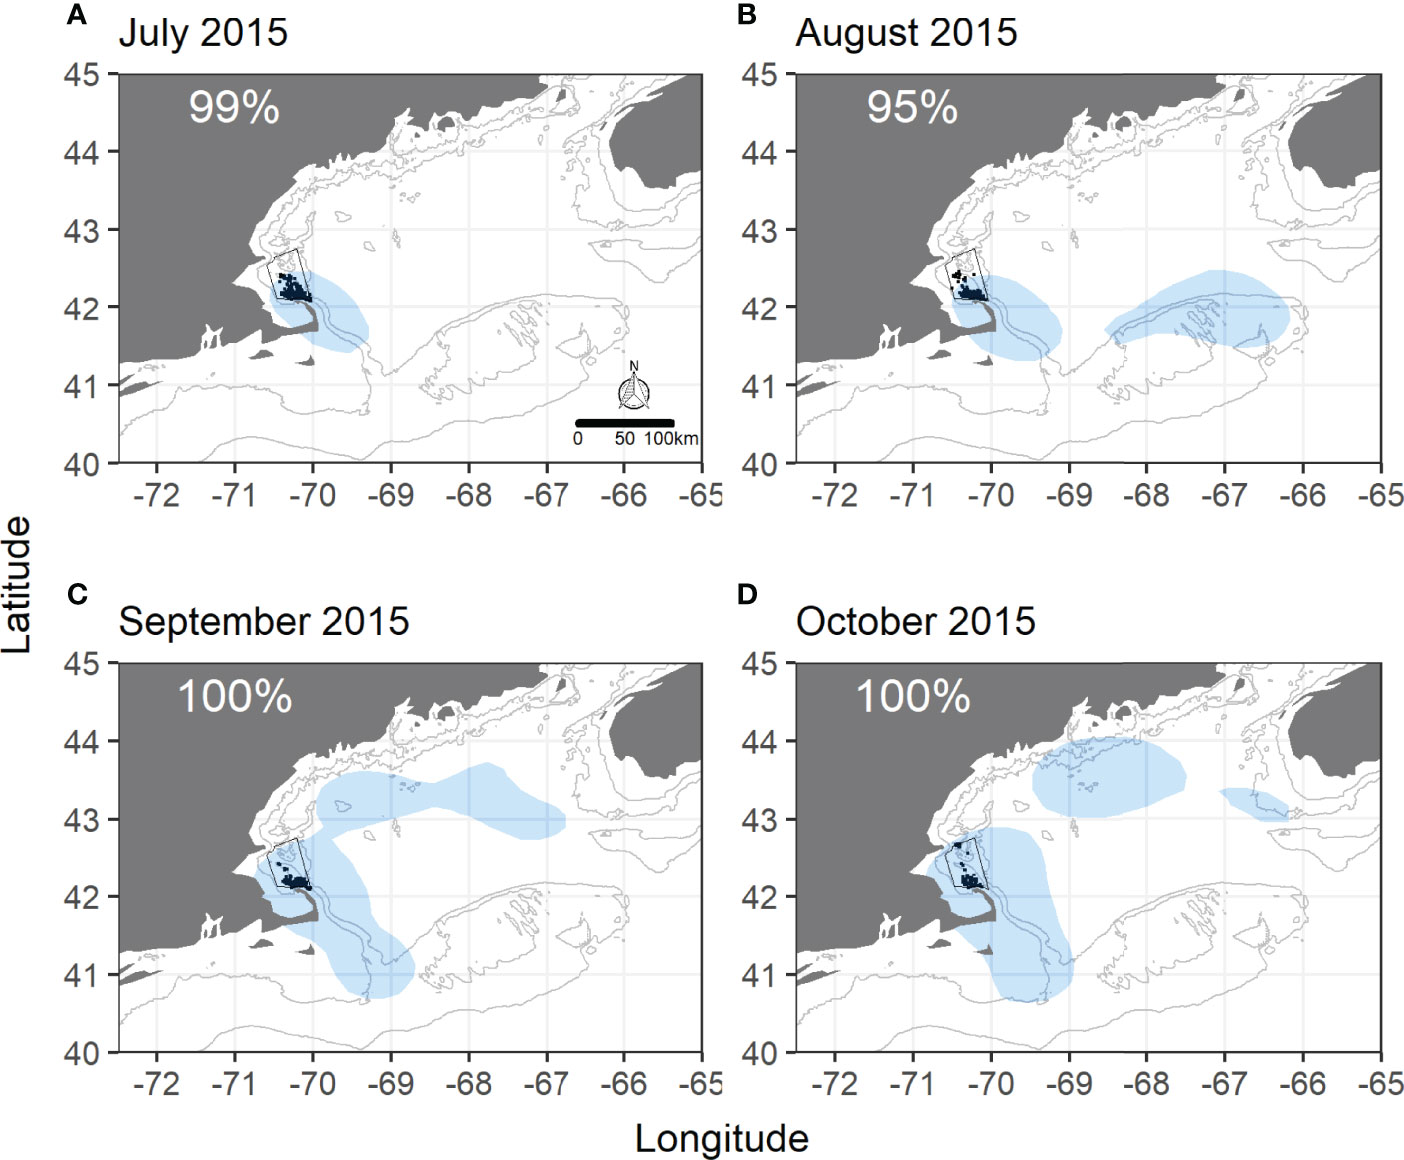
Figure 1 Monthly overlap between great shearwaters and humpback whales within Stellwagen Bank National Marine Sanctuary in 2015. (A) July 2015, (B) August 2015, (C) September 2015, (D) October 2015. Shaded blue areas are shearwater utilization distributions (GOM-wide) from 50% kernel density isopleths. Black dots are daily, unique sightings of individually identified humpback whales in the sanctuary. SBNMS boundaries are in black. Gray lines represent 50m and 100m depth contours. Percentages represent the percentage of humpback sightings within SBNMS falling within the shearwater UD.
GOM overlap showed more variability than SBNMS. Monthly overlap was highest throughout 2015, ranging from 79% to 100% (Figure 2), and lowest in 2018 with two months having ≤ 5% of humpback sightings within shearwater areas (Supplementary Figure 15). While 100% of sightings overlapped in October 2018, there were only 12 sightings for comparison in this month. Satellite telemetry data also showed strong overlap in 2015 with shearwater UDs encompassing 73%- 100% of humpback UDs (Supplementary Figure 17) and low overlap in most months of 2018 (Figure 3). Overlap ranged from 0% to 100% in 2013-2014 and 2016-2017 in the GOM with most values ≥ 50% (Supplementary Figures 11–14).

Figure 2 Monthly overlap between great shearwaters and humpback whales at the Gulf of Maine scale in 2015. (A) July 2015, (B) August 2015, (C) September 2015, (D) October 2015. Shaded blue areas are shearwater utilization distributions (GOM-wide) from 50% kernel density isopleths. Black dots are daily, unique sightings of individually identified humpback whales recorded during GOM-wide humpback whale surveys. SBNMS boundaries are in black. Gray lines represent 50m and 100m depth contours. Percentages represent the percentage of humpback whale sightings falling within the shearwater UD.
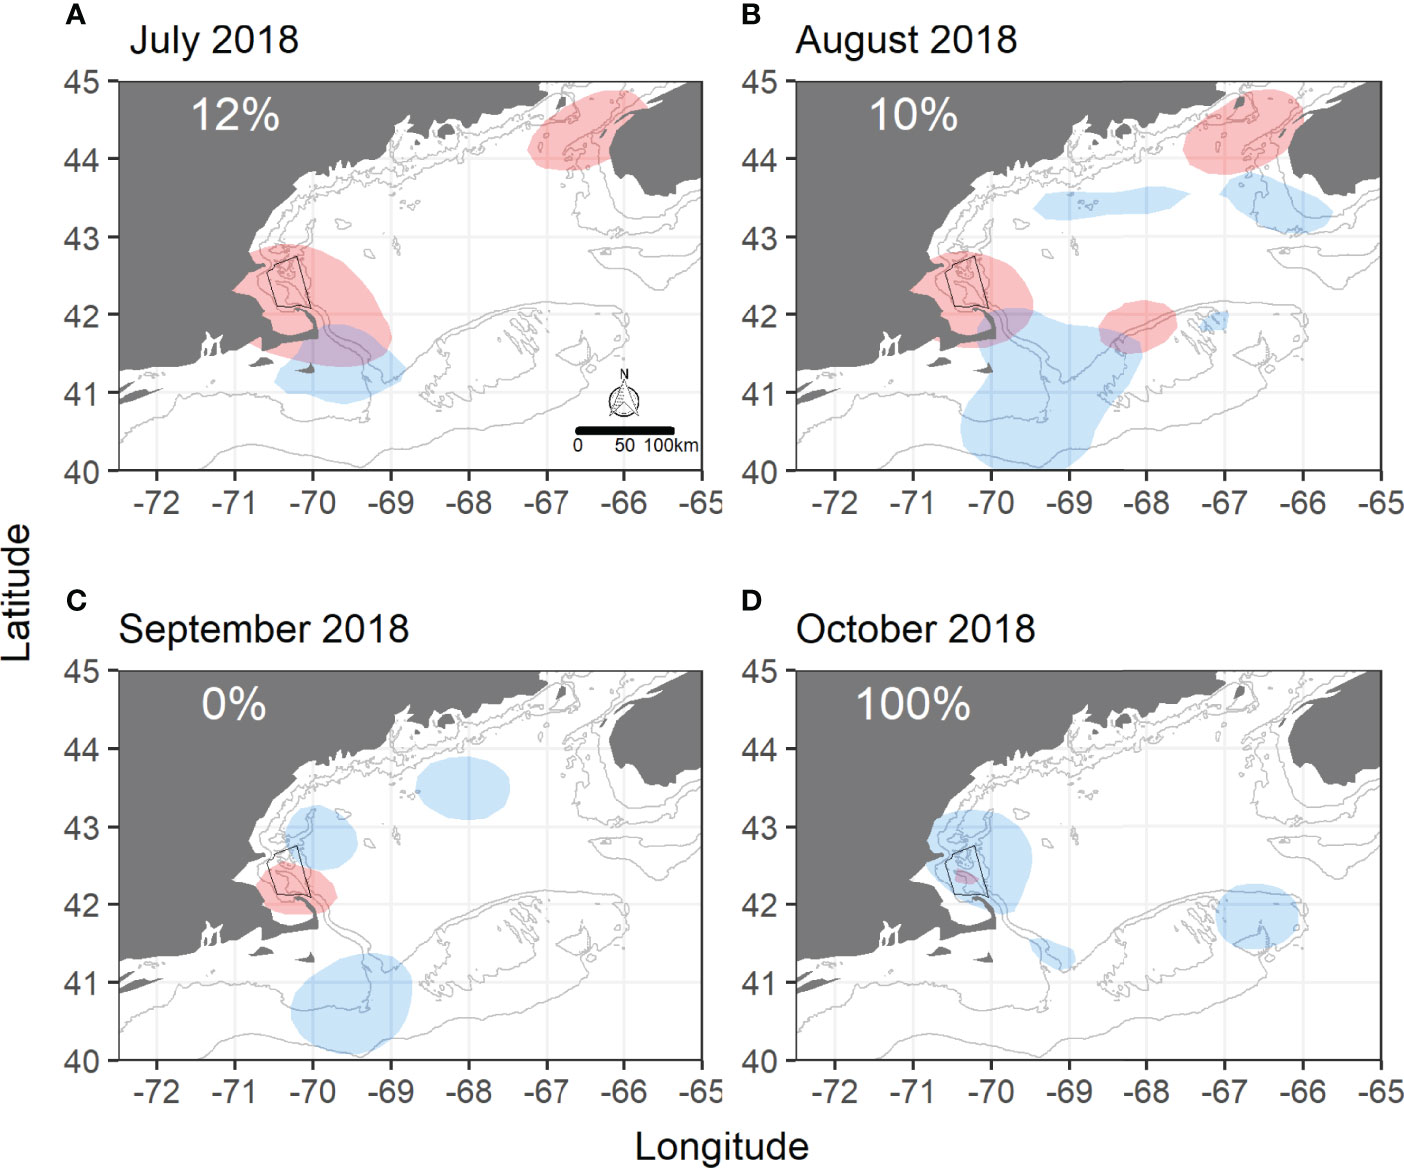
Figure 3 Monthly overlap between great shearwaters and humpback whales at the Gulf of Maine scale using satellite telemetry data in 2018. (A) July 2018, (B) August 2018, (C) September 2018, (D) October 2018. Shaded blue areas are shearwater utilization distributions (GOM-wide) from 50% kernel density isopleths. Shaded red areas are humpback whale utilization distributions from 50% kernel density isopleths. SBNMS boundaries are in black. Gray lines represent 50m and 100m depth contours. Percentages represent the percentage of the humpback whale UD overlapping with the shearwater UD.
Monthly overlap was much lower for right whales, except for 2014 when overlap in August, September, and October was 66%, 78% and 38%, respectively. Overlap in 2018 for right whales was relatively higher for 2 months when whales moved south of Massachusetts (Supplementary Figures 18–23).
There seemed to be no pattern in monthly overlap across years (Figure 4). Shearwater UDs overlapped with SBNMS and GOM humpback sightings in most months throughout the study period (Figure 4). Overlap between shearwaters and right whales was much lower. Most right whale sightings fell outside shearwater areas in most months. Shearwaters and humpbacks showed no overlap in SBNMS and the GOM in 7 of 23 and 2 of 23 months, respectively. Six of 23 months showed no overlap between shearwaters and right whales in the GOM (Figure 4).
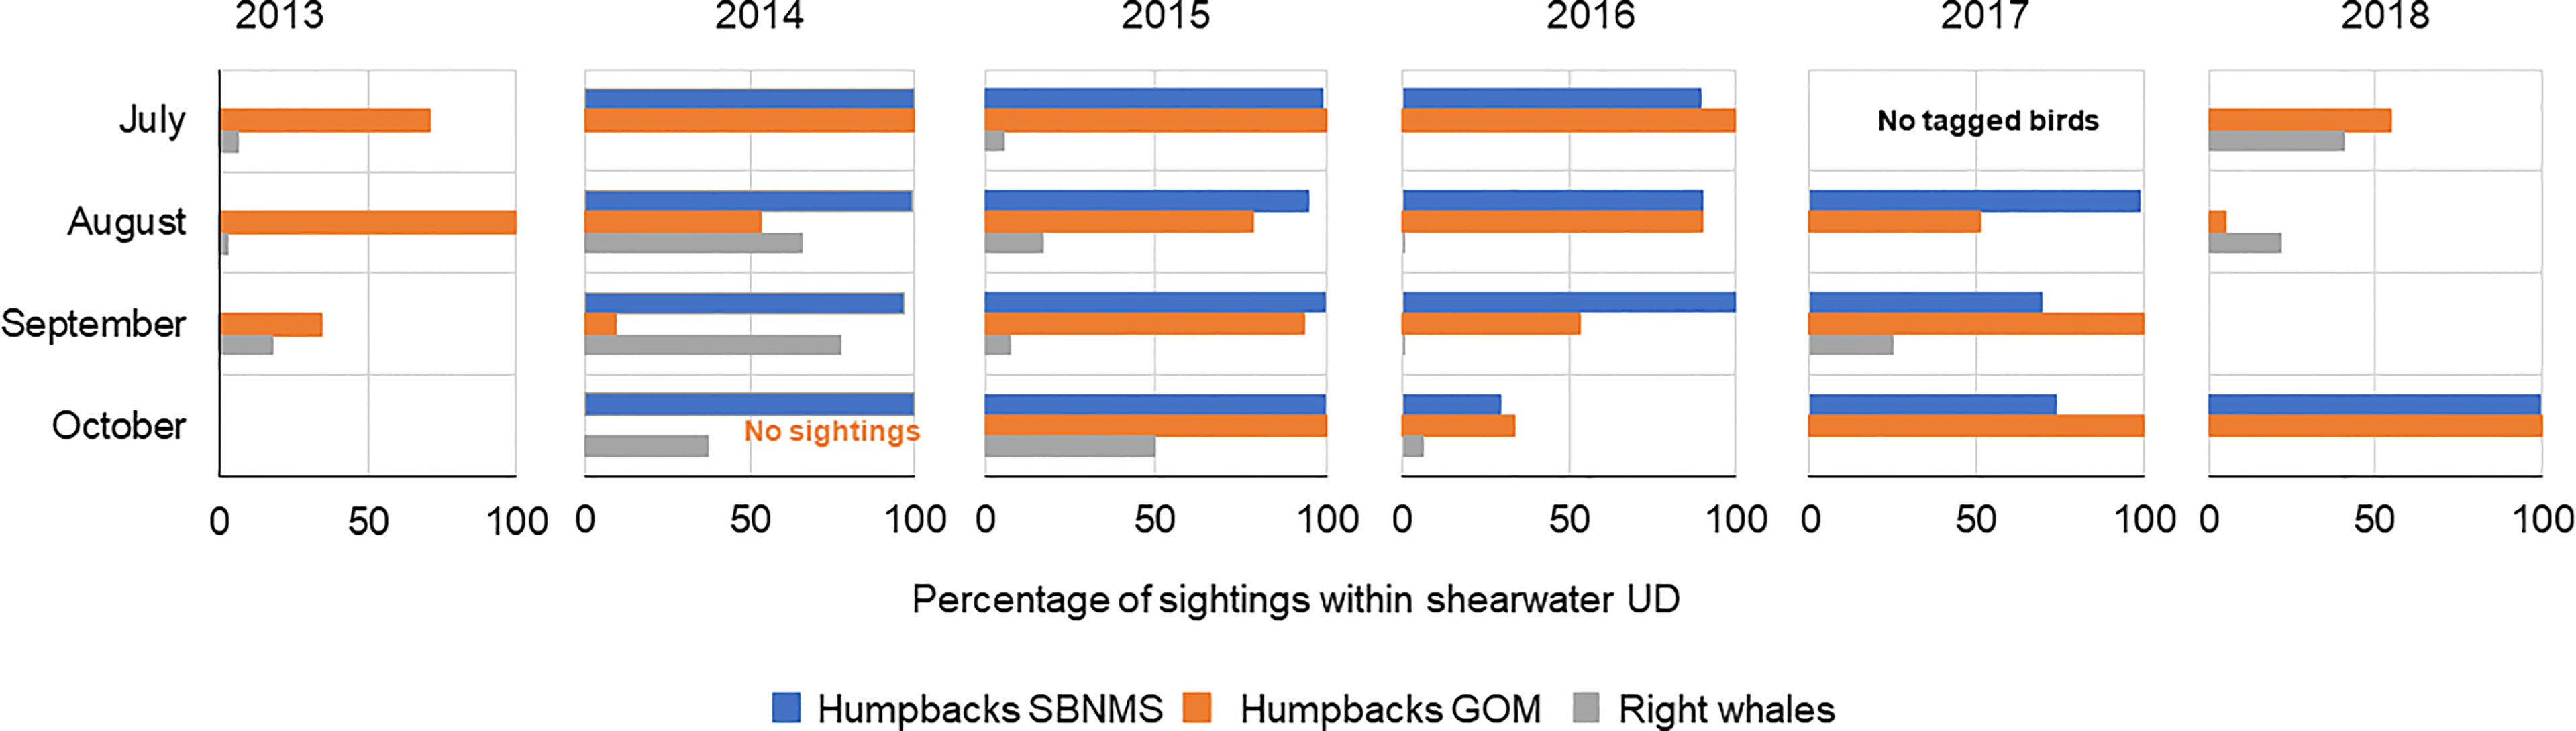
Figure 4 Summary of monthly overlap across the study period showing the percentage of whale sightings overlapping with the respective shearwater utilization distribution (UD) in each month. Blue – humpback whale sightings in SBNMS, orange – humpback whale sightings in GOM, gray – North Atlantic right whale sightings. No birds were tagged in July 2017. The GOM-wide humpback whale survey did not extend into October in 2014 and was limited in that month in all years.
Weekly Overlap
We examined weekly overlap between shearwaters and humpbacks in SBNMS and shearwaters and right whales in the GOM. 2014 showed the highest and most consistent overlap in SBNMS, with shearwater UDs encompassing 100% of humpback sightings in 11 of 15 weeks (Supplementary Figures 25, 30). Most weeks in 2015 and 2016 also showed high overlap (Supplementary Figures 26–27). All 2013 and most 2018 weeks showed no overlap between shearwaters and humpbacks in the sanctuary, though 3 weeks in 2018 showed overlap greater than 50% (Supplementary Figures 24, 29, 30).
Right whales showed higher levels of overlap with shearwaters at a weekly scale compared to monthly or annual scales, though 82% of weeks showed no overlap.
In 2014, 4 weeks showed >90% of right whale sightings overlapping shearwater areas starting in late August. Several weeks in 2015 showed 100% overlap, though two of these weeks only had 1 sighting (Supplementary Tables 1–6).
There seemed to be no patterns in terms of weekly overlap across years for humpbacks (Supplementary Figure 30). Considering the entire study period, ≥ 50% and ≥ 90% of humpback sightings were encompassed by shearwater UDs in 56% and 44% of weeks, respectively. Zero overlap occurred in 37% of weeks. For right whales, ≥ 50% and ≥ 90% of sightings were encompassed by shearwater UDs in 16% and 12% of weeks, respectively.
Discussion
This work demonstrates that satellite-tagged shearwaters identified humpback whale aggregation areas at multiple spatial and temporal scales, providing the near real-time information necessary for dynamic management. Our approach to use satellite-tagged seabirds as a tool to locate whale aggregations in near-real time represents a novel use of satellite-telemetry data and a new kind of DOM tool. Animal tracking data has long been recognized for its value in identifying ecologically important areas, informing management, and establishing static MPAs (Block et al., 2011; Allen and Singh, 2016; Lennox et al., 2019; Hays et al., 2019; Davies et al., 2021). More recently, dynamic habitat models using previously collected satellite-telemetry data have been developed with the goal of informing dynamic management (Žydelis et al., 2011; Abrahms et al., 2019; Barlow and Torres, 2021) and several existing DOM tools rely on tagging data in their work flows to produce end products (Hobday and Hartmann, 2006; Howell et al., 2008; Hazen et al., 2017; Hazen et al., 2018). Our work demonstrates the first potential use of animals tagged in near real-time to inform DOM.
Implementation: Considerations and Recommendations
Further study is needed to advance this work towards an operational DOM tool. Nevertheless, it is worthwhile to consider how this concept could realistically be implemented as a dynamic management strategy using the data streams and scales analyzed here.
Our regional, GOM-wide analyses (with all data types) identified high spatial overlap in areas we expected based on previous work, particularly in known foraging locations for humpbacks and shearwaters in predominantly sand habitats of high sand lance abundance (Payne et al., 1986; Clark et al., 2006; Robbins, 2007; Powers et al., 2017; Powers et al., 2020; Silva et al., 2020; Staudinger et al., 2020). The aggregation of shearwaters and humpbacks over stable features like sand substrates lends itself well to a combination of static and dynamic management (Tittensor et al., 2019), i.e., pre-identified static areas, within which, portions could be turned on and off dynamically. For example, if areas of consistently high overlap between humpback whales and shearwaters become recognized areas of ecological importance, detection of a tagged shearwater (or some minimum threshold of shearwater presence) in one of these areas could trigger a dynamic management action. Focusing more rigorous statistical analyses within these static areas could identify shearwater, and likely humpback, foraging hot-spots on smaller spatial scales, refining management areas and initiating dynamic management in a more targeted way.
An integrated management scheme combining static and dynamic strategies at a regional scale also makes sense based on our results and from ecological and comprehensive management perspectives. While overlap was typically higher within SBNMS, GOM-wide survey data and satellite telemetry data revealed spatial overlap in sand habitats at multiple temporal scales beyond sanctuary boundaries, highlighting the greater consistency in co-occurrence at the GOM scale and the benefit of wider scale surveillance. In addition, there is high ecological connectivity between these predominantly sand areas, including SBNMS, in terms of GOM humpback movements and source-sink dynamics of larval sand lance (Robbins, 2007; Suca et al., 2022). Further, entanglement and vessel strike are regional issues. Managing these threats at the broadest scale, which includes the full geographic range of humpback seasonal movements, provides the greatest benefits. Lastly, SBNMS is nested within the GOM and would automatically be included in a regional management approach. Prior knowledge of GOM areas where co-occurrence of humpbacks and shearwaters predictably occurs is a major advantage in focusing data collection and analysis efforts, and to operationalize a program of finer scale dynamic approaches based on near real-time co-occurrence.
While we ideally support a regional approach, several factors make SBNMS an ideal location to pilot DOM. First, co-occurrence between humpbacks and shearwaters is best understood within SBNMS (Silva et al., 2020; Silva et al., 2021); both species are often collocated on the southern portion of Stellwagen Bank where sand lance abundance is highest. Silva et al. (2021) identified site-specific probabilities of humpback aggregations on an even finer scale (~1-2 km) within SBNMS, which coincides spatially with humpback sightings and shearwater distributions in the current study. The sanctuary was included in most shearwater distributions at all scales and was consistently a high overlap area, highlighting the importance of SBNMS to humpbacks and shearwaters as foraging habitat. Second, SBNMS is a multi-use sanctuary that could benefit from additional surveillance and threat mitigation. Levels of human activities are highly concentrated and include commercial and recreational fishing and vessel traffic (Hatch et al., 2008). Entanglement and vessel strike risk have been well documented here (Wiley et al., 2003; Wiley et al., 2013; Hill et al., 2017; Office of National Marine Sanctuaries, 2020; Silva et al., 2020; Silva et al., 2021). Fourth, the sanctuary is smaller (2180 km2) than all but three shearwater use areas identified here (all at the weekly scale) which would simplify management. Fifth, existing high-resolution sightings data collection programs from research and opportunistic platforms offer unique opportunities to corroborate analyses and assess decision making. Lastly, the sanctuary’s status as a federal MPA may offer alternative management frameworks not applicable to the broader region. Pre-existing knowledge, continued monitoring and concentrated human threats suggest that piloting dynamic management could be most impactful and operational in SBNMS.
We analyzed overlap using multiple datasets and spatio-temporal scales to explore the full range of management options. In theory, dynamic management at the smallest possible spatial and temporal scales poses the least impact to stakeholders. While we demonstrate high spatial overlap between shearwaters and whales at the weekly scale within SBNMS, providing scientific support for management, managing entanglements at weekly scales may be impractical given logistics in hauling and recovering trap-pot gear (Borggaard et al., 2017), and short-term, small geographic scale management might result in gear merely being massed along the borders of the managed areas, which could increase entanglement risk. At the other extreme, an annual scale is likely too coarse and will miss pertinent dynamic shifts in animal distributions during the year. We recommend discussions on dynamic management start by considering the monthly scale. This scale is the finest, and therefore most dynamic temporal scale to more closely match animal movements and offers a more reasonable time frame for fishers, vessel operators, and managers to plan, implement and comply with management actions. Our results showed no consistent monthly patterns across years that may assist in advanced planning, though datasets currently available from July and August provided the best available insight for dynamic management. October seemed to show the most variation in overlap in all datasets (sightings, telemetry), due to limited GOM-wide whale survey effort and fewer tagged birds by this time of year due to migration or tag failure. Further analysis of trade-offs between spatio-temporal management combinations and potential impacts on feasibility of implementation is essential. Communication and engagement with stakeholders will be key in all future phases of study and development (Welch et al., 2019; Oestreich et al., 2020).
Our proposed combination of dynamic management within predefined static sand habitats relies on humpbacks and shearwaters aggregating at these sites foraging for sand lance. Fewer humpback sightings and little use of SBNMS by tagged shearwaters in 2013 and 2018 was likely driven by lower than average sand lance abundance (Silva et al., 2020). GOM survey data and satellite telemetry showed overlap in other parts of the GOM in 2013, but all data showed little to no overlap in 2018. Shearwaters and humpbacks may have targeted different prey sources in 2018, suggesting that shearwaters may be less effective indicators of humpback locations when sand lance are not abundant. Sand lance show extreme sensitivity to increasing temperatures and ocean acidification (Murray et al., 2019) and predicted abundance across the NE U.S. Continental Shelf through the remainder of the century is projected to be lower than average (Suca et al., 2021). This underscores the need for continued innovation of dynamic management tools as climate-related oceanographic changes drive fluctuations in species’ abundance and distributions.
Right Whales
Shearwaters were not reliable or consistent indicators of right whale locations. This was not unexpected, given that right whales feed on copepods (Wishner et al., 1995; Murison and Gaskin, 1989; Mayo and Marx, 1990), while humpbacks and shearwaters primarily target sand lance. The year with the highest overlap, 2014, was one where shearwaters used the Bay of Fundy in the northern GOM, historic right whale foraging habitat (Kraus et al., 1982; Murison and Gaskin, 1989; Baumgartner et al., 2003). Since 2010, coincident with an oceanographic regime shift in the GOM (Meyer-Gutbrod et al., 2021), right whales have mostly abandoned their northern GOM summer feeding grounds and are appearing in the Gulf of St. Lawrence and Southern New England (Davis et al., 2017; Leiter et al., 2017; Davies et al., 2019; Meyer-Gutbrod et al., 2021; Quintana-Rizzo et al., 2021). Interestingly, shearwaters used areas in Southern New England in 2017, just missing an aggregation of right whales. More right whale sightings were encompassed by shearwater distribution in 2018, representing the second highest yearly overlap. Analyzing more recent years may reveal increased overlap between shearwaters and right whales coincident with a shift in right whale habitat. Future work could also explore additional seabird species as better indicators of right whale presence.
Current U.S. Management
The U.S. does employ some dynamic strategies to mitigate vessel strike to whales. In addition to Whale Alert (Wiley et al., 2013), the National Oceanic and Atmospheric Administration (NOAA) can implement Dynamic Management Areas (DMAs) and Right Whale Slow Zones (NOAA, 2021c), which use near real-time visual (DMA) or visual and acoustic (Right Whale Slow Zones) detections to establish areas where mariners are encouraged to reduce vessel speed or to avoid. However, compliance in both programs is voluntary and previous work has shown voluntary rules, including DMAs, to be largely ineffective (Lagueux et al., 2011; McKenna et al., 2012; Silber et al., 2012), though Canada and New Zealand had some success with voluntary ship strike reduction measures (Vanderlaan and Taggart, 2009; Constantine et al., 2015; Ebdon et al., 2020). Mandatory, dynamic strategies may better reduce vessel strike risk to whales (Hausner et al., 2021). Further, current spatial management of vessel strikes and entanglement is designed for times and places where right whales aggregate (NOAA (National Oceanic and Atmospheric Association), 2008; National Marine Fisheries Service, 2021), providing little if any benefit to other whale species. Using satellite-tagged shearwaters to define management areas can provide a means to extend spatial protections to humpbacks and other marine mammal species that feed on sand lance.
There are currently no dynamic management strategies to mitigate entanglement in the U.S, though the data collection (Baumgartner et al., 2013; Baumgartner et al., 2019; Baumgartner et al., 2020) and dissemination (Wiley et al., 2013; Johnson et al., 2021) infrastructure exist. NOAA made an early attempt at dynamic management of entanglement with the implementation of the Dynamic Area Management (DAM) program in 2002 (Asaro, 2012; Borggaard et al., 2017; Bisack and Magnusson, 2021). DAM zones could be created to restrict fixed gear fishing when three or more right whales were present within an area of 75 nm2. When a DAM was triggered, mandatory gear removal, voluntary gear removal, or more restrictive gear modifications could be requested for 15 days. The program lasted seven years, rarely required gear removal, and ended in 2009 after much criticism from stakeholders on all sides. Notably, fishers maintained that more predictable requirements were needed for fixed gear fisheries and removal of gear required weeks to months notice (Borggaard et al., 2017). These examples provide more support for the monthly management scale recommended here. However, Canada has implemented dynamic fisheries management of the fixed gear snow crab fishery on a ~ biweekly scale. In the Gulf of St. Lawrence, acoustic or visual detection of a single right whale triggers a closed area (~2000 km 2) surrounding the detection for 15 days. If no whales are detected in the closed area during days 9-15 of the closure, the area re-opens to fishing (Fisheries and Oceans Canada, 2021). While this strategy is relatively new, focuses on one specific fishery, and has not been evaluated, it does provide precedent for dynamic fisheries management at sub-monthly scales.
Limitations and Future Work
An important next step will be to evaluate how well shearwaters indicate whale locations. While spatial overlap was often high, shearwater distributions were typically much larger than humpback distributions, with many shearwater UDs greater than 20,000 km2. If whale distributions account for only a small portion of shearwater UDs, implementing management areas of this size would not only be inefficient but also logistically and politically difficult. As a rough approximation for how well shearwaters locate whales, we used only telemetry datasets (GOM-wide scale) to calculate the percentage of the shearwater UD encompassed by the humpback UD, which ranged from 0-40% with most values below 20%. This suggests that establishing shearwater 50% UDs as management areas would likely ensure whale protection but managed areas would be unnecessarily large. For tagged shearwaters to be an effective and efficient DOM tool, their habitat-use areas and therefore, candidate management areas, must be refined (Dunn et al., 2016).
Future work should examine more robust statistical methods for determining home ranges using satellite telemetry data. Our method of calculating UDs was highly sensitive to numbers of Argos locations, one known bias of kernel density estimation (Winton et al., 2018). We chose this relatively simple method to examine overlap over many scales at once as proof of concept, and to accommodate differences between shearwater and humpback telemetry data collection. We also explored the use of time-based convex hulls, but found that technique to also be limited by sample size. The presence-only nature of satellite-telemetry data should also be considered in selection of future methods. Potential biases in presence-only data are well known (Phillips et al., 2009; Elith et al., 2011; Renner et al., 2015; Winton et al., 2018). We did not account or correct for potential presence-only biases at this initial stage of exploration, but a more rigorous analysis to reduce presence-only data biases like spatial and temporal autocorrelation would likely produce smaller shearwater use areas and thus, smaller candidate management areas. We note that some whale sightings data in SBNMS were collected opportunistically and are also presence-only data, though daily effort and high resolution of these data alleviate some concern about any biases.
Incorporating environmental variables may also help refine bird use areas (Powers et al., 2017; Powers et al., 2020), particularly those that define areas of highest sand lance abundance. Species distribution modelling incorporating environmental data could also enable forecasts to predict areas of high shearwater-whale overlap. Shearwater UDs could provide a proxy for prey resources in a humpback distribution model. Forecasts could provide the advanced notice required for stakeholders to operate at weekly time scales. However, forecasts depend on strong model performance and move away from the advantages of relying on seabirds tagged in real-time. Identifying areas and times of shearwater foraging behavior where they may be more likely to overlap and associate with humpbacks may better hone in on areas for dynamic management.
Increasing sample sizes of tagged birds may better define habitat use areas and help address sources of error. Here, ~10 birds were tagged each year. Tagging additional birds may further increase and align spatial overlap. Most shearwaters in the SW GOM are likely juvenile or early subadults (0-2 years old) that use the area from July to November, suggesting age-related preferences in movements and foraging areas (Powers et al., 2017; Powers et al., 2020), but older subadults that leave the GOM by September are also common (Powers et al., 2020). Tagging more adult shearwaters, who often move north earlier in the summer, may allow us to capture more humpback or right whale locations in the northern GOM. Larger sample sizes of tagged birds could reduce error or bias in distributions, refine potential management areas, and provide data through the Fall to better support the need for entanglement mitigation throughout October.
Some caution is needed in interpretation of GOM results in light of survey purpose and effort. Surveys were not designed for spatial analyses but rather to document as many individual humpback whales as possible across the population. Effort therefore intentionally focused on historical humpback whale aggregation sites within this large area and was dependent on weather, logistics, and resources. For example, no humpback sightings on Georges Bank in these years reflects the difficulty in successfully surveying this offshore area, even though it is a known foraging area for humpback whales. Non-standardized survey effort means there could have been whales in areas or times that were not surveyed. We did not correct the data for effort and so overlap between shearwaters and humpbacks may be lower (or higher) than reported here. In addition, a temporal mismatch between survey effort and humpback presence may alter results. Regular, GOM-wide, systematic cetacean surveys (such as aerial or vessel line-transect surveys) in these months would be valuable in further understanding overlap between humpbacks and shearwaters to inform DOM tool development.
Future work should map and quantify overlap between fixed gear locations, vessel transits, shearwater areas, and humpback aggregations to document conservation benefits to managing these areas. This has been partially done for SBNMS (Wiley et al., 2003; Wiley et al., 2013; Silva et al., 2020; Silva et al., 2021), but should be done for the entire GOM. Overlap between shearwater areas and known vessel strike and entanglement locations would be additional valuable information. Although entanglement report locations do not necessarily represent locations where entanglement occurred, high-intensity data collection programs on individual whales can sometimes clarify timing and possible location of entanglement. If entanglement locations fall within shearwater use areas, tagged birds could also inform survey effort to assess entanglement risk in other areas.
Continued investigation and investment into seabirds as potential dynamic management tools has many benefits. Tagging seabirds is cost-effective; it is cheaper than other methods to monitor whale distributions including tagging, vessel/aerial visual surveys, or passive acoustic monitoring. The sanctuary’s seabird tagging program is anticipated to continue for at least the next several years, providing an existing means to continue and expand monitoring capabilities and leveraging data collection for additional applications. In addition to cost, tracking seabirds also avoids other limitations of visual and acoustic surveys for whales – daytime operations, reliance on vocalizing animals, and uncertainties in detections. Johnson et al. (2020) recommended that dynamic management areas be >10km and focus on areas used for foraging and socializing to reduce uncertainty associated with whale detection locations. While tracking seabirds has its own limitations and uncertainties in identifying whale locations, shearwater UDs and the nature of overlap with humpbacks (foraging) indicates that seabirds as dynamic tools would automatically meet these recommendations.
Conclusion
This work shows satellite-tagged shearwaters can serve as indicators of humpback whale locations across space and time and with further study, could increase management capabilities. As climate-related changes drive increased variability in ocean conditions and species’ shifts, particularly in the GOM (Pershing et al., 2015; Pershing et al., 2021), static spatial management alone is no longer sufficient for species’ protection (Runge et al., 2014). Static restricted areas and MPAs may become ineffective at serving their original purpose (Bruno et al., 2018). Dynamic management and the flexibility to respond to anomalous ocean conditions and species’ shifts is necessary (Meyer-Gutbrod et al., 2018; Pinsky et al., 2018; Davies and Brillant, 2019; Maxwell et al., 2020; Hausner et al., 2021; Meyer-Gutbrod et al., 2021). DOM tools provide the framework to meet ecological and economic objectives, making implementation of managed areas more attractive to stakeholders, while supporting ecosystem-based management (Lewison et al., 2015; Maxwell et al., 2015).
Data Availability Statement
Data will be made available on request to the corresponding author and/or to the North Atlantic Right Whale Consortium. Requests to access these datasets should be directed to Tammy Silva - tammy.silva@noaa.gov; NARWC - https://www.narwc.org/accessing-narwc-data.html.
Ethics Statement
The animal study was reviewed and approved by Institutional Animal Care & Use Committee (IACUC). Shearwater tagging occurred under research permit #22055 issued by the United States Department of the Interior, #058.19SCB Issued by the Massachusetts Division of Fisheries and Wildlife and #SBNMS-2019-001 issued by the National Oceanic and Atmospheric Administration/Stellwagen Bank National Marine Sanctuary. Humpback whale surveys and tagging were conducted under NOAA permits: 14245, 20465, 16325 and the Canadian Department of Fisheries and Oceans.
Author Contributions
TS, KP, JR, MT, and DW designed the study. All authors collected the data. TS and KP analyzed the data. TS wrote the initial manuscript draft. All authors edited and approved the final version.
Funding
Humpback whale satellite tag funding was provided by the Office of Naval Research, National Oceanographic and Atmospheric Administration and ExxonMobile Exploration Company via the National Fish and Wildlife Foundation and the National Oceanographic Partnership Program. Funding fo seabird work and analysis was provided by Bureau of Ocean Energy Management [IA agreement M17PG0019], NOAA Stellwagen Bank National Marine Sanctuary, and the Volgenau Foundation.
Conflict of Interest
The authors declare that the research was conducted in the absence of any commercial or financial relationships that could be construed as a potential conflict of interest.
Publisher’s Note
All claims expressed in this article are solely those of the authors and do not necessarily represent those of their affiliated organizations, or those of the publisher, the editors and the reviewers. Any product that may be evaluated in this article, or claim that may be made by its manufacturer, is not guaranteed or endorsed by the publisher.
Acknowledgments
We thank the seabird tagging team for their efforts and dedication to the project and help in collecting these data including Les Kaufman, Peter Hong, Kent Hatch, Sara Williams. Thanks to the Center for Coastal Studies staff involved in directed humpback whale research, particularly: Scott Landry, David Mattila, Jenn Tackaberry, Bob Lynch, Theresa Kirchner, Courtney Callahan and Doug Sandilands. Thanks to Virginia Andrews-Goff, Phil Clapham, Michael Double, Nicholas Gales, Frances Gulland, and Amy Kennedy for their work on the humpback whale tagging project. Thank you to the North Atlantic Right Whale Consortium, specifically Heather Pettis and Bob Kenney for collecting, managing and sharing North Atlantic right whale sightings data. We are grateful to Boston Harbor City Cruises, Dolphin Fleet Whale Watch, and their naturalists for sharing and collecting sightings data, and to companies that hosted sighting data collection by Whale and Dolphin Conservation (Captain John Boats, Hyannis Whale Watcher Cruises) and Blue Ocean Society (Granite State Whale Watch). We thank the many interns and volunteers working with Blue Ocean Society, the Center for Coastal Studies, New England Aquarium and Whale and Dolphin Conservation, who volunteered their time to collect and process data. Lastly, we thank two reviewers for their thoughtful comments that greatly improved this manuscript. Shearwater tagging occurred under research permit #22055 issued by the United States Department of the Interior, #058.19SCB Issued by the Massachusetts Division of Fisheries and Wildlife and #SBNMS-2019-001 issued by the National Oceanic and Atmospheric Administration/Stellwagen bank National Marine Sanctuary and under IACUC approval. Humpback whale surveys and tagging were conducted under NOAA permits: 14245, 20465, 16325, the Canadian Department of Fisheries and Oceans as well as IACUC approval. The scientific results and conclusions, as well as any views or opinions expressed herein, are those of the authors and do not necessarily reflect the views of NOAA, the Department of Commerce, or the U.S. Fish and Wildlife Service.
Supplementary Material
The Supplementary Material for this article can be found online at: https://www.frontiersin.org/articles/10.3389/fmars.2022.837604/full#supplementary-material
References
Abrahms B., Welch H., Brodie S., Jacox M. G., Becker E. A., Bograd S. J., et al. (2019). Dynamic Ensemble Models to Predict Distributions and Anthropogenic Risk Exposure for Highly Mobile Species. Divers. Distrib. 25, 1182–1193. doi: 10.1111/ddi.12940
Allen A. M., Singh N. J. (2016). Linking Movement Ecology With Wildlife Management and Conservation. Front. Ecol. Evol. 3. doi: 10.3389/fevo.2015.00155
Andrews R. D., Baird R. W., Calambokidis J., Goertz C. E. C., Gulland F. M. D., Heide-Jørgensen M. P., et al. (2019). Best Practice Guidelines for Cetacean Tagging. J. Cetacean Res. Manage 2, 27–66. doi: 10.47536/jcrm.v20i1.237
Asaro M. (2012). Geospatial Analysis of Management Areas Implemented for Protection of the North Atlantic Right Whale Along the Northern Atlantic Coast of the Unites States. Marine Policy. 6, 915–921. doi: 10.1016/j.marpol.2012.01.004
Barlow D. R., Torres L. G. (2021). Planning Ahead: Dynamic Models Forecast Blue Whale Distribution With Applications for Spatial Management. J. Appl. Ecol. 58, 2703–2710. doi: 10.1111/1365-2664.13992
Baumgartner M. F., Bonnell J., Corkeron P. J., Van Parijs S. M., Hotchkin C., Hodges B. A., et al. (2020). Slocum Gliders Provide Accurate Near Real-Time Estimates of Baleen Whale Presence From Human-Reviewed Passive Acoustic Detection Information. Front. Mar. Sci. 7. doi: 10.3389/fmars.2020.00100
Baumgartner M. F., Bonnell J., Van Parijs S. M., Corkeron P. J., Hotchkin C., Ball K., et al. (2019). Persistent Near Real-Time Passive Acoustic Monitoring for Baleen Whales From a Moored Buoy: System Description and Evaluation. Methods Ecol. Evol. 10, 1476–1489. doi: 10.1111/2041-210X.13244
Baumgartner M. F., Cole T. V., Clapham P. J., Mate B. R. (2003). North Atlantic Right Whale Habitat in the Lower Bay of Fundy and on the SW Scotian Shelf During 1999-2001. Mar. Ecol. Prog. Ser. 264, 137–154. doi: 10.3354/meps264137
Baumgartner M. F., Fratantoni D. M., Hurst T. P., Brown M. W., Cole T. V. N., Van Parijs S. M., et al. (2013). Realtime Reporting of Baleen Whale Passive Acoustic Detections From Ocean Gliders. J. Acoust. Soc Am. 134, 1814–1823. doi: 10.1121/1.4816406
Beacham T. D., Lapointe M., Candy J. R., Miller K. M., Withler R. E. (2004). DNA in Action: Rapid Application of DNA Variation to Sockeye Salmon Fisheries Management. Conserv. Genet. 5, 411–416. doi: 10.1023/B:COGE.0000031140.41379.73
Bisack K. D., Magnusson G. M. (2021). Spatial Management to Reduce Entanglement Risk to North Atlantic Right Whales in Fishing Gear: A Case Study of the U.S. Northeast Lobster Fishery 2002-2009. Front. Mar. Sci. 8. doi: 10.3389/fmars.2021.540966
Block B. A., Jonsen I. D., Jorgensen S. J., Winship A. J., Shaffer S. A., Bograd S. J., et al. (2011). Tracking Apex Marine Predator Movements in a Dynamic Ocean. Nat. 475, 86–90. doi: 10.1038/nature10082
Borggaard D. L., Gouveia D. M., Colligan M. A., Merrick R., Swails K. S., Asaro M. J., et al. (2017). Managing US Atlantic Large Whale Entanglements: Four Guiding Principles. Mar. Policy 84, 202–212. doi: 10.1016/j.marpol.2017.06.027
Bruno J. F., Bates A. E., Cacciapaglia C., Pike E. P., Amstrup S. C., Van Hooidonk R., et al. (2018). Climate Change Threatens the World’s Marine Protected Areas. Nat. Climate Change. 8, 499–503. doi: 10.1038/s41558-018-0149-2
Calenge C. (2006). The Package “Adehabitat” for the R Software: A Tool for the Analysis of Space and Habitat Use by Animals. Ecol. Model. 197, 516–519. doi: 10.1016/j.ecolmodel.2006.03.017
Clark R., Manning J., Costa B., Desch A. (2006). “Physical and Oceanographic Setting,” in An Ecological Characterization of the Stellwagen Bank National Marine Sanctuary Region: Oceanographic, Biogeographic, and Contaminants Assessment, vol. 45 . Eds. Battista T., Clark R., Pittman S. (Silver Spring, MD: NOAA/National Ocean Service (NOAA Technical Memorandum NOS NCCOS), 356.
Constantine R., Johnson M., Riekkola L., Jervis S., Kozmian-Ledward L., Dennis T., et al. (2015). Mitigation of Vessel-Strike Mortality of Endangered Bryde’s Whales in the Hauraki Gulf, New Zealand. Biol. Conserv. 186, 149–157. doi: 10.1016/j.biocon.2015.03.008
Corkeron P., Hamilton P., Bannister J., Best P., Charlton C., Groch K. R, et al. (2018). The Recovery of North Atlantic Right Whales, Eubalaena Glacialis, Has Been Constrained by Human-Caused Mortality. R. Soc. Open Sci. 5, 180892.
Davies K. T. A., Brillant S. W. (2019). Mass Human-Caused Mortality Spurs Federal Action to Protect Endangered North Atlantic Right Whales in Canada. Marine Policy 104, 157–162. doi: 10.1016/j.marpol.2019.02.019
Davies K. T., Brown M. W., Hamilton P. K., Knowlton A. R., Taggart C. T., Vanderlaan A. S. (2019). Variation in North Atlantic Right Whale Eubalaena Glacialis Occurrence in the Bay of Fundy, Canada, Over Three Decades. Endang. Spec. Res. 39, 159–171. doi: 10.3354/esr00951
Davies T. E., Carneiro A. P., Campos B., Hazin C., Dunn D. C., Gjerde K. M., et al. (2021). Tracking Data and the Conservation of the High Seas: Opportunities and Challenges. J. Appl. Ecol 58, 2703–2710. doi: 10.1111/1365-2664.14032
Davis G. E., Baumgartner M. F., Bonnell J. M., Bell J., Berchok C., Thornton J. B., et al. (2017). Long-Term Passive Acoustic Recordings Track the Changing Distribution of North Atlantic Right Whales (Eubalaena Glacialis) From 2004 to 2014. Sci. Rep. 7, 13460. doi: 10.1038/s41598-017-13359-3
Dunn D. C., Maxwell S. M., Boustany A. M., Halpin P. N. (2016). Dynamic Ocean Management Increases the Efficiency and Efficacy of Fisheries Management. PNAS. 113, 668–673. doi: 10.1073/pnas.1513626113
Ebdon P., Riekkola L., Constantine R. (2020). Testing the Efficacy of Ship Strike Mitigation for Whales in the Hauraki Gulf, New Zealand. Ocean Coastal Manage. 184, 105034. doi: 10.1016/j.ocecoaman.2019.105034
Elith J., Phillips S. J., Hastie T., Dudík M., Chee Y. E., Yates C. J. (2011). A Statistical Explanation of MaxEnt for Ecologists. Divers. Distrib 17, 43–57. doi: 10.1111/j.1472-4642.2010.00725.x
Fisheries and Oceans Canada. (2021). 2021 Fishery Management Measures. Available at: https://www.dfo-mpo.gc.ca/fisheries-peches/commercial-commerciale/atl-arc/narw-bnan/management-gestion-eng.html (Accessed 11/24/221).
Hatch L., Clark C., Merrick R., Van Parijs S., Ponirakis D., Schwehr K., et al. (2008). Characterizing the Relative Contributions of Large Vessels to Total Ocean Noise Fields: A Case Study Using the Gerry E. Studds Stellwagen Bank National Marine Sanctuary. Environ. Manage. 42, 735–752. doi: 10.1007/s00267-008-9169-4
Hausner A., Samhouri J. F., Hazen E. L., Delgerjargal D., Abrahms B. (2021). Dynamic Strategies Offer Potential to Reduce Lethal Ship Collisions With Large Whales Under Changing Climate Conditions. Mar. Policy 130, 104565. doi: 10.1016/j.marpol.2021.104565
Hayes S. A., Josephson E., Maze-Foley K., Rosel P. E., Byrd B., Chavez-Rosales S., et al. (2018). U.S. Atlantic and Gulf of Mexico Marine Mammal Stock Assessments - 2017 (Silver Spring, MD: NOAA Tech Memo NMFS NE-245), 371 p. doi: 10.25923/e764-9g81
Hayes S. A., Josephson E., Maze-Foley K., Rosel P. E., Turek J. (2021). U.S. Atlantic and Gulf of Mexico Marine Mammal Stock Assessments - 2020 (Silver Spring, MD: NOAA Tech Memo NMFS NE-271), 403 p. Available at: https://media.fisheries.noaa.gov/2021-07/Atlantic%202020%20SARs%20Final.pdf?null%09.
Hays G. C., Bailey H., Bograd S. J., Bowen W. D., Campagna C., Carmichael R. H., et al. (2019). Translating Marine Animal Tracking Data Into Conservation Policy and Management. Trends Ecol. Evolution. 34, 459–473. doi: 10.1016/j.tree.2019.01.009
Hazen E. L., Palacios D. M., Forney K. A., Howell E. A., Becker E., Hoover A. L., et al. (2017). WhaleWatch: A Dynamic Management Tool for Predicting Blue Whale Density in the California Current. J. Appl. Ecol. 54, 1415–1428. doi: 10.1111/1365-2664.12820
Hazen E. L., Scales K. L., Maxwell S. M., Briscoe D. K., Welch H., Bograd S., et al. (2018). A Dynamic Ocean Management Tool to Reduce Bycatch and Support Sustainable Fisheries. Sci. Adv. 4. doi: 10.1126/sciadv.aar3001
Heide-Jorgensen M. P., Kleivane L., Oien N., Laidre K. L., Jensen M. V. (2001). A New Technique for Deploying Satellite Transmitters on Baleen Whales: Tracking a Blue Whale (Balaenoptera Musculus) in the North Atlantic. Mar. Mamm. Sci. 17, 949–954. doi: 10.1111/j.1748-7692.2001.tb01309.x
Hill A. N., Karniski C., Robbins J., Pitchford T., Todd S., Asmutis-Silvia R. (2017). Vessel Collision Injuries on Live Humpback Whales, Megaptera Novaeangliae, in the Southern Gulf of Maine. Mar. Mamm. Sci. 33, 558–573. doi: 10.1111/mms.12386
Hobday A. J., Hartmann K. (2006). Near real-time spatial management based on habitat predictions for a longline bycatch species. Fish. Manag. Ecol. 13, 365–380. doi: 10.1111/j.1365-2400.2006.00515.x
Hobday A. J., Hartog J. R., Spillman C. M., Alves O. (2011). Seasonal Forecasting of Tuna Habitat for Dynamic Spatial Management. Can. J. Fisheries Aquat. Sci. 68, 898–911. doi: 10.1139/f2011-031
Hobday A. J., Hartog J. R., Timmiss T., Fielding J. (2010). Dynamic Spatial Zoning to Manage Southern Bluefin Tuna (Thunnus Maccoyii) Capture in a Multi-Species Longline Fishery. Fisheries Oceanogr 19, 243–253. doi: 10.1111/j.1365-2419.2010.00540.x
Holmes S. J., Bailey N., Campbell N., Catarino R., Barratt K., Gibb A., et al. (2011). Using Fishery-Dependent Data to Inform the Development and Operation of a Co-Management Initiative to Reduce Cod Mortality and Cut Discards. ICES J. Mar. Sci. 68, 1679–1688. doi: 10.1093/icesjms/fsr101
Howell E. A., Hoover A., Bensen S. R., Bailey H., Polovina J. J., Seminoff J. A., et al. (2015). Enhancing the TurtleWatch Product for Leatherback Sea Turtles, a Dynamic Habitat Model for Ecosystem-Based Management. Fisheries Oceanogr. 24, 57–68. doi: 10.1111/fog.12092
Howell E. A., Kobayashi D. R., Parker D. M., Balazs G. H., Polovina J. J. (2008). TurtleWatch: A Tool to Aid in the Bycatch Reduction of Loggerhead Turtles Caretta Caretta in the Hawaii-Based Pelagic Longline Fishery. Endang. Spec. Res. 5, 267–278. doi: 10.3354/esr00096
Johnson H. D., Baumgartner M. F., Taggart C. T. (2020). Estimating North Atlantic Right Whale (Eubalaena Glacialis) Location Uncertainty Following Visual or Acoustic Detection to Inform Dynamic Management. Conserv. Sci. Pract 2, e267. doi: 10.1111/csp2.267
Johnson H., Morrison D., Taggart C. (2021). WhaleMap: A Tool to Collate and Display Whale Survey Results in Near Real-Time. J. Open Source Software 6, 3094. doi: 10.21105/joss.03094
Knowlton AR, Hamilton PK, Marx MK, Pettis HM, Kraus SD. (2012). Monitoring North Atlantic Right Whale Eubalaena Glacialis Entanglement Rates: a 30 yr Retrospective. Mar. Ecol. Prog. Ser. 466, 293–302. doi: 10.3354/meps09923
Kraus S. D., Prescott J. H., Turnbull P. V., Reeves R. R. (1982). Preliminary Notes on the Occurrence of the North Atlantic Right Whale, Eubalaena Glacialis, in the Bay of Fundy. Rep. Int. Whal. Commn. 32, 407–411.
Lagueux K. M., Zani M. A., Knowlton A. R., Kraus S. D. (2011). Response by Vessel Operators to Protection Measures for Right Whales Eubalaena Glacialis in the Southeast US Calving Ground. Endang. Spec. Res. 14, 69–77. doi: 10.3354/esr00335
Laist D. W., Knowlton A. R., Mead J. G., Collet A. S., Podesta M. (2001). Collisions Between Ships and Whales. Mar. Mamm. Sci. 17, 35–75. doi: 10.1111/j.1748-7692.2001.tb00980.x
Leiter S. M., Stone K. M., Thompson J. L., Accardo C. M., Wikgren B. C., Zani M. A., et al. (2017). North Atlantic Right Whale Eubalaena Glacialis Occurrence in Offshore Wind Energy Areas Near Massachusetts and Rhode Island, USA. Endang. Spec. Res. 34, 45–59. doi: 10.3354/esr00827
Lennox R. J., Engler-Palma C., Kowarski K., Filous A., Whitlock R., Cooke S. J., et al. (2019). Optimizing Marine Spatial Plans With Animal Tracking Data. Can. J. Fisheries Aquat. Sci. 76, 497–509. doi: 10.1139/cjfas-2017-0495
Lewison R., Hobday A., Maxwell S., Hazen E., Hartog J., Dunn D., et al. (2015). Dynamic Ocean Management: Identifying the Critical Ingredients of Dynamic Approaches to Ocean Resource Management. Bioscience 65, 486–498. doi: 10.1093/biosci/biv018
Little A. S., Needle C. L., Hilborn R., Holland D. S., Marshall C. T. (2015). Real-Time Spatial Management Approaches to Reduce Bycatch and Discards: Experiences From Europe and the United States. Fish Fisheries. 16, 576–602. doi: 10.1111/faf.12080
MacLeod C. J., Adams J., Lyver P. (2008). At-Sea Distribution of Satellite-Tracked Grey-Faced Petrels, Pterodroma Macroptera Gouldi, Captured on the Ruamaahua (Aldermen) Islands, New Zealand. Pap Proc. R Soc. Tasmania. 142, 73–88. doi: 10.26749/rstpp.142.1.73
Maxwell S. M., Gjerde K. M., Conners M. G., Crowder L. B. (2020). Mobile Protected Areas for Biodiversity on the High Seas. Sci. 367, 252–254. doi: 10.1126/science.aaz9327
Maxwell S. M., Hazen E. L., Lewison R. L., Dunn D. C., Bailey H., Bograd S. J., et al. (2015). Dynamic Ocean Management: Defining and Conceptualizing Real-Time Management of the Ocean. Mar. Policy 58, 42–50. doi: 10.1016/j.marpol.2015.03.014
Mayo C. A., Marx M. K. (1990). Surface Foraging Behaviour of the North Atlantic Right Whale, Eubalaena Glacialis, and Associated Zooplankton Characteristics. Can. J. Zoology. 68, 2214–2220. doi: 10.1139/z90-308
McKenna M. F., Katz S. L., Condit C., Walbridge S. (2012). Response of Commercial Ships to a Voluntary Speed Reduction Measure: Are Voluntary Strategies Adequate for Mitigating Ship-Strike Risk? Coastal Management. 40, 634–650. doi: 10.1080/08920753.2012.727749
Meyer-Gutbrod E. L., Greene C. H., Davies K. T. A. (2018). Marine Species Range Shifts Necessitate Advanced Policy Planning: The Case of the North Atlantic Right Whale. Oceanography 31, 19–23. doi: 10.5670/oceanog.2018.209
Meyer-Gutbrod E. L., Greene C. H., Davies K. T., Johns D. G. (2021). Ocean Regime Shift is Driving Collapse of the North Atlantic Right Whale Population. Oceanogr. 34, 22–31. doi: 10.5670/oceanog.2021.308
Moore MJ, Rowles TK, Fauquier DA, Baker JD, Biedron I, Durban JW, et al. (2021). REVIEW Assessing North Atlantic Right Whale Health: Threats, and Development of Tools Critical for Conservation of the Species. Dis. Aquat. Org. 143, 205–226. doi: 10.3354/dao03578
Murison L. D., Gaskin D. E. (1989). The Distribution of Right Whales and Zooplankton in the Bay of Fundy, Canada. Can. J. Zool 67, 1411–1420. doi: 10.1139/z89-200
Murray C. S., Wiley D., Baumann H (2019). High Sensitivity of a Keystone Forage Fish to Elevated CO2 and Temperature. Conserv. Physiol. doi: 10.1093/conphys/coz084
National Marine Fisheries Service (2014). Taking of Marine Mammals Incidental to Commercial Fishing Operations; Atlantic Large Whale Take Reduction Plan — Final Rule. Fed Reg. 79, 36586–36621.
National Marine Fisheries Service (2015). Taking of Marine Mammals Incidental to Commercial Fishing Operations; Atlantic Large Whale Take Reduction Plan — Final Rule. Fed Reg. 80, 30367–30379.
National Marine Fisheries Service (2021). Taking of Marine Mammals Incidental to Commercial Fishing Operations; Atlantic Large Whale Take Reduction Plan Regulations; Atlantic Coastal Fisheries Cooperative Management Act Provisions; American Lobster Fishery. Fed Reg. 86, 51970–52024.
NOAA (National Oceanic and Atmospheric Association) (2008). Final Rule to Implement Speed Restrictions to Reduce the Threat of Ship Collisions With North Atlantic Right Whales. Federal Register 73, 60173–60191.
NOAA (2021a) 2017-2021 North Atlantic Right Whale Unusual Mortality Event Along the Atlantic Coast. Available at: https://www.fisheries.noaa.gov/national/marine-life-distress/2017-2021-north-atlantic-right-whale-unusual-mortality-event (Accessed 11/30/2021).
NOAA (2021b) 2016-2021 Humpback Whale Unusual Mortality Event Along the Atlantic Coast. Available at: https://www.fisheries.noaa.gov/national/marine-life-distress/2016-2021-humpback-whale-unusual-mortality-event-along-atlantic-coast (Accessed 11/30/2021).
NOAA (2021c) Reducing Vessel Strikes to North Atlantic Right Whales. Available at: https://www.fisheries.noaa.gov/national/endangered-species-conservation/reducing-vessel-strikes-north-atlantic-right-whales (Accessed 11/27/2021).
North Atlantic Right Whale Consortium (2021). North Atlantic Right Whale Consortium Sightings Database (Boston, MA, U.S.A: New England Aquarium).
Oestreich W. K., Chapman M. S., Crowder L. B. (2020). A Comparative Analysis of Dynamic Management in Marine and Terrestrial Systems. Front. Ecol. Environment. 18, 496–504. doi: 10.1002/fee.2243
Office of National Marine Sanctuaries (2020). “2020 Condition Report: Findings of Status and Trends for 2007-2018,” in U.S. Department of Commerce, National Oceanic and Atmospheric Administration (Silver Spring, MD: Office of National Marine Sanctuaries), 263 pp.
O’Keefe C. E., DeCelles G. R. (2013). Forming a Partnership to Avoid Bycatch. Fisheries 38, 434–444. doi: 10.1080/03632415.2013.838122
Payne P. M., Nicolas J. R., O'Brien L., Br Powers K. D. (1986). Distribution of the Humpback Whale, Megaptera Novaeangliae, on Georges Bank and in the Gulf of Maine in Relation to Densities of the Sand Eel, Ammodytes Americanus. Fishery Bull. 84, 271–277.
Pershing A. J., Alexander M. A., Brady D. C., Brickman D., Curchitser E. N., Diamond A. W., et al. (2021). Climate Impacts on the Gulf of Maine Ecosystem: A Review of Observed and Expected Changes in 2050 From Rising Temperatures. Elem Sci. Anth 9, 76. doi: 10.1525/elementa.2020.00076
Pershing A. J., Alexander M. A., Hernandez C. M., Kerr L. A., Le Bris A., Mills K. E., et al. (2015). Slow Adaptation in the Face of Rapid Warming Leads to Collapse of the Gulf of Maine Cod Fishery. Sci. 350, 809–812. doi: 10.1126/science.aac9819
Pettis H. M., Pace R. M. III, Hamilton P. K. (2022). “North Atlantic Right Whale Consortium 2021 Annual Report Card,” in Report to the North Atlantic Right Whale Consortium. Available at: https://www.narwc.org/uploads/1/1/6/6/116623219/2021report_cardfinal.pdf.
Phillips S. J., Dudík M., Elith J., Graham C. H., Lehmann A., Leathwick J., et al. (2009). Sample Selection Bias and Presence-Only Distribution Models: Implications for Background and Pseudo-Absence Data. Ecol. applications. 19, 181–197. doi: 10.1890/07-2153.1
Phillips R. A., Green J. A., Phalan B., Croxall J. P., Butler P. J. (2003). Chick Metabolic Rate and Growth in Three Species of Albatross: A Comparative Study. Comp. Biochem. Physiol. A Mol. Integr. Physiol. 135, 185–193. doi: 10.1016/S1095-6433(03)00073-4
Pinsky M. L., Reygondeau G., Caddell R., Palacios-Abrantes J., Spijkers J., Cheung W. W. L. (2018). Preparing Ocean Governance for Species on the Move. Science 360, 1189–1191. doi: 10.1126/science.aat2360
Powers K. D. (1983). Pelagic Distributions of Marine Birds Off the Northeastern United States (Silver Spring, MD: NOAA Tech Memo NMFS- F/ NEC-27).
Powers K. D., Wiley D. N., Allyn A. J., Welch L. J., Ronconi R. A. (2017). Movements and Foraging Habitats of Great Shearwaters (Puffinus Gravis) in the Gulf of Maine. Mar. Ecol. Prog. Ser. 574, 211–226. doi: 10.3354/meps12168
Powers K. D., Wiley D. N., Robuck A. R., Olson Z. H., Welch L. J., Thompson M. A., et al. (2020). Spatiotemporal Characterization of non-Breeding Great Shearwaters Ardenna Gravis Within Their Wintering Range. Marine Ornithol. 48, 215–229.
Quintana-Rizzo E., Leiter S., Cole T. V., Hagbloom M. N., Knowlton A. R., Nagelkirk P., et al. (2021). Residency, Demographics, and Movement Patterns of North Atlantic Right Whales Eubalaena Glacialis in an Offshore Wind Energy Development in Southern New England, USA. Endang. Spec. Res. 29, 251–268. doi: 10.3354/esr01137
R Core Team (2019). “R: A Language and Environment for Statistical Computing,” in R Foundation for Statistical Computing(Vienna, Austria). Available at: https://www.R-project.org/.
Record N., Runge J., Pendleton D., Balch W., Davies K., Pershing A., et al. (2019). Rapid Climate-Driven Circulation Changes Threaten Conservation of Endangered North Atlantic Right Whales. Oceanography 32, 162–169. doi: 10.5670/oceanog.2019.201
Renner I. W., Elith J., Baddeley A., Fithian W., Hastie T., Phillips S. J., et al. (2015). Point Process Models for Presence-Only Analysis. Methods Ecol. Evolution. 6, 366–379. doi: 10.1111/2041-210X.12352
Robbins J. (2007). “Structure and Dynamics of the Gulf of Maine Humpback Whale Population,” in Doctoral Dissertation (St Andrews, UK: University of St Andrews).
Robbins J. (2012). Scar-based inference into Gulf of Maine humpback whale entanglement: 2010. Technical report. (Woods Hole, MA: National Marine Fisheries Service). Available from http://www.nefsc.noaa.gov/psb/docs/HUWHScarring%28Robbins2012%29.pdf (accessed December 2021).
Robbins J., Zerbini A. N., Gales N., Gulland F. M. D., Double M., Clapham P. J., et al. (2013). “Satellite Tag Effectiveness and Impacts on Large Whales: Preliminary Results of a Case Study With Gulf of Maine Humpback Whales,” in Report SC/65a/SH05 Presented to the International Whaling Commission Scientific Committee(Jeju, Korea).
Runge C. A., Martin T. G., Possingham H. P., Willis S. G., Fuller R. A. (2014). Conserving Mobile Species. Front. Ecol. Environment. 12, 395–402. doi: 10.1890/130237
Saez L., Lawson D., DeAngelis M. L. (2020). “Large Whale Entanglements Off the U.S. West Coast, From 1982–2017,” in NOAA Tech. Memo (Silver Spring, MD: United States Department of Commerce).
Santora J. A., Mantua N. J., Schroeder I. D., Field J. C., Hazen E. L., Bograd S. J., et al. (2020). Habitat Compression and Ecosystem Shifts as Potential Links Between Marine Heatwave and Record Whale Entanglements. Nat. Commun. 11, 1–12. doi: 10.1038/s41467-019-14215-w
Silber G. K., Adams J. D., Bettridge S. (2012). Vessel Operator Response to a Voluntary Measure for Reducing Collisions With Whales. Endang. Spec. Res. 17, 245–254. doi: 10.3354/esr00434
Silva T. L., Wiley D. N., Fay G. (2021). A Hierarchical Modelling Approach to Estimating Humpback Whale Abundance From Sand Lance Abundance. Ecol. Modelling. 456, 109662. doi: 10.1016/j.ecolmodel.2021.109662
Silva T. L., Wiley D. N., Thompson M. T., Hong P. H., Kaufman L., Suca J. J., et al. (2020). High Collocation Between Sand Lance and Protected Top Predators: Implications for Conservation and Management. Conserv. Sci. Pract. 3, e274. doi: 10.1111/csp2.274
Staudinger M. D., Goyert H., Suca J. J., Coleman K., Welch L., Llopiz J. K., et al. (2020). The Role of Sand Lances (Ammodytes Sp.) in the Northwest Atlantic Ecosystem: A Synthesis of Current Knowledge With Implications for Conservation and Management. Fish Fisheries 21, 522–556. doi: 10.1111/faf.12445
Suca J. J., Ji R., Baumann H., Pham K., Silva T. L., Wiley D. N., et al. (2022). Larval Transport Pathways From Three Prominent Sand Lance Habitats in the Gulf of Maine. Fish. Oceanogr. 31, 333–352 doi: 10.1111/fog.12580
Suca J. J., Wiley D. N., Silva T. L., Robuck A. R., Richardson D. E., Glancy S. G., et al. (2021). Sensitivity of Sand Lance to Shifting Prey and Hydrography Indicates Forthcoming Change to the Northeast US Shelf Forage Fish Complex. ICES J. Mar. Sci. 78, 1023–1037. doi: 10.1093/icesjms/fsaa251
Tittensor D. P., Beger M., Boerder K., Boyce D. G., Cavanagh R. D., Cosandey-Godin A., et al. (2019). Integrating Climate Adaptation and Biodiversity Conservation in the Global Ocean. Sci. Adv. 5, eaay9969. doi: 10.1126/sciadv.aay9969
van der Hoop J. M., Corkeron P., Kenney J., Landry S., Morin D., Smith J., et al. (2016). Drag From Fishing Gear Entangling North Atlantic Right Whales. Mar. Mamm. Sci. 32, 619–642. doi: 10.1111/mms.12292
van der Hoop J., Corkeron P., Moore M. (2017). Entanglement is a Costly Life-History Stage in Large Whales. Ecol. Evol. 7, 92–106. doi: 10.1002/ece3.2615
van der Hoop J. M., Moore M. J., Barco S. G., Cole T. V., Daoust P. Y., Henry A. G., et al. (2013). Assessment of Management to Mitigate Anthropogenic Effects on Large Whales. Conserv. Biol. 27, 121–133. doi: 10.1111/j.1523-1739.2012.01934.x
van der Hoop J. M., Vanderlaan A. S., Cole T. V., Henry A. G., Hall L., Mase-Guthrie B. (2015). Vessel Strikes to Large Whales Before and After the 2008 Ship Strike Rule. Conserv. Lett. 8, 24–32. doi: 10.1111/conl.12105
Vanderlaan A. S., Taggart C. T. (2009). Efficacy of a Voluntary Area to be Avoided to Reduce Risk of Lethal Vessel Strikes to Endangered Whales. Conserv. Biol. 23, 1467–1474. doi: 10.1111/j.1523-1739.2009.01329.x
Velarde E., Anderson D. W., Ezcurra E. (2019). Seabird Clues to Ecosystem Health. Science 365, 116–117. doi: 10.1126/science.aaw9999
Welch H., Hazen E. L., Bograd S. J., Jacox M. G., Brodie S., Robinson D., et al. (2019). Practical Considerations for Operationalizing Dynamic Management Tools. J. Appl. Ecol. 56, 459–469. doi: 10.1111/1365-2664.13281
Wiley D. N., Asmutis R. A., Pitchford T. D., Gannon D. P. (1995). Stranding and Mortality of Humpback Whales, Megaptera Novaeangliae, in the Mid-Atlantic and Southeast United States 1985-1992. Fishery Bull. 93, 196–205.
Wiley D., Hatch L., Schwehr K., Thompson M., MacDonald C. (2013). Marine Sanctuaries and Marine Planning. Coast Guard Proc. Marine Saf. Secur. Council. 70, 10–15.
Wiley D. N., Moller J. C., Zilinskas K. A. (2003). The Distribution and Density of Commercial Fisheries and Baleen Whales Within the Stellwagen Bank National Marine Sanctuary: July 2001–June 2002. Marine Technol. Soc. J. 37, 35–53. doi: 10.4031/002533203787537384
Winton M. V., Fay G., Hass H. L., Arendt M., Barco S., James M. C., et al. (2018). Estimating the Distribution and Relative Density of Satellite-Tagged Loggerhead Sea Turtles Using Geostatistical Mixed Effects Models. Mar. Ecol. Prog. Ser. 586, 217–232. doi: 10.3354/meps12396
Wishner K. F., Schoenherr J. R., Beardsley R., Chen C. (1995). Abundance, Distribution and Population Structure of the Copepod Calanus Finmarchicus in a Springtime Right Whale Feeding Area in the Southwestern Gulf of Maine. Cont. Shelf. Res. 15, 475–507. doi: 10.1016/0278-4343(94)00057-T
Keywords: great shearwaters, humpback whales, vessel strike, entanglement, climate change, tracking, biologging, Stellwagen Bank National Marine Sanctuary
Citation: Silva TL, Powers KD, Robbins J, Asmutis-Silvia R, Cole TVN, Hill AN, Howes LJ, Mayo CA, Schulte D, Thompson MA, Welch LJ, Zerbini AN and Wiley DN (2022) Exploring the Use of Seabirds as a Dynamic Ocean Management Tool to Mitigate Anthropogenic Risk to Large Whales. Front. Mar. Sci. 9:837604. doi: 10.3389/fmars.2022.837604
Received: 16 December 2021; Accepted: 03 May 2022;
Published: 06 June 2022.
Edited by:
Tommy Clay, Environmental Defense Fund, United StatesReviewed by:
Rebecca L Lewison, San Diego State University, United StatesSara M Maxwell, University of Washington Bothell, United States
Copyright © 2022 Silva, Powers, Robbins, Asmutis-Silvia, Cole, Hill, Howes, Mayo, Schulte, Thompson, Welch, Zerbini and Wiley. This is an open-access article distributed under the terms of the Creative Commons Attribution License (CC BY). The use, distribution or reproduction in other forums is permitted, provided the original author(s) and the copyright owner(s) are credited and that the original publication in this journal is cited, in accordance with accepted academic practice. No use, distribution or reproduction is permitted which does not comply with these terms.
*Correspondence: Tammy Silva, dGFtbXkuc2lsdmFAbm9hYS5nb3Y=