 Hannah von Hammerstein
 Renee O. Setter
 Martin van Aswegen
 Jens J. Currie
 Stephanie H. Stack
- 1Department of Geography and Environment, University of Hawai’i at Mānoa, Honolulu, HI, United States
- 2Marine Mammal Research Program, Hawai’i Institute of Marine Biology, University of Hawai’i at Mānoa, Kaneohe, HI, United States
- 3Pacific Whale Foundation, Wailuku, HI, United States
- 4Pacific Whale Foundation Australia, Urangan, QLD, Australia
Anthropogenic greenhouse gas emissions are triggering changes in global climate and warming the ocean. This will affect many marine organisms, particularly those with high site fidelity and habitat temperature preferences, such as humpback whales on their breeding grounds. To study the impacts of a warming ocean on marine organisms, large-scale projections of climatic variables are crucial. Global models are of 0.25 - 1° (~25-100 km) resolution, and not ideal to predict localized changes. Here, we provide 0.05° resolution (~5 km) sea surface temperature (SST) projections, statistically downscaled using the delta method. We illustrate the shifting isotherms of the critical 21 and 28°C boundaries, which border the climatic envelope that humpback whales prefer for their breeding grounds, over the course of the 21st century on a decadal temporal resolution. Results show by the end of the 21st century, 35% of humpback whale breeding areas will experience SSTs above or within 1°C of current thresholds if present-day social, economic, and technological trends continue (‘middle of the road’ CMIP6 greenhouse gas trajectory SSP2-RCP4.5). This number rises to 67% under the scenario describing rapid economic growth in carbon-intensive industries (‘fossil-fueled development’ CMIP6 greenhouse gas trajectory SSP5-RCP8.5). These projections highlight the importance of reducing global greenhouse gas emissions and minimizing further SST increases to preserve ecological integrity of humpback whale breeding areas. In this context, our results emphasize the need to focus on protection of critical ocean habitat and to provide high-resolution climate data for this purpose.
Introduction
Anthropogenic greenhouse gas emissions are impacting the global climate and are projected to cause irreversible ocean temperature increases on centennial to millennial time scales (IPCC, 2021). Throughout the 21st century, climatic changes in the oceans are projected to have consequences across all ecological levels, from individual organisms to ecosystems (Sunday et al., 2012; Vergés et al., 2019; Pinsky et al., 2020). In response to changing conditions in the oceans, free-swimming marine organisms will adapt physiologically as far as their tolerance limits allow or will avoid unsuitable conditions by following the geographic shifts of their environmental niche (Donelson et al., 2019; Pinsky et al., 2020). While small, short-lived organisms may adapt fast enough to climatic changes to remain in their current geographic ranges, large long-lived mammals will likely not be able to adapt in time, instead responding with poleward shifting geographic ranges or face increased risk of extinction (Learmonth et al., 2006; Hastings et al., 2020). Climate-driven species distribution shifts have progressed four times faster in marine taxa compared to terrestrial taxa, leading to the development of novel interspecific dynamics, changes in ecosystem functions and large-scale redistributions of marine resources (Stein et al., 2014; Pecl et al., 2017; Vergés et al., 2019). To develop effective conservation management strategies, it is important to anticipate potential habitat range shifts, especially regarding long-lived, slow adapting species of high ecological and economical importance.
Fitting in this category are humpback whales (Megaptera novaeangliae), whose presence is of great ecological, economic, and cultural importance within their seasonal habitats (O’Connor et al., 2009; National Oceanic and Atmospheric Administration, 2020; Savoca et al., 2021). Humpback whale populations are typically migrating between cold, polar foraging areas and warmer tropical breeding grounds, utilized for calving and mating. Reasons for such migrations are debated, but are likely related to reduced predation risk and/or energetics, specifically in relation to calves (Rasmussen et al., 2007; Avgar et al., 2014). Lactating humpback whales accumulate 26 – 37% higher lipid stores than non-lactating whales to offset elevated energetic demands associated with reproduction (Irvine et al., 2017). Such energetic stressors experienced by lactating females typically occur while fasting on distinct breeding grounds to which they show high site fidelity (Calambokidis et al., 2008; Christiansen et al., 2016). Tracking environmental variables connected to habitat suitability of these distinct sites is therefore crucial for effective management and protection of the species (Dransfield et al., 2014). While on a localized scale within breeding grounds, humpback whale distribution is likely associated with bathymetry and does not respond to minor sea surface temperature (SST) variations (Cartwright et al., 2019), humpback whale breeding and calving grounds generally seem to be associated with an envelope of suitable temperatures ranging between 21 and 28°C (Rasmussen et al., 2007; Derville et al., 2019). This temperature envelope could be an important indicator for upcoming population shifts, and humpback whale encounter rates were shown to respond to variation in SSTs on the Oceanian and East Australian breeding grounds, with greater encounter rates corresponding to cooler temperatures within the 21–28°C range (Smith et al., 2012a; Derville et al., 2019). Over the next century, SST increases are expected for most ocean regions, even under implementation of moderate global greenhouse gas mitigation efforts (Zhang et al., 2016). Should the mean SST in respective humpback whale breeding months rise above the optimal temperature range, distribution shifts are the most likely response (Sydeman et al., 2015; Silber et al., 2017). Such shifts could trigger substantial changes in marine systems of the breeding areas with consequences on ecological and economic levels (O’Connor et al., 2009; Savoca et al., 2021).
To understand the trends of projected climate-driven SST increases in humpback whale habitats, climatologic data needs to be available on a spatial resolution suitable to detect changes in these distinct areas that are often of small extent or along complex coastlines. Global SST projections derived from the latest Coupled Model Intercomparison Project (CMIP6; World Climate Research Programme) are of 0.25-1° (~25-100 km at the equator) resolution, encompassing crucial humpback whale breeding grounds, such as the Hawaiian Islands, in just a few grid cells. This is too coarse to draw conclusions on localized ecological issues and depict the habitat affinities of these animals in such coastal areas. Downscaling the data to a high resolution suitable to represent climate on a regional scale is crucial in creating a solid basis for understanding such studies. Statistical downscaling via the delta method approach can be a robust yet relatively low computational cost tool to produce high-resolution projections by adding monthly low-resolution SST change increments derived from general circulation models (GCMs) on present-day high resolution SST fields (Pourmokhtarian et al., 2016). For example, the delta method has been used to downscale global temperature and precipitation models for Alaskan stakeholders (Walsh et al., 2018), to downscale various global CMIP5 projections for climate change impact assessment purposes (Navarro Racines et al., 2019), and to downscale European climate data for studying regional and local climatic effects (Moreno and Hasenauer, 2016).
Here, we downscale decadal 1-degree (~100 km at the equator) SST projections to a 0.05-degree resolution (~5 km at the equator) in order to track changes in the 21–28°C isotherm envelope in relation to humpback whale habitats globally. This work compares SST projections between two greenhouse gas concentration trajectories (‘middle of the road’ and ‘fossil-fueled development’) and visualizes the shifting isotherm lines of the thermal envelopes bordering humpback whale breeding areas for each scenario. This information could be used to anticipate possible distribution shifts and consequent changes in the ecosystems on a finer scale than previously possible, likely leading to more substantiated conclusions. Furthermore, it can be fed into multivariate models to allow for more accurate modelling of current drivers and future trends in the distribution of various taxa. We focus on the example of shifting thermal boundaries of humpback whale breeding grounds, analyze our results from a conservation perspective, discuss options for climate-flexible management strategies and opportunities to use these results to inspire climate mitigation measurements.
Materials and Methods
The future SST conditions were computed with a delta method statistical downscaling approach (Ramírez Villegas and Jarvis, 2010). In this methodology, monthly SST warming increments derived from CMIP6 projections (‘deltas’) are added to recent high-resolution observational SST data to produce a high-resolution map of SST changes over the upcoming century. This downscaling method has the advantage of allowing inclusion of the wide array of relevant climate variables and modelling power of global CMIP models while effectively bias correcting the projections through the usage of observationally-based high-resolution reference data (Navarro-Racines et al., 2020). The simplicity of the approach comes with a number of limitations that will be discussed in detail in the limitations section. The two scenarios that were chosen for this analysis are Shared Socio-economic Pathway 2-4.5 (‘middle of the road’ SSP2-RCP4.5), describing a future of medium challenges for mitigation and adaptation, and Shared Socio-economic Pathway 5-8.5 (‘fossil-fueled development’ SSP5-RCP8.5), describing a future of high human development paired with high, fossil-fueled economic growth (O’Neill et al., 2016; O’Neill et al., 2017). R code to replicate the methodology is provided in an online repository, allowing for further application of this method to other climate variables, climate change trajectories, or time scales. A workflow diagram can be accessed in the supplementary materials (Supplementary Figure 1).
Deriving ‘Delta’ Values From CMIP6 Projections
Global SST CMIP6 projections for the scenarios were extracted from the CMIP6 data portal (https://esgf-node.llnl.gov/search/cmip6/, World Climate Research Programme, 2019; see Supplementary Table 1). This was done for the months with the highest humpback whale abundance in breeding areas of the Northern Hemisphere (February) (Jorge Urbán and Anelio Aguayo, 1987; Kobayashi et al., 2016; Martin et al., 2021) and the Southern Hemisphere (August) (Jenner et al., 2001; Trudelle et al., 2018; Derville et al., 2019) for each year until 2100. Historical CMIP6 data for the months of August and February from the same model ensemble were extracted for years 1985 to 2001 (see Supplementary Table 1). SST values were regridded with bilinear interpolation to a rectilinear grid of 1° resolution on a WGS 1984 projection using Climate Data Operator v. 1.9.7.1 (Schulzweida, 2019). This interpolation was done to match the projection of the CMIP data to the target high-resolution SST data. SST data was then imported into R v.4.0.3 (R Core Team, 2020) using the ‘raster’ R package v.3.4-5 (Hijmans, 2020). From the annual data, mean SSTs were calculated for each of the two months for the historical time period (1985–2001) as well as each future decade until 2100 for both climate trajectories. SST change (‘delta’) was computed as the difference between the projected mean monthly SST per future decade in February and August and the 1985-2001 historical CMIP6 data for February and August, for each of the 18 ‘fossil-fueled development’ scenario and 19 ‘middle-of-the-road’ scenario CMIP6 ensemble models, respectively. Multi-model medians of ‘delta’ values for each decade were then calculated. Mean and median are both established summary statistics for multi-model ensembles (Sillmann et al., 2013; Martre et al., 2015). A Taylor diagram was used to visually compare the multi-model mean and median to empirical SST data and, in this case, the multi-model median proved to be a better fit. A list of these models as well as a Taylor diagram showing the mean, median, correlation and standard deviation among the ensemble models can be found in the supplementary material section (Supplementary Table 1 and Supplementary Figure 2). Using a multi-GCM ensemble in downscaling approaches reduces uncertainty induced by individual GCM simulations, allowing for a more robust projection of future climate (Xu et al., 2019).
Adding Delta to High-Resolution Climatologies
The ‘delta’ SST change increments were added to observational high-resolution mean SST for February and August. For this purpose, 1985-2001 monthly mean SST climatology for February and August at 0.05-degree resolution was derived from the ESA (European Space Agency) Sea Surface Temperature Climate Change Initiative (Good et al., 2019). This data source was chosen due to the high product resolution, suitable for a variety of different uses and filling a gap that is unlikely to be addressed by dynamical downscaling approaches in the near future, the availability of a historical data timeframe matching our needs, and the availability of monthly data needed for our purpose. The 1985-2001 time period was chosen for best possible overlap with the period in which the data for the thermal envelope of 21-28°C was generated (Rasmussen et al., 2007), in order to minimize possible error due to deviations of SST and thus deviations from the basic assumption of the correlation between SST and whale presence in breeding areas. By adding the calculated CMIP6 SST ‘delta’ values to this current SST data, we produced a 0.05° (~5 km) resolution raster of future SST projections. This step adds a bias correction to the CMIP6 modelled data since the ESA high-resolution observationally based SST data contains empirical information on small-scale SST variations which are factored into the final product. Processing times were optimized using the ‘doParallel’ v.1.0.16 and ‘foreach’ v.1.5.1 R packages (Microsoft Corporation and Weston, 2020a; Microsoft Corporation and Weston, 2020b).
Visualizing the Data
The resulting 0.05° WGS 1984 projections were imported into QGIS v.3.16.1 (QGIS Development Team, 2021) and mapped with isotherm contours corresponding to lower (21°C) and upper (28°C) isotherms associated with humpback whale breeding grounds. Outer humpback whale breeding area coordinates were derived from the compilation published in Rasmussen et al., 2007 and classified as 14 Distinct Population Segments (DPS) identified by NOAA (NMFS and NOAA, 2016). Numerical population codes were assigned to these segments to simplify their representation and comparability in figures and tables.
Results
Comparison of Coarse CMIP6 SST Data and Downscaled SST Data
The downscaled data show clear improvements in resolution when compared with raw mean values of the CMIP6 SST models used in this study (Figure 1). Details of SSTs along the coastlines are visible on a km-scale in the downscaled data, allowing for better estimation of local changes in future SST patterns. SST in DPS 6 (Central America) is displayed with only 31 grid cells in the raw data (Figure 1A) and with 12,230 cells in the downscaled data (Figure 1B). The bias correction step of the downscaling approach is resulting in small-scale SST differences when comparing coarse CMIP6 data and downscaled data (compare Figures 1A, B). On a global level, the mean difference in SST between coarse CMIP6 SST data and downscaled SST data is -0.36°C (SD = 0.97) but varies by region. While the bias correction leads to net decreases in SST in the low and high latitudes, it leads to net SST increases in the tropics and subtropics where most humpback whale breeding areas are located. The differences in SST values between coarse CMIP6 data and downscaled data were mapped globally and can be accessed in Supplementary Figure 3. These differences in SST values have an impact on the number of humpback whale breeding areas approaching the critical 28°C isotherm, with this number being 8% higher according to the downscaled SST data when compared to the coarse CMIP6 SST data. Tables with detailed comparisons of SST increases in humpback whale breeding grounds between coarse CMIP6 multi-model median and downscaled data are available in the supplementary materials (Supplementary Tables 2, 3).
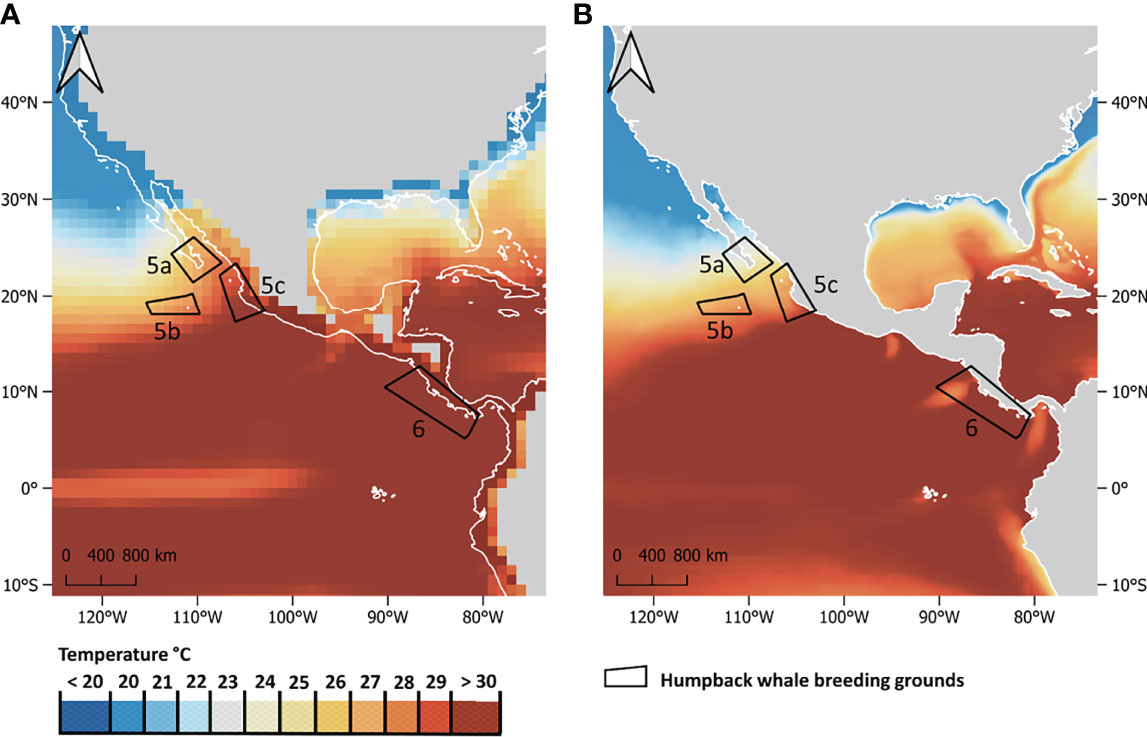
Figure 1 Comparison of (A) non-downscaled mean CMIP6 SST data at a 1° (~100 km at the equator) resolution and (B) statistically downscaled CMIP6 SST data at a 0.05° (~5 km at the equator) resolution. SSTs projections shown are for the month of February, scenario SSP5-RCP8.5 by the year 2100. Boxes outline humpback whale DPS 5a (Mexico: Baja California), 5b (Mexico: Revillagigedos), 5c (Mexico: Mainland) and 6 (Central America).
Fossil-Fueled Development Scenario SSP5-RCP8.5
Mean SST in 64% of humpback whale breeding habitats in the Northern Hemisphere and 69% of humpback whale breeding habitats in the Southern Hemisphere could rise beyond or near (within less than 1°C of) the 28°C isotherm by the end of the 21st century if global greenhouse gas emissions develop according to the ‘fossil-fueled development’ scenario (Figures 2B, C; Tables 1, 2). The current 28°C warm-limit isotherm will shift poleward by ~10-degree latitudes in the Northern and ~5-degree latitudes in the Southern Hemisphere under this high emission scenario (Figures 2B, C). The warmest humpback whale breeding area in the Northern Hemisphere is located in the Eastern Tropical Pacific and utilized by the endangered Central American Population Segment. This area could reach unprecedented mean SST in February, reaching up to 32°C by 2100, if no greenhouse gas mitigation measures are implemented (Table 1). In the Southern Hemisphere, the Southeast Pacific population segment is exposed to the highest mean August SST, reaching ~30°C at the end of the 21st century (Table 2). Animated decadal projections (2020-2100) can be found in the supplementary materials.
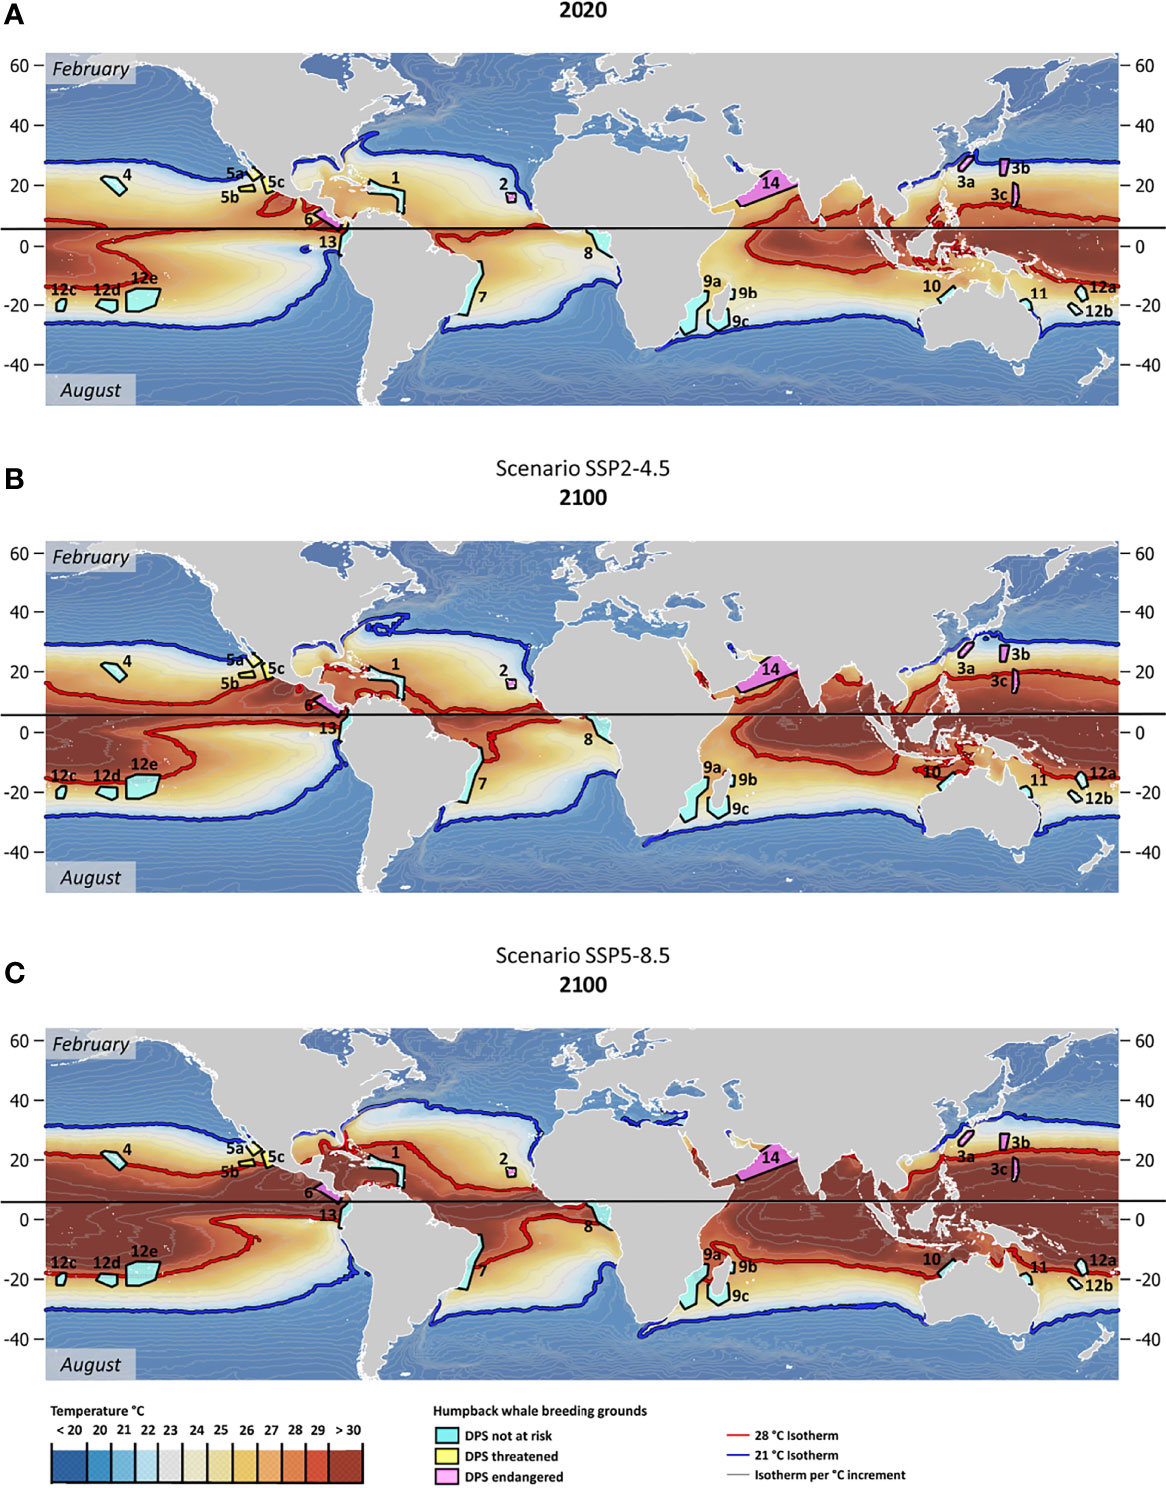
Figure 2 (A) Year 2020 mean monthly SST (in °C) for February (Northern Hemisphere) and August (Southern Hemisphere); (B) Year 2100 mean monthly SST projections for February (Northern Hemisphere) and August (Southern Hemisphere) under the SSP2-RCP4.5 greenhouse gas concentration scenario and (C) Year 2100 mean monthly SST projections for February (Northern Hemisphere) and August (Southern Hemisphere) under the SSP5-RCP8.5 greenhouse gas concentration scenario. Polygons correspond to humpback whale breeding areas colored according to the Distinct Population Segments’ (DPS) conservation status. Grey lines are corresponding to 1°C isotherms. The 21°C isotherm is highlighted in blue and the 28°C isotherm in red. Northern and Southern Hemispheres (February and August means) separated by a black bar. Numerical population codes correspond to DPS as listed in Tables 1 and 2.
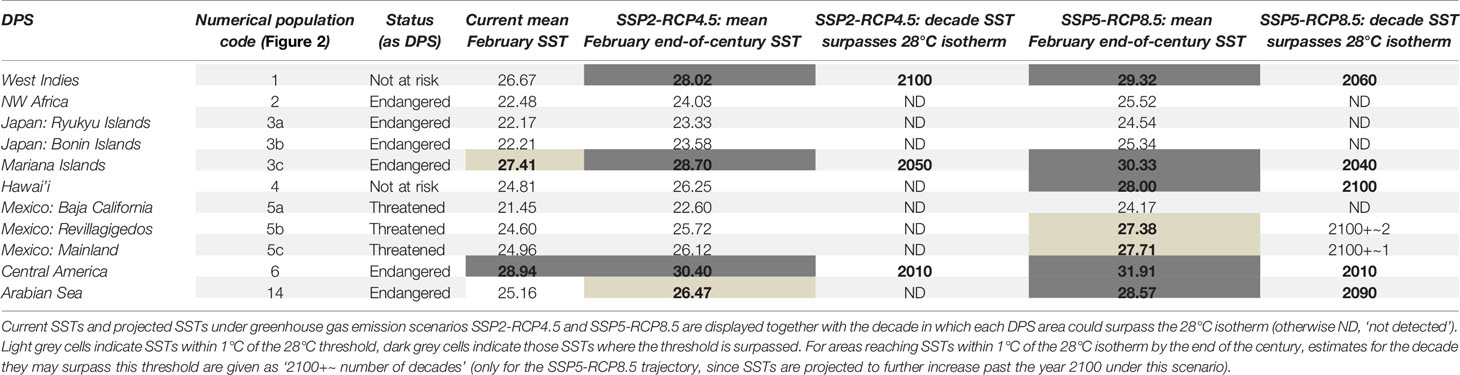
Table 1 Northern Hemisphere humpback whale DPS names, numerical population codes (corresponding to Figure 2) and conservation status.
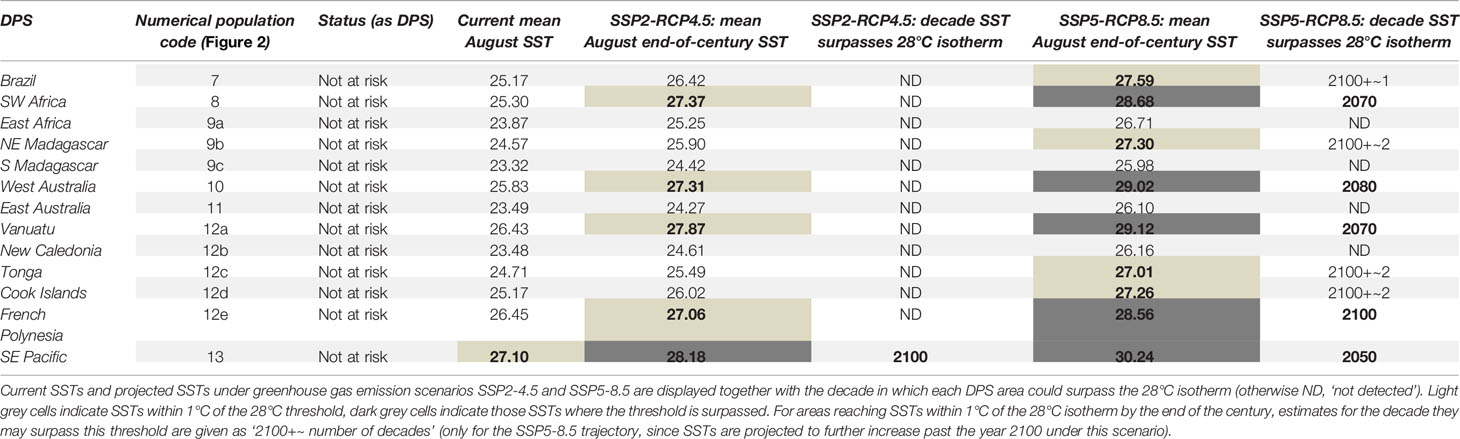
Table 2 Southern Hemisphere humpback whale DPS names, numerical population codes (corresponding to Figure 2) and conservation status.
Middle of the Road Scenario SSP2-RCP4.5
Following the ‘middle of the road’ emission trajectory, by the end of the 21st century ~ 36% of humpback whale breeding areas in the Northern Hemisphere and ~38% on the Southern Hemisphere would experience SSTs above (or within a 1°C range of) 28°C in the months most frequented by humpback whales (Figures 2A, B; Tables 1, 2). End-of-century mean monthly SST projections for February and August under the ‘middle of the road’ emission scenario show a substantially weaker latitudinal shift of the suitable temperature envelope compared to the ‘fossil-fueled development’ scenario. The 28°C isotherm would shift poleward by ~5 degrees latitude in the Northern and ~2 degrees latitude in the Southern Hemisphere under such mitigation measures (Figures 2A, B). Global implementation of moderate greenhouse gas mitigation measures as outlined in the middle-of-the-road scenario could prevent ~ 50% of the humpback whale areas pushed above the 28°C isotherm under ‘fossil-fueled development’ scenario from reaching that threshold. The maximum temperatures under this scenario are also far less pronounced. Central America, the hottest humpback whale breeding area worldwide, could experience SSTs up to 30°C by the end of the century. In the Southern Hemisphere, the maximum mean SST in August 2100 are expected to be achieved in the Southeastern Pacific. With ~28°C, they are just touching on the maximum temperatures currently recorded in humpback whale breeding areas. Animated decadal projections (2020-2100) can be found in the Supplementary Materials.
Discussion
SSTs Throughout the 21st Century and Beyond
Past analyses have shown that humpback whale breeding areas are found worldwide in warm coastal waters restricted to a temperature envelope of 21–28°C, irrespective of latitude (Rasmussen et al., 2007). Notably, in the decade since these data were published, the warmest breeding area (Central America) has already risen above 28°C mean February SST. Population trend estimates for this DPS are currently lacking (Sato and Wiles, 2021) therefore it is not known what population-level impacts may be occurring as a result of this temperature change. Our results indicate clear latitudinal shifts of the 28°C surface isotherm throughout the 21st century, causing mean 2100 SSTs in up to ~ 67% (‘fossil-fueled development’ trajectory) of humpback whale breeding areas globally to rise above any historically utilized thermal envelope. It also must be considered that SST increases do not necessarily stop by the year 2100. While in the ‘middle of the road’ trajectory, temperature increases may plateau at the end of the 21st century, this is not the case if the global community continues to follow a high-emission ‘fossil-fueled development’ trajectory. Continuing on the ‘fossil-fueled development’ trajectory would mean that all areas marked as within one degree of 28°C by the year 2100 (as indicated in light grey in Tables 1, 2) may well surpass this threshold in the first decade of the 22nd century. Moreover, mean SSTs close to the tolerance limit of organisms may reduce their capacity to cope with marine heatwaves, which are projected to increase in frequency, duration and intensity over the 21st century (Oliver et al., 2019).
Humpback Whale Ecology Implications
In order to follow these latitudinal SST shifts and continue wintering, breeding and calving in a 21–28°C temperature range, humpback whales would need to relocate their breeding habitats. Habitat range shifts are considered the most likely response of large cetaceans to climate change (Sydeman et al., 2015). These shifts could occur at differing rates depending on the location. Along coastlines or far spread island groups, gradual latitudinal population shifts matching the temporal rate of isotherm shifts are possible, with areas along the higher SST isotherms being affected more immediately. In contrast, in isolated areas such as the Hawaiian Islands these shifts could prove a difficult task as there are no suitable areas available in proximity. Humpback whale distribution shifts require availability of suitable habitats in proximity to the previously occupied range, due to their reliance on social aggregations and male song (Derville et al., 2019). Isolation is a restricting factor for this process, as it prevents these continuous shifts guided by social behavior. Remaining in suboptimal habitat conditions however could induce chronic stress and impair fitness, which can ultimately lead to population declines (Wright et al., 2011; Tulloch et al., 2019). Shrinking population sizes due to suboptimal habitat conditions could severely impact ecosystem integrity and livelihoods in such remote breeding areas, as well as in the associated summer foraging habitats in higher latitudes.
If suboptimal habitat conditions were to cause a decline of humpback whale population sizes, there would be further compounding effects on the global carbon budget and nutrient cycle. Humpback whales are important ecosystem engineers; they are known to accumulate carbon throughout their life and sequester that carbon at the seafloor when whale carcasses sink to the bottom of the ocean (Roman et al., 2014). Whales also cycle nutrients throughout the ocean by feeding and defecating while diving and migrating which, in turn, stimulates primary production in the ocean (Roman et al., 2014). Therefore, to mitigate anthropogenic climate change and sustain primary productivity levels, it is important to maintain or increase whale stocks around the world.
It is unclear whether there could be any possible positive consequences associated with latitudinal distribution shifts in those areas where shifts are an option. Shortened migration routes could benefit energetic budgets of lactating humpback whale cows (Braithwaite et al., 2015). However, this is dependent on a variety of other environmental factors determining the suitability of these alternative habitats, such as bathymetry or anthropogenic activities. Another possible consequence of SST increases are temporal shifts in migration patterns. However, the timing of migration may be dictated by environmental conditions in the summer feeding habitats rather than in the winter breeding areas (Ramp et al., 2015). Apart from latitudinal or temporal shifts in their migration, humpback whales could be pushed into deeper waters further from the shores of their breeding grounds to stay within habitable temperatures.
Interpreting Results From a Conservation Perspective
In the Northern Hemisphere, four of the humpback whale breeding areas of DPS that have a ‘threatened’ or ‘endangered’ conservation status under the Endangered Species Act (ESA) would reach SSTs surpassing past thermal maxima in their breeding areas by the end of the century under the ‘fossilfueled development’ trajectory. This represents 50% of the humpback whale breeding areas of DPS currently listed as ‘threatened’ or ‘endangered’ under the ESA globally. Under the ‘middle of the road’ trajectory, only two breeding areas of the currently threatened or endangered DPS would surpass that SST threshold. Notably, one of the most vulnerable DPS, the Central American DPS listed as ‘endangered’, utilizes the breeding area with the most extreme SSTs and has already surpassed the 28°C isotherm within the last decade. In the 2016 NOAA Revision of Species-Wide Listing, this DPS population size was estimated at ~411 individuals; vessel collisions and entanglement in fishing gear were listed as the greatest threats, and the Extinction Risk Analysis concluded a moderate to high risk of extinction (NMFS and NOAA, 2016). End-of-century breeding months temperatures as high as 30-32°C, as shown for this area by our results, could add an additional stressor to this vulnerable population segment and warrant a reassessment of the Extinction Risk Analysis.
In order to protect vulnerable migratory species such as humpback whales, spatially flexible conservation strategies should be developed for areas along coasts that could facilitate gradual distribution shifts, such as the Central American DPS (Bonebrake et al., 2018). Some frameworks have been proposed in the form of dynamic protected areas, aiming to meet shifting conservation targets (Pressey et al., 2007; Reside et al., 2018; D’Aloia et al., 2019). Detailed data on organisms’ physiological and ecological responses to all relevant climate variables are needed to develop accurate range shift projections that would provide ideal baselines for such reserves. However, such data are currently still lacking for many species, including humpback whales. In order to prepare for these upcoming changes, conservationists and management agencies have to plan complex adaptive measures such as dynamic protected areas based on information that is currently available (D’Aloia et al., 2019). Simple metrics aimed at estimating shifts in species’ distributions without the need for detailed ecological models, such as climate velocity (Brito-Morales et al., 2018) or shifting isotherm boundaries as presented in this paper, can therefore be important and readily available tools for decision-makers. These metrics can be used to point out general recommendations for the development of reserve networks, considering suitable corridors for movement as well as the need for protected area establishment in areas of new or future suitability (Bonebrake et al., 2018). In spatially isolated breeding areas, where gradual distribution shifts are not possible, other measures of preparation and protection have to be taken. Whales will likely be exposed to suboptimal thermal conditions, which can act as a stressor on the organism (Chambault et al., 2018; Sanderson and Alexander, 2020). Given their preference for coastal habitats, humpback whales are often exposed to additional stressors such as anthropogenic noise and approaches by vessels (Currie et al., 2021). Being subjected to multiple stressors can have compounding negative effects on organism’s health (IPCC, 2019) and consequently weaken the fitness of a population segment (Pirotta et al., 2019). This emphasizes the importance to rigorously target and reduce other possible stressors through implementation of sector-specific management strategies on a local level in current and projected humpback whale habitats, for example through regulation of vessel numbers and speed. Such actions would be even more crucial if humanity cannot manage to reach sufficient emission mitigation globally to keep temperatures within known thermal tolerance ranges for humpback whales, especially in geographically isolated breeding areas.
Lastly, the development of simple metrics such as shifting isotherms as presented in this paper to track climatic changes in the habitat of charismatic flagship species opens opportunities to inspire climate mitigation measurements in policy and public (Thomas‐Walters and Raihani, 2017). Large charismatic marine mammals can invoke emotional responses in supporters, stakeholders and donors which can benefit climate mitigation advocacy, a prominent example being the plight of polar bears on shrinking ice shields (Smith et al., 2012b). Humpback whales, especially mother calf pairs in their breeding areas, a favorite among whale watching tourists, could convey a similar message. Humpback whales are an especially interesting flagship species to advocate climate action, as their successful protection would boost emission mitigation through the species’ ecological function as a carbon sequesterer (Roman et al., 2014). Developing easily understandable visual aids, such as the red isotherm lines shifting across humpback whale breeding habitats provided in this study (Supplementary Materials) can be beneficial in disseminating the key message to a broad, non-scientific audience. Furthermore, these visualizations of different greenhouse gas emission scenarios provide a clear and traceable trajectory, highlighting possible consequences of current global policy efforts and provoking demands for more rigorous action.
Limitations of the Delta Method Downscaling Approach
There are several limitations associated with statistical downscaling of climatological data following the delta method. The disaggregation of coarse grid values is based on the assumption that the same temperature trends are prevalent in the entire grid cell, which may not be the case. This makes the delta approach less accurate than regional climate models, since the approach assumes climate drivers act at coarse scales while local-scale dynamics remain unchanged. This means, while possible small-scale climate interactions are incorporated in the model through the observational high-resolution baseline, possible future changes in their dynamics are not captured. Gradual SST downscaling starting at intermediate resolutions to track these small-scale changes as they develop is not possible with the delta approach, as the target resolution is determined by the observationally based data layer. Other downscaling methods, for example dynamical regional downscaling, would be needed for such comparisons. However, a recent study testing the delta method approach robustness and analyzing model error found that this method produces reliable projections of climate variables for use in impact assessment (Navarro-Racines et al., 2020). Another possible limitation is that the modelling process requires some transformations from curvilinear to rectilinear coordinate systems in order to match the CMIP6 data to the observational ESA SST data. Transforming projections, in this case with bilinear interpolation, could always lead to information losses or minor inaccuracies (Dobesch et al., 2013). However, the achieved high resolution and the usage of a multi-model median give the data a higher degree of certainty compared to individual CMIP6 models at a low computational cost (Xu et al., 2019). The results are easier to interpret than coarse projections and therefore applicable tools for various end-users.
Limitations to the Humpback Whale Case Study
It must be emphasized that this case study only aims to visualize potentially critical SST increases in humpback whale breeding grounds and does not claim to make projections on possible future humpback whale population trends. In order to make such projections and gain a more comprehensive perspective, it is crucial to develop multivariate models and address other climatic and ecological key variables within not only the winter breeding but also the summer foraging areas (Meynecke et al., 2020). This would include factors such as changes in climate affecting primary productivity, with potential consequences across the entire food web. Shifting ranges of a multitude of species could affect predator-prey dynamics and intra- as well as interspecific competition.
There are also other possibilities apart from geographic range shifts in which humpback whales could respond to these climatic and ecological drivers, for example shifts in the timing of migrations or in their depth distribution during the breeding season. In order to address these possibilities, it would be necessary to assess SSTs throughout the year and not just limited to the two months of current highest abundance in breeding grounds. Furthermore, it would require including temperatures in different ocean depth layers. Insights into these possible dynamics could be gained by analyzing how varying temperatures in the ocean and humpback whale breeding grounds have corresponded in the past.
Focusing on mean SSTs within the 21-28°C range could represent another limitation to this approach, as it disregards potential hot or cold spikes. However, during recent heatwaves SSTs in some of the humpback whale breeding grounds temporarily surpassed 28°C in the relevant months (Central American DPS, Good et al., 2019), yet humpback whales have returned to these areas in subsequent years. This could indicate that temperatures need to consistently surpass the 21-28°C bands to cause habitat shifts in a long-lived slow responding species such as humpback whales. We would therefore argue that the usage of mean SSTs is a suitable concept for the purpose of this study.
Conclusions
This study showcases the application of the delta method to statistically downscale global SST data on the example of shifting isotherm boundaries of relevance for humpback whale breeding habitats, highlighting the importance of reducing greenhouse gas emissions, implementing mitigation measures and minimizing SST increases. The methodology produces high-resolution visualizations of robust SST projections at relatively low computational cost while adding a layer of bias correction which refines further modelling or study outcomes. The results can be used to create a sense of urgency in climate policy and conservation and act as a guide to data-informed and timely action. Climate strategies should be developed aiming to avoid ocean warming above currently known temperature tolerance levels of humpback whales, especially in light of remaining uncertainties of their ecological responses to SST increases. The results show that even with moderate mitigation measures it is possible to keep temperature ranges in most humpback whale breeding areas within the envelope of known tolerable temperatures. To achieve this level of mitigation, United Nations member states would have to meet all of the national determined mitigation efforts outlined in the agreement of their 26th Conference of Parties (COP26) in order to meet the nearterm emission targets for 2030 (Meinshausen et al., 2021). Unfortunately, recent reports on the state of these commitments show that the member states with the largest economies (G20 states) are projected to fall short of achieving their emission mitigation goals (United Nations Environment Programme, 2021). The possible compounding effects of humpback whale relocations or population declines on ecosystem integrity and ecosystem services are yet another striking example highlighting the need to hold governments and emission-heavy industries accountable to act and to implement effective greenhouse gas mitigation measures with urgency.
Data Availability Statement
The datasets and R code presented in this study can be found in online repositories. The names of the repository/repositories accession number(s) and R code can be found below: https://github.com/rsetter/whalescc.
Author Contributions
Conceptualization was led by HH and supported by RS, MA, JC, and SS. Data curation was led by RS and supported by HH. Computational analysis was performed by RS. HH wrote the original draft and visualized the data. JC and SS supervised the work. All authors reviewed and discussed the manuscript. All authors contributed to the article and approved the submitted version.
Funding
Funding was provided by the University of Hawai’i Department of Geography and Environment and the Pacific Whale Foundation.
Conflict of Interest
The authors declare that the research was conducted in the absence of any commercial or financial relationships that could be construed as a potential conflict of interest.
Publisher’s Note
All claims expressed in this article are solely those of the authors and do not necessarily represent those of their affiliated organizations, or those of the publisher, the editors and the reviewers. Any product that may be evaluated in this article, or claim that may be made by its manufacturer, is not guaranteed or endorsed by the publisher.
Acknowledgments
We thank Dr. Abby G. Frazier for her advice and support in applying the methodology and her feedback on the early manuscript. We acknowledge the World Climate Research Programme, which, through its Working Group on Coupled Modeling, coordinated and promoted CMIP6. We thank the climate modeling groups for producing and making available their model output, the Earth System Grid Federation (ESGF) for archiving the data and providing access, and the multiple funding agencies who support CMIP6 and ESGF.
Supplementary Material
The Supplementary Material for this article can be found online at: https://www.frontiersin.org/articles/10.3389/fmars.2022.837772/full#supplementary-material
References
Avgar T., Street G., Fryxell J. M. (2014). On the Adaptive Benefits of Mammal Migration. Can. J. Zool. 92, 481–490. doi: 10.1139/cjz-2013-0076
Bonebrake T. C., Brown C. J., Bell J. D., Blanchard J. L., Chauvenet A., Champion C., et al. (2018). Managing Consequences of Climate-Driven Species Redistribution Requires Integration of Ecology, Conservation and Social Science. Biol. Rev. 93, 284–305. doi: 10.1111/brv.12344
Braithwaite J. E., Meeuwig J. J., Hipsey M. R. (2015). Optimal Migration Energetics of Humpback Whales and the Implications of Disturbance. Conserv. Physiol. 3, cov001. doi: 10.1093/conphys/cov001
Brito-Morales I., Molinos J. G., Schoeman D. S., Burrows M. T., Poloczanska E. S., Brown C. J., et al. (2018). Climate Velocity Can Inform Conservation in a Warming World. Trends Ecol. Evol. 33, 441–457. doi: 10.1016/j.tree.2018.03.009
Calambokidis J., Falcone E. A., Quinn T. J., Burdin A. M., Clapham P. J., Ford J. K. B., et al. (2008). SPLASH: Structure of Populations, Levels of Abundance and Status of Humpback Whales in the North Pacific (Seattle, WA: Unpubl. Rep. Submitt. by Cascadia Res. Collect. to USDOC). under Contract AB133F-03-RP-0078.
Cartwright R., Venema A., Hernandez V., Wyels C., Cesere J., Cesere D. (2019). Fluctuating Reproductive Rates in Hawaii’s Humpback Whales, Megaptera Novaeangliae, Reflect Recent Climate Anomalies in the North Pacific. R. Soc Open Sci. 6, 181463. doi: 10.1098/rsos.181463
Chambault P., Albertsen C. M., Patterson T. A., Hansen R. G., Tervo O., Laidre K. L., et al. (2018). Sea Surface Temperature Predicts the Movements of an Arctic Cetacean: The Bowhead Whale. Sci. Rep. 8, 1–12. doi: 10.1038/s41598-018-27966-1
Christiansen F., Dujon A. M., Sprogis K. R., Arnould J. P. Y., Bejder L. (2016). Noninvasive Unmanned Aerial Vehicle Provides Estimates of the Energetic Cost of Reproduction in Humpback Whales. Ecosphere 7, e01468. doi: 10.1002/ecs2.1468
Currie J. J., McCordic J. A., Olson G. L., Machernis A. F., Stack S. H. (2021). The Impact of Vessels on Humpback Whale Behavior: The Benefit of Added Whale Watching Guidelines. Front. Mar. Sci. 8, 72. doi: 10.3389/fmars.2021.601433
D’Aloia C. C., Naujokaitis-Lewis I., Blackford C., Chu C., Curtis J. M. R., Darling E., et al. (2019). Coupled Networks of Permanent Protected Areas and Dynamic Conservation Areas for Biodiversity Conservation Under Climate Change. Front. Ecol. Evol. 7, 27. doi: 10.3389/fevo.2019.00027
Derville S., Torres L. G., Albertson R., Andrews O., Baker C. S., Carzon P., et al. (2019). Whales in Warming Water: Assessing Breeding Habitat Diversity and Adaptability in Oceania’s Changing Climate. Glob. Change Biol. 25, 1466–1481. doi: 10.1111/gcb.14563
Dobesch H., Dumolard P., Dyras I. (2013). Spatial Interpolation for Climate Data: The Use of GIS in Climatology and Meteorology (Newport Beach: John Wiley & Sons).
Donelson J. M., Sunday J. M., Figueira W. F., Gaitán-Espitia J. D., Hobday A. J., Johnson C. R., et al. (2019). Understanding Interactions Between Plasticity, Adaptation and Range Shifts in Response to Marine Environmental Change. Philos. Trans. R. Soc B Biol. Sci. 374, 1–14. doi: 10.1098/rstb.2018.0186
Dransfield A., Hines E., McGowan J., Holzman B., Nur N., Elliott M., et al. (2014). Where the Whales Are: Using Habitat Modeling to Support Changes in Shipping Regulations Within National Marine Sanctuaries in Central California. Endanger. Species Res. 26, 39–57. doi: 10.3354/esr00627
Good S., Embury O., Bulgin C. E., Mittaz J. (2019). ESA Sea Surface Temperature Climate Change Initiative (SST_cci): Level 4 Analysis Climate Data Record, Version 2.1. Didcot: CEDA Centre for Environmental Data Analysis.3. doi: 10.5285/62c0f97b1eac4e0197a674870afe1ee6
Hastings R. A., Rutterford L. A., Freer J. J., Collins R. A., Simpson S. D., Genner M. J. (2020). Climate Change Drives Poleward Increases and Equatorward Declines in Marine Species. Curr. Biol. 30, 1572–1577. doi: 10.1016/j.cub.2020.02.043
Hijmans R. J. (2020) Raster: Geographic Data Analysis and Modeling. Available at: https://cran.r-project.org/package=raster.
IPCC (2019) Summary for Policymakers. In: IPCC Special Report on the Ocean and Cryosphere in a Changing Climate. Available at: http://www.ipcc.ch/publications_and_data/ar4/wg2/en/spm.html.
IPCC (2021). Climate Change 2021: The Physical Science Basis. Contribution of Working Group I to the Sixth Assessment Report of the Intergovernmental Panel on Climate Change. Eds. Masson-Delmotte V., Zhai P., Pirani A., Connors S. L., Pean C., Berger S., et al (Cambridge: Cambridge University Press). Available at: https://www.ipcc.ch/report/ar6/wg1/.
Irvine L. G., Thums M., Hanson C. E., McMahon C. R., Hindell M. A. (2017). Quantifying the Energy Stores of Capital Breeding Humpback Whales and Income Breeding Sperm Whales Using Historical Whaling Records. R. Soc. Open Sci. 4, 160290. doi: 10.1098/rsos.160290
Jenner K. C. S., Jenner M. N. M., McCabe K. A. (2001). Geographical and Temporal Movements of Humpback Whales in Western Australian Waters. APPEA J. 41, 749–765. doi: 10.1071/AJ00044
Jorge Urbán R., Anelio Aguayo L. (1987). Spatial and Seasonal Distribution of the Humpback Whale, Megaptera Novaeangliae, in the Mexican Pacific. Mar. Mammal Sci. 3, 333–344. doi: 10.1111/j.1748-7692.1987.tb00320.x
Kobayashi N., Okabe H., Kawazu I., Higashi N., Miyahara H., Kato H., et al. (2016). Peak Mating and Breeding Period of the Humpback Whale—(Megaptera Novaeangliae) in Okinawa Island, Japan. Open J. Anim. Sci. 6, 169–179. doi: 10.4236/ojas.2016.63022
Learmonth J. A., MacLeod C. D., Santos M. B., Pierce G. J., Crick H. Q. P., Robinson R. A. (2006). Potential Effects of Climate Change on Marine Mammals. Oceanogr. Mar. Biol. 44, 431. doi: 10.1201/9781420006391.ch8
Martin S. C., Aniceto A. S., Ahonen H., Pedersen G., Lindstrøm U. (2021). Humpback Whale (Megaptera Novaeangliae) Song on a Subarctic Feeding Ground. Front. Mar. Sci. 8, 594. doi: 10.3389/fmars.2021.669748
Martre P., Wallach D., Asseng S., Ewert F., Jones J. W., Rötter R. P., et al. (2015). Multimodel Ensembles of Wheat Growth: Many Models Are Better Than One. Glob. Change Biol. 21, 911–925. doi: 10.1111/gcb.12768
Meinshausen M., Lewis J., Nicholls Z., Burdon R. (2021) COP26 Briefing Paper: Updated Warming Projections for NDCs, Long-Term Targets and the Methane Pledge. Making Sense of 1.8°C, 1.9°C and 2.7°C. Available at: https://data.climateresource.com.au/ndc/20211109-ClimateResource-1-9C_to2-7C.pdf.
Meynecke J., Seyboth E., De Bie J., Menzel Barraqueta J., Chama A., Prakash Dey S., et al. (2020). Responses of Humpback Whales to a Changing Climate in the Southern Hemisphere: Priorities for Research Efforts. Mar. Ecol. 41, e12616. doi: 10.1111/maec.12616
Microsoft Corporation, Weston S. (2020a) Doparallel: Foreach Parallel Adaptor for the “Parallel” Package. Available at: https://cran.r-project.org/package=doParallel.
Microsoft Corporation, Weston S. (2020b) Foreach: Provides Foreach Looping Construct. Available at: https://cran.r-project.org/package=foreach.
Moreno A., Hasenauer H. (2016). Spatial Downscaling of European Climate Data. Int. J. Climatol. 36, 1444–1458. doi: 10.1002/joc.4436
National Oceanic and Atmospheric Administration (2020) Hawaiian Islands Humpback Whale National Marine Sanctuary Management Plan. Available at: https://nmshawaiihumpbackwhale.blob.core.windows.net/hawaiihumpbackwhale-prod/media/docs/2020-hihwnms-management-plan.pdf.
Navarro Racines C. E., Tarapues J., Thornton P., Jarvis A., Ramirez Villegas J. (2019). CCAFS-CMIP5 Delta Method Downscaling for Monthly Averages and Bioclimatic Indices of Four RCPs. Nature Publishing Group.
Navarro-Racines C., Tarapues J., Thornton P., Jarvis A., Ramirez-Villegas J. (2020). High-Resolution and Bias-Corrected CMIP5 Projections for Climate Change Impact Assessments. Sci. Data 7, 1–14. doi: 10.1038/s41597-019-0343-8
NMFS, NOAA (2016). Endangered and Threatened Species; Identification of 14 Distinct Population Segments of the Humpback Whale (Megaptera Novaeangliae) and Revision of Species-Wide Listing. Fed Regist. 81, 62260–62320.
O’Connor S., Campbell R., Cortez H., Knowles T. (2009). Whale Watching Worldwide: Tourism Numbers, Expenditures and Expanding Economic Benefits, a Special Report From the International Fund for Animal Welfare. Yarmouth MA USA Prep. by Econ. Large 228, 9-282.
Oliver E. C. J., Burrows M. T., Donat M. G., Sen Gupta A., Alexander L. V., Perkins-Kirkpatrick S. E., et al. (2019). Projected Marine Heatwaves in the 21st Century and the Potential for Ecological Impact. Front. Mar. Sci. 6, 734. doi: 10.3389/fmars.2019.00734
O’Neill B. C., Kriegler E., Ebi K. L., Kemp-Benedict E., Riahi K., Rothman D. S., et al. (2017). The Roads Ahead: Narratives for Shared Socioeconomic Pathways Describing World Futures in the 21st Century. Glob. Environ. Change 42, 169–180. doi: 10.1016/j.gloenvcha.2015.01.004
O’Neill B. C., Tebaldi C., Van Vuuren D. P., Eyring V., Friedlingstein P., Hurtt G., et al. (2016). The Scenario Model Intercomparison Project (ScenarioMIP) for CMIP6. Geosci. Model Dev. 9, 3461–3482. doi: 10.5194/gmd-9-3461-2016
Pecl G. T., Araújo M. B., Bell J. D., Blanchard J., Bonebrake T. C., Chen I.-C., et al. (2017). Biodiversity Redistribution Under Climate Change: Impacts on Ecosystems and Human Well-Being. Sci. (80-.). 355, eaai9214. doi: 10.1126/science.aai9214
Pinsky M. L., Selden R. L., Kitchel Z. J. (2020). Climate-Driven Shifts in Marine Species Ranges: Scaling From Organisms to Communities. Ann. Rev. Mar. Sci. 12, 153-179. doi: 10.1146/annurev-marine-010419-010916
Pirotta E., Mangel M., Costa D. P., Goldbogen J., Harwood J., Hin V., et al. (2019). Anthropogenic Disturbance in a Changing Environment: Modelling Lifetime Reproductive Success to Predict the Consequences of Multiple Stressors on a Migratory Population. Oikos 128, 1340–1357. doi: 10.1111/oik.06146
Pourmokhtarian A., Driscoll C. T., Campbell J. L., Hayhoe K., Stoner A. M. K. (2016). The Effects of Climate Downscaling Technique and Observational Data Set on Modeled Ecological Responses. Ecol. Appl. 26, 1321–1337. doi: 10.1890/15-0745
Pressey R. L., Cabeza M., Watts M. E., Cowling R. M., Wilson K. A. (2007). Conservation Planning in a Changing World. Trends Ecol. Evol. 22, 583–592. doi: 10.1016/j.tree.2007.10.001
QGIS Development Team (2021) QGIS Geographic Information System. Available at: http://qgis.osgeo.org.
Ramírez Villegas J., Jarvis A. (2010). Downscaling Global Circulation Model Outputs: The Delta Method Decision and Policy Analysis Working Paper No. 1. International Center for Tropical Agriculture (CIAT). Cali, Colombia: International Center for Tropical Agriculture (CIAT).
Ramp C., Delarue J., Palsbøll P. J., Sears R., Hammond P. S. (2015). Adapting to a Warmer Ocean—Seasonal Shift of Baleen Whale Movements Over Three Decades. PloS One 10, e0121374. doi: 10.1371/journal.pone.0121374
Rasmussen K., Palacios D. M., Calambokidis J., Saborío M. T., Dalla Rosa L., Secchi E. R., et al. (2007). Southern Hemisphere Humpback Whales Wintering Off Central America: Insights From Water Temperature Into the Longest Mammalian Migration. Biol. Lett. 3, 302–305. doi: 10.1098/rsbl.2007.0067
R Core Team (2020). R: A Language and Environment for Statistical Computing. Available at: https://www.r-project.org/.
Reside A. E., Butt N., Adams V. M. (2018). Adapting Systematic Conservation Planning for Climate Change. Biodivers. Conserv. 27, 1–29. doi: 10.1007/s10531-017-1442-5
Roman J., Estes J. A., Morissette L., Smith C., Costa D., McCarthy J., et al. (2014). Whales as Marine Ecosystem Engineers. Front. Ecol. Environ. 12, 377–385. doi: 10.1890/130220
Sanderson C. E., Alexander K. A. (2020). Unchartered Waters: Climate Change Likely to Intensify Infectious Disease Outbreaks Causing Mass Mortality Events in Marine Mammals. Glob. Change Biol. 26, 4284–4301. doi: 10.1111/gcb.15163
Sato C., Wiles G. J. (2021). Periodic Status Review for the Humpback Whale in Washington (Olympia, Washington: Washington Department of Fish and Wildlife). Available at: https://wdfw.wa.gov/sites/default/files/publications/02169/wdfw02169.pdf.
Savoca M. S., Czapanskiy M. F., Kahane-Rapport S. R., Gough W. T., Fahlbusch J. A., Bierlich K. C., et al. (2021). Baleen Whale Prey Consumption Based on High-Resolution Foraging Measurements. Nature 599, 85–90. doi: 10.1038/s41586-021-03991-5
Silber G. K., Lettrich M. D., Thomas P. O., Baker J. D., Baumgartner M., Becker E. A., et al. (2017). Projecting Marine Mammal Distribution in a Changing Climate. Front. Mar. Sci. 4, 413. doi: 10.3389/fmars.2017.00413
Sillmann J., Kharin V. V., Zhang X., Zwiers F. W., Bronaugh D. (2013). Climate Extremes Indices in the CMIP5 Multimodel Ensemble: Part 1. Model Evaluation in the Present Climate. J. Geophys. Res. Atmos. 118, 1716–1733. doi: 10.1002/jgrd.50203
Smith J. N., Grantham H. S., Gales N., Double M. C., Noad M. J., Paton D. (2012a). Identification of Humpback Whale Breeding and Calving Habitat in the Great Barrier Reef. Mar. Ecol. Prog. Ser. 447, 259–272. doi: 10.3354/meps09462
Smith R. J., Veríssimo D., Isaac N. J. B., Jones K. E. (2012b). Identifying Cinderella Species: Uncovering Mammals With Conservation Flagship Appeal. Conserv. Lett. 5, 205–212. doi: 10.1111/j.1755-263X.2012.00229.x
Stein B. A., Glick P., Edelson N., Staudt A. (2014). Climate-Smart Conservation: Putting Adaption Principles Into Practice (Washington D.C.: National Wildlife Federation).
Sunday J. M., Bates A. E., Dulvy N. K. (2012). Thermal Tolerance and the Global Redistribution of Animals. Nat. Clim. Change 2, 686–690. doi: 10.1038/nclimate1539
Sydeman W. J., Poloczanska E., Reed T. E., Thompson S. A. (2015). Climate Change and Marine Vertebrates. Sci. (80-.). 350, 772–777. doi: 10.1126/science.aac9874
Thomas-Walters L., Raihani N. J. (2017). Supporting Conservation: The Roles of Flagship Species and Identifiable Victims. Conserv. Lett. 10, 581–587. doi: 10.1111/conl.12319
Trudelle L., Charrassin J.-B., Saloma A., Pous S., Kretzschmar A., Adam O. (2018). First Insights on Spatial and Temporal Distribution Patterns of Humpback Whales in the Breeding Ground at Sainte Marie Channel, Madagascar. Afr. J. Mar. Sci. 40, 75–86. doi: 10.2989/1814232X.2018.1445028
Tulloch V. J. D., Plagányi É.E., Brown C., Richardson A. J., Matear R. (2019). Future Recovery of Baleen Whales Is Imperiled by Climate Change. Glob. Change Biol. 25, 1263–1281. doi: 10.1111/gcb.14573
United Nations Environment Programme (2021). Emissions Gap Report 2021: The Heat Is On – A World of Climate Promises Not Yet Delivered (Nairobi: United Nations Environment Programme (UNEP) and UNEP DTU Partnership).
Vergés A., McCosker E., Mayer-Pinto M., Coleman M. A., Wernberg T., Ainsworth T., et al. (2019). Tropicalisation of Temperate Reefs: Implications for Ecosystem Functions and Management Actions. Funct. Ecol. 33, 1000–1013. doi: 10.1111/1365-2435.13310
Walsh J. E., Bhatt U. S., Littell J. S., Leonawicz M., Lindgren M., Kurkowski T. A., et al. (2018). Downscaling of Climate Model Output for Alaskan Stakeholders. Environ. Model. Software 110, 38–51. doi: 10.1016/j.envsoft.2018.03.021
World Climate Research Programme (2019) Coupled Model Intercomparison Project (Phase 6) Search Interface. Available at: https://esgf-node.llnl.gov/search/cmip6/.
Wright A. J., Deak T., Parsons E. C. M. (2011). Size Matters: Management of Stress Responses and Chronic Stress in Beaked Whales and Other Marine Mammals may Require Larger Exclusion Zones. Mar. Pollut. Bull. 63, 5–9. doi: 10.1016/j.marpolbul.2009.11.024
Xu Z., Han Y., Yang Z. (2019). Dynamical Downscaling of Regional Climate: A Review of Methods and Limitations. Sci. China Earth Sci. 62, 365–375. doi: 10.1007/s11430-018-9261-5
Keywords: humpback whale (Megaptera novaeangliae), breeding grounds, sea surface temperature (SST), climate change, climate modeling, statistical downscaling, delta method, general circulation models
Citation: von Hammerstein H, Setter RO, van Aswegen M, Currie JJ and Stack SH (2022) High-Resolution Projections of Global Sea Surface Temperatures Reveal Critical Warming in Humpback Whale Breeding Grounds. Front. Mar. Sci. 9:837772. doi: 10.3389/fmars.2022.837772
Received: 17 December 2021; Accepted: 11 April 2022;
Published: 10 May 2022.
Edited by:
Solène Derville, Oregon State University, United StatesReviewed by:
Philippine Chambault, University of California, Santa Cruz, United StatesFrancine Kershaw, Natural Resources Defense Council, United States
Copyright © 2022 von Hammerstein, Setter, van Aswegen, Currie and Stack. This is an open-access article distributed under the terms of the Creative Commons Attribution License (CC BY). The use, distribution or reproduction in other forums is permitted, provided the original author(s) and the copyright owner(s) are credited and that the original publication in this journal is cited, in accordance with accepted academic practice. No use, distribution or reproduction is permitted which does not comply with these terms.
*Correspondence: Hannah von Hammerstein, aGZ2aEBoYXdhaWkuZWR1