 Ennio Ottaviani1,2
 Marco Francescangeli3
 Nikolla Gjeci1
 Joaquin del Rio Fernandez3
 Jacopo Aguzzi4,5
 Simone Marini6,5*
- 1OnAIR s.r.l., Genova, Italy
- 2Dipartimento di Matematica (DIMA), Università di Genova, Genova, Italy
- 3Sarti Research Group, Electronics Department, Universitat Politècnica de Catalunya (UPC), Vilanova i la Geltru, Spain
- 4Instituto de Ciencias del Mar (ICM-CSIC), Barcelona, Spain
- 5Stazione Zoologica Anton Dohrn (SZN), Naples, Italy
- 6Consiglio Nazionale delle Ricerche (CNR), Istituto di Scienze Marine (ISMAR), La Spezia, Italy
The marine science community is engaged in the exploration and monitoring of biodiversity dynamics, with a special interest for understanding the ecosystem functioning and for tracking the growing anthropogenic impacts. The accurate monitoring of marine ecosystems requires the development of innovative and effective technological solutions to allow a remote and continuous collection of data. Cabled fixed observatories, equipped with camera systems and multiparametric sensors, allow for a non-invasive acquisition of valuable datasets, at a high-frequency rate and for periods extended in time. When large collections of visual data are acquired, the implementation of automated intelligent services is mandatory to automatically extract the relevant biological information from the gathered data. Nevertheless, the automated detection and classification of streamed visual data suffer from the “concept drift” phenomenon, consisting of a drop of performance over the time, mainly caused by the dynamic variation of the acquisition conditions. This work quantifies the degradation of the fish detection and classification performance on an image dataset acquired at the OBSEA cabled video-observatory over a one-year period and finally discusses the methodological solutions needed to implement an effective automated classification service operating in real time.
Introduction
The oceanic seabed and the overlying water masses constitute the largest and yet the less explored biome on Earth (Danovaro et al., 2020). Today, the marine science community is engaged in the exploration and monitoring of biodiversity and its processes (e.g. reproductive cycles, population growth and mortality dynamics and migrations) in relation to environmental control and growing anthropogenic perturbations (Levin et al., 2018; Levin et al., 2019). However, the marine environment is hostile to the prolonged human presence and in situ experiments, especially when the depth of the sea increases (Rountree et al., 2020), and the monitoring actions often need the assistance of expensive support vessels. Within this operational context, it is not easy to plan campaigns for data acquisition that extend for long periods, reducing data sampling capability and repeatability (Raffaelli et al., 2003). So, accurate monitoring of marine ecosystems requires the development of innovative and effective technological solutions to allow a remote and continuous collection of high-frequency physical, chemical and biological data (Aguzzi et al., 2010; Aguzzi et al., 2015; Dañobeitia et al., 2020; Painting et al., 2020).
In this regard, cabled fixed observatories and their docked mobile platforms (e.g. crawlers and AUVs), all equipped with camera systems and multiparametric bio-geochemical and oceanographic sensors, allow for a non-invasive acquisition of biological and environmental data, at a frequency of seconds or higher, over consecutive years (Aguzzi et al., 2019; Del Rio et al., 2020). This biological and environmental highly integrated monitoring activity is about to produce new relevant ecological information to sustain innovative ecosystem management approaches and policies (Danovaro et al., 2017). Those data refer mainly to megafauna species identification and their individual counts (e.g., Juniper et al., 2013; Bicknell et al., 2016; Danovaro et al., 2020).
Many marine observing systems acquire and store terabytes of data that need to be processed (Painting et al., 2020). As a consequence the marine research community is urging for the implementation of services, based on artificial intelligence methodologies, aimed at the automated extraction of relevant biological information, especially from image data (e.g. animals identification, tracking, classification and counting) (Marini et al., 2018b; Canonico et al., 2019; European Marine Board, 2020; Aguzzi et al., 2020; Lopez-Vasquez et al., 2020; Beyan and Browman, 2020; Malde et al., 2020; Zuazo et al., 2020). The achievement of this goal can be resumed by the definition of novel self-aware observing systems capable of sensing the surrounding environment and intelligently processing the acquired data (Aguzzi et al., 2022; European Marine Board, 2020; Jahanbakht et al., 2021), also through edge computing techniques (Shi et al., 2016; Marini et al., 2018a) to process the acquired data onboard intelligent observing systems. Such an on-board processing approach needs to face the problems of multiparametric data acquisition and integration, relevant knowledge extraction and interpretation, transmission latency and bandwidth lack, when the information is remotely sent to a shore server (European Commission, 2018; Malde et al., 2020; European Marine Board, 2020;Jahanbakht et al., 2021; Aguzzi et al., 2022).
Species detection and classification in a real-world scenario requires supervised-learning methods that allow a computer system to automatically make predictions based on a series of examples (e.g., see Marini et al., 2018a; Marini et al., 2018b; Lopez-Vazquez et al., 2020; Malde et al., 2020). Unfortunately, the effectiveness of such automated approaches incurs into the “concept drift” phenomenon, consisting in a progressive decrease over time of the detection and classification performance (Hashmani et al., 2019; Jameel et al., 2020; Din et al., 2021). The concept drift is largely investigated in the community of computer vision and artificial intelligence, but very few contributions are available in the marine science context (Langenkämper et al., 2020; Kloster et al., 2020).
This work analyses and quantifies the degradation of the fish detection and classification performance on the image data acquired at the OBSEA cabled video-observatory (Del Río et al., 2020) over a one-year period. Images were analysed by using deep learning methodologies aimed at fish detection and classification, and the experiments, for assessing the performance degradation, were designed to reproduce an automated classification service installed on the observatory. A ground-truth dataset was generated through the visual inspection of the image dataset, and every fish was tagged with its corresponding bounding box and its species label. The ground-truth dataset was used for training the algorithms on the first four months of the image data stream of the observatory, then the detection and classification performance was evaluated on a monthly basis on the remaining data. The results show a continuous degradation of both the detection and the classification performance over the studied period. Finally, the methodological approaches for mitigating the concept drift phenomenon are presented and discussed.
Materials and Methods
Study Area
The Western Mediterranean Expandable SEAfloor Observatory (OBSEA; http://www.OBSEA.es) is a cabled video-observatory located at 20 m depth, 4 km off Vilanova i la Geltrù (Catalonia, Spain) (Aguzzi et al., 2011; Del Río et al., 2020) (Figures 1A–C). The observatory is equipped with an Underwater IP Camera (OPT-06; OpticCam), acquiring colour images/video footage with 640 x 480 pixels resolution (see next section). Two custom white LEDs (2900 lumens; colour temperature of 2700 K) are located beside the camera, at 1 m distance from each other, projecting the light beam with an angle of 120°. Light ON-OFF (lasting for 3 s) occurs immediately before and after image acquisition by a LabView application that also controls their white balance.
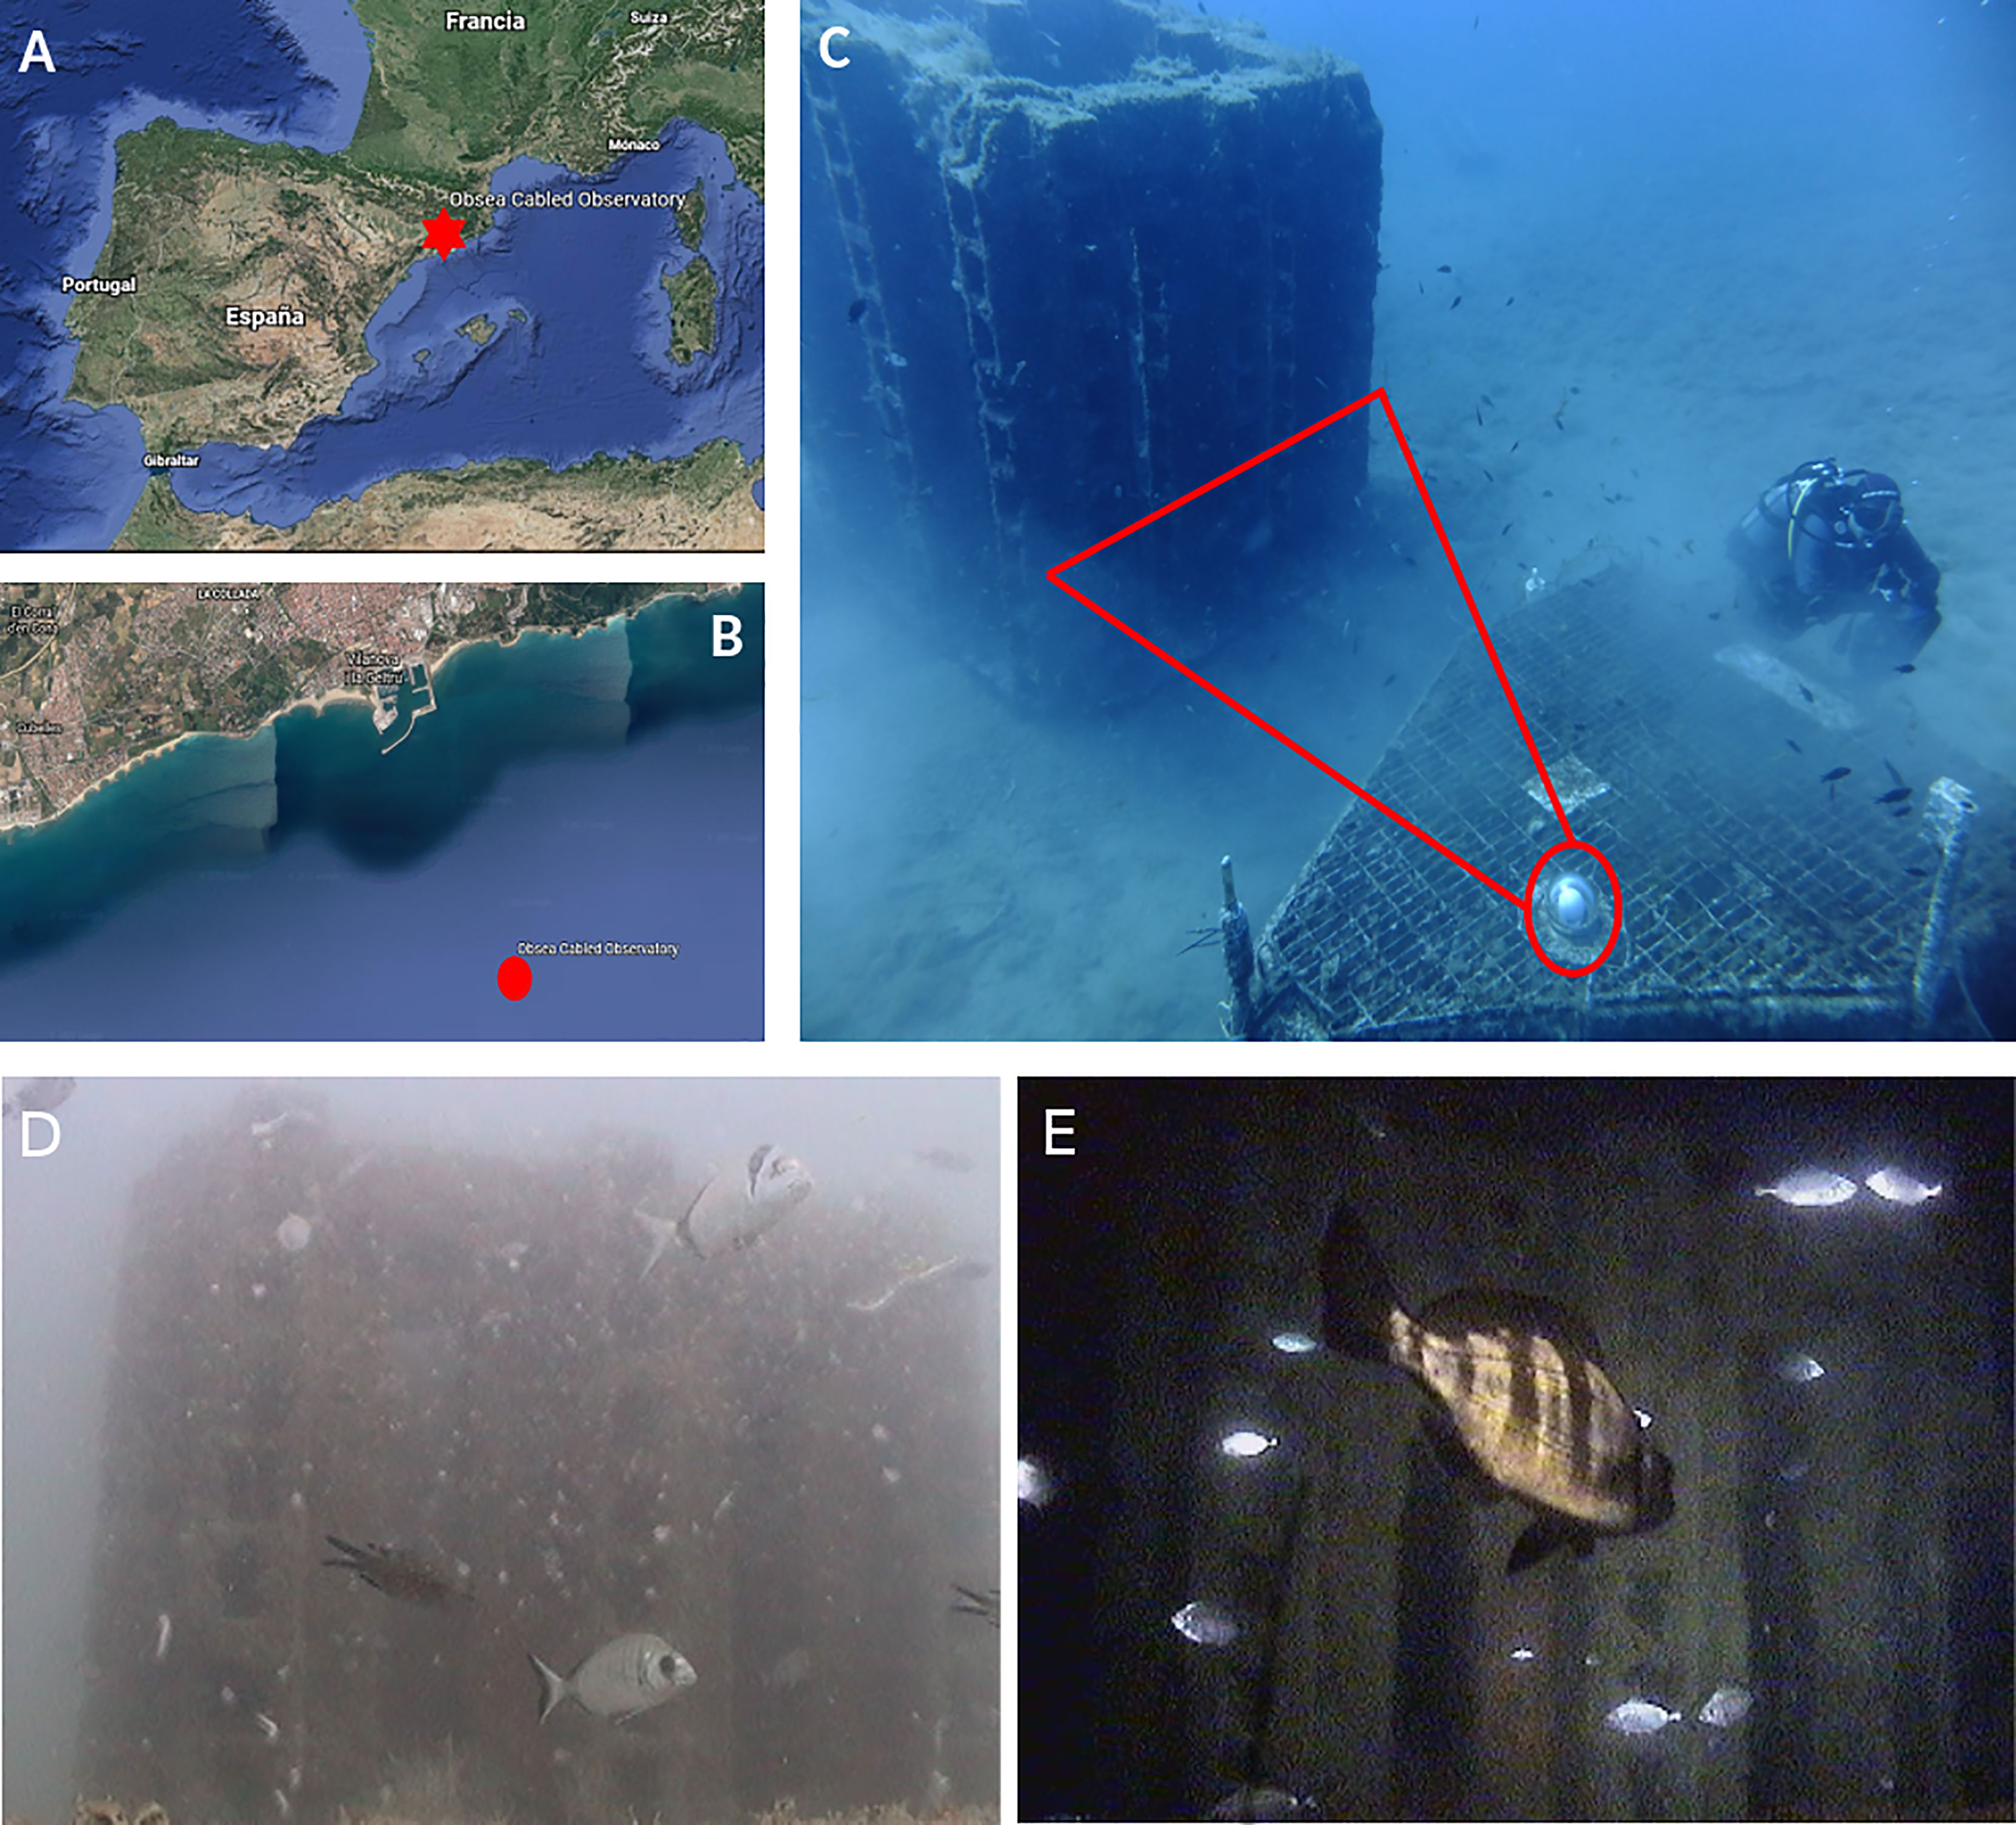
Figure 1 The location of the OBSEA observatory in the Mediterranean Sea (A, B); The field of view of the camera installed in the observatory (C); Two examples of images acquired by the OBSEA camera, during the daylight (D) and during the night (E), using the artificial lighting system of the observatory.
With this setup we acquired 14025 images, one image every 30 minutes between January and December 2014, constantly focussing on the artificial reef, located 3.5 m from the camera. A change of camera occurred on December 11, 2014. The new one was an Axis P1346-E camera, acquiring colour images/video with 3 megapixels resolution. Figures 1D, E shows two examples of acquisition conditions characterised by turbid water and biofouling on the porthole of the camera (i.e., growth of algae or other encrusting organisms) and an image acquired during the night using the artificial lights of the observatory.
Ground-Truth Definition
The images acquired at the OBSEA were visually inspected by a trained operator, in order to recognize the fish specimens, within the field of view, by following the procedures described in Condal et al. (2012) and Aguzzi et al. (2013).
For each individual in the image, a bounding box was drawn and labelled with the corresponding species. The results of this manual processing were encoded into a text file including: the image file name, the corresponding timestamp, the position of the four vertices of the oriented bounding-box and the species label.
The biofouling phenomenon and the water turbidity, sensibly affects the automated recognition of fishes (Marini et al., 2018b) and presents difficulties also during the visual inspection of the images (see Figure 1D as an example). The inspection was also difficult to perform when the individuals appeared too far from the camera or during the nighttime, when the field of view was illuminated only by the lighting system of the observatory. Those individuals, whose species could not be attributed with sufficient confidence, were included in the “unknown” category.
The visual inspection task resulted in 62038 individuals, of which 29497 belonged to 30 species, with very different abundances. Table 1 summarises the taxonomic names of those species (Condal et al., 2012; Aguzzi et al., 2013; Aguzzi et al., 2015).
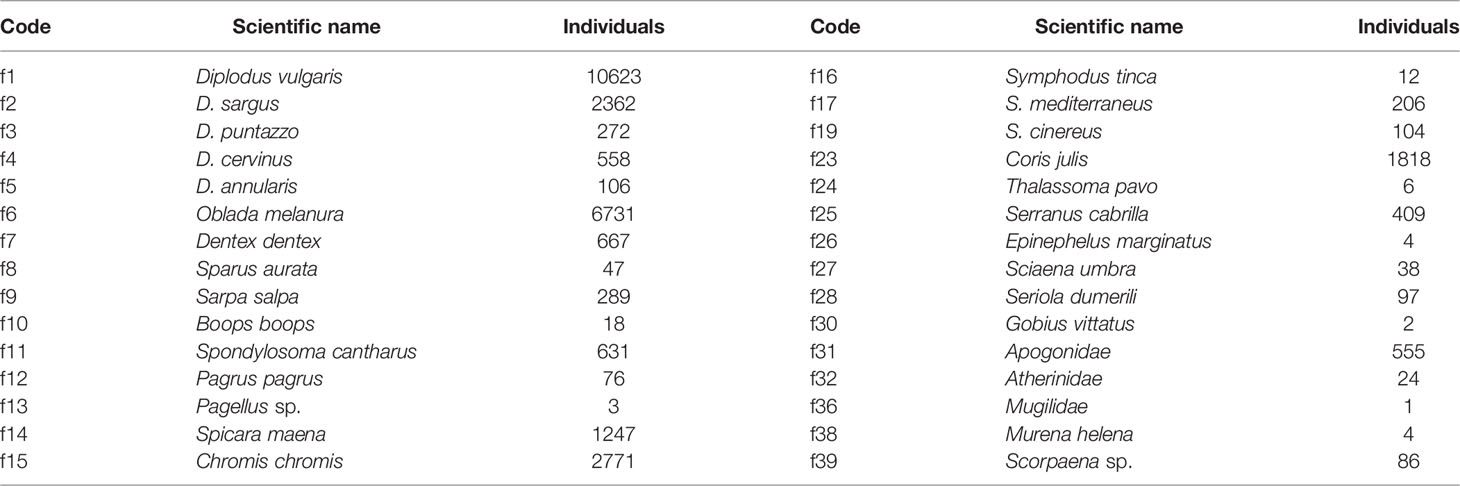
Table 1 Species expected and observed in the OBSEA site: list by scientific names and the number of observed individuals.
Automated Image Fish Classification
The image content classification was performed by using a Deep Learning (DL) approach (LeCun et al., 2015), following the current trend in the scientific community (Malde et al., 2020). The DL methods are well suited for image classification and achieved human-like performances in many visual tasks, as reported in many surveys (e.g., He, 2020). Among the Convolutional Neural Network (CNN) architectures proposed in literature, we have chosen to experiment the fish classification problem with ResNet (He et al., 2016), as it is a compact, effective and consolidated network (Tan and Le, 2019) and because demonstrated good performance by winning the ImageNet competition in 2015, a large classification competition on over 1000 classes and 10 million images1.
Differently from the traditional approaches for image classification, DL operates directly on pixel values, without any kind of pre-processing or feature extraction stage, and learns the optimal mapping between data (i.e. images) and object classes (i.e. fish species) (LeCun et al., 2015). Moreover, CNN can be used in different application contexts through the transfer learning approach (Pan and Yang, 2010; Rawat and Wang, 2017), where the neural network can be trained for a general purpose task and then specialised to a more specific task only, by changing a small part of its architecture.
Taking advantage of the transfer learning approach, we experimented with a few ResNet networks, pretrained on more than a million images from the general purpose ImageNet database2 and then selected the ResNet18 (He et al., 2016) as the main fish species classification algorithm.
For training the specialised fish classifier, the ground-truth dataset was structured according to both the fish species and the acquisition date, as reported in Table 2. Images of fishes far from the camera were not considered in the training process. This is because the reduced size of the image regions containing these specimens do not provide enough information to effectively characterise the fish species. Differently, a human observer performs classification of fish species in the image not based only on the pixel values, but based also on previous experience and a priori knowledge of the time and space distribution of individuals (Sbragaglia et al., 2019).
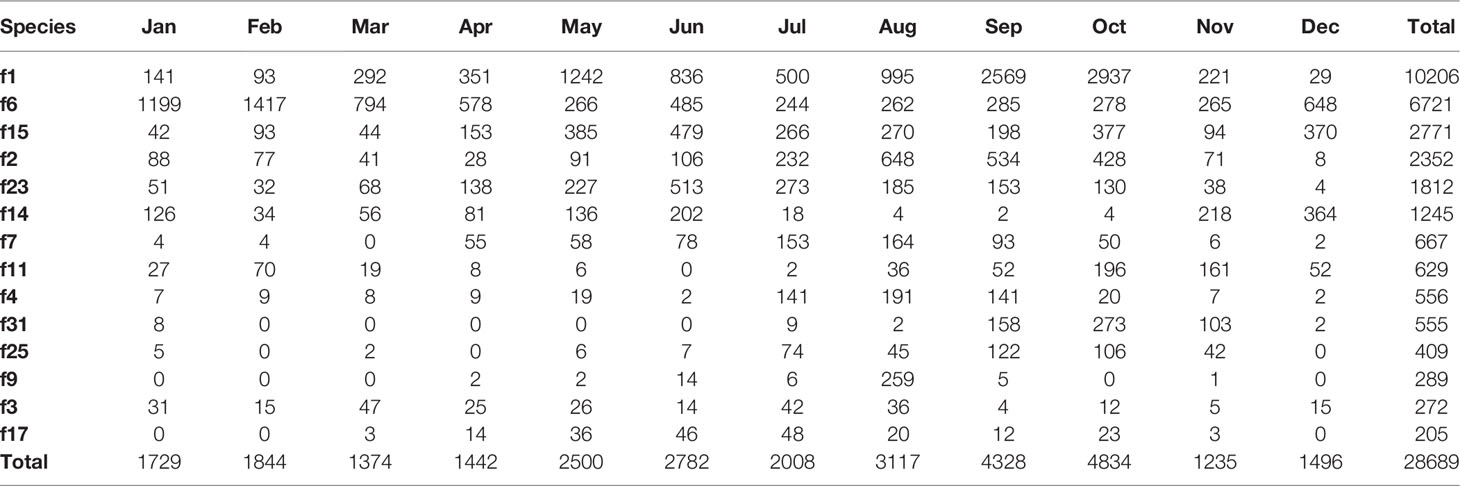
Table 2 The monthly occurrence of fish individuals per species and months.
Moreover, we observed that, even if the total number of classes was high, there were too few observations for certain species, making the learning process not effective. As a consequence, we decided to carry out the classification experiment only on the categories with a number of individuals larger than 200, in order to reduce the class imbalance. For this reason, we focused on the following 14 classes: f1, f2, f3, f4, f6, f7, f9, f11, f14, f15, f17, f23, f25 and f31, whose temporal distribution is represented in Figure 2A, and a representative individual of each species is reported as an example in Figure 2B.
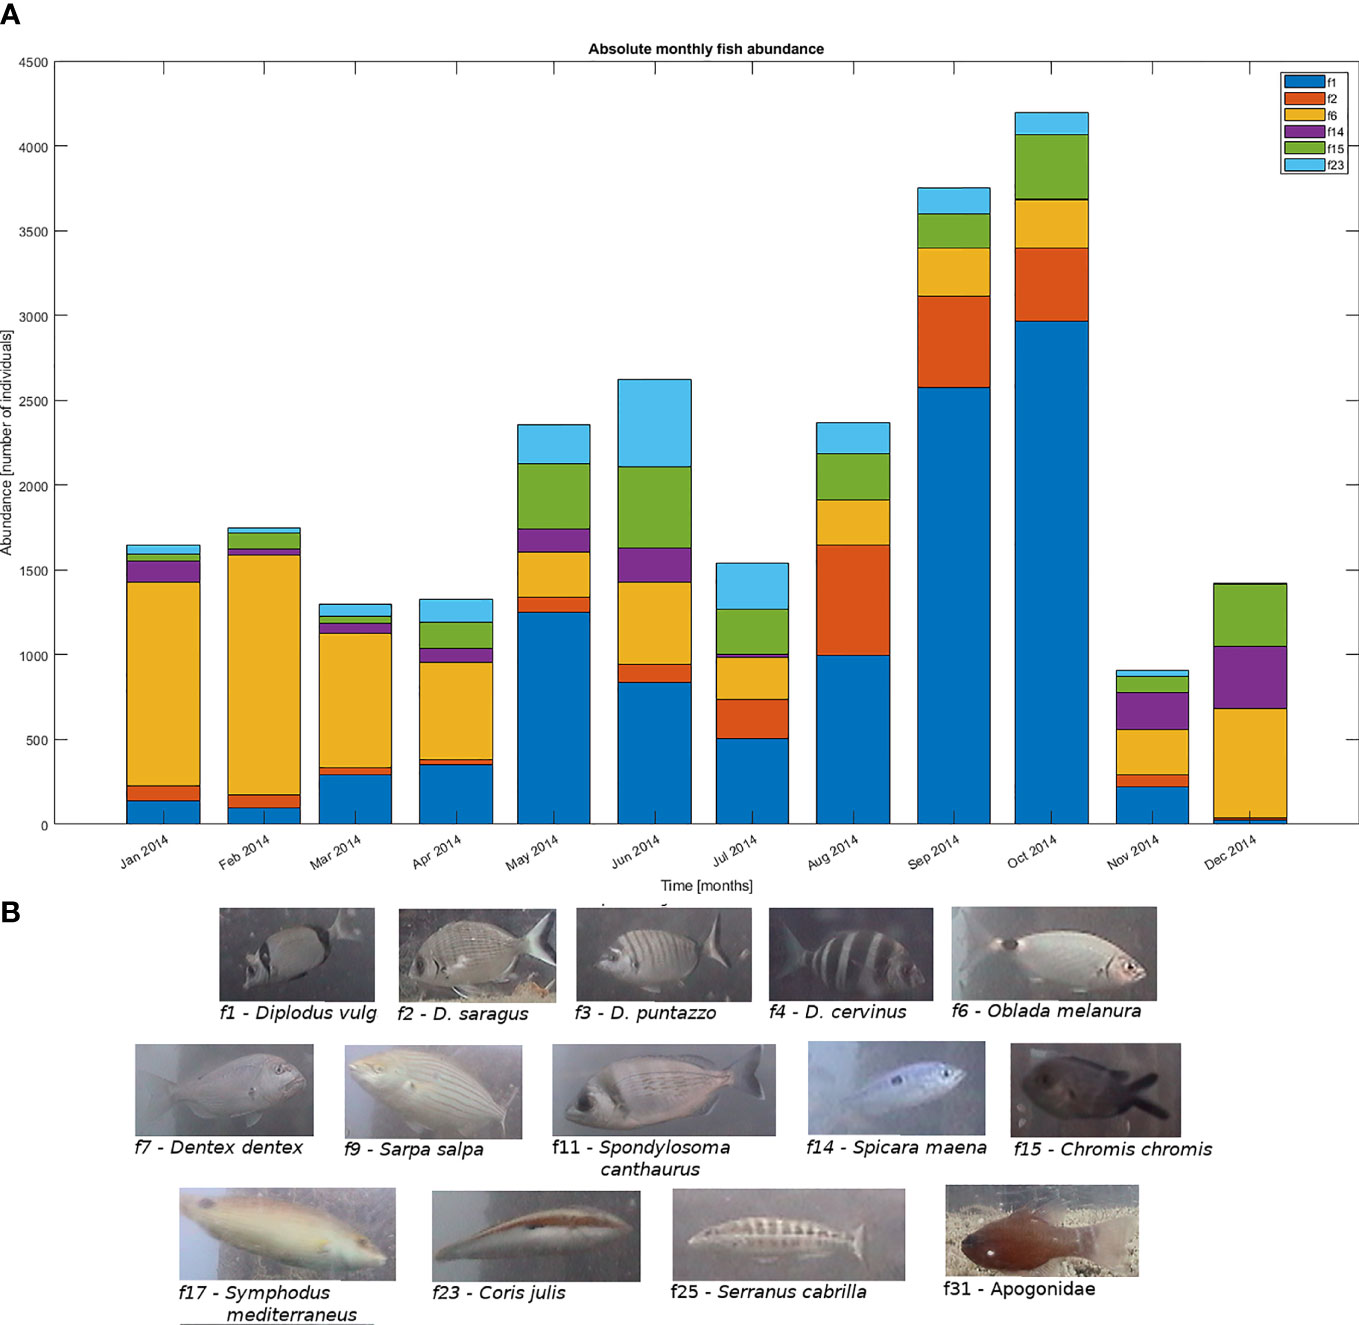
Figure 2 (A) Temporal distribution of the species covering the 90% of the whole set of species reported in Table 2; (B) Representative individuals of the fish species presented in Table 2.
Although the temporal distribution of specimens was very inhomogeneous (see Table 2 and Figure 2), we decided to keep the data sets unbalanced in order to reflect a real-word image-monitoring situation, where the abundance of a species in the environment naturally depends on several and unpredicted factors.
The image dataset described in Table 2, was split into training and validation sets as detailed in the next sections. This partition was made for each class, in order to mirror the relative abundance of each species. Solutions were also adopted for minimising the overfitting on the training set and maximising the generalisation capability of the classifier: shuffling the training dataset at every epoch; augmenting the data by random image flipping along horizontal or vertical direction; setting a learning rate decay option (a piecewise decay starting with an initial value of 10-3 and a drop factor of 0.1 after 5 epochs).
To evaluate the performance of the classifier, a confusion matrix was calculated (Lopez-Vazquez et al., 2020; Zuazo et al., 2020; Harrison et al., 2021). The entry (i,j) of the matrix represents how many individuals belong to the class i have been classified into class j. The more the matrix entries are concentrated on the diagonal, the better is the classification performance. Besides the confusion matrix, other five criteria were used to evaluate the classification performance (Fawcett, 2006):
● the recall or True Positive Rate (TPR), as the number of individuals correctly classified in a given class (TP), with respect to the total number of individuals in that class (P), defined as ;
● the False Negative Rate (FNR), being complementary of the TPR and representing the number of individuals of a given class wrongly classified in other classes (FN) with respect to the total number of individuals in that class (P), defined as ;
● the precision, being the number of individuals correctly classified in a given class (TP) with respect to the total number of individuals classified in that class plus individuals of other classes wrongly classified in that class (FP), defined as
● the False Discovery Rate (FDR), being complementary of precision and representing the number of individuals wrongly classified into a class (FP) with respect to the total number of individuals wrongly classified in that class plus the individuals correctly classified in that class (TP), defined as ;
● the accuracy, being the total number of correct classifications performed on the whole dataset with respect to the total individuals of the dataset, defined as .
Automated Image Fish Detection
While the image classification task is aimed at associating a class label to each relevant subject (i.e. the identified fish), the image detection task is aimed at recognizing the relevant subjects without associating them with the class they belong to. In this work, the object detection task is aimed at recognizing the fish specimens (without any class labelling) with respect to the image background. As for the image classification task, the image detection task can be achieved using the DL approach (Cui et al., 2020). Among the DL methods suitable for the image detection task, we selected the FasterRCNN network, which has proven to be very effective in several competitions, like for example the ImageNet Large Scale Visual Recognition Challenge3. Although the object detection task seems to be simpler than the classification task, within the CNN computational paradigm, the FasterRCNN detection method is built upon a classification network (e.g. the ResNet), adding more layers to compute the bounding box of each object inside the given image (Ren et al., 2015; Li et al., 2017).
Within the fish detection task, the fasterRCNN was trained for detecting a single fish against the image background. Images where one or more fishes overlap other fishes were not used for training. In this way, the detection algorithm learned the fish shape features shared among all the individuals used for the training, without an explicit reference to a specific species. The fish detection performance was estimated by comparing the bounding box coordinates automatically extracted from the images with those encoded in the ground-truth dataset through the use of the Intersection over Union (IoU) approach (Zhu et al., 2021).
Classification and Detection Experiments
Three experiments were designed in order to assess the degradation of the detection and classification performance.
In the first experiment, the full image dataset was split into two random partitions, 50% for training and 50% for testing, with the aim of assessing the global performance of the classification approach. Aim of this experiment was the assessment of the generalisation properties of the ResNet18 classifier in real applications, where no hypothesis can be assumed on the species assemblage and on the quality of the acquired images.
The aim of the second experiment was the simulation of an automated classification service, where the data stream is processed in real-time for the production of time series abundance of fish species. In this second experiment, a different training set was designed. For each species, the 30% of the individuals were randomly sampled from the first four months of the one-year image set and then used for training the fish classifier. The remaining images were used to test the performance of the learnt classifier on a monthly basis, in order to evaluate the possible degradation and its temporal progression.
For both experiments, only the fully connected final layers of the ResNet18 network were trained, for 10 epochs, by shuffling the elements of the training set after each epoch with the aim to ensure that the network sees training data of all classes mixed arbitrarily. To minimise the loss function during the training phase, we used the stochastic gradient descent algorithm, with mini batches of 16 elements and a constant learning rate equal to 0,001. The training was performed on a GPU (NVIDIA GEFORCE RTX 2070) and each experiment lasted about one or two hours, depending on the size of the dataset itself.
The third experiment was aimed at assessing the degradation of the fish detection performance. Similarly to the previous experiments, the fish detection network (fasterRCNN) was trained by randomly sampling the 30% of fish specimens, occurring in the first four months of the dataset. The obtained fish detector was then tested on the remaining data, providing detection accuracy over time as in the experiment n.2.
Results
In this section, we report the results obtained by the ResNet18 for automatic fish classification and by FasterRCNN for automated fish detection.
Experiment n.1
Fish classification with training on a randomly sampled dataset: The confusion matrix resulting from this experiment is shown in Figure 3. The data partition being completely random and unrelated with time, this result represents an estimate of the best performance achievable with this kind of images. The overall accuracy is 93.7% and only 4 classes (i.e., f3, f9, f11 and f17) have an FNR larger than 20%. The results obtained in this experiment were considered the benchmark required to compare the time-dependent tests performed in the second experiment.

Figure 3 Confusion matrix resulting from the first classification experiment (50%-50% training/test partition). The two columns on the right of the confusion matrix represent the recall (blue) and the False Negative Rate (orange), respectively; the two rows below the confusion matrix represent the precision (blue) and the False Discovery Rate (orange), respectively.
Experiment n.2
Fish classification with training on a time-ordered dataset: The confusion matrix for this experiment is shown in Figure 4. The overall accuracy is 72.6% and many classes show poor global performances. For these classes, the first 30% of images used for the training phase does not carry enough information to produce a classifier capable of generalising the whole yearly data stream. Figure 5 shows the monthly accuracy of the classifier, clearly expressing how classification performance decreases over the time.
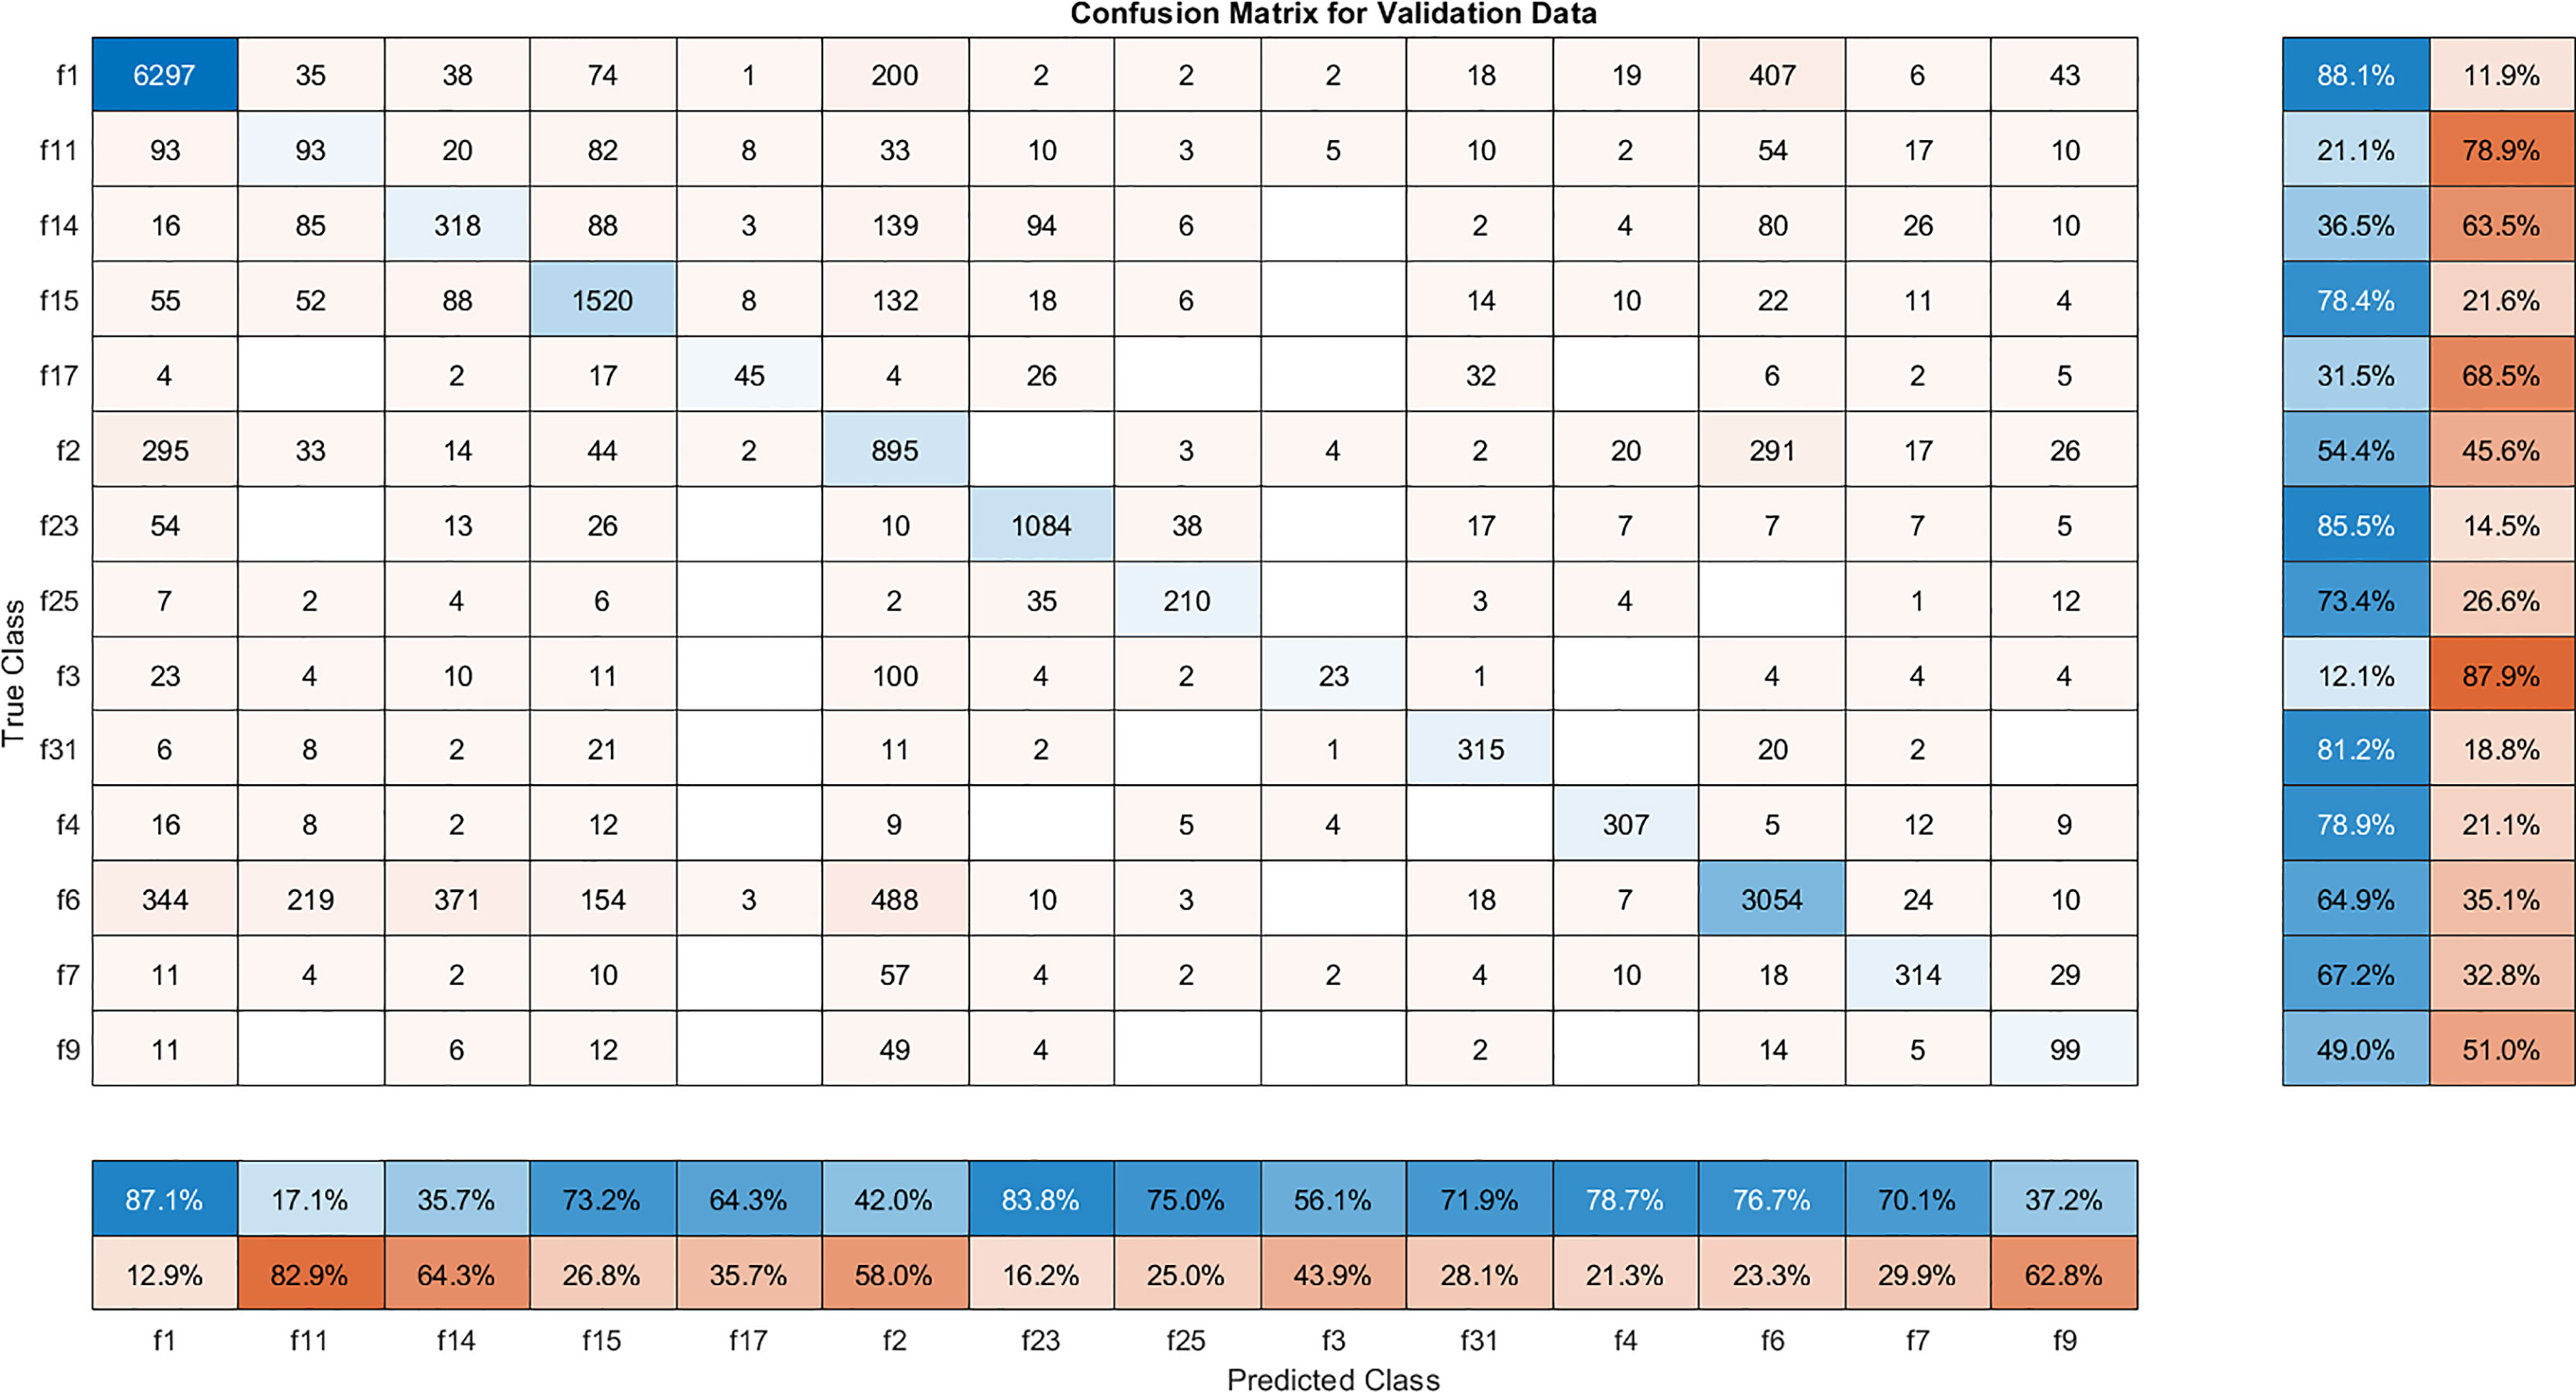
Figure 4 Confusion matrix resulting from the second classification experiment (30%-70% training/test partition). The two columns on the right of the confusion matrix represent the recall (blue) and the False Negative Rate (orange), respectively; the two rows below the confusion matrix represent the precision (blue) and the False Discovery Rate (orange), respectively.
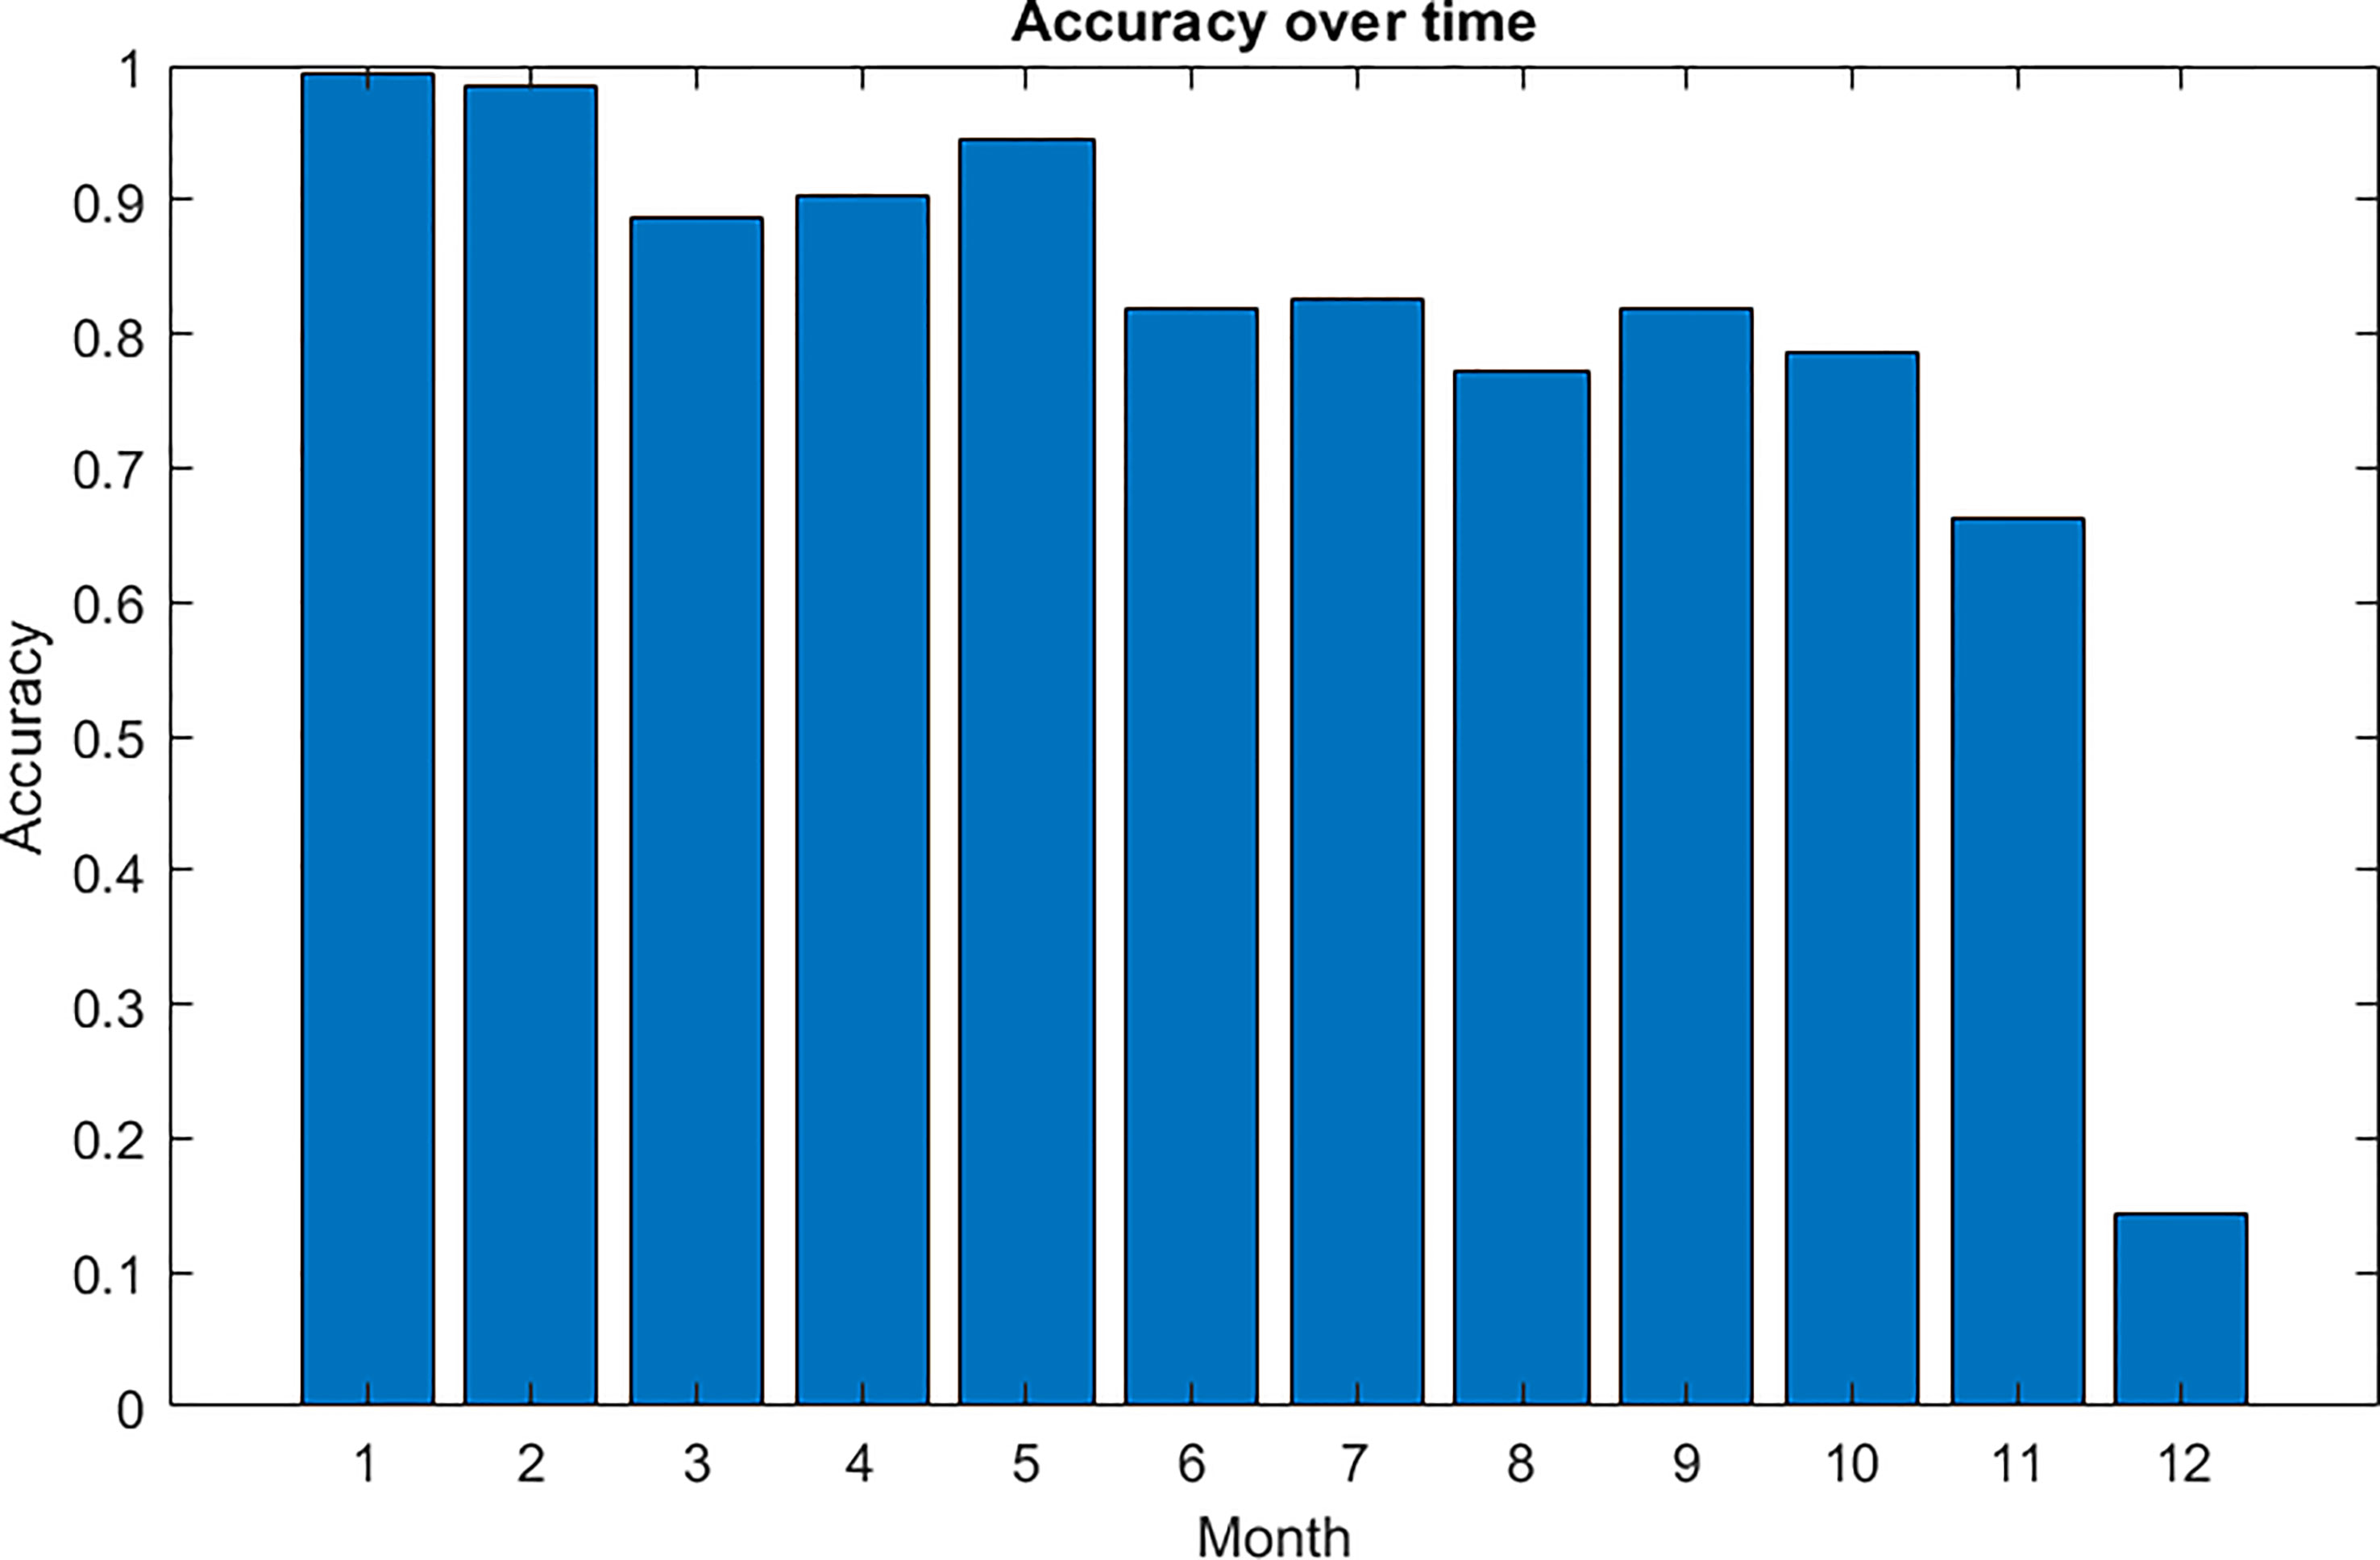
Figure 5 Monthly progressive decrease of the averaged accuracy resulting from the experiment N.2 (30% training, 70% test).
A sensible drop of classification performance occurred in December (see Figure 5), due to a hardware change in the acquisition system, where a new camera with a different colour balance mechanism substituted the old one. Figure 6 shows few image examples of individuals belonging to the same species, acquired with the old and the new camera, just showing an improvement of the image quality. Removing the data gathered in December, the mean accuracy rises from 72.6% to 88.8% showing a sensible incrementation of the detection performance.
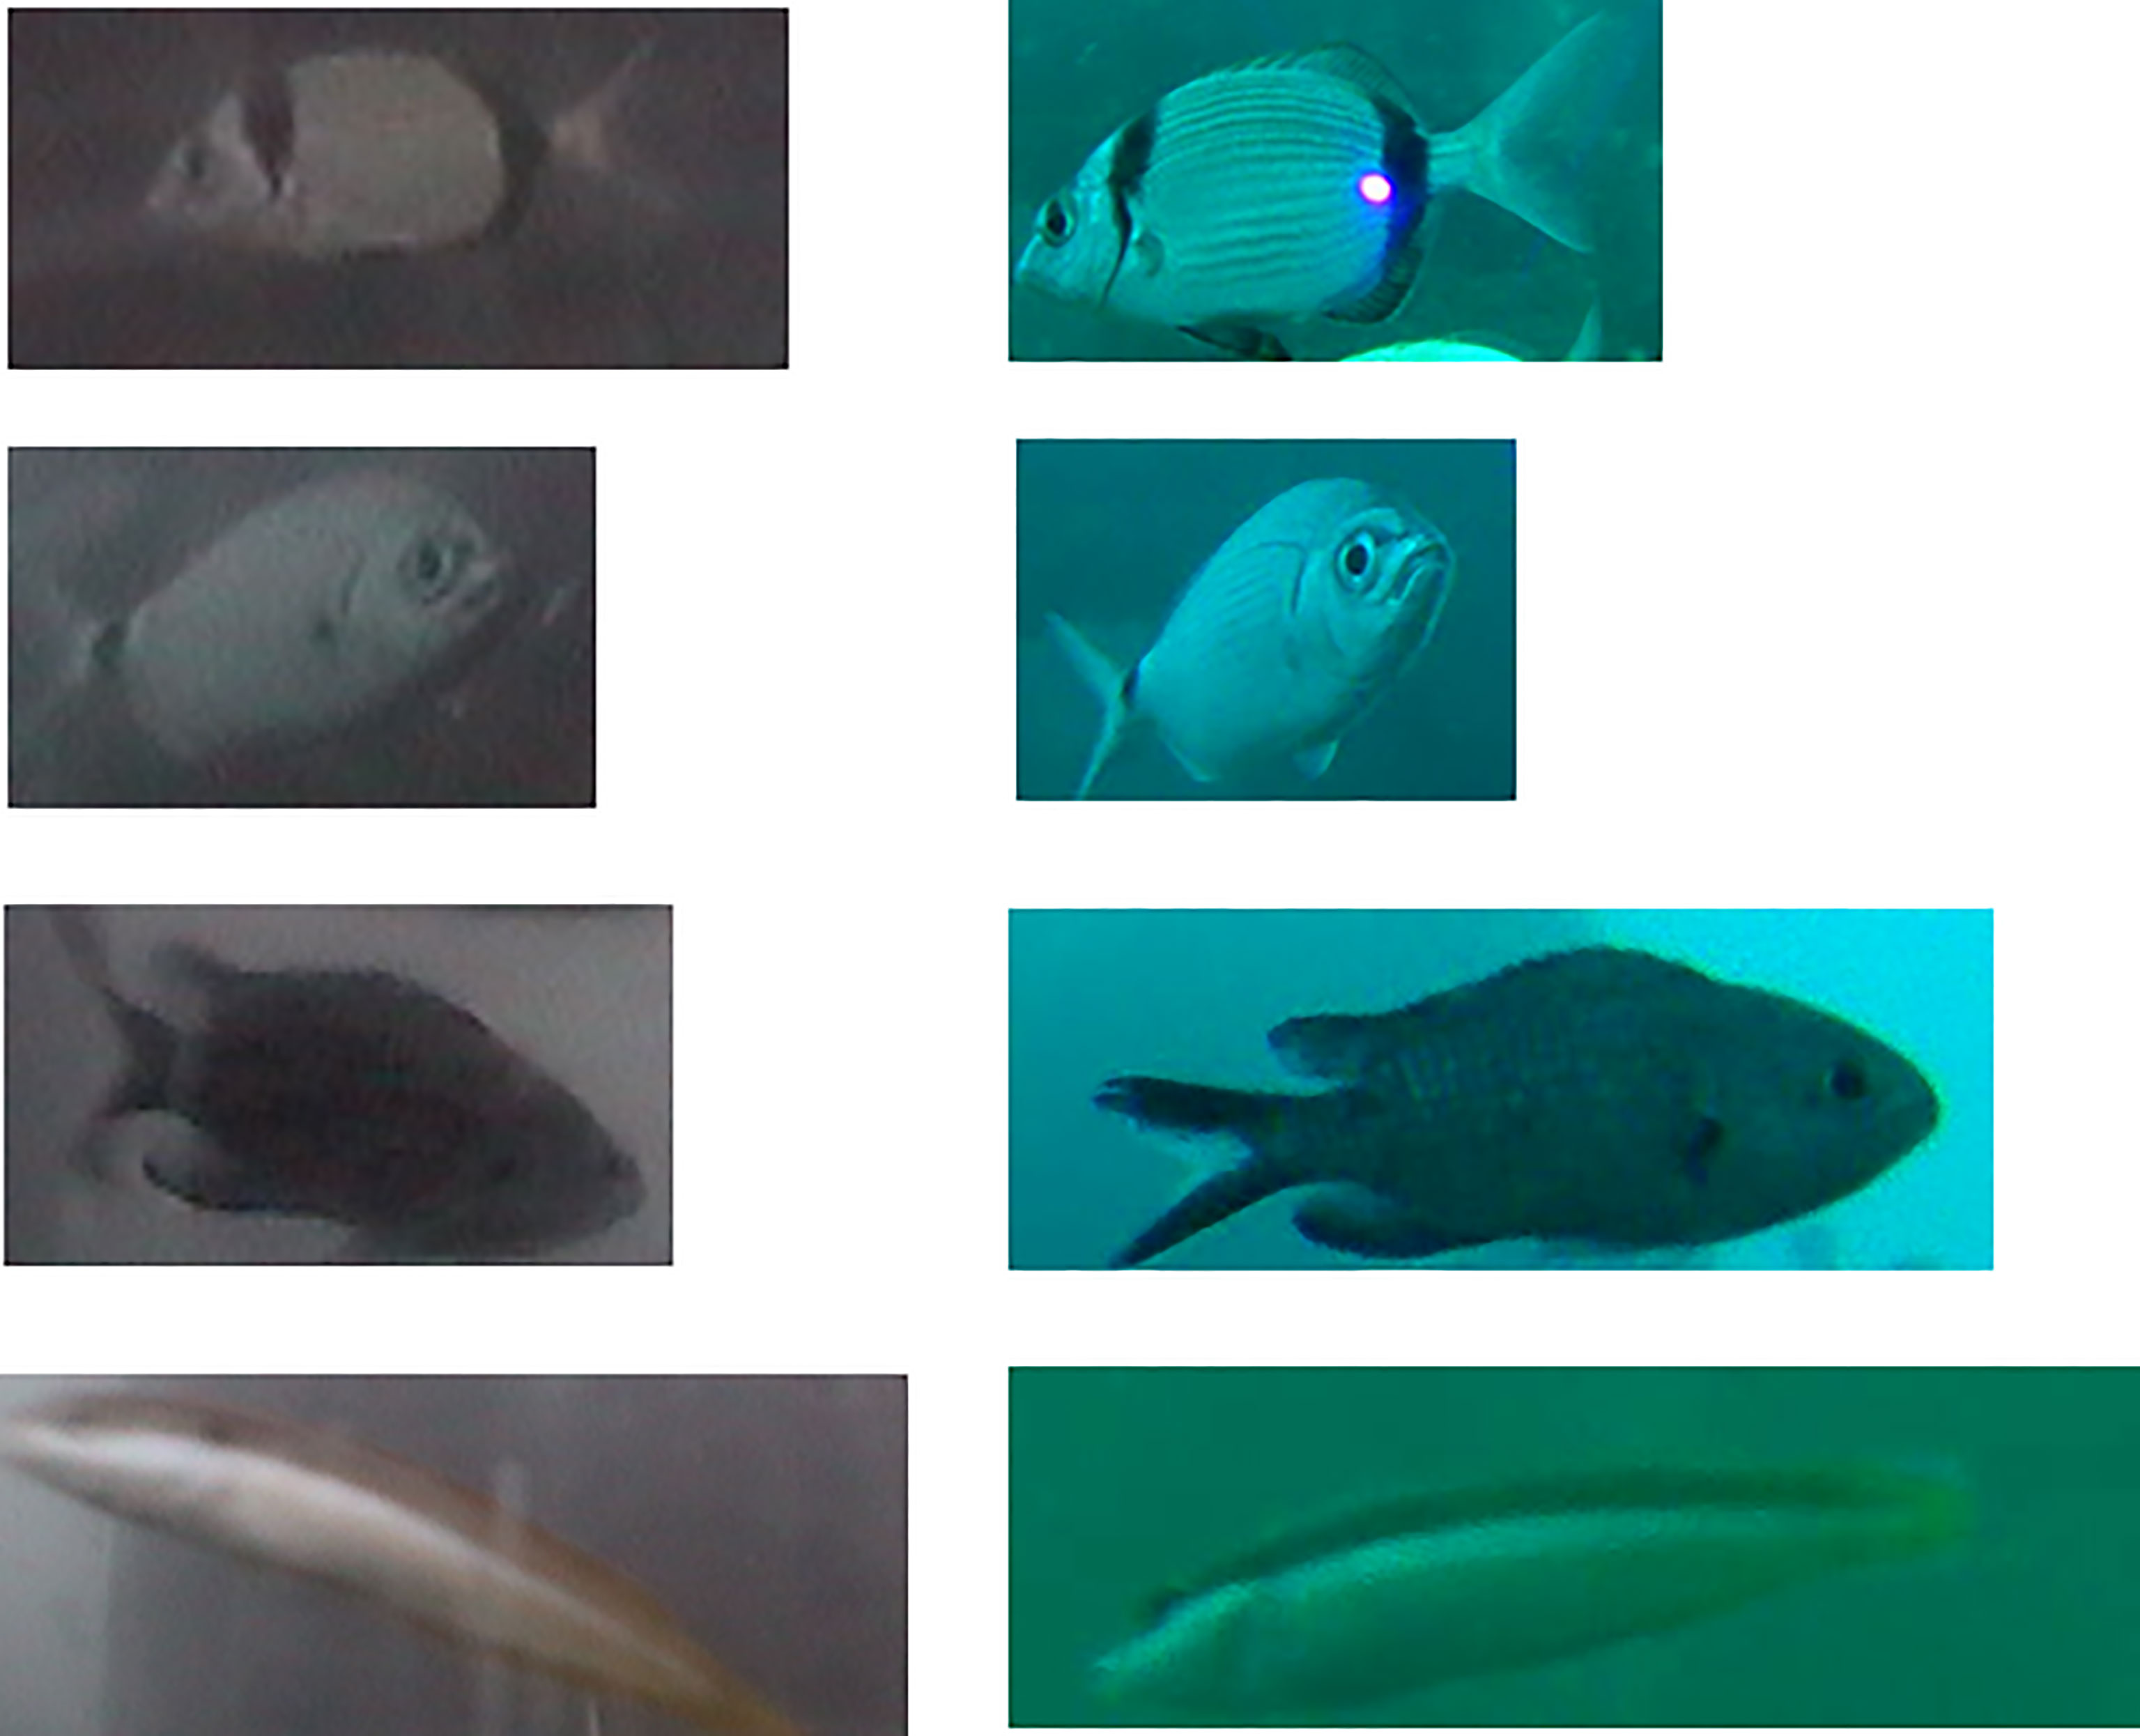
Figure 6 Four examples of fish images before (left) and after (right) the substitution of the OBSEA camera with the new one with improved colour balance.
Experiment n.3
Fish detection with training on the time-ordered dataset: Within this experiment all the available data was used, including those fishes whose class was undetermined (i.e. the unclassified category). This experiment produced an average recall equal to 72.6%. The Figure 7 depicts the distribution of the recall over the different months of the year, showing a decay of performances over time, similar to experiment two, while the Figure 8 shows some examples of fish detection, where the red boxes represent the ground-truth bounding boxes, and the yellow boxes represent the bounding boxes automatically detected.
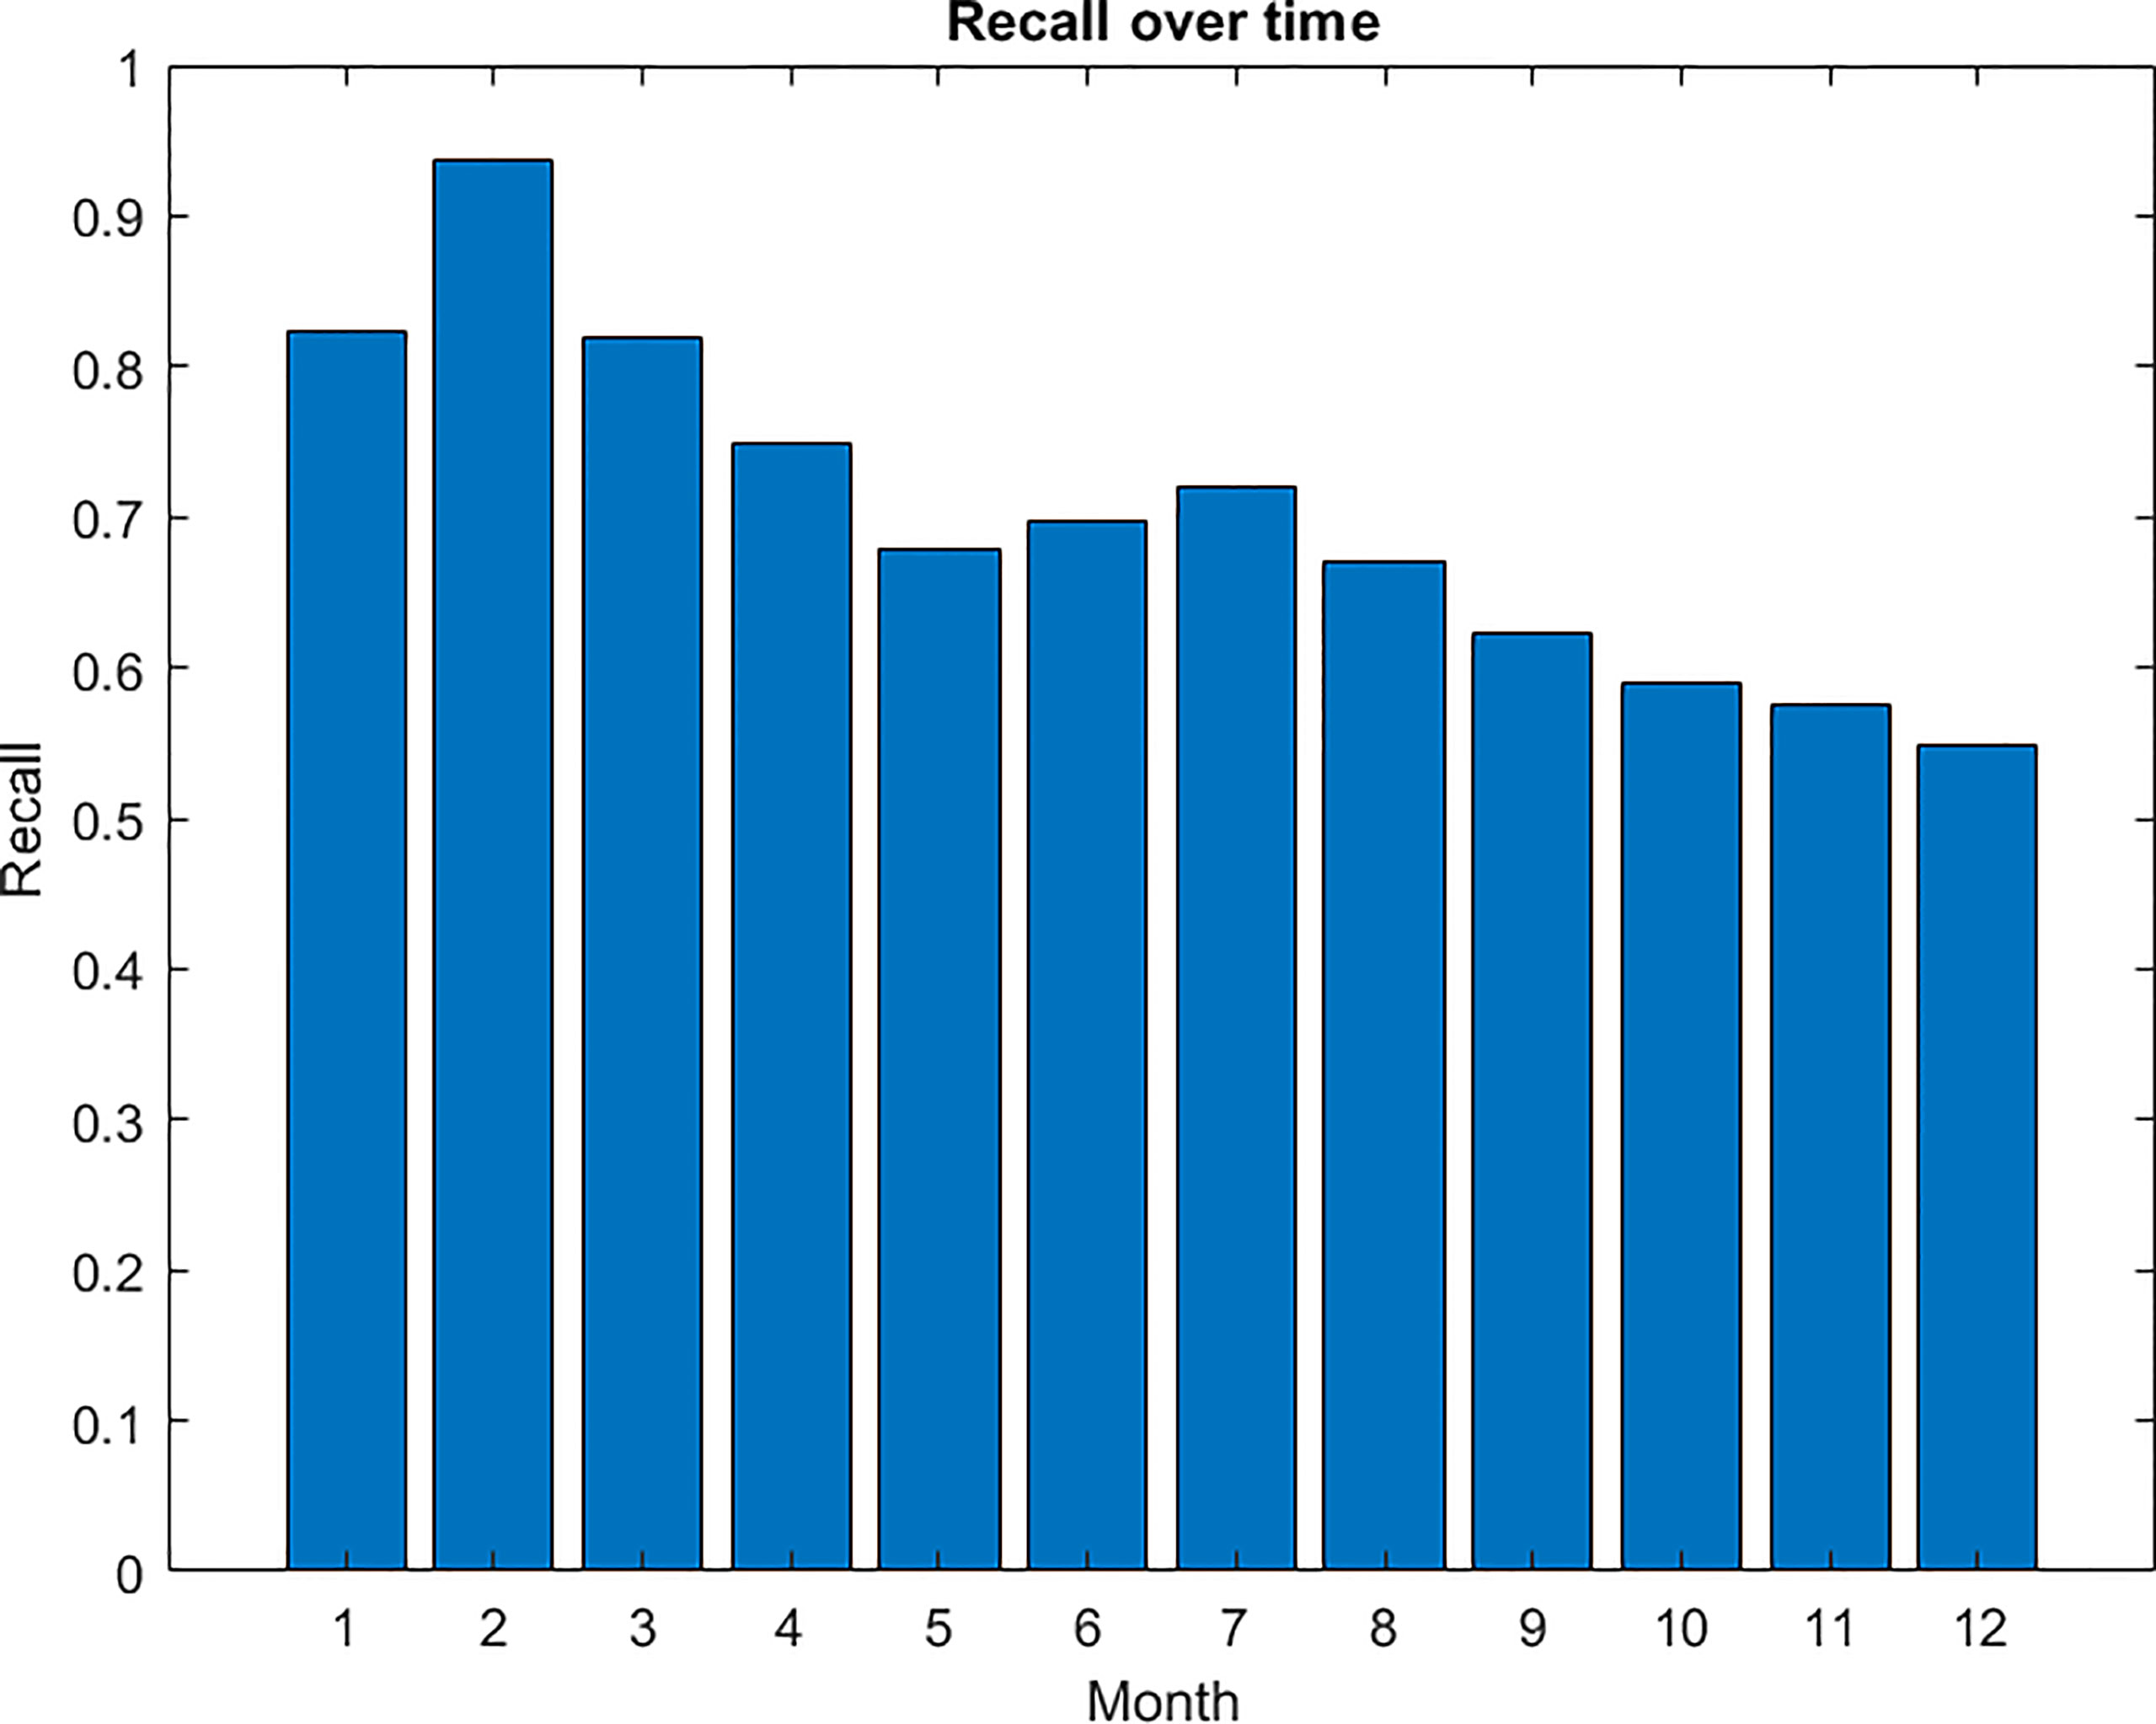
Figure 7 Monthly averaged recall for fish detection with the progressive decreasing trend.
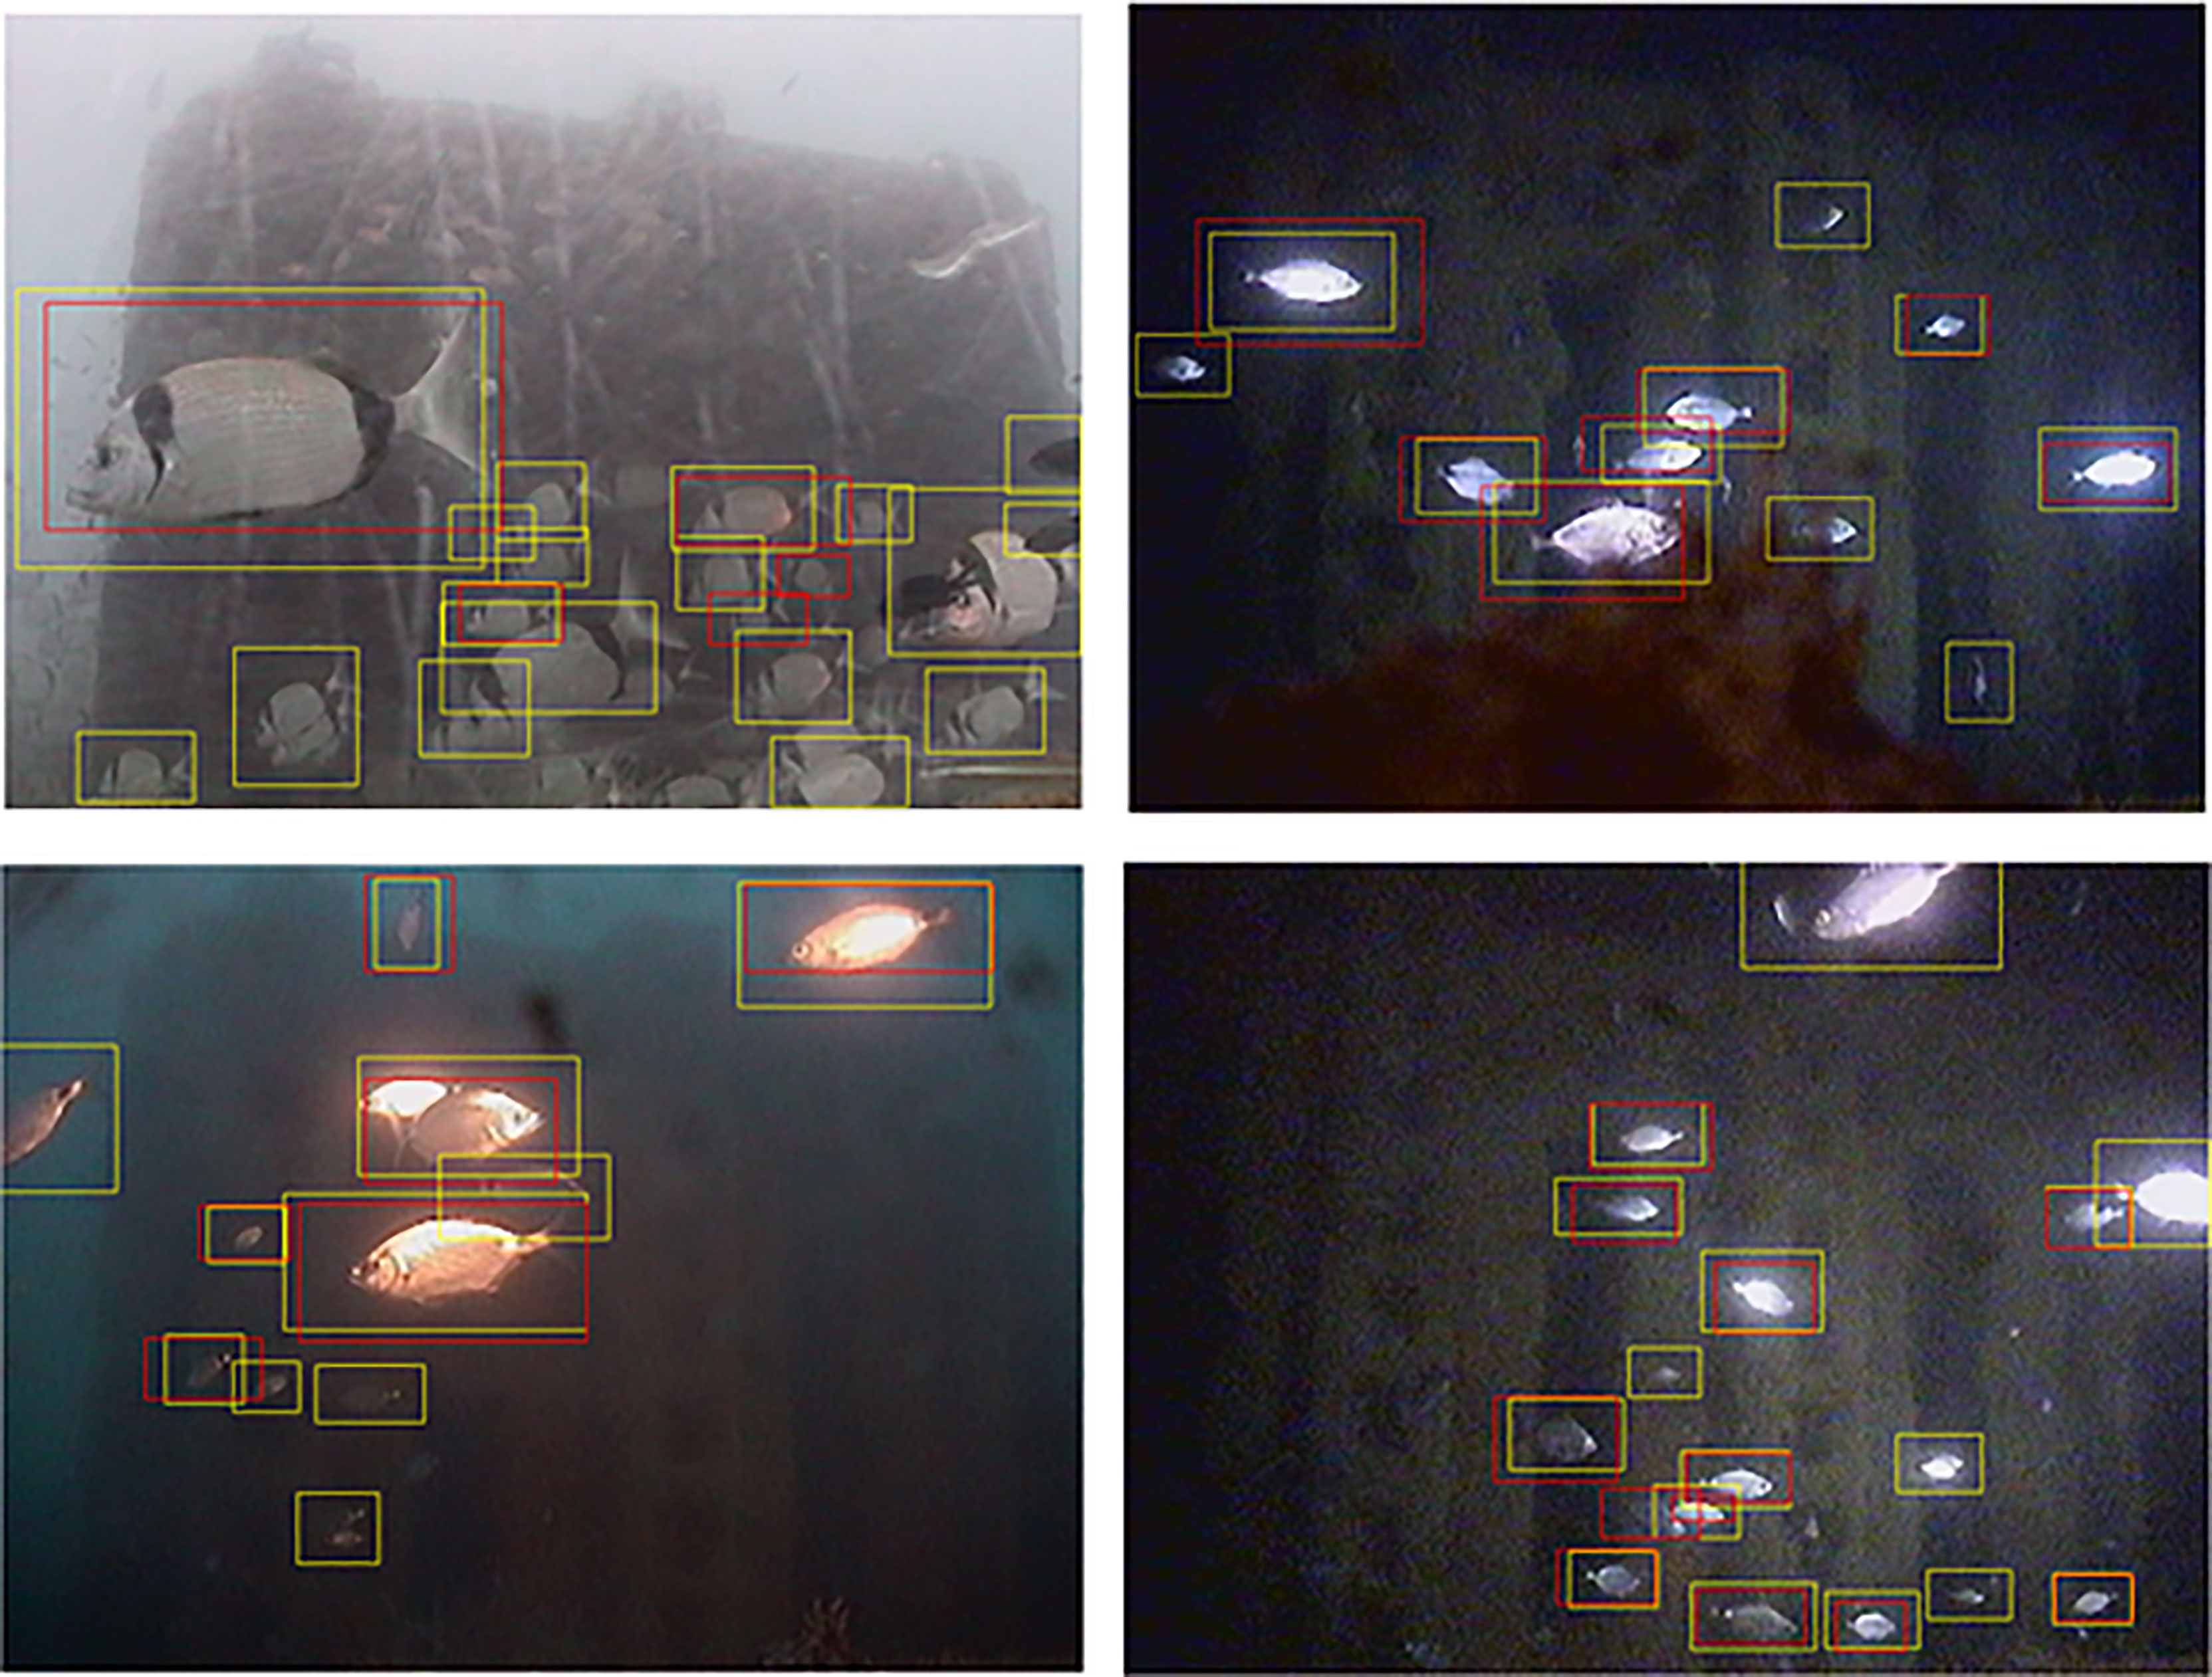
Figure 8 Four examples of automated fish detection. The red boxes represent the ground-truth bounding boxes, while the yellow boxes represent the automated fish detection.
Discussion
In this work, we assessed the problem of the concept drift for the automated classification and detection of fishes at a coastal cabled observatory. The results of the proposed study confirmed that an effective underwater monitoring system can be realised by exploiting an automatic learning procedure based on the DL approach, being able to count individuals and classify them in a way similar to what could be done by a human expert. The results obtained in the experiment shown in Figure 3, prove that the system is robust with respect to the fish shapes variations and motion. It is also robust to the light changes due to the day/night and seasonal photo-period dynamics, as well as to the application of the artificial lighting system of the observatory. Nevertheless, both the classification and detection algorithms showed a concept drift when the data was streamed over a long (i.e. months) time period (see Figures 4, 5 and 7). Such a drift is caused by both natural and artificial factors. Though the camera was periodically maintained, the drop of performance was caused both by the presence of fouling onto the porthole, due to the natural increase of the seasonal temperatures, and by the change of the species present in the surrounding of the observatory, as reported in Figure 2A. In fact, during the training phase of the classification and detection experiments the number of specimens and the proportion among the species changed sensibly with a prevalence of specimens of the species Oblada melanura (f6) in the first three months and an increase of fishes of the species Diplodus vulgaris (f1), Diplodus saragus (f2), Chromis cromis (f15) and Coris julis (f23), in the remaining months used as test set. Very variable numbers of individuals for different video-detected species are usually reported in coastal image monitoring with fixed cameras. In fact, species assemblages can be affected by relevant variations over the year, depending on seasonal biological and physical parameters (Aguzzi et al., 2013; Aguzzi et al., 2015; Sbragaglia et al., 2019). Moreover, a sensible drop of classification performance occurred in December (see Figure 5), when a new camera with a different colour balance mechanism substituted the old one. The classifier was trained before the change of the camera and could not manage this modification. As a consequence, the accuracy dropped down significantly. A different behaviour resulted for the fish detection task (Figure 7), where the effect of the concept drift is sensibly reduced with respect to the fish classification task. The detection algorithm was trained in order to recognize a fish with respect to the image background, without taking care of the visual characteristics needed to discriminate among species. As a consequence the concept drift effect, caused by the change of the camera setup, was sensibly mitigated. In fact, even if the image colour balance changed in December, the detection algorithm was still capable of detecting the learnt fish shapes.
Fixed cabled observatories like the OBSEA platform, that is part of the Joint European Research Infrastructure of Coastal Observatories (JERICO) and is a testing site of the European Multidisciplinary Seafloor and column Observatory (EMSO), have high costs for deployment and maintenance. The automated services for producing valuable scientific knowledge are recognised to be relevant tools for optimising cost/benefit of the infrastructure (Aguzzi et al., 2019). Nevertheless, the reliability of such services to provide an effective tracking of life components in marine ecosystems, is not yet proven at present and the solution of the concept drift phenomenon is an obstacle that needs to be urgently addressed.
Although the concept drift is a major concern for the definition of automated services, very few studies address this problem in the field of marine monitoring (Lagenkämper et al., 2020; Kloster et al., 2020). The recent literature in the computer vision and machine learning community proposes several general purpose approaches useful to mitigate the concept drift problem (Langenkämper et al., 2019). Among those, promising research directions include active learning (Brust et al., 2020; Wu et al., 2020) and incremental learning (He et al., 2020; Zhou et al., 2021), with specific attention to emerging trends in self-supervised and few-shot learning (Jaiswal et al., 2021; Ohri and Kumar, 2021). The active learning approach consists in techniques aimed at minimising the effort of human experts in selecting new valuable unlabelled examples. These are used for training a classifier based on machine learning, while the incremental learning, depending on the classifier architecture, uses a selected set of new examples to dynamically improve classifier performance. Self-supervised and few-shot learning are novel methodologies that strongly reduce the use of positive and negative examples during the training of a machine-learning based algorithm.
In the context of cabled observatories, the creation of a training dataset for fish detection and classification is a bottleneck, even if active learning sensibly reduces the effort for labelling the acquired images. This process can be further improved by combining active learning with the crowd sourcing data and labelling, produced by citizen science activities as discussed in Støttrup et al. (2018) and DiBattista et al. (2021). In this case, several categories spanning from students to professional fisherman or amatorial divers can efficiently contribute to the labelling of the acquired images and combine this effort with active learning techniques to select the most relevant images for training/updating the classifier, as discussed in Sayin et al. (2021).
The new minimal and effective training set generated through an active learning task can be combined with an incremental learning technique for updating the classifier (Delange et al., 2021; Liu et al., 2021). The major challenge of the incremental learning task is to improve the classifier even by learning new classes, possibly characterised by few instances, without a catastrophic forgetting of the previously acquired discrimination capabilities. This capability is critical, especially when the input data originates from a continuous stream as in the case of the OBSEA cabled observatory (Delange et al., 2021; Din et al., 2021; Mai et al., 2022).
Figure 9 summarises the whole pipeline that could be implemented for creating an automated service for a cabled observatory. In the proposed diagram, the red lines and boxes represent the tasks involved in the automated classification of the acquired images and in the production of the abundance time series for each species detected. As discussed in Section 2, the Fish Classifier is obtained through a fine-tuning training activity (dotted blue lines and boxes), aimed at specialising a classifier previously trained on a general purpose image dataset, within a transfer learning approach (dashed green lines and boxes). The fine-tuning training activity is based on the annotation of the acquired images by expert biologists, and since the annotation task is really time consuming also citizen science activities could be useful to ease the ground-truth generation process. According to the literature, the incremental learning task could be activated when the average classification confidence of the organisms contained in the images decreases below a given threshold or when the number of unclassified organisms exceeds a given threshold (Zhou et al., 2021; Mai et al., 2022). The number of unclassified organisms could be estimated using the confidence level for each class already provided by the classifier. In this case, a new training set obtained through an active learning approach can be considered for updating the fish classifier.
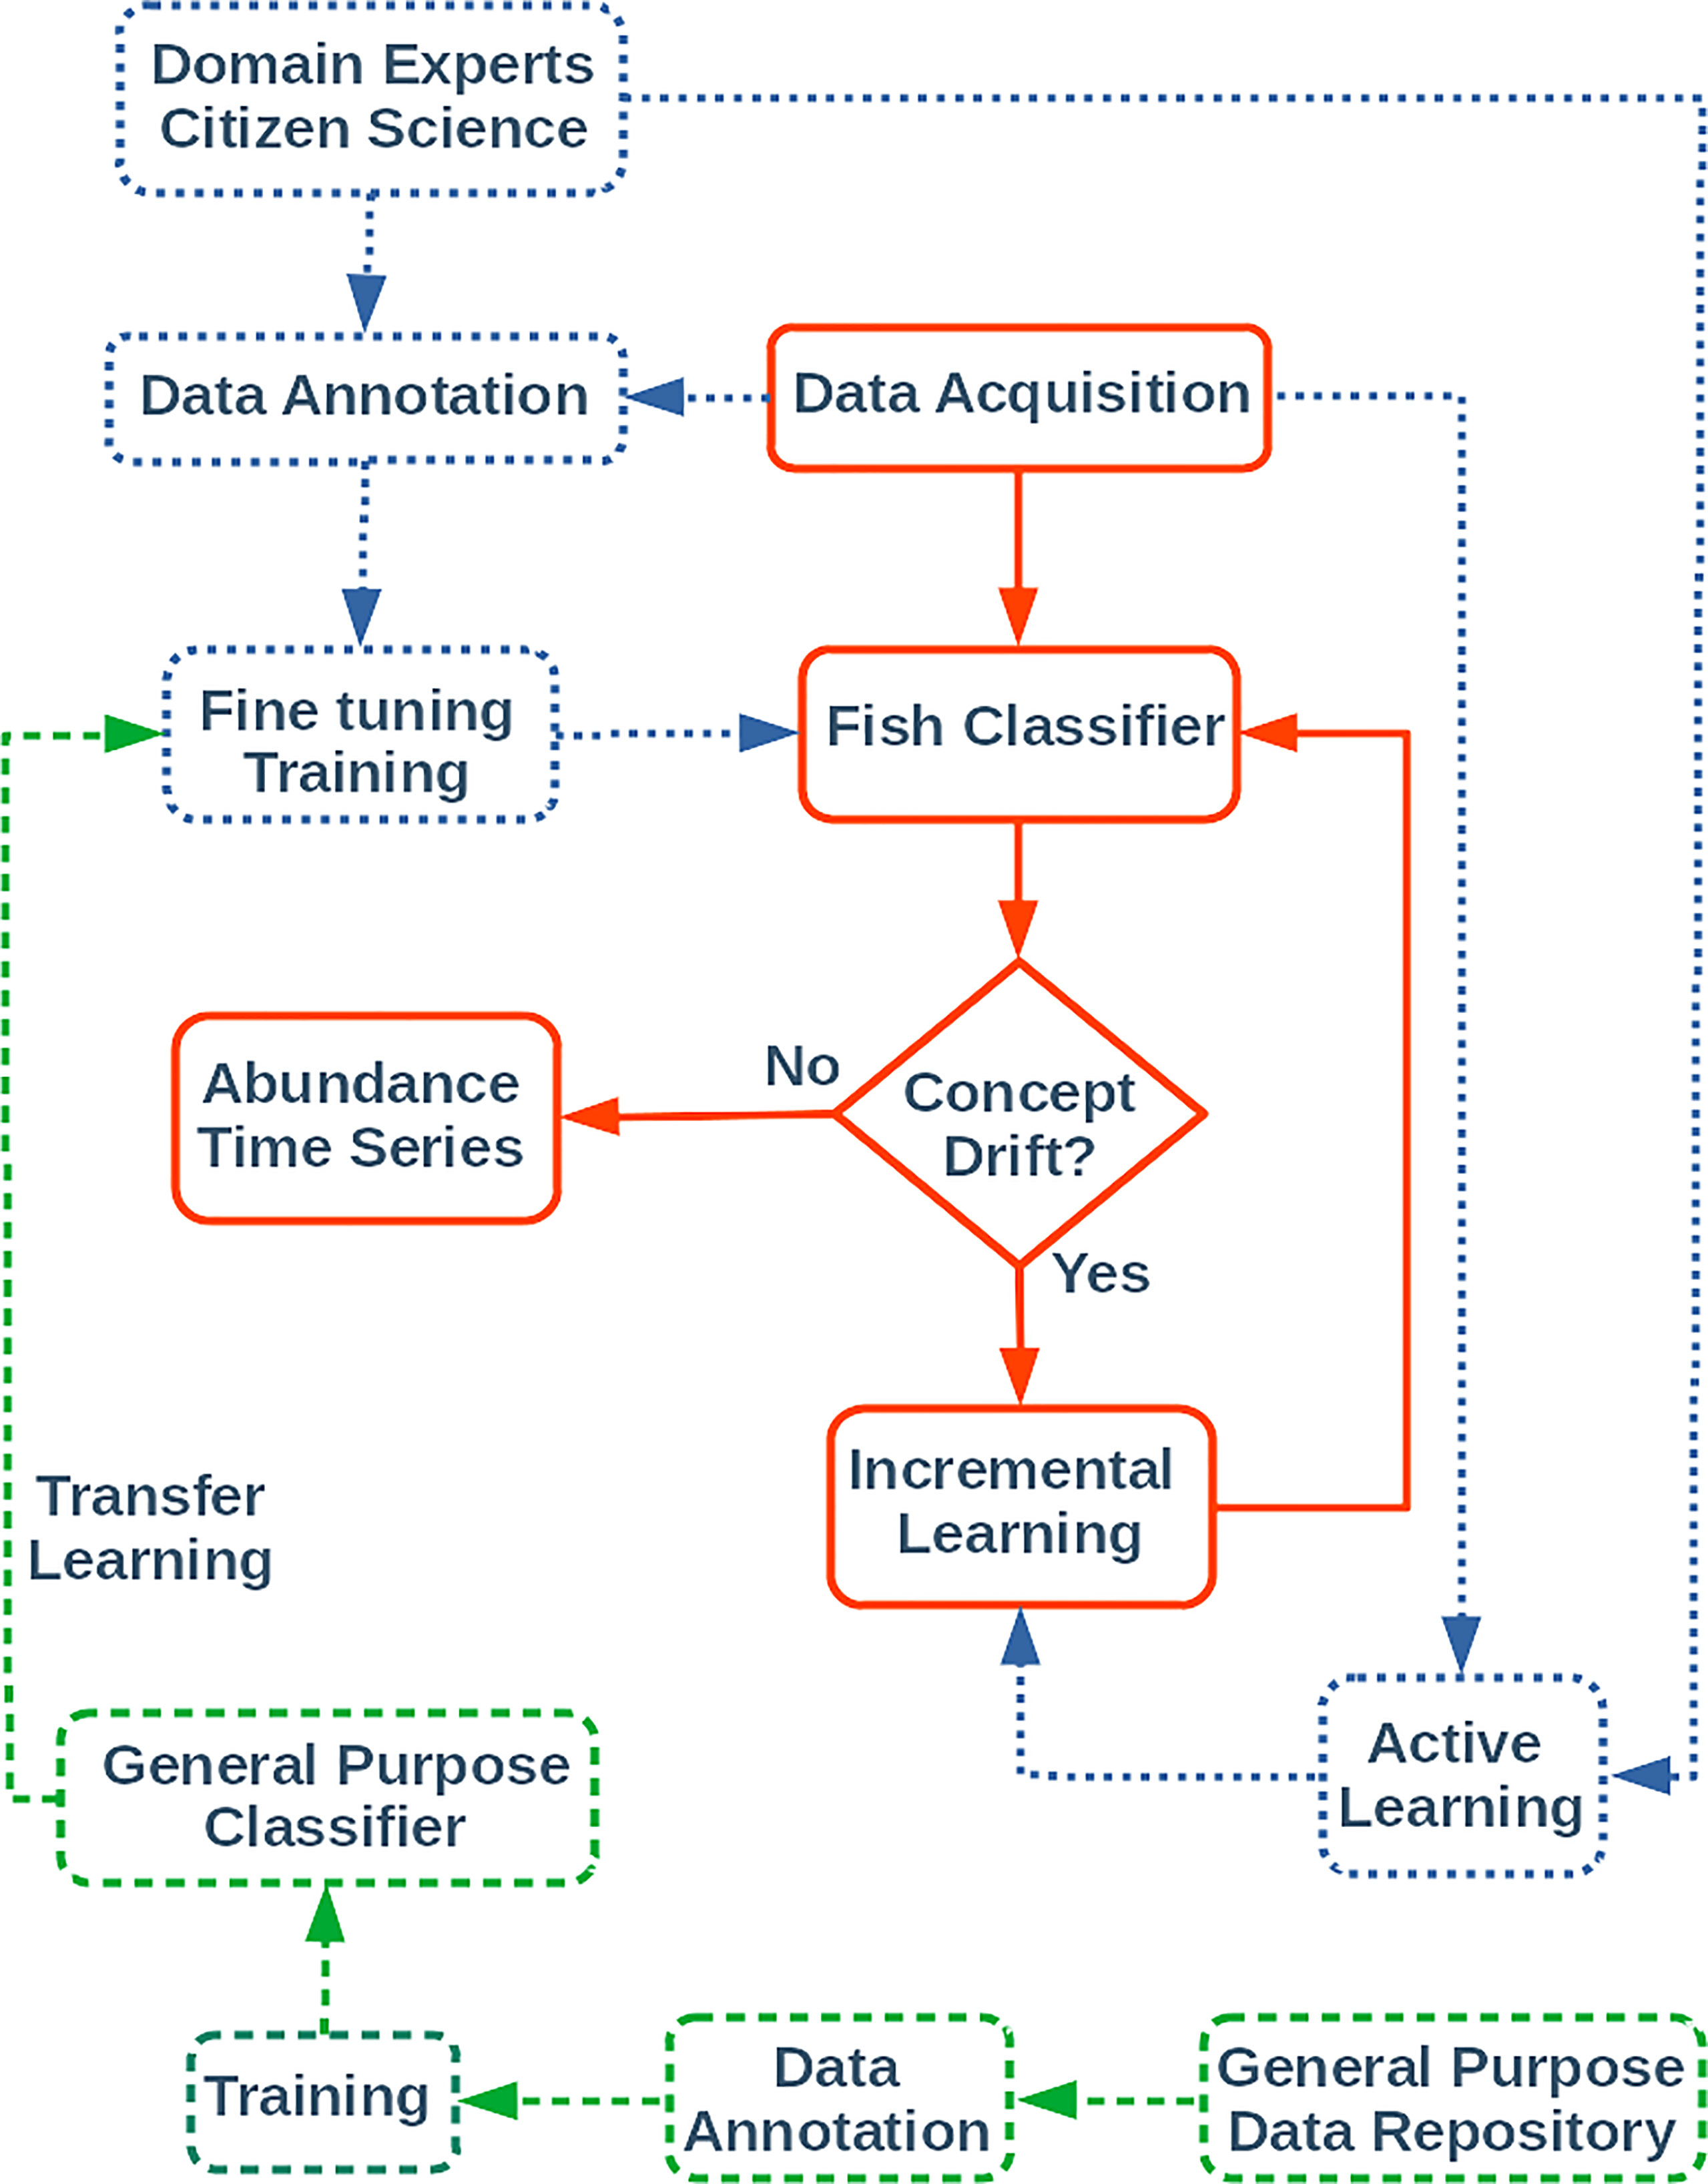
Figure 9 The complete fish classification pipeline for a future automated service at the OBSEA observatory. The continuous red lines and boxes describe the automated service; the dotted blue lines and boxes represent annotation and training activities; the dashed green lines and boxes represent the transfer learning activities.
Finally, the machine learning procedures used for the image analysis can be easily generalised to other types of marine organisms, as these methodologies are in no way linked to the specific image details and can be applied to any type of visual-based observing system.
Data Availability Statement
The time series of specimen counts per species, obtained through the visual inspection of the image dataset, is provided as a supplementary material (only the images containing at least one specimen are reported). The image datasets analysed for this study can be accessed by contacting the OBSEA observatory [https://www.obsea.es/] on reasonable request.
Author Contributions
SM, EO, JA, and JR have conceived research activity. MF produced the ground-truth by visually inspecting and tagging the images. EO and NG implemented the classification and detection algorithms. EO and SM defined the experiments for the concept drift assessment. EO, SM, JA, and JR wrote the manuscript. All the authors reviewed and edited the manuscript. All authors contributed to the article and approved the submitted version.
Funding
This research activity was partially funded by the “ENDURUNS - Development and demonstration of a long-endurance sea surveying autonomous unmanned vehicle with gliding capability powered by hydrogen fuel cell project”, Horizon 2020, Grant Agreement H2020-MG-2018-2019-2020 n.824348 and by the “Joint European Research Infrastructure of Coastal Observatories: Science, Service, Sustainability - JERICO-S3’’ project, Horizon 2020, Grant Agreement no. 871153. This research was also funded within the framework of the following project activities: ARIM (Autonomous Robotic sea-floor Infrastructure for benthopelagic Monitoring; MarTERA ERA-Net Cofound); RESBIO (TEC2017-87861-R; Ministerio de Ciencia, Innovación y Universidades). We also profited from the funding from the Spanish Government through the ‘Severo Ochoa Centre of Excellence’ accreditation (CEX2019-000928-S).
Conflict of Interest
Authors EO and NG are employed by OnAIR srl.
The remaining authors declare that the research was conducted in the absence of any commercial or financial relationships that could be construed as a potential conflict of interest.
Publisher’s Note
All claims expressed in this article are solely those of the authors and do not necessarily represent those of their affiliated organizations, or those of the publisher, the editors and the reviewers. Any product that may be evaluated in this article, or claim that may be made by its manufacturer, is not guaranteed or endorsed by the publisher.
Acknowledgments
JA and JR are both members of the Tecnoterra Official Research Unit (ICM-CSIC and SARTI-UPC).
Footnotes
- ^ https://image-net.org/challenges/LSVRC/2015/
- ^ https://www.image-net.org/
- ^ https://image-net.org/challenges/LSVRC/2015/
References
Aguzzi J., Chatzievangelou D., Francescangeli M., Marini S., Bonofiglio F., del Rio J., et al. (2020). The Hierarchic Treatment of Marine Ecological Information From Spatial Networks of Benthic Platforms. Sensors 20, 1751. doi: 10.3390/s20061751
Aguzzi J., Chatzievangelou D., Marini S., Fanelli E., Danovaro R., Flögel S., et al. (2019). New High-Tech Interactive and Flexible Networks for the Future Monitoring of Deep-Sea Ecosystems. Environ. Sci. Technol. 53, 6616–6631. doi: 10.1021/acs.est.9b00409
Aguzzi J., Costa C., Furushima Y., Chiesa J. J., Menesatti P., Iwase R., et al. (2010). Behavioral Rhythms of Hydrocarbon Seep Fauna in Relation to Internal Tides. Marine Ecol. Prog. Ser. 418, 47–56. doi: 10.3354/meps08835
Aguzzi J., Doya C., Tecchio S., De Leo F. L., Azzurro E., Costa C., et al. (2015). Coastal Observatories for Monitoring of Fish Behaviour and Their Responses to Environmental Changes. Rev. Fish Biol. Fisheries 25, 463–483. doi: 10.1007/s11160-015-9387-9
Aguzzi J., Flögel S., Marini S., Thomsen L., lbiez J., Weiss P., et al. (2022). Developing Technological Synergies Between Deep-Sea and Space Research. Elementa-Science Anthropocene. doi: 10.1525/elementa.2021.00064
Aguzzi J., Manuél A., Condal F., Guillén J., Nogueras M., Del Río J., et al. (2011). The New SEAfloor OBservatory (OBSEA) for Remote and Long-Term Coastal Ecosystem Monitoring. Sensors-Basel 11, 5850–5872. doi: 10.3390/s110605850
Aguzzi J., Sbragaglia V., Santamaría G., del Río J., Sarda F., Nogueras M., et al. (2013). Daily Activity Rhythms in Temperate Coastal Fishes: Insights From Cabled Observatory Video Monitoring. Marine Ecol. Prog. Ser. 486, 223–236. doi: 10.3354/meps10399
Beyan C., Browman H. I. (2020). Setting the Stage for the Machine Intelligence Era in Marine Science. ICES J. Marine Sci. 77, 1267–1273. doi: 10.1093/icesjms/fsaa084
Bicknell A. W., Godley B. J., Sheehan E. V., Votier S. C., Witt M. J. (2016). Camera Technology for Monitoring Marine Biodiversity and Human Impact. Front. Ecol. Environ. 14, 424–432. doi: 10.1002/fee.1322
Brust M. R., Bouvry P., Danoy G., Talbi E. G. (2020). “Design Challenges of Trustworthy Artificial Intelligence Learning Systems,” in Asian Conference on Intelligent Information and Database Systems. Eds. Sitek P., Pietranik M., Krótkiewicz M., Drinilta C. (Singapore: Springer Singapore), 574–584. doi: 10.1007/978-981-15-3380-8_50
Canonico G., Buttigieg P. L., Montes E., Muller-Karger F. E., Stepien C., Wright D., et al. (2019). Global Observational Needs and Resources for Marine Biodiversity. Front. Marine Sci. 6. doi: 10.3389/fmars.2019.00367
Condal F., Aguzzi J., Sardà F., Nogueras M., Cadena J., Costa C., et al. (2012). Seasonal Rhythm in a Mediterranean Coastal Fish Community as Monitored by a Cabled Observatory. Mar. Biol. 159, 2809–2817. doi: 10.1007/s00227-012-2041-3
Cui S., Zhou Y., Wang Y., Zhai L. (2020). Fish Detection Using Deep Learning. Appl. Comput. Intell. Soft Comput. 2020, 3738108. doi: 10.1155/2020/3738108
Dañobeitia J. J., Pouliquen S., Johannessen T., Basset A., Cannat M., Pfeil B. G., et al. (2020). Toward a Comprehensive and Integrated Strategy of the European Marine Research Infrastructures for Ocean Observations. Front. Marine Sci. 7, 180. doi: 10.3389/fmars.2020.00180
Danovaro R., Aguzzi J., Fanelli E., Billet D., Gjerde K., Jamieson A., et al. (2017). A New International Ecosystem-Based Strategy for the Global Deep Ocean. Science 355, 452–454. doi: 10.1126/science.aah7178
Danovaro R., Fanelli E., Aguzzi J., Billett D., Carugati L., Corinaldesi C., et al. (2020). Ecological Variables for Developing a Global Deep-Ocean Monitoring and Conservation Strategy. Nat. Ecol. Evol. 4, 181–192. doi: 10.1038/s41559-019-1091-z
Delange M., Aljundi R., Masana M., Parisot S., Jia X., Leonardis A., et al. (2021). A Continual Learning Survey: Defying Forgetting in Classification Tasks. IEEE Trans. Pattern Anal. Mach. Intell. doi: 10.1109/TPAMI.2021.3057446
Del Río J., Nogueras M., Aguzzi J., Toma D., Masmitja I., Carandell M., et al. (2020). A Decadal Balance for a Cabled Observatory Deployment. IEEE Access 8, 33163–33177. doi: 10.1109/ACCESS.2020.2973771
Dibattista J. D., West K. M., Hay A. C., Hughes J. M., Fowler A. M., McGrouther M. A. (2021). Community-Based Citizen Science Projects can Support the Distributional Monitoring of Fishes. Aquat. Conserv: Marine Freshw Ecosyst. 31, 1– 14. doi: 10.1002/aqc.3726
Din S. U., Shao J., Kumar J., Mawuli C. B., Mahmud S. M. H., Zhang W., et al. (2021). Data Stream Classification With Novel Class Detection: A Review, Comparison and Challenges. Knowl Inf. Syst. 63 (9), 2231–2276. doi: 10.1007/s10115-021-01582-4
European Commission (2018). Artificial Intelligence for Europe, Communication From the Commission to the European Parliament, the European Council, the Council, the European Economic and Social Committee and the Committee of the Regions (Brussels: European Commission), 25.4.2018 COM. 237 final.
European Marine Board - Working Group on Big Data in Marine Science (2020) Big Data in Marine Science. European Marine Board IVZW Future Science Brief 6, April 2020. Available at: https://www.marineboard.eu/publications/big-data-marine-science (Accessed October 2021).
Fawcett T. (2006). An Introduction to ROC Analysis. Pattern Recognition Lett. 27 (8), 861–874. doi: 10.1016/j.patrec.2005.10.010. ISSN 0167-8655.
Harrison D., De Leo F. C., Gallin W. J., Mir F., Marini S., Leys S. P. (2021). Machine Learning Applications of Convolutional Neural Networks and Unet Architecture to Predict and Classify Demosponge Behavior. Water 2021 (13), 2512. doi: 10.3390/w13182512
Hashmani M. A., Jameel S. M., Alhussain H., Rehman M., Budiman A. (2019). Accuracy Performance Degradation in Image Classification Models Due to Concept Drift. Int. J. Adv. Comput. Sci. Appl. 10 (5), 422–425. doi: 10.14569/ijacsa.2019.0100552
He Z. (2020). “Deep Learning in Image Classification: A Survey Report Proceedings,” in 2020 2nd International Conference on Information Technology and Computer Application. (Guangzhou, China) 174–177 (ITCA 2020), art. no. 9421942.
He J., Mao R., Shao Z., Zhu F. (2020). “Incremental Learning in Online Scenario,” in 2020 IEEE/CVF Conference on Computer Vision and Pattern Recognition (CVPR). (IEEE Computer Society) 2020, 13923–13932. doi: 10.1109/CVPR42600.2020.01394
He K., Zhang X., Ren S., Sun J. (2016). “Deep Residual Learning for Image Recognition,” in 2016 IEEE Conference on Computer Vision and Pattern Recognition (CVPR). (Las Vegas, NV, USA: IEEE) 2016-December. 770–778, art. no. 7780459.
Jahanbakht M., Xiang W., Hanzo L., Azghadi M. R. (2021). Internet of Underwater Things and Big Marine Data Analytics—a Comprehensive Survey. IEEE Commun. Surveys Tutorials 23, 904–956. doi: 10.1109/COMST.2021.3053118
Jaiswal A., Babu A. R., Zadeh M. Z., Banerjee D., Makedon F. (2021). A Survey on Contrastive Self-Supervised Learning. Technologies 9 (1), 2. doi: 10.3390/technologies9010002
Jameel S. M., Hashmani M. A., Rehman M., Budiman A. (2020). An Adaptive Deep Learning Framework for Dynamic Image Classification in the Internet of Things Environment. Sensors 20 (20), 5811. doi: 10.3390/s20205811
Juniper S. K., Matabos M., Mihály S., Ajayamohan R. S., Gervais F., Bui A. O. (2013). A Year in Barkley Canyon: A Time-Series Observatory Study of Mid-Slope Benthos and Habitat Dynamics Using the NEPTUNE Canada Network. Deep Sea Res. Part II: Topical Stud. Oceanography 92, 114–123. doi: 10.1016/j.dsr2.2013.03.038
Kloster M., Langenkämper D., Zurowietz M., Beszteri B., Nattkemper T. W. (2020). Deep Learning-Based Diatom Taxonomy on Virtual Slides. Sci. Rep. 10 (1), 14416. doi: 10.1038/s41598-020-71165-w
Langenkämper D., Simon-Lledó E., Hosking B., Jones D. O. B., Nattkemper T. W. (2019). On the Impact of Citizen Science-Derived Data Quality on Deep Learning Based Classification in Marine Images. PloS One 14 (6), e0218086. doi: 10.1371/journal.pone.0218086
Langenkämper D., van Kevelaer R., Purser A., Nattkemper T. W. (2020). Gear-Induced Concept Drift in Marine Images and Its Effect on Deep Learning Classification. Front. Mar. Sci. 7, 506. doi: 10.3389/fmars.2020.00506
LeCun Y., Bengio Y., Hinton G. (2015). Deep Learning. Nature 521 (7553), 436. doi: 10.1038/nature14539
Levin L. A., Bett B. J., Gates A. R., Heimbach P., Howe B. M., Janssen F., et al. (2019). Global Observing Needs in the Deep Ocean. Front. Marine Sci. 6, 241. doi: 10.3389/fmars.2019.00241
Levin N., Kark S., Danovaro R. (2018). Adding the Third Dimension to Marine Conservation. Conserv. Lett. 11, e12408. doi: 10.1111/conl.12408
Li X., Tang Y., Gao T. (2017). “Deep But Lightweight Neural Networks for Fish Detection,” in OCEANS 2017 - Aberdeen. (Aberdeen, UK: IEEE) 1–5. doi: 10.1109/OCEANSE.2017.8084961
Liu S., Xue S., Wu J., Zhou C., Yang J., Li Z., et al. (2021). Online Active Learning for Drifting Data Streams IEEE Transactions on Neural Networks and Learning Systems. (IEEE) doi: 10.1109/TNNLS.2021.3091681
Lopez-Vazquez V., Lopez-Guede J.-M., Marini S., Fanelli E., Johnsen E., Aguzzi J. (2020). Video-Imaging Enhancement and Machine Learning Pipeline for Animal Tracking and Classification at Cabled Observatories. Sensors 20, 726. doi: 10.3390/s20030726
Mai Z., Li R., Jeong J., Quispe D., Kim H., Sanner S. (2022). Online Continual Learning in Image Classification: An Empirical Survey. Neurocomputing 469, 28–51. doi: 10.1016/j.neucom.2021.10.021
Malde K., Handegard N. O., Eikvil L., Salberg A. B. (2020). Machine Intelligence and the Data-Driven Future of Marine Science. ICES J. Marine Sci. 77, 1274–1285. doi: 10.1093/icesjms/fsz057
Marini S., Corgnati L., Mantovani C., Bastianini M., Ottaviani E., Fanelli E., et al. (2018a). Automated Estimate of Fish Abundance Through the Autonomous Imaging Device GUARD1 Measurement. J. Int. Meas Confed 126, 72–75. doi: 10.1016/j.measurement.2018.05.035
Marini S., Fanelli E., Sbragaglia V., Azzurro E., Del Rio J., Aguzzi J. (2018b). Tracking Fish Abundance by Underwater Image Recognition. Sci. Rep. 8, 13748. doi: 10.1038/s41598-018-32089-8
Ohri K., Kumar M. (2021). Review on Self-Supervised Image Recognition Using Deep Neural Networks. Knowledge-Based Syst. 224 (2021), 107090. ISSN 0950-7051. doi: 10.1016/j.knosys.2021.107090
Painting S. J., Collingridge K. A., Durand D., Grémare A., Créach V., Bernard G. (2020). Marine Monitoring in Europe: Is it Adequate to Address Environmental Threats and Pressures? Ocean Sci. 16 (1), 235–252. doi: 10.5194/os-16-235-2020
Pan S., Yang Q. (2010). A Survey on Transfer Learning. IEEE Trans. knowl Data Eng. 22 (10), 1345–1359. doi: 10.1109/TKDE.2009.191
Raffaelli D., Bell E., Weithoff G., Matsumoto A., Cruz-Motta J. J., Kershaw P., et al. (2003). The Ups and Downs of Benthic Ecology: Considerations of Scale, Heterogeneity and Surveillance for Benthic-Pelagic Coupling. J. Exp. Mar. Biol. Ecol. 285-286, 191–203. doi: 10.1016/S0022-0981(02)00527-0
Rawat W., Wang Z. (2017). Deep Convolutional Neural Networks for Image Classification: A Comprehensive Review. Neural Comput. 29 (9), 2352–2449. doi: 10.1162/neco_a_00990
Redmon J., Farhadi A. (2018) Yolov3: An Incremental Improvement. Available at: https://arxiv.org/abs/1804.02767.
Ren S., He K., Girshick R., Sun J. (2015). Faster R-CNN: Towards Real-Time Object Detection With Region Proposal Networks. Adv. Neural Inf. Process. Syst. 28 (NIPS), 91–99. doi: 10.1109/TPAMI.2016.2577031.
Rountree R., Aguzzi J., Marini S., Fanelli E., De Leo F., Del Rio J., et al. (2020). Towards an Optimal Design for Ecosystem-Level Ocean Observatories. Oceanogr Marine Biol: Annu. Rev. (OMBAR) 58, 9–106. doi: 10.1201/9780429351495-2
Sayin B., Krivosheev E., Yang J., Passerini A., Casati F. (2021). A Review and Experimental Analysis of Active Learning Over Crowdsourced Data. Artif. Intell. Rev. 54, 5283–5305. doi: 10.1007/s10462-021-10021-3
Sbragaglia V., Nuñez J. D., Dominoni D., Coco S., Fanelli E., Azzurro E., et al. (2019). Annual Rhythms of Temporal Niche Partitioning in the Sparidae Family are Correlated to Different Environmental Variables. Sci. Rep. 9, 1–11. doi: 10.1038/s41598-018-37954-0
Shi W., Cao J., Zhang Q., Li Y., Xu L. (2016). Edge Computing: Vision and Challenges. IEEE Internet Things J. 3 (5), 637–646. doi: 10.1109/JIOT.2016.2579198
Støttrup J. G., Kokkalis A., Brown E. J., Olsen J., Kærulf Andersen S., Pedersen E. M. (2018). Harvesting Geo-Spatial Data on Coastal Fish Assemblages Through Coordinated Citizen Science. Fisheries Res. 208, 86–96. doi: 10.1016/j.fishres.2018.07.015
Tan M., Le Q. V. (2019). “EfficientNet: Rethinking Model Scaling for Convolutional Neural Networks,” in Proceedings of the 36th International Conference on Machine Learning. (Long Beach, California, USA: PMLR) 2019-June. 10691–10700.
Wu J., Sheng V. S., Zhang J., Li H., Dadakova T., Swisher C. L., et al. (2020). Multi-Label Active Learning Algorithms for Image Classification: Overview and Future Promise. ACM Comput Surveys 53 (2), 1–35. doi: 10.1145/3379504.
Zhou D.-W., Yang Y., Zhan D.-C. (2021). “Learning to Classify With Incremental New Class,” in IEEE Transactions on Neural Networks and Learning Systems. (IEEE) doi: 10.1109/TNNLS.2021.3104882
Zhu L., Xie Z., Liu L., Tao B., Tao W. (2021). IoU-Uniform R-CNN: Breaking Through the Limitations of RPN. Pattern Recognition 112 (2021), 107816. doi: 10.1016/j.patcog.2021.107816. ISSN 0031-3203.
Keywords: concept drift, automated fish classification, automated fish detection, deep learning, underwater imaging, underwater observing systems, cabled observatories
Citation: Ottaviani E, Francescangeli M, Gjeci N, del Rio Fernandez J, Aguzzi J and Marini S (2022) Assessing the Image Concept Drift at the OBSEA Coastal Underwater Cabled Observatory. Front. Mar. Sci. 9:840088. doi: 10.3389/fmars.2022.840088
Received: 20 December 2021; Accepted: 14 March 2022;
Published: 07 April 2022.
Edited by:
Juan José Dañobeitia, ERIC Foundation, ItalyReviewed by:
Daniel Langenkämper, Bielefeld University, GermanyGiorgio Riccobene, Laboratori Nazionali del Sud (INFN), Italy
Copyright © 2022 Ottaviani, Francescangeli, Gjeci, del Rio Fernandez, Aguzzi and Marini. This is an open-access article distributed under the terms of the Creative Commons Attribution License (CC BY). The use, distribution or reproduction in other forums is permitted, provided the original author(s) and the copyright owner(s) are credited and that the original publication in this journal is cited, in accordance with accepted academic practice. No use, distribution or reproduction is permitted which does not comply with these terms.
*Correspondence: Simone Marini, c2ltb25lLm1hcmluaUBzcC5pc21hci5jbnIuaXQ=