 Ignacio Pita1*
 Raphael Seguin1
 Yunne-Jai Shin1
 Pauline Viguier1
 Thibault Catry2
 Rodolphe Devillers2David Mouillot1,3
- 1Marine Biodiversity, Exploitation and Conservation (MARBEC), Univ Montpellier, Institut de Recherche pour le Développement (IRD), Institut Français de Recherche pour l’Exploitation de la Mer (IFREMER), CNRS, Montpellier, France
- 2Espace-Dev (IRD, Univ Montpellier, Univ Guyane, Univ La Réunion, Univ Antilles, Univ Nouvelle Calédonie), Montpellier, France
- 3Institut Universitaire de France, Paris, France
The Covid-19 pandemic is the latest example in a growing number of health, social, economic, and environmental crises humanity is facing. The multiple consequences of this pandemic crisis required strong responses from governments, including strict lockdowns. Yet, the impact of lockdowns on coastal ecosystems and maritime activities is still challenging to quantify over large spatial scales in comparison to the pre-Covid period. In this study, we used an object detection algorithm on Synthetic Aperture Radar (SAR) images acquired by the two Sentinel-1 satellites to assess the impact of the Covid-19 crisis on the presence of boats before, during and after lockdown periods in the French Mediterranean Exclusive Economic Zone. During the French most severe lockdown period (March – May 2020), we observed that ship frequentation remained at the same level from March to July 2020, instead of rising towards the summer peak like in previous years. Then, ship frequentation increased rapidly to a normal level in August 2020 when restrictions were lifted. By comparing morning and evening (7:00 am and 7:00 pm) ship frequentation during this period to pre-Covid years, we observed contrasting patterns. On the one hand, morning detections were particularly high, while on the other hand evening detections were significantly lower and less concentrated in coastal touristic waters than in previous years. Overall, we found a 9% decrease in ship frequentation between the year 2020 and the 2017-2019 period, with a maximum of 43% drop in June 2020 due to the lockdown. So, the Covid -19 crisis induced only a very short-term reduction in maritime activities but did not markedly reduce the annual ship frequentation in the French Mediterranean waters. The satellite imagery approach is an alternative method that improves our understanding of the pandemic impacts at an unprecedented spatiotemporal scale and resolution.
Introduction
The humanity’s demand on natural resources is increasingly exceeding Earth’s biological rate of regeneration, inducing a growing number of social, economic, environmental and health crises (Bordo et al., 2001; Otero et al., 2020). The most recent and striking example is the Covid-19 pandemic (Sohrabi et al., 2020), a global health crisis that in addition to the worldwide loss of human lives, constitutes an unprecedented challenge to our globalized societies (OECD, 2020). To slow down the spread of the virus, governments set-up several preventive measures such as border shutdowns, quarantines, and lockdowns. According to the International Labor Organization (ILO), nearly half of the world’s global workforce has been at risk of losing their source of income due to lockdown measures. Informal workers are particularly vulnerable due to the lack of social aids and access to quality health care (ILO et al., 2020). With severe lockdowns limiting manual work and short food circuits, economic inequality is bound to increase in the aftermath of the pandemic. On the other side of the same coin, the drastic changes in our behavior imposed by the Covid 19 crises had major impacts on our environment by significantly decreasing our anthropogenic pressure (Bates et al., 2020; Bates et al., 2021). Thus, our socio-ecological systems have been profoundly modified over the last two years but most of the effects remain poorly quantified particularly in the vast ocean which is still challenging to monitor across space and time.
Human activities in the oceans rely on movements and exchanges whether for people or goods. However, lockdown measures impacted the local and global demand for seafood (Knight et al., 2020; Ortega et al., 2020) and restricted public access to the sea and even to the shore. Such effects should be reflected in spatiotemporal patterns of ship density, including those of the fisheries sector (Bennett et al., 2020; Depellegrin et al., 2020). Indeed, with a switch in consumption habits to long-lived products and the sudden closure of the food services sector, several fisheries halted their production due to a lack of demand (FAO, 2020a; Russo et al., 2021). One early example is the lobster fisheries worldwide that mainly depend on China’s imports, which halted before the World Health Organization (WHO) declaration of Covid 19 as a public emergency (Knight et al., 2020). Several other fisheries worldwide saw their fishing efforts decreasing dramatically. Indonesian shark trade dropped by 70% (Mongabay, 2020) while Peru, which holds the world’s largest commercial fishery, decreased its fishing activities by 80% (Global Fishing Watch, 2020). Similar consequences were seen in the Mediterranean where fishing efforts fell by 34% and landings declined by 49% during lockdown periods in comparison to precedent years (Coll, 2020; Coll et al., 2021). Furthermore, in several countries, including France, governments have provided financial aids to the fisheries sector to compensate for the operating losses. This allowed fishers to reduce their activity with limited impact on their income (Carvalho et al., 2020). It also meant a short recess from human activities for the exploited ecosystems that may have benefited from several months of hiatus in anthropogenic pressures (Coll, 2020). Yet, this potential hiatus in maritime activities remains unassessed over large scale due to limited standardized data and a lack of comparative baseline.
Satellite detection has often been used to track boats and fisheries behavior. Automatic Identification System (AIS) and Vessel Monitoring System (VMS) are self-reporting systems that provide massive data to monitor vessel activity and human presence in the oceans (Ferrà et al., 2018; James et al., 2018; Kroodsma et al., 2018; Depellegrin et al., 2020; Armelloni et al., 2021). Some studies used these data to assess the impact of Covid-19 on marine traffic (March et al., 2021). Alternatively, the development of Synthetic Aperture Radar (SAR) satellites has unlocked the possibility of detecting the location of marine vessels without requiring voluntary or automatic reporting via transmitters on board (Friedman et al., 2001; Pelich et al., 2015; Stasolla et al., 2016). Using an active sensor system, SAR images can be taken by day or night and regardless of weather conditions (Fernandez Arguedas et al., 2016). This opens up the possibility of detecting vessel activity that ranges from undeclared and illegal to recreational (Galdelli et al., 2020; Lanz et al., 2021). In contrast to fishing activities that are monitored, at least partly, through catch reports and AIS data, marine leisure activities are still challenging to assess, even more during the Covid-19 crisis while their impact on marine ecosystems and fish stocks is far from being negligible, targeting a large proportion of vulnerable species (Lewin et al., 2019; Hyder et al., 2020; Lloret et al., 2020).
In this study, we used the Search for Unidentified Marine Objects software (SUMO) developed by the European Union Joint Research Centre (JRC) (Greidanus et al., 2017a) in order to assess the impact of the Covid 19 crisis on the spatiotemporal patterns of boat density across the French Mediterranean coasts. The crisis resulted in a severe lockdown from the 17th of March to the 11th of May where the French population was required to quarantine at home with few exceptions (essential workers, health reasons, compelling family reasons or grocery shopping). Yet, the extent to which this lockdown induced a decrease of maritime activity and a hiatus in human pressure upon coastal ecosystems is unknown. With almost a dozen images per month, we were able to highlight the presence of human activity in the French Mediterranean between 2017 and 2019 as a “control” period compared to 2020 when the most severe lockdowns occurred.
Materials and Methods
Study Area and Data Collection
Our study aimed at quantifying human activity in the French Mediterranean waters. We used the French maritime boundaries and exclusive economic zones (200NM, version 11) (Flanders Marine Institute, 2019) in the Mediterranean Sea, which are composed of the Gulf of Lion and the waters around the island of Corsica (Figure 1).
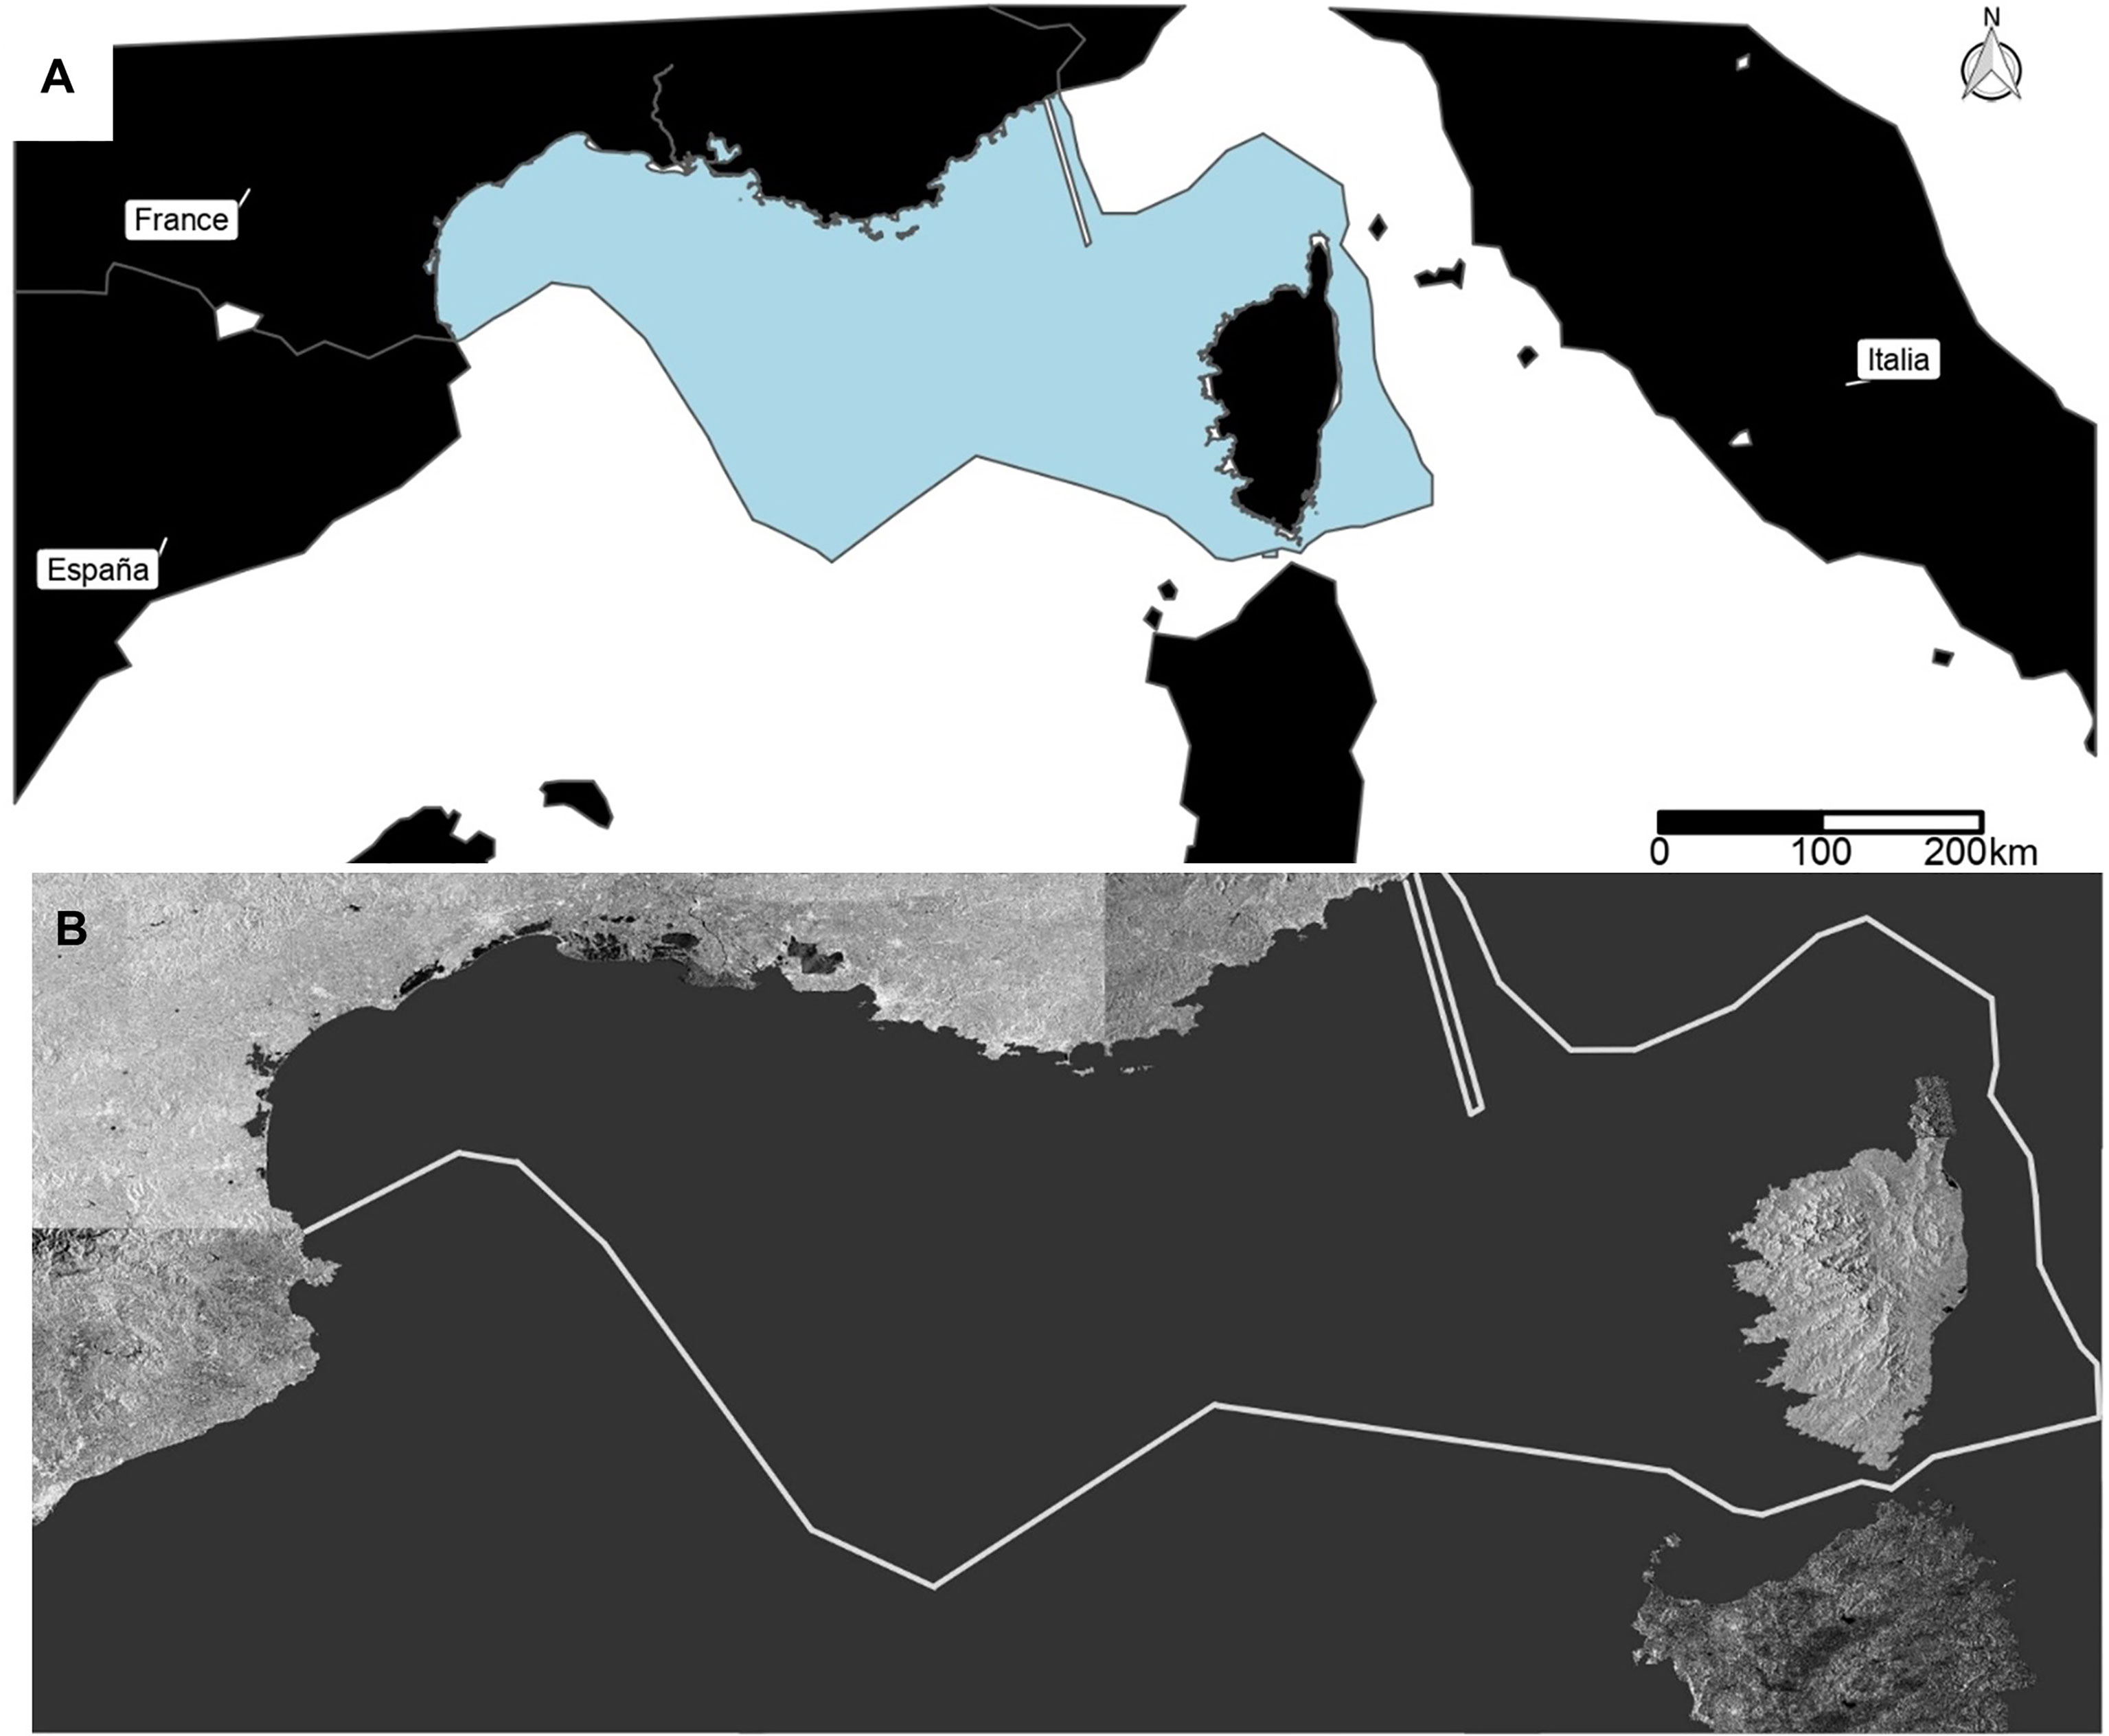
Figure 1 (A) Plot depicting the French Mediterranean Exclusive Economic Zone (EEZ) and study area, represented in blue. (B) Study area built with several SAR images captured between 6th and 18th of March 2020. In white lines, the French Mediterranean EEZ. Shapes are different due to the angle from which the images are taken by the satellites. Copernicus Sentinel data 2020.
We used satellite images collected by the two radar satellites of the European Space Agency Sentinel-1 Copernicus mission (Copernicus, 2021). Sentinel-1A was launched in April 2014 while Sentinel-1B, an identical satellite, was launched in April 2016 onto the same orbital plane. Together they collect images from the earth surface by day or by night, without being affected by cloud coverage. This allowed us to have a complete dataset of synthetic aperture radar (SAR) images from early 2017 until late 2020. Each SAR image covers part of the study area and each given location of the study area was captured by 12 to 24 images each month, resulting in around 60 images per month covering the entire study area. Both satellites orbiting around the earth in a near-polar orbit have a 12-day revisit period in which acquisitions are made either early in the morning or late in the afternoon. In this part of the Mediterranean Sea, images were captures between 7:00 and 8:00 am for morning acquisitions, and between 7:00 and 7:45 pm for afternoon acquisitions. Preliminary to this study we performed several visual verifications of the SAR satellite’s ability to detect a variety of ships. With field work in the coastal towns of Sète, Banyuls and the Island of Corsica, we were able to clearly identify ships of over 15 meters in length of all types of material (smaller than 15 meters for metallic ships).
In order to assess the impact of the Covid-19 pandemic, and particularly the lockdown put in place by the French government between March and May 2020 (Sanchez, 2021), we collected all Sentinel-1A and 1B images each year from March to November starting 02/03/2017 to 28/11/2020. With these dates we were able to compare the lockdown period and the aftermath during the summer of 2020 to the three prior years. A total of 2 183 images weighing approximately 1.7 GB each was downloaded from the Alaska Satellite Facility “SAR Search Vertex” interface (https://asf.alaska.edu/). In addition, the JRC SUMO software (https://github.com/ec-europa/sumo) produced a folder containing all detection information weighing approximately 1 GB, totaling around 6 TB of information. We were able to locally store the data, but the storage aspect rapidly becomes an issue with bigger scale studies.
Ship Detection With Synthetic-Aperture Radar Imagery
The images we used were acquired using the Interferometric Wide swath acquisition mode (IM), and we performed our assessment on Ground Range Detected images in high-resolution (10 meters per pixel) and dual polarization. Being an active sensor system, Sentinel-1 satellites can transmit and receive a signal in either a horizontal (H) or vertical (V) polarization. As different targets on the ground have different polarization signatures with different intensities, reflecting one polarization into another, integrating both polarizations into the target detection process allows for an improved qualification of targets. When using radar satellites and imagery, the signal returns are usually disrupted by noise or clutter due to unwanted objects or bad weather conditions. This can possibly induce false positives that can overestimate boat density (Gandhi and Kassam, 1988). To overcome the problem of clutters and noise we used the Constant False Alarm Rate processing scheme (CFAR) that sets a threshold for each cell based on the information and noise power of the neighboring cells (Anastassopoulos and Lampropoulos, 1995). After setting thresholds, those algorithms can detect objects separating them from the background and has been widely used in the marine environment for ship detection as well as other applications (Leng et al., 2015; Kang et al., 2017; Lanz et al., 2020).
SUMO Algorithm
To perform ship detection on the SAR images, we used the Search for Unidentified Maritime Objects (SUMO) algorithm based on the pixel-based CFAR method (Greidanus et al., 2017a). After applying cross-polarization and co-polarization detection threshold adjustments (Galdelli et al., 2021), SUMO applies a land mask and proposes different buffers to avoid coastal interference. In this study we used a 50-meter buffer integrated into the SUMO software based on OpenStreetMap (2017) to detect coastal activities while avoiding continental interference. The next steps of the object detection apply the CFAR approach by deriving a local detection threshold for all polarization channels. Then, nearby detected pixels are clustered together into a detected object and all detection attributes can be extracted (e.g., geographic location, length, significance). The SUMO algorithm can thus discriminate between real ship detections and false alarms based on the attributes of each object. This algorithm was developed with a user interface to run it and manually check every detection to test the performance of different parameters. The software can also be used in “automatic” mode and analyze a series of images that are specified through a configuration file in which all needed parameters for a SUMO analysis are entered as well (Greidanus et al., 2017b). In this case, we used a parametrization which minimizes false positives but allows for the detection of all ships with a length over 15 meters based on literature and field work (Santamaria et al., 2017). To focus on the coastal activities of fisheries and recreational boats, we removed the shipping lanes provided by the dataset of Halpern et al. (2015) at 1km resolution, by filtering out observations that were in cells where the density of transport ships was equal or higher to 10. This was carried out considering the amount of information lost when filtering out the ships. Under the threshold of 10 transport ships per square km the amount of information lost becomes significant (Supplementary Material Figure 1). We therefore filtered out commercial shipping lanes following the procedure detailed in Santamaria et al. (2017): we removed detections where SUMO assigned a low-level of reliability, assumed to correspond to false positives. Finally, we manually excluded images affected by radio frequency interference (RFI) (Figure 2). These interferences mostly occur due to ground sources, and to a lesser extent to the Radarsat-2 SAR satellite which operates in the same frequency band as Sentinel-1 (Santamaria et al., 2017).
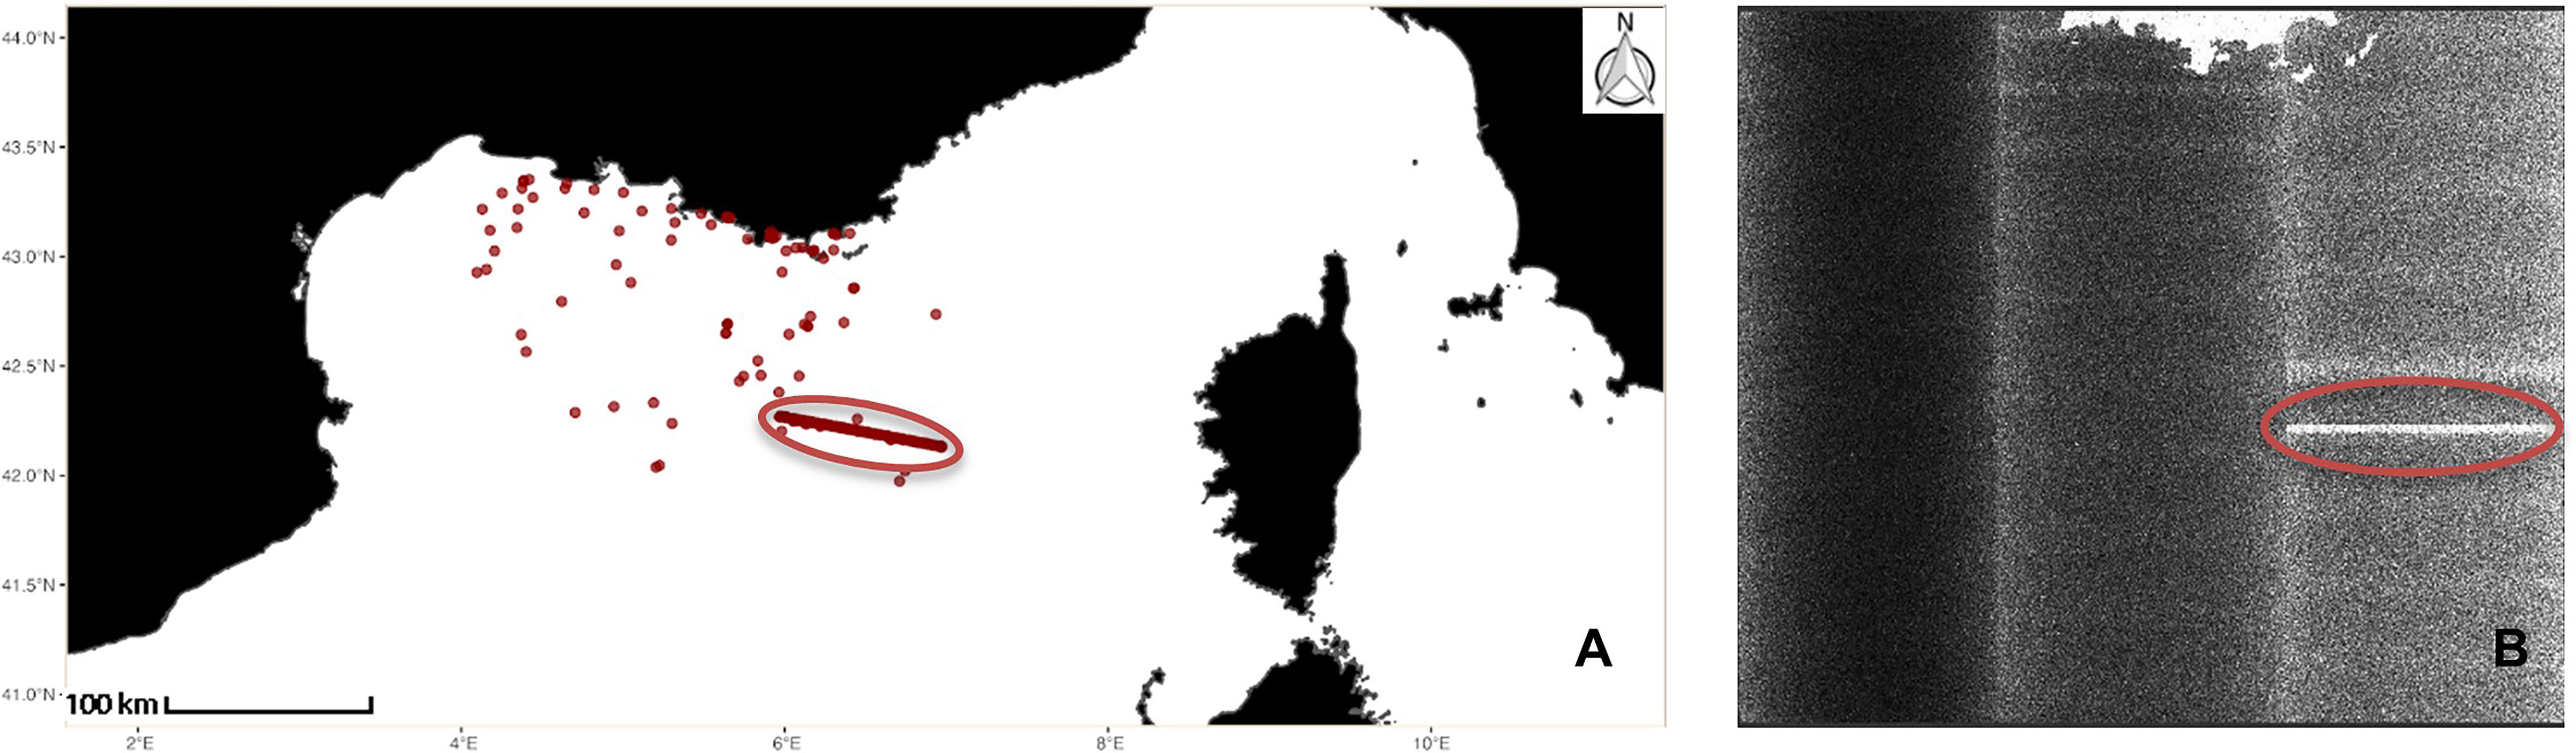
Figure 2 Example of Radio Frequency Interference (RFI) in detections on a SAR image. (A) Detection plot of an image with RFI. (B) The SAR image used for the detection process (12/11/2020). Circled in red is the RFI that translates into a row of false positives in the detection plot. Copernicus Sentinel data 2020.
Data Analysis
We compared the total number of detections yearly from 2017 to 2020, but also extracted monthly and daily marine activity to highlight the effect of the lockdown. We were able to statistically compare mean daily observations between 2020 and different periods during 2017-2019 using the mean comparison t-test implemented with the “t.test()” R function after a log transformation of our data in order to obtain a normal distribution. Since discriminating recreational and fishing activities is impossible directly through SAR imagery, it was assumed that the recreational activities are much lower during the morning hours (i.e., before 8AM) and outside of the summer season. By looking at the difference between seasonal but also morning and evening detections, we assessed the extent to which leisure activities were affected by the Covid-19 restrictions. In order to compare the 2020 activity to a control period, we used the mean yearly and monthly detections of the 2017-2019 considered as a baseline. In addition, ship concentration around coastal and touristic areas is an indicator of ship activity and presence of leisure boats. To compare the differences in ship clusters between 2020 and prior years, we used the “kde2d()” R function from the “MASS” package to calculate spatial kernel density of the detections (from 0 to 1).
In order to limit false positives, we removed 32,231 detections identified by SUMO as being ships with a length under 15 meters. Twenty-seven images were removed when filtering out outliers (for which the number of detections was higher than 95% of observed values per image). We manually removed 34 images submitted to high radio frequency interference (RFI) by examining all high detection images by a human observer.
Results
After excluding detections located in commercial shipping lanes and false positives identified by SUMO, which together resulted in the removal of 75,788 detections, a total of 2,114 images were analyzed, comprising 107,462 potential ship observations. In total, 527, 486, 533 and 568 images were collected respectively from 2017 to 2020, with a yearly mean number of acquisitions of 545 (sd = 29). Monthly number of acquisitions varied from 49 to 73 images, with a mean of 59 images per month (sd = 5) (Figure 3).
The total number of detections increased from 2017 to 2019, with 26,353 ships in 2017, 26,592 in 2018 and 29,216 in 2019 (Figure 3). In 2020, the number of detected ships dropped to 25,004, which represents a 9% decrease compared to the mean of the three previous years. We observed a similar trend for the mean number of monthly detections (see Figure 4), with values increasing from 3,357 detections in 2017 (sd = 1,011, min = 1,408 and max = 4,710), to 3,484 detections in 2018 (sd = 1,219, min = 1,385 and max = 5,038) and 3,894 detections in 2019 (sd = 1,468, min = 1,632 and max = 5,586). As for the yearly number of detections, a drop was observed for the year 2020, with a mean number of monthly observations of 3,431 detections (sd = 1,490, min = 1,789 and max = 5,599). However, monthly detections were highly variable across the studied months. Finally, the mean daily number of observations exhibited the same trend from 271 in 2017 (sd = 146, min = 1 and max = 651), 282 in 2018 (sd = 154, min = 5 and max = 677) to 311 in 2019 (sd = 169, min = 1 and max = 714) then dropping to 277 in 2020 (sd = 171, min = 2 and max = 690).
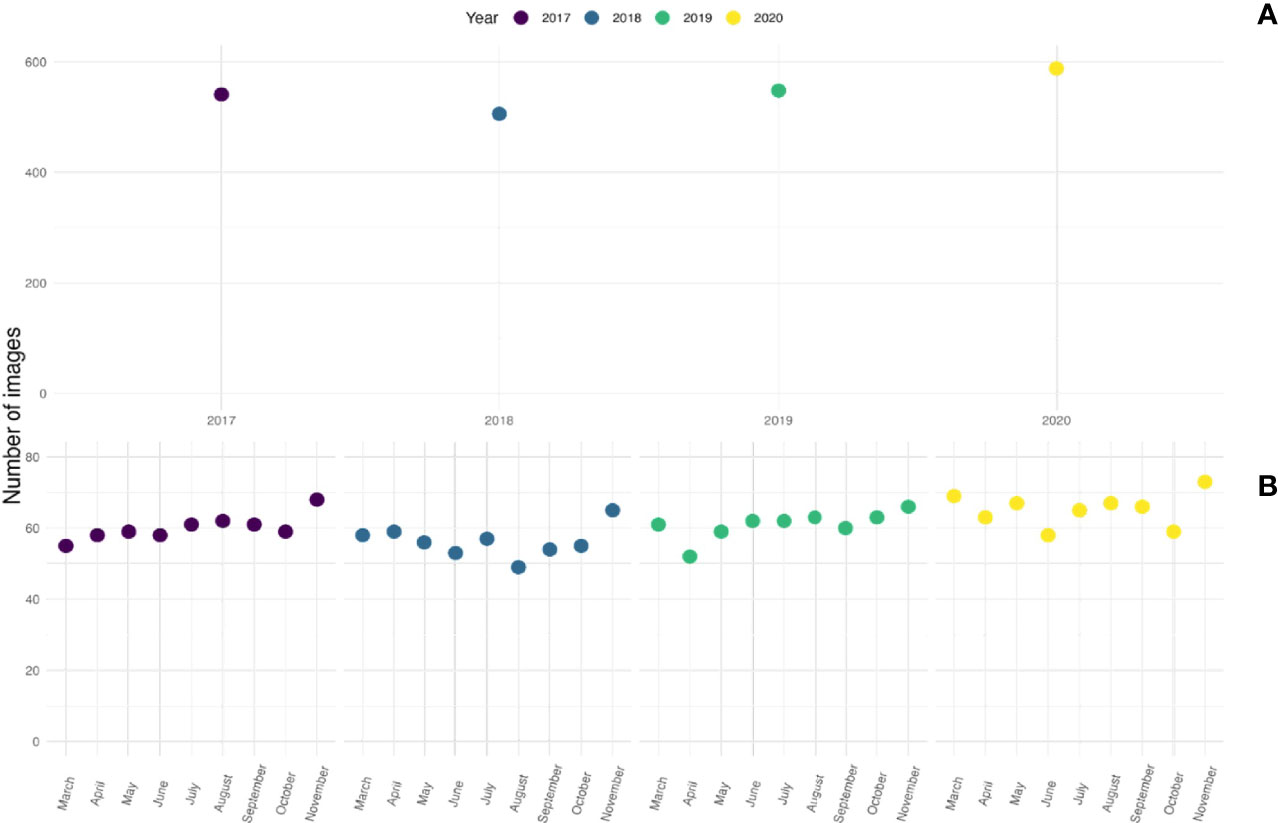
Figure 3 Number of images available from the Sentinel-1 mission database (A) yearly and (B) monthly on the French Mediterranean EEZ.
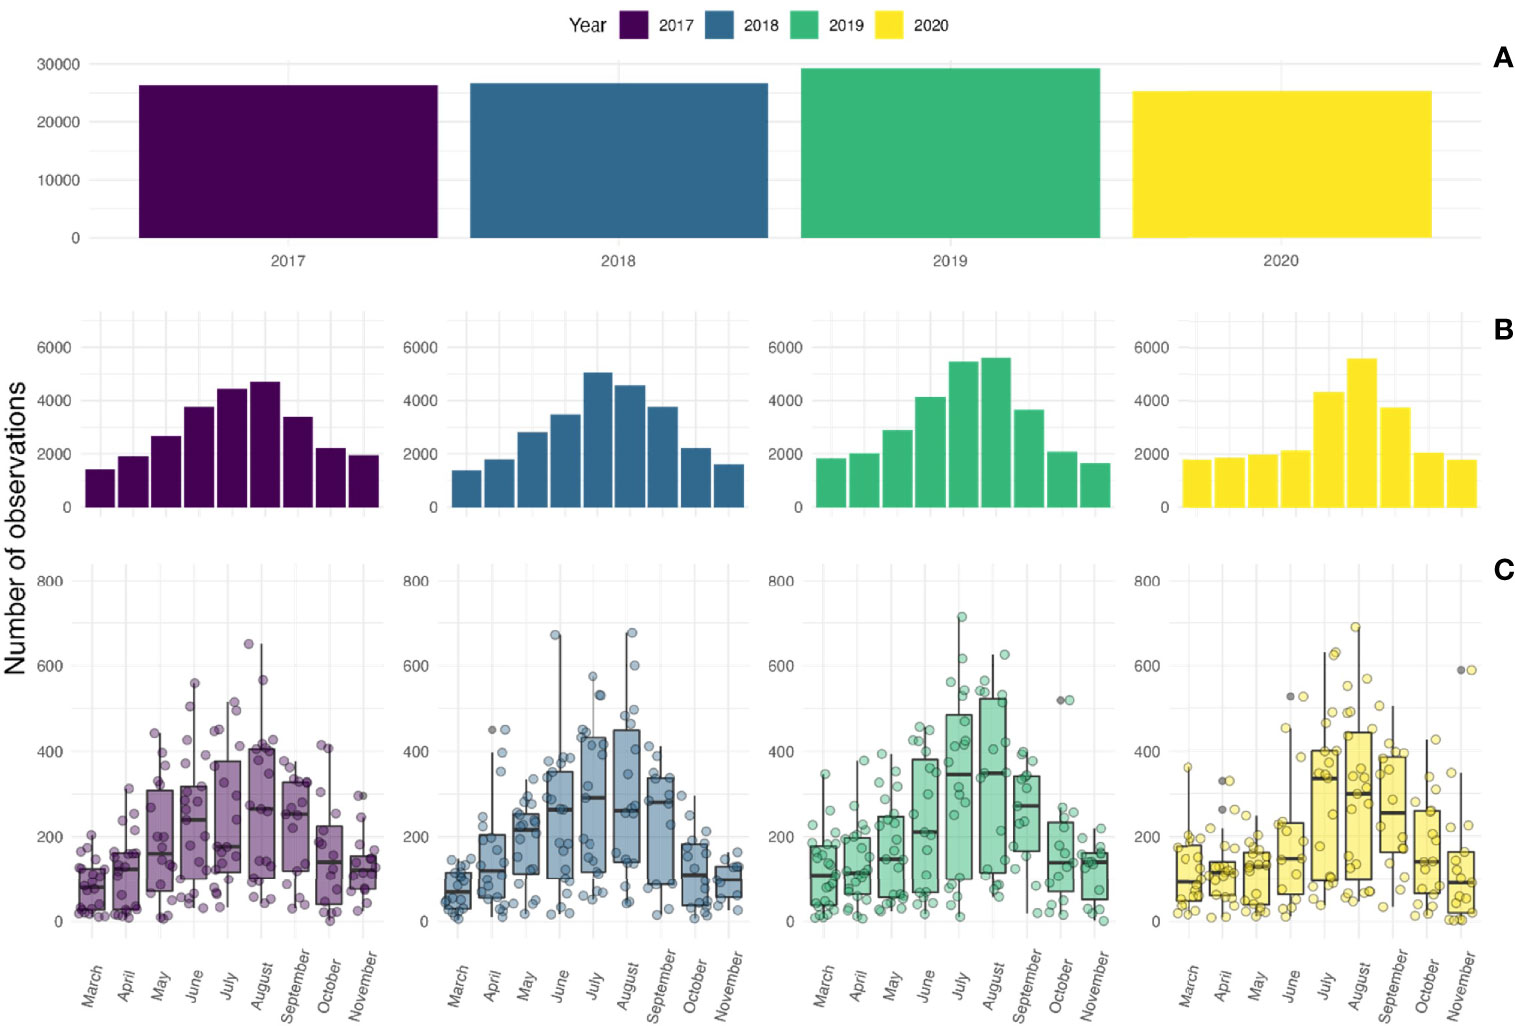
Figure 4 Number of ship detections with the SUMO algorithm (A) yearly, (B) monthly, (C) daily in 2017, 2018, 2019 and 2020 on the French Mediterranean EEZ.
The data highlight three distinct periods in ship detections: the lockdown period, from March to May 2020, the post-lockdown in June 2020, and the return to a normal period for maritime activities during summer, from July and onwards. From March to May, a total number of 5,944, 5,966 and 6,723 ships were detected in 2017, 2018 and 2019 respectively, while only 5,626 were detected from March to May 2020 during the lockdown period, representing a 8% drop compared to the mean of previous years. Likewise, a decrease in the mean number of daily observations was observed due to the lockdown from 195 in 2017 (sd = 110, min = 5 and max = 442), to 242 in 2018 (sd = 166, min = 5 and max = 708) to 201 in 2019 (sd = 99, min = 6 and max = 394) and then 145 in 2020 (sd = 69, min = 9 and max = 362). Mean daily detections were significantly different between 2020 during the lockdown period and the same time of year for the 2017-2019 period (p-value < 0.001).
A similar drop of ship detections took place during the post-lockdown period, in June 2020, compared to previous years. Total ship observations were of 3,737, 3,475 and 4,121 in 2017, 2018 and 2019 respectively. Ship observations were only 2,142 in 2020, representing a drop of 43% in detections compared to the average number of observations over 2017-2019. This was translated in the mean number of daily observations: 316 (sd = 146, min = 29 and max = 559), 294 (sd = 124, min = 16 and max = 672) and 336 (sd = 122, min = 17 and max = 457 and) in 2017, 2018 and 2019 to 213 in 2020 (sd = 135, min = 11 and max = 527). A difference that was again statistically significant between the 2017-2019 period and 2020 (p-value < 0.001).
A different trend was observed for the summer period, from July to September. We observed 12,531, 13,341 and 14,668 ships in 2017, 2018 and 2019, and 13,688 ships in 2020, which corresponds to a drop of only 7% compared to 2019, and to a level very close to that in 2018. Mean daily observations were 321 in 2017 (sd = 147, min = 16 and max = 651), 352 in 2018 (sd = 157, min = 15 and max = 677) and 389 in 2019 (sd = 171, min = 10 and max = 714), then 362 in 2020 (sd = 169, min = 25 and max = 690 and), this latter value being not significantly different from that of 2018 (p-value = 0.26), indicating a recovery of maritime activities during summer 2020 despite the pandemic and lockdown (Figure 5).
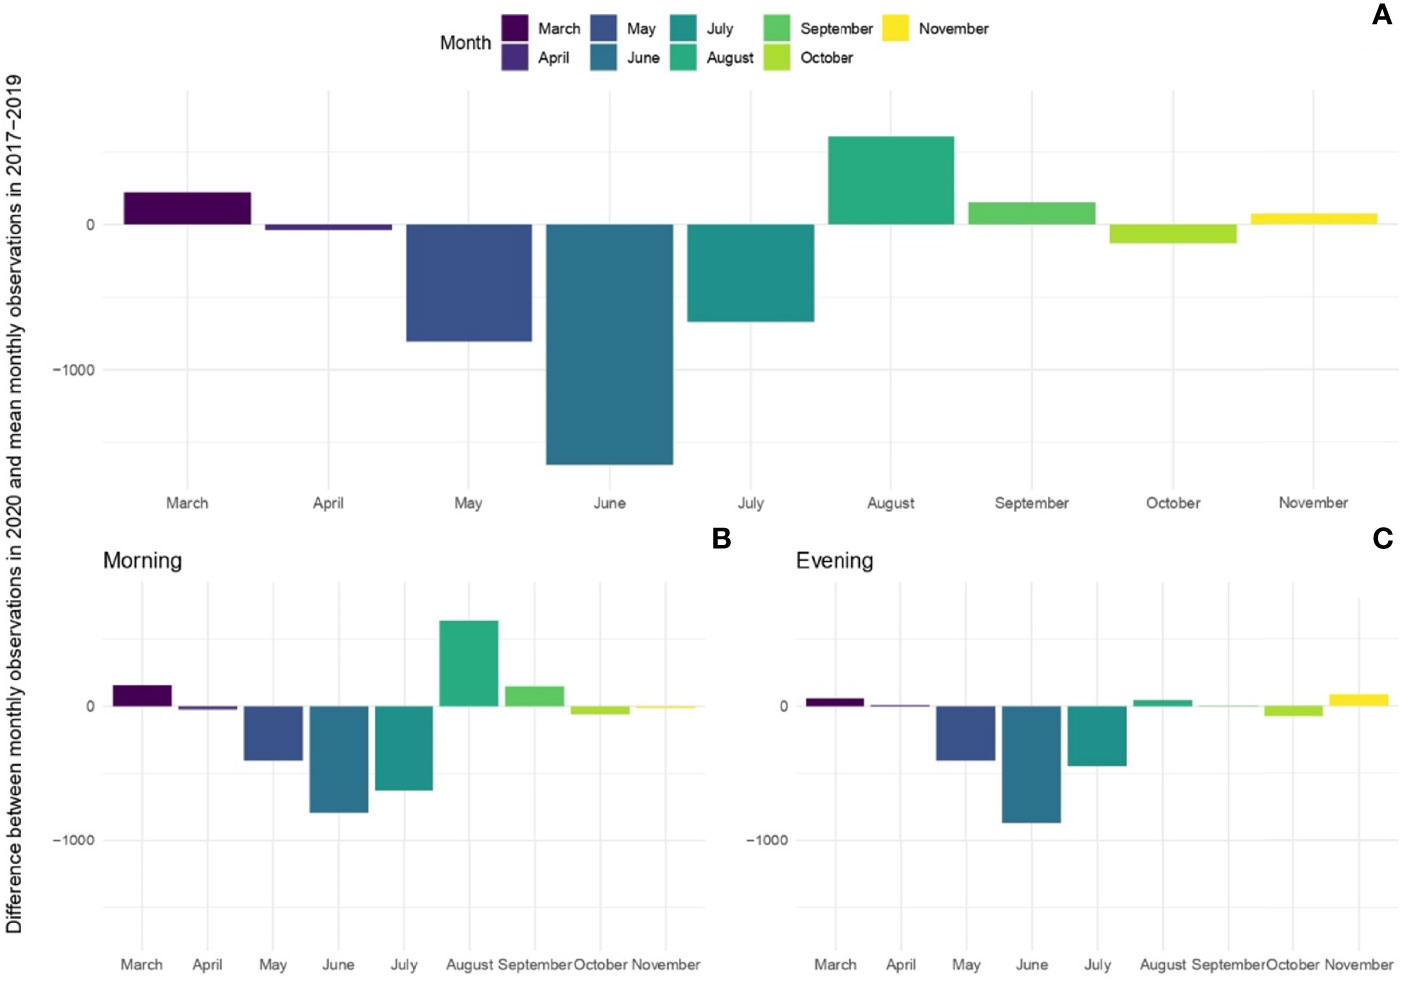
Figure 5 Difference in monthly detections between 2020 and the 2017-2019 period. Negative values represent a decrease in number of detections in all images (A), only for morning images 7:00 am to 8:00 am (B), only for evening images taken from 7:00 pm to 7:45 pm (C).
When discriminating between fishing and leisure activities, the same decline of boat density was observed during the lockdown period from April to June 2020 (Figure 5). However, during the busiest period of the summer season (August), monthly detections were notably lower along the coastline in the evening than in the morning. In August and September, morning detections were 2,558 and 2,996 respectively, whereas evening detections were 2,152 and 1,941 respectively (Figure 5). When looking at the spatial density of ship detections, plotting the difference in kernel densities between 2020 and the 2017-2019 period highlights a significant decrease in ship concentrations in the eastern part of the French Mediterranean coast and the western side of Corsica’s coastline. This phenomenon is particularly visible during the evenings of the post-lockdown summer season, whereas morning concentrations are less contrasted when compared to previous years (Figure 6).
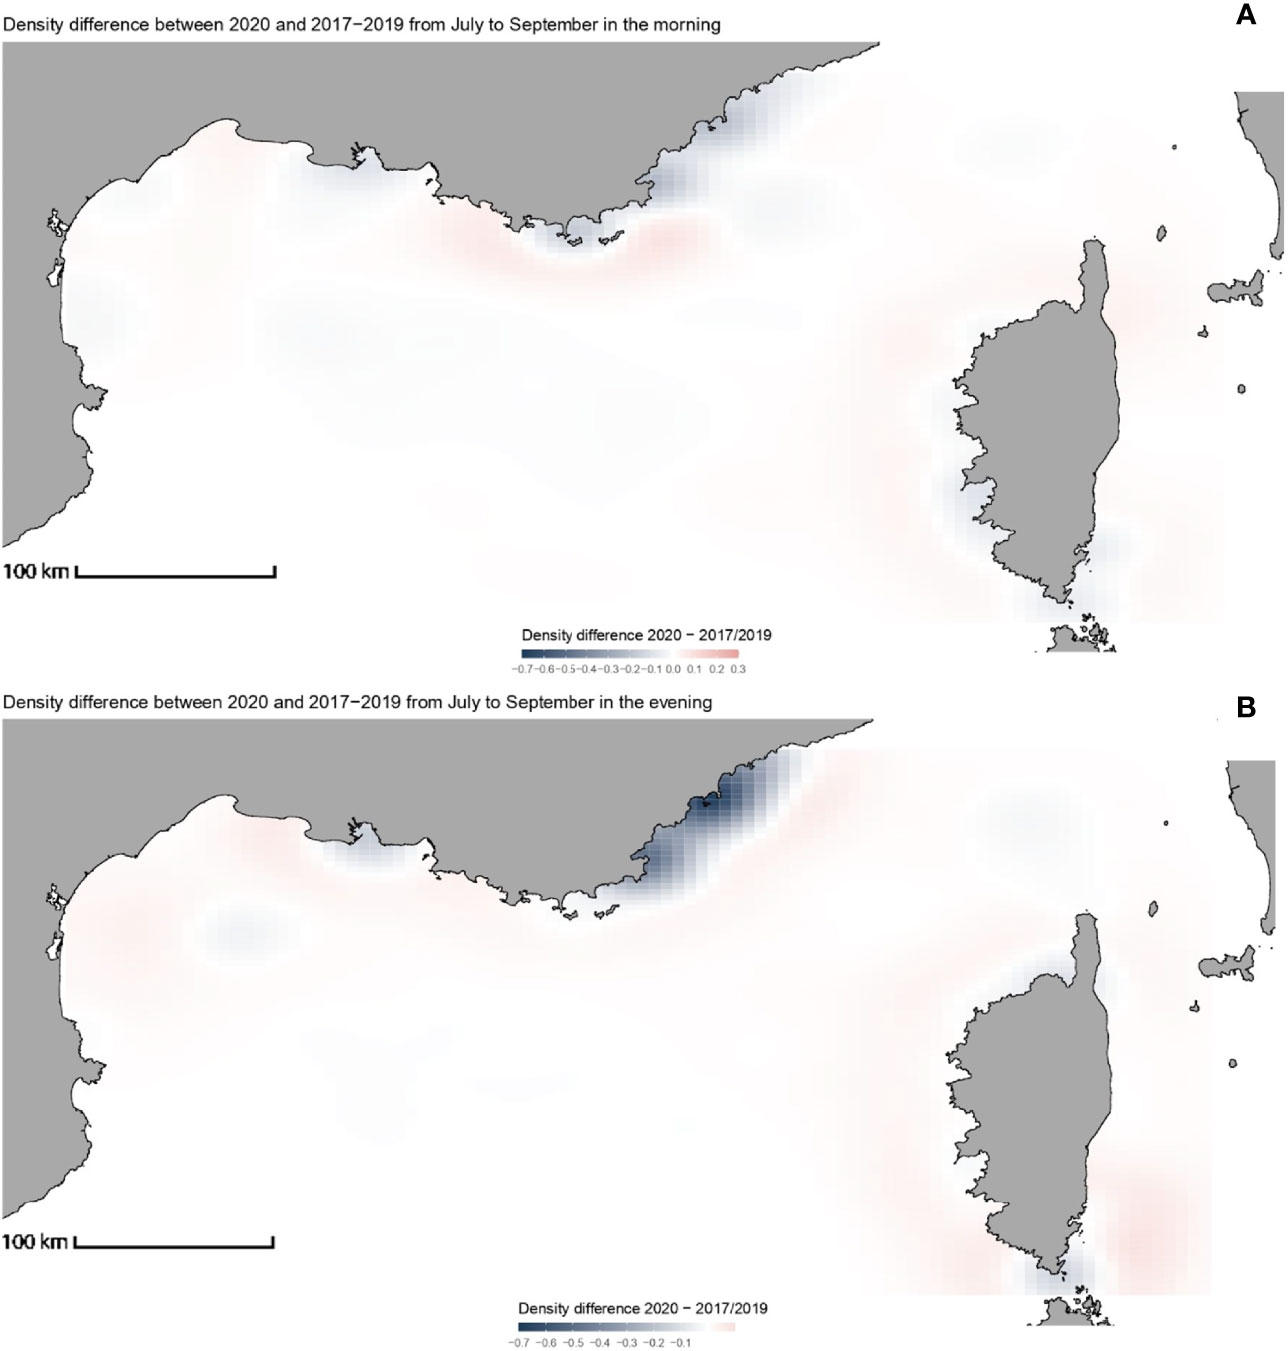
Figure 6 Difference in Ship detection density between 2020 and the 2017-2019 period for the peak summer season for (A) morning 7:00 am to 8:00 am detections and (B) 7:00 pm to 7:45 pm detections.
Discussion
Studies on the Covid 19 pandemic and its impact on marine activity and fisheries have been limited by data availability in order to build reliable comparisons (Pita et al., 2021; Villasante et al., 2021; White et al., 2021). SAR imagery used for ship detection can overcome this limitation by quantifying human activity in the oceans within hours of the event, as well as to compare ship density patterns in a standardized way for time series of archived data. The first key finding of our study is the visible increase in ship detections over the 2017 - 2019 period in French Mediterranean waters, especially during the summer season. This is consistent with the yearly 10% increase in the number of recreational vessels in the Mediterranean sea which represent 90% of the Mediterranean fleets (Cappato, 2011; ICOMIA, 2018). Furthermore, 70% of the world’s superyacht charter contracts are in the Mediterranean (Piante and Ody, 2015). These observations reinforce the context where the Mediterranean Sea has already been assessed as a hotspot in anthropogenic stressors and fishing overcapacity (Micheli et al., 2013; Lucrezi et al., 2017; Ramírez et al., 2018; FAO, 2020a; Duarte et al., 2021).
As expected, ship density patterns during the lockdown period in 2020 contrast sharply with those in the three previous years. With a 9% reduction in annual ship detection, considering recreational boats are far less numerous at sea than commercial fishing boats between March and May, lockdown measures likely had an impact on fisheries activity. Similar results were found by Guyader et al. (2021) from official 2020 reports, with a 10% decrease in French ship activity (days out at sea) compared to 2018-2019. This global phenomenon has been reported from catch records elsewhere in the Mediterranean Sea and around the world (Coll, 2020; FAO, 2020b; Ortega et al., 2020; Coll et al., 2021; Russo et al., 2021). In a study conducted by Spagnol et al. (2021), based on interviews of the owners of 392 Mediterranean fishing ships of different length categories, the number of fishing trips appeared as the most impacted variable by the Covid 19 crisis. Fishing activity abruptly decreased with the lockdown due to the uncertainty on what was authorized or not. Subsequently, closed markets and a change in consumer habits produced a drop in demand which forced the sector to adjust in order to avoid unsold fish and a collapse in prices (Fontana, 2020; Goubert, 2020; Tillet, 2021). This was particularly true for larger ships and trawlers that could not sell the entirety of their landings due to the large tonnage they represent. Therefore, most ship owners decided to stop their activity entirely during the lockdown period, maintaining their enterprise with the help of governmental aid (Spagnol et al., 2021). This is reflected in our data with a marked decrease in boat density during the lockdown period (March-May) including June, even though French lockdown restrictions were lifted by the middle of May (Sanchez, 2021), with a 43% decrease in ship detections compared to the 2017 - 2019 period. Ship detection did not increase until August, when most summer vacations start in France with an important part of the population heading to coastal cities for recreational purposes (Cappato, 2011; Lucrezi et al., 2017; ICOMIA, 2018). Our results on ship detection show an overall small decrease in boat presence during the peak of the summer season in 2020 compared to previous years. Indeed, boat activity dramatically increased in July 2020 to reach levels comparable to pre-Covid years. This suggests that fishing and recreational activities were almost back to normal one month after the end of lockdown measures ended as suggested by Spagnol et al. (2021). Their study showed that the number of fishers who perceived the impact of the Covid-19 crisis on their activity went down from 70% during the lockdown period, to 25% in the following months. We can notice that the Mediterranean is the only French marine region that saw a decrease of the perceived crisis impact during the summer season, while 59% to 65% of fishers are still being affected by the health crisis along the Atlantic coastline. Our study corroborates Spagnol et al. (2021) and Guyader et al. (2021) results with a complementary method which improves our understanding of boat activity at a smaller spatial and temporal scale.
Indeed, the analyses of the morning and the evening detection data revealed large differences between 2020 and the prior years. Morning detections during July, August and September increased in 2020 compared to the mean detections between 2017 and 2019. On the contrary, evening detections were remarkably lower for the same period. In addition, the spatial distribution of morning and evening detections is different during summertime, with evening detections being largely concentrated close to coastal touristic areas (Figure 5). This supports the idea that detections observed around 7:00 am are most likely due to fishing activity that takes place further away from the coastline, and those observed around 7:00 pm mostly represent recreational boats staying close to the land. In addition, evening detections in 2020 were significantly less concentrated around coastal areas than in previous years, especially along the eastern part of the French coastline which is the most touristic area. This noticeable decrease in ship detections reflects an important drop in coastal activities in the aftermath of the Covid-19 lockdown. Interestingly, morning activity at sea, which can be mostly attributed to fisheries, seems to have increased after the lockdown. Consistent with the results of Spagnol et al. (2021), although fisheries had a 3 to 4-month hiatus in activity, as soon as the lockdown measures were lifted, morning Mediterranean fishing trips seem to have resumed at levels comparable or higher to previous years. This observed increase in morning sea trips is counterbalanced by a considerable decrease in evening trips, raising the question of the Covid-19 impact on leisure boat activity in these highly touristic coastal areas.
In the context of research in marine surveillance and in comparison with AIS, the SUMO algorithm has been used as a detection tool and a reference for developing effective alternative methods for SAR imagery object detection (Mazzarella et al., 2015; Santamaria et al., 2017; Grover et al., 2018; Aiello et al., 2019). This method allowed us to obtain an extensive dataset, thanks to the Sentinel-1 project that is fully operational since late 2016. SAR imagery can provide data archives and accessibility while not being affected by cloud cover nor sunlight and not needing voluntary actions on board to detect ship locations. These advantages make SAR a good alternative to other methods. Nevertheless, high wind conditions can cause small waves on the water surface that can result in false positive detections. It is important to take this into account and be careful with unusual numbers of detections in certain images. Another limitation comes from the use of Sentinel-1 SAR images which have a 10m resolution per pixel. With this resolution, our detection method cannot consider ships smaller than 15 meters, which represent a large part of recreational boats and many artisanal fisheries vessels. Consequently, the impact of the pandemic on the smaller fishing ships and recreational boats cannot be robustly quantified using this method. In addition, by the nature of a SAR image, we cannot obtain more information on a ship than its length (activities and equipment are unknown). However, when coupled with AIS and Optical imagery, we could potentially identify boat types and activities opening the door towards a better and more precise understanding of our use of marine resources (Galdelli et al., 2020; Galdelli et al., 2021; Kroodsma, 2022). Integrating different detection methods will eventually allow us to build a more complete picture of our presence and activities in the oceans over an unprecedented spatiotemporal scale and resolution.
Data Availability Statement
The original contributions presented in the study are included in the article/Supplementary Materials. Further inquiries can be directed to the corresponding author. All scripts and data can be accessed through the github repository: https://github.com/RaphSeguin/SAR_fishing_covid.
Author Contributions
IP, RS, TC, RD, YS and DM contributed to the conception and design of the study. IP and RS researched possible satellite detection methods. IP downloaded and organized the image database, ran detection algorithms, and redacted the manuscript. RS performed the statistical analysis, data processing and graphical outputs. PV helped with image processing and methodology research. YS and DM guided and contributed to the results analysis, manuscript read and corrections. TC and RD contributed to manuscript reviews. All authors approved the submitted version.
Funding
This work was partly funded by the IA-Biodiv ANR project FISH-PREDICT (ANR-21-AAFI-0001-01).
Conflict of Interest
The authors declare that the research was conducted in the absence of any commercial or financial relationships that could be construed as a potential conflict of interest.
Publisher’s Note
All claims expressed in this article are solely those of the authors and do not necessarily represent those of their affiliated organizations, or those of the publisher, the editors and the reviewers. Any product that may be evaluated in this article, or claim that may be made by its manufacturer, is not guaranteed or endorsed by the publisher.
Supplementary Material
The Supplementary Material for this article can be found online at: https://www.frontiersin.org/articles/10.3389/fmars.2022.845419/full#supplementary-material
References
Aiello M., Vezzoli R., Gianinetto M. (2019). Object-Based Image Analysis Approach for Vessel Detection on Optical and Radar Images. Appl. Remote Sens. 13, 14502. doi: 10.1117/1.JRS.13.014502
Anastassopoulos V., Lampropoulos G. A. (1995). Optimal CFAR Detection in Weibull Clutter. IEEE Trans. Aerosp. Electron. Syst. 31, 52–64. doi: 10.1109/7.366292
Armelloni E. N., Tassetti A. N., Ferrà C., Galdelli A., Scanu M., Mancini A., et al. (2021). AIS Data, a Mine of Information on Trawling Fleet Mobility in the Mediterranean Sea. Mar. Policy 129, 104571. doi: 10.1016/J.MARPOL.2021.104571
Bates A. E., Primack R. B., Biggar B. S., Bird T. J., Clinton M. E., Command R. J., et al. (2021). Global COVID-19 Lockdown Highlights Humans as Both Threats and Custodians of the Environment. Biol. Conserv. 263, 109175. doi: 10.1016/J.BIOCON.2021.109175
Bates A. E., Primack R. B., Moraga P., Duarte C. M. (2020). COVID-19 Pandemic and Associated Lockdown as a “Global Human Confinement Experiment” to Investigate Biodiversity Conservation. Biol. Conserv. 248, 108665. doi: 10.1016/J.BIOCON.2020.108665
Bennett N. J., Finkbeiner E. M., Ban N. C., Belhabib D., Jupiter S. D., Kittinger J. N., et al. (2020). The COVID-19 Pandemic, Small-Scale Fisheries and Coastal Fishing Communities. Coast. Manag. 48, 336–347. doi: 10.1080/08920753.2020.1766937
Bordo M., Eichengreen B., Klingebiel D., Martinez-Peria M., Soledad Rose A. K. (2001). Is the Crisis Problem Growing More Severe? On JSTOR. Econ. Policy 16, 53–82. doi: 10.1111/1468-0327.00070
Cappato A. (2011). Cruises and Recreational Boating in the Mediterranean. Available at: https://www.academia.edu/41029724/Cruises_and_Recreational_Boating_in_the_Mediterranean.
Carvalho N., Guillen J., Calvo Santos A. (2020). The Impact of COVID-19 in the EU-27 Fishing Fleet (Luxembourg, Luxembourg: Publ. Off. EU). doi: 10.2760/187580
Coll M. (2020). Environmental Effects of the COVID-19 Pandemic From a (Marine) Ecological Perspective. Ethics Sci. Environ. Polit. 20, 41–55. doi: 10.3354/ESEP00192
Coll M., Ortega-Cerdà M., Mascarell-Rocher Y. (2021). Ecological and Economic Effects of COVID-19 in Marine Fisheries From the Northwestern Mediterranean Sea. Biol. Conserv. 255, 108997. doi: 10.1016/J.BIOCON.2021.108997
Copernicus. (2021). Copernicus Sentinel Data 2017 - 2020. Available at: https://search.asf.alaska.edu/#/.
Depellegrin D., Bastianini M., Fadini A., Menegon S. (2020). The Effects of COVID-19 Induced Lockdown Measures on Maritime Settings of a Coastal Region. Sci. Total Environ. 740, 140123. doi: 10.1016/J.SCITOTENV.2020.140123
Duarte C. M., Chapuis L., Collin S. P., Costa D. P., Devassy R. P., Eguiluz V. M., et al. (2021). The Soundscape of the Anthropocene Ocean. Science (80- ) 371, eaba4658. doi: 10.1126/SCIENCE.ABA4658
FAO. (2020b). The State of World Fisheries and Aquaculture 2020. Sustainability in Action. doi: 10.4060/ca9229en
Fernandez Arguedas V., Velotto D., Tings B., Greidanus H., Bentes da Silva C. A. (2016). “Ship Classification in High and Very High Resolution Satellite SAR Imagery,” in Security Research Conference, 11th Future Security, Berlin, September 13-14, 2016, Proceedings (Quay Stuttgart, Germany: Fraunhofer Verlag). Available at: http://www.future-security2016.de/.
Ferrà C., Tassetti A. N., Grati F., Pellini G., Polidori P., Scarcella G., et al. (2018). Mapping Change in Bottom Trawling Activity in the Mediterranean Sea Through AIS Data. Mar. Policy 94, 275–281. doi: 10.1016/J.MARPOL.2017.12.013
Flanders Marine Institute (2019). Maritime Boundaries Geodatabase: Maritime Boundaries and Exclusive Economic Zones (200NM), Version 11 (Oostende, Belgium). doi: 10.14284/386
Fontana J.-B. (2020). Coronavirus: Pas De Marchés Autorisés À Marseille (Fréquence sud). Available at: https://www.frequence-sud.fr/art-68956-coronavirus_pas_de_marches_autorises_a_marseille_marseille?fbclid=IwAR3DsjxZM6sH-cRTmqXzMAjfCToLDY1YgWzKsnE6xcoPPE7Hp4HBSQDiaiw.
Friedman K. S., Wackerman C., Funk F., Pichel W. G., Clemente-Colón P., Li X. (2001). Validation of a CFAR Vessel Detection Algorithm Using Known Vessel Locations. Int. Geosci. Remote Sens. Symp. 4, 1804–1806. doi: 10.1109/IGARSS.2001.977077
Galdelli A., Mancini A., Ferrà C., Tassetti A. N. (2020)Integrating AIS and SAR to Monitor Fisheries: A Pilot Study in the Adriatic Sea. Available at: https://www.imeko.org/publications/tc19-Metrosea-2020/IMEKO-TC19-MetroSea-2020-08.pdf (Accessed December 7, 2021).
Galdelli A., Mancini A., Ferrà C., Tassetti A. N. (2021). A Synergic Integration of AIS Data and SAR Imagery to Monitor Fisheries and Detect Suspicious Activities. Sensors 21, 2756. doi: 10.3390/S21082756
Gandhi P. P., Kassam S. A. (1988). Analysis of CFAR Processors in Nonhomogeneous Background. IEEE Trans. Aerosp. Electron. Syst. 24, 427–445. doi: 10.1109/7.7185
Global Fishing Watch (2020)Global Fisheries During COVID-19. Available at: https://globalfishingwatch.org/data/global-fisheries-during-covid-19/ (Accessed December 7, 2021).
Goubert E. (2020). Coronavirus: La Filière De La Pêche Professionnelle Au Ralenti (La Provence). Available at: https://www.laprovence.com/article/papier/5946193/la-filiere-de-la-peche-professionnelle-au-ralenti.html?fbclid=IwAR1BYMQyC5ux6LQ0EdKsT5s4uKG8qMKfv4-Rbez8Sb7gjeLy7TGYE7ROldg.
Greidanus H., Alvarez M., Santamaria C., Thoorens F. X., Kourti N., Argentieri P. (2017a). The SUMO Ship Detector Algorithm for Satellite Radar Images. Remote Sens. 9, 246. doi: 10.3390/RS9030246
Greidanus H., Argentieri P., Alvarez M., Santamaria C., Kourti N. (2017b). The SUMO Ship Detection Software for Satellite Radar Images (Publ. Off. EU). doi: 10.2760/349278
Grover A., Kumar S., Kumar A. (2018). Ship Detection Using Sentinel-1 SAR Data. Remote Sens. Spat. Inf. Sci. IV-5, 317–324. doi: 10.5194/isprs-annals-IV-5-317-2018
Guyader O., Merzéréaud M., Demaneche S. (2021). La Pêche Française À L’épreuve De La Tempête Covid-19 (Conversat). Available at: https://archimer.ifremer.fr/doc/00692/80448/83585.pdf.
Halpern B. S., Frazier M., Potapenko J., Casey K. S., Koenig K., Longo C., et al. (2015). Spatial and Temporal Changes in Cumulative Human Impacts on the World’s Ocean. Nat. Commun. 61 (6), 1–7. doi: 10.1038/ncomms8615
Hyder K., Maravelias C. D., Kraan M., Radford Z., Prellezo R. (2020). Marine Recreational Fisheries — Current State and Future Opportunities. ICES J. Mar. Sci. 77, 2171–2180. doi: 10.1093/ICESJMS/FSAA147
ICOMIA (2018) Recreational Boating Industry Statistics 2017. Available at: https://www.bvww.org/fileadmin/user_upload/bvww/PDF_Dateien/ICOMIA_Statistics_Yearbook/ICOMIA_Recreational_Boating_Industry_Statistics_2017_ed2_-_UNPROTECTED.pdf.
ILO, FAO, IFAD, WHO. (2020). Impact of COVID-19 on People’s Livelihoods, Their Health and Our Food Systems. Available at: https://www.who.int/news/item/13-10-2020-impact-of-covid-19-on-people’s-livelihoods-their-health-and-our-food-systems (Accessed December 7, 2021).
James M., Mendo T., Jones E. L., Orr K., McKnight A., Thompson J. (2018). AIS Data to Inform Small Scale Fisheries Management and Marine Spatial Planning. Mar. Policy 91, 113–121. doi: 10.1016/J.MARPOL.2018.02.012
Kang M., Leng X., Lin Z., Ji K. (2017). “A Modified Faster R-CNN Based on CFAR Algorithm for SAR Ship Detection,” in RSIP 2017 - Int. Work. Remote Sens. with Intell. Process. Proc. (Institute of Electrical and Electronics Engineers Inc.). doi: 10.1109/RSIP.2017.7958815
Knight C. J., Burnham T. L. U., Mansfield E. J., Crowder L. B., Micheli F. (2020). COVID-19 Reveals Vulnerability of Small-Scale Fisheries to Global Market Systems. Lancet Planet. Heal. 4, e219. doi: 10.1016/S2542-5196(20)30128-5
Kroodsma D. (2022) A Radar-Illuminated Ocean Reveals Dark Fleets (Glob. Fish. Watch). Available at: https://globalfishingwatch.org/data/radar-illuminated-ocean/ (Accessed February 14, 2022).
Kroodsma D. A., Mayorga J., Hochberg T., Miller N. A., Boerder K., Ferretti F., et al. (2018). Tracking the Global Footprint of Fisheries. Science (80- ) 359, 904–908. doi: 10.1126/SCIENCE.AAO5646
Lanz P., Marino A., Brinkhoff T., Köster F., Möller M. (2020). The InflateSAR Campaign: Evaluating SAR Identification Capabilities of Distressed Refugee Boats. Remote Sens. 12, 3516. doi: 10.3390/RS12213516
Lanz P., Marino A., Brinkhoff T., Köster F., Möller M. (2021). The InflateSAR Campaign: Testing SAR Vessel Detection Systems for Refugee Rubber Inflatables. Remote Sens. 13, 1487. doi: 10.3390/RS13081487
Leng X., Ji K., Yang K., Zou H. (2015). A Bilateral CFAR Algorithm for Ship Detection in SAR Images. IEEE Geosci. Remote Sens. Lett. 12, 1536–1540. doi: 10.1109/LGRS.2015.2412174
Lewin W. C., Weltersbach M. S., Ferter K., Hyder K., Mugerza E., Prellezo R., et al. (2019). Potential Environmental Impacts of Recreational Fishing on Marine Fish Stocks and Ecosystems. Rev. Fish. Sci. Aquac. 27, 287–330. doi: 10.1080/23308249.2019.1586829
Lloret J., Biton-Porsmoguer S., Carreño A., Di Franco A., Sahyoun R., Melià P., et al. (2020). Recreational and Small-Scale Fisheries May Pose a Threat to Vulnerable Species in Coastal and Offshore Waters of the Western Mediterranean. ICES J. Mar. Sci. 77, 2255–2264. doi: 10.1093/ICESJMS/FSZ071
Lucrezi S., Milanese M., Markantonatou V., Cerrano C., Sarà A., Palma M., et al. (2017). Scuba Diving Tourism Systems and Sustainability: Perceptions by the Scuba Diving Industry in Two Marine Protected Areas. Tour. Manage. 59, 385–403. doi: 10.1016/J.TOURMAN.2016.09.004
March D., Metcalfe K., Tintoré J., Godley B. J. (2021). Tracking the Global Reduction of Marine Traffic During the COVID-19 Pandemic. Nat. Commun. 12 (1), 1–12. doi: 10.1038/s41467-021-22423-6
Mazzarella F., Vespe M., Santamaria C. (2015). SAR Ship Detection and Self-Reporting Data Fusion Based on Traffic Knowledge. IEEE Geosci. Remote Sens. Lett. 12, 1685–1689. doi: 10.1109/LGRS.2015.2419371
Micheli F., Halpern B. S., Walbridge S., Ciriaco S., Ferretti F., Fraschetti S., et al. (2013). Cumulative Human Impacts on Mediterranean and Black Sea Marine Ecosystems: Assessing Current Pressures and Opportunities. PloS One 8, e79889. doi: 10.1371/JOURNAL.PONE.0079889
Mongabay. (2020) As COVID-19 Batters Fishery, Indonesia’s Sharks Get a Respite. Available at: https://news.mongabay.com/2020/05/as-covid-19-response-batters-sales-indonesias-shark-fishery-gets-a-respite/ (Accessed December 7, 2021).
OECD. (2020) The Territorial Impact of COVID-19: Managing the Crisis Across Levels of Government - OECD. Available at: https://read.oecd-ilibrary.org/view/?ref=128_128287-5agkkojaaa&title=The-territorial-impact-of-covid-19-managing-the-crisis-across-levels-of-government (Accessed December 7, 2021).
Ortega M., Mascarell Y., Coll M. (2020) Monitoring of the COVID Crisis in the Spanish Mediterranean Fisheries. Available at: https://ent.cat/wp-content/uploads/2020/12/2020_Seguimiento-crisis-COVID-y-sector-pesquero_EN.pdf (Accessed December 7, 2021).
Otero I., Farrell K. N., Pueyo S., Kallis G., Kehoe L., Haberl H., et al. (2020). Biodiversity Policy Beyond Economic Growth. Conserv. Lett. 13, e12713. doi: 10.1111/CONL.12713
Pelich R., Longepe N., Mercier G., Hajduch G., Garello R. (2015). “Performance Evaluation of Sentinel-1 Data in SAR Ship Detection,” in Int. Geosci. Remote Sens. Symp., 2015-November (Institute of Electrical and Electronics Engineers Inc.). 2103–2106. doi: 10.1109/IGARSS.2015.7326217
Piante C., Ody D. (2015). Blue Growth in the Mediterranean Sea: The Challenge of Good Environmental Status (Med Trends Project). Available at: https://d2ouvy59p0dg6k.cloudfront.net/downloads/medtrends_regional_report.pdf.
Pita P., Ainsworth G. B., Alba B., Anderson A. B., Antelo M., Alós J., et al. (2021). First Assessment of the Impacts of the COVID-19 Pandemic on Global Marine Recreational Fisheries. Front. Mar. Sci. 8. doi: 10.3389/fmars.2021.735741
Ramírez F., Coll M., Navarro J., Bustamante J., Green A. J. (2018). Spatial Congruence Between Multiple Stressors in the Mediterranean Sea May Reduce Its Resilience to Climate Impacts. Sci. Rep. 8 (1), 1–8. doi: 10.1038/s41598-018-33237-w
Russo E., Anelli Monti M., Toninato G., Silvestri C., Raffaetà A., Pranovi F. (2021). Lockdown: How the COVID-19 Pandemic Affected the Fishing Activities in the Adriatic Sea (Central Mediterranean Sea). Front. Mar. Sci. 8. doi: 10.3389/FMARS.2021.685808/BIBTEX
Sanchez L. (2021). Combien De Jours De Restrictions Avons-Nous Vécu En France Depuis Un an? (Le Monde). Available at: https://www.lemonde.fr/les-decodeurs/article/2021/03/12/couvre-feu-confinement-commerces-ou-bars-fermes-combien-de-jours-de-restrictions-depuis-un-an_6072845_4355770.html#commune=35238 (Accessed December 8, 2021).
Santamaria C., Alvarez M., Greidanus H., Syrris V., Soille P., Argentieri P. (2017). Mass Processing of Sentinel-1 Images for Maritime Surveillance. Remote Sens. 9, 678. doi: 10.3390/rs9070678
Sohrabi C., Alsafi Z., O’Neill N., Khan M., Kerwan A., Al-Jabir A., et al. (2020). World Health Organization Declares Global Emergency: A Review of the 2019 Novel Coronavirus (COVID-19). Int. J. Surg. 76, 71–76. doi: 10.1016/J.IJSU.2020.02.034
Spagnol C., Guyader O., Le Grand C., Demaneche S., Le Roy E., Leblond E. (2021). Enquête Sur Les Conséquences À Court Terme De La Pandémie De Covid-19 Sur La Pêche Maritime Française. Premier Confinement Et Période Post-Confinement. France Métropolitaine. Arch. - Ifremer’s Institutional Repos (Ifremer). doi: 10.13155/84224
Stasolla M., Mallorqui J. J., Margarit G., Santamaria C., Walker N. (2016). A Comparative Study of Operational Vessel Detectors for Maritime Surveillance Using Satellite-Borne Synthetic Aperture Radar. IEEE J. Sel. Top. Appl. Earth Obs. Remote Sens. 9, 2687–2701. doi: 10.1109/JSTARS.2016.2551730
Tillet W. (2021). Interview With William Tillet, 1st Prud’homme De Pêche of Martigues, on the Impact of the Covid Crisis on Their Fisheries (Maritima). Available at: https://www.maritima.info/actualites/economie/martigues/12560/william-tillet-je-suis-assez-pessimiste-pour-l-avenir-.html?fbclid=IwAR2fWIeZhvReWw2yBAWj1isj4whJeRbTXItTwVKNaL1cKejFY5VCOlvFUDo.
Villasante S., Tubío A., Ainsworth G., Pita P., Antelo M., María Da-Rocha J. (2021). Rapid Assessment of the COVID-19 Impacts on the Galician (NW Spain) Seafood Sector. Front. Mar. Sci. 8, 1410. doi: 10.3389/FMARS.2021.737395
Keywords: Covid-19, lockdown, fisheries, synthetic aperture radar, ship detection, French Mediterranean
Citation: Pita I, Seguin R, Shin Y-J, Viguier P, Catry T, Devillers R and Mouillot D (2022) SAR Satellite Imagery Reveals the Impact of the Covid-19 Crisis on Ship Frequentation in the French Mediterranean Waters. Front. Mar. Sci. 9:845419. doi: 10.3389/fmars.2022.845419
Received: 29 December 2021; Accepted: 08 April 2022;
Published: 09 May 2022.
Edited by:
Sebastian Villasante, University of Santiago de Compostela, SpainReviewed by:
Dimitris Poursanidis, Terrasolutions Marine Environment Research, GreeceAlessandro Galdelli, Marche Polytechnic University, Italy
Copyright © 2022 Pita, Seguin, Shin, Viguier, Catry, Devillers and Mouillot. This is an open-access article distributed under the terms of the Creative Commons Attribution License (CC BY). The use, distribution or reproduction in other forums is permitted, provided the original author(s) and the copyright owner(s) are credited and that the original publication in this journal is cited, in accordance with accepted academic practice. No use, distribution or reproduction is permitted which does not comply with these terms.
*Correspondence: Ignacio Pita, aWduYWNpby5waXRhLXZhY2FAdW1vbnRwZWxsaWVyLmZy