 Hava Wandel1,2
 Roi Holzman1,2*
- 1School of Zoology, Faculty of Life Sciences, Tel Aviv University, Tel Aviv, Israel
- 2 The Inter-University Institute for Marine Sciences, Eilat, Israel
Tintinnids are a group of ciliated microzooplankton, who spontaneously settle on marine snow and other aggregates. Tintinnids create a feeding current that draws particles towards their mouth using a crown of continuously beating oral cilia. Similarly to other ciliated microzooplankton, not all encountered particles are ingested. However, it is unclear what is the mechanistic and behavioral basis of this selectivity. Here, we used particle tracking velocimetry to quantify the feeding flow, prey fate, and cilia beat frequency. We then asked (1) what determines the encounter rate with prey, (2) at which stages of the feeding sequence does selectivity develop, and (3) which predator’s behaviors modify selectivity. We found that the speed of the tintinnids’ feeding currents is modulated by their cilia beat frequency. Individual tintinnids were observed to modify their cilia beat frequency during foraging, resulting in ~3-fold acceleration or deceleration of the flow speed within seconds. Selectivity changed throughout the feeding sequence as tintinnids preferentially captured larger prey but subsequently preferentially ingested spherical over prolate prey. Short bouts of flow reversal mitigated the preference for larger prey during both encounter and handling. Overall, we show that individual tintinnids were able to modulate cilia kinematics, which affected encounter rates, encounter outcome, and handling outcome. The tintinnids’ ability to modulate their cilia kinematics is a major component of their feeding behavior.
Introduction
Tintinnids are a group of heterotrophic microzooplankton, which are known to play important ecological roles in controlling phytoplankton blooms (Watras et al., 1985; Admiraal & Venekamp, 1986; Nakamura et al., 1996), serving as a link between microbial food webs and larger predators (e.g. copepods and fish larvae) (Conover, 1982; Calbet & Saiz, 2005), and recycling nutrients (Johannes, 1965; Pierce & Turner, 1992; Calbet & Saiz, 2005). Tintinnids are characterized by a crown of oral cilia that beat in a metachronal wave to generate swimming and feeding currents (Dolan et al., 2013; Kiorboe et al., 2014; Ryu et al., 2017). This arrangement has independently evolved at least three times in ciliated protists, and is characteristic of sessile and motile free-living micro-grazer ciliates from marine and freshwater habitats (Dolan et al., 2013; Kiorboe et al., 2014; Ryu et al., 2017). Although tintinnids are generally classified as microzooplankton, they spontaneously attach themselves to various surfaces including particular aggregates (“marine snow”; Jonsson et al., 2004).
Tintinnids are classified based on two meristic criteria which are critical to their hydrodynamics. All tintinnids reside in a lorica, an outer “shell” which varies in shape and structure between species (Figures 1A, B; Blackbourn, 1974; Stoecker et al., 1995; Dolan et al., 2013). Because the lorica is denser and larger than the cell, it functions as a “sea anchor”, potentially allowing tintinnids to generate faster flows and modulate their location in the water column (Dolan et al., 2013). Furthermore, the oral cilia are arranged as “polykinetids” (trichia), i.e. compound cilia bundles. The cilia are used to generate a flow of water past the cell, but also directly interact with the prey to filter it from the passing water. It is understood that particles are captured in the inner part of the cilia and transported into the oral area where they are ingested (Blackbourn, 1974; Dolan et al., 2013).
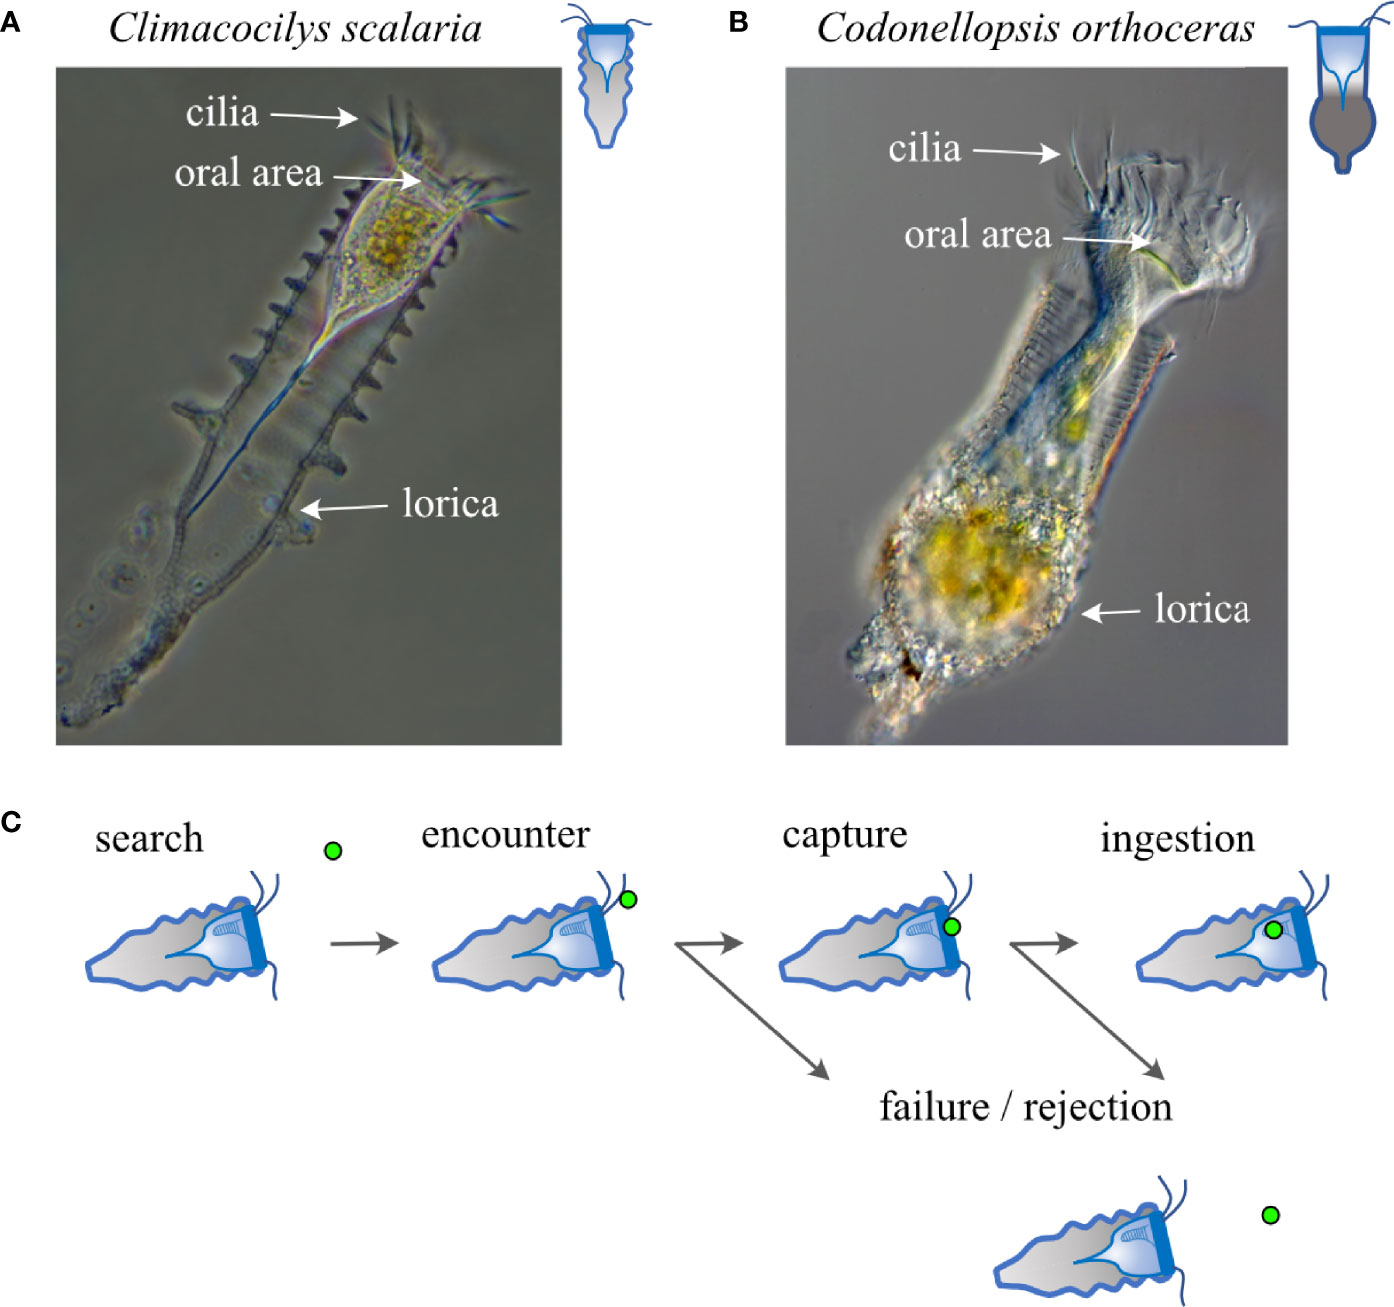
Figure 1 Study species and the major stages of prey capture. (A, B) Images of Climacocilys scalaria (A) and Codonellopsis orthoceras (B), illustrating the morphology of their lorica and cell body. The lorica diameter of Climacocilys scalaria is 46-63µm, and that of Codonellopsis Orthoceras is 54-62µm. Illustrations to the right of the image are used throughout the figures to depict species. Images are from https://planktonnet.awi.de/ and are used under Creative Commons attribution 3 (C) Prey capture is composed of sequential phases that include search, encounter, capture, handling, ingestion, and digestion (Montagnes et al., 2008). “Search” is defined as the phase in which the tintinnid is actively moving itself or the water around it to facilitate prey encounters. “Encounter” is defined as the initial contact between the tintinnid and its prey. “Capture” is defined as the successful transfer of the prey item into the oral area. “Handling” is the process of moving the prey into the oral groove where “ingestion” and later digestion occur. Unsuccessful outcomes can occur following encounter (hereafter “failure”) and capture (hereafter “rejection”). Note that selectivity can develop due to the predator adjusting its behavior during any of the above stages.
Clearance rate experiments, in which the change in the concentration of food is documented over time, reveal that ciliates are strongly selective to prey size (Fenchel, 1980b; Fenchel, 1980a; Jonsson, 1986). In general, these experiments show a parabolic (hump-shape) response to prey size, indicating an increase in capture rate up to an optimum, above which capture rates decline. The density of the cilia is considered the limiting factor for the size of the smallest prey, as it corresponds to the size of the gap between the cilia across species (Fenchel, 1980b; Fenchel, 1980a). In tintinnids, the minimal prey size is ~1-3 µm and the maximal size is ~20 µm, depending on the species (Rassoulzadegan & Etienne, 1981; Hansen et al., 1994; Dolan et al., 2013). For example, individuals of the species Favella ehrenbergii catch larger particles (10-15µm diameter) more often than small particles (1-4µm diameter). Across species, lorica diameter (a surrogate to oral diameter) seem to explain much of the variation in prey diameter. Dolan et al., 2012 found that the preferred prey diameter corresponds to 20% of the lorica diameter and the maximal is 30%. Similarly, Hansen et al. (1994) reported that the ratio of prey to predator size in tintinnids ranges 1:2.5 to 1:30. While the ratio between oral diameter and prey diameter seem to be the dominant trait that determines selectivity, individuals of Favella ehrenbergii preferred dinoflagellates of any size over other groups of algae (Stoecker et al., 1981; Stoecker et al., 1995).
In general, prey capture is composed of sequential phases that include search, encounter, capture, handling, ingestion, and digestion (Figure 1C; Montagnes et al., 2008). Correspondingly, selectivity can develop due to the predator adjusting its behavior during any of the stages of the feeding sequence: from changing its swimming patterns to remain within a patch of preferred food (Buskey & Stoecker, 1988), to rejecting unfavorable prey upon encounter (Blackbourn, 1974). Different mechanisms can thus operate during the different stages to affect selectivity: (a) the hydrodynamics of the feeding and swimming flows, which influence the search, encounter, and catch of the prey, (b) the kinematics of the beating cilia, which affect the search, encounter, catch and handling of prey, and (c) the prey properties that affect the interaction of the cilia with the prey at each of these steps. Stoecker (Stoecker et al., 1981; Stoecker et al., 1995) showed that tintinnids engaged a cilia beat pattern that resulted in bouts of flow reversal when they encountered larger prey, and that capture success changed depending on whether prey interacted with the tintinnid’s oral area or with the cilia. While these behaviors induced differential capture success (i.e. differential capture of encountered prey), it is unclear how selective encounter, capture, handling and ingestion integrate to determine the overall prey preference and eventually clearance rate.
The goal of this study was to understand how cilia kinematics affect encounter rate and selectivity in tintinnids. Specifically, we ask (1) what determines the encounter rate with prey, (2) at which stages of the feeding sequence does selectivity develop, and (3) which predator’s behaviors modify selectivity. We used high-speed videography to parameterize a computetional model of the flow generated by the tintinnid, and to characterize the interactions with particles throught the feeding sequence from encounter to injection. We generated a large dataset (N= 231 videos from 150 individuals, belonging to two tintinnid species) of high-resolution observations, documenting the fate of ~900 particles (polystyrene beads and four species of live algae) under conditions of different cilia beat frequencies and feeding flows. This approach allowed us to investigate the joint effect of hydrodynamics, kinematics, and the prey properties on encounter and handling outcomes in tintinnid ciliates.
Methods
Study Organisms
Climacocilys scalaria and Codonellopsis orthoceras are both abundant in the Gulf of Aqaba at depths of up to 50 m (Kimor & Golandsky-baras, 1981). Climacocilys scalaria is characterized by a hyaline, spiral lorica with a characteristic diameter of 46-63µm. Codonellopsis orthoceras is characterized by a tubular lorica with an opaque ovoid bottom, covered with organic particles, and a typical lorica diameter of 54-62µm (Figures 1A, B).
Tintinnids were isolated from fresh plankton samples, collected at the beginning of each experimental day. Sample collection was made at the Inter-University Institute for Marine Sciences (IUI; 29˚30’N, 34˚56’E) in Eilat, Israel, during the period of July 2019 to February 2020 and June to September 2020. Plankton was sampled using a manual vertical haul of a plankton net (1.5m long; mouth diameter 50 cm; 64µm mesh net) with cod-end, from the far end of the pier of the IUI, about 35m from the shore. The net was repeatedly (3-4 times) lowered to ~3m depth, allowed to spread with the current for several minutes and then retrieved, filtering a total of ~7-9 m3. In accordance with previous observations (Kimor & Golandsky-baras, 1981) Climacocilys scalaria was abundant in the summer months (July-September), whereas Codonellopsis orthoceras was abundant throughout the study period, except for August-October.
In the laboratory, sub-samples were transferred to a Bogrov counting chamber, from which tintinnids were isolated under a stereo microscope (Nikon SMZ1500) using a 20µl pipette. Isolated tintinnids were individually transferred to a 12 well-plate. Wells were filled in advance with 240µl fresh seawater, filtered through a Millex GV 0.22 µm membrane. After the experiments, tintinnids were classified to species level using morphological characteristics described by Abou Zaid & Hellal (2012) and Marshall (1969a; 1969b).
Filming
We acquired high-speed videos that were used for two aims: (1) to quantify the flow fields tintinnids create and (2) to assess the factors that govern their feeding success. Accordingly, we filmed tintinnids in two setups, each designed for one of the above purposes. All videos were recorded using a highspeed Phantom VEO-340S camera mounted on an inverted Nikon TMS-F microscope. Videos for flow analysis were taken at a frame rate of 500 fps at a resolution of 3.5 megapixels (2560×1600 pixels) under a X10 or X20 magnification. Videos were split into fragments in which constant flow towards the oral area and little body movement were observed. Average fragment length was 2000 frames, but fragments ranged from 400 to 12,200 sequential frames (depending on tintinnid behavior; see below). The flow fields were quantified for a total of 137 fragments (61 videos, 1-4 fragments per video; Table 1). To visualize flow, we used either 3 µm Polysciences Fluoresbrite carboxylate microspheres (beads; 53 videos) or 3 µm Nannochloropsis oceanica cells (8 videos; 4 for each species) that were added to the wells to a final concentration of 106 particles/ml.
Table 1 Number of videos used for the different analyses in this study.
Videos for feeding analysis were filmed at 1400 fps, a resolution of 1.6 megapixels (1280×1280 pixels), and higher magnification (X20, X40). For each visualization, one of four types of algae was added to the well to a final concentration of ~105-106 cells/ml. In this section we only used tintinnids of the species Climacocilys scalaria, because individuals of Codonellopsis orthoceras tended to settle with a slight upward pitch such that the cilia and the oral groove were not in the same focal plane. This, in addition to the opaque lorica of C. orthoceras made it difficult to track the fate of particles after the initial contact with the cilia. Some videos proved suitable for both aims, so no dichotomous separation of data sets was made. For example, a few videos in intermediate frame rates (600-1000 fps) were also used for both aims (SEM Table 1). Feeding success videos were not divided into fragments.
Tintinnids can spontaneously settle on solid surfaces and feed while attached, similarly to other “crowned” ciliates (P. R. Jonsson et al., 2004); and this was the case in our study. Settled tintinnids that were positioned parallel to the bottom of the well and actively creating flow were filmed. For both aims, the focus was set on the distal parts of the oral cavity, approximately at the center of the oral diameter. The depth of field ranged from 3µm in X40 objective, to 8.5µm in X10 objective (Spring & Davidson, 2021) and was much narrower than the oral diameter, so that the focused area captured the center of the tintinnids’ oral area. A total of 231 videos (duration range 5-25 sec, median 8 sec) of 150 individuals were recorded, half of which were of Climacocilys scalaria, and the other of Codonellopsis orthoceras. After a video was recorded, an image of a 0.1mm width wire was taken to allow conversion from pixels to mm. Some videos were not suitable for flow field or feeding success analyses, but were used for morphological and kinematic measurements, as detailed below. Some videos contained more than one period in which a constant flow was created, separated by bursts of flow reversals.
In each video (N = 231), we determined the cilia length and oral diameter of the tintinnid (Figure 2A). Five cilia were measured on different frames, where a cilium was in the focal plane. For each cilium, a freehand line was drawn and measured from its origin at the cell surface to its most distal point. Oral diameter was measured in five different frames to account for possible shifts in tintinnid position.
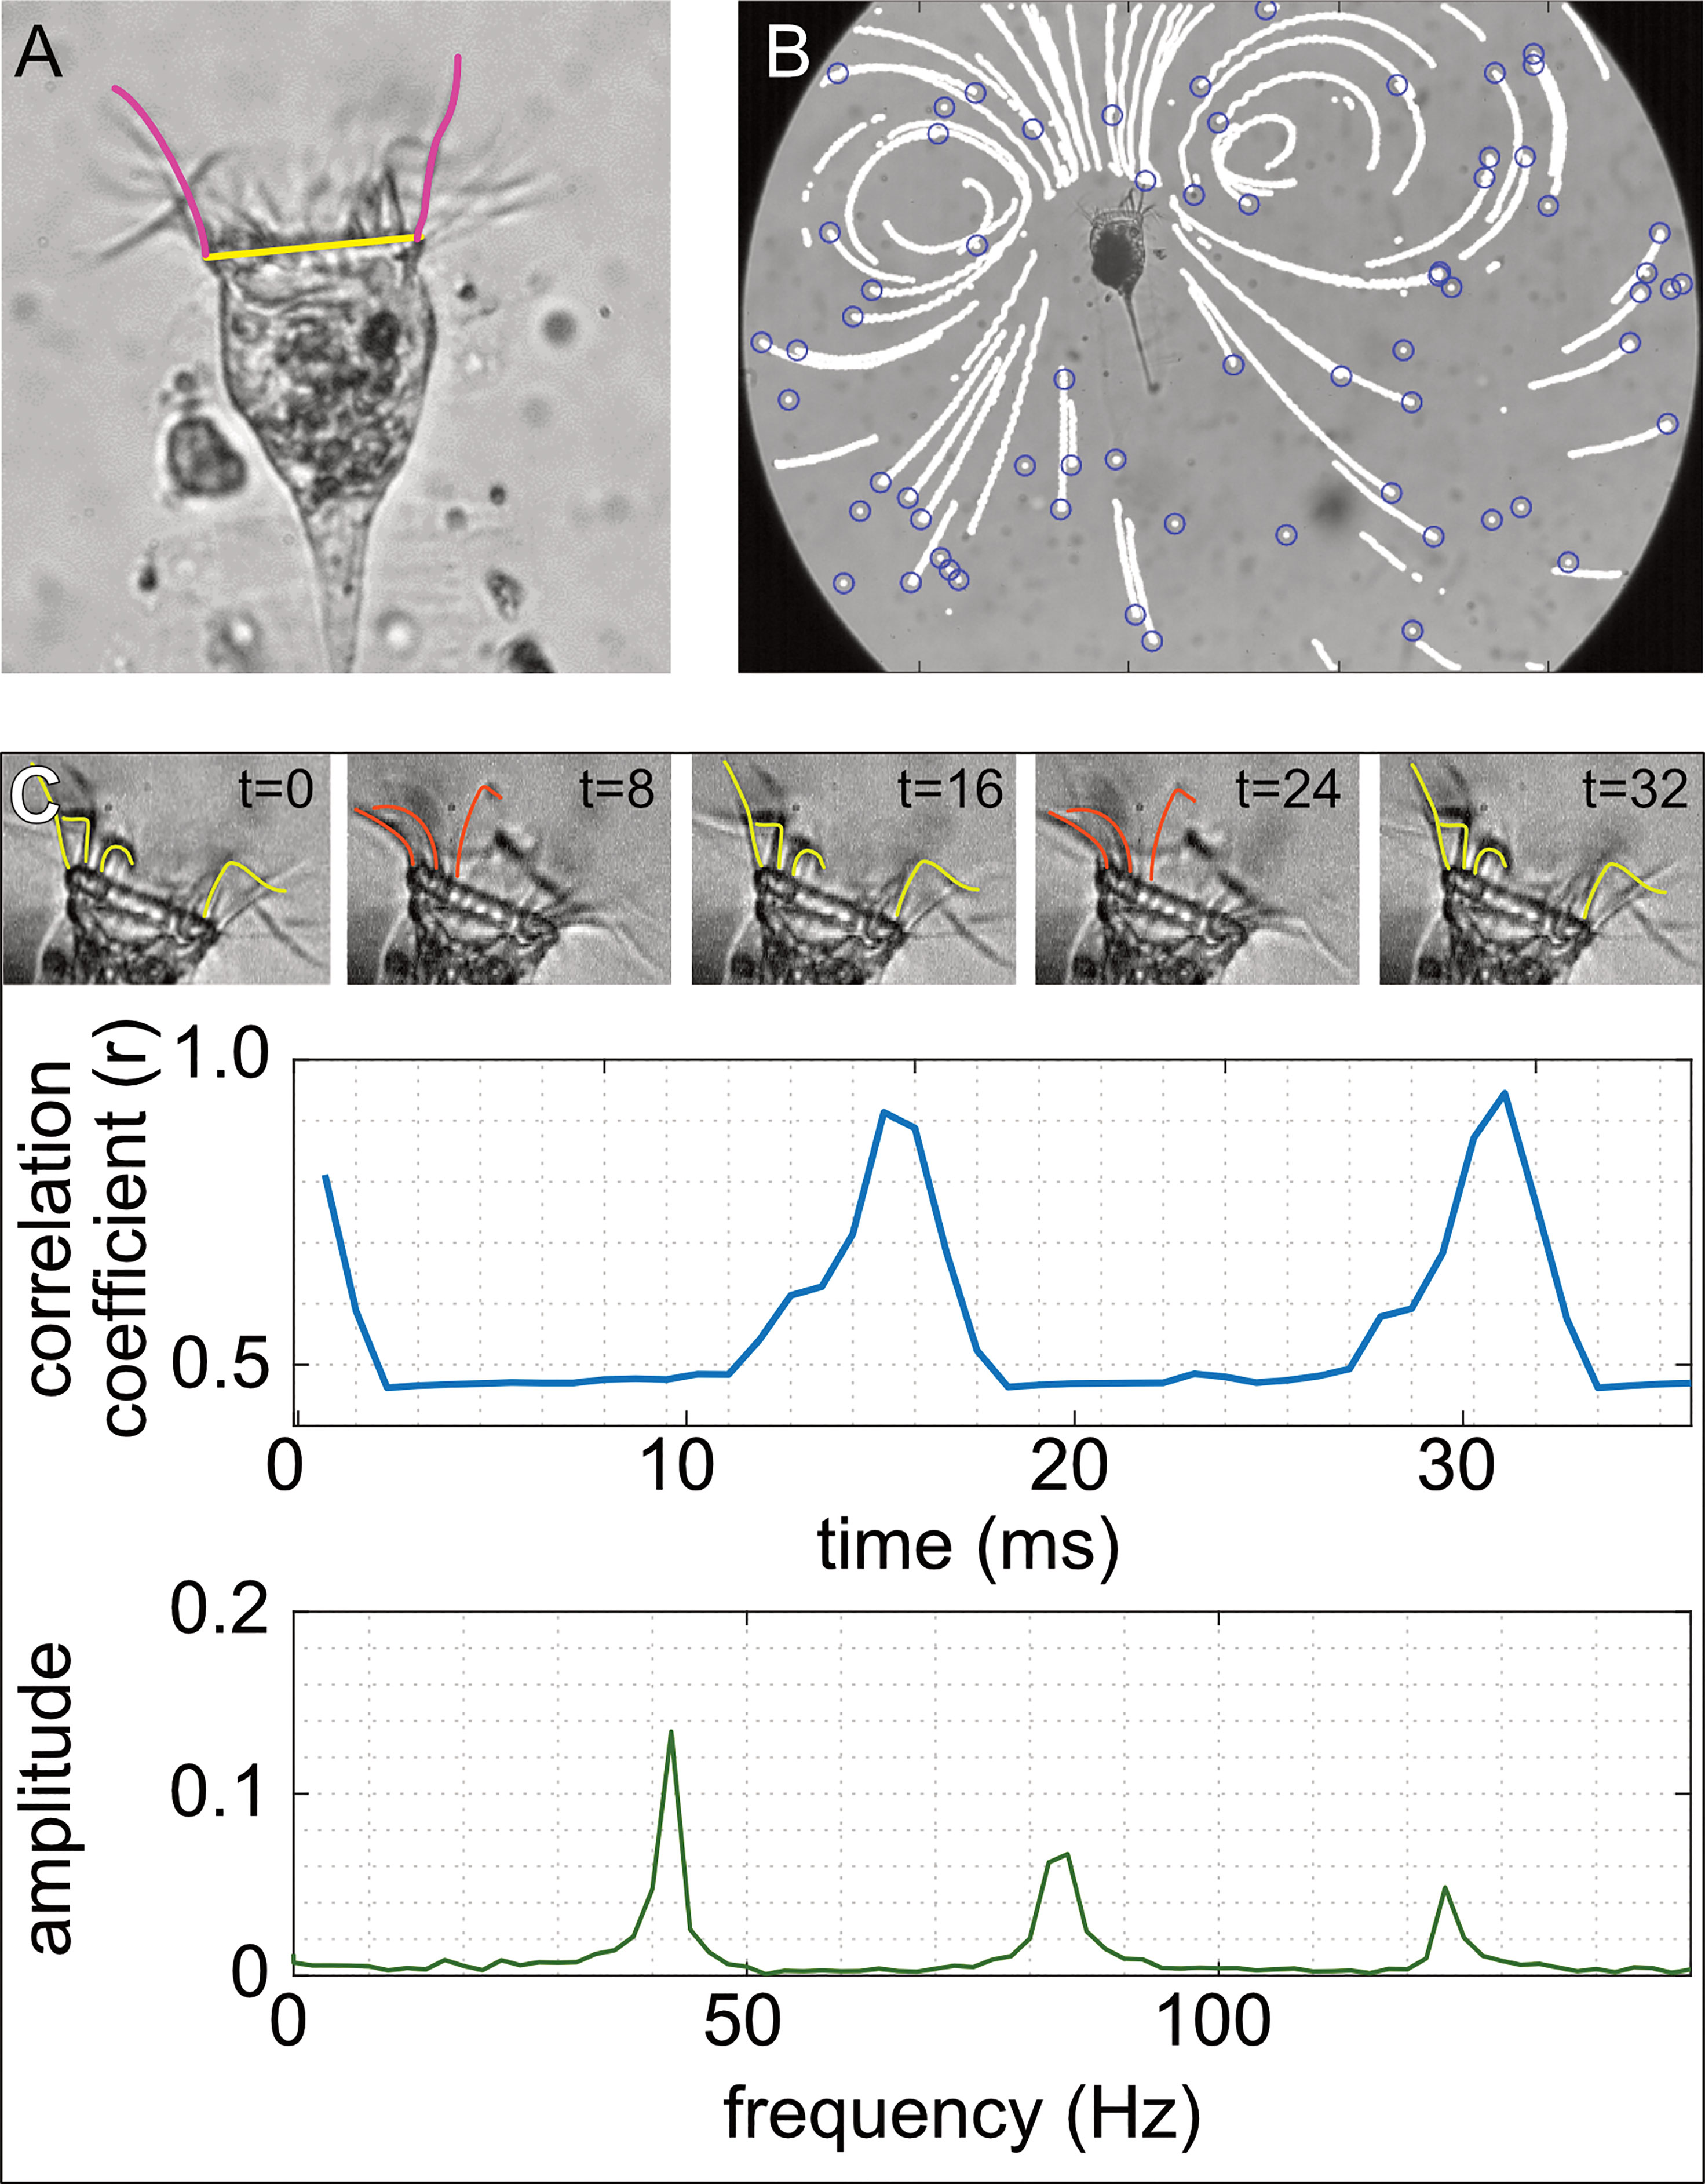
Figure 2 Illustration of tintinnid morphology, particle velocity, and cilia beat frequency. (A) Oral diameter was measured from our videos as the distance between edges of the oral area (yellow line; 40 μm), and the length of the cilia was measured by drawing a line extending the length of the cilia when viewed at maximal length (pink line). (B) To estimate the flow speed, the position of the particles in the video (blue circles) was noted at each time step, which generated continuous movement tracks (white lines). (C) We took advantage of the repetitive arrangement of the cilia (upper panel in C) to estimate their beat frequency. We correlated the brightness values of pixels in the cilia area at t = 0 (left panel in C) to those in consecutive frames (middle and right panels in C). This correlation coefficient peaks when the cilia return to their reference arrangement. Fast Fourier transform (FFT) was used on the vector of correlation coefficients to extract the dominant frequency, which represents the cilia beat frequency (lower panel in C). Photos and drawings are for Climacocilys scalaria.
Food Particles
Four different types of unicellular algae and one type of artificial beads were used in the feeding experiments (Table 2). We chose particles that varied in size (3- 13µm), aspect ratio (1-4.2) and swimming abilities, as detailed in Table 2. The size range used was appropriate to ensure feeding given the dimensions of the gap between the polykinetids (~3.5 μm; Fenchel, 1980b; Fenchel, 1980a) and matched the ratio reported by Hansen et al. (1994). The four unicellular algae were previously shown to be suitable prey for tintinnids or other ciliates (Gold, 1973; Stoecker et al., 1981; Van Wambeke, 1995), while beads were previously used as inert control particles in feeding experiments, and are captured by ciliates (Stoecker et al., 1995). Algae were grown on f/2 media (Guillard & Ryther, 1962), at suitable temperature, and diluted once a week.
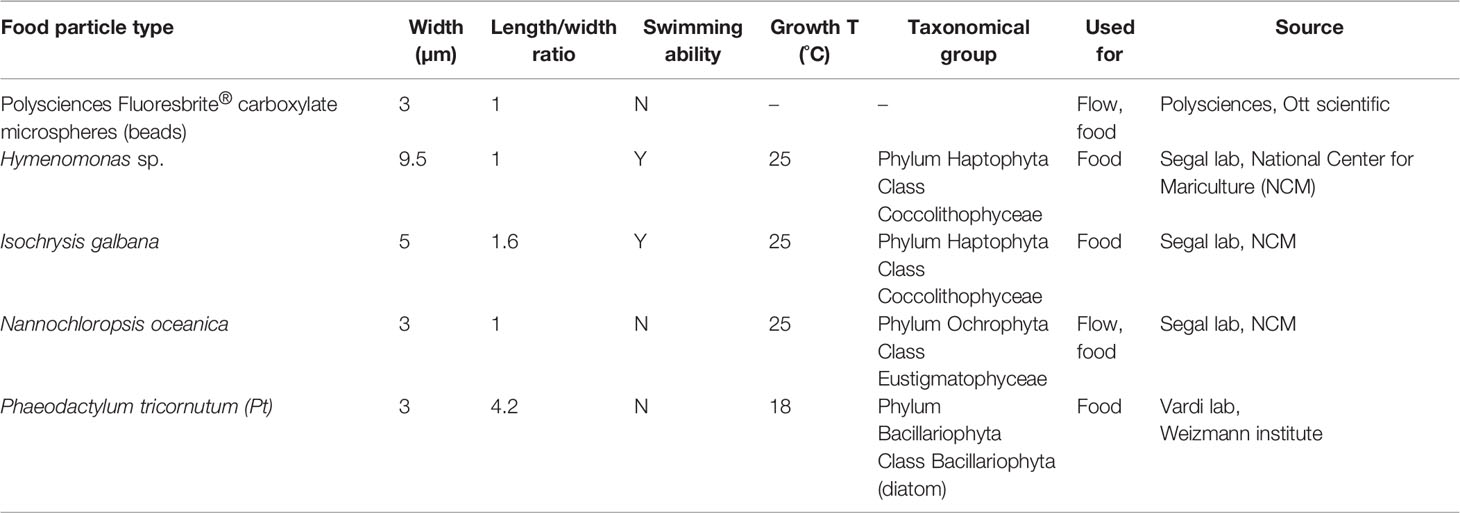
Table 2 Particle properties.
Kinematics
The most conspicuous kinematic parameter in tintinnids is the motion of the cilia. To better understand the impact of cilia movement on the flow and thereby on particle capture, we assessed the cilia beat frequency for each of the video fragments. Beat frequency was estimated for a total of 390 video fragments (Climacocilys scalaria: 221, Codonellopsis orthoceras: 169) extracted from 160 videos (99, 61 for each species, respectively) and 108 individuals (58, 50). Beat frequency was estimated using an image cross-correlation algorithm and fast Fourier transform (following Dimova et al., 2005; Chan et al., 2013) (Figure 2C). In short, this algorithm compares the brightness values of each pixel in the cilia area of each frame to those in a reference frame (Figure 2C). The correlation coefficient between the frames is expected to peak once the cilia returned to their reference location. Fast Fourier transform (FFT) was used on the vector of correlation coefficient to extract the dominant frequency, which was noted as the cilia beat frequency. Because tintinnids moved slightly during filming, the correlation with the reference image declined with time. Thus, each video fragment was divided into windows of 200-500 frames with 100 frames overlap, allowing us to calculate a moving average of cilia beat frequency along the fragment. Water temperature has been shown to influence cilia beat frequency (Riisgård & Larsen, 2007), and was therefore measured for 81 videos using Unisense MicrOptode temperature sensor. The water temperature ranged 18.8-28.1°C.
Hydrodynamics
We used particle tracking velocimetry (PTV) (Adrian, 1991) to quantify the feeding flow generated by the tintinnids (Figure 2B). In PTV, individual particles are tracked, and their trajectory is derived with respect to time to calculate velocity, resulting in spatially sparse measurements of the velocity field. Video fragments were processed using the MATLAB version of the IDL particle tracking software (Crocker & Grier, 1996) written by Daniel Blair and Eric Dufresne (http://site.physics.georgetown.edu/matlab/). Tracks were rotated and shifted so that the mouth center was at the origin (0,0), and the tintinnid body parallel to the y axis. Only tracks in which particles moved >80 pixels in 10 frames were used to calculate the velocity fields. Velocities were derived from a 3rd degree polynomial fit (with R2 > 0.85) to the cumulative displacement of particles, performed on the x and y axes separately. The calibration image and recorded frame rate were used to convert speeds from pixel/frame to mm/s.
Numerical Modelling of the Flow Field
The hydrodynamics of feeding and swimming in organisms with a ciliary crown has been characterized using Stokeslets in Stokes flow (Liron & Blake, 1981; Blake & Otto, 1998; Pepper et al., 2010). This low-Reynolds flow field (Re <<1) consists of a general flow direction towards and past the ciliary crown, and a geometry that depends on the presence of solid boundaries near the organism. For sessile cells, two circular vortices define a toroidal (i.e. “donut” shaped) flow around the organism. This flow pattern was described using both analytical models (Liron & Blake, 1981; Blake & Otto, 1998; Pepper et al., 2010) and flow visualization techniques (Hartmann et al., 2007; Nagai et al., 2009; Pepper et al., 2010). Here, we took advantage of the analytical modeling to transform our sparse PTV measurements to a Eularian specification of the flow field around the tintinnid. We followed Pepper et al. (2010) and used the Brinkman approximation for the Stokes equation to model the flow around the tintinnid. This approximation treats the organism as a cylinder of radius a, perpendicular to the bottom of the well, between two closely spaced walls, representing the walls of the chamber where the organism was placed (SEM Figure 1). Thus, the continuity equation can be written for cylindrical coordinates (r, θ, z) as:
where r is the distance from origin (0,0), and θ is the vertical angle (with the y axis) from origin, and ur, uθ are the velocity components at (r, θ). Z is considered negligible since the cylinder is uniform along z.
The Brinkman approximation for Stokes equation is therefore:
Where p is pressure and k represents the permeability, or viscous friction term associated with the parabolic velocity profile across the height of the medium.
Boundary conditions were defined to represent the asymmetric distribution of cilia with respect to the (r, θ) plane. Localized surface forcing was described as ur = 0 at r = a, and
Where u0 is the maximal tangential speed; c, d are boundary condition parameters, that can be changed and fitted to describe the flow (SEM Figure 1). The need for additional boundary conditions is satisfied by the assumption that velocity vanishes at infinity.
A numerical solution for equations 1-4 was obtained using finite element method (FEM) in COMSOL Multiphysics 5.3. The domain around the tintinnid (positioned at the origin of a 5x5 mm area) was discretized into a finite number of small elements. Element size ranged from 7.5 · 10-4 to 0.654 mm, with increasing element density towards the cell body that provided higher resolution closer to the tintinnid. To get an accurate description of the flow, the model’s parameters (k, c, d, a) were optimized using an active-set constrained optimization function written for COMSOL Multiphysics 5.3 with MATLAB. For each tracked particle, we first calculated the coefficient of determination (R2) between the measured and modeled speed. The optimizer was then set to maximize the median R2 for all the tracks (N = 2268, N = 1586 for Climacocilys scalaria and Codonellopsis orthoceras, respectively). The slope of measured versus simulated speeds was not optimized, allowing the comparison of flow fields with different speed ranges. For this reason, u0 was arbitrarily set to u0 = -1 mm/s; a was defined as a = mean(oral diameter per specie). Hence, optimized parameters were k, c, d. Manually changing these parameters in COMSOL showed that they influence the shape of the flow field, such that k affects the distance of the center of vortices from the center of the cell, c affects the vortices angle, and d influences the surface forcing along with U0. The initial guess for k, c, d, was made following a univariate search, conducted for each parameter separately. For Climacocilys scalaria initial guess values were k0 = 0.05, c0 = 0.4, d0 = 0.3, and for Codonellopsis orthoceras k0 = 0.02, c0 = 0.14, d0 = 0.5 (SEM Table 3). The parameters were passed to the optimizer, and after satisfying the default constraint tolerance of the optimization (10-6), best fitting parameters were exported, as well as all the R2 values per track, which allowed testing the fit at level of individual realization. To check the credibility of the optimizer, simulated values of a known set of parameters were interpolated to the locations of the tracks in the Climacocilys scalaria dataset. This dataset was passed through the optimizer to verify that initial parameters can be correctly retrieved.
We used the model to reconstruct streamlines, along which particle are expected to travel. Specifically, we identified the region in the flow field, where the streamlines will lead to encounter with the cilia or the oral area. Streamlines were calculated from the optimized flow field for Climacocilys scalaria. The central streamline, leading to the mouth center, was defined as 0, and the two furthest streamlines that still allow encounter were arbitrarily defined as 1.5 and -1.5. Thus, the perpendicular “distance from the central streamline” is a measure of particle location independent of tintinnid size or the particle’s distance on the r axis.
Feeding Success
To understand the factors that contribute to feeding success, we tracked the fate of individual particles that directly encountered the tintinnid, i.e. particles that interacted with the cilia or the oral cavity. This strategy allowed us to address the stages of capture, handling, and ingestion of prey (Figure 1C), but did not account for encounter rate. Since tintinnids were filmed when settled, their swimming patterns and possible search of prey patches did not confound the analysis. About 200 encounters were analyzed for each of the five food types, except from Hymenomonas sp. Where only 86 interactions were analyzed. For each video, we noted the oral diameter, cilia length and cilia beat frequency as described above. Additionally, for each encountered particle we recorded the following parameters: encounter outcome (catch/no catch, Videos S1, S2), handling outcome (rejection/retention/ingestion; Videos S3, S4) and the time after encounter at which rejection of injection occurred, cilia reversal during catch (yes/no) and cilia reversal during handling. For caught particles, we noted whether cilia reversal occurred within 2.6 s following catch, a time frame representing the 80th percentile of rejection time.
Overall, flow reversals occurred in ~16% of the observed encounters and in ~40% of the observed handling. The frequency of flow reversals for Hymenomonas sp in the observed encounters (68%) was higher than for other food types. The frequency of flow reversals for Isochrysis galbana and Pt in the observed encounters (~7%) was lower than for other food types.
Statistical Analysis
The relationship between cilia length and oral diameter was assessed using linear regression (n=150 individuals, SEM Table 2). The effect of tintinnid species, cilia length, oral diameter, and water temperature on cilia beat frequency was tested using a linear mixed-effect model with tintinnid ID as a random variable (N=390 observations). In all our analyses that utilized mixed-effect models, the significance of each model was assessed using a likelihood ratio test between the full model and an intercept-only model (Gałecki & Burzykowski, 2013). In these analyses, conditional and marginal R2 are reported. Conditional R2 quantifies the variance explained by both the fixed and random variables, whereas marginal R2 quantifies only the variance explained by the fixed variables. These two parameters allowed distinction between the effect of the tested variables and the effect of the individual differences, set as random variables. Compliance with the assumptions of homogeneity of variance and appropriate distribution of residuals were verified using a Q-Q plot and residuals plot, respectively. Variance inflation factor (VIF) of <6 was verified to ensure low correspondence between the independent variables. All our analysis was done using the software R statistics (R Core Team, 2021).
We used a linear mixed-effect model to test the effect of morphology and kinematics on flow velocity, accounting also for tintinnid species. The maximal flow speed observed in each video fragment was the dependent variable, whereas cilia beat frequency, cilia length and tintinnid species were the independent variables. Interaction terms between cilia beat frequency and tintinnid species were included in the model. Tintinnid ID was defined as a random variable. Oral diameter was not included in the model to due high variance inflation factor (VIF > 6), driven by the strong positive correlation between cilia length and oral diameter (R2 = 0.7). For this correlation, there was also a significant effect of species (p<0.001, SEM Table 2), such that for the same oral diameter Codonellopsis orthoceras had longer cilia.
We hypothesized that encounter outcome (catch/no catch) depends on the flow field, cilia kinematics, and the properties of the particles. This hypothesis was tested using a generalized linear model (GLM) with a binomial error structure. The dependent variable was the encounter outcome (binary variable; catch/no catch), and the independent variables were the distance from the central streamline, cilia beat frequency, cilia reversal at the time of interaction (yes/no), prey size, prey aspect ratio (length to width) and prey swimming abilities (yes/no). Based on the observations of Stoecker et al., 1995, an interaction term between cilia reversal and particle size was added to the model. To allow a balanced statistical design, we ran this analysis on a smaller dataset of 15 successful and 15 unsuccessful captures per particle type, selected at random from the pool of all observations.
We further hypothesized that handling outcome (rejection/retention/ingestion) is affected by the same parameters as encounter outcome. This hypothesis was tested using multinomial logistic regression, such that handling outcome was the dependent variable, with three levels: retention was used as the base level, since in this case there was no change in prey status after catch; rejection and ingestion were the two other possible, opposing outcomes. The independent variables were cilia beat frequency, cilia reversal after catch, prey size, prey aspect ratio, and prey swimming abilities. The model included an interaction term between cilia reversal and particle. Tintinnid ID was used as a random variable. Unfortunately, the model did not converge when using the subset with the streamlines (N=37), and was therefore fitted to the full data set without streamlines (N = 119).
To evaluate the possibility that either encounter or handling outcome are affected by other prey properties that we did not characterize [i.e. growth phase, chemical cues, surface properties (Hamels et al., 2004; Gruber et al., 2009; Dadon-Pilosof et al., 2017)], we compared each of our models (above) to a model that included food type (categorical predictor; n=5 levels) instead of prey physical properties (prey size, prey aspect ratio, and prey swimming ability). Models were compared using δAIC score, where a difference of >2 in AIC values (ΔAIC) indicates some support in favor of model with the lowest score, and ΔAIC >4 indicates strong support.
To test the influence of date and time on tintinnid cilia beat frequency and flow velocity, we used a liner mixed effect model with either the frequency or flow velocity as the dependent variables; date and time as the independent variables; and tintinnid ID as an independent random variable. No significant effect of day or time was found on cilia beat frequency and flow velocity, with individual differences accounting for most of the variance in the data (P>0.5, R2marginal= 0.027, R2conditional= 0.5).
Results
What Determines the Encounter Rate With Prey?
The spatial pattern of the flow was highly stereotypic between individuals and between species, irrespective of the maximal flow speed (Figures 3A–D). To obtain a Eularian specification of the flow field around the tintinnid, we used the PTV tracks to fit the free parameters in the Brinkman approximation for the Stokes equation (Pepper et al., 2010) (Figure 3E). Qualitatively, the low-Reynolds flows (Re << 1) were typical to Stokeslet flow. One set of parameters (k = 0.255, c = 0.3, d = 0.4) was sufficient to describe the flow field for both species (SEM Table 3). The mean correlation coefficient, calculated between the measured speeds from the PTV and the modeled speeds for each video fragment was R2 = 0.84 (range of 0.51-0.998). The only parameter that differed from the first heuristic guess was the value of k, which affects the distance between the tintinnid to the center of the vortices.
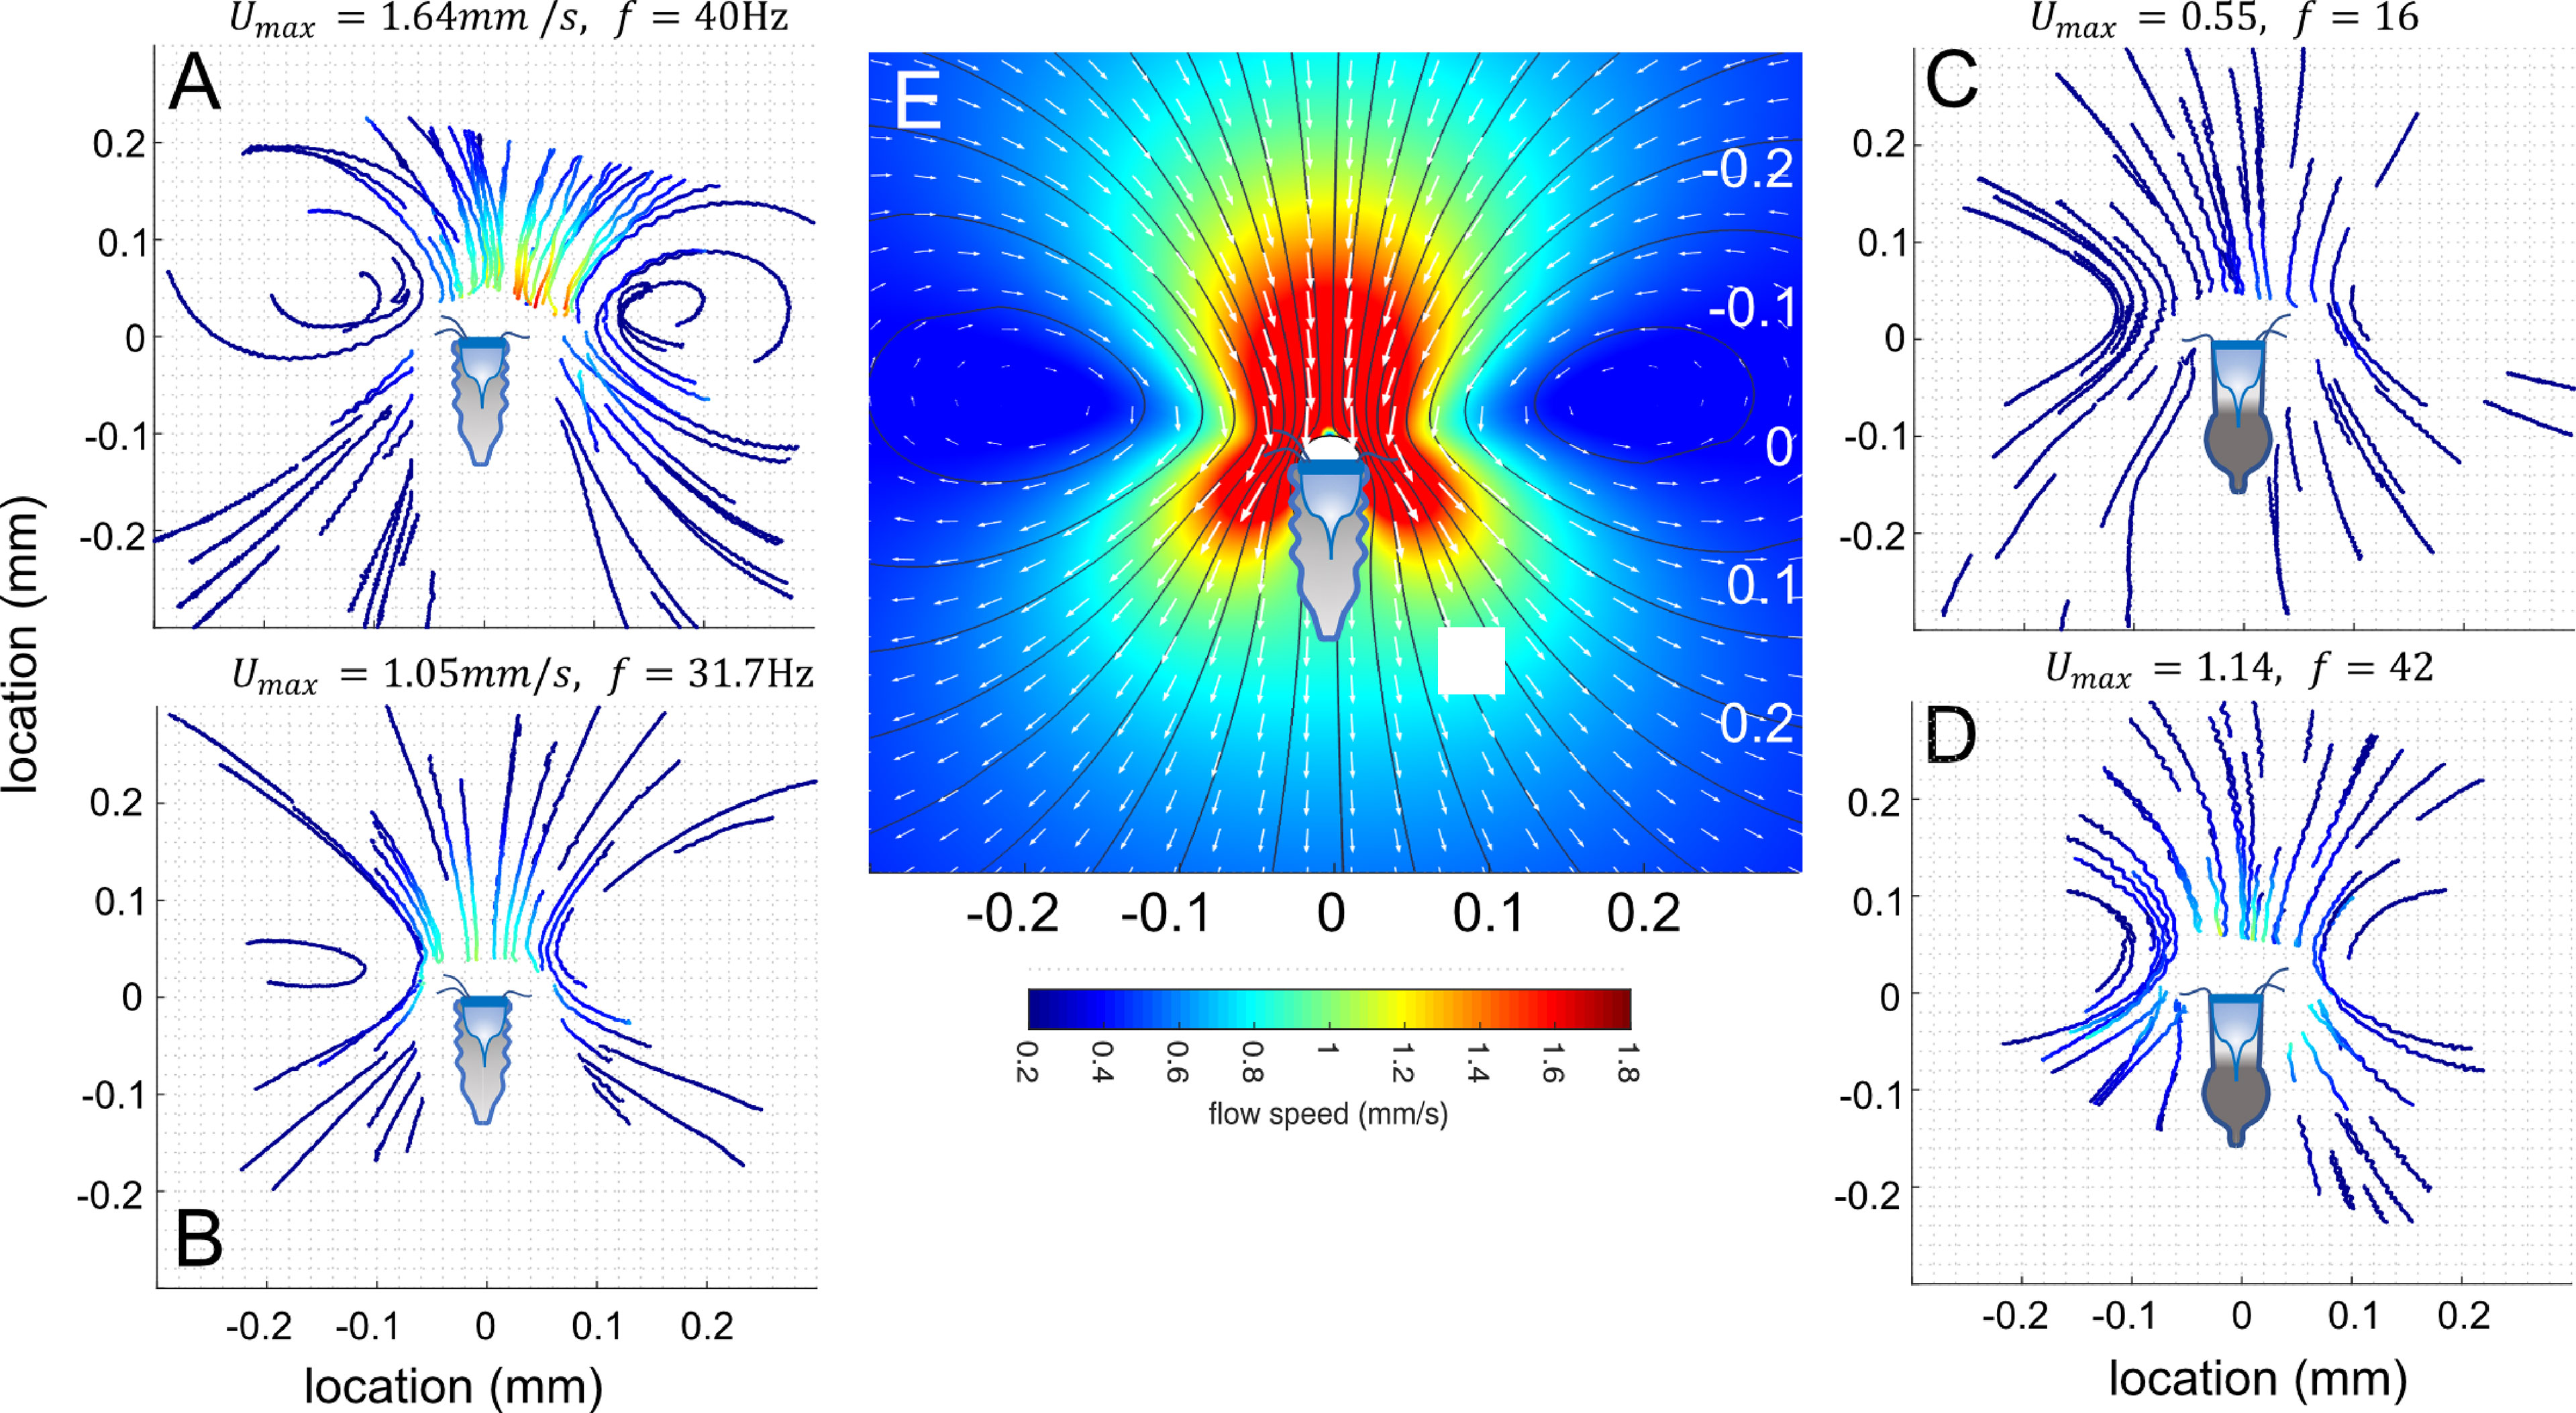
Figure 3 The flow fields generated by the tintinnids. PTV tracks for Climacocilys scalaria (A, B) and Codonellopsis orthoceras (C, D). Tracks are colored by the particle’s speed; the maximal speed in the field and the cilia beat frequency are indicated above each panel. (E) A numerical solution to the Brinkman approximation to Stokes equations (eq. 1-4), optimized using the PTV results. Colors represent flow speeds, arrows velocity vectors, and thin black lines the streamlines. Prior to PTV analysis, videos were rotated and shifted such that the center of the oral area of the tintinnid was at the origin (0,0) of a cylindrical coordinate system, and the mouth centerline on the x-axis. Illustrated tintinnids are to scale.
The maximal flow speed evaluated using PTV in the entire field varied greatly within and between individuals and ranged from Umax = 0.081 to 2.28 mm s-1. Higher cilia beat frequency was significantly correlated with faster flow speeds (linear mixed-effect model; R2marginal = 0.45; R2conditional = 0.61, p< 0. 001, SEM Table 4, Figure 4A). Neither cilia length, tintinnid species, nor the interaction of species and cilia beat frequency showed significant association with flow speed (p > 0.05). In turn, cilia beat frequency was not significantly correlated with tintinnid species, cilia length, oral diameter, or water temperature (R2marginal = 0.09, R2conditional =0.85, whole model p > 0.11, SEM Table 5). Between-individual differences accounted for 83% of the variance explained by the model, providing strong evidence that cilia beat frequency is a flexible, behavioral trait at least for settled tintinnids while generating feeding flows. We recorded some tintinnids changing their cilia beat frequency in >10Hz over only 6s, and other tintinnids not changing their beat frequency at all over 18s of sequential filming (Figures 4B, C).
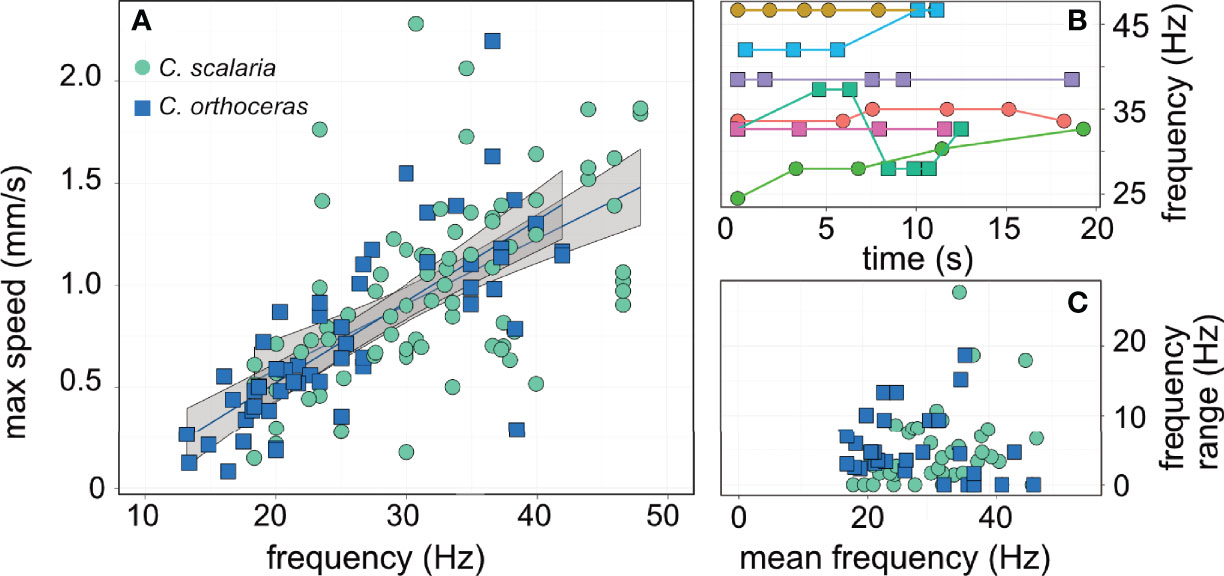
Figure 4 Cilia beat frequency dictates the flow speed and thereby encounter rates with prey. (A) cilia beat frequency was positively correlated (R2marginal = 0.45; p< 0. 001) with the maximum flow speed measured in front of the tintinnid using PTV. (B) examples of cilia beat frequency in different individual tintinnids; this illustrates the flexibility in cilia beat behavior, where some individuals beat their cilia at the same frequency (e.g. purple, pink lines) whereas other displayed rapid shifts (e.g. blue and green lines). (C) the mean beat frequency was ~30 Hz, however individuals shifted their beat frequency by an average of 4.5 Hz, independent of their beat frequency. The two species are represented by different color (A, C) and symbols (A–C). Colors in (B) represent different individuals, arbitrarily selected to showcase the behavioral variation.
Particles encountered the tintinnids’ polykinetids and oral area if they traveled along the streamlines demarked by the edges of the polykinetids (Figure 5). However, not all encountered particles were captured. The probability of prey capture decreased from 0.75 at the central streamline to 0.05 at a scaled distance of |1.5| oral diameters from the central streamline (Figures 5B, C; GLM, p < 0.001, R2marginal = 0.3, R2conditional =0.3, SEM Table 6). Particles generally traveled along the same streamline until they reached the tintinnid, however swimming algae (Hymenomonas sp., and Isochrysis galbana) were observed to cross streamlines.
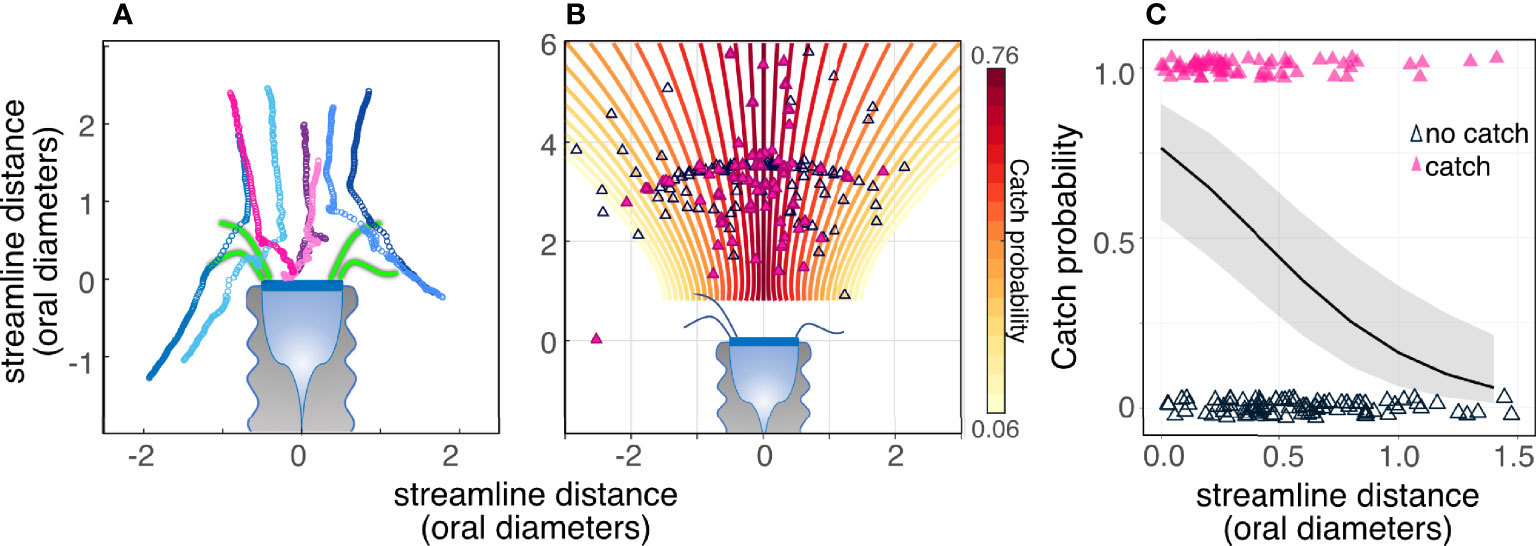
Figure 5 Particles encountered the tintinnids’ polykinetids and oral area if they traveled along the streamlines demarked by the edges of the polykinetids; however, not all encountered particles were captured. (A) Tracks of encountered particles showing captured (warm colored-symbols) and non-captured (cold colors) particles. Consecutive symbols represent the location of the prey at 1.25 ms intervals. Representative polykinetids are drawn in green and are to scale. (B, C) Catch probability decreased significantly with increasing distance from the central streamline. Closed (pink) triangles denote captured particles while open triangles denote particles that were not captured. The color of the streamlines in (B) and the slope of the black line in (C) denote the expected change in capture probability with streamline distance (logit function) based on a GLM model (SEM Table 6). Gray area in (C) is the confidence interval of the logit function. Data are for Climacocilys scalaria.
These results show that effective encounter rate with prey is determined by cilia beat frequency (which determines the flow speed towards the tintinnid) and by the position of the prey relative to the central streamline.
At Which Stages of the Feeding Sequence Does Selectivity Develop?
Overall, the feeding success of our tintinnids was ~7%. Only 14% of encountered particles were caught (i.e., moved into the oral cavity, Figure 6A). Out of the particles caught, ~50% of particles were rejected after initial catch (Figure 6B). We observed ingestion for ~15% of the captured particles, whereas ~35% of the particles were retained in the oral cavity until the end of the video and their fate could not be verified. Because rejection probability did not increase with time (SEM Table 6), we reasoned that all retained particles were eventually ingested.
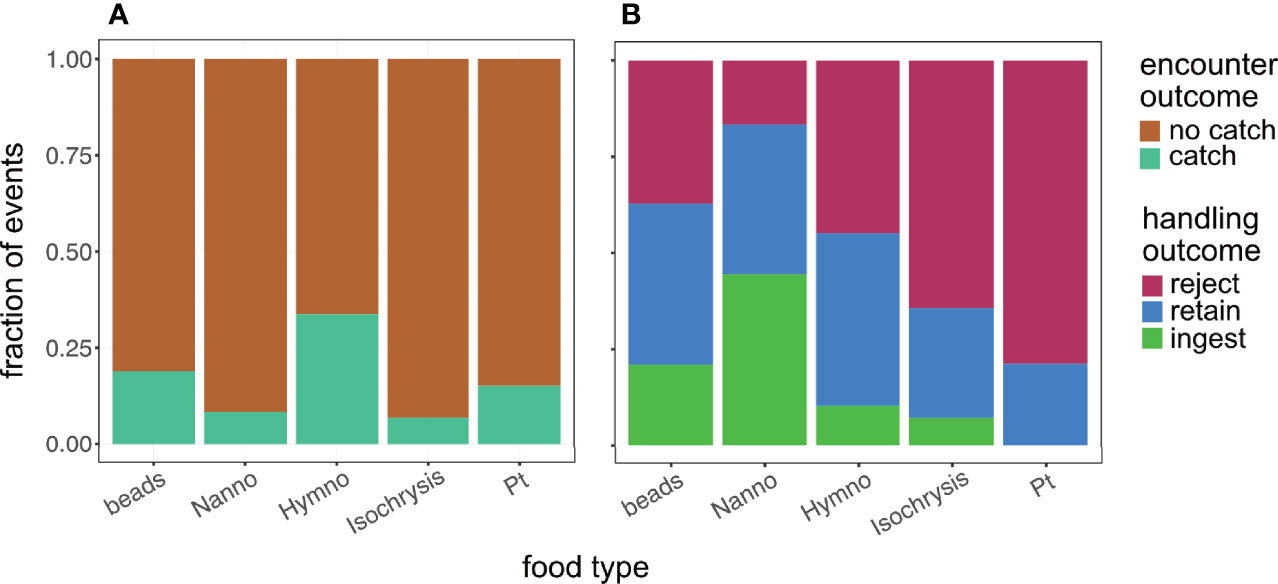
Figure 6 Encounter and handling outcome (A, B, respectively) by food type for Climacocilys scalaria. n = 817 and 137 for encounters and handling events. Caught particles were either rejected back into the fluid, ingested into the cell, or remained in the oral cavity by the end of our video (‘retained’). Overall feeding success was 0.07. ‘Beads’ are Polysciences Fluoresbrite carboxylate microspheres, ‘Nanno’- Nannochloropsis oceanica, ‘Hymno’- Hymenomonas sp., ‘Isochrysis’ - Isochrysis galbana, ‘Pt’- Phaeodactylum tricornutum.
Selectivity was observed both during capture and handling. At the capture stage, tintinnids captured larger particles at a higher probability than small ones (Figure 7A), but showed no selectivity based on prey aspect ratio, swimming ability, or whether prey was artificial (beads) or not (Figure 7B; GLM, p < 0.001, R2marginal = 0.3, R2conditional =0.3, SEM Table 5). At the handling stage, tintinnids rejected larger particles at a lower probability than small ones, and rejected prolate particles at a higher probability than round particles (Figure 7C; p < 0.001, SEM Table 7). The two algae with aspect ratios of > 1.5 had the lowest observed ingestion fraction (Figure 7D). At the handling stage, tintinnids showed no selectivity for swimming or inert particles. There were no significant differences between ingestion and retention probabilities, with respect to any prey or tintinnid traits (SEM Table 6), reinforcing our conclusion that retained particles were eventually ingested.
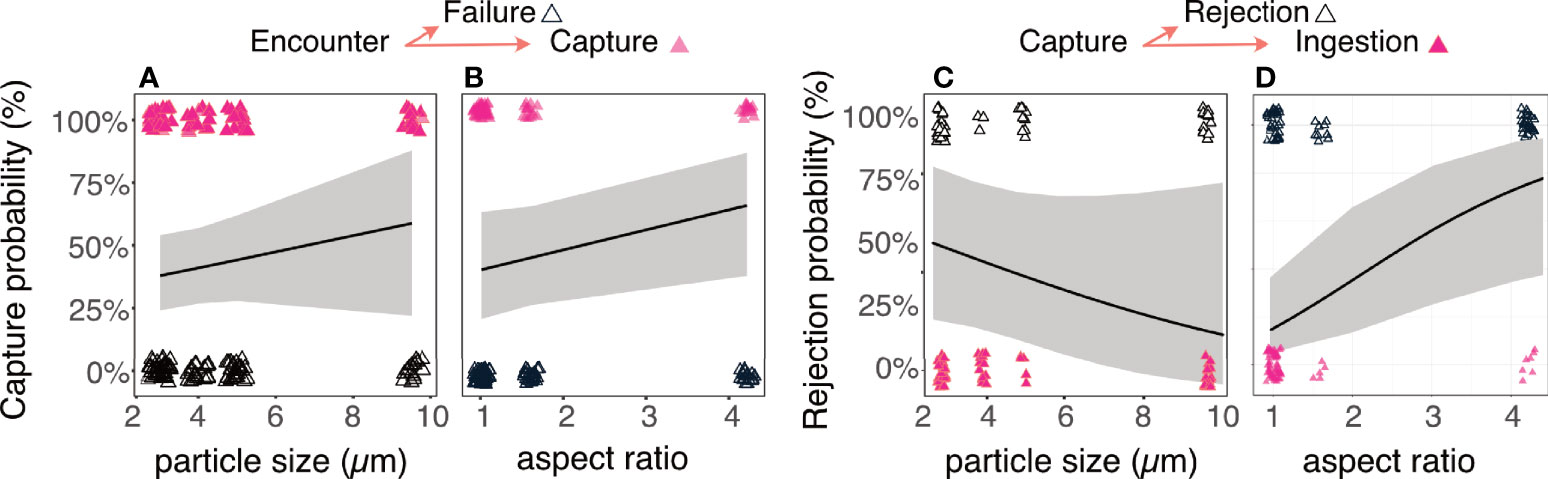
Figure 7 Prey selectivity is the outcome of selective capture and handling. Upon encounter (A, B), capture probability significantly increased with particle size, however the relationship between capture success and aspect ratio was non-significant (SEM Table 6). After prey capture (C, D), rejection probability significantly decreased with particle size, and significantly increased with the particle’s aspect ratio (SEM Table 6). The size distribution and dimensions of the ingested prey (Figure 5) are therefore the result of integrating the processes occurring at the stages of capture and handling. Open triangles denote a negative outcome (particles not captured/rejected), while closed (pink) triangles denote a positive outcome (particles captured/not rejected). Lines and shaded areas are the logit function depicting the probability of capture of rejection (± CI) for a given particle size/aspect ratio from a GLM model.
These results show that selectivity for prey size and shape can differentially occur at the stage of prey capture, as well as during handling. Furthermore, the degree of selectivity can markedly differ between these stages (Figure 7).
Which Predator’s Behaviors Modify Selectivity?
Tintinnids often incorporated short bouts of flow reversal during longer sequences of generating flow towards their body. These cilia reversals strongly altered the patterns of selectivity during both capture and handling stages, as indicated by a significant interaction term between flow reversal and size (SEM Tables 5, 6). At the capture stage, bouts of cilia reversal transposed the pattern of selectivity, allowing the tintinnids to capture small particles at a higher probability than large ones (Figures 8A, B). A similar pattern was observed at the handling stage, where bouts of cilia reversal allowed the tintinnids to retain small particles at a higher probability than large ones (Figures 8C, D).
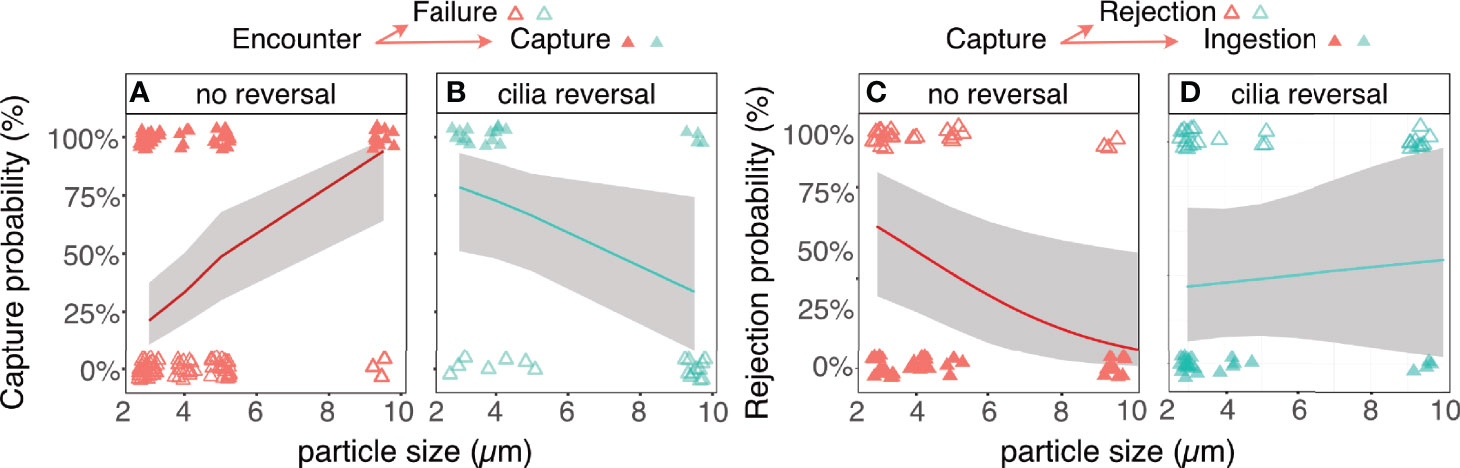
Figure 8 Cilia reversal modifies the patterns of prey size selectivity at the stages of capture and handling. Upon encounter, large particles are preferentially captured at the absence of flow reversal (A), but ciliary reversal transposes this trend (B) (SEM Table 6). A similar trend if observed at the handling stage, where larger particles have a lower rejection probability at the absence of flow reversal (C), while ciliary reversal leads to a lower probability to reject smaller ones (D) (SEM Table 7). The size distribution of the ingested prey (Figure 5) are therefore strongly affected by the tintinnid’s behavior at the stages of capture and handling. Open triangles denote a negative outcome (particles not captured/rejected), while closed triangles denote a positive outcome (particles captured/not rejected). Red triangles denote capture events without ciliary reversal while green ones denote reversal. Lines and shaded areas are the logit function depicting the probability of capture of rejection (± CI) for a given particle size/aspect ratio from a GLM model.
Discussion
Tintinnids feed by generating a flow of water towards the cell, carrying particles towards the oral area. Ciliate feeding is a multi-step process that includes encounter, capture, ingestion, and digestion. This feeding sequence is thus governed by three components: the hydrodynamics of the feeding flows, the kinematics of the beating cilia, and the prey properties. Our results show that the encounter rate with potential prey strongly affected by cilia beat frequency (which determines the flow speed). The capture probability of encountered particles strongly depends on their location with respect to the central streamline. Tintinnids showed strong selectivity for particle size and shape, which developed during both capture and handling stages. Tintinnid behavior, manifested as cilia reversal, transposed the patterns of selectivity observed during periods of continuous flow.
Studies of feeding success and selectivity have usually focused on single components (hydrodynamics, kinematics, and the prey properties). Here, we investigate the joint effect of the three components on encounter and handling outcomes in tintinnid ciliates. In agreement with studies on other ciliates (Blake & Otto, 1998; Hartmann et al., 2007; Pepper et al., 2010), we find that the spatial pattern of the tintinnid flow field is highly stereotypic, but our data shows that maximal flow speed was highly variable, and was controlled by cilia kinematics (Figure 4A). Individual tintinnids were able to modulate cilia kinematics (Figures 4B, C), which affected encounter rates, and the patterns of selectivity (Figure 8).
In filter-feeding grazers, the encounter rate is determined by the flux of water towards the grazer (Kiørboe, 2011) and the density of particles around it. We used the flux of water towards the tintinnid and the observed success probability to calculate the specific clearance rate in our experiments (defined as the volume of filtered water divided by the grazer’s volume). The flux towards the tintinnid was calculated based on tintinnid size using the observed radius and a length corresponding to 3 times the radius. We used the maximal observed flow speed within each PTV realization and tintinnid size to calculate the flux of water towards it. The resulting specific clearance rate varied by two orders of magnitude, ranging from a minimum of 7.3 x 10⁴ day -1 to a maximum of 2.7 x 10⁶ day -1 (mean = 1.0 x 10⁶ ± 5.5 x 10⁵ day -1). These calculations show that tintinnids can potentially adjust their feeding flows according to the grazer’s satiation, physiological state, or in response to prey density. Although we filmed settled tintinnids, their ability to manipulate the flow speed they create supports the evidence that grazers actively optimize encounter rate by altering their swimming (Buskey & Stoecker, 1988; Buskey & Stoecker, 1989). Our estimates generally consistent with estimates based on tintinnid ingestion rates (106 – 107 day-1, Hansen et al., 1997; Kiørboe, 2011). Jonsson et al. (2004), reported that attached tintinnids of the species Eutintinnus inquilinus had higher clearance rate than swimming ones (4-5µl h-1 compared to 2-2.6 µl h-1), but even if we correct for a possible doubling of the encounter rate, our observation is still within the reported range.
The effects of prey size and cilia kinematics on encounter outcome are in good agreement with previous observations of the tintinnid Favella ehrenbergii (Stoecker et al., 1995). Our data agrees that there exists an interaction between flow reversals and particle size in determining prey capture, however, the interaction was opposite: in our data larger particles were caught less often using flow reversal, and smaller particles were more likely to be caught during flow reversal (Figures 8A, B). Our characterization of the flow field enabled us to test whether the reported decrease of capture success at the periphery of the oral area (Stoecker et al., 1995) was due to changes in the flow regime across the cell. We show that the encounter outcome decreases as a function of the distance from the central streamline (Figures 5B, C), but we did not observe strong velocity gradients across the oral area (Figure 3). In addition, flow speed did not affect catch probability, and therefore its effects are limited to encounter rate. We reiterate the hypothesis of Stoecker et al. (1995) that flow reversal might be a strategy to move the particle closer to the central streamline, thus improving the catch probability by ~20% (from 0.46 to 0.67).
Previous research focused on encounter rate and encounter outcome as the drivers of selectivity. However, our results show strong selectivity at the handling stage, with rejection rates amounting to 75% for Phaeodactylum tricornutum, and averaging 50% overall (Figure 6B). In our experiments, size and aspect ratio of the particle (the latter is disregarded in most studies), together with cilia reversal, had the strongest effect on handling outcome (Figures 7, 8). Elongated particles had a higher chance of being rejected than round particles (Figures 7B, D), and smaller particles (beads and the algae Nannochloropsis oceanica), were less likely to be rejected during flow reversal (Figure 8B). These results suggest a hitherto undescribed effect of cilia reversal, which can be used for both selective capture and selective handling of particles. Note that we chose to characterize the prey using linear dimensions and swimming ability, but the particles used could potentially differ in other aspects such as hydrophobicity or surface chemistry. While these traits can be important in prey capture, a model that substituted the linear traits with a categorical variable of “species” received much lower support (ΔAIC = 9.58; model not shown), implying that the traits we chose provide greater explanatory power with respect to the observed outcomes.
Our quantification of the flow speeds generated by the tintinnids utilized tracking of sparse particles, resulting in an uneven spatial coverage of the flow field (Figures 3A–D). Thus, our results are likely a conservative estimate of the maximal flow speed generated by the tintinnid, as it is possible that particles passing through the area of fastest flow were not recorded by chance. Moreover, the highest flow velocities are expected close to the cilia, where tracking was often impossible. The sparse tracking also limited our ability to describe the flow field at each point of the field with the same resolution, as can be deduced from the sensitivity of the model only to one parameter (k, the parameter affecting the distance of the center of vortices from the center of the cell; eq. 4) of the three parameters that affect the spatial flow pattern. Specifically, areas with slow flow generated fewer tracks. Nevertheless, the quality of information was high in the area immediately in front of the mouth, which is most relevant area for prey capture. This resolution was sufficient to predict the flow in front of the mouth using Brinkman approximation for the Stokes equation, as suggested by Pepper et al. (2010). Our research focused on settled tintinnids, which allowed us to accurately quantify their capture and handling success without a confounding effect of search or swim pattern. Although we could not address the selectivity that may result from swimming (Hamels et al., 2004), we hypothesize that cilia-particle interactions would be similar for settled and swimming tintinnids. However selective foraging prior to prey encounter, is likely to be exercised through swimming, and merit inclusion in future studies to fully address the mechanisms of prey selectivity.
Taken together, the mechanisms of prey capture in tintinnids can be described as: (1) food particles are being encountered at a rate dictated by the flow speed, governed by cilia beat frequency, and prey concentration; (2) encountered particles have higher catch probability the closer they are to the central streamline, and larger particles are captured preferentially; (3) once caught, selective rejection may occur, explained by the particles’ aspect ratio and size; (4) ciliary reversal transpose the patterns of selectivity during both capture and handling stages. Overall, these results show that selective predation can occur through different mechanisms, potentially allowing tintinnids to optimize their feeding. Despite the profound effect of cilia beat kinematics on prey capture, and the frequent and dramatic changes to this behavior, it is rarely addressed in research. Our results stress the importance of assessing feeding mechanisms at the individual level, since it is driven by behavioral traits that cannot be accounted for when using culture level experiment.
Data Availability Statement
The original contributions presented in the study are included in the article/Supplementary Material. Further inquiries can be directed to the corresponding author.
Author Contributions
RH and HW conceived the research. HW collected the data. HW and RH analyzed the data and wrote the manuscript. All authors contributed to the article and approved the submitted version.
Conflict of Interest
The authors declare that the research was conducted in the absence of any commercial or financial relationships that could be construed as a potential conflict of interest.
Publisher’s Note
All claims expressed in this article are solely those of the authors and do not necessarily represent those of their affiliated organizations, or those of the publisher, the editors and the reviewers. Any product that may be evaluated in this article, or claim that may be made by its manufacturer, is not guaranteed or endorsed by the publisher.
Acknowledgments
We thank Avihai Tsinober for help with constructing the COMSOL model; Yuval Jacobi, Ayelet Dadon-Pilosof, and Gitai Yahel, and members of the Holzman Lab for useful discussions and insights; Nir Marom for his greatest ideas and invaluable scientific input. HW thanks Lilian and Jacques Richter for their generous financial support.
Supplementary Material
The Supplementary Material for this article can be found online at: https://www.frontiersin.org/articles/10.3389/fmars.2022.845903/full#supplementary-material
References
Abou Zaid M. M., Hellal A. M. (2012). Tintinnids (Protozoa: Ciliata) From the Coast of Hurghada Red Sea, Egypt. Egypt. J. Aquat. Res. 38 (4), 249–268. doi: 10.1016/j.ejar.2013.01.003
Admiraal W., Venekamp L. (1986). Significance of Tintinnid Grazing During Blooms of Phaeocystis Pouchetii (Haptophyceae) in Dutch Coastal Waters. Netherlands J. Sea Res. 20 (1), 61–66. doi: 10.1016/0077-7579(86)90061-X
Adrian R. J. (1991). Particle-Imaging Techniques for Experimental Fluid Mechanics. Annu. Rev. Fluid Mech. 23 (1), 261–304. doi: 10.1146/annurev.fl.23.010191.001401
Blackbourn D. J. (1974). The Feeding Biology of Tintinnid Protozoa and Some Other Inshore Microzooplankton. Vancouver: the University of British Columbia.
Blake J. R., Otto S. R. (1998). Filter Feeding, Chaotic Filtration, and a Blinking Stokeslet. Theor. Comput. Fluid Dyn. 10, 23–36. doi: 10.1007/s001620050049
Buskey E. J., Stoecker D. K. (1988). Locomotory Patterns of the Planktonic Ciliate Favella Sp.: Adaptations for Remaining Within Food Patches. Bull. Marine Sci. 43 (3), 783–796.
Buskey E. J., Stoecker D. K. (1989). Behavioral Responses of the Marine Tintinnid Favella Sp. To Phytoplankton: Influence of Chemical, Mechanical and Photic Stimuli. J. Exp. Marine Biol. Ecol. 132 (1), 1–16. doi: 10.1016/0022-0981(89)90173-1
Calbet A., Saiz E. (2005). The Ciliate-Copepod Link on Marine Ecosystems. Aquat. Microb. Ecol. 38 (2), 157–167. doi: 10.3354/ame038157
Chan K. Y. K., Jiang H., Padilla D. K. (2013). Swimming Speed of Larval Snail Does Not Correlate With Size and Ciliary Beat Frequency. PloS One 8 (12), e82764. doi: 10.1371/journal.pone.0082764
Conover R. J. (1982). Interaction Between Microzooplankton and Other Plankton Organisms. Ann. Inst. Oceanogr. Paris, 31–46.
Crocker J. C., Grier D. G. (1996). Methods of Digital Video Microscopy for Colloidal Studies. J. Colloid Interface Sci. 179 (1), 298–310. doi: 10.1006/jcis.1996.0217
Dadon-Pilosof A., Conley K. R., Jacobi Y., Haber M., Lombard F., Sutherland K. R., et al. (2017). Surface Properties of SAR11 Bacteria Facilitate Grazing Avoidance. Nat. Microbiol. 2 (12), 1608–1615. doi: 10.1038/s41564-017-0030-5
Dimova S., Maes F., Brewster M. E., Jorissen M., Noppe M., Augustijns P. (2005). High-Speed Digital Imaging Method for Ciliary Beat Frequency Measurement. J. Pharm. Pharmacol. 57 (4), 521–526. doi: 10.1211/0022357055777
Dolan J. R., Agatha S., Coats D. W., Montagnes D. J. S., Stocker D. K. (eds) (2012). Tintinntinid Ciliates: an Introduction and Overview. in Biology and Ecology of Tintinnid Ciliates: Models for Marine Plankton. Oxford: Wiley-Blackwell. pp 1–16.
Dolan J. R., Montagnes D. J. S., Agatha S., Coats D. W., Stocker D. K. (2013). The Biology and Ecology of Tintinnid Ciliates. Oxford: Wiley-Blackwell.
Fenchel T. (1980a). Suspension Feeding in Ciliated Protozoa: Functional Response and Particle Size Selection. Microb. Ecol. 6 (1), 1–11. doi: 10.1007/BF02020370
Fenchel T. (1980b). Suspension Feeding in Ciliated Protozoa: Structure and Function of Feeding Organelles. Archiv. Fur. Protistenkunde 123 (3), 239–260. doi: 10.1016/S0003-9365(80)80009-1
Gałecki A., Burzykowski T. (2013). “Linear Mixed-Effects Models Using R,” in Springer Texts in Statistics, vol. 102. (New York: Springer). doi: 10.1007/978-1-4614-3900-4
Gold K. (1973). Methods for Growing Tintinnida in Continuous Culture. Integr. Comp. Biol. 13 (1), 203–208. doi: 10.1093/icb/13.1.203
Gruber D. F., Tuorto S., Taghon G. L. (2009). Growth Phase and Elemental Stoichiometry of Bacterial Prey Influences Ciliate Grazing Selectivity. J. Eukaryotic Microbiol. 56 (5), 466–471. doi: 10.1111/j.1550-7408.2009.00428.x
Guillard R. R. L., Ryther J. H. (1962). Studies of Marine Planktonic Diatoms. Can. J. Microbiol. 8, 229–239. doi: 10.1139/m62-029
Hamels I., Mussche H., Sabbe K., Muylaert K., Vyverman W. (2004). Evidence for Constant and Highly Specific Active Food Selection by Benthic Ciliates in Mixed Diatoms Assemblages. Limnol. Oceanogr. 49 (1), 58–68. doi: 10.4319/lo.2004.49.1.0058
Hansen P. J., Bjørnsen P. K., Hansen B. W. (1997). Zooplankton Grazing and Growth: Scaling Within the 2-2,000-μm Body Size Range. Limnol. Oceanogr. 42 (4), 687–704. doi: 10.4319/lo.1997.42.4.0687
Hansen B., Koefoed Bjornsen P., Hansen J. (1994). The Size Ratio Between Planktonic Predators and Their Prey. Limnol. Oceanogr. 39 (2), 395–403. doi: 10.4319/lo.1994.39.2.0395
Hartmann C., Özmutlu Ö., Petermeier H., Fried J., Delgado A. (2007). Analysis of the Flow Field Induced by the Sessile Peritrichous Ciliate Opercularia Asymmetrica. J. Biomech. 40 (1), 137–148. doi: 10.1016/j.jbiomech.2005.11.006
Johannes R. E. (1965). Influence of Marine Protozoa on Nutrient Regeneration. Limnol. Oceanogr. 10 (3), 434–442. doi: 10.4319/lo.1965.10.3.0434
Jonsson P. (1986). Particle Size Selection, Feeding Rates and Growth Dynamics of Marine Planktonic Oligotrichous Ciliates (Ciliophora: Oligotrichina). Marine Ecol. Prog. Ser. 33 (January), 265–277. doi: 10.3354/meps033265
Jonsson P. R., Johansson M., Pierce R. W. (2004). Attachment to Suspended Particles may Improve Foraging and Reduce Predation Risk for Tintinnid Ciliates. Limnol. Oceanogr. 49 (6), 1907–1914. doi: 10.4319/lo.2004.49.6.1907
Kiørboe T. (2011). How Zooplankton Feed: Mechanisms, Traits and Trade-Offs. Biol. Rev. 86 (2), 311–339. doi: 10.1111/j.1469-185X.2010.00148.x
Kimor B., Golandsky-baras B. (1981). Distribution and Ecology of the Tintinnids in the Gulf of Elat (Aqaba), Red Sea. J. Plankton Res. 3 (3), 445–459. doi: 10.1093/plankt/3.3.445
Kiorboe T., Jiang H., Goncalves R. J., Nielsen L. T., Wadhwa N. (2014). Flow Disturbances Generated by Feeding and Swimming Zooplankton. Proc. Natl. Acad. Sci. 111 (32), 11738–11743. doi: 10.1073/pnas.1405260111
Liron N., Blake J. R. (1981). Existence of Viscous Eddies Near Boundaries. J. Fluid Mech. 107, 109–129. doi: 10.1017/S0022112081001699
Marshall S. M. (1969a). ORDER : TINTINNIDA Family : Codonellopsidae. ICES Identif. Leaflets Plankton 119, 1–7. doi: 10.17895/ices.pub.5097
Marshall S. M. (1969b). ORDER: TINTINNIDA Family: Coxliellidae. ICES Identif. Leaflets Plankton 120, 2–5. doi: 10.17895/ices.pub.5098
Montagnes D. J. S., Barbosa A. B., Boenigk J., Davidson K., Jürgens K., Macek M., et al. (2008). Selective Feeding Behaviour of Key Free-Living Protists: Avenues for Continued Study. Aquat. Microb. Ecol. 53 (1), 83–98. doi: 10.3354/ame01229
Nagai M., Oishi M., Oshima M., Asai H., Fujita H., Nagai M., et al. (2009). Three-Dimensional Two-Component Velocity Measurement of the Flow Field Induced by the Vorticella Picta Microorganism Using a Confocal Microparticle Image Velocimetry Technique Three-Dimensional Two-Component Velocity Measurement of the Flow Field Induced. Biomicrofluidics 3, 014105. doi: 10.1063/1.3105106
Nakamura Y., Suzuki S. Y., Hiromi J. (1996). Development and Collapse of a Gymnodinium Mikimotoi Red Tide in the Seto Inland Sea. Aquat. Microb. Ecol. 10 (2), 131–137. doi: 10.3354/ame010131
Pepper R. E., Roper M., Ryu S., Matsudaira P., Stone H. A. (2010). Nearby Boundaries Create Eddies Near Microscopic Filter Feeders. J. R. Soc Interface 2009, 851–862. doi: 10.1098/rsif.2009.0419
Pierce R. W., Turner J. T. (1992). Ecology of Planktonic Ciliates in Marine Food Webs. Rev. In Aquat. Sci. 6 (2), 139–181.
Rassoulzadegan F., Etienne M. (1981). Grazing Rate of the Tintinnid Stenosemella Ventricosa (Clap. & Lachm.) Jorg. On the Spectrum of the Naturally Occurring Particulate Matter From a Mediterranean Neritic Area. Limnol. Oceanogr. 26 (2), 258–270. doi: 10.4319/lo.1981.26.2.0258
R Core Team (2021). R: A Language and Environment for Statistical Computing. Vienna: R Foundation for Statistical Computing. Available at: https://www.r-project.org/.
Riisgård H. U., Larsen P. S. (2007). Viscosity of Seawater Controls Beat Frequency of Water-Pumping Cilia and Filtration Rate of Mussels Mytilus Edulis. Marine Ecol. Prog. Ser. 343 (1971), 141–150. doi: 10.3354/meps06930
Ryu S., Pepper R. E., Nagai M., France D. C. (2017). Vorticella: A Protozoan for Bio-Inspired Engineering. Micromachines. 8 (1), 4. doi: 10.3390/mi8010004
Spring K. R., Davidson M. W. (2021). Depth of Field and Depth of Focus (Nikon MicroscopyU). Available at: https://www.microscopyu.com/microscopy-basics/depth-of-field-and-depth-of-focus.
Stoecker D. K., Gallager S. M., Langdon C. J., Davis L. H. (1995). Particle Capture by Favella Sp. (Ciliata, Tintinnina). J. Plankton Res. 17 (5), 1105–1124. doi: 10.1093/plankt/17.5.1105
Stoecker D., Guillard R. R. L., Kavee R. M. (1981). Selective Predation by Favella Ehrenbergii (Tintinnia) on and Among Dinoflagellates. Biol. Bull. 160 (1), 136–145. doi: 10.2307/1540907
Van Wambeke F. (1995). Fate of Phaeodactylum Tricornutum and Nitrogen Flow in an Experimental Microbial Food Web Limited at the Top by Protozoans. Aquat. Microb. Ecol. 9 (2), 127–136. doi: 10.3354/ame009127
Keywords: selectivity, cilia, microzooplankton, low reynolds flows, kinematics
Citation: Wandel H and Holzman R (2022) Modulation of Cilia Beat Kinematics Is a Key Determinant of Encounter Rate and Selectivity in Tintinnid Ciliates. Front. Mar. Sci. 9:845903. doi: 10.3389/fmars.2022.845903
Received: 30 December 2021; Accepted: 04 March 2022;
Published: 29 March 2022.
Edited by:
Laura Ann Miller, University of Arizona, United StatesReviewed by:
Alexander Peter Hoover, University of Akron, United StatesChristina Hamlet, Bucknell University, United States
Copyright © 2022 Wandel and Holzman. This is an open-access article distributed under the terms of the Creative Commons Attribution License (CC BY). The use, distribution or reproduction in other forums is permitted, provided the original author(s) and the copyright owner(s) are credited and that the original publication in this journal is cited, in accordance with accepted academic practice. No use, distribution or reproduction is permitted which does not comply with these terms.
*Correspondence: Roi Holzman, aG9sem1hbkB0YXVleC50YXUuYWMuaWw=