 Li Gao
 Xuan Bai
 Yingbin Wang
- 1School of Fishery, Zhejiang Ocean University, Zhoushan, China
- 2Department of Fisheries Science, Chonnam National University, Yeosu, South Korea
Based on the data of Portunus trituberculatus and environmental factors in the northern East China Sea from 2001 to 2014, a Ricker-type model was used in investigating the effects of environmental factors on P. trituberculatus recruitment. The main environmental factors include the area of red tide, sea level height, sea surface salinity, and typhoon landing times with wind forces above 6 near the center. We assumed that the distributions of environmental data vary and selected AIC, BIC, and maximum likelihood as criteria for the selection of the best distribution of each environmental factor. Environmental factor data were simulated according to the distributions (repeated 10,000 times). The Ricker model with ln-linear environmental impact was used in predicting the recruitment of P. trituberculatus under different combinations of various environmental factors for a given spawning stock biomass. Results show that the predicted recruitment abundance most likely appears between 10 × 103 and 15 × 103 million individuals, and the probability is approximately 39.56%. The environmental condition in which the four environmental factors have the best and worst combinations was also simulated. Our results indicate that red tide and typhoon are the two dominant factors affecting the recruitment of P. trituberculatus. The results show that at the 5% significance level, if the recruitment is less than 6.394 × 10³ million individuals, then it is probably under a bad environment condition. Similarly, if recruitment is more than 28.305 × 10³ million individuals, then it is probably under a good environmental condition. This study provides a technical reference for the scientific prediction and management of P. trituberculatus and other fishery resources subjected to various environmental conditions.
1 Introduction
Portunus trituberculatus, an important commercial crab, is widely distributed on the coastal waters of South Korea, Japan, and China (Secor et al., 2002; Sugilar et al., 2012). However, the yield of P. trituberculatus in China (catch in the East China Sea area accounts for nearly 50% of the total catch in China) accounts for approximately 90% of the world’s total amount. In recent years, owing to the high-intensity utilization of P. trituberculatus, fluctuations in its resources has attracted considerable attention. An analysis of the main economic crab in the north-central part of the East China Sea, as well as existing resources and maximum sustainable yield, shows that P. trituberculatus in the area has reached the level of overexploitation (Yu et al., 2004).
Recruitment, which is impacted by spawning stock biomass (SSB) and environmental factors, directly affects catch. Therefore, analyzing the factors that influence P. trituberculatus recruitment is necessary for the sustainable utilization and management of its resources (Gilbert, 1997; Arnott and Ruxton, 2002; Kurota et al., 2020). Fluctuations in P. trituberculatus catch are caused by sudden increases in the number of megalopa juveniles, which have a high survival rate (Shiota, 1993). Barrowman and Myers (1996) found a positive association between recruitment and SSB and argued that a low SSB leads to low recruitment. When fecundity and recruitment decrease, the probability of fishery resource recruitment failure increases, and the population’s adaptability to environmental randomness decreases (Lipcius and Stockhausen, 2002).
However, some researchers have a different view and believe that changes in the number of fishery resource recruitment are largely affected by living environment conditions (Hjort, 1914; Planque and Frédou, 1999; Chen and Irvine, 2001; Bian et al., 2018), especially in the spawning season; thus, the influences of environmental factors on recruitment should be considered (Sakuramoto et al., 2010). The recruitment of fishery resources, such as Gadus, Sardina pilchardus, P. trituberculatus, and some small pelagic fish are significantly affected by environmental changes (Yasuda et al., 1999; Solow, 2002; Santojanni et al., 2006; Ariyama and Secor, 2010; Shentu et al., 2015). Sakuramoto (2005) emphasized that introducing environmental factors into the study of S–R relationship is necessary for exploring dynamic changes in fish populations.
Normally, compared with the other traditional S–R model, the Ricker model has a more obvious response to an environment and has been widely used in studying fish population dynamics (Wilderbuer et al., 2002; Zhang et al., 2010). Zheng and Kruse (2003) directly added environmental factors into the Ricker model to establish a novel S–R model for the three species of Alaskan crab. Moreover, the extended Ricker model has been used in studying the effects of environmental factors (sea surface temperature) and spawning stock on the recruitment of Sardinops melanostictus and Scomber japonicus, and the results showed that environmental impacts can be divided into favorable and unfavorable impacts, which can change under certain circumstances (Yatsu et al., 2005). Nonetheless, the living environments of organisms are complex systems, which contain multiple environmental factors, and thus many problems in the field of S–R relationship research of fishery resources remain unresolved. Studying the relationship between recruitment and environmental factors has become one of the most important and difficult tasks in current resource assessment (Hilborn and Walters, 1992).
Although many studies have been conducted on P. trituberculatus, they were mainly focused on the impact of biomass or a single environmental factor on recruitment. The probability of recruitment under the impacts of different combinations of environmental factors has not been studied. In our previous work, we assessed the impact of environmental factors on the recruitment of P. trituberculatus and developed two environmentally sensitive Ricker-based S–R models, namely, the Ricker model with ln-linear environmental impact and the Ricker model with ln-quadratic polynomial environmental impact (Gao and Wang, 2021). The former can better describe the recruitment of P. trituberculatus under the impacts of environmental factors. Thus, the Ricker model with ln-linear environmental impact was selected as the optimal form describing change in recruitment under the impacts of environmental factors. Then, we predicted the probabilities of P. trituberculatus recruitment under different combinations of environmental factors on the basis of extreme environmental conditions (the best and the worst combination of environmental factors).
2 Materials and methods
2.1 Research data
This study used P. trituberculatus collected from the northern East China Sea during May 2015 to May 2016 as experimental samples (mainly from crab pots, gill nets, and single otter trawl vessels). Biological data (carapace width, carapace length, body weight, and gender) were obtained by statistical measurement of the samples and grouped based on carapace width (CW, mm). Furthermore, the structural composition of P. trituberculatus in the survey area (Figure 1) was determined by measuring the mean weight and proportion of individuals in different groups. Therefore, recruitment of P. trituberculatus was defined in this study as crabs with carapace widths in the range of 60–80 mm (Gao and Wang, 2021). On the basis of information obtained from the survey data of P. trituberculatus between 2015 and 2016, the annual spawning stock and recruitment were estimated. Furthermore, catch data from 2001 to 2014 were obtained from the Zhejiang Provincial Statistical Yearbook and the Zhoushan Fisheries Bureau (unpublished). Vogt (2012) suggested that the most widespread method for determining the age of wild population of crustaceans is to analyze the length–frequency distribution. Therefore, the age of P. trituberculatus was calculated based on the carapace width in this study. We assumed that there is no significant interannual change in the CW composition of P. trituberculatus (Gao and Wang, 2021). Recruitments during 2001 and 2014 were calculated from the catch data according to the ratio of carapace width in the survey samples. According to the catch data, Eq. (1) and Eq. (2) were used in calculating the abundance of P. trituberculatus each year:
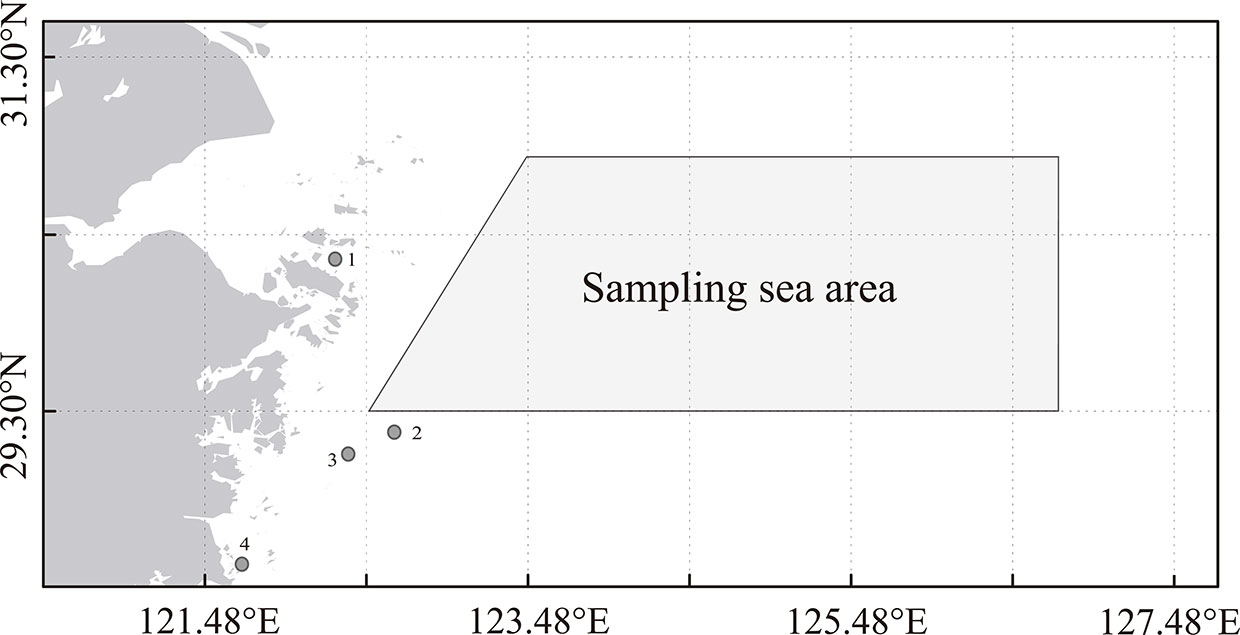
Figure 1 Map of sampling area of P. trituberculatus during 2015 and 2016 (Gao and Wang, 2021). [The points in the figure represent the enhancement and releasing areas centered on Zhoushan (1), Ningbo (2), Taizhou (3), and Wenzhou (4).
where N represents the abundance of P. trituberculatus, Z represents the coefficient of total mortality, Δa represents the range of ages, i.e., the time course it has undergone, a, represents a certain age, C represents catch, Se represents the selectivity of fishing gear, L represents the body width, and a represents age. The parameters introduced by Wang et al. (2017b), including coefficient of natural mortality (M) and coefficient of fishing mortality (F), were used.
In recent years, the scales of the stock enhancement and release (Figure 1) of P. trituberculatus have been increasing, and the species has gradually become an important enhancement species (Ariyama, 2000; Xie et al., 2014; Liu et al., 2016). P. trituberculatus enhancement and releasing have considerable impacts on natural populations (Hamasaki et al., 2004). Thus, in the analysis of impacts on the environmental factors of S–R relationship, the effects of enhancement and releasing must be eliminated. Releasing data from 2011 to 2015 were obtained from fishery management departments. Because the quantities of P. trituberculatus releasing were relatively small before 2011, releasing records were incomplete in those years. Accordingly, based on the number of enhancements and releases in 2011, we inversely calculated the enhancement and releasing data of P. trituberculatus from 2001 to 2010 (the releasing number in the second year was supposed to be 10% higher than that of the previous year according to the consultation of the fishery management department). We then used Eq. (1) to calculate recruitments from the releasing group for corresponding years and excluded them from the total recruitment data.
The marine environmental data of the sea level height and sea surface salinity were derived from National Oceanic and Atmospheric Administration (NOAA)1, and the temporal resolution was annual average by month; the data of the red tide area were derived from the China Ocean Yearbook, which takes the total area of red tide occurrence along the coast of Zhejiang Province as an index; The total landing times of the typhoon with wind force above 6 near the center (Ying et al., 2014) landing in Zhejiang Province are taken as the typhoon index, the data were obtained from the typhoon data website2, and the time resolution is year. The time series of environmental factors is from 2001 to 2014 (because of the lag of the environmental impact on the recruitment, the recruitment of the current year may be influenced by the environment of the previous year). Thus, except for sea surface salinity, other environmental data correspond to the annual lag of the recruitment.
2.2 Analyses
2.2.1 Ricker-type S-R model
In previous studies, we analyzed the relationship between environmental factors and recruitment of P. trituberculatus and compared different Ricker-type models with different environmental factors. Based on the traditional Ricker model, two Ricker-type S–R models (ln-linear environment and ln-quadratic polynomial environmental models) considering environmental factors were established (Gao and Wang, 2021). Moreover, when establishing the Ricker-type models, the environmental condition indices were used instead of α in the traditional Ricker model, and multiplication and addition calculations were performed separately (Gao and Wang, 2021).
Gao and Wang (2021) indicated that the Ricker-type model with environmental factors, compared with the traditional Ricker model, is more accurate in describing the S–R relationship of P. trituberculatus. Meanwhile, the Ricker-type model with ln-linear environmental impact performs better than that with ln-quadratic polynomial environmental impact. The former model expression was as follows:
where Rt+1 represents the recruitment in the next year and St represents the spawning stock biomass in year t. α (the index that independent of stock death) and β (the index that depends on stock death) are parameters in the model. α1,α2,α3, andα4 represent the coefficients of the four marine environmental factors [area of red tide area (AORT), sea level height (SLH), sea surface salinity (SSS), and typhoon landing times (TYP), respectively]. Moreover, ϵ is the error structure that have the log normal distribution relationship, ϵ ~N (0, σ2 ).
Therefore, in this study, we selected the Ricker-type model with ln-linear environmental impact and four environmental factors for our assessment model (Table A1 in Appendix A provides a detailed model summary):
2.2.2 Simulation environmental factor combination
The degree of occurrence of environmental factors varied; for example, the occurrence probabilities of one typhoon and three typhoons in a year are not equal, and the probability for the latter is usually lower than the former. Therefore, to ensure the accuracy of the environmental data simulation in the study, we analyzed the distribution of the four environmental factors from 2001 to 2014.
The MASS package in R (Version 3.5.3), which provides the function of checking the distribution of single variables for different types of data, were used in evaluating the distributions of the four environmental factors (methods including maximum likelihood, moment matching, quantile matching, and t-test were used) (Delignette-Muller and Dutang, 2015). In the current study, each environmental factor was assumed to be one of the five hypothetical distributions (Weibull, gamma, normal, exponential, and log-normal distributions). We used the fitdistrplus function in the MASS package to fit multiple distributions (parameter θ∈Rd) to the environmental data set. In this way, the optimal distribution of each environmental factor can be determined. The distribution parameter was estimated using the maximum likelihood function with the following formula:
where θ represents the parameter of the distribution, xi represents the ith observed value of the variable x, and f( .|θ) represents the density function of the distribution of the parameter.
We used the corresponding distribution functions to simulate (repeated 10,000 times to maximize accuracy, i.e., sufficient environmental simulation data for subsequent research) environmental data according to the distributions of the four environmental factors. Given that the annual SSB of P. trituberculatus in the natural environment also varied, we assumed that the SSB followed a normal distribution and randomly generated a spawning stock with a normal distribution (μ is equal to the average value of SSB from 2001 to 2014, and the resulting sd = 0.882 × 10³ million individuals was obtained from the analysis of the observation data of spawning stock biomass). Origin-pro (Version 2020) was used in analyzing the influences of different combinations of environmental factors on recruitment at a given spawning stock level. Recruitments predicted by the Ricker-type model were analyZed and fitted. We also analyZed the required SSB at a given P. trituberculatus recruitment level and the effects of extreme environmental factors on it.
2.2.3 Probability analysis of the combination of environmental factors
We assumed that the probability of the occurrence of each extreme environmental factor accounts for 5% of the total; that is, data smaller than the first 5% quantile and larger than the 95% quantile of environmental data were selected as extreme environments (Qi and Cai, 2019). Then, probability analyses were performed for the combination of the two kinds of extreme environmental conditions. The MASS package in R was used to fit the distribution of predicted recruitment, and the density function curve and cumulative distribution function (CDF) (Appendix A) were obtained.
The combinations of the best and worst environmental factors were screened step by step in the simulated data, then the probabilities of their occurrence were obtained. In addition, the probability of recruitment occurring at a given SSB level under the combined influence of environmental factors was also obtained. To quantify the relationship between SSB and recruitment, we tested the distribution of predictive recruitment for the complex changes of environmental factors. The probabilities of the occurrence of recruitment of P. trituberculatus for the two extreme cases were calculated.
In this study, we also provide a detailed flowchart to clearly explain the research process (Table A1).
3 Results
3.1 Simulation analyses
3.1.1 Simulation results of environmental factors
The fitting results of the distribution of environmental factors are shown in Table 1 and Figure 2. In each environmental distribution fitting, only one distribution simultaneously meets the selection criteria [minimum AIC, BIC value (Appendix B), and the maximum likelihood value)], which is the optimal distribution of environmental factors (Table 1). Additionally, histograms and theoretical density, quantile–quantile plot (Q–Q plot), empirical and theoretical CDFs, and probability–probability plot (P–P plot) visually showed the difference and similarity of the fitting of the hypothetical distribution to the prediction data (Figure 2). The results show that the most suitable distribution of the area of red tide and sea surface salinity is the Weibull distribution. In contrast, the most suitable distribution of sea level height and typhoon landing times is normal distribution and exponential distribution, respectively.

Table 1 Comparison of fitting results of different distributions of environmental factors.
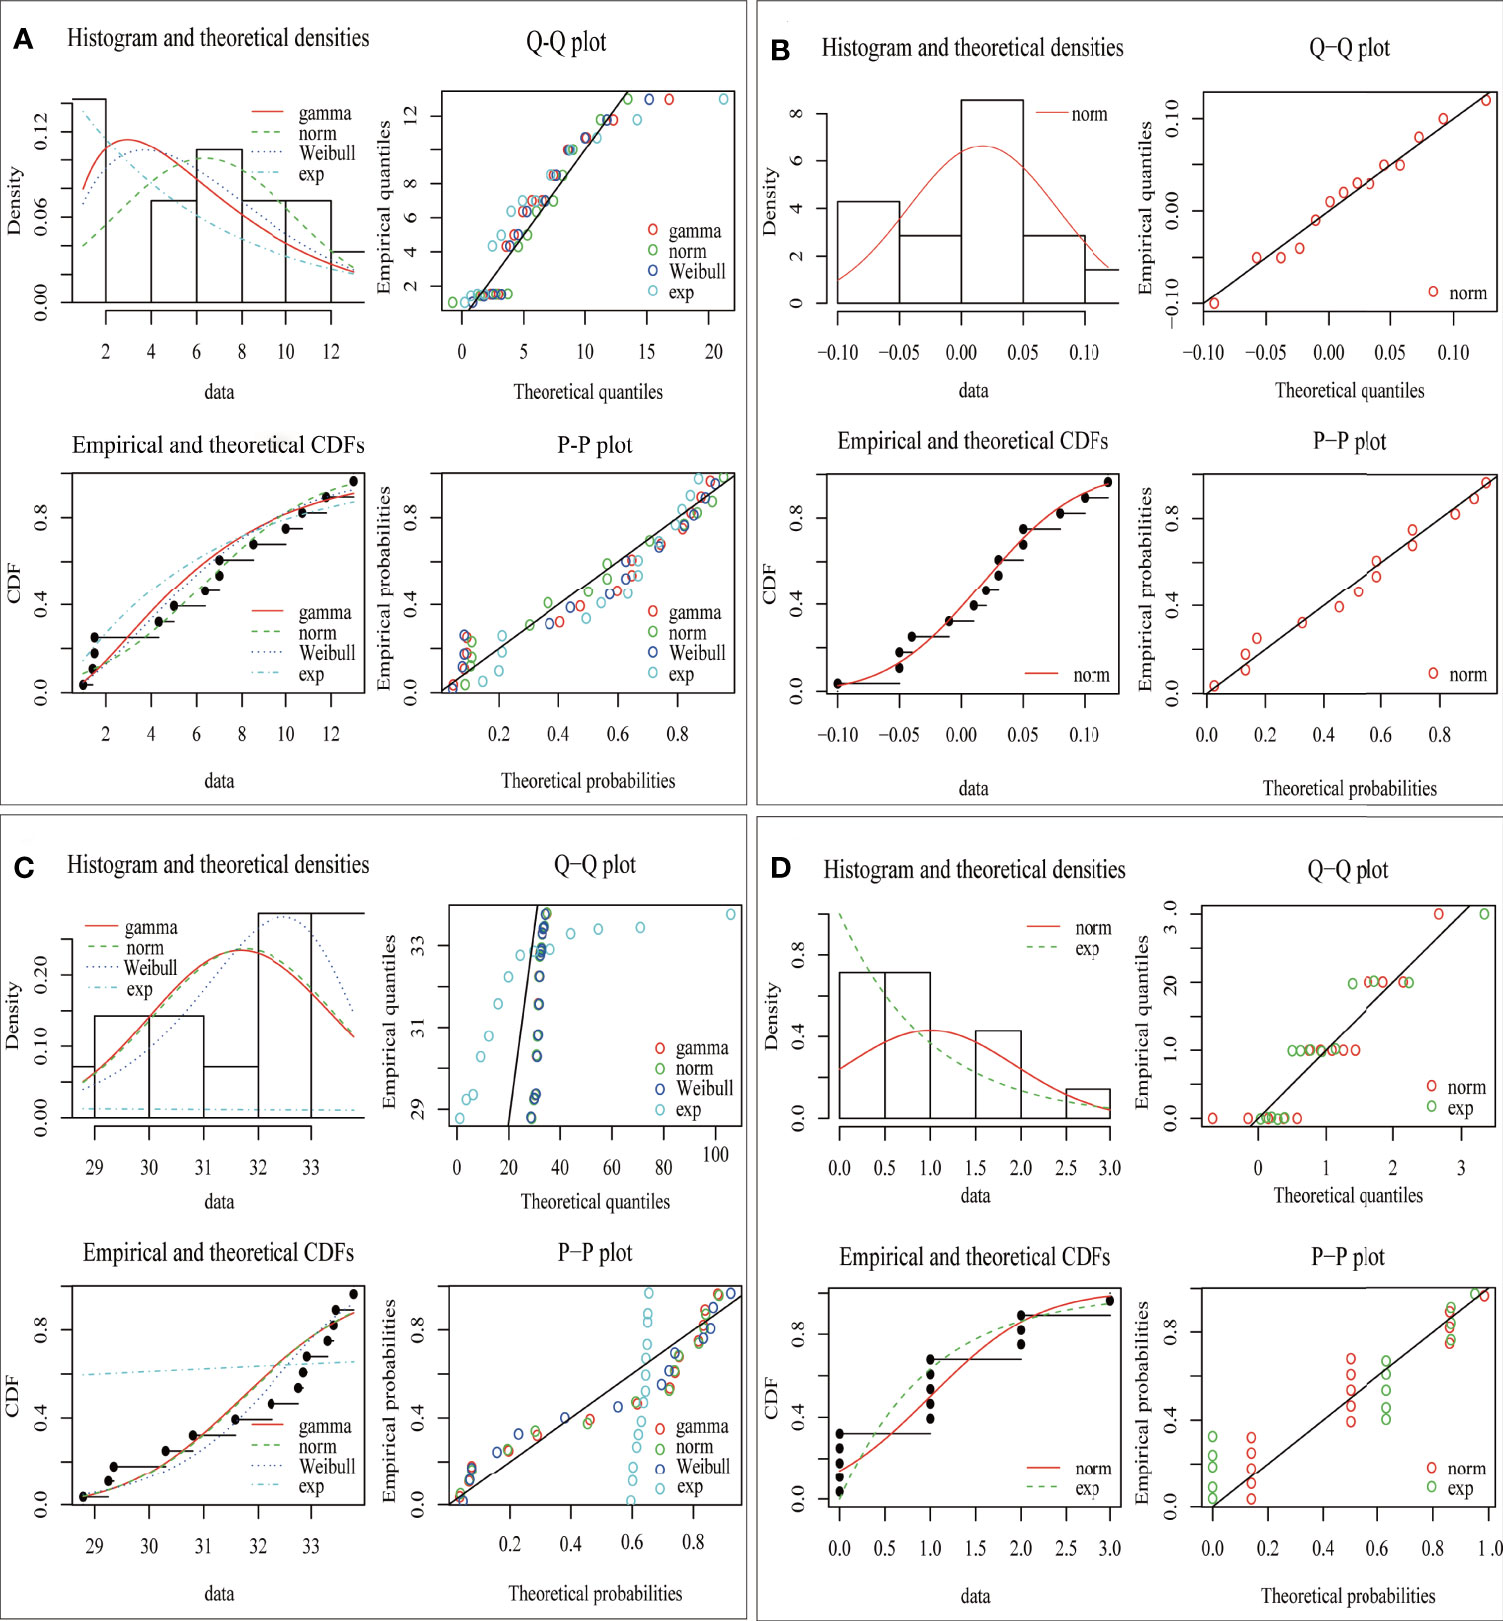
Figure 2 Distribution of simulated data of four environmental factors from 2001 to 2014. (A) Red tide area, (B) sea level height, (C) sea surface salinity, and (D) typhoon landing times.
3.1.2 Distribution selection of recruitment prediction
In Figure 3, the Monte Carlo simulation origin (observations displayed as circular points) falls on the dotted line representing the log-normal distribution, which indicates that the predicted recruitment (Ȓ) of P. trituberculatus under the comprehensive effect of the environment is log-normally distributed. The meanlog and sdlog, the location and scale parameters associated with the log-normal distribution, are 2.599 and 0.380, respectively. These parameters are the mean and standard deviation of the logarithm of the recruitment. The fitting results show that the skewness is 1.125, and the kurtosis is 5.458.
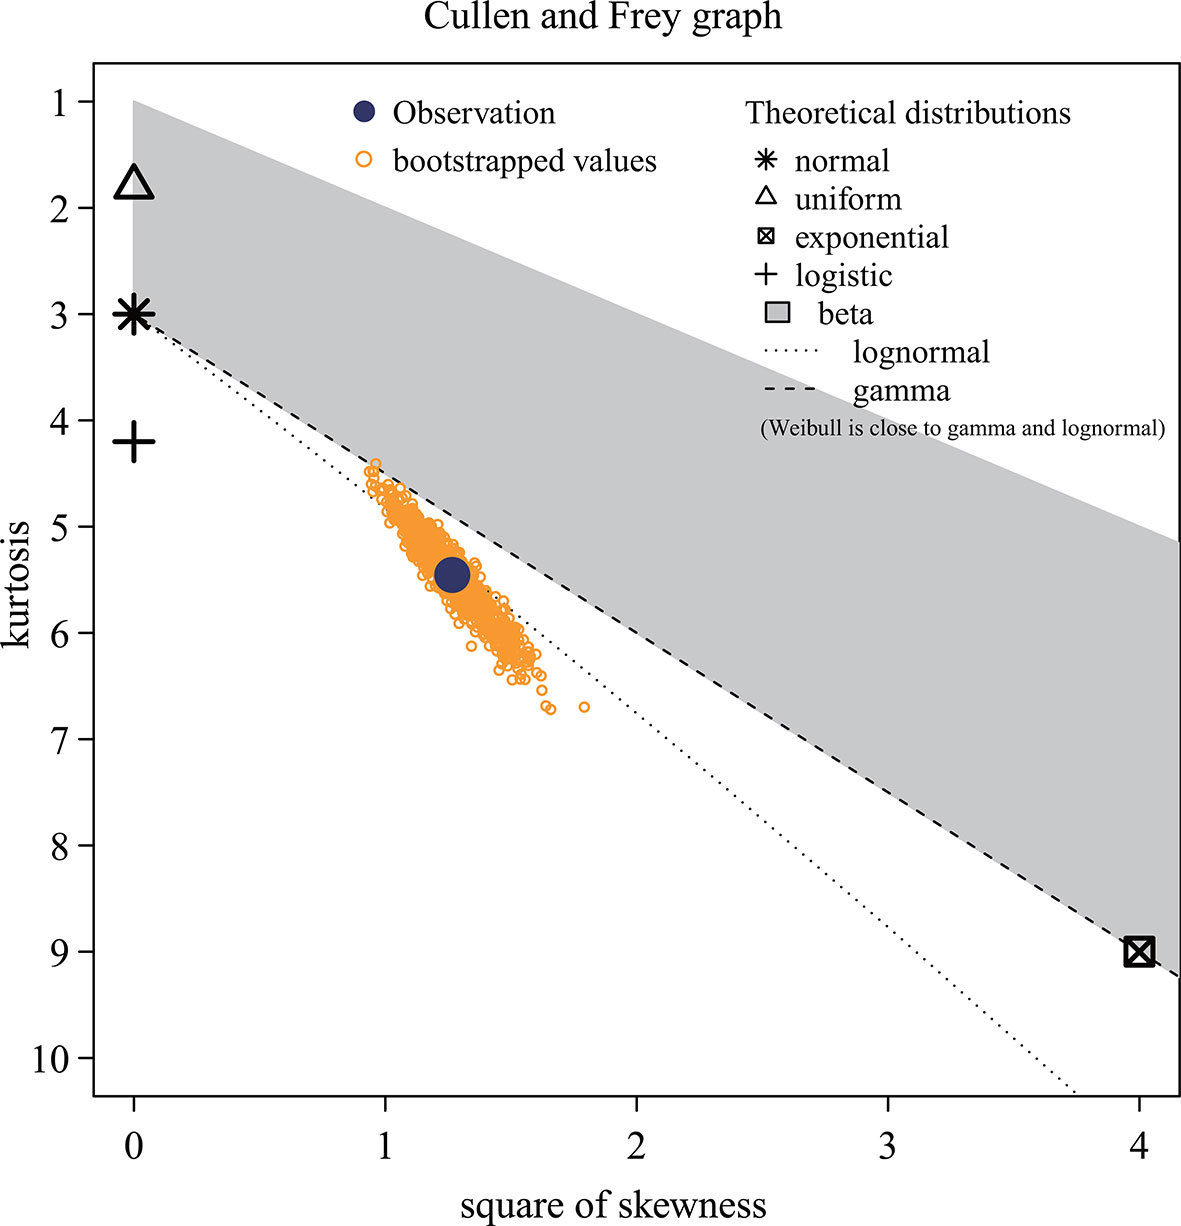
Figure 3 Distribution of projected recruitment data. These yellow dots represent the step values, while the different symbols represent the various distribution models. The distribution type of the data is the theoretical distribution represented by the nearest symbol of the observed value (blue solid dots). The horizontal and vertical axes indicate skewness and kurtosis, respectively.
3.2 Comprehensive changes in the environmental factors
3.2.1 Different combinations of environmental factors
The results in Figure 4 show that the impact of different environmental combinations on the recruitment varies because the environmental factors change every year. Four environmental factors change synchronously, but the red tide area and typhoon have obvious influences on recruitment (Figure 4). The reason may be that the red tide area and typhoon are marine disaster environments, which can have sudden and destructive effects on the survival of P. trituberculatus. Apart from red tide, typhoon is a main factor affecting the recruitment of P. trituberculatus. When the frequency of typhoon reaches its maximum, recruitment changes greatly even if other environmental factors are in a relatively good combination (situations that minimally affect the dynamic of recruitment). Sea surface salinity (the optimal salinity of P. trituberculatus is approximately 28–35) affects the recruitment of P. trituberculatus. The results in Figure 4 show that the recruitment of P. trituberculatus increases with salinity, and recruitment tends to decrease when salinity reaches 35. The reason is that high and low salt can affect the feeding of P. trituberculatus and even cause death.
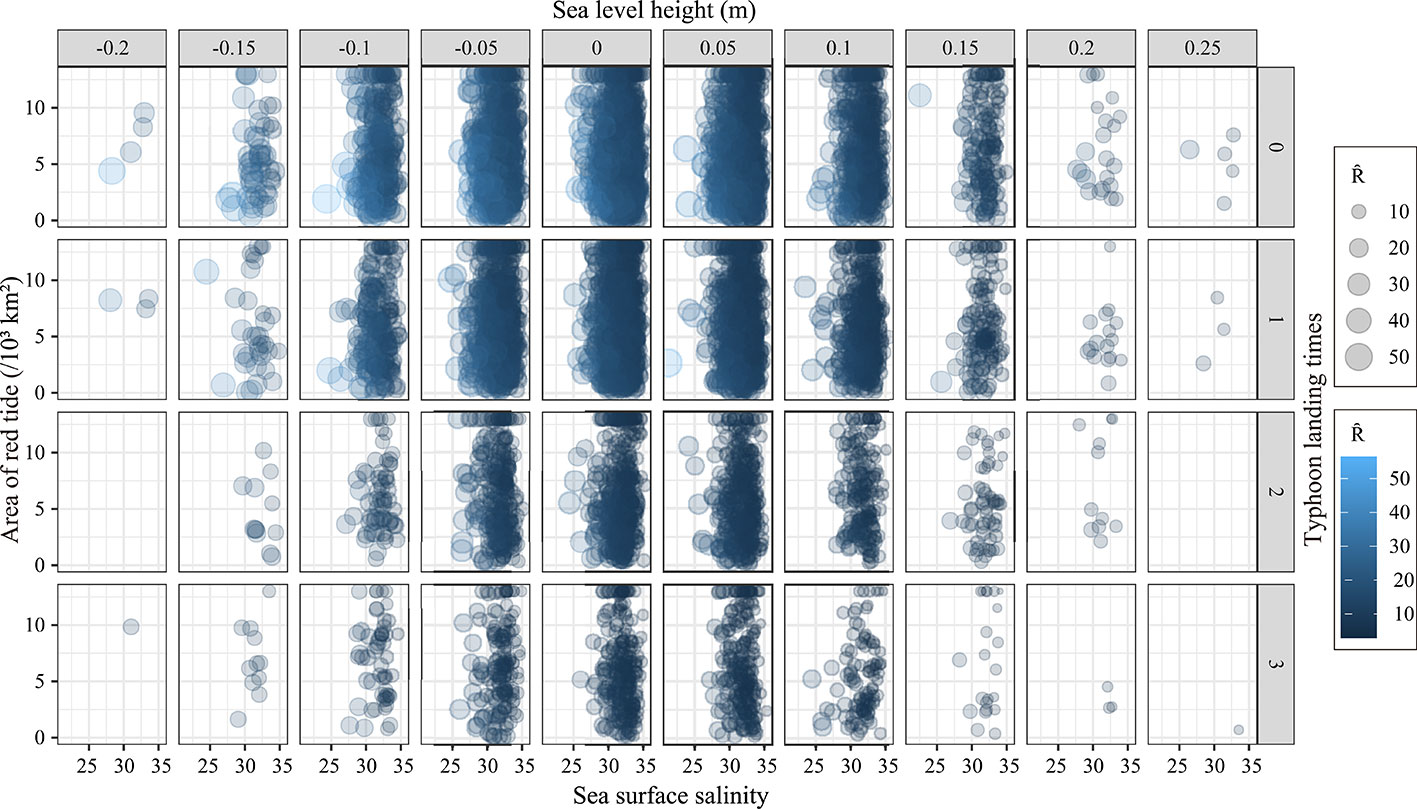
Figure 4 Combined effects of environmental factors on the recruitment of Portunus trituberculatus.
3.2.2 Recruitment under the condition of given spawning stock biomass
Under the premise of controlling for environmental variables (selecting the average value), the effects of changes in the other two environments on the recruitment are shown in Figure 5. The results demonstrate that the variation range of P. trituberculatus recruitment abundance is from 5.50 × 10³ million individuals to 28.50 × 10³ million individuals when the average values of the red tide area and the sea level height were used. The recruitment value reaches its maximum when the frequency of typhoon landfall times is 0, and the maximum recruitment value is 28.50 × 10³ million individuals (Figure 5A). Meanwhile, recruitment decreases with the increasing frequency of typhoon landfall and sea surface salinity. When the landfall frequency of typhoon is 2, and sea surface salinity is 31, the recruitment of P. trituberculatus is approximately 11.25 × 10³ million individuals. Similarly, the interaction of sea level height with the typhoon landing times (Figure 5B) and sea surface salinity (Figure 5C), respectively, led to fluctuations in the recruitment of P. trituberculatus within a certain range. The maximum recruitment of P. trituberculatus was 24.25 × 10³ million individuals and 28.70 × 10³ million individuals, respectively. When the sea level height is 0 m, the recruitment under the influence of typhoon landing times and sea surface salinity is 17.58 × 10³ million individuals and 23.33 × 10³ million individuals, respectively. Based on the above results, we know that the typhoon has a greater impact on the recruitment than sea surface salinity.
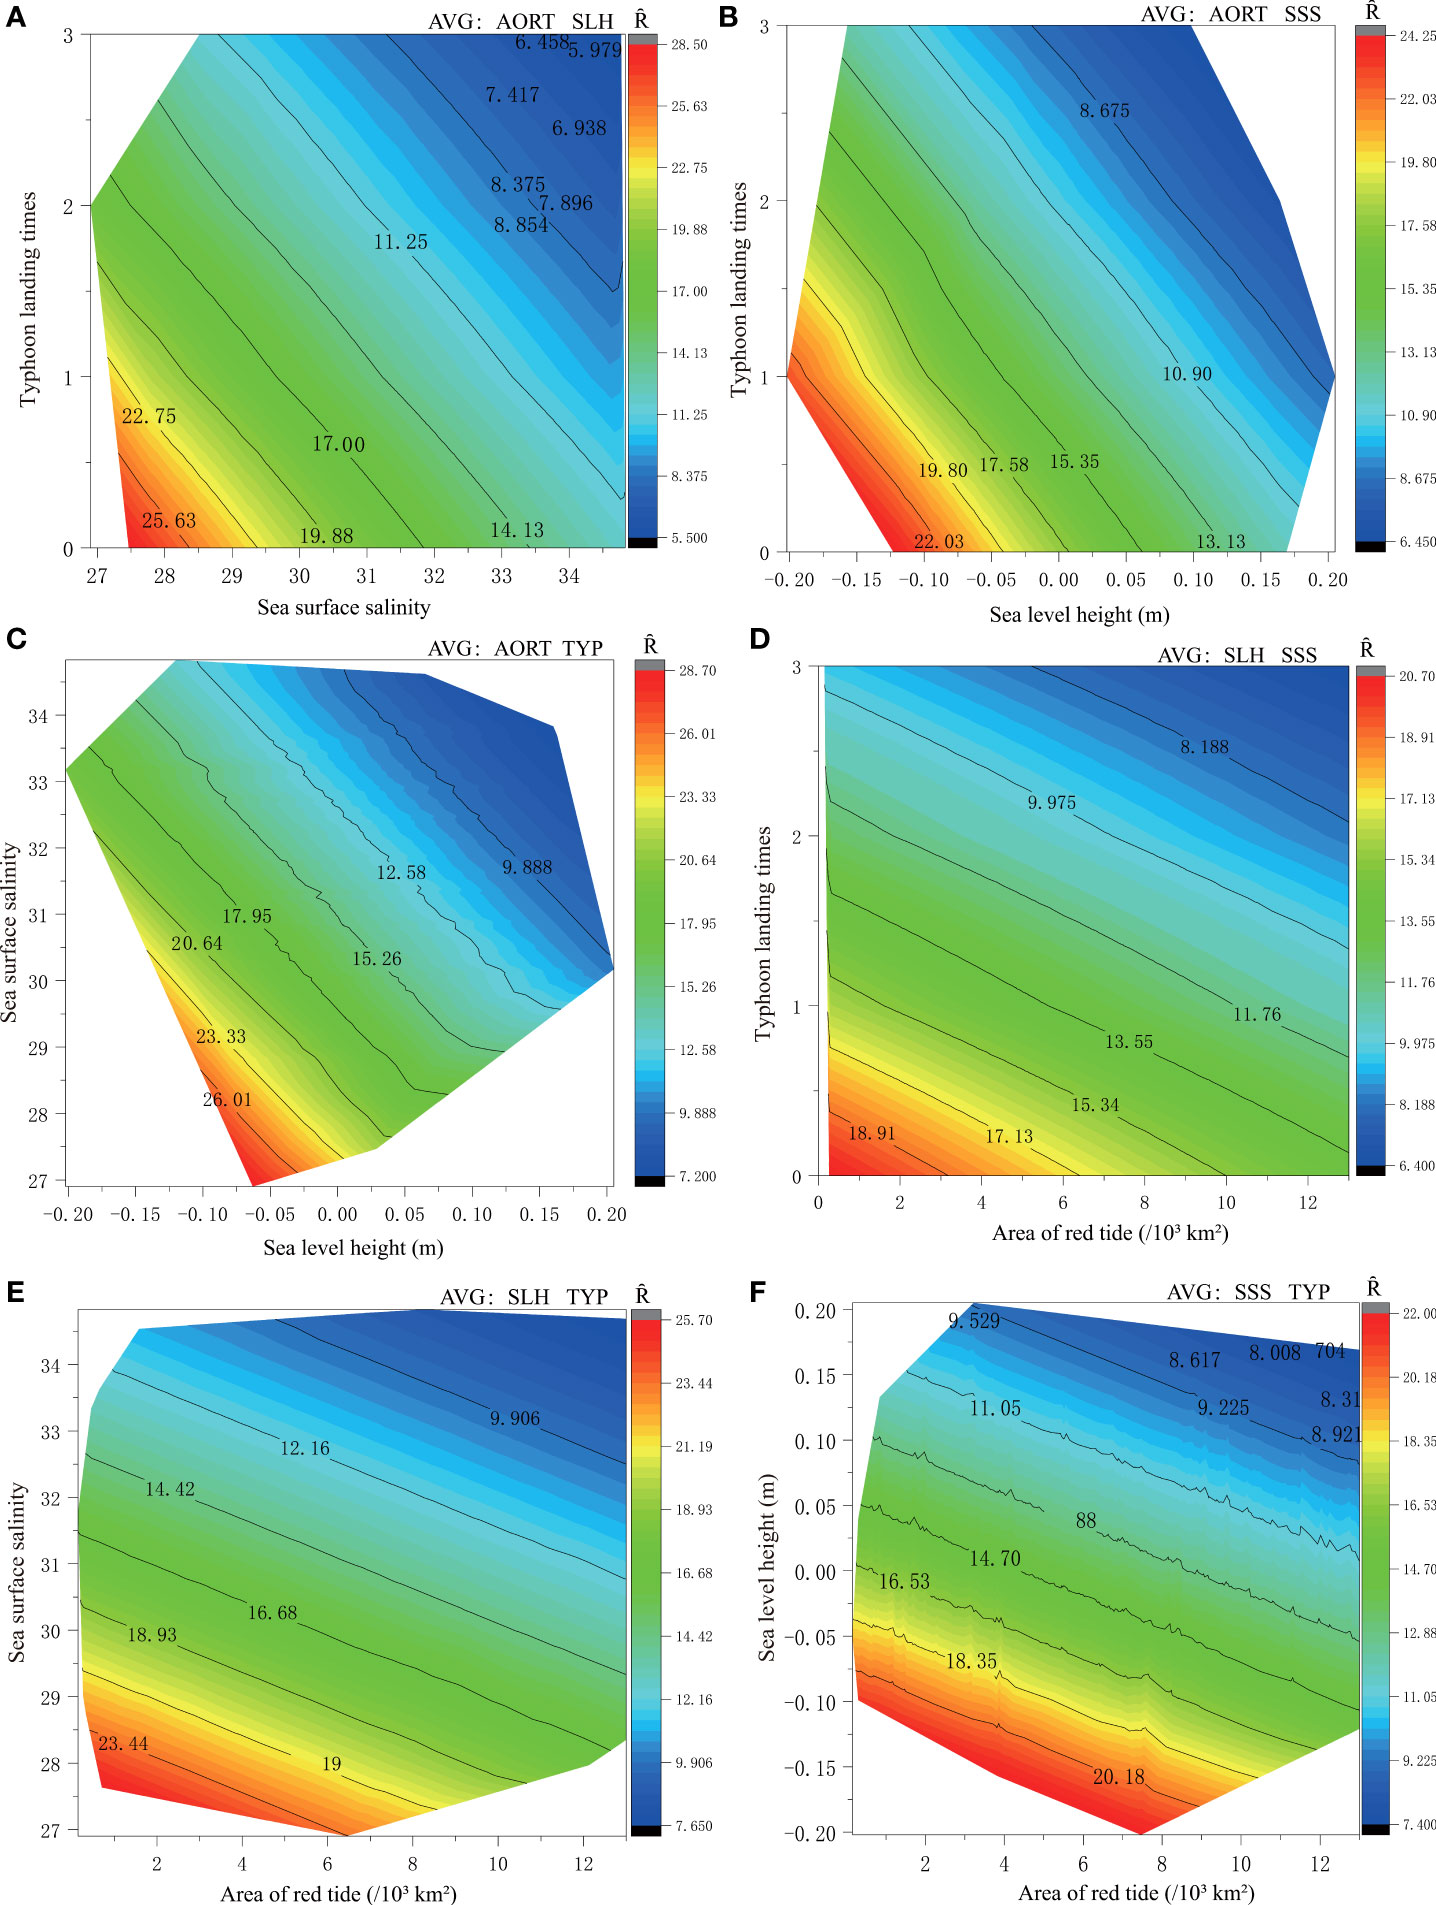
Figure 5 Contour map of recruitment with different environmental factors combinations. Note: At a given spawning biomass level (average value of 6.008 × 10³t), choose to control two environmental variables (average value: AORT (6.367×10³km2), SLH (0.017 m), SSS (31.77) and TYP (1)) to study the effect of a combination of two other different environments on recruitment. The control variables were selected as follows: When the red tide area (AORT) is the mean, it can be combined with the mean of the sea level height (SLH) (A), sea surface salinity (SSS) (B), and typhoon landing times (TYP) (C) respectively to become the control variable; When SLH is the mean, it can be combined with the mean of SSS (D) and TYP (E), respectively, to become the control variable; Finally, SSS and TYP were averaged as control variables (F). Ȓepresents the predicted value of recruitment.
When any two of the environmental factors affecting the P. trituberculatus recruitment are set to their average values, different combinations of the other factors are obviously constrained by the change of another two environmental factors. Typhoon landfall times, sea surface salinity, and sea level height combine with red tide area successively. Therefore, the effect of the combination of red tide area and different environmental factors on recruitment were analyZed. The results show that when the red tide area was ignored, under the effects of typhoon landfall times, sea surface salinity, and sea surface height, the P. trituberculatus recruitment is approximately 20.70 × 10³ million individuals (Figure 5D), 25.70 × 10³ million individuals (Figure 5E), and 22 × 103 million individuals (Figure 5F), respectively.
3.3 Probability analysis
3.3.1 Probability of extreme environmental condition
The histogram in Figure 6 shows the simulated frequency distribution of environmental factors, and the scatter plot shows the variation in recruitment under the influence of each environmental factor at different frequencies. Strictly speaking, the greater the frequency of environmental factors in a certain range is, the denser the distribution of recruitment is. The results show that the highest frequency of red tide area is 2 × 10³km2 to 4 × 10³ km2 (21%), and the recruitment distribution in this range is denser than the recruitment distributions in other ranges (Figure 6A). When the sea level height is 0–0.05 m, the highest probability is approximately 6% (Figure 6B). The highest probability of salinity appears in the range of 32–33, accounting for nearly 20% (Figure 6C). The landfall times of typhoon level 6 and above less than or equal to 1 annually are the most common, accounting for 80% of the total (Figure 6D).
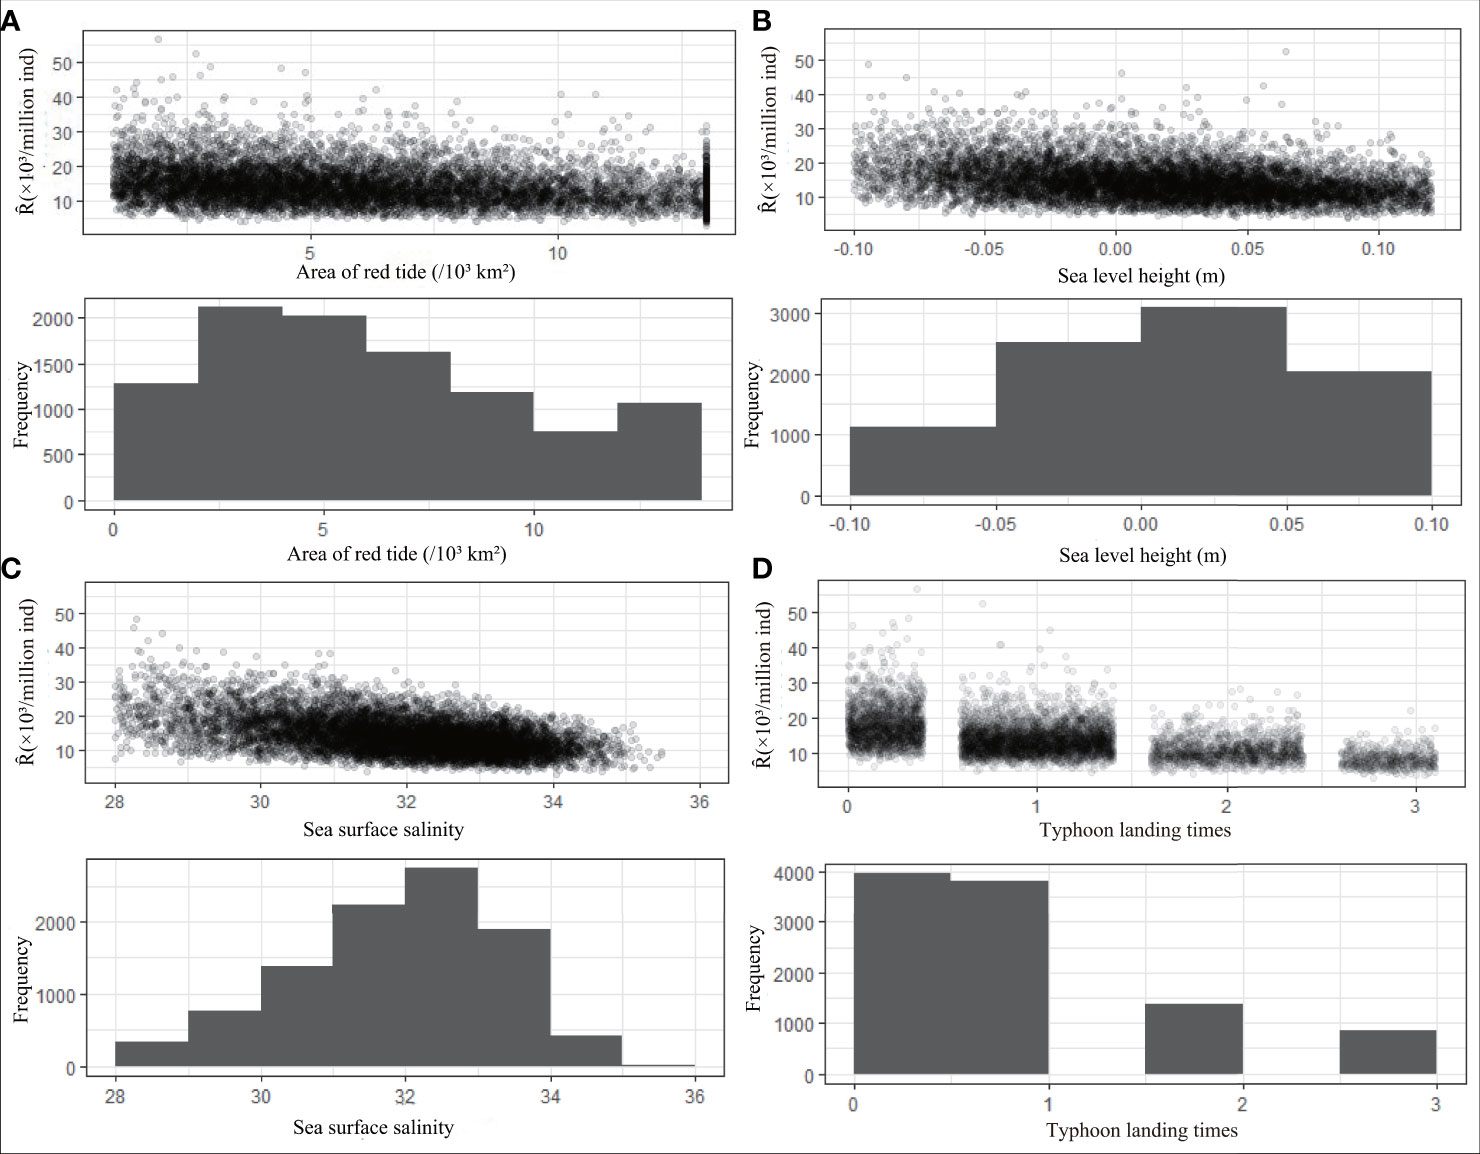
Figure 6 Frequency distribution histogram of the simulation results of environmental factors and the scatter plot between environmental factors and Ȓ (Predicted value of recruitment). It describes the frequency of environmental factors area of red tide (A), sea level height (B), sea surface salinity (C), typhoon landing times (D) in different groups, and the responses of Ȓ under varying degrees of changes in each environmental factor.
In general, the recruitment of P. trituberculatus decreases with increasing red tide area, landfall frequency of typhoons, sea surface salinity, and sea level height until it reaches its lowest value (Figure 6). When the environmental factors reach an optimal combination, red tide area, sea level height, sea surface salinity, and typhoon landing frequency are approximately 1.08 × 10³km2, −0.084 m, 28.8, and 0, respectively. For the worst combination, the four environmental factors are approximately 13 × 103km2 (red tide area), 0.119 m (sea level height), 33.948 (sea surface salinity), and 3 (typhoon landing times).
3.3.2 Probability of recruitment under the influence of environment
As a result of the comprehensive changes of environmental factors, the predicted recruitment fluctuates within a certain range. The minimum for the recruitment abundance is 4.79 × 10³ million individuals, and the maximum is 34.99 × 10³ million individuals. According to the analysis results, the probability of the worst and the best environmental conditions (the lower and upper 5% proportions) are 2.02% and 1.92%, respectively.
The histogram and density estimate in Figure 7 show that the probability density (8%) of the P. trituberculatus recruitment abundance is between 10 × 103 and 15 × 103 million individuals. In addition, the difference in CDF in the empirical accumulation distribution with 15 × 103 million individuals CDF minus 10 × 103 million individuals is consistent with the above calculation results. The probability of a randomly selected P. trituberculatus recruitment abundance between 10 × 103 and 15 × 103 million individuals is approximately 39.56%. The results indicate that if the recruitment abundance is at a low level, that is, below 5 × 10³ million individuals, P. trituberculatus resources may be at risk. When the recruitment is 5 × 10³ million individuals, the probability of extreme environment (the best or the worst) under the combined change of various factors has a possibility of 0.4%. The critical points of the recruitment abundance of P. trituberculatus is 6.394 × 10³ million individuals (α = 0.05) for the worst environmental combination and 28.305 × 10³ million individuals for the best environmental combination. In other words, if the recruitment abundance of P. trituberculatus is less than 6.394 × 10³ million individuals or higher than 28.305 × 10³ million individuals, it may have experienced the worst or best environmental condition (with α = 0.05).

Figure 7 Histogram and CDF plots of an empirical distribution for a continuous variable.
4 Discussion
4.1 Dynamics of environmental factors
To understand the variations on fishery resources, it is necessary to conduct the stock assessment. The relationship between environmental conditions and biological recruitment is one of the critical points. Gao and Wang (2021) indicated that multiple environmental variables are more accurate for the assessment of the impacts of environmental factors on the recruitment of P. trituberculatus. This result is consistent with the results of Williams and Quinn (2000), who reported that multiple environmental variables show significant improvements in model prediction accuracy compared with single environmental variable models.
The interactions of several environmental factors produce joint effects, which, in turn, affect fishery resources. For example, frequency, area, and the duration of each occurrence of red tide vary because of their individual characteristics, and may also be affected by other environmental factors such as air pressure, water temperature, strong typhoon, and ocean current. In this study, we found that the different combination levels of environmental factor have different effects on the stock–recruitment relationship. In Figure 4, red tide area and typhoon landing times have significant impacts on the recruitment of P. trituberculatus, and typhoon landing times remarkably fluctuate. Strictly speaking, both factors are marine disaster factors and can cause huge natural disasters. We used the probability method to analyze the combination of various environmental factors and extreme environment conditions to fully consider the uncertainty of environmental changes.
4.2 Mechanisms for the impact of typhoons on recruitment
Our results indicate that red tide and typhoon are the two dominant factors affecting the recruitment of P. trituberculatus. Different environmental combinations have different effects on the recruitment of P. trituberculatus. Regardless of how red tide area changes, the recruitment of P. trituberculatus is always at the minimum level under the influence of typhoon landing times. Ariyama and Secor (2010) found that the frequency and timing of typhoons may promote the recruitment of P. trituberculatus. In contrast, our research indicates that typhoons have the largest impact on P. trituberculatus recruitment to cause recruitment failure.
The influence of typhoons on the recruitment of P. trituberculatus is mainly reflected in two aspects. On the one hand, the passage of typhoons can affect the marine environment in which the P. trituberculatus live, leading to population changes. Strong winds during typhoons can trigger upwelling, altering physical (Lin et al., 2003), chemical (Babin et al., 2004), and biological (Chen et al., 2015) processes in the upper ocean, leading to dramatic changes in the variety of marine environments. This change may induce a stress response in P. trituberculatus, thereby altering the body’s physiological functions (Chen et al., 2018). Wang et al. (2017a) analyzed and explored nine-strong typhoons in the East China Sea and reported that the Chl-a concentration, SST, and precipitation changed after the typhoon passed. These environmental changes can lead to higher integrated nutrient concentrations in coastal areas, accelerating phytoplankton growth, and thus triggering red tide events (Zhao et al., 2008). In addition, typhoons cause drastic changes in seawater salinity, leading to a sudden increase in the salinity of the upper ocean (Lee et al., 2017). Changes in the above environmental factors reduce the tolerance of P. trituberculatus to the environment and affect molting and growth.
On the other hand, the summer and autumn seasons in the East China Sea are periods of the frequent occurrence of typhoons (storm surges). The main spawning period of P. trituberculatus is from April to July, and the peak period of larval growth is from early June to mid-September, which is the same as the typhoon outbreak period (Grossmann et al., 2015; Gao and Wang, 2021). Furthermore, the reproductive migration time of P. trituberculatus occurs during typhoon seasons, juvenile crabs are vulnerable to typhoons, and their swimming activities and adaptability to the environment are poor; thus, they easily die, and their death affects recruitment. This result can well explain the obvious increase in mortality after typhoon. Therefore, we speculate that typhoons play a leading role in changes in recruitment.
4.3 Effects of extreme environmental conditions on recruitment
Extreme events occur when environmental factors in marine ecosystems deviate significantly from their average states. The intensities and frequencies of extreme events or disaster-causing factors affect the level of resource biomass. In the early life of P. trituberculatus, swimming, foraging, and other survival ability are poor, and it can only “drift with the current”. During this period, if it encounters strong typhoons, torrential rain, and other extreme weather conditions, its recruitment is considerably affected. If the SSB of P. trituberculatus is at a low level, the sustainability of recruitment faces great risks.
Discontinuous events and extreme events have impacts on the recruitment of fishery resources (Brander, 2010). Although the probability of occurrence of extreme environments is extremely low, it is unavoidable for the analyses of fish stock assessment. Moreover, once it occurs, it leads to changes in the biomass of biological resources. If P. trituberculatus encounters an extremely bad environmental condition, resource becomes extremely fragile. If P. trituberculatus is caught blindly without effective assessment, overfishing occurs. Under adverse environmental conditions, catch considerably declines (Jacobson and Maccall, 1995; Schreiber et al., 2011). Therefore, the assessment and probability estimation of extreme marine environments have practical significance for the assessment and management of fishery resources. When P. trituberculatus is insufficiently recruited due to the impact of an adverse environment, managers should promptly adopt appropriate fishing strategies or carry out stock enhancement to ensure its sustainability.
4.4 Management under different environment combinations
Changes in marine environments are ultimately the main factors affecting changes in fishery resources. Researchers found that the resources of P. trituberculatus fluctuate greatly annually, and catch shows irregular changes in “large and small years” (Zheng et al., 2003; Zhang et al., 2007). These findings indicate that the growth and recruitment of P. trituberculatus vary under different environmental conditions. Marshall et al. (2003) pointed out that preserving populations with sufficient reproductive potential was the basic goal of fishery management, which greatly depended on the levels of environmental factors. Zwolinski and Demer (2012) showed that overfishing during the periods of low productivity accelerate the decline of a population. Therefore, maintaining the SSB above the past average level (6.008 × 10³ t in this study) is sensible.
Generally speaking, good marine environmental conditions can provide sufficient bait and suitable spawning ground and feeding ground for the growth of P. trituberculatus and increase its survival rate and recruitment. A poor marine environment increases the mortality of juvenile P. trituberculatus and is thus an obstacle to its growth and recruitment. It may further lead to obvious fluctuations between generations. Maintaining the basic spawning population is the key to the stable development of P. trituberculatus resources. Managers should formulate strict fishing specifications and implement stock enhancement. Moreover, predicting the trend of climate change is effective in the utilization of good environmental years, enhancement of resource abundance, and protection of spawning populations in poor environmental years (Guan and Xuan, 2019). Therefore, in the management of quota catch, changing trends of environmental factors should be fully considered, and reasonable management strategies based on resource and climate are necessary.
Marine environments are complex and usually cannot be predicted accurately because various factors may influence one another. When environmental elements in a marine ecosystem deviate significantly from their average states, extreme events occur. In such situation, the traditional stock assessment method may be no longer applicable. Many scholars established optimal probability distribution models to evaluate the impact of extreme events on biological recruitment (Ding and Jiang, 2009). These models should be fully utilized in the management and utilization of fisheries resource.
4.5 Limitations and constraints
The time series of available data is short due to the data limitations. The data during the short period of time are insufficient for the verification of the distribution of environmental factors. Thus, the prediction of the final probability may not be the actual situation. In future research, we will comprehensively analyze the dynamic relationship between marine environments and populations based on more data to provide more accurate recruitment and probability prediction.
5 Conclusions
The present study results can partially explain the influence of the marine environment on the spawning stock–recruitment relationship of P. trituberculatus. Compared with the traditional Ricker model, the Ricker-type model with ln-linear environmental impact provides more accurate information about the influence of the environment on the population dynamics of P. trituberculatus. The results showed that the population fluctuation of P. trituberculatus was driven by the marine environment to some extent. The comprehensive effects of different environments impact the recruitment of P. trituberculatus, especially in extreme environments, which even lead to change in the relationship between the spawning stock biomass and recruitment. The AORT and TYP are two critical factors influencing the recruitment of P. trituberculatus. In this study, we propose a probability distribution, which helps improve the accuracy of recruitment estimation. This information can improve the population assessment to explore the proximate spawning stock–recruitment relationship of P. trituberculatus.
Data availability statement
The original contributions presented in the study are included in the article/Supplementary Material. Further inquiries can be directed to the corresponding author.
Ethics statement
This study study was reviewed and approved by The Institutional Animals Care and Use Committee of Zhejiang Ocean University.
Author contributions
LG: Conceptualization, Methodology, Writing-original draft, Writing-review and editing, Formal analysis, Visualization. XB: Conceptualization, Writing-review and editing, Visualization. YW: Conceptualization, Writing-review and editing, Supervision, Data curation, Project administration, Funding acquisition. All authors contributed to the article and approved the submitted version.
Funding
This research was supported by the National Key Research and Development Program of China (2019YFD0901304), the Public Welfare Technology Application Research Project of Zhejiang (LGN21C190009) and the Science and Technology Project of Zhoushan (2022C41003).
Acknowledgments
The authors gratefully thank the reviewers for their comments on our draft of this paper.
Conflict of interest
The authors declare that the research was conducted in the absence of any commercial or financial relationships that could be construed as a potential conflict of interest.
Publisher’s note
All claims expressed in this article are solely those of the authors and do not necessarily represent those of their affiliated organizations, or those of the publisher, the editors and the reviewers. Any product that may be evaluated in this article, or claim that may be made by its manufacturer, is not guaranteed or endorsed by the publisher.
Supplementary material
The Supplementary Material for this article can be found online at: https://www.frontiersin.org/articles/10.3389/fmars.2022.850317/full#supplementary-material.
Footnotes
References
Ariyama H. (2020). Studies on ecology and stock enhancement of swimming crab portunus trituberculatus in Osaka bay. Bull. Osaka Prefectural Fish. Exp. Station 12, 1–90.
Ariyama H., Secor D. H. (2010). Effect of environmental factors, especially hypoxia and typhoons, on recruitment of the gazami crab portunus trituberculatus in Osaka bay, Japan. Fish. Sci. 76, 315–324. doi: 10.1007/s12562-009-0198-6
Arnott S. A., Ruxton G. D. (2002). Sandeel recruitment in the north Sea: demographic, climatic and trophic effects. Mar. Ecol. Prog. Ser. 238, 199–210. doi: 10.3354/MEPS238199
Babin S., Carton J., Dickey T., Wiggert J. (2004). Satellite evidence of hurricane-induced phytoplankton blooms in an oceanic desert. J. Geophys. Res.: Ocean. 109, C03043. doi: 10.1029/2003JC001938
Barrowman N. J., Myers R. (1996). Is fish recruitment related to spawner abundance. Fish. Bull. 94, 707–724.
Bian X., Wan R., Jin X., Shan X., Guan L. (2018). Ichthyoplankton succession and assemblage structure in the bohai Sea during the past 30 years since the 1980s. Prog. Fish. Sci. 39, 1–15. doi: 10.19663/j.issn2095-986.20170911001
Brander K. (2010). Impacts of climate change on fisheries. J. Mar. Syst. 79, 389–402. doi: 10.1016/J.JMARSYS.2008.12.015
Chen D., Irvine J. (2001). A semiparametric model to examine stock recruitment relationships incorporating environmental data. Can. J. Fish. Aquat. Sci. 58, 1178–1186. doi: 10.1139/CJFAS-58-6-1178
Chen X., Pan D., Bai Y., He X., Chen C.-T. A., Kang Y., et al. (2015). Estimation of typhoon-enhanced primary production in the south China Sea: a comparison with the Western north pacific. Continent. Shelf. Res. 111, 286–293. doi: 10.1016/j.csr.2015.10.003
Chen X., Ren Y., Li L., Mu C., Li R., Song W., et al. (2018). Effect of typhoon on the antioxidant system and Na+, K+-ATPase activityin portunus trituberculatus. J. Mar. Sci. 36, 101–106. doi: 10.3969/j.issn.1001-909X.2018.03.012
Delignette-Muller M. L., Dutang C. (2015). Fitdistrplus: An r package for fitting distributions. J. Stat. softw. 64, 1–34. doi: 10.18637/JSS.V064.I04
Ding Y., Jiang Z. (2009). Intro to Extreme Climate Research Methods (Diagnosis and Simulation and Prediction), (Beijing: Meteorological Press).
Gao L., Wang Y. (2021). Influences of environmental factors on the spawning stock-recruitment relationship of portunus trituberculatus in the northern East China Sea. Acta Oceanolog. Sin. 40, 145–159. doi: 10.1007/s13131-021-1801-7
Gilbert D. (1997). Towards a new recruitment paradigm for fish stocks. Can. J. Fish. Aquat. Sci. 54, 969–977. doi: 10.1139/F96-272
Grossmann M. M., Gallager S. M., Mitarai S. (2015). Continuous monitoring of near-bottom mesoplankton communities in the East China Sea during a series of typhoons. J. oceanogr. 71, 115–124. doi: 10.1007/s10872-014-0268-y
Guan W., Xuan F. (2019). A research paradigm of climate impacting reproductive dynamics of fishery resources: A case study of portunus trituberculatus population in the East China Sea. Fish. Info. & Strat. 34, 279–285. doi: 10.13233/j.cnki.fishis.2019.04.007
Hamasaki K., Imai H., Akiyama N., Fukunaga K. (2004). Ovarian development and induced oviposition of the overwintering swimming crab portunus trituberculatus (Brachyura: Portunidae) reared in the laboratory. Fish. Sci. 70, 988–995. doi: 10.1111/j.1444-2906.2004.00898.x
Hilborn R., Walters C. J. (1992). Quantitative fisheries stock assessment: choice, dynamics and uncertainty (New York:Chapman and Hall).
Hjort J. (1914). Fluctuations in the great fisheries of northern Europe viewed in the light of biological research. Rapports et Procès-Verbaux des Réunions du Conseil International pour L’exploration de la Mer 20, 1–228.
Jacobson L. D., Maccall A. D. (1995). Stock-recruitment models for pacific sardine (Sardinops sagax). Can. J. Fish. Aquat. Sci. 52, 566–577. doi: 10.1139/F95-057
Kuha J. (2004). AIC and BIC: Comparisons of assumptions and performance. Sociolog. Methods Res. 33, 188–229. doi: 10.1177/0049124103262065
Kurota H., Szuwalski C. S., Ichinokawa M. (2020). Drivers of recruitment dynamics in Japanese major fisheries resources: Effects of environmental conditions and spawner abundance. Fish. Res. 221, 105353. doi: 10.1016/j.fishres.2019.105353
Lee J. H., Moon I. J., Moon J. H., Kim S. H., Jeong Y. Y., Koo J. H. (2017). Impact of typhoons on the changjiang plume extension in the yellow and East c hina seas. J. Geophys. Res.: Ocean. 122, 4962–4973. doi: 10.1002/2017jc012754
Lin I. I., Liu W. T., Wu C. C., Chiang J., Sui C. H. (2003). Satellite observations of modulation of surface winds by typhoon-induced upper ocean cooling. Geophys. Res. Lett. 30, 1131. doi: 10.1029/2002GL015674
Lipcius R. N., Stockhausen W. T. (2002). Concurrent decline of the spawning stock, recruitment, larval abundance, and size of the blue crab callinectes sapidus in Chesapeake bay. Mar. Ecol. Prog. Ser. 226, 45–61. doi: 10.3354/MEPS226045
Liu H., Lv H., Cui F., Xie W., Li B., Wang L., et al. (2016). Parental contribution and genetic diversity between broodstock and offsprings in swimming crab (Portunus trituberculatus) releasing into natural waters. Fish. Sci. 35, 613–619. doi: 10.16378/j.cnki.1003-1111.2016.06.002
Marshall C. T., O'brien L., Tomkiewicz J., Marteinsdóttir G., Morgan M., Saborido-Rey F., et al. (2003). Developing alternative indices of reproductive potential for use in fisheries management: case studies for stocks spanning an information gradient. J. Northwest Atlantic Fish. Sci. 33, 161–190. doi: 10.2960/J.V33.A8
Planque B., Frédou T. (1999). Temperature and the recruitment of Atlantic cod (Gadus morhua). Can. J. Fish. Aquat. Sci. 56, 2069–2077. doi: 10.1139/F99-114
Qi Q., Cai R. (2019). Analysis on climate characteristics of sea surface temperature extremes in coastal China seas. Haiyang Xuebao 41, 36–51. doi: 10.3969/j.issn.0253-4193.2019.07.004
Sakuramoto K. (2005). Does the ricker or beverton and Holt type of stock-recruitment relationship truly exist? Fish. Sci. 71, 577–592. doi: 10.1111/j.1444-2906.2005.01002.x
Sakuramoto K., Shimoyama S., Suzuki N. (2010). Relationships between environmental conditions and fluctuations in the recruitment of Japanese sardine, Sardinops melanostictus, in the northwestern pacific. Bull. Jpn. Soc Fish. Oceanogr 74, 88–97.
Santojanni A., Arneri E., Bernardini V., Cingolani N., Di Marco M., Russo A. (2006). Effects of environmental variables on recruitment of anchovy in the Adriatic Sea. Climate Res. 31, 181–193. doi: 10.3354/CR031181
Schreiber M. A., Ñiquen M., Bouchón M. (2011). Coping strategies to deal with environmental variability and extreme climatic events in the Peruvian anchovy fishery. Sustainability 3, 823–846. doi: 10.3390/SU3060823
Secor D. H., Hines A. H., Place A. R. (2002). Japanese Hatchery-based stock enhancement: lessons for the Chesapeake bay blue crab (Maryland Sea Grant Rep. No. UM-SG-TS-2002-02. University of Maryland: College Park, MD).
Shentu J., Xu Y., Ding Z. (2015). Effects of salinity on survival, feeding behavior and growth of the juvenile swimming crab, portunus trituberculatus (Miers 1876). Chin. J. Oceanol. Limnol. 33, 679–684. doi: 10.1007/s00343-015-4218-3
Shiota K. (1993). Relationship between annual catch fluctuations and reproduction in the swimming crab in hiuchi Nada, the seto inland Sea. Nippon Suisan Gakkaishi 59, 1709–1715. doi: 10.2331/SUISAN.59.1709
Solow A. R. (2002). Fisheries recruitment and the north Atlantic oscillation. Fish. Res. 54, 295–297. doi: 10.1016/S0165-7836(00)00308-8
Sugilar H., Park Y. C., Lee N. H., Han D. W., Han K. N. (2012). Population dynamics of the swimming crab portunus trituberculatus (Miers 1876)(Brachyura, portunidae) from the West Sea of Korea. Int. J. Oceanogr. Mar. Ecol. Syst. 1, 36. doi: 10.3923/ijomes.2012.36.49
Vogt G. (2012). Ageing and longevity in the decapoda (Crustacea): a review. Zoologischer Anzeiger 251, 1–25. doi: 10.1016/J.JCZ.2011.05.003
Wang T., Liu G., Gao L., Zhu L., Li D. (2017a). Biological responses to nine powerful typhoons in the East China Sea. Region. Environ. Change 17, 465–476. doi: 10.1007/s10113-016-1025-0
Wang Y., Wang X., Ye T., Chen L., Zhou C. (2017b). Spawner-recruit analysis of portunus (Portunus) trituberculatus (Miers 1876) in the case of stock enhancement implementation: a case study in zhejiang Sea area, China. Turkish J. Fish. Aquat. Sci. 17, 293–299. doi: 10.4194/1303-2712-v17_2_08
Wilderbuer T., Hollowed A., Ingraham W. Jr., Spencer P., Conners M., Bond N., et al. (2002). Flatfish recruitment response to decadal climatic variability and ocean conditions in the eastern Bering Sea. Prog. Oceanogr. 55, 235–247. doi: 10.1016/S0079-6611(02)00081-2
Williams E. H., Quinn T. J. (2000). Pacific herring, clupea pallasi, recruitment in the Bering Sea and north-east pacific ocean, II: relationships to environmental variables and implications for forecasting. Fish. Oceanogr. 9, 300–315. doi: 10.1046/j.1365-2419.2000.00146.x
Xie Z., Qiu S., Hou C., Jin X. (2014). Recapture rates of swimming crabs (Portunus trituberculatus) released in the waters off southern Shandong peninsula. J. Fish. Sci. China 21, 1000–1009. doi: 10.3724/SP.J.1118.2014.01000
Yasuda I., Sugisaki H., Watanabe Y., Minobe S. S., Oozeki Y. (1999). Interdecadal variations in Japanese sardine and ocean/climate. Fish. Oceanogr. 8, 18–24. doi: 10.1046/J.1365-2419.1999.00089.x
Yatsu A., Watanabe T., Ishida M., Sugisaki H., Jacobson L. D. (2005). Environmental effects on recruitment and productivity of Japanese sardine sardinops melanostictus and chub mackerel scomber japonicus with recommendations for management. Fish. oceanogr. 14, 263–278. doi: 10.1111/J.1365-2419.2005.00335.X
Ying M., Zhang W., Yu H., Lu X., Feng J., Fan Y., et al. (2014). An overview of the China meteorological administration tropical cyclone database. J. Atmospher. Ocean. Technol. 31, 287–301. doi: 10.1139/CJFAS-58-6-1178
Yu C., Song H., Yao G. (2004). Assessment of the crab stock biomass in the continental shelf waters of the East China Sea. J. Fish. China 28, 41–46. doi: 10.3321/j.issn:1000-0615.2004.01.007
Zhang Q., Cheng J., Xu H., Xu X., Yu G., Zheng Y. (2007). Fishery resources in the East China Sea and their sustainable utilization (Shanghai: Fudan University press).
Zhang H., Yuan X., Cheng J. (2010). Optimizing selection and application of reproduction model of small yellow croaker in the East China Sea. J. Fish. Sci. China 17, 1300–1308. doi: 10.3724/SP.J.1011.2010.01351
Zhao H., Tang D., Wang Y. (2008). Comparison of phytoplankton blooms triggered by two typhoons with different intensities and translation speeds in the south China Sea. Mar. Ecol. Prog. Ser. 365, 57–65. doi: 10.3354/meps07488
Zheng Y., Chen X., Cheng J., Wang Y., Shen X., Chen W., et al. (2003). Biological resources and environment on the continental shelf of the East China Sea (Shanghai: Shanghai Scientific & Technical Publishers).
Zheng J., Kruse G. H. (2003). Stock-recruitment relationships for three major alaskan crab stocks. Fish. Res. 65, 103–121. doi: 10.1016/J.FISHRES.2003.09.010
Keywords: Portunus trituberculatus, Ricker-type S-R model, environmental factor, recruitment, abundance prediction
Citation: Gao L, Bai X and Wang Y (2022) Dynamic prediction of the ricker-type model of Portunus trituberculatus on the basis of marine environmental factors. Front. Mar. Sci. 9:850317. doi: 10.3389/fmars.2022.850317
Received: 07 January 2022; Accepted: 27 June 2022;
Published: 26 July 2022.
Edited by:
Romuald Lipcius, College of William and Mary, United StatesReviewed by:
Yuan Li, Ministry of Natural Resources, ChinaWen-Cheng Liu, National United University, Taiwan
Copyright © 2022 Gao, Bai and Wang. This is an open-access article distributed under the terms of the Creative Commons Attribution License (CC BY). The use, distribution or reproduction in other forums is permitted, provided the original author(s) and the copyright owner(s) are credited and that the original publication in this journal is cited, in accordance with accepted academic practice. No use, distribution or reproduction is permitted which does not comply with these terms.
*Correspondence: Yingbin Wang, eWluZ2JpbndhbmdAMTI2LmNvbQ==