 Jang-Mu Heo1
 Hyo-Ryeon Kim1
 Sang-Min Eom1Joo-Eun Yoon2
 JeongHee Shim3
 Jae-Hyun Lim4
 Ju-Hyoung Kim5
 Satheeswaran Thangaraj1
 Ki-Tae Park6HuiTae Joo7
 Il-Nam Kim1*
- 1Department of Marine Science, Incheon National University, Incheon, South Korea
- 2Centre for Climate Repair at Cambridge, Downing College, University of Cambridge, Cambridge, United Kingdom
- 3Fisheries Resources and Environment Research Division, East Sea Fisheries Research Institute, National Institute of Fisheries Science, Gangneung, South Korea
- 4Marine Environment Research Division, National Institute of Fisheries Science, Busan, South Korea
- 5Department of Aquaculture and Aquatic Science, Kunsan National University, Gunsan, South Korea
- 6Division of Atmospheric Sciences, Korea Polar Research Institute, Incheon, South Korea
- 7Ocean Climate Ecology Research Division, National Institute of Fisheries Science, Busan, South Korea
Nitrous oxide (N2O) is an important greenhouse gas emitted in significant volumes by the Pacific Ocean. However, the relationship between N2O dynamics and environmental drivers in the subtropical western North Pacific Ocean (STWNPO) remains poorly understood. We investigated the distribution of N2O and its production as well as the related mechanisms at the surface (0–200 m), intermediate (200–1500 m), and deep (1500–5774 m) layers of the STWNPO, which were divided according to the distribution of water masses. We applied the transit time distribution (TTD) method to determine the ventilation times, and to estimate the N2O equilibrium concentration of water parcels last in contact with the atmosphere prior to being ventilated. In the surface layer, biologically derived N2O (ΔN2O) was positively correlated with the apparent oxygen utilization (AOU) (R2 = 0.48), suggesting that surface N2O may be produced by nitrification. In the intermediate layer, ΔN2O was positively correlated with AOU and (R2 = 0.92 and R2 = 0.91, respectively) and negatively correlated with nitrogen sinks (N*) (R2 = 0.60). Hence, the highest ΔN2O value in the oxygen minimum layer suggested N2O production through nitrification and potential denitrification (up to 51% and 25% of measured N2O, respectively). In contrast, the deep layer exhibited a positive correlation between ΔN2O and AOU (R2 = 0.92), suggesting that the N2O accumulation in this layer may be caused by nitrification. Our results demonstrate that the STWNPO serves as an apparent source of atmospheric N2O (mean air−sea flux 2.0 ± 0.3 μmol m-2 d-1), and that nitrification and potential denitrification may be the primary mechanisms of N2O production in the STWNPO. We predict that ongoing ocean warming, deoxygenation, acidification, and anthropogenic nitrogen deposition in the STWNPO may elevate N2O emissions in the future. Therefore, the results obtained here are important for elucidating the relationships between N2O dynamics and environmental changes in the STWNPO and the global ocean.
Introduction
Since the industrial revolution, atmospheric greenhouse gas (GHG) concentrations have been increasing at unprecedented rates, especially nitrous oxide (N2O), which rose from previous concentrations of 270 ppb (pre-industrial revolution) to above 330 ppb (Montzka et al., 2011; Prinn et al., 2018). Generally, N2O is considered a significant GHG, similar to carbon dioxide (CO2) and methane (CH4), and it contributes significantly to the global greenhouse effect (Stocker et al., 2014). More specifically, N2O is 300 times more potent as a GHG than CO2 (Jain et al., 2000) and plays a critical role in ozone depletion (Crutzen, 1970). N2O is released into the atmosphere from various sources, such as agriculture, industry, the burning of fossil fuels, and other natural sources (Tian et al., 2016). As N2O is produced from biological sources in the ocean, oceanic N2O emissions play a vital role in the atmospheric N2O budget (Bange, 2006). It has been estimated that the N2O emitted from the oceans contributes to 35% (3.4 Tg N yr−1) of total natural sources (Tian et al., 2020).
Generally, N2O is produced in the ocean through two microbial activities: nitrification and denitrification. Nitrification refers to a series of processes in which ammonium ( ) is converted to its inorganic form from organic nitrogen (ammonification), which is then oxidized to nitrate ( → NH2OH → → ) by nitrifiers. During nitrification, N2O is produced through two pathways (NH2OH → N2O and → NO → N2O), the latter being termed “nitrifier denitrification” (Codispoti and Christensen, 1985). Nitrification is an aerobic process occuring in almost all oxygen-rich oceans. In this process, N2O is produced by ammonia-oxidizing bacteria (AOB) and ammonia-oxidizing archaea (AOA), which are nitrifiers (Goreau et al., 1980; Löscher et al., 2012). However, when the oxygen concentration is low (below 20 μmol L-1), nitrifying bacteria mediate nitrifier denitrification (Poth and Focht, 1985; Wrage et al., 2001). In the euphotic zone, the nitrification rates ranged from 3.7 to 11.3 nmol L-1 d-1 in the western North Pacific Ocean (Yoshikawa et al., 2016; Breider et al., 2019), which is one of the normoxic oceans, in comparison to the rates of 44.5−213 nmol L-1 d-1 in the eastern tropical North Pacific Ocean (Beman et al., 2013). With relatively low nitrification rates, N2O surface concentrations in the western North Pacific Ocean remain slightly higher (5.6−8.0 nmol L−1 with saturation of 102−115% at 0−200 m) than the equilibrium values, being produced through nitrification and nitrifier denitrification (Butler et al., 1989; Breider et al., 2015; Yoshikawa et al., 2016; Zhan et al., 2017).
Denitrification is a dissimilatory reduction process ( → → NO → N2O → N2) in which bacteria use nitrate as the first electron acceptor in an oxygen-depleted environment (0 < O2 < 20–25 μmol L-1), producing N2O as a by-product (Cohen and Gordon, 1978; Cohen and Gordon, 1979). In general, denitrification occurs in suboxic environments, including the oxygen minimum zones (OMZs) of the Arabian Sea (e.g., typical rates of 0.2–25.4 nmol N2 L-1 d-1) (Ward et al., 2009) and eastern tropical Pacific Ocean (e.g., typical rates of 2.6–189.6 nmol N2 L-1 d-1) (Dalsgaard et al., 2012). As these regions undergo a combination of nitrification and denitrification, considerably high N2O concentrations have been observed (e.g., up to 986 nmol L-1 in the eastern tropical South Pacific Ocean) (Arevalo-Martínez et al., 2015).
Several studies have expanded our knowledge of the oxygen dependence of denitrification in marine environments. Schropp and Schwarz (1983) suggested that N2O is produced through potential denitrification in the formation of anaerobic microsites by particles within a nitrate-rich and even well-oxygenated environment. Similarly, in the relatively oxygen-rich Pacific Ocean outside the OMZ, potential denitrification in the micro-reducing environment created by marine snow in the water column has also been suggested despite aerobic conditions (Yamagishi et al., 2005; Kim et al., 2013). In addition, the coupling of many surface-supplied particles and denitrifiers may contribute to denitrification in the oxygenated Chukchi Shelf waters (Zeng et al., 2017). In addition to potential denitrification within the water column, denitrification occurs in permeable sediments under high oxygen concentrations (even above 100 μmol L-1) (Marchant et al., 2017). Denitrification has not been highlighted in the western Pacific Ocean in comparison to other regions where oxygen is depleted. However, these studies in various regions, including the Pacific Ocean, have provided insights into the potential for N2O production through denitrification in the western Pacific Ocean.
The subtropical North Pacific Ocean plays a significant role in the air–sea exchange of climate relevant gases (Dore et al., 1998), and drives the largest wind-driven circulation (North Pacific Subtropical Gyre) across the global ocean (Karl, 1999; Talley, 2011). As part of this gyre, the subtropical western North Pacific Ocean (STWNPO) is dominated by western boundary currents of the Kuroshio, Mindanao, and North Equatorial currents (Liu et al., 2017). The STWNPO is considered as an oligotrophic region (Corno et al., 2007; Kämpf and Chapman, 2016), comprising an oxygen minimum layer under hypoxic conditions (oxygen < ~63 µmol L−1), which is characteristic of the Pacific Ocean, as it contains the oldest water in the world (Talley, 2011).
As with other oceans, the STWNPO has undergone significant environmental changes owing to anthropogenic activities (Doney et al., 2012). These anthropogenic activities and subsequent emissions of GHGs into the atmosphere have led to global warming (Von Schuckmann et al., 2016). These changes have increased the atmospheric thermal energy transmitted into the ocean, resulting in ocean warming (Cheng et al., 2019). In particular, ocean warming in the western boundary currents is double in magnitude compared with the average global ocean warming (Wu et al., 2012). This increased thermal energy also acts as the main driver for the deoxygenation of STWNPO (Levin, 2018). Moreover, ocean acidification in the STWNPO has accelerated as atmospheric CO2 levels increase (Ono et al., 2019). Anthropogenic activities have also driven increased atmospheric nitrogen deposition (AND), significantly impacting the N-limited oligotrophic STWNPO (Kim et al., 2014). In the future, these environmental changes will affect ocean ecosystems and eventually alter N2O production and distribution, which are controlled by bacterial communities (nitrification and denitrification). Therefore, it is not only necessary to elucidate the N2O production and distribution mechanisms in STWNPO, but also to demonstrate the sensitivity or responsiveness of this region to ongoing environmental changes.
Over the last three decades, several studies have assessed the mechanisms of N2O production and distribution in the core of the western North Pacific Ocean (Yoshida et al., 1989; Toyoda et al., 2002; Breider et al., 2015; Yoshikawa et al., 2016) along latitudinal transects (Butler et al., 1989; Zhan et al., 2017). However, these studies have investigated only a few locations of subtropical convergence or only the surface layer, hence, they provide limited information on the mechanisms associated with N2O cycling in the STWNPO. Here, we present an in-depth investigation of the overall N2O dynamics of the understudied STWNPO. The present study aimed to achieve the following objectives: (1) determine the spatial distributions and production of N2O, (2) identify and quantify the factors controlling N2O production, (3) determine whether the STWNPO acts as a sink and/or source of atmospheric N2O content, and (4) evaluate the relationship between future global changes and the N2O dynamics of the STWNPO.
Materials and Methods
Sampling and Measurements of Physical and Biogeochemical Data
This investigation was conducted in the STWNPO, between 15 and 28°N and 135°E (Figure 1A) onboard the R/V Isabu, from May 27th to June 4th, 2020. Seawater was collected at eight stations (Figure 1A), and at each station, 24 vertical samples were collected from the surface down to a depth of 5774 m using Niskin bottles on a rosette sampler. At all stations, temperature, salinity, and dissolved oxygen (DO) profiles were determined using an SBE 911 Plus (CTD; Sea-Bird, USA) sensor system attached to a rosette sampler. The accuracies of temperature, conductivity, and oxygen sensors were ± 0.001°C, ± 0.0003 S m-1, and ± 2% of saturation, respectively. The wind speed above the sea surface (29 m) was also measured using an ultrasonic wind sensor (Ventus, Lufft, Germany) and later converted to a 10 m height following the log wind profile method (Holmes, 2007). The accuracy of the wind sensor is ± 0.2 m s-1.
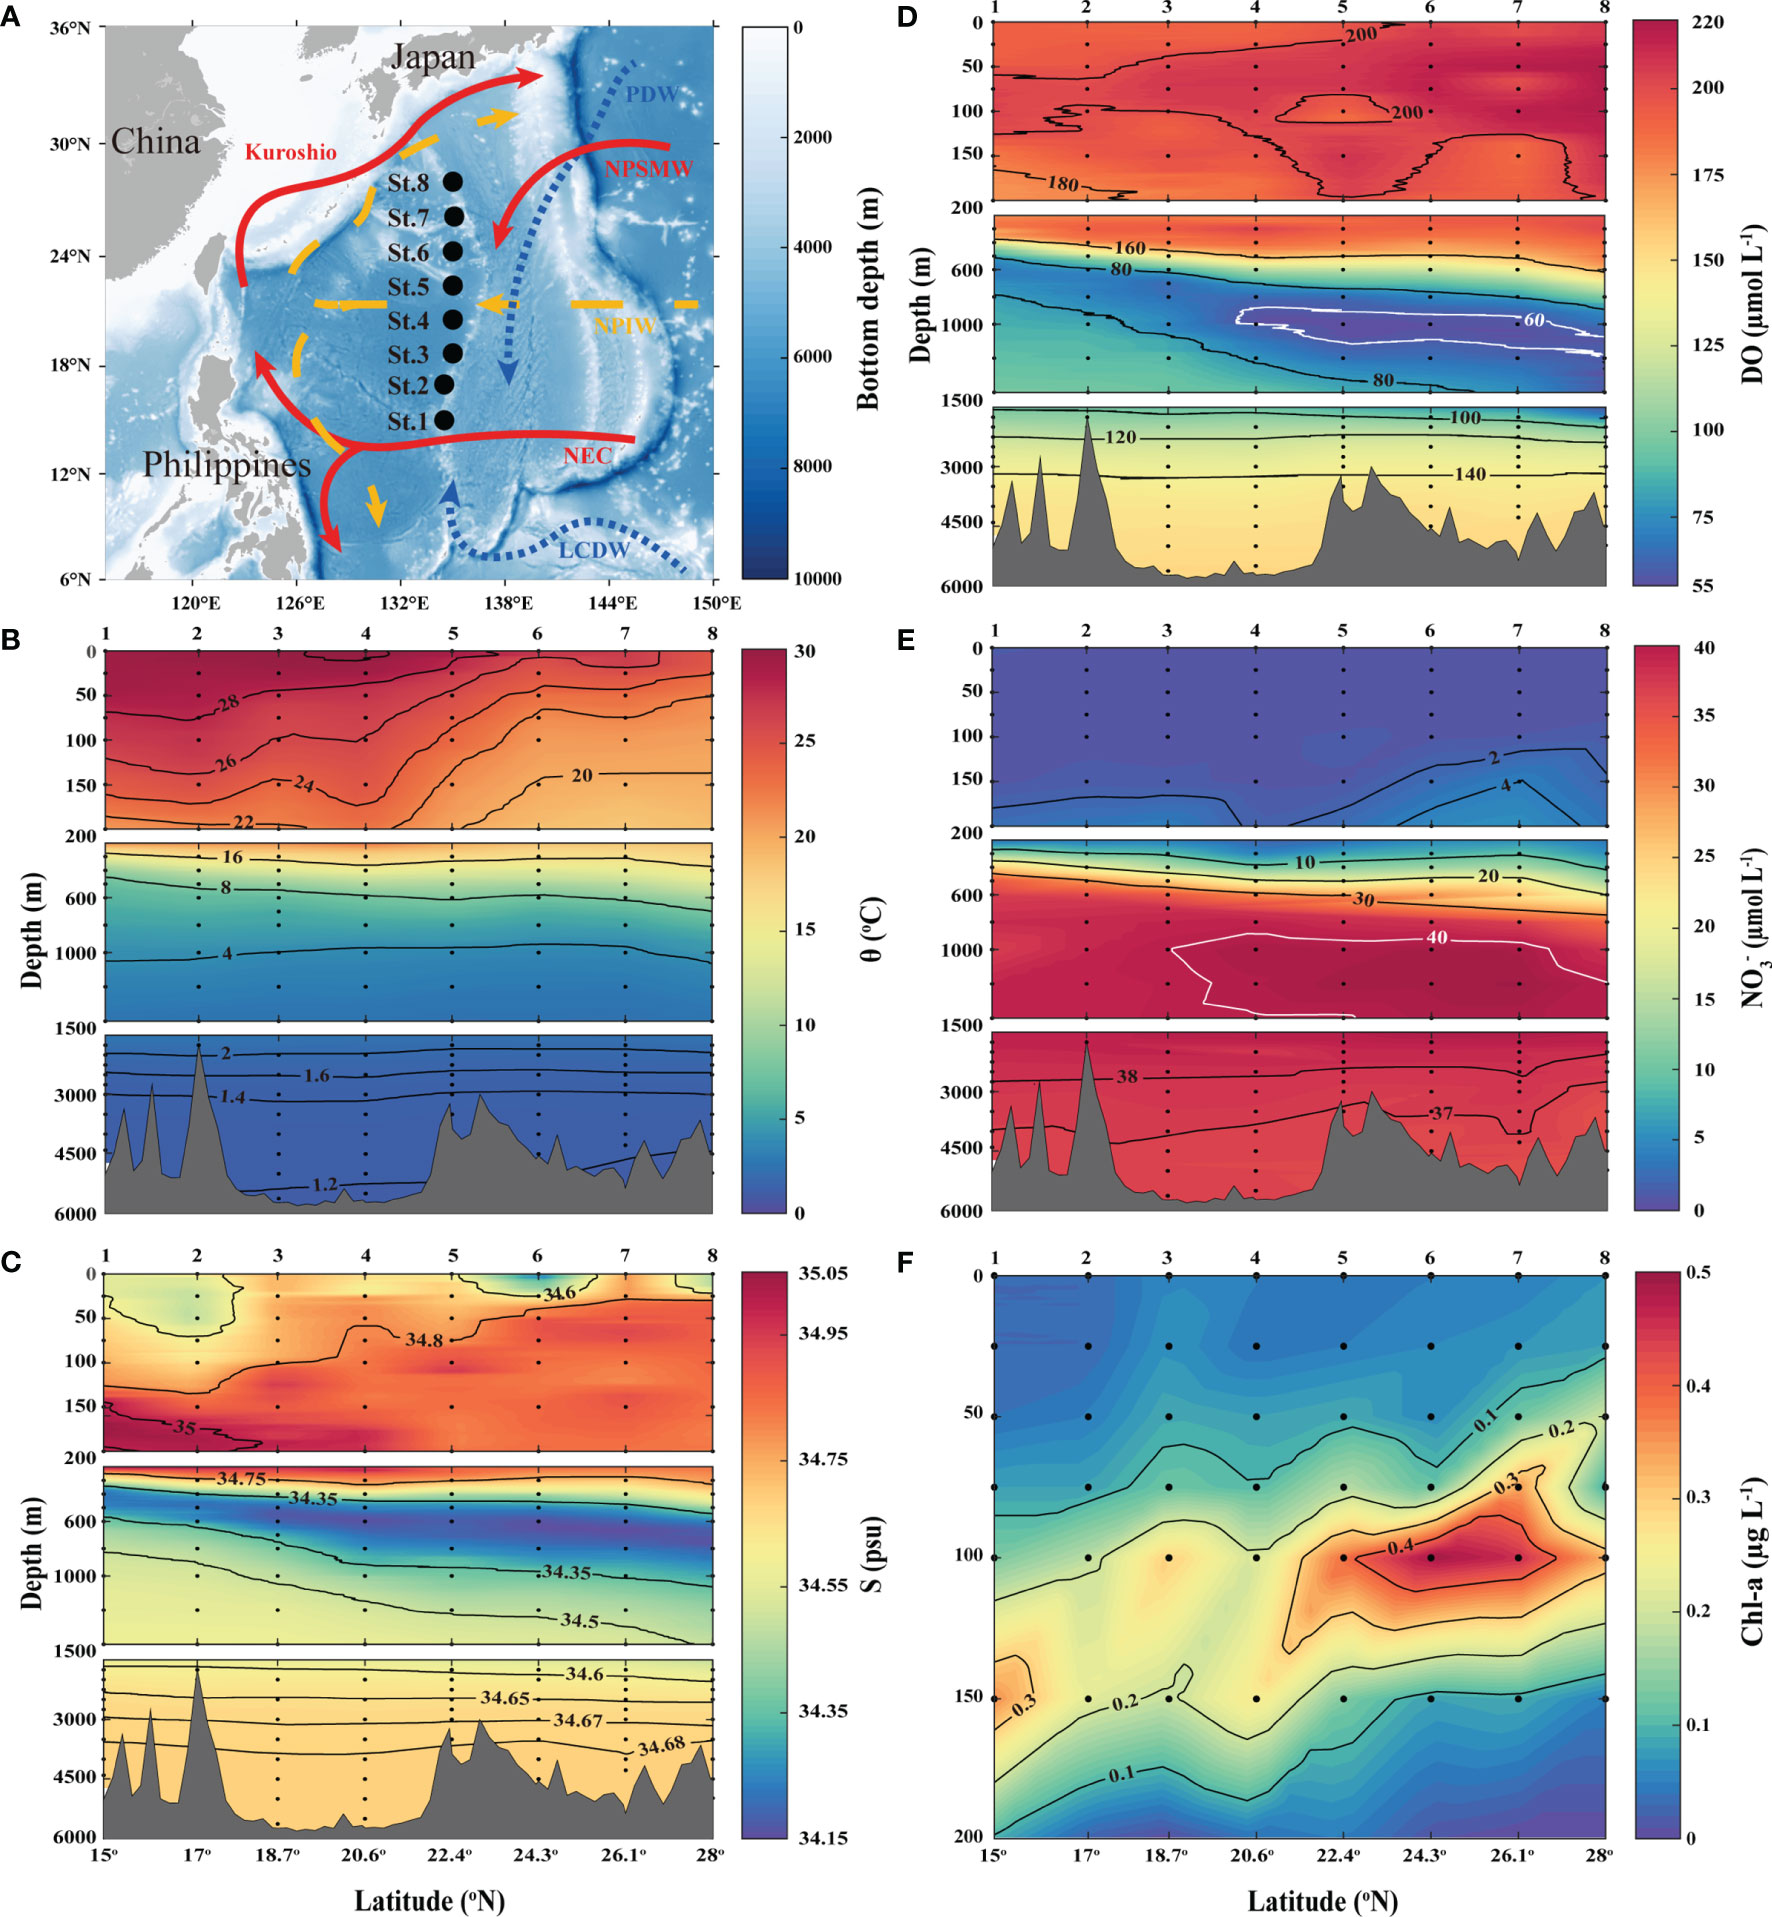
Figure 1 (A) Study area and station locations in the Subtropical Western North Pacific Ocean (STWNPO). Different colors (white–blue gradient) represent the bathymetry information. Schematic arrows represent flowing major currents and water masses in compliance with the surface (red and solid), intermediate (yellow and dashed), and deep (blue and dotted) layers. The vertical profiling of (B) potential temperature (θ), (C) salinity (S), (D) dissolved oxygen (DO), (E) nitrate (), and (F) chlorophyll-a (Chl-a) along the latitudinal transects in the STWNPO. The black dots indicate sampling locations/depths, and the black/white solid lines represent the contour lines of each parameter. The numbers (1–8) at the top of (B–F) are the station numbers. This figure is also available with a gray color version in Supplementary Materials.
To determine nutrient concentrations, seawater samples were collected in 15 mL acid-rinsed bottles and stored at −20°C until further analysis. Nitrate () and phosphate (PO43-) were analyzed in the laboratory using a QuAAtro autoanalyzer (Seal Analytical, Germany). The analytical precision of the nutrients was greater than 1%. To determine chlorophyll-a (Chl-a), ~4 L of seawater was filtered through 47 mm Whatman GF/F filters and frozen at −80°C. In the laboratory, pigments were extracted using 90% acetone (Ritchie, 2006), and the Chl-a concentrations were measured using a Trilogy Fluorometer (Model # 7200-002, Turner designs, USA) with an analytical precision of ± 0.05 µg L-1. Seawater samples for pH estimation were collected according to the protocol of Dickson et al. (2007) and were later spectrophotometrically assessed using an unpurified meta-cresol purple indicator (Douglas and Byrne, 2017a; Douglas and Byrne, 2017b) with an accuracy of ± 0.004 pH units.
Determinations of Atmospheric/Dissolved N2O
To estimate the historical values of atmospheric N2O concentrations, a dataset of atmospheric N2O concentrations was aggregated, spanning AD 800 to AD 2020. Data between 800 and 1977, when atmospheric N2O had not been monitored, were obtained from studies of Antarctic ice cores (Battle et al., 1996; Schilt et al., 2010). Data from 1979 to 1986 were obtained from the Air Monitoring Program of the Commonwealth Scientific and Industrial Research Organisation (CSIRO) in Cape Grim, Australia. Although there is a limit to the available information representing the spatial variability of atmospheric N2O concentrations for the entire planet, obtaining this information is simultaneously beneficial and the sole data source.
The longitudinal difference in atmospheric N2O concentrations in the North Pacific Ocean is insignificant because of the zonally well-mixed atmosphere and lack of strong sources or sinks (Ishijima et al., 2009). However, as N2O emissions (e.g., from agriculture, industry, and natural soil) are more significant in the Northern Hemisphere than in the Southern Hemisphere, atmospheric N2O is also higher in the Northern Hemisphere than in the Southern Hemisphere (Supplementary Figure S1A). From 1987 to 2020, the mean difference in atmospheric N2O concentrations between hemispheres was 1.13 ± 0.59 ppb. Hence, to reflect atmospheric N2O over the North Pacific Ocean as accurately as possible, the data between 1987 and 2020 were taken from the air monitoring program run by the NOAA Earth System Research Laboratories (ESRL) in Mauna Loa, Hawaii.
Subsequently, spline interpolation was applied according to time to the total aggregated N2O data because it comprised discrete values (Supplementary Figure S1B). However, our approach does not accurately reflect the spatial variability of the dataset before 1987, when atmospheric N2O data for the North Pacific Ocean was limited, and may underestimate the equilibrium N2O of seawater, expressed as N2Oeq = N2Oair ∙ β ∙ P, where N2Oair is the atmospheric N2O level, β is the Bunsen solubility (nmol L−1 atm−1) determined from the relationship between the potential temperature and salinity of seawater (Weiss and Price, 1980), and P is the atmospheric pressure (atm). However, for the pre-1980s period, estimating the exact impact of utilizing data from the Southern Hemisphere (i.e., Antarctica and Cape Grim, Australia) is still limited by data availability.
The seawater samples used to quantify the dissolved N2O concentrations were carefully transferred from the Niskin sampler to 120 mL glass bottles, and 100 μL of saturated HgCl2 was added to inhibit biological activity. The sample bottles were tightly sealed with rubber stoppers and aluminum caps to avoid interaction with ambient air (Wilson et al., 2018). We used the headspace method with a cavity ring-down spectrometer (CRDS; Model G2308, USA) to estimate the dissolved N2O gas in the water samples. This laser-based method uses gas optical absorbance characteristics with a precision of < 7 ppb (Heo et al., 2021). Subsamples were transferred from 120 mL glass bottles into a 100 mL glass gas-tight syringe, and 40 mL of high-purity N2O-free air was then added to the syringe. The sample and N2O-free air in the syringe were gas equilibrated using an action shaker (ASA-026-12, ASIA TESTING MACHINE, South Korea). This equilibrated gas (i.e., gas in the headspace of the syringe) was then injected into the CRDS to measure its N2O concentrations. The following equation was used to calculate and convert the N2O concentrations in the equilibrated gas to dissolved N2O concentrations in the seawater samples (Eq. 1):
We determined the measurement accuracy of the N2O concentration in seawater by measuring the concentration of N2O standard gas once every 15 seawater samples. The standard was certified as 334.1 ppb (± 1%) by the Korean Research Institute of Standards and Science. The ensemble standard deviation of all gas standard measurements was 2.8% (mean: 328.8 ± 2.3 ppb) (Supplementary Figure S2). As the gas standard measurements overlapped with the precision of the certified standard values and the instrument, the seawater samples were measured without any adjustments. In addition, we measured duplicate seawater samples, with a measurement discrepancy of approximately 4%.
Estimations of Excess N2O and Transit Time Distribution Ages
Excess N2O (ΔN2O), which is the amount of biogeochemically produced N2O, was estimated as the difference between the equilibrium N2O (N2Oeq, refer to the section 2.2) and the measured N2O concentration (N2Omeasured) (Yoshinari, 1976; Walter et al., 2006; Kock et al., 2016; Heo et al., 2021) and is expressed as follows:
To accurately estimate ΔN2O, we first assessed the time when a water parcel was last in contact with the atmosphere (i.e., ventilation age) using the transit time distribution (TTD) method. Historical N2Oair values varied over time (Supplementary Figure S1B), and given that the Pacific Ocean is the oldest in the world, the age of each water parcel should be considered when selecting a value of N2Oair for calculations of N2Oeq away from the surface. The TTD method was initially developed by Waugh et al. (2003) and has been widely applied to various marine environments (e.g., Tanhua et al. (2008); Kim et al. (2013); Sonnerup et al. (2019); Ko and Quay (2020)). Below, we briefly describe how this method was applied in the present study using CFC measurements. In summary, we calculated water mass ages approximately ranging from 0 to 1200 yr. for 0−5774 m (Supplementary Figure S3).
The transit time distribution (TTD) method assumes that inert tracers present at the surface are transported into the ocean interior, and their concentrations are affected by physical processes (e.g., advection and diffusion) (Waugh et al., 2003; Tanhua et al., 2008; Kim et al., 2013). Using this method, ventilation times can be obtained (Waugh et al., 2003). The following equations describe this method:
We used CFC11 and CFC12, collected during the July–August 2016 CLIVAR P09 cruise (Supplementary Figure S3), as inert tracer gases using the TTD method. To identify a suitable Δ/Γ ratio for STWNPO, we compiled the Δ/Γ ratios that have been applied to various regions (Supplementary Table S1). He et al. (2018) used a Δ/Γ ratio of 1.2 in the North Pacific Ocean, and Sonnerup et al. (2013) suggested that possible Δ/Γ ratios for directly ventilated waters in the North Pacific do not exceed 1.0 but are greater than 1.0, for denser waters that are ventilated by physical mixing. Waugh et al. (2006) assumed a Δ/Γ ratio of 1.0, which could accurately describe global tracer distributions, while Wang et al. (2021) used a mean Δ/Γ ratio of 0.8 for the western North Pacific and the northern South China Sea. Based on the compilation of these values, we set the Δ/Γ ratio range to 0.8–1.2, in increments of 0.2.
Ideally, the TTD ages from different tracers should be equal, so we compared the correlations between TTD ages from CFC11 (TTDCFC11 age) and CFC12 (TTDCFC12 age) along with Δ/Γ ratios of 0.8, 1.0, and 1.2 (Supplementary Figure S4). For all Δ/Γ ratios, the correlation between TTDCFC11 age and TTDCFC12 age was high. We also compared the excess N2O (ΔN2O) in the water column, as estimated from the TTDCFC12 ages for each Δ/Γ ratio (i.e., ΔN2O0.8, ΔN2O1.0, and ΔN2O1.2) (Supplementary Table S2). The mean of the differences between ΔN2O0.8 and ΔN2O1.0 and between ΔN2O1.0 and ΔN2O1.2 was 0.07 ± 0.07 nmol L−1 and 0.09 ± 0.11 nmol L−1, respectively. The ΔN2O values of the available Δ/Γ ratios were not significantly different. Therefore, we used the mean Δ/Γ ratio of 1.0. N2O saturation (= N2Omeasured/N2Oeq × 100) was calculated based on N2Oeq using the water mass age corresponding to Δ/Γ ratio of 1.0.
In addition, ΔN2O1.0 and unmodified ΔN2O (i.e., estimated ΔN2O using a unitary contemporary atmospheric N2O concentration) were compared to obtain the error when estimating ΔN2O without considering the water mass age. The mean difference was 1.28 ± 1.12 nmol L-1, which was 11.3 ± 10.9% compared to the ΔN2O1.0 (Supplementary Table S2). This suggests that significant distortion may occur when estimating excess N2O if the same contemporary atmospheric N2O concentration is used for all water depths without considering the water mass age.
Results and Discussion
Hydrographic Conditions in the STWNPO
The vertical profiles of the hydrographic parameters in the STWNPO are shown in Figures 1B–F, and the distributions of the potential temperature (θ) and salinity (S) of the water masses are shown in Figure 2. The distributions of θ and S are labeled as . N* has been widely used as an indicator of nitrogen surplus (e.g., nitrogen fixation) or sinks (e.g., denitrification: → → N2O/N2), relative to phosphorus (Gruber and Sarmiento, 1997). This study utilized an N:P ratio of 16 ± 1, confirmed by Takahashi et al. (1985) and Anderson and Sarmiento (1994). Given the deviation of this stoichiometric value, the error of N* estimations was 1.65 ± 1.19 μmol L-1.
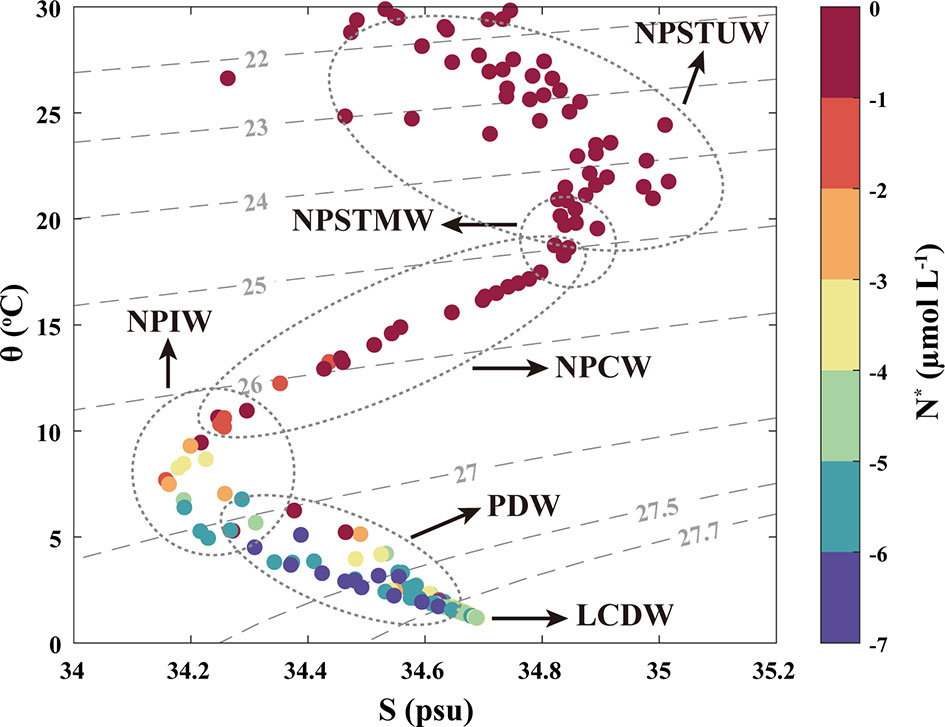
Figure 2 The potential temperature (θ) and salinity (S) distributions are labeled with N*. The dotted grey lines represent the extent of water masses, and the dashed lines represent the potential density anomaly (σθ–1000 kg m−3) of the STWNPO. Acronyms: North Pacific subtropical underwater (NPSTUW), North Pacific subtropical mode water (NPSTMW), North Pacific central water (NPCW), North Pacific intermediate water (NPIW), Pacific deep water (PDW), and lower circumpolar deep water (LCDW). This figure is also available with a gray color version in Supplementary Materials.
These results demonstrated that the distributions of θ, S, , and DO between 0 and 200 m depths were the warmest, highly saline, and N-depleted (i.e., oligotrophic) over the study period. In particular, at shallow depths (0–200 m), St. 1 to St. 4, located in the southern region, had a higher mean θ (26.34°C), maximum S (35.05 psu), and lower mean DO (195.11 µmol L−1), compared to St. 5 to St. 8, which were located in the northern region and had a mean θ of 21.97 °C, maximum S of 34.96 psu, and mean DO of 205.71 µmol L−1. These hydrographic variations are likely the reason for the different water masses being part of the surface waters of the STWNPO, that is, the North Pacific Subtropical Underwater (NPSTUW) (Suga et al., 2000; O’Connor et al., 2002; Behrens et al., 2018) in the southern region and the North Pacific Subtropical Mode Water (NPSTMW) (Hanawa and Talley, 2001; Oka, 2009; Rainville et al., 2014) in the northern region. The NPSTMW had higher average (1.56 µmol L−1) and Chl-a (0.13 µg L−1) concentrations in the northern region, relative to the southern region (1.10 µmol L−1 of and 0.11 µg L−1 of Chl-a). However, in terms of chlorophyll as an indicator of primary productivity, both regions exhibited overall low productivity in the STWNPO during this study (Figures 1E, F).
In contrast to the upper layer, the intermediate profiles (200–1500 m) in this study showed sharp fluctuations in physicochemical parameters. A pycnocline appeared just below the surface, which is a typical characteristic of North Pacific Central Water (NPCW) (Emery, 2001; Behrens et al., 2018), with an extensive range of θ (10–22°C) and S (34.2–35.2 psu) (Figures 1B, C, 2). In addition, just below the NPCW, the North Pacific Intermediate Water (NPIW) was observed with the lowest S in this study (~34.15 psu) (Figure 1C) (Talley, 1993; Behrens et al., 2018). The NPIW is ventilated by the Okhotsk Sea or an adjacent subpolar gyre with a low S and high DO. However, NPIW which had lower DO (107.56 ± 32.96 µmol L−1) than the overlying NPCW (186.12 ± 8.11 µmol L−1) (Figure 1D) was due to its long residence time (Talley, 2011). In this study, under the NPIW, the Pacific Deep Water (PDW) was observed to have minimum DO concentrations (Figure 1D) over an extensive range of depths (800–3000 m), and these core conditions were considered hypoxic (<63 µmol L−1) (Amakawa et al., 2009; Talley, 2011; Behrens et al., 2018). PDW was also identified as having the maximum nutrient concentration, which was inversely proportional to the DO concentration (Figures 1D, E) (Talley, 2011), along with its minimum N* signature (Figure 2). As the PDW is formed by upwelling, diffusion, and continued mixing with adjacent waters, its attributes become less characteristic toward the southern region (Figures 1D, E) (Talley, 2011).
The water layer beneath the PDW, the Lower Circumpolar Deep Water (LCDW) (Emery, 2001; Kawano et al., 2006; Talley, 2011), was observed to have minimal θ (~1.2 °C) and high S (~34.68 psu). The LCDW was composed of the densest and most homogeneous waters and was also identified by higher DO and N* and lower nutrient content than the PDW (Figures 1D, E, 2).
Considered together, our results demonstrate that during the investigation (spring, 2020), the STWNPO comprised six different water masses (NPSTUW, NPSTMW, NPCW, NPIW, PDW, and LCDW) and exhibited strong hydrographic variations (see Supplementary Table S3). To better understand N2O dynamics in this study, we divided the water column into three layers according to the vertical distribution of the water masses: surface (0–200 m), intermediate (200–1500 m), and deep (>1500 m) layers.
N2O Dynamics: Distribution, Controlling Factor, and Production
During this investigation, N2O concentrations within the surface layer showed an increasing trend with depth (Figure 3A). The variations in N2O in the southern region where the NPSTUW exerted influence and in the northern region where the NPSTMW exerted influence ranged from 6.4 nmol L−1 to 9.6 nmol L−1 and from 6.7 nmol L−1 to 9.5 nmol L−1, respectively. Although the N2O concentration was slightly lower in the southern region (mean N2O0–200m southern: 7.4 ± 0.9 nmol L−1) than in the northern region (mean N2O0–200m northern: 7.8 ± 0.7 nmol L−1), the average N2O saturation was higher in the southern region (120.4 ± 6.4%) than in the northern region (113.9 ± 4.4%) (Supplementary Figure S5). The dependence of solubility on temperature can explain these variations in N2O concentrations.
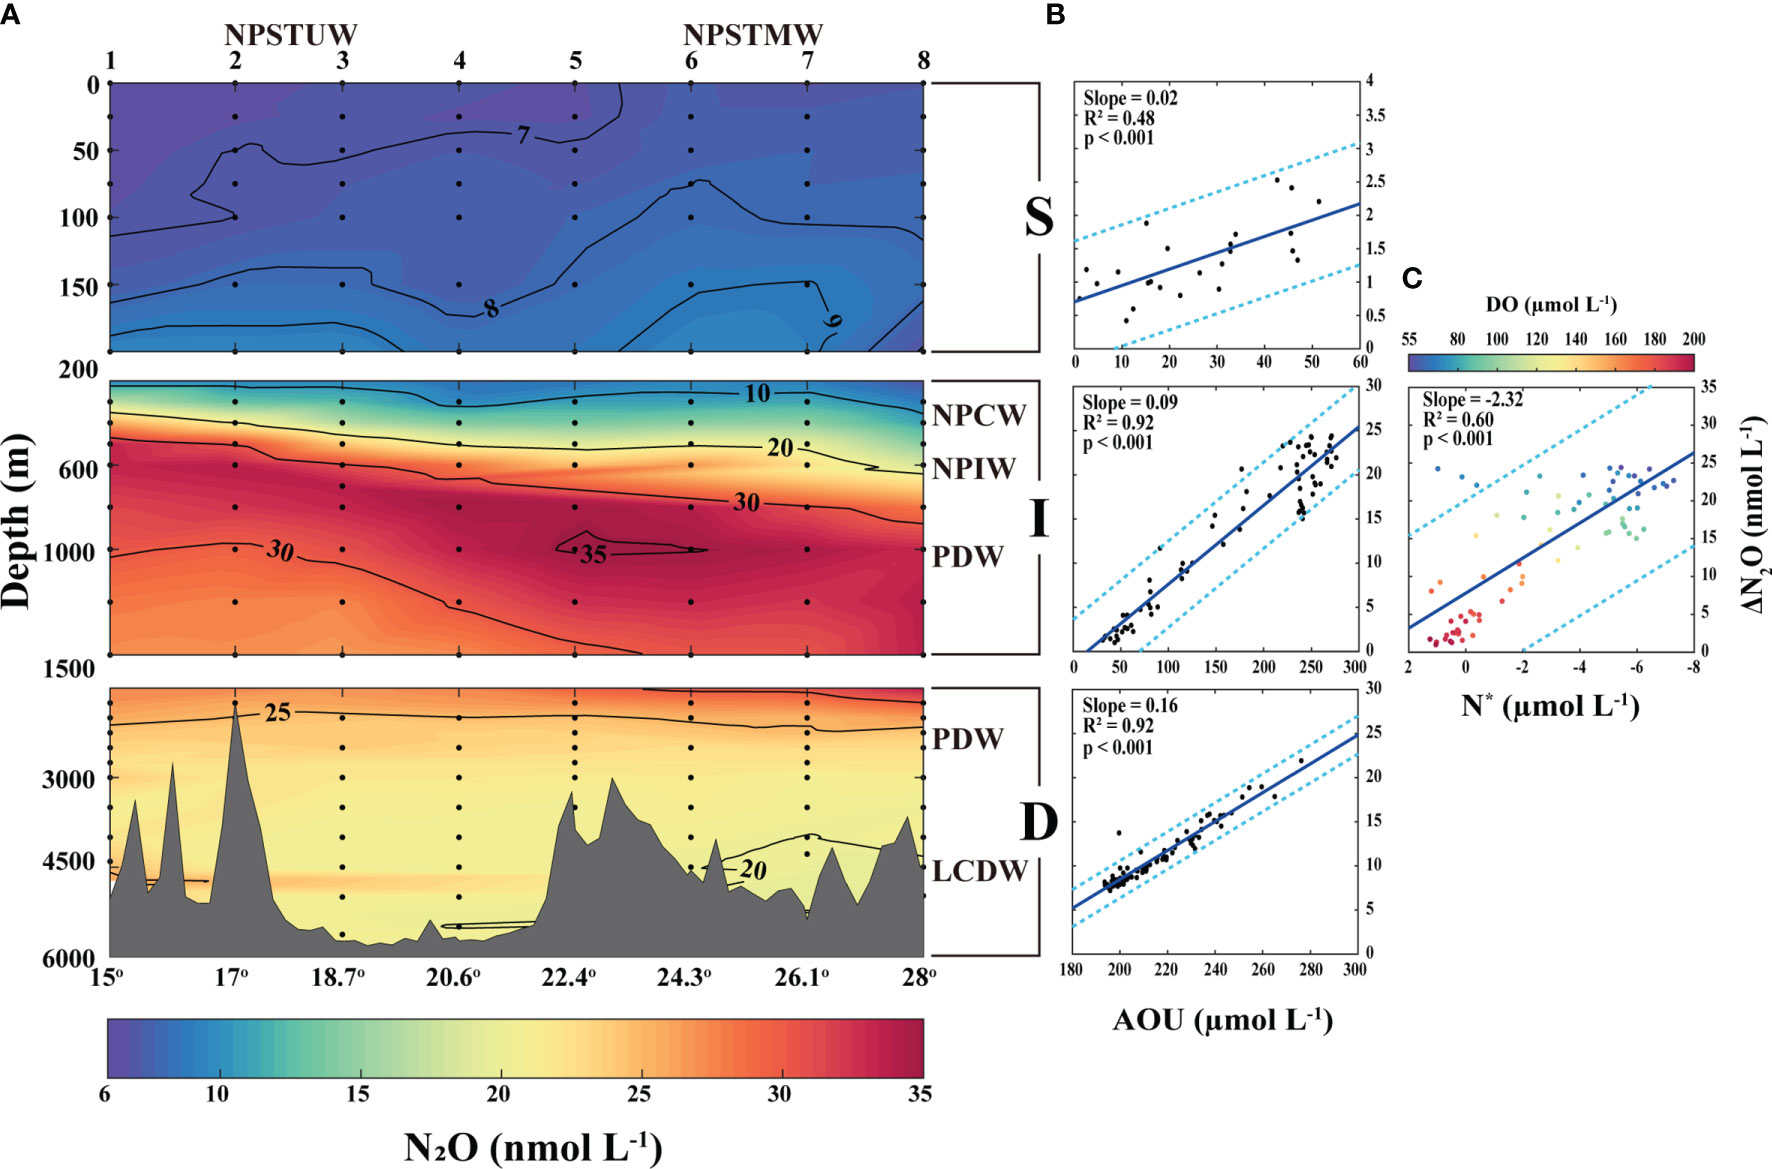
Figure 3 (A) Vertical profiling of N2O concentrations at the surface (0–200 m), intermediate (200–1500 m), and deep (1500–5774 m) layers of the STWNPO during this investigation. The black solid lines represent the contour lines and the abbreviations of water masses indicate the distribution of water masses. The top and bottom of the x-axis represent the station numbers and latitudes, respectively. (B) Correlations of ΔN2O with AOU and (C) N* at each layer. The blue lines and cyan dotted lines represent the model I linear regression and 95% prediction interval, respectively. The correlations of ΔN2O with N* at the intermediate layer are labeled with DO. This figure is also available with a gray color version in Supplementary Materials.
Prior to 2010, the N2O surface concentrations observed in the vicinity of the Western North Pacific tended to be lower (~5.6 nmol L−1), but remained slightly supersaturated compared to equilibrium values (Butler et al., 1989; Yoshida et al., 1989; Toyoda et al., 2002). However, recent observations have indicated that surface N2O concentrations increase with increasing latitude—for example, N2O concentrations in tropical regions were ~6.0 nmol L−1 and those at 30°N were under 8.0 nmol L−1 (Zhan et al., 2017). In addition, other reports from a nearby station (30°N, 145°E) reported that values increase from the surface (~6.6 nmol kg−1) toward the euphotic zone limit (~10 nmol kg−1) (Breider et al., 2015; Yoshikawa et al., 2016).
In the intermediate layer, the N2O concentrations rapidly increased up to the oxygen minimum layer (Figure 3A), and the NPCW exhibited the lowest N2O concentrations (13.4 ± 3.1 nmol L−1) and saturation values (149.6 ± 28.1%) (Supplementary Figure S5). In contrast, beneath the NPCW, the NPIW (27.4 ± 5.8 nmol L−1) exhibited higher N2O concentrations. Within the intermediate layer of the PDW, the highest N2O concentration and saturation were observed (31.1 ± 2.7 nmol L−1 and 280.4 ± 29.9%, respectively), and the maximum N2O (35.3 nmol L−1 and 324.5%) was observed in the core of the oxygen minimum layer (Figures 1D, 3A). Below the core depths, N2O concentration tended to decrease as DO concentration increased with depth.
Our observations are consistent with the findings of previous studies. An earlier study reported higher N2O concentrations (~50 nmol L−1) at similar latitudes in the eastern region (160°E) of the PDW (Butler et al., 1989), with decreasing DO concentrations toward the southeast. Toyoda et al. (2002) and Breider et al. (2015) also reported similar N2O profiles in the intermediate layer of nearby stations. However, the maximum N2O was higher in the latter by approximately 42 nmol kg−1 (approximately 43.2 nmol L-1 at a density of 27.4 kg m-3) and the DO was lower (approximately 40 μmol L−1).
In contrast, the N2O concentrations of the PDW in the deep layer showed a gradually decreasing trend (~23.9 ± 2.1 nmol L−1) with increasing depth and DO concentrations (Figure 3A). Additionally, with a stable physicochemical environment (Figure 1B–E), the underlying LCDW comprised homogeneous N2O distributions (20.8 ± 1.1 nmol L−1 and 171.8 ± 9.5%) (Supplementary Figure S5). These results are consistent with previous studies, where N2O concentrations in the deep layer decreased with increasing depth and converged to approximately 20 nmol kg−1 (approximately 20.6 nmol L-1 at an average depth of 27.74 kg m-3) (Toyoda et al., 2002). Moreover, in the deep layers (depths below 2000 m), the N2O concentrations of the North Atlantic Ocean (i.e., 13.6 ± 2.3 nmol L−1) were lower than those in the North Pacific Ocean, indicating an accumulation of N2O in deep waters over time (Bange and Andreae, 1999).
The relationship between ΔN2O and other biogeochemical tracers, represented by the apparent oxygen utilization (AOU = [DO]eq (θ, S) − [DO]measured) and N*, has been widely used to estimate the biogeochemical production and/or consumption of N2O in various marine environments (Nevison et al., 2003; Forster et al., 2009; Zhang et al., 2015; Chen et al., 2021). The AOU is typically interpreted as the amount of DO consumed during remineralization (Redfield et al., 1963; Sarmiento and Gruber, 2006), and a positive correlation between ΔN2O and AOU indicates that nitrification (→→) is the main pathway for ΔN2O production (Yoshinari, 1976; Nevison et al., 2003). In addition, a negative correlation between ΔN2O and N* indicates N2O production via denitrification (Yamagishi et al., 2005; Kock et al., 2016).
The distribution of surface N2O increased with depth, with slightly supersaturated values relative to equilibrium values. Higher N2O concentrations than the N2O capacity of seawater within the surface layer indicated that excess N2O (i.e., ΔN2O) was produced within the water column. In addition, fluctuations in physical parameters (i.e., temperature and salinity) could be responsible for the supersaturated N2O observed within the surface layer. Because the rate of N2O exchange is slower than that of heat exchange, a discrepancy between gas and thermal equilibrium may occur in the mixed layer, resulting in the N2O supersaturation of surface water (Zhan et al., 2017).
To investigate the biological effects on N2O dynamics, we evaluated the linear relationships between ΔN2O and AOU (Figure 3B) and the linear relationship between ΔN2O and (Supplementary Figure S6). However, in the mixed layer, the AOU may have been distorted because of biological activity (photosynthesis) and interactions with the atmosphere. The correlation between ΔN2O and AOU in the 0–200 m layer was weaker (R2 = 0.39, Supplementary Figure S7) than that (R2 = 0.48) for the 100–200 m layer. Therefore, we set a depth of 100 m as the boundary of the mixed layer (Yoon et al., 2022), and discussed the results below 100 m. In the surface layer, ΔN2O had relatively strong correlations with AOU and (R2 = 0.48 and R2 = 0.34, respectively) (Figure 3B and Supplementary Figure S6). Generally, nitrification in the surface layer is limited by the photoinhibition of nitrifying microorganisms and competition with phytoplankton for ammonia (Lomas and Lipschultz, 2006). Several studies have suggested the possibility of nitrification within the euphotic zone (Wankel et al., 2007; Rafter and Sigman, 2016; Stephens et al., 2020). Therefore, ΔN2O–AOU and correlations suggested that the slightly supersaturated N2O of the surface layer during this investigation may be due to the products derived from nitrification within the euphotic zone, and gradually increasing nitrification near the boundary of the euphotic zone. Recent observations of N2O production reinforce this suggestion via nitrification at a nearby location (30°N, 145°E) (Breider et al., 2015; Yoshikawa et al., 2016). In addition, the ΔN2O of the surface layer included both in-situ produced N2O and transported N2O. Approximately 30–50% of the surface ΔN2O may originate from production within the subsurface water at 100–300 m in the subtropical North Pacific Ocean (Popp et al., 2002; Breider et al., 2015).
The highest N2O concentration and saturation levels found in the intermediate layer in this investigation suggest that N2O production was vigorous. In addition, the correlation between ΔN2O and AOU and between ΔN2O and was significant (R2 = 0.92 and R2 = 0.91, respectively) (Figure 3B and Supplementary Figure S6). In addition, a negative correlation between ΔN2O and N* was evaluated in this layer, where denitrification signals were most likely to be detected, and the correlation between ΔN2O and N* was relatively strong (R2 = 0.60) (Figure 3C). These results suggest that nitrification and denitrification may contribute to the ΔN2O production in the intermediate layer, as discussed in the next section. Yoshida et al. (1989) were the first to suggest that both nitrification and denitrification are potential sources of N2O through isotopic composition analysis of the western Pacific Ocean (WPO). Similarly, other studies have observed nitrification as a significant source of the highest N2O levels (Toyoda et al., 2002; Breider et al., 2015).
Supersaturated N2O in the deep layer was not as high as in the intermediate layer, but a significant amount of N2O was observed in this study. We determined that the relationships between ΔN2O and AOU and between ΔN2O and were strongly linear (positively correlated at R2 = 0.92 and R2 = 0.81, respectively) (Figure 3B and Supplementary Figure S6). The relatively homogeneous N2O concentrations and hydrographic conditions at the bottom, and the tendency of N2O and AOU (and ) to increase with shallower depths suggest that nitrification is the primary source of N2O accumulation in the deep layer.
Is it Possible to Enhance N2O Production via Water-Column Denitrification in the Oxygen Minimum Layer?
The significant correlation between N2O and N* in the intermediate layer is likely represented by the N2O production signal via denitrification (hereafter referred to as ‘potential denitrification’). However, despite hypoxic conditions, the oxygen concentration in the oxygen minimum layer was higher than that in the oxygen minimum zone (DO < 20 µmol L-1) (Paulmier and Ruiz-Pino, 2009), where denitrification usually occurs (Bianchi et al., 2012). A possible explanation for potential denitrification in the open ocean is the formation of ‘micro-reducing environments’ provided by marine snow (Kim et al., 2013).
As aggregates descend through the water column, they entangle fine suspended particles and accumulate more in the intermediate layer (Alldredge et al., 1990). In the oxygen minimum layer, especially under hypoxic conditions, oxygen influx to the aggregates may be lower. These conditions may form a more favorable reducing microenvironment (Shanks and Reeder, 1993) and allow potential denitrification in the microzones despite aerobic conditions (Li and Peng, 2002). Indeed, aggregates consisting of not only nitrifiers but also denitrifiers on the suspended particles were observed, suggesting that the suspended particles may provide a niche in which coupled nitrification and denitrification processes can occur (Zhu et al., 2018). Yamagishi et al. (2005) also suggested the possibility of denitrification within microzones of aggregates despite the aerobic conditions in the North Pacific Ocean (44°N, 155°W).
As Frey et al. (2020) found that the addition of particulate organic matter increased N2O production by denitrification, high availability of increases N2O production through denitrification (Weier et al., 1993; Ji et al., 2015). Furthermore, the high concentration in the oxygen minimum layer may provide easy access to . Marchant et al. (2017) also suggested that denitrification aids in respiration under aerobic conditions when the electron acceptor and donor concentrations fluctuate over short temporal and spatial scales, as in permeable environments. This background and our results support potential denitrification. However, it is necessary to exclude the possibility of alternative explanations for the potential denitrification signals, although there is no direct evidence to support the occurrence of potential denitrification in the intermediate layer in the study area.
First, the low N* values and high N2O concentrations in the intermediate layer are likely due to the influence of the NPIW, which may transport denitrification signals from the eastern North Pacific Ocean, where oxygen is completely depleted in oxygen-deficient zones. Although the NPIW contained relatively low N* values and high N2O concentrations at depths adjacent to the oxygen minimum layer, the core of the NPIW exhibited N* of -1.09 μmol L-1 (Figures 2, 3A). We determined that the N* minimum (-7.28 μmol L-1) and N2O maximum (35.3 nmol L−1) values were identified in the oxygen minimum layer occupied by the PDW (Figures 1D, 3). Moreover, while the NPIW core was found at ~600 m (salinity minimum in Figure 1C), the lowest N* signals appeared at ~1250 m, dominating the PDW. These results indicate that NPIW is not a significant contributor to potential denitrification signals.
Second, the N* technique can not distinguish between denitrification signals from the water column and sedimentary interactions, assuming that all nitrate sinks result from potential denitrification. Hence, we focused on the intermediate layer, which has no direct contact with the bottom layer. Nevertheless, as the PDW originates from the upwelling of bottom water and a mixture of deep waters (Talley, 2011), the water mass history that may involve substantial exposure to the sediment needs to be considered. If the interaction with the sediment affects the signal, the N* value decreases as it approaches the bottom. However, the core of the LCDW contained a relatively high N* value (-2.68 μmol L-1), and low N2O concentrations (20.0 nmol L−1) (Figures 2, 3A) compared to the PDW. These results suggest that the influence of NPIW and sedimentary interactions were not significant contributors to the potential denitrification signals in the oxygen minimum layer.
Based on these N2O mechanisms (i.e., nitrification and potential denitrification), we attempted to estimate the fractions of N2O production derived from physical and biogeochemical processes in the intermediate layer. N2O is derived from two physical processes. First, the dissolved N2O concentration of a water parcel can interact with the atmosphere in the surface layer, thereby contributing to the internal N2O concentration. Second, mixing with water parcels originating from other surface layers can contribute to the internal N2O concentration as the water parcels move from the surface layer to an internal location.
The biological processes involved in N2O dynamics in the ocean include nitrification and denitrification. Nitrification is a remineralization process, which consumes oxygen (AOU) and produces N2O as a by-product. Freing et al. (2009) used ΔN2O/AOU as a quantitative indicator of N2O production through nitrification. In contrast, denitrification uses nitrate as an electron acceptor instead of oxygen in oxygen-deficient environments, thereby losing nitrogen. Accordingly, N* represents the nitrogen lost compared with phosphate through denitrification. As denitrification also produces N2O as a by-product, the relationship between N* and ΔN2O was used as an indicator of N2O production through denitrification (Kock et al., 2016; Fenwick et al., 2017).
Before calculating these fractions, we made the following assumptions: (1) N2O derived from physical processes is maintained in equilibrium with the atmosphere before ventilation of the water parcels and (2) N2O derived from biogeochemical processes is produced only through nitrification and potential denitrification. Although diverse processes interact in the ocean environment, we focused on evaluating these assumptions. The fractions of N2O produced were calculated as follows:
To ensure the reliability of the slopes in estimating N2O production derived from biogeochemical processes, we compiled a list of slopes obtained for diverse regions (Supplementary Table S4). The slopes of the STWNPO were lower than those in other regions known to have higher productivity (e.g., the eastern tropical Pacific Ocean and eastern tropical Atlantic Ocean). The N2O distributions and biogeochemical tracer slopes for the tropical and subtropical North Atlantic Ocean were similar to those in our observations for STWNPO. Although their extremes differ, the two regions show similar hydrographic trends because the upper circulations in both regions are mainly driven by the wind (Talley, 2011). These environments influence N2O dynamics and may explain the similar results observed in both regions. Therefore, we assumed that the slope values observed in this study were acceptable for use in our assessment.
The mean fractions of N2O production in the intermediate layer were estimated using the AOU and observations (Supplementary Figure S8). Although there was a slight variation in the fraction values between the AOU and , the trend was so similar that we employed the estimations obtained using the AOU. Given the error of rΔN20:AOU the error for estimating N2ONitrification was ±1.8%. Given the errors of N* and rΔN20:N*, the errors for estimating were ±6.9% and ±3.1%, respectively. Accordingly, the combined uncertainty in was estimated to be ±12.4%. Among the total N2O concentrations within the intermediate layer, the fractions of biogeochemically derived N2O were greater than those of physical processes. Because of the influence of the oxygen minimum layer in the intermediate water column, N2O production from potential denitrification in this study was higher at high latitudes, where lower DO was observed (Supplementary Figure S8). The fractions of N2O produced by potential denitrification in biogeochemical processes range from 17 to 25%, suggesting that N2O may be produced by potential denitrification in hypoxic waters.
In addition, the N2O production rates (i.e., rΔN20:AOU and rΔN20:N*) of water masses adjacent to the oxygen minimum layer were compared to investigate the potential N2O contribution during the mixing of the water masses (Supplementary Table S5). The NPIW overlying the upper boundary of the oxygen minimum layer exhibited a relatively high rΔN20:AOU (0.11) and rΔN20:N* (-1.35). Compared with the production rates in the intermediate layer, the NPIW may contribute approximately 55% of N2ONitrification and 37% of in proportion to the mixing ratio. The PDW in the deep layer, which is underlying the lower boundary of the oxygen minimum layer, also exhibited higher rΔN20:AOU (0.16) and rΔN20:N* (-0.84) and may contribute 64% of N2ONitrification and 27% of in proportion to mixing ratio.
For global biological N2O estimation (Freing et al., 2012), the impact of denitrification on N2O production was considered to occur only in the Arabian Sea and eastern tropical Pacific Ocean. In the oxygen minimum layer of the Arabian Sea and eastern tropical North and South Pacific, the fractions of N2O produced through denitrification ranged up to 89%, 35%, and 14%, respectively. They produced higher estimates of the fractions in the Arabian Sea and eastern tropical North Pacific Ocean and lower fractions in the eastern tropical South Pacific Ocean than the present estimates for the STWNPO, where we observed higher DO concentrations in the oxygen minimum layer.
These differences may be attributed to several factors that were not considered in the present study. Non-constant remineralization ratios, including N:P, can vary with depth. The N:P ratio in the Pacific Ocean has been reported to be approximately 12–14 and 15–16 between 1000 and 3000 m and 3000–4000 m, respectively, which influences N* (Anderson and Sarmiento, 1994). However, the present estimation was performed using a constant Redfield ratio of 16, and the preformed nutrients were not considered. Furthermore, as N* is indirect evidence for denitrification, our estimations using N* involve uncertainty. Our estimates could not distinguish N2O production via nitrifier denitrification, although nitrifier denitrification is known to contribute to N2O production in STWNPO (Breider et al., 2015; Yoshikawa et al., 2016). In addition, we simplified the physical processes involved in the N2O dynamics. Significant uncertainties likely accompany these factors. However, as providing the possibility of potential denitrification in the STWNPO is still crucial in the global N cycle, future studies involving tracers such as nitrogen and oxygen isotopes and information on aggregate microzones are needed.
Estimation of N2O Flux STWNPO Source or Sink?
To determine whether the STWNPO was a source or sink for atmospheric N2O during this investigation, we used the air–sea gas exchange equation presented below:
During this study, the average N2O flux of the STWNPO was 2.0 ± 0.3 µmol m−2 d−1 (Supplementary Table S7). Excluding St. 8 (where it was windy during the observations), the average N2O flux of the stations was 1.5 ± 0.2 µmol m−2 d−1, and in contrast, the St. 8 flux was comparatively high (5.6 ± 1.3 µmol m−2 d−1). Although the N2O saturation at St. 8 was comparatively lower than at lower latitudes (see Section 3.2), the high N2O flux would be due to intense wind speeds. This suggests that in STWNPO, surface waters are already supersaturated with N2O and could release more N2O into the atmosphere during physical stress.
The N2O fluxes of the STWNPO varied with time and the estimation methods used. Butler et al. (1989) estimated that N2O fluxes ranged from 0.04 to 0.13 µmol m−2 d−1 in the subtropical gyre of the West Pacific Ocean. In that study, the average surface anomaly was lower (~2.5%). In general, open oceans at low latitudes, such as the tropical and subtropical Pacific Ocean, have low variability, and their effects on N2O dynamics are small. For example, simulated seasonal variations in parameters related to N2O dynamics showed little variation in STWNPO (30° N, 145° E) (Yoshikawa et al., 2016). The N2O flux fluctuated slightly higher in winter, but this was because of the wind speed. The surface N2O of the STWNPO originates from N2O production through nitrification, and the nitrate concentration also shows little seasonal variation. For there to be some effect on existing N2O dynamics, a relatively large event must occur. Butler et al. (1989) highlighted El Niño as an event present in their study. El Niño, which is a natural climate variability in the Pacific Ocean, can reduce the upward diffusion of rich subsurface N2O by suppressing upwelling, which consequently reduces N2O efflux (Cline et al., 1987; Ji et al., 2019). The present study area is distant from this interannual event centered on the equator, which may have caused the differences in the results.
In addition, Zhan et al. (2017) estimated N2O fluxes in STWNPO using the method. Their flux estimations were higher (14.8 ± 2.8 µmol m−2 d−1) than the present result, despite the surface saturation anomaly being similar (~8%). As we calculated the N2O flux analogously (i.e., following Eqs. 8-11), the difference between our flux values and those of Zhan et al. (2017) are most likely due to differences in wind speed around the time of sampling. Some attempts have been made to estimate N2O flux in the western North Pacific using the isotopic mass balance method (Breider et al., 2015; Yoshikawa et al., 2016). Their findings showed that the N2O distributions in the subtropical and subarctic regions were similar (~6–8 nmol kg−1) and higher (~10–11.9 nmol kg−1) than those in our results, and the N2O fluxes were lower in the subtropical region (0.5–0.9 µmol m−2 d−1) than in the subarctic region (~6.3 µmol m−2 d−1), but the overall flux values were lower than those in the present observation. Although the spatial and temporal variability of N2O production in the STWNPO is very low, our study showed different results related to N2O flux compared with other studies. These variations could be the reasons for the different approaches to estimating the N2O fluxes in the ocean environment.
The STWNPO serves as an apparent source of atmospheric N2O. However, like many other regions worldwide, this region is undergoing various climatic changes that may affect N2O dynamics. To understand the variation in N2O flux in the STWNPO, we compared the present results with those from other regions dominated by different N2O dynamics (Figure 4 and Supplementary Table S8). The N2O flux in global ocean conditions fluctuates, but the average flux of a normoxic ocean is estimated to be under 1 µmol m−2 d−1 (Naqvi et al., 2010). N2O flux values tended to be higher in the coastal region than in the open ocean (Figure 4). However, they were occasionally significantly higher in the several regions characterized by high productivity and depleted oxygen (upwelling region). In an upwelling environment, subsurface water is directed toward the surface, accompanied by accumulated N2O. This condition also provides a nutrient-rich environment with low DO and triggers high productivity and remineralization. The depletion of oxygen produces N2O from nitrification and denitrification. As N2O is also consumed by further denitrification (N2O → N2) in oxygen-depleted waters, relatively low N2O emissions (but still high compared with normal oceans) into the atmosphere were observed in the eastern tropical South Pacific Ocean at 12.7–30.7 µmol m−2 d−1 (Farías et al., 2009). Nevertheless, significant N2O effluxes in the upwelling region have been recorded at up to 3243 µmol m−2 d−1 (Naqvi et al., 2006; Arevalo-Martínez et al., 2015; Fenwick and Tortell, 2018; Ji et al., 2019; Morgan et al., 2019). In addition, N2O effluxes (2.3 ± 2.7 μmol m-2 d-1) were emitted from the southern Chukchi Sea (Heo et al., 2021), which is a highly productive area (Bates and Mathis, 2009). Here, N2O was derived from nitrification in the water column, and upward transport originated from nitrification or denitrification in the sediment due to the shallow depths, despite oxic environmental conditions.
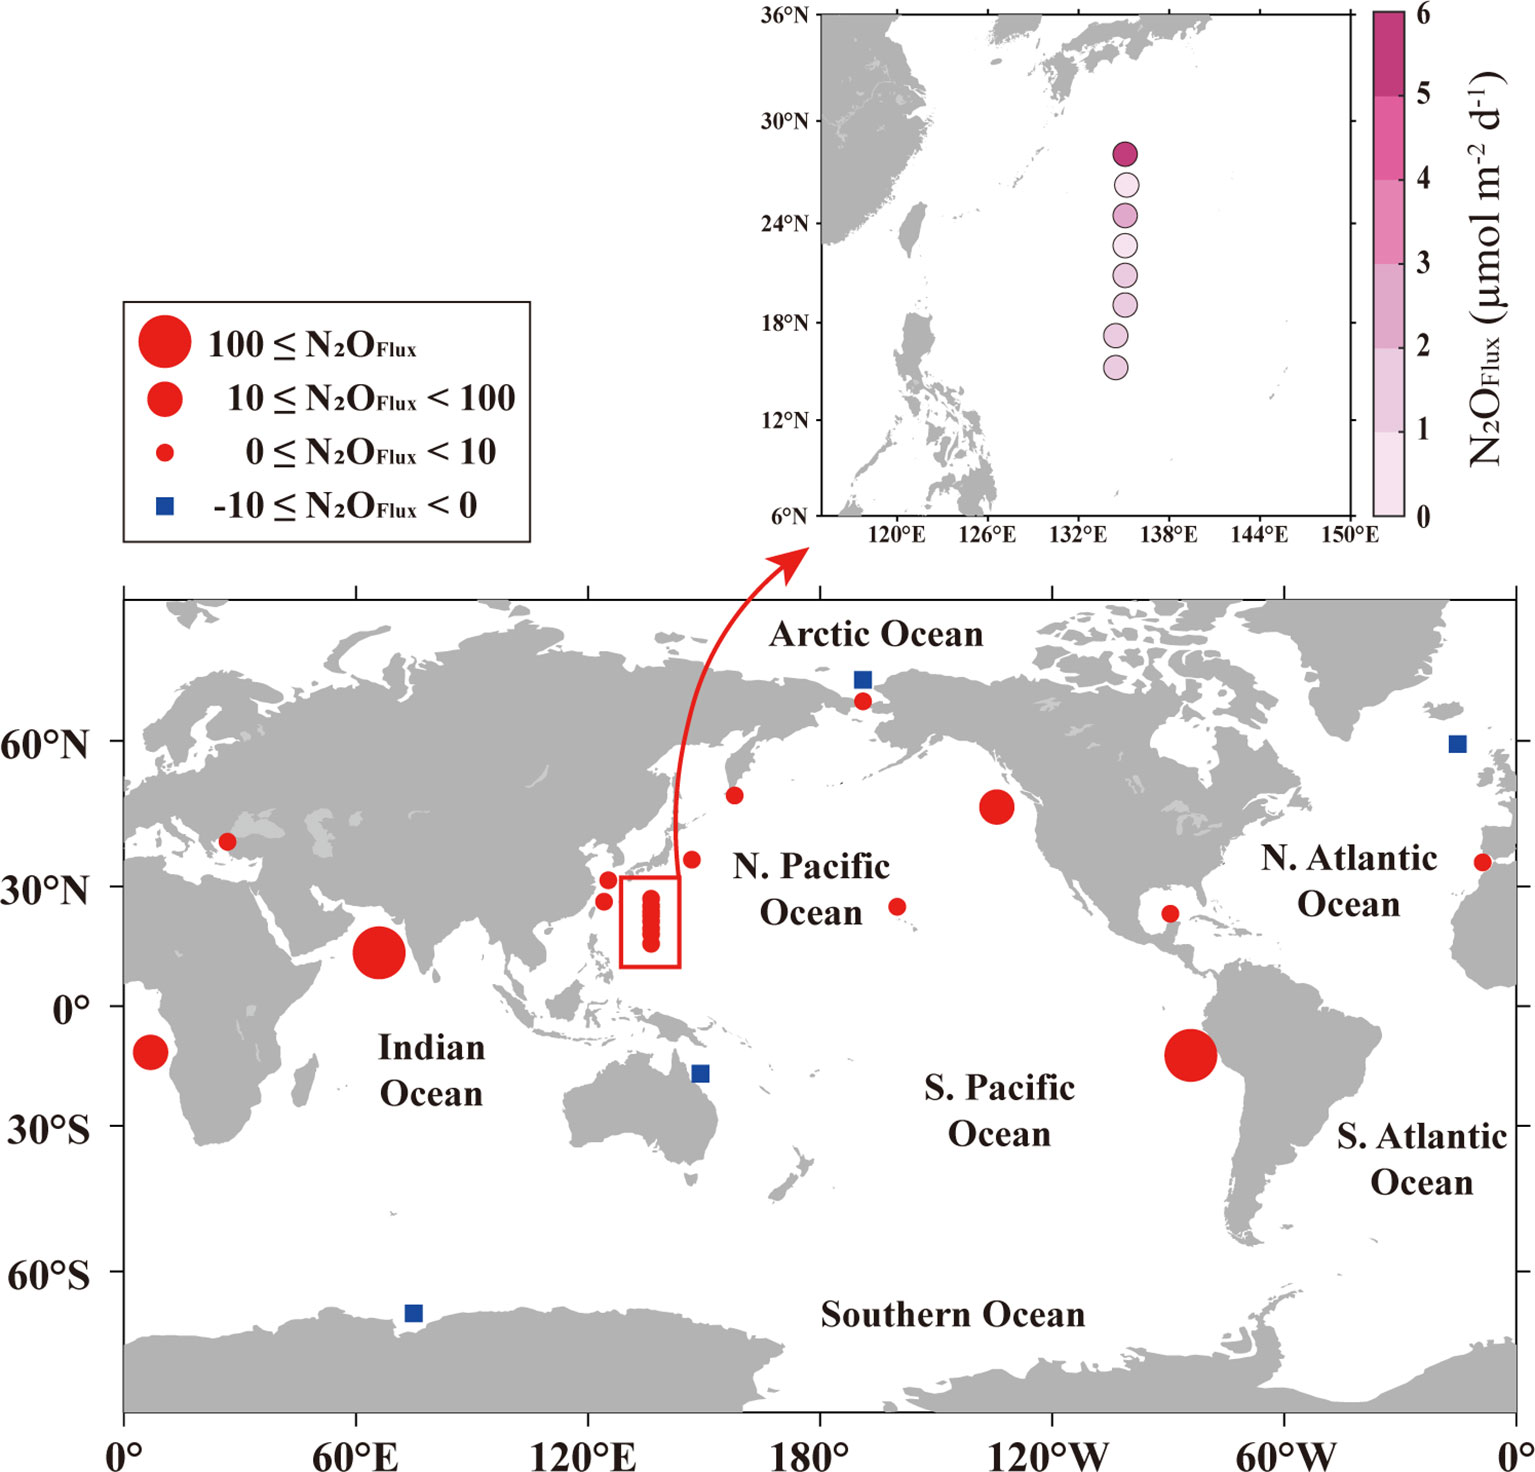
Figure 4 Spatial distribution of STWNPO surface N2O fluxes across the air–sea interface during the investigation (spring, 2020) and N2O fluxes from various regions. The points encompassed by the red box represent the current study area. The N2O flux values of different regions are given in Supplementary Table S8.
Implications for Future Studies
Based on our results, we speculated on the implications of ocean warming, deoxygenation, acidification, and anthropogenic nitrogen deposition (AND) on the overall N2O dynamics of STWNPO. Since 1900, the western boundary current of the North Pacific Ocean has experienced two-fold greater warming trends than the global average (Wu et al., 2012). Ocean warming is a significant driver of deoxygenation (Levin, 2018), the Oyashio region (NPIW origin) has undergone deoxygenation and increased stratification. The deoxygenation originating therein has propagated into the interior of the North Pacific Ocean (Sasano et al., 2018). The intermediate water column of the middle-and high-latitude North Pacific may lose more oxygen in the future (Bopp et al., 2017). These environmental changes could expand the oxygen minimum layer of STWPO. In addition, ocean acidification in the STWNPO has accelerated in recent years (Ono et al., 2019), and evidence of acidification was observed in this investigation (Supplementary Figure S9). Furthermore, AND has also been increasing because of human activities that disturb the N cycle in the western North Pacific Ocean (Kim et al., 2014).
The increase in the thermal energy transmitted into the western Pacific Ocean, where N2O is slightly supersaturated due to its production via nitrification (Figure 5), decreases gas solubility. Subsequently, the increased N2O efflux into the atmosphere can accelerate the greenhouse effect (positive feedback). The expansion of the oxygen minimum layer could potentially elevate denitrification-based N2O production (positive feedback) (Figure 5). Decreased pH conditions in the ocean also decrease nitrification and N2O production (Beman et al., 2011). For instance, recent reports have observed decreases in N2O production from 44% to 2.4% (Rees et al., 2016), and from 72.38 to 50.77% (Gu et al., 2021), along with decreased pH values. Further, in the western North Pacific Ocean, acidified conditions decreased nitrification but increased N2O production through the ammonia-oxidizing archaeal process (Breider et al., 2019) and which has also been observed in a variety of other environments, including in freshwater and upwelling regions (Frame et al., 2017). Despite this evidence, apparent inhibition of nitrification by acidification has been observed in the Pacific and Atlantic oceans (Beman et al., 2011), suggesting that accelerating acidification in the western North Pacific may decrease nitrification rates and N2O production (negative feedback) (Figure 5). AND stimulates productivity by supplying limited nutrients and it consequently elevates nitrification and N2O production (positive feedback) (Suntharalingam et al., 2012). Atmospheric dust deposition, the vehicle for AND, directly acidifies the seawater. Nitrification elevated by AND-driven productivity also provides a greater H+ concentration in the water column, leading to ocean acidification (negative feedback) (Doney et al., 2007; Sarma et al., 2021). Therefore, AND exerts a combination of positive and negative effects on N2O production in STWNPO. However, our present speculations lack direct observations of related parameters, making it difficult to determine a causal relationship. With regard to these speculations, future studies must focus on the impacts of climate change to better understand N2O dynamics and the associated air–sea gas exchange in STWNPO.
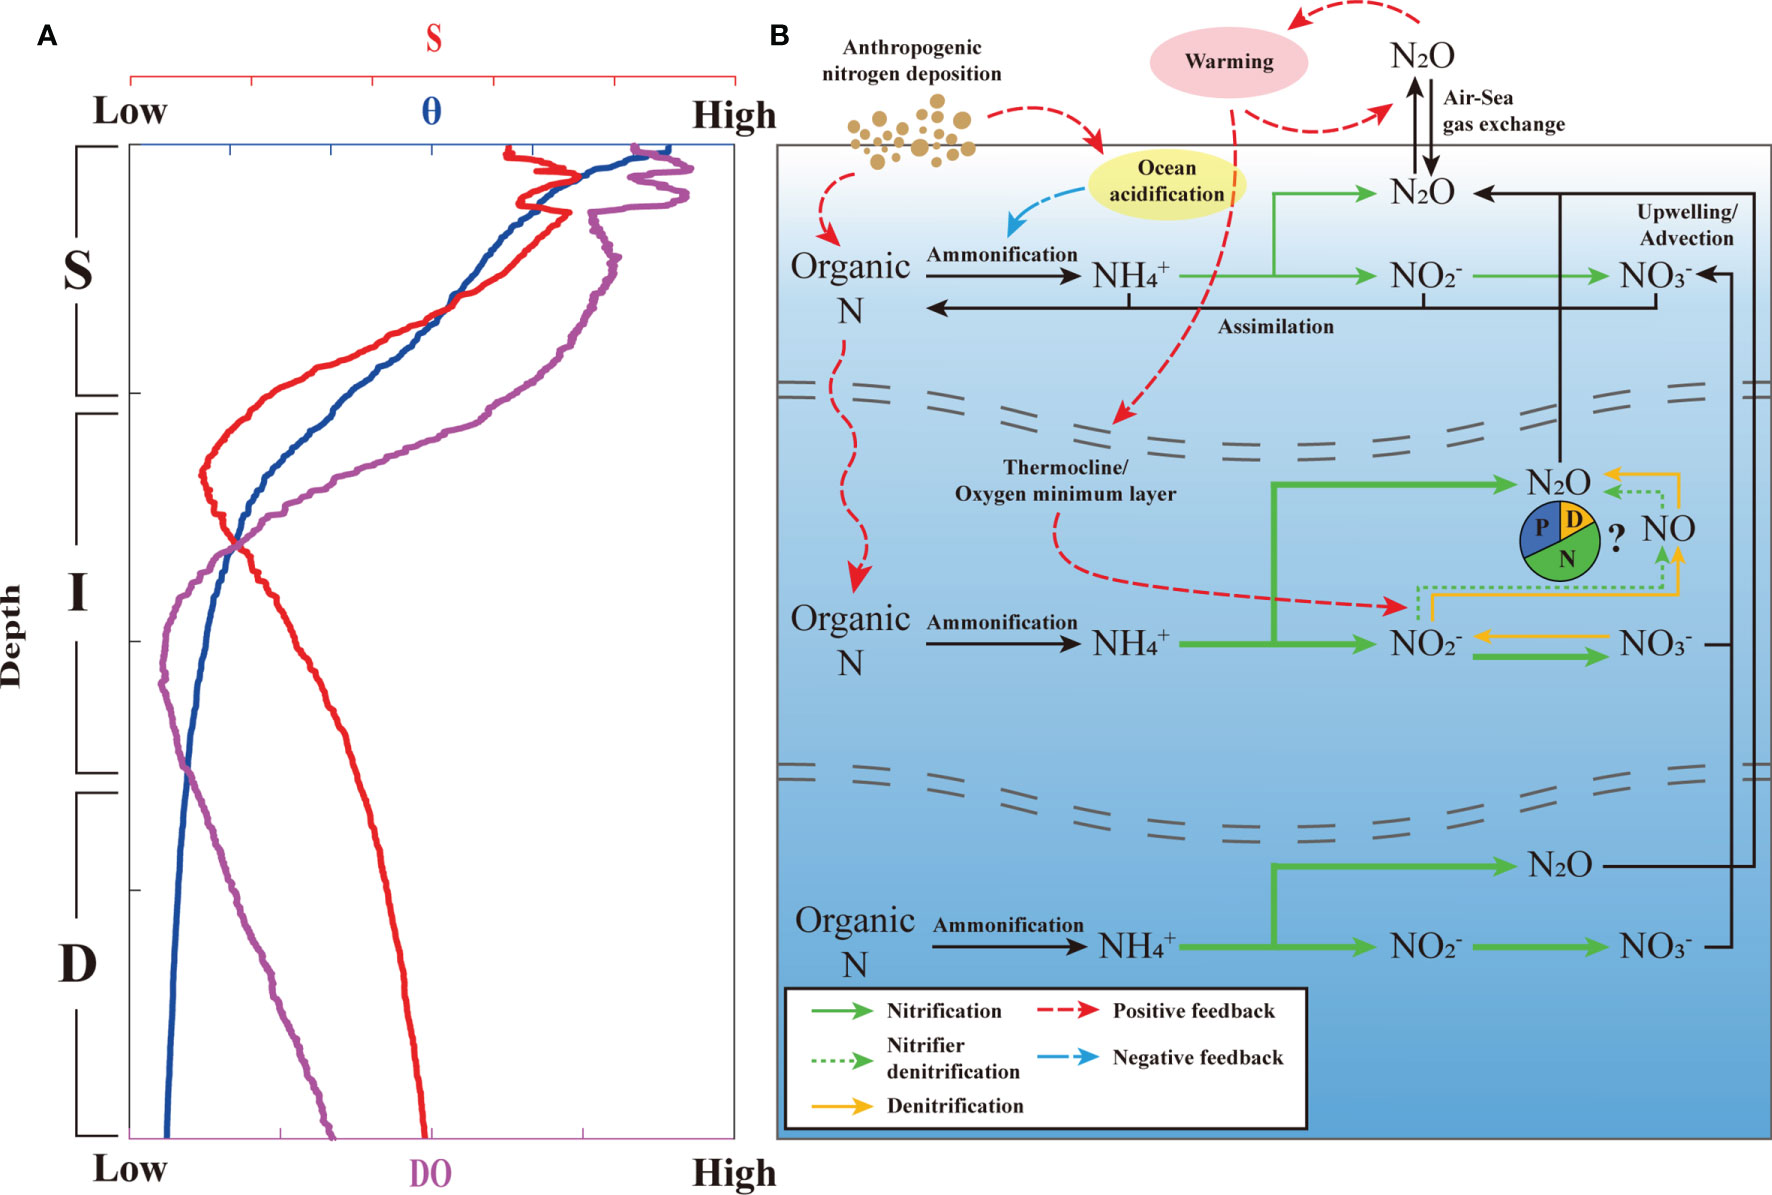
Figure 5 (A) Typical vertical profiling of potential temperature (θ), salinity (S), and oxygen (DO) concentration during this investigation from the STWNPO. (B) Schematic representation of N2O dynamics in this study. The green and yellow solid arrows represent nitrification and potential denitrification processes, respectively, the green dotted arrows represent the nitrifier denitrification process, and the thickness of the arrows depicts the proportion of the N2O production and associated mechanisms within each layer. The red dashed and blue dash-dotted lines represent positive and negative feedback for N2O dynamics, respectively. The blue, green, and yellow columns of the pie chart represent the approximate fractions of N2O produced through physical (P), nitrification (N), and denitrification (D) processes in the thermocline/oxygen minimum layer (OML), respectively. The estimated N2O production for each station is given in the Supplementary Figure S8.
Summary and Conclusions
We investigated the distribution of N2O concentrations and their production and controlling mechanisms (N2O dynamics) on the surface (0–200 m), intermediate (200–1500 m), and deep layers (1500–5774 m) of the STWNPO. N2O concentrations were slightly oversaturated in the surface layer relative to the atmospheric equilibrium and tended to increase with depth. The low ΔN2O in the surface layer was produced by nitrification. In the intermediate layer, N2O distribution corresponded with oxygen consumption. Therefore, the maximum N2O concentration was observed at the core of the oxygen minimum layer. However, unlike that in the surface column, a significant amount of ΔN2O was produced through nitrification and potential denitrification. The deeper layer exhibited higher DO and lower N2O concentrations, and nitrification was the main source of N2O in the deep layer.
Our results demonstrated that the STWNPO served as an apparent source of atmospheric N2O, although not to the extent as the regions known to be N2O hotspots. As STWNPO has been characterized by ongoing ocean changes (e.g., ocean warming, deoxygenation, acidification, and atmospheric nitrogen deposition), further clarification is required to understand the N2O dynamics of future climate change scenarios. As the present investigation was limited, it is difficult to predict how these environmental changes may affect the future N2O dynamics of STWNPO. Therefore, further studies must focus on the N2O dynamics associated with environmental changes in the STWNPO region.
Data Availability Statement
The original contributions presented in the study are included in the article/Supplementary Material. Further inquiries can be directed to the corresponding author.
Author Contributions
J-MH and H-RK conducted sampling. J-MH, H-RK, S-ME, and J-HS conducted measurements. J-MH, ST, and I-NK developed the concept and design of the study, and wrote the manuscript. All the authors discussed the results and commented on the manuscript. All authors contributed to the article and approved the submitted version.
Funding
This study was supported by a grant from the Korea Institute of Ocean Science and Technology (KIOST) (PE99887). This study was also supported by the National Institute of Fisheries Science (R2022055) and the National Research Foundation of Korea (NRF) funded by the Korean government (MSIT) (NRF-2022R1A2C1008475).
Conflict of Interest
The authors declare that the research was conducted in the absence of any commercial or financial relationships that could be construed as a potential conflict of interest.
Publisher’s Note
All claims expressed in this article are solely those of the authors and do not necessarily represent those of their affiliated organizations, or those of the publisher, the editors and the reviewers. Any product that may be evaluated in this article, or claim that may be made by its manufacturer, is not guaranteed or endorsed by the publisher.
Supplementary Material
The Supplementary Material for this article can be found online at: https://www.frontiersin.org/articles/10.3389/fmars.2022.854651/full#supplementary-material
References
Alldredge A. L., Granata T. C., Gotschalk C. C., Dickey T. D. (1990). The Physical Strength of Marine Snow and its Implications for Particle Disaggregation in the Ocean. Limnol. Oceanograph. 35 (7), 1415–1428. doi: 10.4319/lo.1990.35.7.1415
Amakawa H., Sasaki K., Ebihara M. (2009). Nd Isotopic Composition in the Central North Pacific. Geochim. Cosmochim. Acta 73 (16), 4705–4719. doi: 10.1016/j.gca.2009.05.058
Anderson L. A., Sarmiento J. L. (1994). Redfield Ratios of Remineralization Determined by Nutrient Data Analysis. Global Biogeochem. Cycle. 8 (1), 65–80. doi: 10.1029/93GB03318
Arevalo-Martínez D. L., Kock A., Löscher C., Schmitz R. A., Bange H. W. (2015). Massive Nitrous Oxide Emissions From the Tropical South Pacific Ocean. Nat. Geosci. 8 (7), 530–533. doi: 10.1038/ngeo2469
Bange H. W. (2006). New Directions: The Importance of Oceanic Nitrous Oxide Emissions. Atmosph. Environ. 40 (1), 198–199. doi: 10.1016/j.atmosenv.2005.09.030
Bange H. W., Andreae M. O. (1999). Nitrous Oxide in the Deep Waters of the World's Oceans. Global Biogeochem. Cycle. 13 (4), 1127–1135. doi: 10.1029/1999GB900082
Bates N. R., Mathis J. T. (2009). The Arctic Ocean Marine Carbon Cycle: Evaluation of Air-Sea CO2 Exchanges, Ocean Acidification Impacts and Potential Feedbacks. Biogeosciences 6 (11), 2433–2459. doi: 10.5194/bg-6-2433-2009
Battle M., Bender M., Sowers T., Tans P., Butler J., Elkins J., et al. (1996). Atmospheric Gas Concentrations Over the Past Century Measured in Air From Firn at the South Pole. Nature 383 (6597), 231–235. doi: 10.1038/383231a0
Behrens M. K., Pahnke K., Schnetger B., Brumsack H.-J. (2018). Sources and Processes Affecting the Distribution of Dissolved Nd Isotopes and Concentrations in the West Pacific. Geochim. Cosmochim. Acta 222, 508–534. doi: 10.1016/j.gca.2017.11.008
Beman J. M., Chow C.-E., King A. L., Feng Y., Fuhrman J. A., Andersson A., et al. (2011). Global Declines in Oceanic Nitrification Rates as a Consequence of Ocean Acidification. Proc. Natl. Acad. Sci. 108 (1), 208–213. doi: 10.1073/pnas.1011053108
Beman J. M., Leilei Shih J., Popp B. N. (2013). Nitrite Oxidation in the Upper Water Column and Oxygen Minimum Zone of the Eastern Tropical North Pacific Ocean. ISME. J. 7 (11), 2192–2205. doi: 10.1038/ismej.2013.96
Bergman T. L., Incropera F. P., Dewitt D. P., Lavine A. S. (2011). Fundamentals of Heat and Mass Transfer (New York: John Wiley & Sons).
Bianchi D., Dunne J. P., Sarmiento J. L., Galbraith E. D. (2012). Data-Based Estimates of Suboxia, Denitrification, and N2O Production in the Ocean and Their Sensitivities to Dissolved O2. Global Biogeochem. Cycle. 26 (2), 6550–55. doi: 10.1029/2011GB004209
Bopp L., Resplandy L., Untersee A., Le Mezo P., Kageyama M. (2017). Ocean (De) Oxygenation From the Last Glacial Maximum to the Twenty-First Century: Insights From Earth System Models. Philos. Trans. R. Soc. A.: Math. Phys. Eng. Sci. 375 (2102), 20160323. doi: 10.1098/rsta.2016.0323
Breider F., Yoshikawa C., Abe H., Toyoda S., Yoshida N. (2015). Origin and Fluxes of Nitrous Oxide Along a Latitudinal Transect in Western North Pacific: Controls and Regional Significance. Global Biogeochem. Cycle. 29 (7), 1014–1027. doi: 10.1002/2014GB004977
Breider F., Yoshikawa C., Makabe A., Toyoda S., Wakita M., Matsui Y., et al. (2019). Response of N2O Production Rate to Ocean Acidification in the Western North Pacific. Nat. Climate Change 9 (12), 954–958. doi: 10.1038/s41558-019-0605-7
Butler J. H., Elkins J. W., Thompson T. M., Egan K. B. (1989). Tropospheric and Dissolved N2O of the West Pacific and East Indian Oceans During the El Nino Southern Oscillation Event of 1987. J. Geophys. Res.: Atmos. 94 (D12), 14865–14877. doi: 10.1029/JD094iD12p14865
Cheng L., Abraham J., Hausfather Z., Trenberth K. E. (2019). How Fast are the Oceans Warming? Science 363 (6423), 128–129. doi: 10.1126/science.aav7619
Chen X., Ma X., Gu X., Liu S., Song G., Jin H., et al. (2021). Seasonal and Spatial Variations of N2O Distribution and Emission in the East China Sea and South Yellow Sea. Sci. Tot. Environ. 775, 145715. doi: 10.1016/j.scitotenv.2021.145715
Chen L., Zhang J., Zhan L., Li Y., Sun H. (2014). Differences in Nitrous Oxide Distribution Patterns Between the Bering Sea Basin and Indian Sector of the Southern Ocean. Acta Oceanol. Sin. 33 (6), 9–19. doi: 10.1007/s13131-014-0484-8
Cline J. D., Wisegarver D. P., Kelly-Hansen K. (1987). Nitrous Oxide and Vertical Mixing in the Equatorial Pacific During the 1982–1983 El Niño. Deep. Sea. Res. Part A. Oceanog. Res. Pap. 34 (5-6), 857–873. doi: 10.1016/0198-0149(87)90041-0
Codispoti L. A., Christensen J. P. (1985). Nitrification, Denitrification and Nitrous Oxide Cycling in the Eastern Tropical South Pacific Ocean. Mar. Chem. 16 (4), 277–300. doi: 10.1016/0304-4203(85)90051-9
Cohen Y., Gordon L. I. (1978). Nitrous Oxide in the Oxygen Minimum of the Eastern Tropical North Pacific: Evidence for its Consumption During Denitrification and Possible Mechanisms for its Production. Deep. Sea. Res. 25 (6), 509–524. doi: 10.1016/0146-6291(78)90640-9
Cohen Y., Gordon L. I. (1979). Nitrous Oxide Production in the Ocean. J. Geophys. Res.: Ocean. 84 (C1), 347–353. doi: 10.1029/JC084iC01p00347
Corno G., Karl D. M., Church M. J., Letelier R. M., Lukas R., Bidigare R. R., et al. (2007). Impact of Climate Forcing on Ecosystem Processes in the North Pacific Subtropical Gyre. J. Geophys. Res.: Ocean. 112 (C4), CO4021. doi: 10.1029/2006JC003730
Crutzen P. J. (1970). The Influence of Nitrogen Oxides on the Atmospheric Ozone Content. Q. J. R. Meteorol. Soc. 96 (408), 320–325. doi: 10.1002/qj.49709640815
Dalsgaard T., Thamdrup B., Farías L., Revsbech N. P. (2012). Anammox and Denitrification in the Oxygen Minimum Zone of the Eastern South Pacific. Limnol. Oceanograph. 57 (5), 1331–1346. doi: 10.4319/lo.2012.57.5.1331
Dickson A. G., Sabine C. L., Christian J. R. (2007). Guide to Best Practices for Ocean CO2 Measurements. Sidney: PICES Special Publication.
Doney S. C., Mahowald N., Lima I., Feely R. A., Mackenzie F. T., Lamarque J.-F., et al. (2007). Impact of Anthropogenic Atmospheric Nitrogen and Sulfur Deposition on Ocean Acidification and the Inorganic Carbon System. Proc. Natl. Acad. Sci. 104 (37), 14580–14585. doi: 10.1073/pnas.0702218104
Doney S. C., Ruckelshaus M., Emmett Duffy J., Barry J. P., Chan F., English C. A., et al. (2012). Climate Change Impacts on Marine Ecosystems. Annu. Rev. Mar. Sci. 4, 11–37. doi: 10.1146/annurev-marine-041911-111611
Dore J. E., Popp B. N., Karl D. M., Sansone F. J. (1998). A Large Source of Atmospheric Nitrous Oxide From Subtropical North Pacific Surface Waters. Nature 396 (6706), 63–66. doi: 10.1038/23921
Douglas N., Byrne R. H. (2017a). Achieving Accurate Spectrophotometric pH Measurements Using Unpurified Meta-Cresol Purple. Mar. Chem. 190, 66–72. doi: 10.1016/j.marchem.2017.02.004
Douglas N., Byrne R. H. (2017b). Spectrophotometric pH Measurements From River to Sea: Calibration of mCP for 0≤ S ≤ 40 and 278.15≤ T ≤ 308.15 K. Mar. Chem. 197, 64–69. doi: 10.1016/j.marchem.2017.10.001
Emery W. J. (2001). “Water Types and Water Masses,” in Encyclopedia of Ocean Sciences, ed. Steele J. H. (Oxford: Academic Press), 3179–87.
Farías L., Castro-González M., Cornejo M., Charpentier J., Faúndez J., Boontanon N., et al. (2009). Denitrification and Nitrous Oxide Cycling Within the Upper Oxycline of the Eastern Tropical South Pacific Oxygen Minimum Zone. Limnol. Oceanograph. 54 (1), 132–144. doi: 10.4319/lo.2009.54.1.0132
Fenwick L., Capelle D., Damm E., Zimmermann S., Williams W. J., Vagle S., et al. (2017). Methane and Nitrous Oxide Distributions Across the North American Arctic Ocean During Summe. J. Geophys. Res.: Ocean. 122 (1), 390–412. doi: 10.1002/2016JC012493
Fenwick L., Tortell P. D. (2018). Methane and Nitrous Oxide Distributions in Coastal and Open Ocean Waters of the Northeast Subarctic Pacific During 2015–2016. Mar. Chem. 200, 45–56. doi: 10.1016/j.marchem.2018.01.008
Forster G., Upstill-Goddard R. C., Gist N., Robinson C., Uher G., Woodward E. M. S. (2009). Nitrous Oxide and Methane in the Atlantic Ocean Between 50°N and 52°S: Latitudinal Distribution and Sea-to-Air Flux. Deep. Sea. Res. Part II.: Top. Stud. Oceanograph. 56 (15), 964–976. doi: 10.1016/j.dsr2.2008.12.002
Frame C. H., Lau E., Nolan E. J., Goepfert T. J., Lehmann M. F. (2017). Acidification Enhances Hybrid N2O Production Associated With Aquatic Ammonia-Oxidizing Microorganisms. Front. Microbiol. 7. doi: 10.3389/fmicb.2016.02104
Freing A., Wallace D. W., Bange H. W. (2012). Global Oceanic Production of Nitrous Oxide. Philosophical Transactions of the Royal Society B. Biol. Sci. 367 (1593), 1245–1255. doi: 10.1098/rstb.2011.0360
Freing A., Wallace D. W., Tanhua T., Walter S., Bange H. W. (2009). North Atlantic Production of Nitrous Oxide in the Context of Changing Atmospheric Levels. Global Biogeochem. Cycle. 23 (4), GB4015. doi: 10.1029/2009GB003472
Frey C., Bange H. W., Achterberg E. P., Jayakumar A., Löscher C. R., Arévalo-Martínez D. L., et al. (2020). Regulation of Nitrous Oxide Production in Low-Oxygen Waters Off the Coast of Peru. Biogeosciences 17 (8), 2263–2287. doi: 10.5194/bg-17-2263-2020
Goreau T. J., Kaplan W. A., Wofsy S. C., McElroy M. B., Valois F. W., Watson S. W. (1980). Production of NO2- and N2O by Nitrifying Bacteria at Reduced Concentrations of Oxygen. Appl. Environ. Microbiol. 40 (3), 526–532. doi: 10.1128/aem.40.3.526-532.1980
Gruber N., Sarmiento J. L. (1997). Global Patterns of Marine Nitrogen Fixation and Denitrification. Global Biogeochem. Cycle. 11 (2), 235–266. doi: 10.1029/97GB00077
Gu T., Jia D., Ma X., Peng L., Zhang G., Wei Y., et al. (2021). Hypoxia-Enhanced N2O Production Under Ocean Acidification in the Bohai Sea. Mar. Sci. 8. doi: 10.3389/fmars.2021.695105
Hall T. M., Haine T. W. N., Waugh D. W. (2002). Inferring the Concentration of Anthropogenic Carbon in the Ocean From Tracers. Global Biogeochem. Cycle. 16 (4), 78–71-78-15. doi: 10.1029/2001GB001835
Hanawa K., Talley L. D. (2001). “Chapter 5.4 Mode Waters,” in International Geophysics, eds. Siedler G., Church J., Gould J. (Academic Press), 373–386.
Heo J.-M., Kim S.-S., Kang S.-H., Yang E. J., Park K.-T., Jung J., et al. (2021). N2O Dynamics in the Western Arctic Ocean During the Summer of 2017. Sci. Rep. 11 (1), 1–12. doi: 10.1038/s41598-021-92009-1
He Y. C., Tjiputra J., Langehaug H. R., Jeansson E., Gao Y., Schwinger J., et al. (2018). A Model-Based Evaluation of the Inverse Gaussian Transit-Time Distribution Method for Inferring Anthropogenic Carbon Storage in the Ocean. J. Geophys. Res.: Ocean. 123 (3), 1777–1800. doi: 10.1002/2017JC013504
Ishijima K., Nakazawa T., Aoki S. (2009). Variations of Atmospheric Nitrous Oxide Concentration in the Northern and Western Pacific. Tellus. B.: Chem. Phys. Meteorol. 61 (2), 408–415. doi: 10.1111/j.1600-0889.2008.00406.x
Jain A. K., Briegleb B. P., Minschwaner K., Wuebbles D. J. (2000). Radiative Forcings and Global Warming Potentials of 39 Greenhouse Gases. J. Geophys. Res.: Atmos. 105 (D16), 20773–20790. doi: 10.1029/2000JD900241
Ji Q., Babbin A. R., Peng X., Bowen J.L., Ward B. B. (2015). Nitrogen Substrate–Dependent Nitrous Oxide Cycling in Salt Marsh Sediments. J. Mar. Sci. 73 (3–4), 71–92. doi: 10.1357/002224015815848820
Ji Q., Altabet M. A., Bange H. W., Graco M. I., Ma X., Arévalo-Martínez D. L., et al. (2019). Investigating the Effect of El Niño on Nitrous Oxide Distribution in the Eastern Tropical South Pacific. Biogeosciences 16 (9), 2079–2093. doi: 10.5194/bg-16-2079-2019
Karl D. M. (1999). A Sea of Change: Biogeochemical Variability in the North Pacific Subtropical Gyre. Ecosystems 2 (3), 181–214. doi: 10.1007/s100219900068
Kawano T., Fukasawa M., Kouketsu S., Uchida H., Doi T., Kaneko I., et al. (2006). Bottom Water Warming Along the Pathway of Lower Circumpolar Deep Water in the Pacific Ocean. Geophys. Res. Lett. 33 (23), L23613. doi: 10.1029/2006GL027933
Kim I.-N. (2018). Estimating “Mean-State” July, (1985–2007) N2O Fluxes in the Northern Gulf of Mexico Hypoxic Region: Variation, Distribution, and Implication. Front. Mar. Sci. 5. doi: 10.3389/fmars.2018.00249
Kim I.-N., Lee K., Gruber N., Karl D. M., Bullister J. L., Yang S., et al. (2014). Increasing Anthropogenic Nitrogen in the North Pacific Ocean. Science 346 (6213), 1102–1106. doi: 10.1126/science.1258396
Kim I. N., Min D. H., Macdonald A. M. (2013). Water Column Denitrification Rates in the Oxygen Minimum Layer of the Pacific Ocean Along 32°S. Global Biogeochem. Cycle. 27 (3), 816–827. doi: 10.1002/gbc.20070
Kock A., Arévalo-Martínez D. L., Löscher C. R., Bange H. W. (2016). Extreme N2O Accumulation in the Coastal Oxygen Minimum Zone Off Peru. Biogeosciences 13 (3), 827–840. doi: 10.5194/bg-13-827-2016
Ko Y. H., Quay P. D. (2020). Origin and Accumulation of an Anthropogenic CO2 and 13C Suess Effect in the Arctic Ocean. Global Biogeochem. Cycle. 34 (2), e2019GB006423. doi: 10.1029/2019GB006423
Levin L. A. (2018). Manifestation, Drivers, and Emergence of Open Ocean Deoxygenation. Annu. Rev. Mar. Sci. 10, 229–260. doi: 10.1146/annurev-marine-121916-063359
Li Y. H., Peng T. H. (2002). Latitudinal Change of Remineralization Ratios in the Oceans and its Implication for Nutrient Cycles. Global Biogeochem. Cycle. 16 (4), 77–71-77-16. doi: 10.1029/2001GB001828
Liu Z., Lian Q., Zhang F., Wang L., Li M., Bai X., et al. (2017). Weak Thermocline Mixing in the North Pacific Low-Latitude Western Boundary Current System. Geophys. Res. Lett. 44 (20), 10,530–510,539. doi: 10.1002/2017GL075210
Lomas M. W., Lipschultz F. (2006). Forming the Primary Nitrite Maximum: Nitrifiers or Phytoplankton? Limnol. Oceanograph. 51 (5), 2453–2467. doi: 10.4319/lo.2006.51.5.2453
Löscher C. R., Kock A., Könneke M., LaRoche J., Bange H. W., Schmitz R. A. (2012). Production of Oceanic Nitrous Oxide by Ammonia-Oxidizing Archaea. Biogeosciences 9 (7), 2419–2429. doi: 10.5194/bg-9-2419-2012
Marchant H. K., Ahmerkamp S., Lavik G., Tegetmeyer H. E., Graf J., Klatt J. M., et al. (2017). Denitrifying Community in Coastal Sediments Performs Aerobic and Anaerobic Respiration Simultaneously. ISME. J. 11 (8), 1799–1812. doi: 10.1038/ismej.2017.51
Montzka S. A., Dlugokencky E. J., Butler J. H. (2011). Non-CO2 Greenhouse Gases and Climate Change. Nature 476 (7358), 43–50. doi: 10.1038/nature10322
Morgan E. J., Lavric J. V., Arévalo-Martínez D. L., Bange H. W., Steinhoff T., Seifert T., et al. (2019). Air–sea Fluxes of Greenhouse Gases and Oxygen in the Northern Benguela Current Region During Upwelling Events. Biogeosciences 16 (20), 4065–4084. doi: 10.5194/bg-16-4065-2019
Naqvi S., Bange H. W., Farías L., Monteiro P., Scranton M., Zhang J. (2010). Marine Hypoxia/Anoxia as a Source of CH4 and N2O. Biogeosciences 7 (7), 2159–2190. doi: 10.5194/bg-7-2159-2010
Naqvi S. W. A., Naik H., Jayakumar D., Shailaja M., Narvekar P. (2006). “Seasonal Oxygen Deficiency Over the Western Continental Shelf of India,” in Past and Present Water Column Anoxia, ed. Neretin L.N. (Dordrecht: Springer), 195–224.
Nevison C., Butler J. H., Elkins J. (2003). Global Distribution of N2O and the ΔN2O-AOU Yield in the Subsurface Ocean. Global Biogeochem. Cycles 17 (4), 1119. doi: 10.1029/2003GB002068
Nightingale P. D., Malin G., Law C. S., Watson A. J., Liss P. S., Liddicoat M. I., et al. (2000). In Situ Evaluation of Air-Sea Gas Exchange Parameterizations Using Novel Conservative and Volatile Tracers. Global Biogeochem. Cycle. 14 (1), 373–387. doi: 10.1029/1999GB900091
O’Connor B. M., Fine R. A., Maillet K. A., Olson D. B. (2002). Formation Rates of Subtropical Underwater in the Pacific Ocean. Deep. Sea. Res. Part I.: Oceanog. Res. Pap. 49 (9), 1571–1590. doi: 10.1016/S0967-0637(02)00087-0
Oka E. (2009). Seasonal and Interannual Variation of North Pacific Subtropical Mode Water in 2003–2006. J. Oceanog. 65 (2), 151–164. doi: 10.1007/s10872-009-0015-y
Ono H., Kosugi N., Toyama K., Tsujino H., Kojima A., Enyo K., et al. (2019). Acceleration of Ocean Acidification in the Western North Pacific. Geophys. Res. Lett. 46 (22), 13161–13169. doi: 10.1029/2019GL085121
Paulmier A., Ruiz-Pino D. (2009). Oxygen Minimum Zones (OMZs) in the Modern Ocean. Prog. Oceanograph. 80 (3-4), 113–128. doi: 10.1016/j.pocean.2008.08.001
Popp B. N., Westley M. B., Toyoda S., Miwa T., Dore J. E., Yoshida N., et al. (2002). Nitrogen and Oxygen Isotopomeric Constraints on the Origins and Sea-to-Air Flux of N2O in the Oligotrophic Subtropical North Pacific Gyre. Global Biogeochem. Cycle. 16 (4), 12–11-12-10. doi: 10.1029/2001GB001806
Poth M., Focht D. D. (1985). 15N Kinetic Analysis of N2O Production by Nitrosomonas Europaea: An Examination of Nitrifier Denitrification. Appl. Environ. Microbiol. 49 (5), 1134–1141. doi: 10.1128/aem.49.5.1134-1141.1985
Prinn R. G., Weiss R. F., Arduini J., Arnold T., DeWitt H. L., Fraser P. J., et al. (2018). History of Chemically and Radiatively Important Atmospheric Gases From the Advanced Global Atmospheric Gases Experiment (AGAGE). Earth Sys. Sci. Data 10 (2), 985–1018. doi: 10.5194/essd-10-985-2018
Rafter P. A., Sigman D. M. (2016). Spatial Distribution and Temporal Variation of Nitrate Nitrogen and Oxygen Isotopes in the Upper Equatorial Pacific Ocean. Limnol. Oceanograph. 61 (1), 14–31. doi: 10.1002/lno.10152
Rainville L., Jayne S. R., Cronin M. F. (2014). Variations of the North Pacific Subtropical Mode Water From Direct Observations. J. Climate 27 (8), 2842–2860. doi: 10.1175/JCLI-D-13-00227.1
Redfield A. C., Ketchum B. H., Richards F. A. (1963). The Influence of Organisms on the Composition of Seawater. Sea, ed. Hill M. N. (New York: John Wiley & Sons) 2, 26–77.
Rees A. P., Brown I. J., Jayakumar A., Ward B. B. (2016). The Inhibition of N2O Production by Ocean Acidification in Cold Temperate and Polar Waters. Deep. Sea. Res. Part II.: Top. Stud. Oceanograph. 127, 93–101. doi: 10.1016/j.dsr2.2015.12.006
Ritchie R. J. (2006). Consistent Sets of Spectrophotometric Chlorophyll Equations for Acetone, Methanol and Ethanol Solvents. Photosyn. Res. 89 (1), 27–41. doi: 10.1007/s11120-006-9065-9
Sarma V., Krishna M., Srinivas T., Kumari V., Yadav K., Kumar M. D. (2021). Elevated Acidification Rates Due to Deposition of Atmospheric Pollutants in the Coastal Bay of Bengal. Geophys. Res. Lett. 48 (16), e2021GL095159. doi: 10.1029/2021GL095159
Sarmiento J. L., Gruber N. (2006). Ocean Biogeochemical Dynamics (New Jersey: Princeton University Press).
Sasano D., Takatani Y., Kosugi N., Nakano T., Midorikawa T., Ishii M. (2018). Decline and Bidecadal Oscillations of Dissolved Oxygen in the Oyashio Region and Their Propagation to the Western North Pacific. Global Biogeochem. Cycle. 32 (6), 909–931. doi: 10.1029/2017GB005876
Schilt A., Baumgartner M., Blunier T., Schwander J., Spahni R., Fischer H., et al. (2010). Glacial–interglacial and Millennial-Scale Variations in the Atmospheric Nitrous Oxide Concentration During the Last 800,000 Years. Quater. Sci. Rev. 29 (1-2), 182–192. doi: 10.1016/j.quascirev.2009.03.011
Schropp S. J., Schwarz J. R. (1983). Nitrous Oxide Production by Denitrifying Microorganisms From the Eastern Tropical North Pacific and the Caribbean Sea. Geomicrobiol. J. 3 (1), 17–31. doi: 10.1080/01490458309377781
Shanks A. L., Reeder M. L. (1993). Reducing Microzones and Sulfide Production in Marine Snow. Mar. Ecol. Prog. Ser. 96, 43–47. doi: 10.3354/meps096043
Sonnerup R. E., Chang B. X., Warner M. J., Mordy C. W. (2019). Timescales of Ventilation and Consumption of Oxygen and Fixed Nitrogen in the Eastern Tropical South Pacific Oxygen Deficient Zone From Transient Tracers. Deep. Sea. Res. Part I.: Oceanog. Res. Pap. 151, 103080. doi: 10.1016/j.dsr.2019.103080
Sonnerup R. E., Mecking S., Bullister J. L. (2013). Transit Time Distributions and Oxygen Utilization Rates in the Northeast Pacific Ocean From Chlorofluorocarbons and Sulfur Hexafluoride. Deep. Sea. Res. Part I.: Oceanog. Res. Pap. 72, 61–71. doi: 10.1016/j.dsr.2012.10.013
Sonnerup R. E., Mecking S., Bullister J. L., Warner M. J. (2015). Transit Time Distributions and Oxygen Utilization Rates From Chlorofluorocarbons and Sulfur Hexafluoride in the Southeast Pacific Ocean. J. Geophys. Res.: Ocean. 120 (5), 3761–3776. doi: 10.1002/2015JC010781
Stephens B. M., Wankel S. D., Beman J. M., Rabines A. J., Allen A. E., Aluwihare L. I. (2020). Euphotic Zone Nitrification in the California Current Ecosystem. Limnol. Oceanograph. 65 (4), 790–806. doi: 10.1002/lno.11348
Stocker T. F., Qin D., Plattner G.-K., Tignor M. M., Allen S. K., Boschung J., et al. (2014). Climate Change 2013: The Physical Science Basis. Working Group I Contribution to the Fifth Assessment Report of the Intergovernmental Panel on Climate Change (Cambridge, UK: Cambridge University Press).
Suga T., Kato A., Hanawa K. (2000). North Pacific Tropical Water: Its Climatology and Temporal Changes Associated With the Climate Regime Shift in the 1970s. Prog. Oceanograph. 47 (2-4), 223–256. doi: 10.1016/S0079-6611(00)00037-9
Suntharalingam P., Buitenhuis E., Le Quéré C., Dentener F., Nevison C., Butler J. H., et al. (2012). Quantifying the Impact of Anthropogenic Nitrogen Deposition on Oceanic Nitrous Oxide. Geophys. Res. Lett. 39 (7), L07605. doi: 10.1029/2011GL050778
Takahashi T., Broecker W. S., Langer S. (1985). Redfield Ratio Based on Chemical Data From Isopycnal Surfaces. J. Geophys. Res.: Ocean. 90 (C4), 6907–6924. doi: 10.1029/JC090iC04p06907
Talley L. D. (1993). Distribution and Formation of North Pacific Intermediate Water. J. Phys. Oceanograph. 23 (3), 517–537. doi: 10.1175/1520-0485(1993)023<0517:DAFONP>2.0.CO;2
Talley L. D., Pickard G. L., Emery W. J., Swift J. H. (2011). "Chapter 10 - Pacific Ocean," in Descriptive Physical Oceanography (Sixth Edition), eds. Talley L. D., Pickard G. L., Emery W. J., Swift J. H. (Boston: Academic Press), 303–362.
Tanhua T., Waugh D. W., Wallace D. W. R. (2008). Use of SF6 to Estimate Anthropogenic CO2 in the Upper Ocean. J. Geophys. Res.: Ocean. 113 (C4), C04037. doi: 10.1029/2007JC004416
Tian H., Lu C., Ciais P., Michalak A. M., Canadell J. G., Saikawa E., et al. (2016). The Terrestrial Biosphere as a Net Source of Greenhouse Gases to the Atmosphere. Nature 531 (7593), 225–228. doi: 10.1038/nature16946
Tian H., Xu R., Canadell J. G., Thompson R. L., Winiwarter W., Suntharalingam P., et al. (2020). A Comprehensive Quantification of Global Nitrous Oxide Sources and Sinks. Nature 586 (7828), 248–256. doi: 10.1038/s41586-020-2780-0
Toyoda S., Yoshida N., Miwa T., Matsui Y., Yamagishi H., Tsunogai U., et al. (2002). Production Mechanism and Global Budget of N2O Inferred From its Isotopomers in the Western North Pacific. Geophys. Res. Lett. 29 (3), 7–1-7-4. doi: 10.1029/2001GL014311
Von Schuckmann K., Palmer M., Trenberth K. E., Cazenave A., Chambers D., Champollion N., et al. (2016). An Imperative to Monitor Earth's Energy Imbalance. Nat. Climate Change 6 (2), 138–144. doi: 10.1038/nclimate2876
Walter S., Bange H. W., Breitenbach U., Wallace D. W. (2006). Nitrous Oxide in the North Atlantic Ocean. Biogeosciences 3 (4), 607–619. doi: 10.5194/bg-3-607-2006
Wang W., Cai M., Huang P., Ke H., Liu M., Liu L., et al. (2021). Transit Time Distributions and Apparent Oxygen Utilization Rates in Northern South China Sea Using Chlorofluorocarbons and Sulfur Hexafluoride Data. J. Geophys. Res.: Ocean. 126 (8), e2021JC017535. doi: 10.1029/2021JC017535
Wankel S. D., Kendall C., Pennington J. T., Chavez F. P., Paytan A. (2007). Nitrification in the Euphotic Zone as Evidenced by Nitrate Dual Isotopic Composition: Observations From Monterey Bay, California. Global Biogeochem. Cycle. 21 (2), GB2009. doi: 10.1029/2006GB002723
Wanninkhof R. (2014). Relationship Between Wind Speed and Gas Exchange Over the Ocean Revisited. Limnol. Oceanograph.: Methods 12 (6), 351–362. doi: 10.4319/lom.2014.12.351
Wanninkhof R., McGillis W. R. (1999). A Cubic Relationship Between Air-Sea CO2 Exchange and Wind Speed. Geophys. Res. Lett. 26 (13), 1889–1892. doi: 10.1029/1999GL900363
Ward B. B., Devol A. H., Rich J. J., Chang B. X., Bulow S. E., Naik H., et al. (2009). Denitrification as the Dominant Nitrogen Loss Process in the Arabian Sea. Nature 461 (7260), 78–81. doi: 10.1038/nature08276
Waugh D., Hall T. (2002). Age Of Stratospheric Air: Theory, Observations, And Models. Rev. Geophys. 40 (4), 1–1-1-26. doi: 10.1029/2000RG000101
Waugh D. W., Hall T. M., Haine T. W. (2003). Relationships Among Tracer Ages. J. Geophys. Res.: Ocean. 108 (C5), 3138. doi: 10.1029/2002JC001325
Waugh D., Hall T., McNeil B., Key R., Matear R. (2006). Anthropogenic CO2 in the Oceans Estimated Using Transit Time Distributions. Tellus. B.: Chem. Phys. Meteorol. 58 (5), 376–389. doi: 10.1111/j.1600-0889.2006.00222.x
Weier K. L., Doran J. W., Power J. F., Walters D. T. (1993). Denitrification and the Dinitrogen/Nitrous Oxide Ratio as Affected by Soil Water, Available Carbon, and Nitrate. Soil Sci Soc Am J 57 (1), 66-72-1993 v.1957 no.1991. doi: 10.2136/sssaj1993.03615995005700010013x
Weiss R., Price B. (1980). Nitrous Oxide Solubility in Water and Seawater. Mar. Chem. 8 (4), 347–359. doi: 10.1016/0304-4203(80)90024-9
Wilson S. T., Bange H. W., Arévalo-Martínez D. L., Barnes J., Borges A. V., Brown I., et al. (2018). An Intercomparison of Oceanic Methane and Nitrous Oxide Measurements. Biogeosciences 15 (19), 5891–5907. doi: 10.5194/bg-15-5891-2018
Wrage N., Velthof G. L., van Beusichem M. L., Oenema O. (2001). Role of Nitrifier Denitrification in the Production of Nitrous Oxide. Soil Biol. Biochem. 33 (12), 1723–1732. doi: 10.1016/S0038-0717(01)00096-7
Wu L., Cai W., Zhang L., Nakamura H., Timmermann A., Joyce T., et al. (2012). Enhanced Warming Over the Global Subtropical Western Boundary Currents. Nat. Climate Change 2 (3), 161–166. doi: 10.1038/nclimate1353
Yamagishi H., Yoshida N., Toyoda S., Popp B. N., Westley M. B., Watanabe S. (2005). Contributions of Denitrification and Mixing on the Distribution of Nitrous Oxide in the North Pacific. Geophys. Res. Lett. 32 (4), L04603. doi: 10.1029/2004GL021458
Yoon J.-E., Kim J.-H., Kim I.-N. (2022). Climate-Driven High Primary Production and Contrasting Export Production in the Eastern North Pacific Subtropical Gyre. Front. Mar. Sci. 8. doi: 10.3389/fmars.2021.710540
Yoshida N., Morimoto H., Hirano M., Koike I., Matsuo S., Wada E., et al. (1989). Nitrification Rates and 15N Abundances of N2O and NO3– in the Western North Pacific. Nature 342 (6252), 895–897. doi: 10.1038/342895a0
Yoshikawa C., Abe H., Aita M. N., Breider F., Kuzunuki K., Toyoda S., et al. (2016). Insight Into Nitrous Oxide Production Processes in the Western North Pacific Based on a Marine Ecosystem Isotopomer Model. J. Oceanog. 72 (3), 491–508. doi: 10.1007/s10872-015-0308-2
Yoshinari T. (1976). Nitrous Oxide in the Sea. Mar. Chem. 4 (2), 189–202. doi: 10.1016/0304-4203(76)90007-4
Zeng J., Chen M., Zheng M., Hu W., Qiu Y. (2017). A Potential Nitrogen Sink Discovered in the Oxygenated Chukchi Shelf Waters of the Arctic. Geochem. Trans. 18 (1), 5. doi: 10.1186/s12932-017-0043-2
Zhang J., Zhan L., Chen L., Li Y., Chen J. (2015). Coexistence of Nitrous Oxide Undersaturation and Oversaturation in the Surface and Subsurface of the Western Arctic Ocean. J. Geophys. Res.: Ocean. 120 (12), 8392–8401. doi: 10.1002/2015JC011245
Zhan L., Wu M., Chen L., Zhang J., Li Y., Liu J. (2017). The Air-Sea Nitrous Oxide Flux Along Cruise Tracks to the Arctic Ocean and Southern Ocean. Atmosphere 8 (11), 216. doi: 10.3390/atmos8110216
Zhan L., Zhang J., Ouyang Z., Lei R., Xu S., Qi D., et al. (2021). High-Resolution Distribution Pattern of Surface Water Nitrous Oxide Along a Cruise Track From the Okhotsk Sea to the Western Arctic Ocean. Limnol. Oceanograph. 66 (S1), S401–S410. doi: 10.1002/lno.11604
Keywords: nitrous oxide, greenhouse gas, North Pacific Ocean, oxygen minimum layer, air-sea gas exchange, climate change
Citation: Heo J-M, Kim H-R, Eom S-M, Yoon J-E, Shim J, Lim J-H, Kim J-H, Thangaraj S, Park K-T, Joo H and Kim I-N (2022) Distribution and Production of N2O in the Subtropical Western North Pacific Ocean During the Spring of 2020. Front. Mar. Sci. 9:854651. doi: 10.3389/fmars.2022.854651
Received: 14 January 2022; Accepted: 12 May 2022;
Published: 15 June 2022.
Edited by:
Roberta Hamme, University of Victoria, CanadaReviewed by:
Annie Bourbonnais, University of South Carolina, United StatesRobert Izett, Dalhousie University, Canada
Copyright © 2022 Heo, Kim, Eom, Yoon, Shim, Lim, Kim, Thangaraj, Park, Joo and Kim. This is an open-access article distributed under the terms of the Creative Commons Attribution License (CC BY). The use, distribution or reproduction in other forums is permitted, provided the original author(s) and the copyright owner(s) are credited and that the original publication in this journal is cited, in accordance with accepted academic practice. No use, distribution or reproduction is permitted which does not comply with these terms.
*Correspondence: Il-Nam Kim, aWxuYW1raW1AaW51LmFjLmty