 Tristan J. Douglas
 Goetz Schuerholz
 S. Kim Juniper
- 1School of Earth and Ocean Sciences, University of Victoria, Victoria, BC, Canada
- 2Cowichan Estuary Restoration and Conservation Association, Duncan, BC, Canada
- 3Department of Biology, University of Victoria, Victoria, BC, Canada
- 4Ocean Networks Canada, University of Victoria Queenswood Campus, Victoria, BC, Canada
Vegetated coastal ecosystems can contribute greatly to long-term carbon sequestration and greenhouse gas emission mitigation, providing a strong argument for their protection and restoration. We investigated carbon sequestration in the Cowichan Estuary, a temperate estuary on Vancouver Island, Canada, in relation to habitat type (salt marsh, eelgrass, mudflats, and oyster shell beds) and habitat degradation. Stored organic carbon and inorganic carbon were quantified in the top 20 cm of sediment as well as in eelgrass and salt marsh vegetation. Sedimentation and carbon sequestration rates were quantified by 210Pb radiometric dating, and organic matter sources and quality were assessed by δ13C, C:N ratios and photopigment content. We also examined the potential impact of habitat disturbance by industrial activity (log booms) on the estuary’s carbon storage capacity. The salt marsh was the most important carbon reservoir, with a mean sediment organic carbon stock of 58.78 ± 19.30 Mg C ha-1. Sediment organic carbon stocks in the upper mudflats, lower mudflats, eelgrass meadow, and oyster shell beds were 19.30 ± 3.58, 17.33 ± 3.17, 18.26 ± 0.86 and 9.43 ± 1.50 Mg C ha-1, respectively. Carbon accumulation rates in the salt marsh and eelgrass meadows were 68.21 ± 21 and 38 ± 26 g C m-2 yr-1, whereas 210Pb profiles indicated that mudflat sediments were subject to erosion and/or mixing. While eelgrass was absent from the log boom area, likely due to disturbance, sediments there had similar carbon sequestration and bulk properties to adjacent mudflats. Carbon stocks in the eelgrass meadow were similar to those of the mudflats and consistent with the relatively low values reported for other temperate Zostera marina meadows, compared with tropical eelgrass meadows. Stable isotope evidence was suggestive of substantial outwelling and/or decomposition of eelgrass vegetation. Finally, we compared the carbon sequestration potential of the estuary to selected sources and sinks of CO2 in the surrounding region. We estimated that annual carbon sequestration in the estuary offsets approximately twice the greenhouse gas emission increases attributable to local population growth, and is equivalent to approximately twice that of a 20-year-old stand forest.
Introduction
The capacity of the world’s coastal ecosystems to sequester carbon dioxide (CO2) in biomass and biomass residues, termed “blue carbon,” has been a major focus of research in recent decades in the context of climate change mitigation. Estuarine and intertidal areas in particular have very high rates of carbon sequestration relative to the open ocean (Nelleman et al., 2009; Rogers et al., 2019). In these coastal habitats, photosynthesis by vascular plants, macroalgae, benthic diatoms, and phytoplankton produces and deposits organic matter at rates that often exceed microbial respiration, resulting in the net sequestration of organic carbon (OC) in sediments, where anoxic conditions may greatly restrict remineralization and release of (CO2) into the atmosphere for millennia (Macreadie et al., 2017a). Sediment OC sequestration is additionally enhanced in coastal vegetated habitats by their ability to trap organic particles from river discharge and seawater flow (Van de Broek et al., 2018; Geraldi et al., 2019). Intertidal foundation plant species like salt marsh grasses and sedges, mangrove forests and seagrasses are particularly efficient natural carbon sinks. They are responsible for capturing and storing up to 70% of the OC permanently stored in marine systems despite only occupying 0.2% of the ocean surface (Nelleman et al., 2009; Duarte et al., 2013). Vegetated intertidal ecosystems rank among the most efficient sediment OC sinks on Earth, sequestering sediment OC at aggregated global rates that are disproportionately higher than terrestrial ecosystems, annually storing comparable quantities of sediment OC to terrestrial plants yet comprising only approximately 0.05% of the biomass and less than 3% the areal extent of forests. Recent global interest in blue carbon coastal ecosystems is based on the potential of vegetated habitats for climate change mitigation, coastal protection and wildlife enhancement (Duarte et al., 2005; Nelleman et al., 2009; Mcleod et al., 2011). Unvegetated mudflats, on the other hand, are generally under-represented in blue carbon budgets, despite often representing the largest areal component of intertidal systems with total sediment OC sequestration capacities that can be comparable to vegetated wetlands (Sanders et al., 2010; Phang et al., 2015). In addition, mudflats play important roles in nutrient recycling and supplying bioavailable OC to benthic populations (Van Duyl et al., 1999; Cook et al., 2004).
Salt marshes reportedly have the highest sediment OC burial rates per unit area of all intertidal blue carbon habitats, with a global average rate of 218 ± 24 g C m−2 yr−1 (Chmura et al., 2003; Duarte et al., 2013; Ouyang and Lee, 2014), exceeding long-term accumulation rates for temperate, tropical, and boreal forests, which range from 0.7 to 13.1 g C m-2 yr-1 (Zehetner, 2010; Mcleod et al., 2011). However, Chmura et al. (2003) and Ouyang and Lee (2014) reported salt marsh sediment OC sequestration rates that range widely around the globe, from 18 to 1713 C m−2 yr−1. These estimates of salt marsh SOC accumulation rates were based on a limited number of locations (n = 94) and disproportionate representation from some temperate areas of the world such as Europe and eastern North America, with respect to western North America. Coastal wetlands of the cool, wet Pacific Northwest (British Columbia, Washington, Oregon) climate zone are particularly underrepresented in the global data set (Kauffman et al., 2020). Pacific Northwest salt marshes occur along saline to tidal freshwater gradients and, together with widespread seagrass beds, represent largely unquantified blue carbon sinks (Callaway et al., 2012).
Seagrasses, which have a wide latitudinal distribution, have a reported global average sediment OC burial rate of 138 ± 38 g C m–2 yr–1, which is up to 35 times higher than in soils of temperate and tropical forests (Orth et al., 2006; Mcleod et al., 2011). Seagrasses have been estimated to capture up to 18% of the total carbon permanently stored in marine environments despite accounting for only 0.1 to 0.2% of the total ocean sea floor area globally (Gattuso et al., 1998; Duarte et al., 2005; Fourqurean et al., 2012a). However, most seagrass data used to develop worldwide blue carbon estimates are derived from tropical and subtropical regions. The seagrass Zostera marina (Z. marina), also known as “eelgrass”, is the predominant seagrass species in shallow areas of temperate estuaries along the Pacific coasts of Canada and the United States (Miyajima et al., 2015). The few published papers on carbon sequestration by Z. marina have reported sediment OC sequestration rates and sediment OC stocks orders of magnitude lower than global averages (Greiner et al., 2013; Miyajima et al., 2015; Spooner, 2015; Jankowska et al., 2016; Röhr et al., 2016; Poppe and Rybczyk, 2018; Prentice et al., 2019). Adequate regional and species-specific seagrass meadow data are therefore necessary to complete global blue carbon calculations and assess the relative importance of eelgrass habitats to regional blue carbon budgets.
Surficial mudflat sediments often host photosynthetic microbial biofilms, formed by eukaryotic algae and cyanobacteria, collectively known as ‘microphytobenthos’ (MPB) (Admiraal, 1984; Barranguet et al., 1997; Cahoon and Safi, 2002). The microphytobenthos can represent up to 50% of the total primary production in many estuaries (Underwood and Kromkamp, 1999; Pratt et al., 2015), and on a global scale, the MPB represents one of the most important and largest components of marine/estuarine primary production (Pniewski and Sylwestrzak, 2018). The MPB forms biofilms by excreting extracellular polymeric substances (EPS), mainly polysaccharides, which enhance the stability of the sediment/water interface by reducing resuspension potential (Cahoon, 1999; Blanchard et al., 2000; de Brouwer et al., 2000). Further, biofilms are a major source of high-quality OC for populations of heterotrophic microbes, benthic invertebrates and shore birds (McKew et al., 2013; Schnurr et al., 2020).
Organic carbon generally represents a small fraction of buried material within intertidal habitats, often only 2–3% by weight, although this can be highly variable (Saderne et al., 2019). The remaining sediment is composed of siliciclastic and carbonate (CaCO3) particles, with inorganic carbon (IC) concentrations often exceeding OC (Mazarrasa et al., 2015). Estuarine and other coastal ecosystems provide a variety of habitats for a diverse assortment of calcifying fauna and flora such as crustaceans, echinoderms, molluscs, calcified algae, and foraminifera, whose remains may be deposited onto the sediment and buried. Considerable uncertainty remains regarding the role of CaCO3 as source or sink of atmospheric CO2, since carbonate shell production shifts the dissolved carbonate equilibrium in seawater and produces CO2 with a ratio of ~0.6 mol of CO2 emitted per mol of CaCO3 precipitated (Ware et al., 1992). This has led to the argument that high CaCO3 burial in shell beds may partially offset CO2 sequestration associated with OC burial in some intertidal ecosystems (Howard et al., 2017). However, shellfish also facilitate atmospheric-CO2 drawdown via filtration and rapid biodeposition of carbon-fixing primary producers (Fodrie et al., 2017). For the present, few generalizations can be made about the net result of CaCO3 burial in sediments and CO2 emission from carbonate formation for any given blue carbon system.
Our study site, the Cowichan Estuary, on the east coast of Vancouver Island, British Columbia, is a potentially informative field location for quantitatively addressing two important knowledge gaps related to blue carbon sequestration in the coastal zone. First, it hosts several types of intertidal habitat whose carbon storage capacities are poorly constrained, namely, temperate Pacific coastal salt marshes, temperate eelgrass meadows, mudflats, and shell beds. Second, the relatively simple and historically recent nature of agricultural and industrial activity in the estuary, together with substantial local and Indigenous knowledge, facilitate the quantitative evaluation of the impact of land use changes on habitat distribution and related carbon sequestration.
The Cowichan-Koksilah Estuary (hereafter referred to as the Cowichan Estuary) is the fourth largest estuary on Vancouver Island, with an intertidal/estuarine area about 4.9 km2, including vegetated intertidal lands (saltmarsh and eelgrass), mudflats, and oyster beds (Lambertsen, 1986) (Figure 1). The invasive Pacific oyster (Crassostrea gigas) is now the only oyster species in the Cowichan Estuary, outcompeting the Olympia oyster (Ostrea lurida), the only oyster species native to British Columbia (Schuerholz, 2018). As part of the traditional territory of the Coast Salish People, the Cowichan Estuary supported the largest Indigenous community on Vancouver Island prior to European settlement in Cowichan Bay in the mid-1800s, providing sustainable harvests of shellfish, salmon, herring roe and seaweed for centuries (Dyck, 2000; Schuerholz, 2006; Dale and Natcher, 2015). Like many estuaries in the province and globally, the ecological health of the Cowichan Estuary has been compromised by land use changes. Approximately 102.8 ha of intertidal area has been reclaimed for agricultural or industrial use (Schuerholz, 2017). Much of the salt marsh was dyked and drained for farming, and a shipping terminal, causeway and sawmill occupy infilled areas of salt marsh and mudflat (Figure 1). The distribution of eelgrass in the Cowichan Estuary has been strongly affected by sawmill activity. Log booming in the Cowichan Estuary has been documented since the late 1800s, when log storage was relocated from Cowichan Lake to Cowichan Bay with the construction of a sawmill (O’Donnell, 1988). By the 1980s, log handling, storage and boom assembly affected 129 hectares (45%) of the intertidal zone and was reported to be the major source of environmental impact in estuary (Cowichan Estuary Task Force, 1980). Today, logs for the mill continue to be transported by sea and stored in an approximately 20 ha area of the lower intertidal zone prior to processing. Log booms make physical contact with the seabed during low tides, destroying eelgrass meadows and preventing seedling recolonization (Leschen et al., 2010). The gradual loss of eelgrass has been described in several reports: interviews with First Nations elders and long-term residents of Cowichan Bay Village documented historic eelgrass distribution that extended throughout most of the lower intertidal zone (Cowichan Tribes, 2010); and research publications by Harris (1953) and Bell and Kallman (1976) respectively report on eelgrass distribution before and after the emergence of log booming. Currently, eelgrass covers approximately one third of the previously occupied area in the southern portion of the estuary, and no eelgrass remains on the northern mudflats where log storage is concentrated (Figure 1). Like eelgrass, the microphytobenthos in the lower intertidal zone may have been similarly impacted by the mechanical disturbance and shading of the seabed, with associated losses of MPB productivity potential resulting in decreased carbon sequestration.
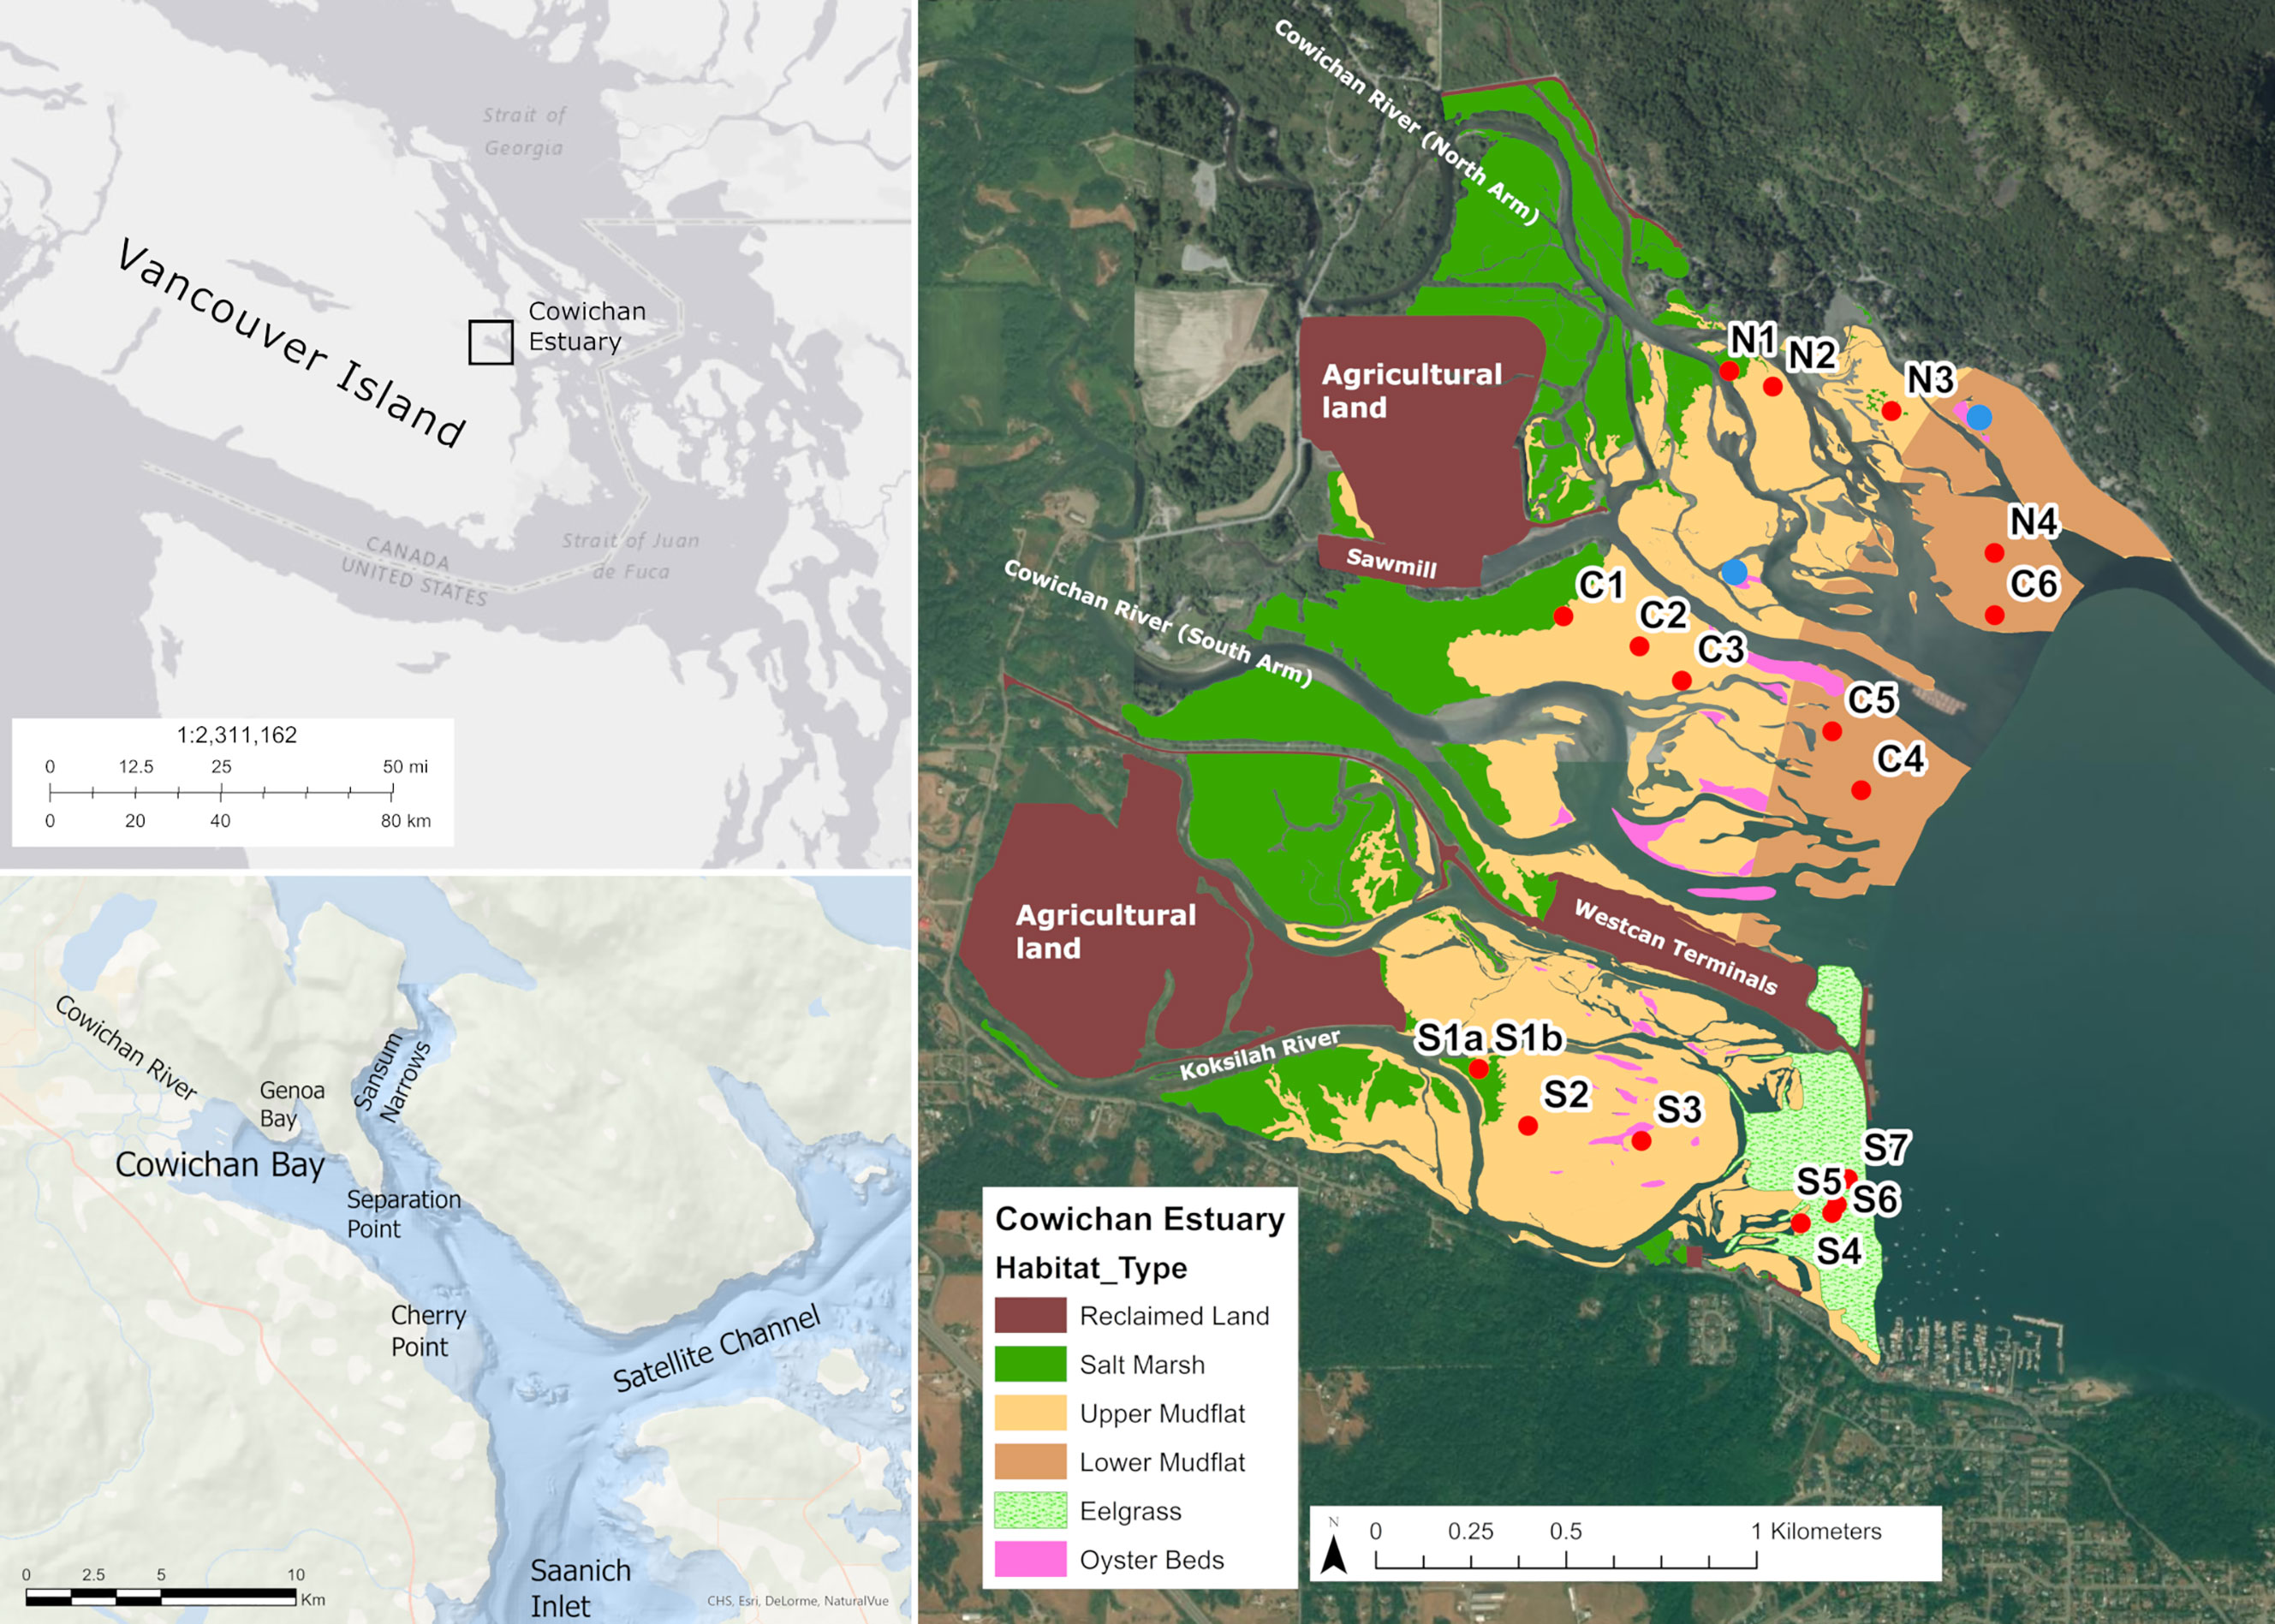
Figure 1 Location map and sediment core sampling sites in the Cowichan Estuary on Vancouver Island, British Columbia, Canada. The rightmost map shows the four dominant habitats found at the Cowichan Estuary: the salt marsh at the landward edge (N1, C1, S1a, S1b), and the seagrass meadow at the seaward edge. The mudflat is in between the salt marsh and seagrass meadow, separated in the upper mudflat (N2, N3, C2, C3, C2, S3), the lower mudflat (N4, C4, C5, C6, S4). Pink shading outlines mapped oyster beds, with blue circles indicating oyster sediment sampling sites. Geo-referenced habitat polygons were delineated and classified by visual aerial photo interpretation of an unoccupied aerial vehicle (UAV)-acquired orthomosaic and verified using ground-based GIS waypoints.
We report here on stocks of organic and inorganic carbon in intertidal sediments of the Cowichan Estuary and their distribution among eelgrass, salt marsh, mudflat, and oyster bed habitats. We also investigated sedimentation and carbon accumulation rates and potential sources of organic matter in each habitat, and estimated the loss of blue carbon sequestration that has resulted from land reclamation for agriculture and current industrial activity in the estuary. Finally, we used our results to assess the contribution of blue carbon in the Cowichan Estuary to climate change mitigation by comparing annual sequestration of carbon dioxide equivalents (CO2e) in the estuary to that of British Columbia forests, and local and regional greenhouse gas (GHG) emissions.
Materials and Methods
Field Sampling and Sample Preparation
Sediment Cores
A series of cores was the primary source of samples for quantitative and qualitative assessment of blue carbon stores in Cowichan Estuary sediments. Sampling sites were chosen to be representative of the major habitat types in the Estuary, according to vegetation presence, vegetation type, tidal inundation, and anthropogenic disturbance. Habitat types were grouped as (1) salt marsh, (2) upper intertidal mudflat, (3) lower intertidal mudflat (the area affected by log booms and likely historical eelgrass habitat), and (4) eelgrass meadows in the lower intertidal zone (eelgrass also extended into the shallow subtidal zone). A total of eighteen sediment cores with 3-6 cores from each habitat type were collected from the Cowichan Estuary in May 2017 (Figure 1 and Table S1). At low tide, sediment cores were collected by slowly inserting acrylic core tubes (50 cm length, 7.62 cm inner diameter) into the substrate at each site. The insertion procedure permitted the collection of sediment cores without visibly disturbing or compacting strata. Core tube penetration ranged from 24 cm to 38.5 cm, depending on sediment compactness; therefore, 20 cm was set as the maximum depth for all analyses except radiometric dating. Immediately after collection, the sediment cores were extruded from their tubes and systematically sectioned at depth intervals of 1 cm from the core surface to 10 cm, and at 2 cm intervals from 10 cm to the bottom of the core. The wet weights and volumes of individual sediment sections were recorded, following which they were subsampled, sealed in plastic containers, transported to the laboratory and frozen at -80°C until further analysis.
Plant Biomass
Separate aboveground and belowground vegetation samples from the salt marsh and eelgrass meadow were harvested to quantify sequestered carbon in living plant material. Sampling methods were designed to minimize destructive impact on each vegetated ecosystem. In the eelgrass meadow, aboveground plant material (Zostera marina) was harvested in five 1 m x 1 m (1 m2) quadrats by cutting eelgrass shoots at ground-level, leaving the roots undisturbed. In addition, a small number of eelgrass shoots with intact roots (n = 8) were carefully extracted by hand. Total belowground eelgrass biomass was then estimated from the quantitative relationship between shoot and root biomass, adapted from the methods of Touchette et al. (2003) and described below. Aboveground salt marsh material, predominantly Lyngbye’s Sedge (Carex lyngbyei Hornem), was harvested by cutting shoots at ground level in five 0.25 m x 0.25 (0.0625 m2) quadrats. The denser belowground biomass in the salt marsh (roots and rhizomes) was estimated from material separated from sediment cores. Fine salt marsh root material could not be separated from sediments and was thus included in the analyses of salt marsh sediment organic material. Following sample collection, all plant material was rinsed with fresh water to remove sediments, carbonates, marine algae, detritus and other organisms, then oven dried and ground for OC estimation and elemental analysis as described for sediments below.
Oyster Beds
To quantify the bulk OC and IC stocks in the oyster shell beds, we collected oyster shell material and sediments from mapped oyster beds in the Cowichan Estuary. The high gravel content of the oyster bed sediments precluded coring, extruding, and fine-resolution depth sampling. Instead, belowground oyster shells and shell debris were isolated from triplicate 25 cm x 25 cm x 20 cm (0.0125 m3 volume) excavated pits by sieving, removing gravel (2-4 mm granule and 4-64 mm pebble), and then drying and weighing the shell material. Three sediment samples of known volume were collected from each 0.0125 m3 pit at 1 cm, 10 cm, and 20 cm depth intervals for bulk OC and sediment IC measurements. Sample volumes ranged from 25 – 45 cm3 and were thus large enough to estimate gravel as a proportion of total sediment volume. Aboveground oyster shell density and mean shell weight data from the 2017 survey were used to calculate total aboveground oyster shell mass and IC content. Intact aboveground oyster shells with all barnacles and oyster flesh removed from a 2017 survey (Schuerholz, 2018) were rinsed, dried at 65°C, and pulverized in a mortar and pestle before being assessed for IC as described below.
Habitat Map
To determine the areal extent of each habitat type in the Cowichan Estuary, we and the Cowichan Estuary Restoration and Conservation Association (CERCA) produced a Cowichan Estuary habitat map in September 2017. Briefly, we collected red-green-blue (RGB) imagery and global information system (GIS) data by flying an unoccupied aerial vehicle (UAV) over the extent of the Cowichan Estuary, in addition to collecting ground-based GPS control point data. Data were processed into point clouds and an orthophoto in Agisoft Photoscan software (Agisoft, St. Petersburg, Russia) using photogrammetry and Structure from Motion (SFM) image processing workflows. A 2-4 cm resolution orthophoto was produced for the entire estuary with the exception of privately-held land by Western Forest Products and the Westcan Terminal leased Crown land. Geo-referenced habitat polygons were delineated and classified by visual aerial photo interpretation in accordance with Canada’s Department of Fisheries and Oceans protocol for estuarine habitat mapping and verified using ground-based GIS waypoints. The total areal extent of each habitat type was calculated from the habitat polygons in ESRI ArcGIS® software. For more detail on the habitat mapping methodology implemented, see Schuerholz (2017).
Sediment Analysis
Bulk Density
The bulk density (BD) of each sediment section was determined from its calculated dry weight divided by its measured volume. The dry weight of each sediment section was calculated from the dry weight of a subsample from each section. First, frozen sediment sections were thawed and subsampled. Each subsample (≈ 4 g) was weighed wet, and then dried to a constant mass at ≤65°C and re-weighed. Then, the dry weight/wet weight ratio of each subsample was then used to calculate the dry weight of its corresponding sediment section, using the previously determined section wet weight. Wet sediment volume (V) of the core sections were determined from the core radius (r) and the section thickness (h) using the formula for the volume of a cylinder.
Grain Size
Particle size analysis by Laser Diffraction (Laser PSA) was performed on a subset of samples (n = 96), at the Natural Resources Analytical Laboratory, University of Alberta, Canada, according to their protocol. Briefly, organic matter and IC in dried sediments <2 mm were removed by the addition of hydrogen peroxide and HCl, respectively. Samples were then dispersed by soaking overnight in 1% sodium hexametaphosphate (Calgon). Using a Laser PSA instrument, a total particle size range of 0.017 – 2000 µm was determined. Results were reported as full particle size distributions and sand/silt/clay size fractions were reported as % volume/volume.
210Pb Sediment Dating
A subset of cores from each habitat type was selected for 210Pb radioisotope dating using alpha spectrometry, assuming that similar sediment deposition rates had occurred within the same hydrogeomorphic location. Samples were analyzed by Chronos Scientific Inc (Ottawa, Ontario) for radionucleotide analysis according to their protocol.
Carbon Stock Determinations
Sediment organic matter content was calculated as the weight loss on ignition at 550°C (LOI550) for 5 hours (e.g., Hoogsteen et al., 2015). In a second step, ashed samples of sediment and whole oyster shells were combusted at 950°C for an additional 2 hours to determine the IC content. Organic carbon content and total nitrogen content in a subset of sediment samples (n = 94) was directly determined by elemental analysis using an Elementar Vario MicroCube elemental analyser in continuous flow mode, in the Géotop Research Centre, at the Université du Québec à Montréal (Montréal, Canada). This carbon content was used to convert organic matter content (LOI550) to sediment OC (% by weight) in all samples (e.g., Prentice et al., 2020). Sediment OC density and sediment IC density were then calculated for each interval of the core sampled (e.g., Howard et al., 2014).
The mass of sediment OC and sediment IC in each core section sampled was calculated by multiplying each sediment carbon density value by the volume of the section (cm). To account for gravel in the oyster shell bed sediment, the volume of gravel in each sample was first measured by the water displacement method and then used to adjust sediment OC and sediment IC (Government of Western Australia, 2020). Core section totals to 20 cm depth were then added to determine the total mass of carbon in each core and converted into the Mg units (Tonnes) on a per hectare basis, as is commonly used in carbon stock assessment (Mg C/hectare(20cm)) (e.g., Howard et al., 2014). The total carbon in the top 20 cm of each habitat type was estimated as the product of total sediment OC and sediment IC per core by each habitat area.
To determine the OC contained in macroscopic plant biomass, harvested aboveground eelgrass and saltmarsh vegetation was first dried and weighed. For the intact eelgrass plants, roots were separated from shoots, dried separately, and used to determine the relationship between shoot and root biomass by fitting a linear regression to root and shoot dry weight data from the individual plants. The OC content (% by weight) of above- and below-ground plant material extracted from sediment cores was determined by elemental analysis, as described above. These values were then used to calculate the organic carbon content of dry harvested vegetation from the mean aboveground and belowground dry weights of the five quadrats, and then extrapolated to weights per hectare.
Total IC in aboveground oyster shells was determined from mean oyster shell IC content (% by weight) multiplied by the total shell weight of all oyster beds in the estuary, as estimated by Schuerholz (2017), based on mean oyster shell weight, mean oyster shell density, and total oyster shell bed habitat area.
Total ecosystem carbon stocks (TECS) were calculated for all habitats as described by Kauffman et al. (2020), where TECS are defined as the masses of all OC and IC in aboveground (vegetated habitats only) and belowground pools to a maximum depth of 20 cm, and expressed as:
where CAB is aboveground plant biomass C pool; CBB is belowground biomass C pool and CSOC is the sediment organic carbon pool.
Sediment Organic Carbon Burial Rates
Sediment organic carbon burial rates (Mg C ha−1 yr−1) were calculated using the same 210Pb methods employed by Greiner et al. (2013) with the following equation:
where SOC is sediment OC content (%), and MAR is sediment mass accumulation rate (g m−2 yr−1) derived from 210Pb sediment dating. Sediment OCburial of each habitat-specific core was then multiplied by the habitat area in order to determine total annual sediment carbon burial per habitat. The same method was used to calculate the burial rates for sediment IC.
Organic Matter Quality and Sources
Photosynthetic Pigments
Sediment samples for pigment analysis were thawed overnight and mixed thoroughly, then approximately 2 g aliquots were added to 10mL of refrigerated (4°C) 90% acetone in a 15-mL polypropylene centrifuge tube sonicated for 10 min, then incubated for 24 h in the dark at 2° C. The extracted samples were then centrifuged at 1500 rpm for 5 min. Supernatant containing extracted pigments was decanted into a clean 13 x 100 mm borosilicate culture tube. Concentrations of photosynthetic pigments (chl a and phæopigments) were then measured spectrofluorometrically according to Heiri et al. (2001). Standards were prepared using 90% HPLC grade acetone and pure chlorophyll a (chl a) extracted from Anacystis nidulans. Sediment pellets we reweighted after ≥ 4 days of drying.
C:N and δ13C
The molar ratio of the total OC and nitrogen contents was used as an indicator of organic matter origins from terrestrial or marine sources. C:N ratios were calculated from the above-cited elemental analyses. Selected sediment and vegetation tissue ‘end-member’ samples were analyzed to determine carbon stable isotope ratios δ13C, with the goal of identifying sources of OC stored in sediments. Dried, pre-weighed samples were analyzed at the Géotop Research Centre, at the Université du Québec à Montréal (Montréal, Canada), using a Micromass model Isoprime 100 isotope ratio mass spectrometer coupled to an Elementar Vario MicroCube elemental analyser in continuous flow mode.
Carbon Valuation and Greenhouse Gas Equivalents
Comparison to British Columbia Forests
Total Sediment OC stocks from the top 20 cm of the Cowichan Estuary habitats were compared to mature stands in the Pacific Northwest (PNW) as well as old- and second-growth forests of interior British Columbia (B.C.), Canada, as reported by Black et al. (2008). Soil OC represents 30-50% of forest TECS. Additionally, sediment OC burial rates in each habitat and the whole Cowichan Estuary were compared to a chronosequence of coastal Douglas-fir stands since 1998, ranging from clearcut-harvested stands which was a net source of carbon (~22 Mg CO2e ha-1 y-1) to ~15 Mg CO2e ha-1 y-1 carbon sequestration in a 50-60-year-old forest. Because B.C. forest soil OC stocks have been reported to a depth of 1 m, they were divided by five to estimate SOC stocks to a depth of 20 cm, assuming homogeneous sediment OC distribution to a depth of 1 m, for comparison with sediment OC stocks from this study.
Greenhouse Gas Equivalents
To estimate the potential contribution of organic carbon sequestration in the Cowichan Estuary to mitigating regional GHG emissions, sediment organic carbon accumulation rates in this study were converted to equivalents in annual emissions by motor vehicles and per capita emission by B.C. residents, both for the entire estuary and for the different habitats. The United States Environmental Protection Agency (EPA) estimates annual emissions from individual motor cars at 4.6 Mg CO2 yr-1 per vehicle, and B.C.’s annual emissions per capita are 12.6 Mg carbon dioxide equivalents (CO2e), not including transportation or air travel emissions (Business Council of British Columbia, 2019). Calculated carbon sequestration rates from this study were then converted to CO2e sequestration rates for regional-scale comparison with emissions from motor vehicles and residents.
Statistical Analysis
Sediment characteristics of the salt marsh, upper mudflat, lower mudflat, and eelgrass were compared statistically using R Studio version 1.3.1093 (cran.r.project.org). A Levene test of homogeneity of variance revealed that datasets had unequal variances. In addition, Shapiro–Wilk test showed that the datasets were not normally distributed, and the assumptions of the parametric t-test could not be met; thus, non-parametric tests were used. A Welch’s unequal variance t-test was employed to test for differences in the sediment characteristics between the habitats. Simple linear regressions and Pearson’s correlation were used to determine statistical relationship between sediment properties. Natural log transformations of datasets were used when required to satisfy the assumptions of linear regression. Significance level of α = 0.05 was set for all statistical analyses.
Results
Sediment Physicochemical Properties
Bulk Density
Sediment BD generally increased with depth in all habitat types. Mean sediment BD values in the upper 20 cm were significantly different between all habitats (Welch’s t-test, p < 0.05), most similar in the upper mudflat, lower mudflat, and eelgrass meadow, and notably lower in the salt marsh and at intermediate levels in the oyster shell beds (Figure 2 and Table S2).
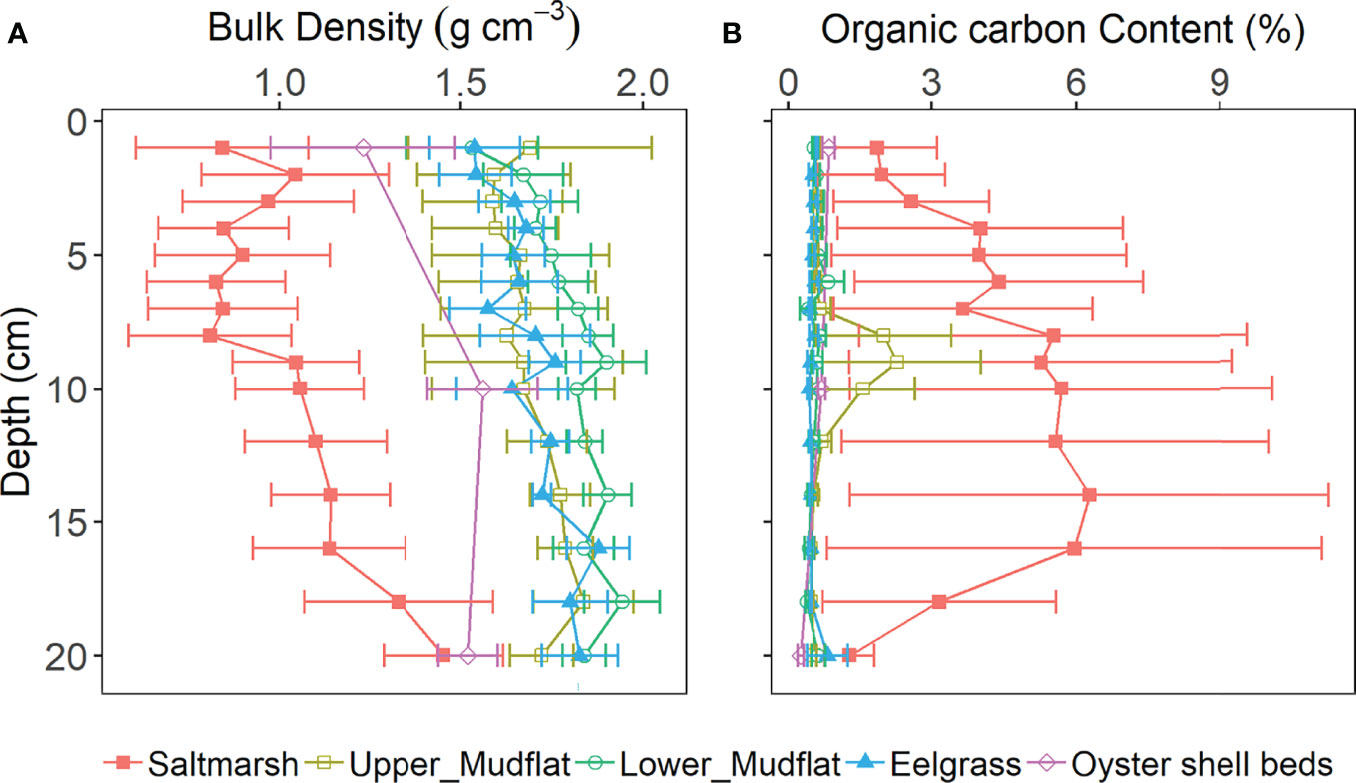
Figure 2 Sediment core profiles of average (A) bulk density, and (B) carbon content (% by weight) in the top 20 cm of cores from salt marsh (n = 4), upper mudflat (n = 6), lower mudflat (n = 5), eelgrass (n = 3), and oyster shell bed (n = 2) stations at all sampling sites. All data are presented as the mean ± standard error of the mean.
Sediment Organic Carbon
Concentrations of sediment organic matter and OC in the upper 20 cm were highest at the salt marsh stations (8.96 ± 1.06% organic matter and 4.47 ± 0.77% OC), with a slight increasing trend from the eelgrass (2.49 ± 0.084 and 0.53 ± 0.03%), to the lower mudflat (2.61 ± 0.10 and 0.57 ± 0.06%), and the upper mudflat (3.13 ± 0.28 and 0.86 ± 0.17%) stations. Sediment OC in the oyster shell bed sediments was 0.61 ± 0.08%, comparable to mudflat and eelgrass sediments. Across all habitats, an inverse relationship was observed between bulk density and sediment OC (p ≤ 0.05). None of the depth profiles for sediment OC concentration showed the typical exponential decay trend expected under steady-state conditions of sediment OC accumulation and decomposition (Berner, 1980; Hargrave and Phillips, 1989). Generally, sediment OC content (% by weight) varied little with depth with the exception of the salt marsh cores where sediment OC increased from 2 to 12 cm and decreased from 12 to 20 cm (Figure 2). As a result of this homogeneity along depth profiles, mean sediment OC values over the full 20 cm are used here for comparison between all cores. Generally, sediment OC was low in all habitats compared to similar habitats globally (Table 1).
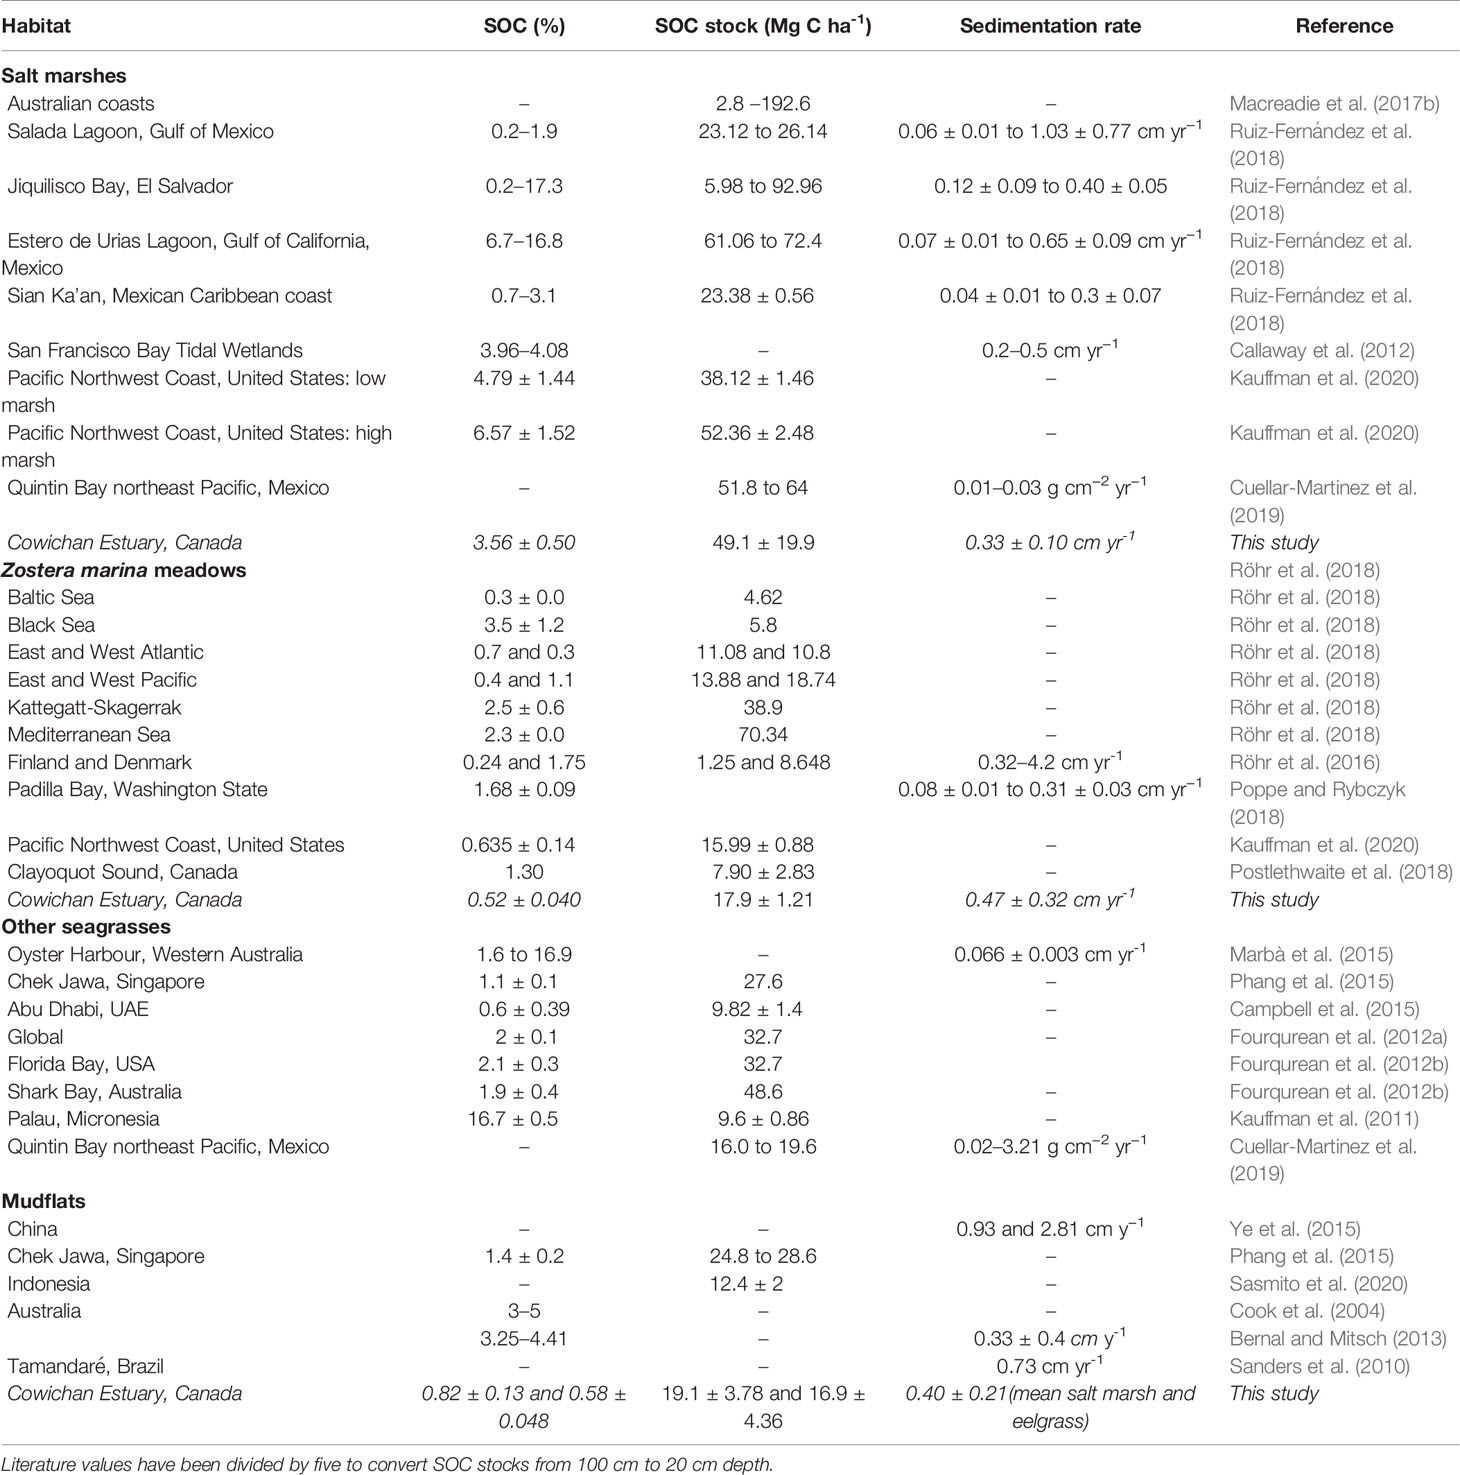
Table 1 Comparison of sediment organic carbon (SOC) concentrations (% by weight) and stocks (Mg C ha−1) at different salt marsh, mudflat and eelgrass environments.
Granulometry
Upper mudflat, lower mudflat and eelgrass sediments were mostly sandy (82.56 ± 1.41, 87.14 ± 1.28, and 94.17 ± 0.25% sand, Figure 3), with a small fraction of silt (<12%) and clay (<6%). Salt marsh sediments had the highest fraction of silt and clay (32.39 ± 2.13 and 8.87 ± 0.61%) and the lowest fraction of sand (58.74 ± 2.71%) compared to the other habitats. A general transition in mean grain size was observed from the high to the low intertidal zone, with decreasing clay and silt content and increasing sand content from salt marsh to lower mudflat stations. A positive relationship was observed between bulk density and percentage sand, as well as between sediment OC and clay and silt contents (p ≤ 0.05). Average gravel content in the oyster shell bed sediments was 41.4 ± 4.0%.
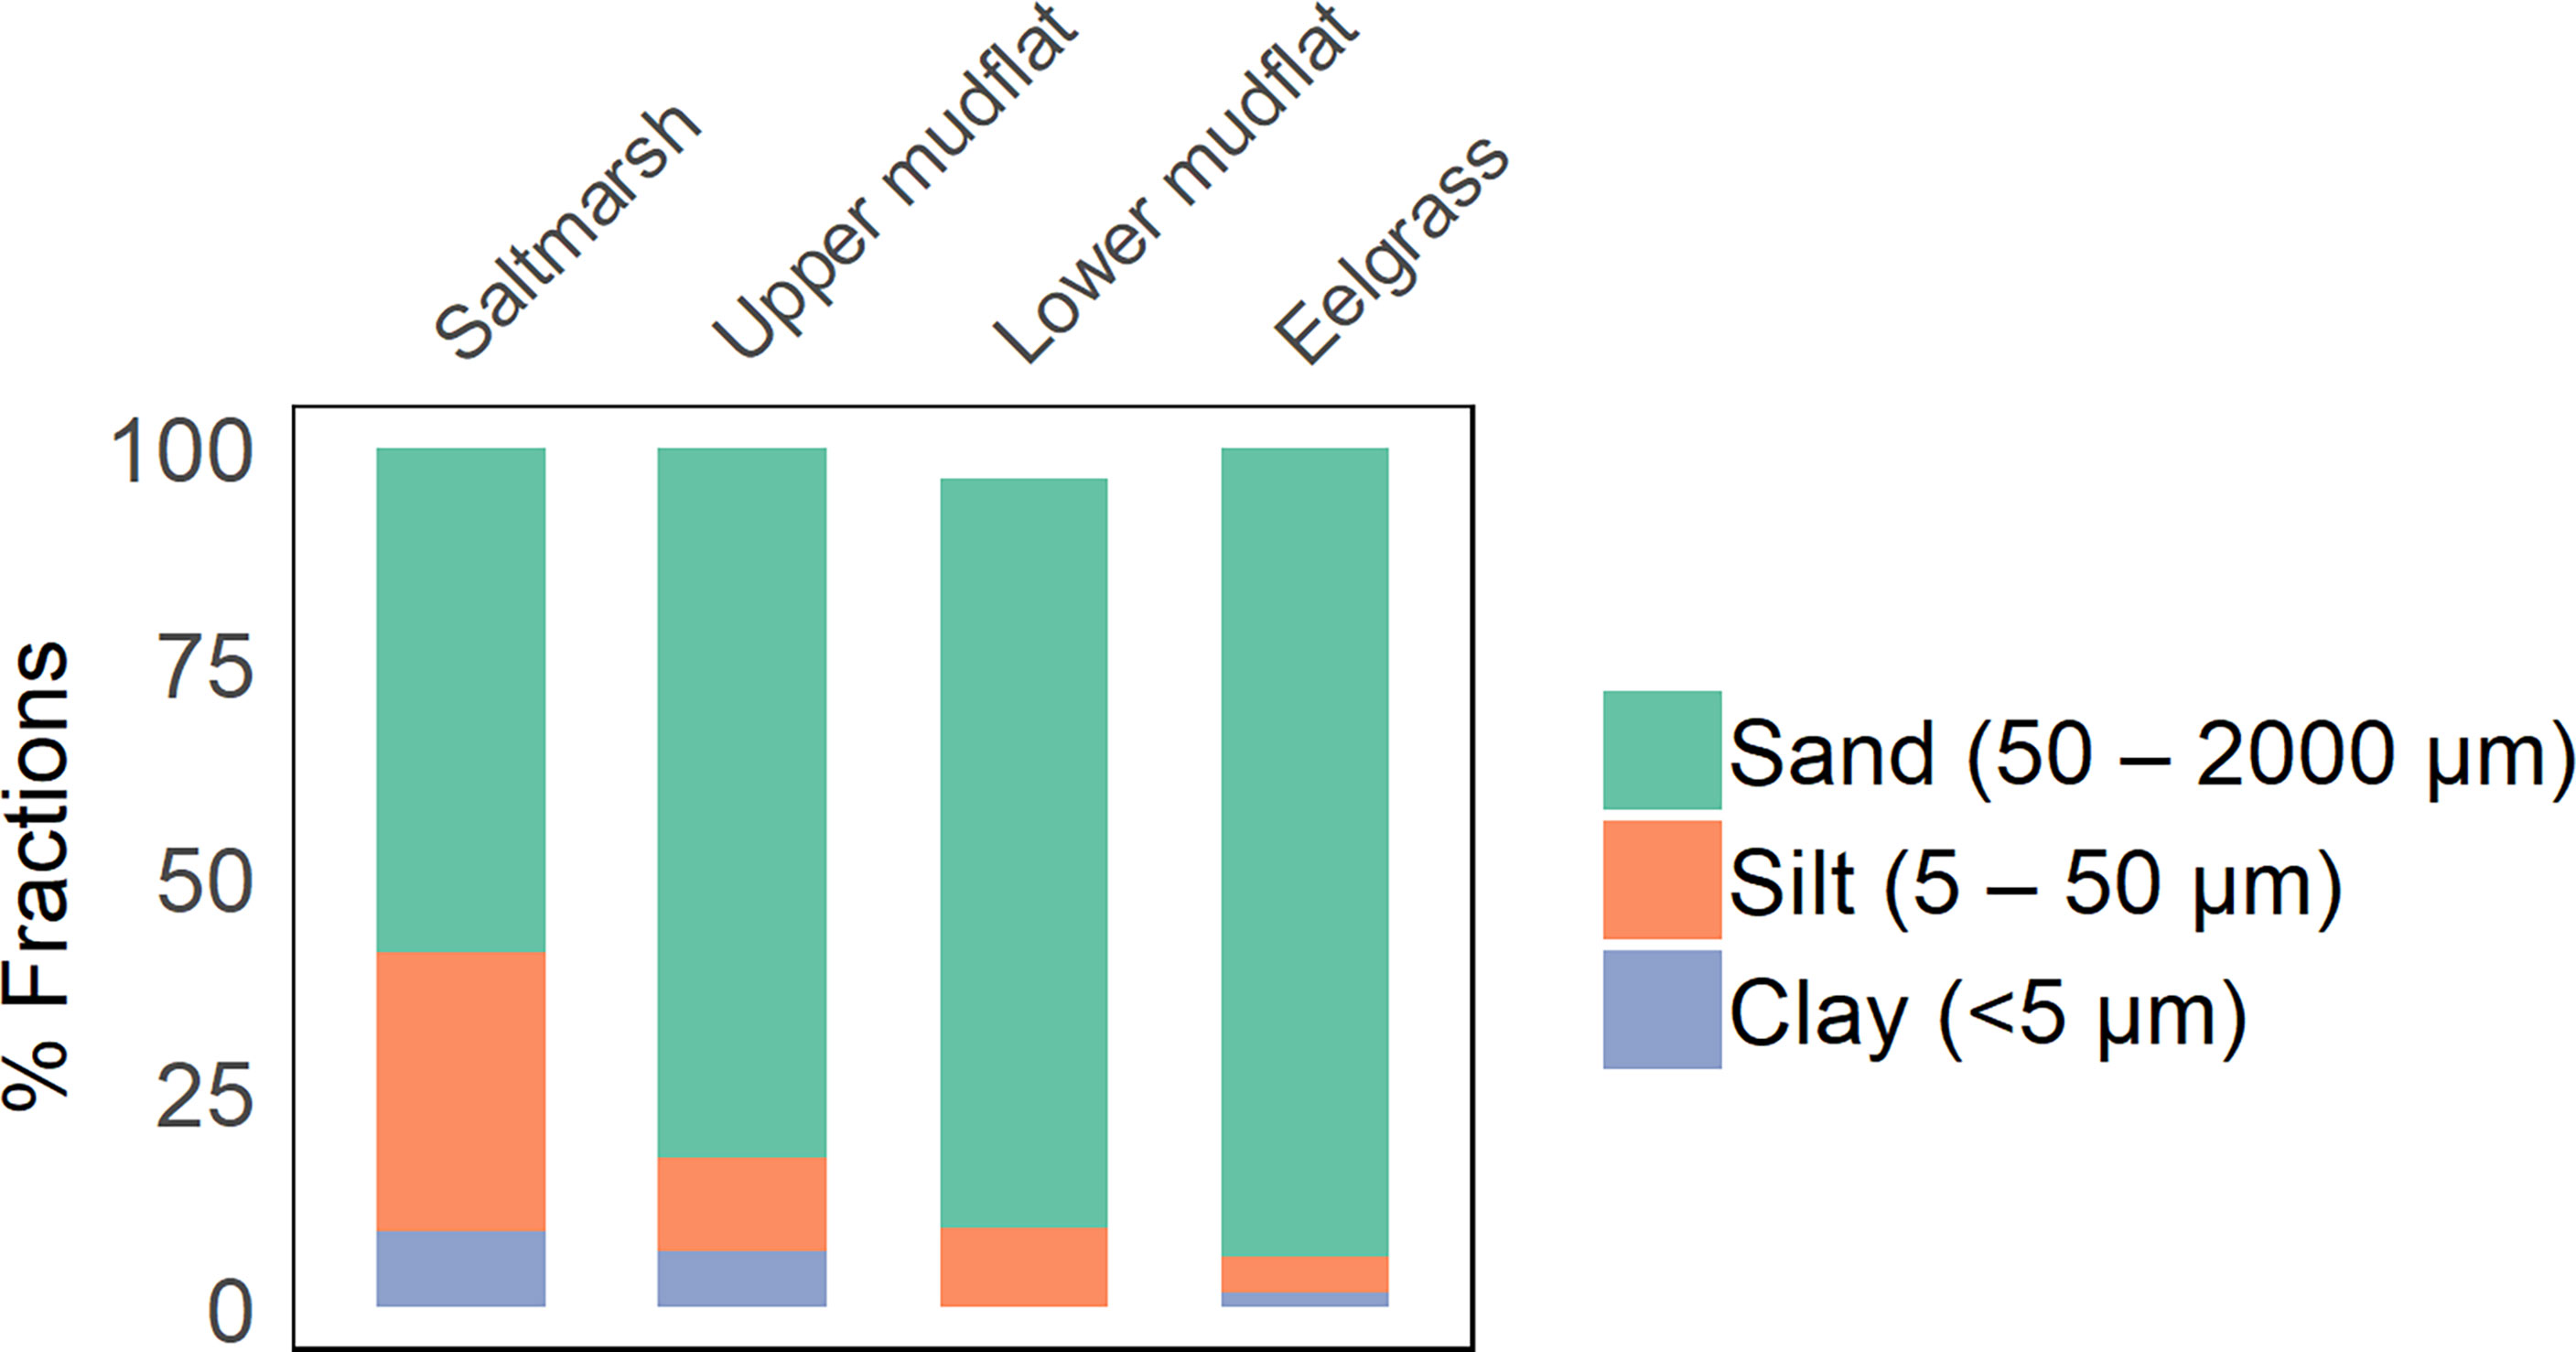
Figure 3 Sediment grain size distribution in the top 20 cm of cores from salt marsh, upper mudflat, lower mudflat, and eelgrass stations at all sampling sites.
Carbon Stocks
Mean SOC stocks (i.e., the amount of OC stored per unit area, down to a fixed sediment depth) in the top 20 cm of sediment were comparable in the upper mudflat (19.30 ± 3.58 Mg C ha-1), lower mudflat (17.33 ± 3.17 Mg C ha−1) and eelgrass meadow (18.26 ± 0.86 Mg C ha−1) cores (Table 2S). Saltmarsh sediments had the highest per-hectare carbon content (58.78 ± 31.45 Mg C ha−1), approximately three-fold higher than all other habitats. When granule (2-4 mm) and pebble (4-64 mm) contents were accounted for, the oyster shell bed had a mean SOC stocks of 9.43 ± 1.50 Mg C ha−1, approximately half those of the mudflats and eelgrass meadow.
Sediment Accretion, Mass Accumulation, and Carbon Sequestration Rates
Sediment accretion, mass accumulation, and carbon accumulation rates could only be determined for salt marsh and eelgrass cores. The four mudflat cores analyzed showed no trends in 210Pbex activity with depth, and thus could not be dated using the CRS model (Table 2 and Figure 4). Successfully dated salt marsh and eelgrass cores had low 210Pbex activity ranges (0.12 to 10.30 and 0.86 to 5.13 Bq kg-1, respectively) which resulted in high uncertainty values for sediment accretion, mass accumulation, carbon accumulation, and dates.
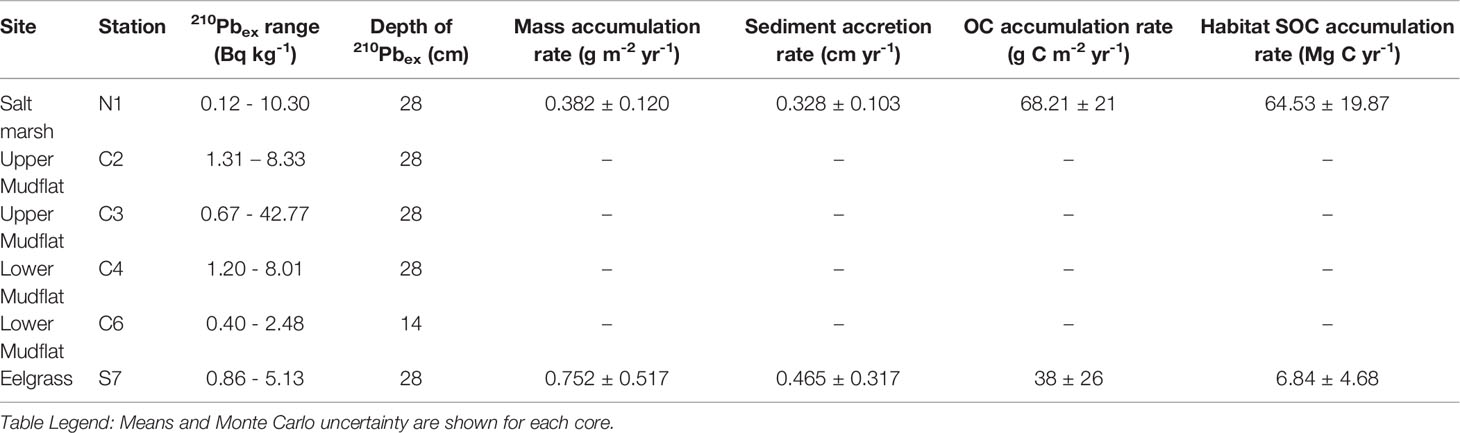
Table 2 Excess 210Pb (210Pbex) activity, depth of 210Pbex, sedimentation rates and carbon accumulation rates calculated with CRS dating model for each core with positive excess 210Pb activity values, representing an approximately 100-year timeframe.
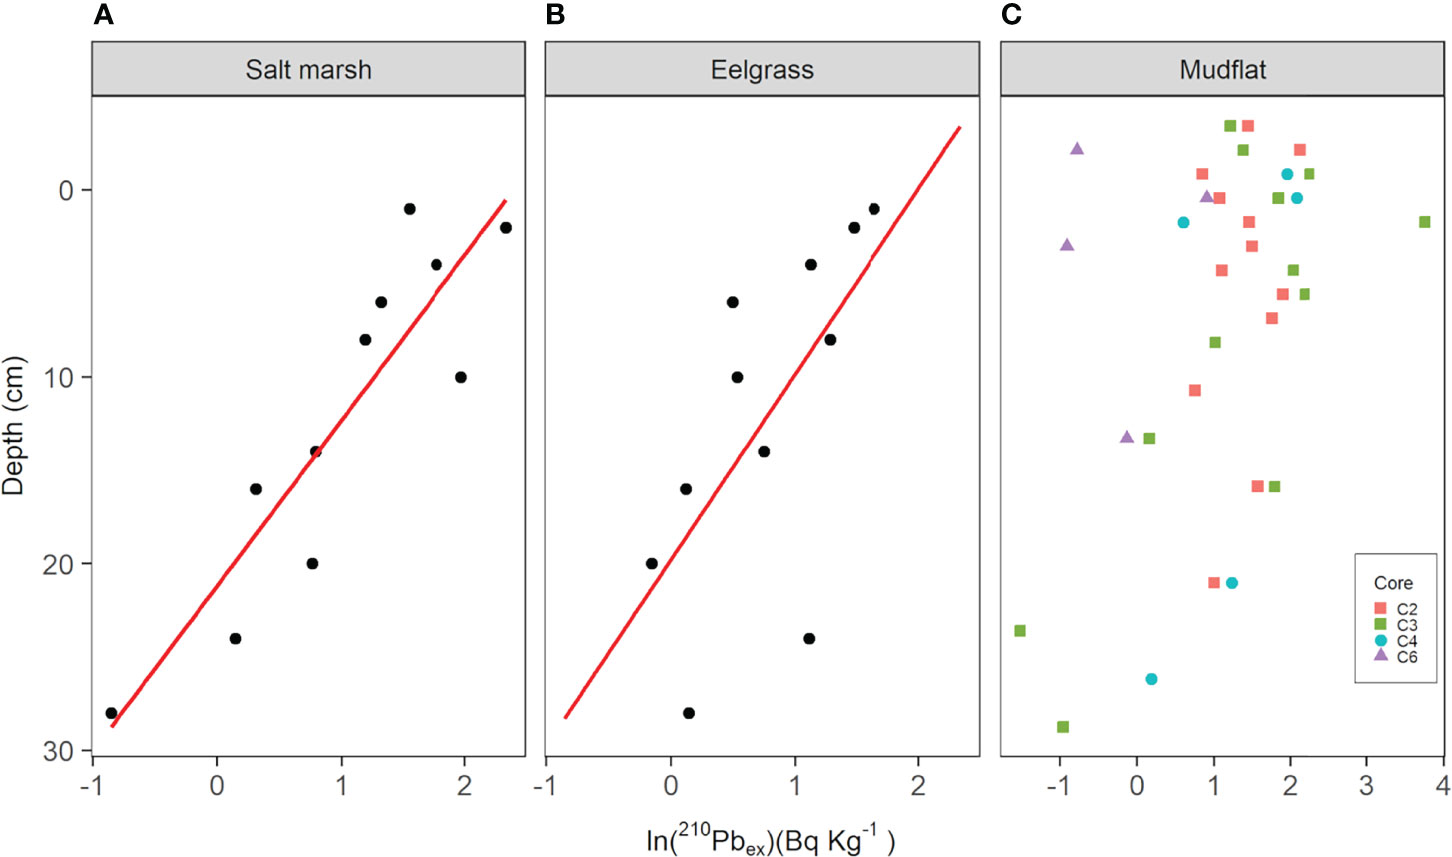
Figure 4 Excess 210Pb activity per unit mass of sediment (Bq kg-1) depth profiles of sediment cores from the Cowichan Estuary. Panels (A) (salt marsh) and (B) (eelgrass) show natural log transformations of excess 210Pb (210Pbex) and linear regression lines used to estimate sediment accretion rate (SAR). Panel (C) shows natural log transformations 210Pbex in mudflat cores C2, C3, C4, and C6, which were respectively collected from low to high tidal inundation, omitting values equal to or below the supported “background” 210Pb threshold for each core.
The salt marsh and eelgrass cores analyzed were both 32 cm in length. The maximum depth of excess 210Pb (210Pbex) was 28 cm in the salt marsh core, corresponding to the year 1877 ± 52 years. The sediment accretion rate in the salt marsh core ranged from 0.095 to 0.733 cm yr-1 with an average 0.328 ± 0.103 cm yr-1. Carbon accumulation rates ranged from 27 ± 19 to 122 ± 24 g C m-2 yr-1, averaging 68 ± 21 g C m-2. The maximum depth of 210Pbex in the eelgrass core was also 28 cm, with sediments at that depth dating from the year 1914 ± 31 years. Accretion rates in the eelgrass sediment ranged from 0.078 ± 0.038 to 0.900 ± 0.662 cm yr-1 at an average of 0.465 ± 0.317 cm yr-1, while carbon accumulation rates ranged from 7 ± 3 to 68 ± 50 g C m-2 yr-1, averaging 38 ± 26 g C m-2.
Aboveground and Belowground Biomass and Organic Carbon in Macroscopic Plant Material
The mean aboveground (herbaceous mass) and belowground (root mass) biomass stocks of the Z. marina that dominated the seagrass sites were respectively 0.44 ± 0.059 and 0.39 ± 0.077 Mg ha-1, with area-integrated biomass stocks of 7.91 ± 1.07 Mg and 6.97 ± 1.39 Mg. Eelgrass biomass carbon stocks were 0.087 ± 0.012 and 0.074 ± 0.011 Mg C ha-1 in the below- and aboveground biomass, with area-integrated stocks of 1.57 ± 0.21 and 1.50 ± 0.20 Mg C (Table 3). The aboveground and belowground biomass stocks of the salt marsh dominated by Lyngbye’s sedge (Carex lyngbyei Hornem) were 4.67 ± 0.74 and 18.27 ± 7.02 Mg ha-1. The salt marsh had area-integrated biomass stocks of 443.51 ± 70.56 aboveground and 1728.33 ± 655.17 Mg belowground, with average biomass OC stocks of 1.34 ± 0.21 and 7.144 ± 2.74 Mg C ha-1, and area-integrated biomass carbon stocks of 126.53 ± 20.13 and 675.84 ± 259.61 Mg C. Total area-integrated biomass for both vegetated habitats was 805.44 Mg (see individual habitat stock values for associated standard errors).
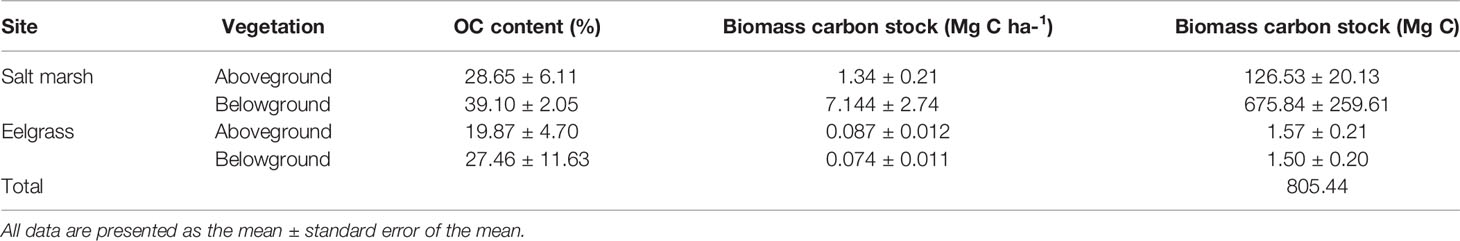
Table 3 Total organic carbon (OC) stocks in salt marsh and eelgrass plant biomass.
Total Ecosystem Carbon Stocks
The term total ecosystem carbon stock (TECS) is defined here as the total sediment and vegetation OC stock per unit-area, excluding IC to remain consistent with established definition of ecosystem carbon stocks used by other contemporary blue carbon studies (Kauffman et al., 2020; Sharma et al., 2020). The TECS in the salt marsh was 67.26 Mg C ha-1 (1.34 ± 0.21, 7.144 ± 2.74, and 58.78 ± 14.19 Mg C ha-1, respectively, for aboveground biomass, belowground biomass and sediment) (Table 2S, Table 3 and Figure 5). The TECS were 19.30 and 17.33 Mg C ha-1, respectively, in the upper mudflat and lower mudflat, and 21.33 Mg C ha-1 in the eelgrass meadow (1.57 ± 0.21, 1.50 ± 0.20, and 18.26 ± 3.17, respectively, for aboveground biomass, belowground biomass and sediment). The oyster shell bed TECS was 9.43 ± 1.50 Mg C ha-1, all of which was accounted for in the sediments. Carbon stocks in the salt marsh were generally three-fold higher than all other habitats, which were all approximately equal. Sediment OC stock dominated the total carbon storage in the eelgrass meadow, with combined aboveground and belowground biomass constituting 0.48% of TECS. In contrast, the salt marsh had the highest biomass contribution relative to total ecosystem carbon (12.61%).
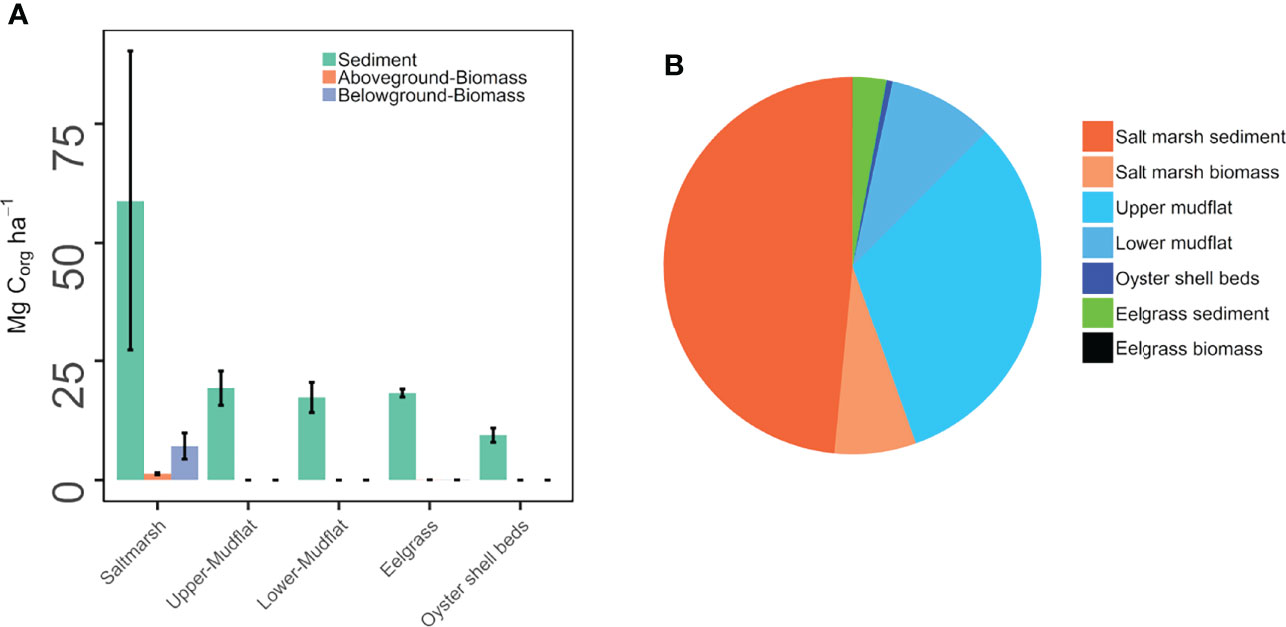
Figure 5 Comparison of the total biomass and sediment organic carbon (OC) stocks in the salt marsh, upper mudflat, lower mudflat, eelgrass meadow, and oyster shell beds of the Cowichan Estuary. Panel (A) is per-hectare sediment and vegetation biomass organic carbon stocks; Panel (B) is total area-integrated sediment and vegetation biomass OC stocks. Bars represent standard errors.
When per-hectare TECS was multiplied by the area of each of the intertidal habitats, the upper mudflat total covered 52% of the land area (191 ha) and contained approximately 32% (3718.72 Mg C) of the Cowichan Estuary carbon stock (Table 2S and Figure 5). The salt marsh accounted for 25% (95 ha) of the land area, but 51% (6362.49 Mg C) of the TECS. The lower mudflat and eelgrass grass meadow respectively accounted for land areas of 16% (60 ha) and 5% (18 ha), contributing 9% (1085.85 Mg C) and 3% (330.20 Mg C) of the TECS, respectively. The oyster beds accounted for approximately 2% of the estuary area and 0.65% (59.4 Mg C) of the TECS.
Organic Matter Characterization and Sources
Photosynthetic Pigments
At the saltmarsh sites, the depth-integrated total photosynthetic pigment concentration was 15.84 ± 2.44 μg/g, with a surface concentration of 35.77 ± 16.38 μg/g. The eelgrass sites had similar average depth-integrated and surface total pigment concentrations of 11.41 ± 1.23 and 34.78 ± 0.77 μg/g, respectively (Table S3 and Figure 6). Pigment concentrations in upper and lower mudflat sediments were similar, and notably lower than those of the vegetated habitats, for both the depth-integrated (6.69 ± 0.58 and 6.58 ± 0.58 μg/g) and surface layer (14.65 ± 2.10 and 14.35 ± 4.67 μg/g) measures.
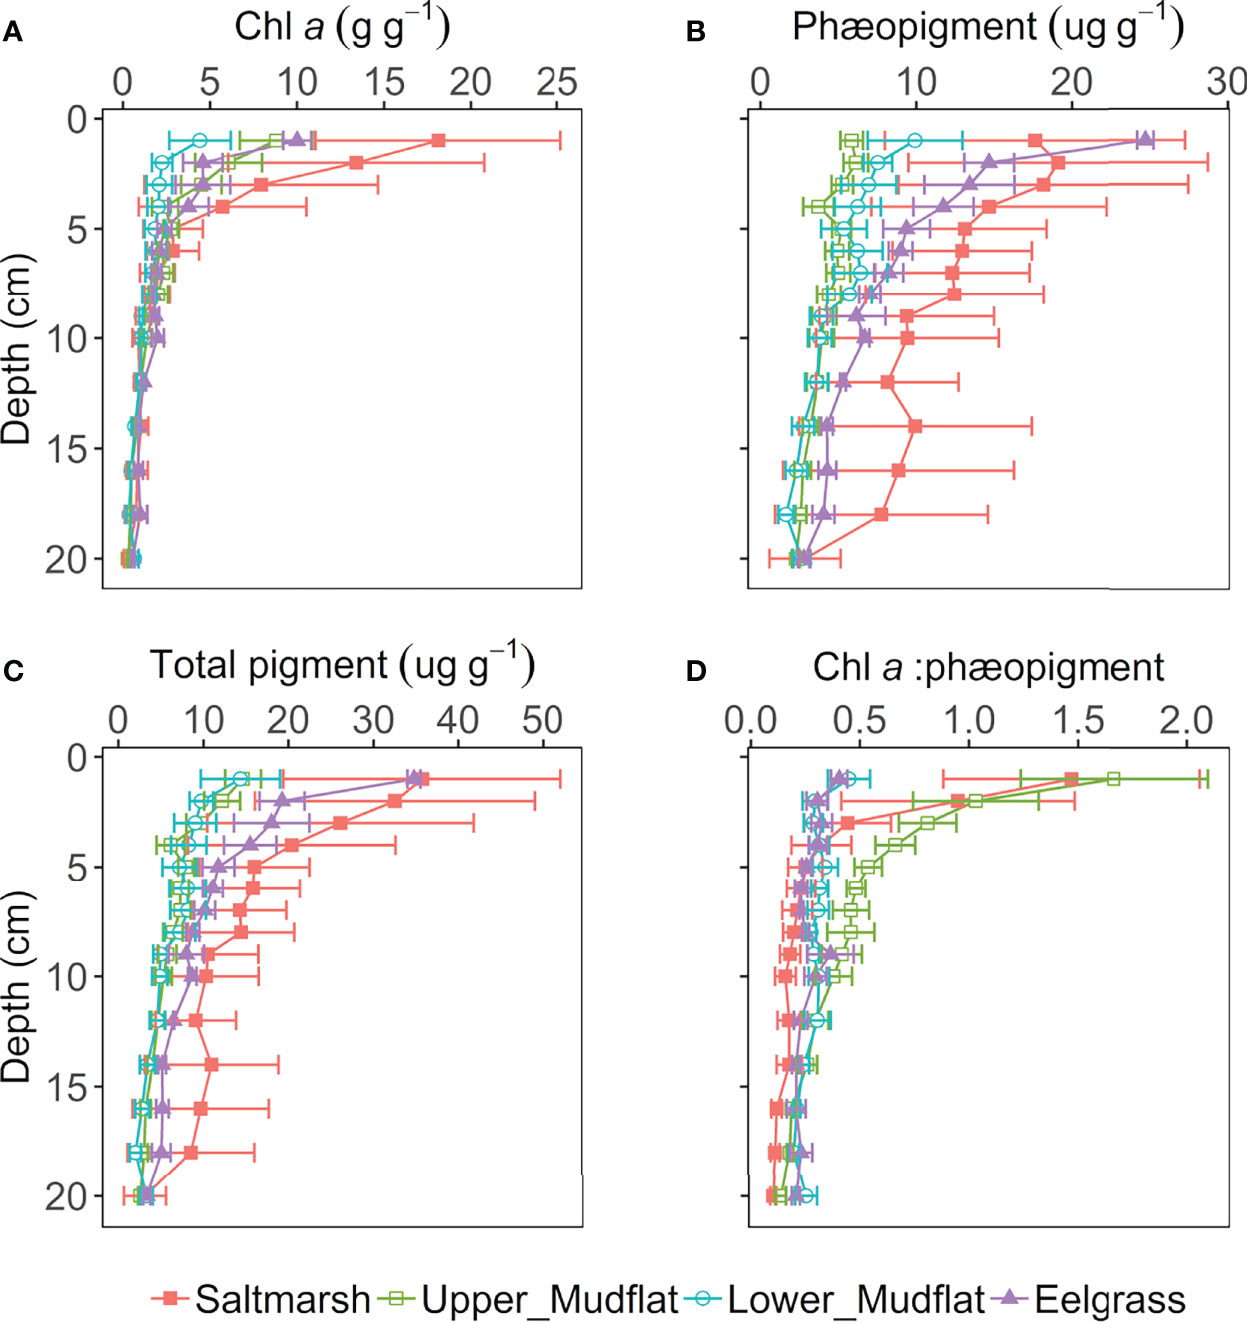
Figure 6 Photosynthetic pigment depth profiles in the top 20 cm of sediment of the Cowichan Estuary: (A) chlorophyll a (chl a) (μg/g dry sediment); (B) Phæopigment (μg/g dry sediment); (C) Total pigment (μg/g dry sediment); (D) Chl a/phæopigment ratio. Horizontal bars represent standard errors.
Depth-integrated chl a concentration increased from lower mudflat (1.55 ± 0.19 μg/g) to upper mudflat (2.49 ± 0.32 μg/g) stations, and eelgrass meadow (2.63 ± 0.37 μg/g) to the salt marsh (4.05 ± 1.02 μg/g). This trend of increasing chl a from low- to high-intertidal and unvegetated to vegetated habitats was more obvious in surface chl a, which increased from 4.43 ± 2.04 μg/g in the lower mudflat, to 8.80 ± 2.08 μg/g in the upper mudflat, 10.02 ± 0.81 μg/g in the eelgrass meadow, and 18.13 ± 7.074 μg/g in the salt marsh.
Surface sediment chl a/Phæopigment ratios were highest in the upper mudflat (1.67 ± 0.28), followed by the saltmarsh (1.47 ± 0.59). Lower mudflat and eelgrass sites had the lowest surface chl a/Phæopigment ratios (0.45 ± 0.097 and 0.41 ± 0.037).
C:N and δ13C
Ranges of C:N ratios and δ13C in cores from this study reflect the mixed nature of organic inputs in these sediments with both terrestrial- and marine-derived material (Table 4 and Figure 7). The highest average δ13C enrichment (-22.6 ± 0.4 ‰) and lowest C:N (10.9 ± 1.2) were found in the eelgrass sediments suggesting a relatively high contribution of marine-derived OM and buried Z. marina biomass (McPherson et al., 2015). In contrast, salt marsh sediments were composed of more terrestrial material with the lowest δ13C enrichment and highest C:N (-26.5 ± 0.1 ‰ and 20.2 ± 0.8) compared to the other habitats. The lower mudflat had slightly lower δ13C (-25.8 ± 0.2 ‰) and higher C:N (12.2 ± 1.1) than the upper mudflat (-24.5 ± 0.1 ‰ and 11.7 ± 0.6), possibly reflecting the input of woody debris from log booms in the low intertidal zone.
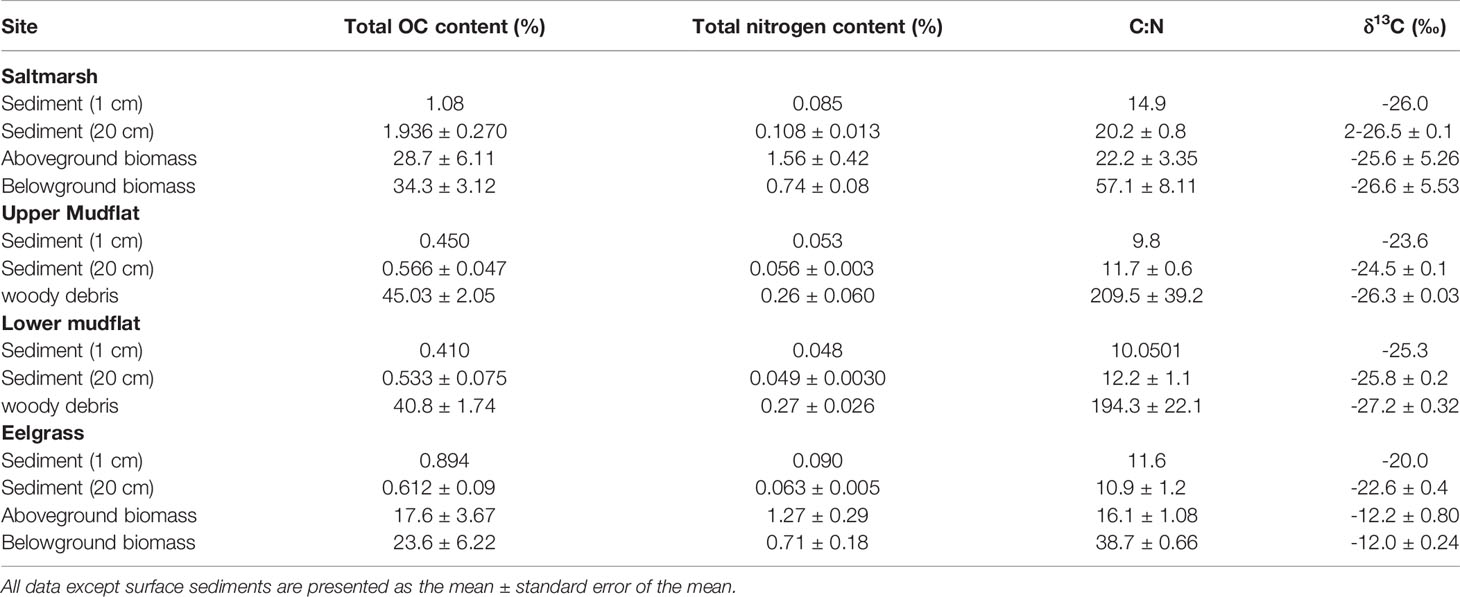
Table 4 Mean organic and nitrogen contents, CLN ratio, and δ13C signatures in biomass, surface sediment (1 cm), and top 20 cm of sediment from salt marsh, upper mudflat, lower mudflat, and eelgrass meadow in the Cowichan Estuary.
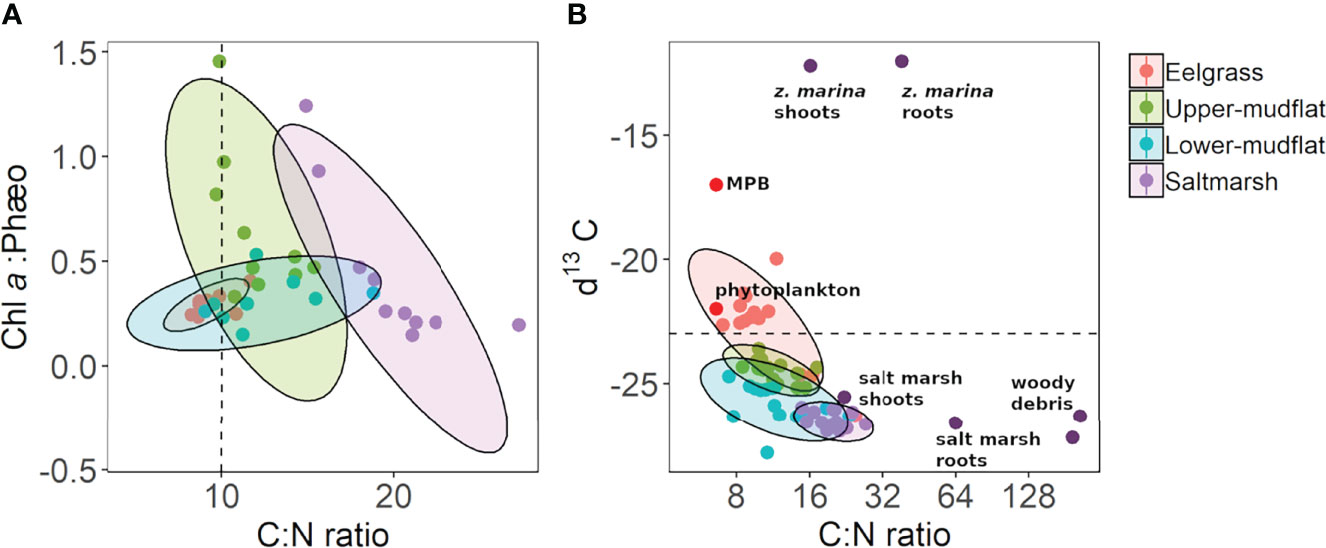
Figure 7 Relationship between C:N ratio to sediment properties: (A) chlorophyll a (chl a)/phæopigment ratio vs. C:N ratio, with hatched line on the x-axis to denote generally labile (C:N <10) and recalcitrant (C:N >10) material; (B) δ13C vs. C:N ratio plot of sediment cores collected from the Cowichan Estuary, with dark-purple labelled points denoting vegetation end-members from the Cowichan Estuary, with phytoplankton and microphytobenthos (MPB) δ13C and C:N estimates from literature (Redfield et al., 1963, France, 1995). The hatched line on the y-axis denotes marine (δ13C <23‰) and terrestrial (δ13C >23‰). Ellipses delineate the 95% confidence interval for each of the habitats, assuming a multivariate t distribution.
Sediment and Oyster Shell Bed Inorganic Carbon Stocks
Inorganic carbon stocks, outside of the oyster shell beds, exhibited a generally positive relationship with tidal inundation, ranging from 6.26 ± 0.90 Mg C ha-1 in the salt marsh and increasing to 11.15 ± 1.24 Mg C ha-1 in the lower mudflats (Figure 1S and Table 2S). Statistically significant differences were found in the sediment IC densities between the salt marsh and all other all other habitats, as well as between the upper- and lower-mudflats, the eelgrass and lower mudflat, and the eelgrass and the oyster shell beds (Welch’s t-test, p < 0.05). Together, the two mudflat IC stocks (1550.4 ± 117.2 and 669.0 ± 74.5 in the upper- and lower mudflat, respectively) contribute ~68% of the IC in the Cowichan Estuary, with the salt marsh and eelgrass meadow respectively accounting for 18% (591.9 ± 84.8 Mg C) and 5% (283.7 ± 19.2 Mg C).
The oyster shell beds represented approximately 9% (434.19 Mg C) of the IC in the intertidal sediments of the estuary despite covering under 2% of the intertidal area. Inorganic carbon accounted for 11.43 ± 0.11% of the shell material. Mean per-hectare aboveground oyster shell IC stock was 37.01 ± 0.34 Mg C ha-1 and the total aboveground oyster shell IC stock for all of the oyster beds was 233.19 ± 2.16 Mg C. With buried shell material included in sediment IC (% by dry weight), the oyster shell bed sediments were statistically distinct from all other habitat types and mean per-hectare sediment IC stocks were highest in the oyster shell beds (31.91 ± 3.04 Mg C ha-1).
Blue Carbon Valuation
Comparison With B.C. forests
The Cowichan Estuary salt marsh per-hectare sediment OC stock is up to to five and three times higher than values reported, respectively, for second- and old-growth forest in the interior of British Columbia, and comparable with the lower range of values for mature stands of Pacific Northwest coastal forest (Table 5). Cowichan Estuary eelgrass and mudflat per-hectare sediment OC stocks are approximately 1.5 times higher than to those of second growth forests and the lower limit of old growth forests of interior B.C., and around two times lower than estimates for mature stands of Pacific Northwest coastal forest.
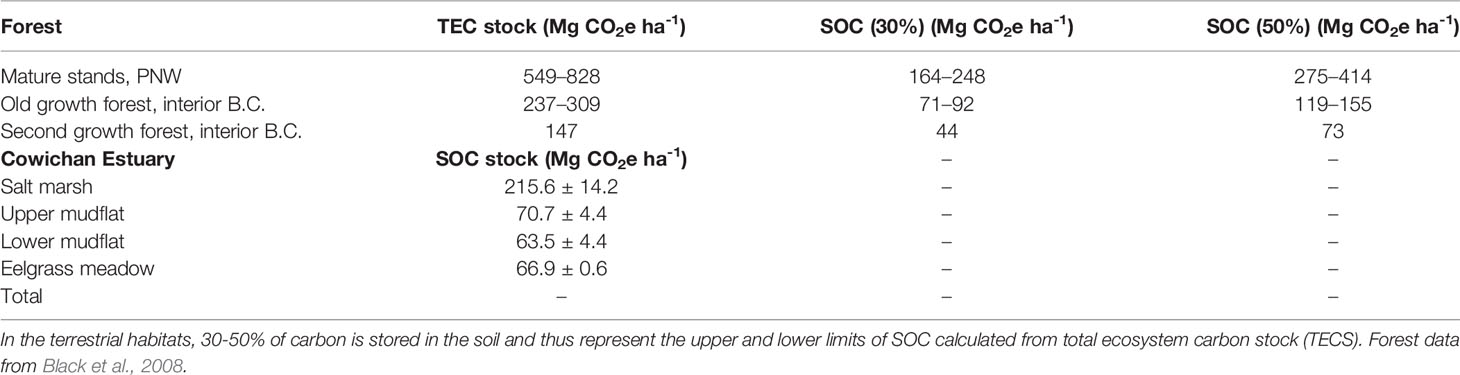
Table 5 Comparison of sediment organic carbon (SOC) stocks, reported as carbon dioxide equivalents (CO2e), in the top 1 m of Cowichan Estuary salt marsh and eelgrass meadow, mature stands in the Pacific Northwest (PNW), old- and second-growth forests of interior British Columbia, Canada.
Carbon Sequestration
Estimated areal rates of carbon sequestration for salt marsh and eelgrass meadow in the Cowichan Estuary were respectively 64.53 ± 19.87 and 6.84 ± 4.68 Mg C ha-1 y-1, similar to a 20-year-old stand of forest on coastal Vancouver Island, British Columbia. Together, these two blue carbon habitats (salt marsh and mudflat) in the Cowichan Estuary would have the capacity to sequester the annual equivalent emissions of 133 ± 72 vehicles and 49 ± 26 B.C. residents (Table 6).
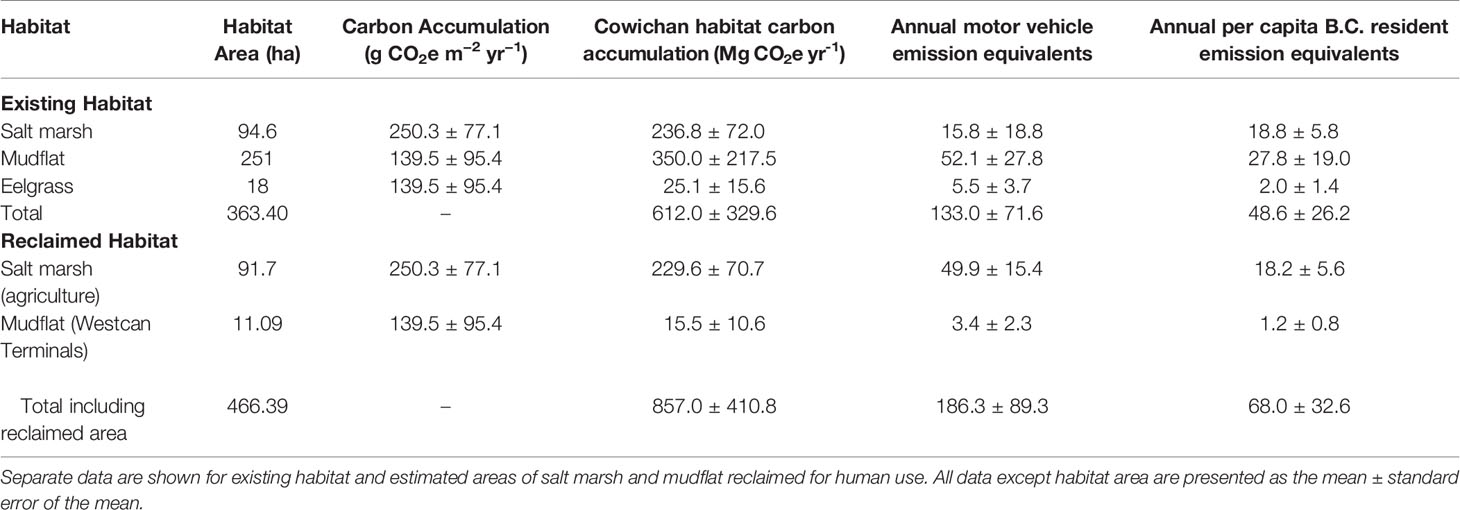
Table 6 Total annual carbon sequestration per habitat in the Cowichan Estuary compared to annual motor vehicle and B.C. resident CO2 emission equivalents (CO2e).
Discussion
Evidence for Strong Hydrodynamics
We observed a number of habitat-related trends in sediment bulk properties in the Cowichan Estuary that we attribute to hydrodynamics. Most distinct were sediments from the salt marsh, where the high intertidal location and thick vegetation would act to minimize wave and current forces, compared to non-vegetated habitats and habitats lower in the intertidal zone. Salt marsh sediments were relatively carbon-rich, and high in moisture (low bulk density) and fine particles. In contrast, mudflat and eelgrass sediments had notably lower organic carbon and moisture contents, and a high percentage of sand. Alone, the relatively homogenous organic carbon profiles in the mudflat sediments could also be attributed to an irregular supply of organic matter or irregular rates of degradation (Alongi et al., 1996, Ruiz-Fernández et al., 2018). However, when combined with the non-trending 210Pb depth profiles and the high percentage of coarser particles mixing and erosion forces are the most likely explanation (Winterwerp and Van Kesteren, 2004; Jacobs et al., 2011; Zhou et al., 2016). In addition, decreased chl a in the surface sediments of the lower mudflats suggests that sediment instability may inhibit the formation of cohesive surface biofilms by epiphytobenthos (Cahoon, 1999; Blanchard et al., 2000; de Brouwer et al., 2000). The down-core trends in the eelgrass sediments also provide evidence for hydrodynamic mixing, possibly dampened by the vegetation. There was no depth-related organic matter decay trend in the eelgrass sediments. However, there was a discernible down-core trend in excess 210Pb in the eel grass sediments that was weaker than the trend observed in the more thickly vegetated salt marsh.
Across intertidal ecosystems globally, reworking of sediment through burrowing and feeding activities of macrofauna, as well as an overabundance of bioturbators in some estuaries, can contribute to substantial remineralization of organic matter (Bentley et al., 2014; Coverdale et al., 2014). However, bioturbation rather that abiotic reworking is less likely to be the primary cause of sediment mixing in the Cowichan Estuary, as few potentially bioturbating macrofauna were observed in the mudflats during coring operations and other field activities. While interannual fluctuations in invertebrate species richness is common, the total macrofauna abundance and biomass is generally less pronounced (Beukema et al., 1993). Seasonally, a pattern of increasing invertebrate abundance has been observed in late spring and early summer in temperate estuaries (Ysebaert, 2000). Sediment cores in this study were collected in May when macrofauna abundances would have likely been relatively high, yet sieved cores only occasionally produced polychaetes or crustaceans. Macrofaunal abundance may therefore be generally low in the Cowichan Estuary. Characterizing the exact role of bioturbation in sediment reworking in the Cowichan Estuary would require more detailed investigation of macrofauna species richness, biomass, and seasonal dynamics.
Cowichan Bay lacks a sill or any other geological features to shelter it from high-energy wave and current action from outside waters in the adjacent Satellite Channel. The Cowichan Estuary is exposed to strong tidal currents, and the associated mixing is known to play an important role in controlling water mass exchange (Davenne and Masson, 2001). A 1984 survey of the surface sediments of Cowichan Bay reported predominantly sandy sediments in most of the intertidal sample sites (>50–90% sand, n = 22 sites) and muddy sediments in the subtidal area extending into Satellite Channel (Luternauer, 1984), suggesting a hydrodynamic that favours the deposition of fine-grained sediment to the subtidal seafloor rather than within the estuary. Furthermore, Saanich Inlet, 6 km to the southeast of the Cowichan Estuary, receives the majority of its deposited terrigenous sediment from the Cowichan River via Satellite Channel (Gucluer and Gross, 1964). Erosion and/or export in the Cowichan Estuary may be enhanced by its many secondary distributary channels, as similar high sand content and deposition of coarse particles have been noted in sediment columns collected close to estuarine channels that are influenced by increased hydrodynamic energy conditions and tidal currents (Boldt et al., 2013; Nayak et al., 2018).
The observed patterns of decreasing total photosynthetic pigments, chl a, and chl a/phaeopigment ratios with depth at all stations offer insight into the relative time scales for the proposed hydrodynamic sediment mixing. Chlorophyll a is an indicator of fresh, recently produced and labile organic material (Gacia et al., 2002), as opposed to 210Pbex and bulk sediment organic matter that degrade over longer periods of time (Fry et al., 1977; Arias-Ortiz et al., 2018). As such, deposited chl a is likely degrading in the sediment faster than the sediment is being mixed vertically, resulting in a vertical decrease in chl a despite evidence of mixing in the profiles of sediment OC and other bulk properties (Figure 8). In both the datable sediment cores from the vegetated habitats and the non-datable cores from the mudflats, 210Pbex activity was detectable to a depth of 28 cm, except for a lower mudflat core that lacked 210Pbex activity below 14 cm. This depth threshold for 210Pbex activity suggests the effects of sediment mixing in the mudflats do not occur deeper than 28 cm. While hydrodynamic-driven mixing does not necessarily penetrate up to 28 cm below the sediment surface, sediments at these depths have not been isolated from atmospheric input for sufficient time to produce statistically significant trends in 210Pbex activity compared to the ~100-year-old sediment below this depth threshold. In the mudflats and eelgrass, this rate of mixing over the past ~100 year may be faster than the rate of measurable sediment OC loss, so that mixing obscures any evidence of decomposition (i.e., exponential decrease in sediment OC to the measured depth of 20 cm). In the eelgrass, the effects of hydrodynamic mixing may be dampened enough to allow for a detectable 210Pbex decay profile to develop over the past ~100 years, but sediment instability and reworking over a longer time period prevent a sediment OC decay to develop in the anoxic sediments. As such, the establishment of photopigment decay profiles is likely to precede the rate at which mudflat sediments are mixed and measurable sediment OC decomposition can be detected. In the salt marsh, where the better defined 210Pbex decay profile indicates more sediment stability than the eelgrass sites, the presence of refractory roots add another level of complexity to interpreting sediment OC trends since they are not expected to decay in the same manner as the more labile sediment OC in the other habitats, and furthermore involve substantial photosynthetic pumping of sediment OC to depth in the sediments (Vaughn et al., 2020).
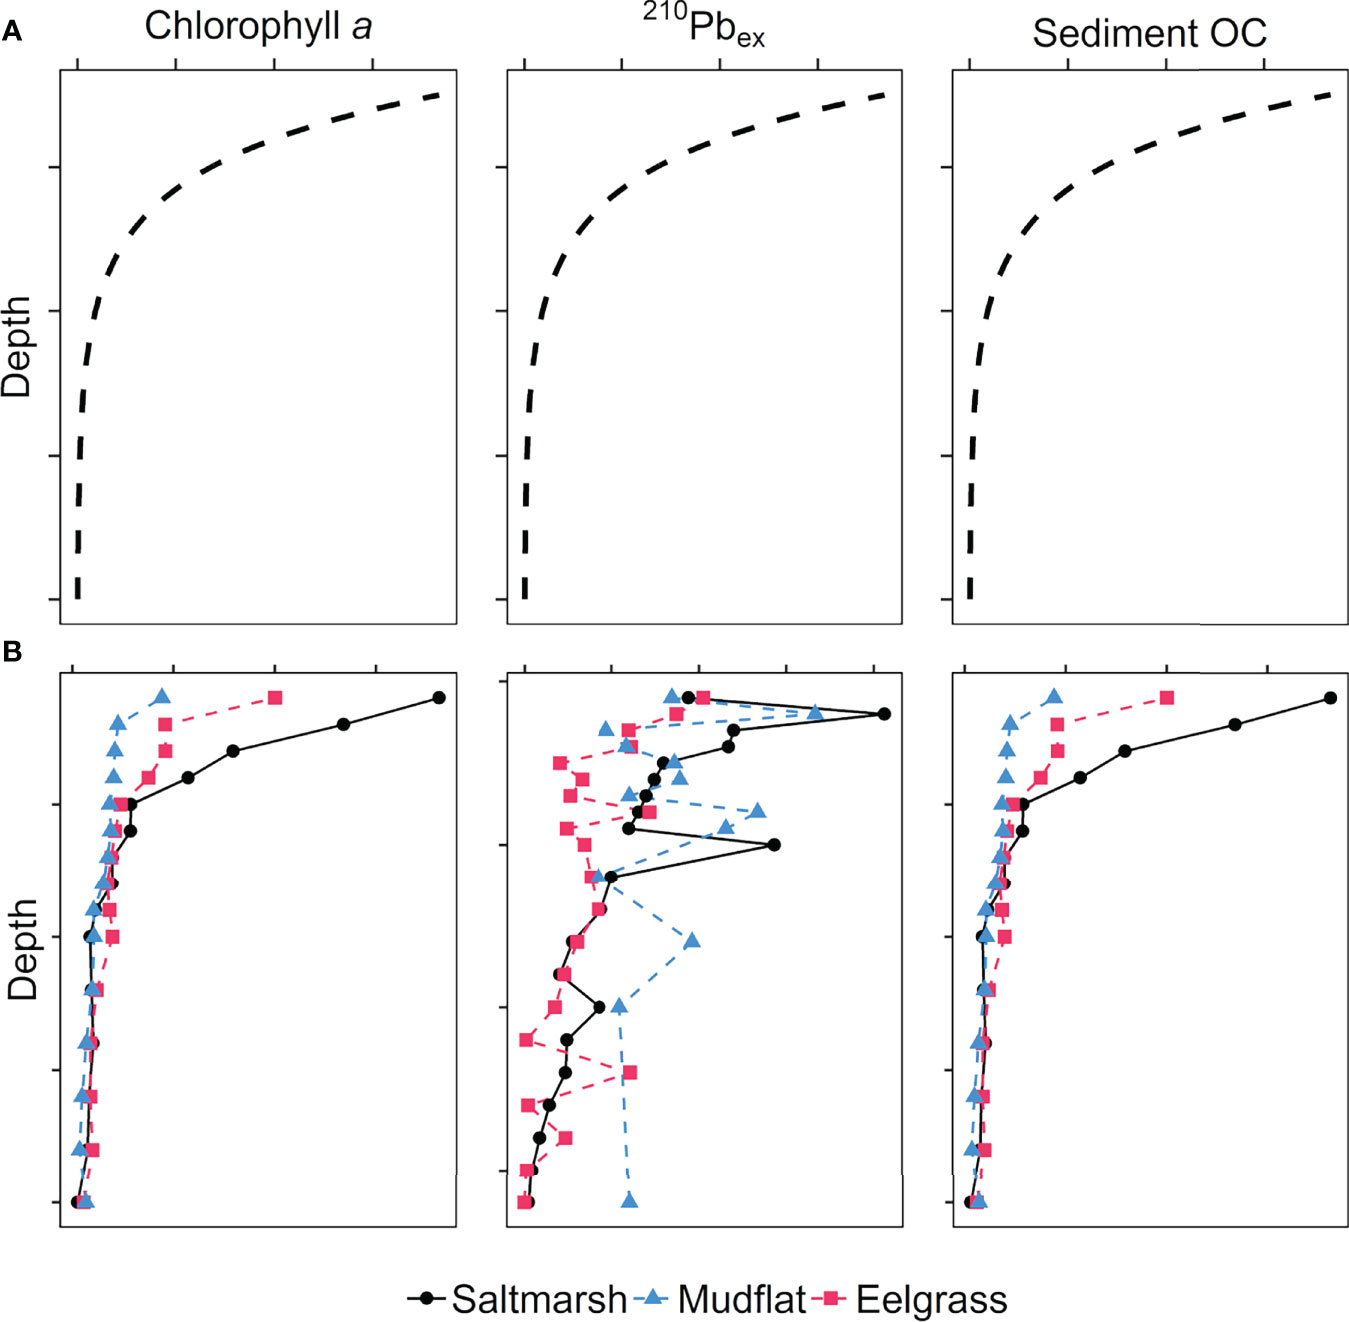
Figure 8 Influence of hydrodynamic sediment mixing and relative rates of decay on profiles of chlorophyll a, excess 210Pb, and bulk sediment organic carbon (OC) in deposited sediments in an intertidal system. Panel (A) shows idealized depth profiles with steady-state sediment accumulation where hydrodynamic mixing is minimal, resulting in exponential decay of (1) chlorophyll a followed by (2) excess 210Pb and (3) organic matter decomposition; Panel (B) shows typical depth profiles in a system like the Cowichan Estuary where physical mixing is strong on unvegetated mudflats (dashed blue profiles), and dampened increasingly by eelgrass (dashed red profiles) and salt marsh vegetation (solid black profiles).
Organic Carbon Stocks
Ecosystem organic carbon stocks in the Cowichan Estuary were dominated by sediment organic carbon which accounted for 87-100% of total organic carbon stocks in the different habitats. Above- and belowground macroscopic plant material was not the primary contributor to ecosystem carbon stocks in either of the vegetated habitats. The high organic carbon concentrations in the salt marsh sediments resulted in a total area-integrated carbon stock that was approximately equal to that of the upper and lower mudflats combined, despite the spatial extent of the salt marsh being only about one third that of the mudflats. A substantially higher amount of plant biomass was observed in the saltmarsh compared to the eelgrass, especially in the root material. The eelgrass had a shoot:root ratio of approximately one, whereas the salt marsh had nearly five times as much macroscopic root biomass as aboveground herbaceous plant material, consistent with other studies reporting similar high belowground compared to aboveground salt marsh biomass (Valiela et al., 1976; Valiela et al., 1978; Tripathee and Schäfer, 2014). In salt marsh sediments, root material too fine to be separated from the sediment likely contributed to the high organic matter and low bulk density in cores, relative to the other habitats (Turner et al., 2004).
Salt marsh sediment organic carbon stocks were in the middle of the range reported for similar habitats globally (Table 1), with the exception of some values reported for coastal Australian salt marshes, which were up to eight times higher than reported here (Macreadie et al., 2017b). Closer to the Cowichan Estuary, a multi-site blue carbon survey in the US Pacific Northwest yielded average salt marsh carbon stock estimates similar to ours (Kauffman et al., 2020). That study also separately sampled low marsh and high marsh areas, and reported 37% greater carbon stocks in high marsh compared with low marsh sediments. All of our saltmarsh cores from the Cowichan Estuary were collected from the lower marsh, which is predominantly populated by Lyngbye’s sedge and submerged at high tide. Extrapolations to the entire salt marsh area may not accurately represent carbon storage nearer the riparian zone where bulrush (Typha sp., Bolboschoenus maritimus), and cordgrass (Spartina patens) are more abundant.
Compared to global averages for seagrasses, eelgrass carbon stocks measured here were low. However, such comparisons should be made with caution since global data are disproportionately dominated by tropical and subtropical seagrass species such as Posidonia oceanica, which can form thick, dense mats of roots and rhizomes and sequester orders of magnitude more carbon (Mateo et al., 1997; Gacia et al., 2002; Serrano et al., 2012). Other studies of temperate Z. marina meadows have reported average sediment organic carbon concentrations, carbon stocks, and sequestration rates (Table 1 and Table 7) similar to what we observed in the Cowichan Estuary (Ruesink et al., 2010; Yang et al., 2013 and Ruesink et al., 2015). Several species-specific morphologies and habitat requirements have been proposed to explain low sediment organic carbon stocks in Z. marina meadows, including a low tolerance by the plant of sediment organic matter accumulations (Barko and Smart, 1983; Batiuk et al., 2000), sub-optimal light conditions in many temperate ecosystems, as well as seasonal Z. marina biomass patterns (Laugier et al., 1999). In a compilation of data from multiple studies worldwide, Fourqurean et al. (2012a) showed that the large majority of Z. marina are found in sediments with low organic carbon levels (average 2.5%). Whatever the underlying reason(s), our results agree with a growing literature consensus that low carbon stocks in Z. marina meadows are not anomalous but rather represent the carbon sequestration capacity of healthy Z. marina.
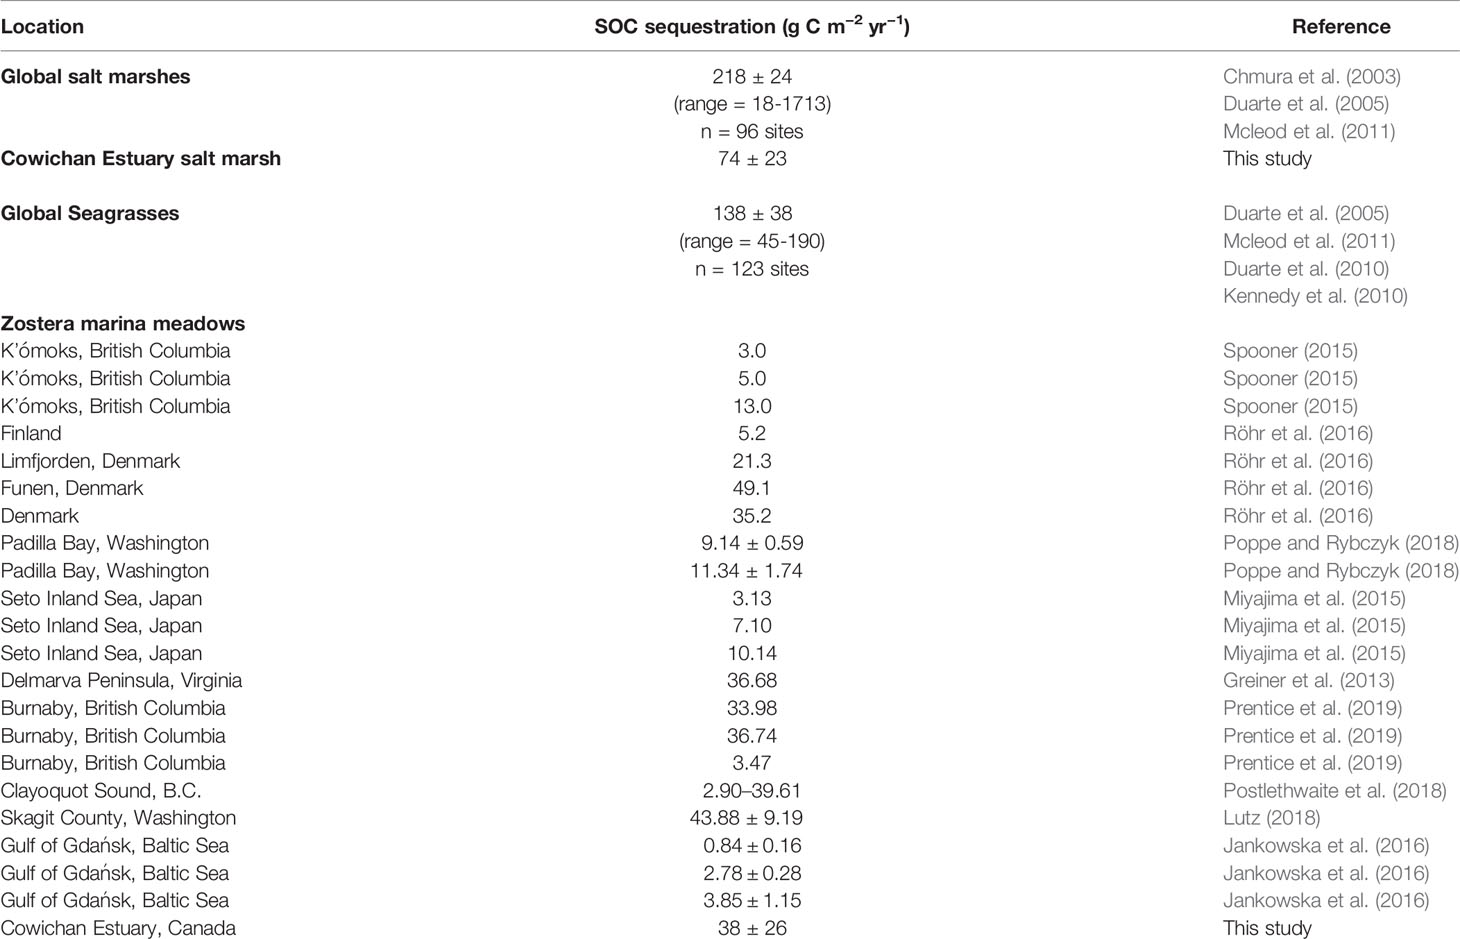
Table 7 Global sediment OC (SOC) sequestration rates reported for salt marshes and seagrasses globally, and carbon sequestration rates reported for Z. marina in the Northern Hemisphere.
Despite low carbon burial levels, high annual rates of net primary productivity (NPP) have been reported for Z. marina in nearby Puget Sound, WA (Thom, 1990). Part of this discrepancy can be explained by high rates of decomposition (Kairis and Rybczyk, 2010) and export of plant material. Since NPP in seagrass meadows is often greater than can be degraded or stored within the system, particulate and dissolved OC may be exported to adjacent coastal seawaters and sediments in a process known as “outwelling” (Odum and de la Cruz, 1967; Meziane et al., 1997; Meziane and Tsuchiya, 2000). Leaf shedding, which can be enhanced during strong hydrodynamic events (Cebrián, 2002), can cause aquatic macrophytes like Z. marina to export nutrient-rich detritus to neighbouring coastal systems (Pollard and Moriarty, 1991). In the K’ómoks Estuary on Vancouver Island, eDNA analysis revealed sloughed Z. marina material persisting along the approximately 500 m long wrack line, a fronting saltmarsh and a non-seagrass vegetated area (Hintz et al., 2016). Grazing and movement of macrobenthos such as crustaceans and snails also facilitate export of primary products, littoral particulate organic matter and biodeposits (Kharlamenko et al., 2001). Duarte and Cebrian (1996) reviewed carbon budgets for a variety of coastal habitats and estimated that seagrass ecosystems on average export 24.3% of their total NPP, with 50.3% lost to decomposition, 18.6% to herbivory, and only 15.9% stored in seagrass bed sediments.
To further investigate the effect of losses from outwelling, decomposition and herbivory on the carbon sequestration capacity of Z. marina in the Cowichan Estuary we applied a two-source mixing model (Phillips and Gregg 2003; Limén et al., 2007) to our δ13C data. The model enabled us to quantify the contribution of eelgrass tissue (shoots) to organic matter in the eelgrass sediments. The two δ13C endmembers were eelgrass shoots (-12.2‰) and organic carbon in lower mudflat sediments (-25.8‰) that was sampled outside of the eelgrass meadow (Table 4). The percentage contribution of eelgrass shoots to sediment organic carbon in the eelgrass meadow was determined by solving for x in the following equation:
Sedeg, sediment in eelgrass meadow; Sedlm, lower mudflat sediment; EGsh, eelgrass shoots. The mixing model result indicated that 23.4% of the organic carbon in the eelgrass sediment could come from eelgrass shoots, with the remaining 77% from other sources, the same sources supplying the lower mudflat sediments outside of the eelgrass meadow. Eelgrass roots had a similar δ13C signature (-12.0‰) to shoots and yielded a nearly identical result (23.2% contribution) when used in the mixing model in place of eelgrass shoots.
The non-depositional nature of the mudflat sediments may account for the observed lower carbon stocks compared with global averages. Several publications have reported sequestration capacities of intertidal mudflats to be comparable to adjacent vegetated habitats (Sanders et al., 2010; Phang et al., 2015). For example, Phang et al. (2015) reported nearly equal carbon stocks in seagrasses (138 Mg C ha-1) and mudflats (124–143 Mg C ha-1) in a Singaporean estuary. In the Cowichan Estuary, a considerable portion of organic matter that would accumulate on the mudflats under less vigorous hydrodynamic conditions, may instead be exported and deposited elsewhere, such as on the subtidal seafloor in outer Cowichan Bay, where accumulations of fine-grained sediment have been noted (Luternauer, 1984).
Carbon Sequestration Rates in Vegetated Habitats
The sediment accretion rates determined from the 210Pb profiles in cores from the vegetated habitats, together with corresponding sediment carbon density measurements, permitted the calculation of carbon accumulation rates for the seagrass meadow and the salt marsh in the Cowichan Estuary. The generally low levels of excess 210Pb in sediments of these two habitats introduce a degree of uncertainty, and differences in sedimentation rates between the salt marsh and the eelgrass meadow should be interpreted with caution.
The higher organic carbon content of the salt marsh sediments in Cowichan Estuary resulted in this habitat having a higher carbon accumulation rate (68.2 ± 21 g C m-2 yr-1) than the eelgrass (38 ± 26 g C m-2 yr-1), despite having a slightly lower sediment accretion rate and mass accumulation rates (Table 2). The salt marsh carbon accumulation rate reported here is approximately one third of the global average (Table 1). However, there is a wide range of carbon sequestration rates in salt marshes in the global data set (18 to 1713 g C m−2 yr−1), and an underrepresentation of saltmarshes within the Pacific Northwest climate zone (Kauffman et al., 2020).
The average carbon accumulation rate estimated for the eelgrass meadow (38 ± 26 g C m-2 yr-1) was below the range reported globally for all seagrass species (45 to 190 g C m-2 yr-1) but comparable to or higher than average carbon sequestration rates reported in other Z. marina meadows (Table 7). Spooner (2015) reported Z. marina carbon accumulation rates three times lower (ranging from 0 to 13 g C m-2 yr-1) in the K’ómoks Estuary on Vancouver Island, located 170 km north of the Cowichan Estuary. Similarly, carbon accumulation rates of 3.13 to 11 g C m-2 yr-1 have been found in Z. marina meadows in Japan (Miyajima et al., 2015) and Padilla Bay, Washington State (Poppe and Rybczyk, 2018). Greiner et al. (2013) measured a carbon accumulation rate of 36.68 g C m-2 yr-1 Z. marina meadow in coastal bays of the US state of Virginia which had undergone restoration.
Blue Carbon Sources in the Cowichan Estuary
Between-habitat comparisons of sediments photosynthetic pigment concentrations, C:N ratios and δ13C values provide some insights into the primary sources of organic carbon stocks for each habitat.
Beginning with the unvegetated upper and lower mudflats, we interpret the contrasting photopigment profiles between the two habitats to indicate that the upper mudflat had a more developed microphytobenthos than the lower mudflat. This is consistent with other studies that report a positive relationship between MPB biomass and emersion duration due to the increased exposure to favourable ambient conditions (i.e., light, warm temperatures, gas exchange into/out of biofilms) for MPB photosynthesis within the upper intertidal zone (van der Wal et al., 2010; Schnurr et al., 2020). In addition, in surface sediments (upper 1 cm), where microphytobenthos would be concentrated, chl a/phæopigment ratios were highest in the upper mudflat compared to all other habitats including the saltmarsh, indicating fresher OM in the upper mudflat relative to other habitats in the estuary. In contrast, the lower mudflat had the lowest total photopigment and chl a concentrations and the lowest chl a/phæopigment ratios. Microphytobenthos biomass in the Cowichan Estuary mudflats is low compared to similarly sandy estuarine sediments in the region. Ten cm depth-integrated chl a values in the Cowichan Estuary, converted from concentration per unit sediment dry weight calculations, were 377 ± 53 mg m−2 (177–539) in the upper mudflats and 207 ± 34 mg m−2 (132–310) in the lower mudflats. In contrast, Yin et al. (2016) reported 10 cm depth-integrated chl a values averaging 2,044 mg m–2 (160–4,200) and 882 mg m−2 (183–2,569) at two sandy sites in the Fraser River Estuary (across the Strait of Georgia from the Cowichan Estuary), much higher than at two muddy sites in the Fraser River Estuary, which had average chl a concentrations of 84 mg m−2 (41–174) and 235 mg m−2 (77–854).
The extremely high C:N ratios (C:N ≥ 190) of woody debris samples collected from mudflat sediments could have provided a means of identifying potential contributions of woody debris from log storage activity to sediment carbon storage in the estuary. However, there were no significant differences (Welch’s t-test, p = 0.68) in C:N ratios between the lower mudflat sediments (12.2 ± 1.1), where log boom activity was located, and sediments of the upper mudflat (11.7 ± 0.6). This observation excludes woody debris from log storage as a significant contributor to carbon storage in the estuary.
Consideration of only C:N ratios in salt marsh samples could lead to the conclusion that nitrogen-poor root material was likely responsible for the salt marsh sediments having the highest C:N ratio (20.0 ± 0.8) of all habitats. Sampled, larger pieces of macroscopic root material had a notably high C:N ratio (64.2 ± 8.84). However, a similar influence of the distinct δ13C signature of root material (-22.1 ± 1.45) was not apparent in the salt marsh sediment δ13C signature (-26.5 ± 0.1), which was indistinguishable from that of the aboveground saltmarsh vegetation (-25.6 ± 3.04). This leads us to suggest that our analysis of macroscopic root material may not have captured the stable isotope and C:N properties of the visibly abundant fine root material that was likely responsible for the high water and carbon contents of the salt marsh sediments. Compared to the other habitats, salt marsh sediment also had a δ13C signature that was the most consistent with terrestrial vascular plant material, which is generally between −25‰ and −28‰ (Burdige, 2005). As such, the Lyngbye’s sedge (Carex lyngbyei) growing on the lower salt marsh where we collected cores is a C3 plant and likely a dominant source of the refractory, terrestrially derived material found in the salt marsh sediment.
Sediments in the eelgrass meadow were nitrogen rich (C:N = 10.9 ± 1.2), in comparison to samples of eelgrass shoots and roots whose C:N ratios were respectively 16.1 ± 1.08 and 38.7 ± 0.6, consistent with reported values for Z. marina leaf biomass (C:N ratio = 19.7) and root-rhizome biomass (C:N ratio = 31.62) (Duarte, 1990; Pedersen and Borum, 1992; Fourqurean et al., 1997). The lower C:N ratio in the Cowichan Estuary eelgrass meadow sediments likely result from limited burial of Z. marina debris and a predominant input of the same nitrogen-rich, marine-derived material (microphytobenthos and phytoplankton) that accumulates in the mudflat sediments.
As discussed above, the stable isotope data indicate that eelgrass tissues make a minor but notable contribution to blue carbon storage in the eelgrass meadow. We were able to make this determination because of the enriched δ13C signature of eelgrass shoots and roots, compared with other potential carbon sources in the estuary. As a polyphyletic group of aquatic angiosperms with C3 or C3-C4 intermediate metabolisms (Touchette and Burkholder, 2000), seagrasses have much heavier isotopic signatures than terrestrial C3 plants (Peterson and Fry, 1987), ranging from -23‰ to -3‰ (Hemminga and Mateo, 1996). Z. marina in particular generally has high 13C enrichment, with δ13C values in the range of -7 to -12 ‰ in leaves and rhizomes (Kim et al., 2014; McPherson et al., 2015), which are typically heavier than values reported for marine phytoplankton (-22 ± 3 ‰) and marine macroalgae (-20 ‰ to -15 ‰), and MPB (-17 ± 4 ‰) (France, 1995). The end member isotopic signatures for Z. marina shoot and roots here were respectively -12.2 ± 0.80 ‰ and -12.0 ± 0.24 ‰. It is more likely that organic matter in the eelgrass sediment originates from a mixture of marine microalgae (phytoplankton and MPB), with a possible but less significant input of terrestrially-derived OM.
Sediment and Oyster Bed Inorganic Carbon Stocks
Particulate inorganic carbon (PIC) in the form of calcium carbonate (CaCO3) often accumulates in the sediments of blue carbon ecosystems in addition to photosynthesized particulate organic carbon (POC) (Macreadie et al., 2017c). While PIC can represent a substantial carbon stock, the precipitation CaCO3 can result in the depletion of carbonate () and reduction of total alkalinity (TA) in the water column, facilitating the return of CO2 to the atmosphere (Ware et al., 1992; Saderne et al., 2019). Specifically, the production of one mole of CaCO3 consumes two moles of TA and one mole of dissolved inorganic carbon (DIC), thereby increasing the partial pressure of carbon dioxide (pCO2) and potentially resulting in CO2 supersaturation and increased flux to the atmosphere. Because of this, there is concern that CaCO3 precipitation partially offsets the sequestration of OC in blue carbon ecosystems and the current, rapid expansion of blue carbon scientific literature and CO2 offset schemes report only organic carbon while omitting calcium carbonate cycling and sequestration (Macraedie et al., 2017b).
The relationship between carbonate precipitation results and net release of CO2 is defined as the molar ratio of CO2 flux: CaCO3 precipitation (Ψ) (Frankignoulle et al., 1994; Mazarrasa et al., 2015). Shallow-water coastal ecosystems may accumulate approximately two thirds of precipitated CaCO3 in the benthic sediments, theoretically acting as net CO2 sources with equal Ψ values for CaCO3 precipitation and dissolution. However, the strong net primary production in these coastal areas may compensate for increases in pCO2 due to calcification with the uptake of CO2 during organic matter production. The sediments of the Cowichan Estuary habitat were generally dominated by sediment OC relative to sediment IC, and had sediment OC: sediment IC ratios of 9.80 ± 0.95 in the salt marsh, 2.99 ± 0.44 and 1.78 ± 0.18 in the upper and lower mudflats, and 1.87 ± 0.11 in the eelgrass meadow. Assuming that organic carbon and calcium carbonate accumulate in the sediment in proportion to their production, these high ratios indicate primary production is more than compensating for the calcification-associated CO2 production in most of the estuary’s habitats (Mazarrasa et al., 2015). In contrast, the oyster shell bed sediments had Ψ value of 0.62 ± 0.05, suggesting that they act as a source of CO2. However, because the oyster beds account for less than 2% of the total area of the estuary, this venting of CO2 can be considered negligible. Oyster shell beds growing on similar gravel banks from sandy intertidal flats with low sediment OC have been reported as net sources of CO2, resulting from predominantly carbonate deposition, whereas shallow subtidal saltmarsh fringing reefs with organic-carbon-rich sediments functioned as net carbon sinks, on par with vegetated coastal habitats (Fodrie et al., 2017).
Blue Carbon Valuation
The growing interest in blue carbon in recent decades has been founded on the widely reported high carbon sequestration capacities of coastal ecosystems, often estimated to be orders of magnitude greater than terrestrial ecosystems per unit area (Duarte et al., 2005; Mcleod et al., 2011; Atwood et al., 2020). Seagrass meadows have been reported to have global sequestration rates up to 35 times higher than temperate and tropical forests (Orth et al., 2006; Mcleod et al., 2011). Annual per-hectare sediment OC accumulation rates in the Cowichan Estuary were below global averages for each habitat examined, and the estuary as a whole sequesters carbon at approximately 30% that of an estuary of equal size and composition with global average sequestration rates for each habitat (Table S4). Compared to B.C. forests, the Cowichan Estuary, at 363 ha in size, stores about as much carbon in the top 20 cm of sediment as a second-growth forest in B.C. approximately 1.7 times larger in area (619 ha) and accumulates carbon at a rate between 1.39 ± 0.95 and 2.50 ± 0.77 Mg C ha-1 yr−1, approximately equivalent of a 20-year-old stand forest.
Current annual sediment OC burial in the Cowichan Estuary is approximately equal to the annual GHG emission of 133 motor vehicles or 48 British Columbia residents (Table 6). The population of Cowichan Bay Village is 2,394 (City Population, 2020), meaning that the estuary can only offset the emissions produced by 2.05% of the local population per year. At the municipal level, current carbon sequestration in the Cowichan estuary offsets approximately twice the GHG emission increases from the 0.9% annual population growth of the Municipality of North Cowichan’s 29,676-person population (Statistics Canada, 2017). If the historical extents of the salt marsh and mudflat were restored and the reclaimed sawmill, farms, and causeway were made available for carbon sequestration, the resulting carbon sequestration would increase to be equivalent to the annual emissions of 186 motor vehicles and 68 residents, or 2.8% of Cowichan Bay Village, and over GHG emission increases from the annual municipal population growth. The apparently small capacity of the Cowichan Estuary to mitigate anthropogenic GHG emissions even from local sources in a small rural village cannot be solely attributed to its below-average carbon sequestration rates. Even if each habitat in the Cowichan Estuary were to sequester carbon at reported average global rates, with the entire area of mudflat sequestering at the global average rate for seagrass meadows (Table S3), the equivalent emissions of only 461 motor vehicles and 168 people, or 14.25% of the local population, would be offset. Based on the estimations outlined in this valuation, over 20,000 ha of 20-year-old stand forest or a Cowichan Estuary more than 50 times its current size (363 ha) would be required to offset the emissions of Cowichan Bay Village. As such, preserving the areal extent of the Cowichan Estuary and restoring vegetated habitat should be prioritized in order to maintain and maximize its capability to offset GHG emissions. This highlights the current unsustainable level of per-capita GHG emissions, even at the scale of the local population in Cowichan Bay Village, which far exceed the natural capacity of the estuary and other natural carbon reservoirs to trap and store greenhouse gasses.
Conclusions
The lack of a sill or any other geological feature preventing high-energy water exchange between the Cowichan Estuary and the open ocean likely results in strong hydrodynamic mixing, erosion, resuspension and/or export or deposited OM. This was reflected in the low sediment OC and scattered 210Pbex vertical profiles of the unvegetated mudflats. Like the salt marsh, the eelgrass vegetation buffers hydrodynamic forces, stabilizing deposited material enough for an exponential decrease in 210Pbex to be detected over a ~100 year period, but mixing and possible resuspension is still likely to occur on a broader timescale.
Our results point to epiphytobenthos and phytoplankton as the primary sources of organic carbon stored in the upper and lower mudflats and eelgrass sediments. This is evident in the similarly low C:N ratios, suggestive of labile cell material, and the marine stable isotope signatures in the upper and lower mudflat sediments, which are modified somewhat in the eelgrass sediments. The strong hydrodynamic and related outwelling of eelgrass material are also likely behind the modest contribution (23%) of eelgrass shoots and stems to the bulk 13C signature of eelgrass sediments. A blue carbon evaluation of the subtidal area of outer Cowichan Bay would be of great interest for future research.
We found no evidence that log storage activity decreased carbon sequestration in the lower mudflat areas where logs make frequent contact with the seafloor. Carbon stocks in the mudflats were similar to those of the eelgrass meadow, despite being lower than global averages but consistent with recently reported low carbon stocks in Z. marina meadows in the Pacific Northwest. The salt marsh was the most important carbon reservoir in the Cowichan Estuary, which is consistent with a large body of studies that report salt marshes as having the highest carbon sequestration rates of all intertidal blue carbon habitats. However, the Cowichan Estuary salt marsh has a more modest carbon sequestration capacity compared to global averages; while the Cowichan estuary salt marsh’s sequestration capacity is in the range of a 20-year-old forest stand, global average salt marsh carbon sequestration rates have been reported to exceed long-term accumulation rates in forests by many orders of magnitude (Zehetner, 2010; Mcleod et al., 2011). This point highlights the lack of temperate salt marsh representation in western North America in current global blue carbon estimates. Since approximately half of the historical salt marsh habitat in the Cowichan Estuary is currently reclaimed for agricultural and industrial use, consideration should be given to the role of the marsh system as a carbon reservoir in future land-use planning.
CO2 emissions derived from carbonate deposition in the Cowichan Estuary are unlikely to significantly offset the CO2 sink capacity associated with organic carbon burial. Sediment OC was generally three-fold higher than sediment IC. While the oyster shell beds appear to be a net source of CO2, they were very limited in overall area. Interestingly, the current area of oyster beds in the Cowichan Estuary represented a fraction of the former area, as a result of dredging of channels for moving logs from the lower intertidal zone to the sawmill.
Despite being the fourth largest estuary on Vancouver Island and the largest intertidal estuary in the Municipality of North Cowichan, the Cowichan Estuary can only offset the emissions produced by 2.05% of the local population of 2,394 in Cowichan Bay Village (City Population, 2020), highlighting the current unsustainable level of per-capita GHG emissions. Likewise, the Cowichan Estuary cannot significantly offset the emissions of the municipality’s 29,676-person population, which is growing 0.9% per year. Current carbon sequestration in the Cowichan Estuary offsets approximately twice the GHG emission increases from the annual population growth Municipality of North Cowichan, and if all habitats were restored to their natural state and sequestered carbon at current rates, the estuary could have the capacity to offset over three times the GHG emission increases from the annual population growth. As such, preserving the areal extent of the Cowichan Estuary and restoring vegetated habitat should be prioritized in order to maintain and maximize its capability to offset GHG emissions.
Data Availability Statement
The raw data supporting the conclusions of this article will be made available by the authors, without undue reservation.
Author Contributions
TD contributed to conceptualization, fieldwork designing, laboratory methodology, investigation, writing the original draft, data processing, statistical analyses, review and editing, and geospatial analysis. GS contributed to conceptualization, project administration, supervision, review and editing. SJ contributed to conceptualization, supervision, laboratory methodology, fieldwork designing, investigation, review and editing. All authors contributed to the article and approved the submitted version.
Funding
Funding for radiometric dating lab analyses was provided by the Cowichan Valley Regional District (CVRD) and the Cowichan Estuary Restoration and Conservation Association (CERCA). Funding for habitat mapping was funded by CERCA and the Fisheries and Oceans Canada (DFO). All other funding was provided by Ocean Networks Canada (ONC) and the BC Leadership Chair in Ocean Ecosystems and Global Change for their financial contributions.
Conflict of Interest
The authors declare that the research was conducted in the absence of any commercial or financial relationships that could be construed as a potential conflict of interest.
Publisher’s Note
All claims expressed in this article are solely those of the authors and do not necessarily represent those of their affiliated organizations, or those of the publisher, the editors and the reviewers. Any product that may be evaluated in this article, or claim that may be made by its manufacturer, is not guaranteed or endorsed by the publisher.
Acknowledgments
The authors thank S. Murdock, C.J. Stevens, B.D. Jameson, and V. Carnero-Bravo their technical assistance, and the Cowichan Estuary Restoration and Conservation Association for their support and collaboration. Special thanks to Grant Douglas for his assistance with the design and construction of field equipment.
Supplementary Material
The Supplementary Material for this article can be found online at: https://www.frontiersin.org/articles/10.3389/fmars.2022.857586/full#supplementary-material
References
Admiraal W. (1984). The Ecology of Estuarine Sediment-Inhabiting Diatoms. Prog. Phycol. Res. 3, 269–322. doi: 10.1017/S0025315400019603
Alongi D. M., Tirendi F., Goldrick A. (1996). OM Oxidation and Sediment Chemistry in Mixed Terrigenous-Carbonate Sands of Ningaloo Reef, Western Australia. Marine Chem. 54 (3–4), 203–219. doi: 10.1016/0304-4203(96)00037-0
Arias-Ortiz A., Masqué P., Masqué P., Masqué P., Masqué P., Garcia-Orellana J., et al. (2018). Reviews and Syntheses: 210Pb-Derived Sediment and Carbon Accumulation Rates in Vegetated Coastal Ecosystems – Setting the Record Straight. Biogeosciences 15, 6791–6818. doi: 10.5194/bg-15-6791-2018
Atwood T. B., Witt A., Mayorga J., Hammill E., Sala E. (2020). Global Patterns in Marine Sediment Carbon Stocks. Front. Marine Sci. 7 (10), 3389. doi: 10.3389/fmars.2020.00165
Barko J. W., Smart R. M. (1983). Effects of OM Additions to Sediment on the Growth of Aquatic Plants. J. Ecol. 71 (1), 161–175. doi: 10.2307/2259969
Barranguet C., Herman P. M. J., Sinke J. J. (1997). Microphytobenthos Biomass and Community Composition Studied by Pigment Biomarkers: Importance and Fate in the Carbon Cycle of a Tidal Flat. J. Sea Res. 38, 59–70. doi: 10.1016/S1385-1101(97)00032-4
Batiuk R., Bergstrom P., Kemp M., Koch E., Murray L., Stevenson C., et al. (2000). Chesapeake Bay Submerged Aquatic Vegetation Water Quality and Habitat-Based Requirements and Restoration Targets: A Second Technical Synthesis (Annapolis, MD: US. EPA).
Bell M., Kallman R. (1976). The Cowichan – Chemainus River Estuaries Status of Environmental Knowledge to 1975. Report of the Estuary Working Group Department of the Environment Regional Board Pacific Region (West Vancouver, B. C: Fisheries and Marine Service Pacific Environment Institute).
Bentley S. J., Swales A., Pyenson B., Dawe J. (2014). Sedimentation, Bioturbation, and Sedimentary Fabric Evolution on a Modern Mesotidal Mudflat; a Multi-Tracer Study of Processes, Rates, and Scales. Estuarine Coastal Shelf Sci. 141, 58–68. doi: 10.1016/j.ecss.2014.02.004
Bernal B., Mitsch W. J. (2013). Carbon Sequestration in Freshwater Wetlands in Costa Rica and Botswana. Biogeochemistry 115 (1), 77–93. doi: 10.1007/s10533-012-9819-8
Berner R. A. (1980). Early Diagenesis: A Theoretical Approach (Princeton, USA: Princeton University Press), 245 pp.
Beukema J. J., Essink K., Michaelis H., Zwarts L. (1993). Year-To-Year Variability in the Biomass of Macrobenthic Animals on Tidal Flats of the Wadden Sea: How Predictable Is This Food Source for Birds? Netherlands J. Sea Res. 31 (4), 319–330. doi: 10.1016/0077-7579(93)90051-S
Black T. A., Jassal R. S., Fredeen A. L., Canadian Electronic Library (Firm), & University of Victoria (B.C.) Pacific Institute for Climate Solutions (2008). Carbon Sequestration in British Columbia’s Forests and Management Options (Victoria, B.C: Pacific Institute for Climate Solutions, University of Victoria).
Blanchard G. F., Paterson D. M., Stal L. J., Richard P., Galois R., Huet V., et al. (2000). The Effect of Geomorphological Structures on Potential Biostabilisation by Microphytobenthos on Intertidal Mudflats. Continental Shelf Res. 20, 1243–1125. doi: 10.1016/S0278-4343(00)00021-2
Boldt K. V., Nittrouer C. A., Ogston A. S. (2013). Seasonal Transfer and Net Accumulation of Fine Sediment on a Muddy Tidal Flat: Willapa Bay, Washington. Continental Shelf Res. 60, S157–S172. doi: 10.1016/j.csr.2012.08.012
Burdige D. J. (2005). Burial of Terrestrial OM in Marine Sediments: A Reassessment. Glob. Biogeochem. 19 (4), 1–7. doi: 10.1029/2004GB002368
Business Council of British Columbia. (2019). Available at: https://bcbc.com/insights-and-opinions/per-capita-emissions-what-does-it-really-mean#_ftn5.
Cahoon L. B. (1999). The Role of Benthic Microalgae in Neritic Ecosystems. Oceanographic Marine Biol. 37, 47–86. doi: 10.1201/9781482298550-4
Cahoon L. B., Safi K. A. (2002). Distribution and Biomass of Benthic Microalgae in Manukau Harbour, New Zealand, NZ. J. Mar. Freshw. Res. 36, 257–266. doi: 10.1080/00288330.2002.9517084
Callaway J. C., Borgnis E. L., Turner R. E., Milan C. S. (2012). Carbon Sequestration and Sediment Accretion in San Francisco Bay Tidal Wetlands. Estuaries Coasts 35 (5), 1163–1181. doi: 10.1007/s12237-012-9508-9
Campbell J. E., Lacey E. A., Decker R. A., Crooks S., Fourqurean J. W. (2015). Carbon Storage in Seagrass Beds of Abu Dhabi, United Arab Emirates. Estuaries Coasts 38, 242–251. doi: 10.1007/s12237-014-9802-9
Cebrián J. (2002). Variability and Control of Carbon Consumption, Export, and Accumulation in Marine Communities. Limnol. Oceanogr. 47, 11–22. doi: 10.4319/lo.2002.47.1.0011
Chmura G. L., Anisfeld S. C., Cahoon D. R., Lynch J. C. (2003). Global Carbon Sequestration in Tidal, Saline Wetland Soils. Glob. Biogeochem. 17, 1111. doi: 10.1029/2002GB001917
City Population (2020). Available at: https://www.citypopulation.de/en/canada/britishcolumbia/_/UA1410:cowichan_bay/.
Cook P. L. M., Revill A. T., Clementson L. A., Volkman J. K. (2004). Carbon and Nitrogen Cycling on Intertidal Mudflats of a Temperate Australian Estuary: III. Sources of OM. Marine Ecology. Prog. Ser. (Halstenbek) 280, 55–72. doi: 10.3354/meps280055
Coverdale T. C., Brisson C. P., Young E. W., Yin S. F., Donnelly J. P., Bertness M. D. (2014). Indirect Human Impacts Reverse Centuries of Carbon Sequestration and Salt Marsh Accretion. PloS One 2014 (3), e93296. doi: 10.1371/journal.pone.0093296
Cowichan Estuary Task Force. (1980). Cowichan Estuary Task Force Report (Victioria, BC, Province of British Columbia: Environment and Land Use Committee Secretariat).
Cowichan Tribes. (2010). Proceedings of the Cowichan Tribes Estuary Workshop. Available at: https://cowichanwatershedboard.ca/document/doc-cowichan-tribes-estuary-workshop-may-2010-proceedings/.
Cuellar-Martinez T., Ruiz- Fernández A. C., Sanchez-Cabeza J., Pérez-Bernal L., Sandoval-Gil J. (2019). Relevance of Carbon Burial and Storage in Two Contrasting Blue Carbon Ecosystems of a North-East Pacific Coastal Lagoon. Sci. Total Environ. 675, 581–593. doi: 10.1016/j.scitotenv.2019.03.388
Dale C., Natcher D. C. (2015). What Is Old Is New Again: The Reintroduction of Indigenous Fishing Technologies in British Columbia. Local Environ. 20 (11), 1309–1321. doi: 10.1080/13549839.2014.902371
Davenne E., Masson D. (2001). Water Properties in the Straits of Georgia and Juan De Fuca (Vancouver Island, British Columbia: Institute of Ocean Sciences (IOS), Fisheries and Oceans Canada).
de Brouwer J. F. C., Bjelic S., de Deckere E. M. G. T., Stal L. J. (2000). Interplay Between Biology and Sedimentology in a Mudflat (Biezelingse Ham, Westerschelde, The Netherlands). Continental Shelf Res. 20, 1159–1177. doi: 10.1016/S0278-4343(00)00017-0
Duarte C. M. (1990). Seagrass Nutrient Content. Marine Ecol. Prog. Ser. 67, 201– 207. doi: 10.3354/meps067201
Duarte C. M., Cebrián J. (1996). The Fate of Marine Autotrophic Production. Limnol. Oceanogr. 41, 1758–1766. doi: 10.4319/lo.1996.41.8.1758
Duarte C. M., Losada I. J., Hendriks I. E., Mazarrasa I., Marbà N. (2013). The Role of Coastal Plant Communities for Climate Change Mitigation and Adaptation. Nat. Climate Change 3 (11), 961–968. doi: 10.1038/nclimate1970
Duarte C. M., Middelburg J., Caraco N. (2005). Major Role of Marine Vegetation on the Oceanic Carbon Cycle. Biogeosciences 2, 1–8. doi: 10.5194/bg-2-1-2005
Duarte C. M., Marbà N., Gacia E., Fourqurean J. W., Beggins J., Barrón C., et al. (2010). Seagrass Community Metabolism: Assessing the Carbon Sink Capacity of Seagrass Meadows. Global Biogeochem. Cycles 24 (4). doi: 10.1029/2010GB003793
Dyck J. (2000). To Take the Food From Our Mouths: The Cowichans’ Fight to Maintain Their Fishery 1894–1914. Native Stud. Rev. 13 (1), 41–70.
Fodrie F. J., Rodriguez A. B., Gittman R. K., Grabowski J. H., Lindquist N. L., Peterson C. H., et al. (2017). Oyster Reefs as Carbon Sources and Sinks. Proc. R. Society. B Biol. Sci. 284, 20170891. doi: 10.1098/rspb.2017.0891
Fourqurean J. W., Duarte C. M., Kennedy H., Marba N., Holmer M., Mateo A. M. (2012a). Seagrass Ecosystems as a Globally Significant Carbon Stock. Nat. Geosci. 5, 505–509. doi: 10.1038/ngeo1477
Fourqurean J. W., Kendrick G. A., Collins L. S., Chambers R. M., Vanderklift M. A. (2012b). Carbon, Nitrogen and Phosphorus Storage in Subtropical Seagrass Meadows: Examples From Florida Bay and Shark Bay. Marine Freshwater Res. 63, 967. doi: 10.1071/MF12101
Fourqurean J. W., Moore T. O., Fry B., Hollibaugh J. T. (1997). Spatial and Temporal Variation in C:N:P Ratios, 15N and 13C of Eelgrass Zostera Marina as Indicators of Ecosystem Processes, Tomales Bay, California, USA. Marine Ecol. Prog. Ser. 157, 147–157. doi: 10.3354/meps157147
France R. L. (1995). Carbon-13 Enrichment in Benthic Compared to Planktonic Algae: Foodweb Implications. Marine Ecol. Prog. Ser. 124, 307–312. doi: 10.3354/meps124307
Frankignoulle M., Canon C., Gattuso J. P. (1994). Marine Calcification as a Source of Carbon Dioxide: Positive Feedback of Increasing Atmospheric CO2. Limnol. Oceanogr. 39, 458–46. doi: 10.4319/lo.1994.39.2.0458
Fry B., Scalan R. S., Parkerv P. L. (1977). Stable Carbon Isotope Evidence for Two Sources of OM in Coastal Sediments: Seagrass and Plankton. Geochimica Cosmochimica Acta 41, 1875–1877. doi: 10.1016/0016-7037(77)90218-6
Gacia E., Duarte C. M., Middleburg J. J. (2002). Carbon and Nutrient Deposition in a Mediterranean Seagrass (Posidonia Oceanica) Meadow. Limnol. Oceanogr. 47, 23–32. doi: 10.4319/lo.2002.47.1.0023
Gattuso J. P., Frankignoulle M., Wollast R. (1998). Carbon and Carbonate Metabolism in Coastal Aquatic Ecosystems, Annu. Rev. Ecol. Syst. 29, 405–434. doi: 10.1146/annurev.ecolsys.29.1.405
Geraldi N. R., Ortega A., Serrano O., Macreadie P. I., Lovelock C. E., Krause-Jensen D., et al. (2019). Fingerprinting Blue Carbon: Rationale and Tools to Determine the Source of OC in Marine Depositional Environments. Front. Marine Chem. 10, 3389. doi: 10.3389/fmars.2019.00263
Government of Western Australia’s Department of Primary Industries and Regional Development. (2020). Measuring and Reporting Soil Organic Carbon. Available at: https://www.agric.wa.gov.au/soil-carbon/measuring-and-reporting-soil-organic-carbon.
Greiner J. T., McGlathery K. J., Gunnell J., McKee B. A. (2013). Seagrass Restoration Enhances “Blue Carbon” Sequestration in Coastal Waters. PloS One 8, e72469. doi: 10.1371/journal.pone.0072469
Gucluer S. M., Gross M. G. (1964). Recent Marine Sediments in Saanich Inlet, a Stagnant Marine Basin. Limnol. Oceanogr. 9 (3), 359–376. doi: 10.4319/lo.1964.9.3.0359
Hargrave B., Phillips G. (1989). Decay Times of OC in Sedimented Detritus in a Macrotidal Estuary. Marine Ecology. Prog. Ser. (Halstenbek) 56, 271–279. doi: 10.3354/meps056271
Harris R. D. (1953). Eelgrass Status in 1953. Canadian Wildlife Service (Delta, B.C.: Canadian Wildlife Service Unpublished Report), p. 3–4.
Heiri O., Lotter A. F., Lemcke G. (2001). Loss on Ignition as a Method for Estimating Organic and Carbonate Content in Sediments: Reproducibility and Comparability of Results. J. Paleolimnology 25, 101e110. doi: 10.1023/A:1008119611481
Hemminga M. A., Mateo M. A. (1996). Stable Carbon Isotopes in Seagrasses: Variability in Ratios and Use in Ecological Studies. Marine Ecol. Prog. Ser. 140, 285–298. doi: 10.3354/meps140285
Hintz W., LeBlanc J., Petrell R., Horgen P. (2016). A DNA Diagnostic Approach for Following Sea Grass: Carbon Distribution in the K’o Moks Estuary and Key New Observations. Comox Valley Project Watershed Soc. 1–17.
Hoogsteen M. J. J., Lantinga E. A., Bakker E. J., Groot J. C. J., Tittonell P. A. (2015). Estimating Soil Organic Carbon Through Loss on Ignition : Effects of Ignition Conditions and Structural Water Loss. Eur. J. Soil Sci. 66 (2), 320–328. doi: 10.1111/ejss.12224
Howard J. L., Creed J. C., Aguiar M. V. P., Fouqurean J. W. (2017). CO2 Released by Carbonate Sediment Production in Some Coastal Areas may Offset the Benefits of Seagrass ‘Blue Carbon’ Storage. Limnol. Oceanogr. 63, 160–172. doi: 10.1002/lno.10621
Howard J., Hoyt S., Isensee K., Pidgeon E., Telszewski M. (2014). Coastal Blue Carbon: Methods for Assessing Carbon Stocks and Emissions Factors in Mangroves, Tidal Salt Marshes and Seagrass Meadows Vol. 180 pp (Arlington, USA: Conservation International, Intergovernmental Oceanographic Commission of UNESCO, International Union for Conservation of Nature).
Jacobs W., Le Hir P., Van Kesteren W., Cann P. (2011). Erosion Threshold of Sand-Mud Mixtures. Continental Shelf Res. 31, S14–S25. doi: 10.1016/j.csr.2010.05.012
Jankowska E., Michel L. N., Zaborska A., Włodarska-Kowalczuk M. (2016). Sediment Carbon Sink in Low-Density Temperate Eelgrass Meadows (Baltic Sea). J. Geophys. Res. Biogeosci. 121 (12), 2918–2934. doi: 10.1002/2016JG003424
Kairis P. A., Rybczyk J. M. (2010). Sea Level Rise and Eelgrass (Zostera Marina) Production: A Spatially Explicit Relative Elevation Model for Padilla Bay, WA. Ecol. Modelling 221 (7), 1005–1016. doi: 10.1016/j.ecolmodel.2009.01.025
Kauffman J. B., Giovanonni L., Kelly J., Dunstan N., Borde A., Diefenderfer H., et al. (2020). Total Ecosystem Carbon Stocks at the Marine-Terrestrial Interface: Blue Carbon of the Pacific Northwest Coast, United States. Global Change Biol. 26 (10), 5679–5692. doi: 10.1111/gcb.15248
Kauffman J. B., Heider C., Cole T. G., Dwire K. A., Donato D. C. (2011). Ecosystem Carbon Stocks of Micronesian Mangrove Forests. Wetlands 31, 343–352. doi: 10.1007/s13157-011-0148-9
Kennedy H., Beggins J., Duarte C. M., Fourqurean J. W., Holmer M., Marbà N., et al. (2010). Seagrass Sediments as a Global Carbon Sink: Isotopic Constraints. Glob. Biogeochem. 24 (4). doi: 10.1029/2010GB003848
Kharlamenko V. I., Kiyashko S. I., Imbs A. B., Vyshkvartzev D. I. (2001). Identification of Food Sources of Invertebrates From the Seagrass Zostera Marina Community Using Carbon and Sulfur Stable Isotope Ratio and Fatty Acid Analyses. Marine Ecology. Prog. Ser. (Halstenbek) 220, 103–117. doi: 10.3354/meps220103
Kim M., Lee S., Kim H., Lee S., Yoon S., Shin K. (2014). Carbon Stable Isotope Ratios of New Leaves of Zostera Marina in the Mid-Latitude Region: Implications of Seasonal Variation in Productivity. J. Exp. Marine Biol. Ecol. 461, 286–296. doi: 10.1016/j.jembe.2014.08.015
Lambertsen G. K., British Columbia Ministry of Environment and Parks Planning and Assessment Branch (1986). Cowichan Estuary Environmental Management Plan (Victoria, B.C: Ministry of Environment and Parks, Planning and Assessment Branch).
Laugier T., Rigollet V., de Casabianca M. (1999). Seasonal Dynamics in Mixed Eelgrass Beds, Zostera Marina L. And Z. Noltii Hornem., in a Mediterranean Coastal Lagoon (Thau Lagoon, France). Aquat. Bot. 63 (1), 51–69. doi: 10.1016/S0304-3770(98)00105-3
Leschen A. S., Ford K. H., Evans N. T. (2010). Successful Eelgrass (Zostera Marina) Restoration in a Formerly Eutrophic Estuary (Boston Harbor) Supports the Use of a Multifaceted Watershed Approach to Mitigating Eelgrass Loss. Estuaries Coasts 33 (6), 1340–1354. doi: 10.1007/s12237-010-9272-7
Limén H., Levesque C., Kim Juniper S. (2007). POM in Macro-/Meiofaunal Food Webs Associated With Three Flow Regimes at Deep-Sea Hydrothermal Vents on Axial Volcano, Juan De Fuca Ridge. Marine Biol. 153 (2), 129–139. doi: 10.1007/s00227-007-0790-1
Luternauer J. L. (1984). Skeena, Nanaimo and Cowichan River Deltas and Offshore Environs, British Columbia: Surficial Sediment Distribution and Locations of Other Available Data Types Collected by the Geological Survey of Canada (Ottawa, ON: Geological Survey of Canada). Open File 1112.
Lutz M. D. (2018). A Search for Blue Carbon in Central Salish Sea Eelgrass Meadows (Bellingham, WA: M.S. Thesis, Western Washington University).
Macreadie P. I., Nielsen D. A., Kelleway J. J., Atwood T. B., Seymour J. R., Petrou K., et al. (2017a). Can We Manage Coastal Ecosystems to Sequester More Blue Carbon? Front. Ecol. Environ. 15 (4), 206–213. doi: 10.1002/fee.1484
Macreadie P. I., Ollivier Q. R., Kelleway J. J., Serrano O., Carnell P. E., Lewis C. J. E., et al. (2017b). Carbon Sequestration by Australian Tidal Marshes. Sci. Rep. 7, 44071. doi: 10.1038/srep44071
Macreadie P. I., Serrano O., Maher D. T., Duarte C. M., Beardall J. (2017c). Addressing Calcium Carbonate Cycling in Blue Carbon Accounting: Addressing CaCO3 Cycling in Blue CO2 Accounting. Limnol. Oceanogr. Lett. 2 (6), 195–201. doi: 10.1002/lol2.10052
Marbà N., Arias-Ortiz A., Masqué P., Kendrick G. A., Mazarrasa I., Bastyan G. R., et al. (2015). Impact of Seagrass Loss and Subsequent Revegetation on Carbon Sequestration and Stocks. J. Ecol. 103, 296–302. doi: 10.1111/1365-2745.12370
Mateo M. A., Romero J., Pérez M., Littler M. M., Littler D. S. (1997). Dynamics of Millenary Organic Deposits Resulting From the Growth of the Mediter- Ranean Seagrass Posidonia Oceanica. Estuarine. Coastal Shelf Sci. 44, 103–110. doi: 10.1006/ecss.1996.0116
Mazarrasa I., Marbà N., Lovelock C. E., Serrano O., Lavery P. S., Fourqurean J. W. (2015). Seagrass Meadows as a Globally Significant Carbonate Reservoir. Biogeosciences 12, 4993–5003. doi: 10.5194/bg-12-4993-2015
McKew B. A., Dumbrell A. J., Taylor J. D., McGenity T. J., Graham J. C. (2013). Underwood Differences Between Aerobic and Anaerobic Degradation of Microphytobenthic Biofilm-Derived OM Within Intertidal Sediments. FEMS Microbiol. Ecol. 84, 495–509. doi: 10.1111/1574-6941.12077
Mcleod E., Chmura G., Bouillon S., Salm R., Björk M., Duarte C. M., et al. (2011). A Blueprint for Blue Carbon: Toward an Improved Understanding of the Role of Vegetated Coastal Habitats in Sequestering CO2. Front. Ecol. Enviro. 9 (10), 552–560. doi: 10.1890/110004
McPherson M. L., Zimmerman R. C., Hill V. J. (2015). Predicting Carbon Isotope Discrimination in Eelgrass (Zostera Marina L.) From the Environmental Parameters—Light, Flow, and [DIC]. Limnol. Oceanogr. 60 (6), 1875–1889. doi: 10.1002/lno.10142
Meziane T., Bodineau L., Retiere C., Thoumelin G. (1997). The Use of Lipid Markers to Define Sources of OM in Sediment and Food Web of the Intertidal Salt-Marsh-Flat Ecosystem of Mont-Saint-Michel Bay, France. J. Sea Res. 38, 47–58. doi: 10.1016/S1385-1101(97)00035-X
Meziane T., Tsuchiya M. (2000). Fatty Acids as Tracers of OM in the Sediment and Food Web of a Mangrove/Inter- Tidal Flat Ecosystem, Okinawa, Japan. Mar. Ecol. Prog. Ser. 200, 49–57. doi: 10.3354/meps200049
Miyajima T., Hori M., Hamaguchi M., Shimabukuro H., Adachi H., Yamano H., et al. (2015). Geographic Variability in OC Stock and Accumulation Rate in Sediments of East and Southeast Asian Seagrass Meadows. Glob. Biogeochem. 29, 397–415. doi: 10.1002/2014GB004979
Nayak G. N., Volvoikar S. P., Hoskatta T. (2018). Changing Depositional Environment and Factors Controlling the Growth of Mudflat in a Tropical Estuary, West Coast of India. Environ. Earth Sci. 77, 741. doi: 10.1007/s12665-018-7923-3
Nellemann C., Corcoran E., Duarte C. M., Valdés L., De Young C., Fonseca L., et al. (2009). Blue Carbon: A Rapid Response Assessment (Birkeland Trykkeri AS, Birkeland: United Nations Environmental Programme, GRID-Arendal).
O’Donnell B. (1988). Indian and Non-Native Use of the Cowichan and Koksilah Rivers: An Historical Perspective. Fisheries Oceans Canada Native Affairs Division Policy Program Plann. 8, 40–84.
Odum E. P., de la Cruz A. A. (1967). Particulate Organic Detritus in a Georgia Salt Marsh Estuarine Ecosystem. Ed. Lauff M. (Washington, DC: Estuaries. Am. Assoc. Adv. Sci. Publ), 383–388.
Orth R. J., Carruthers T. J. B., Dennison W. C., Duarte C. M., Fourqurean J. W., Heck K. L. (2006). A Global Crisis for Seagrass Ecosystems. Bioscience 56, 987–996. doi: 10.1641/0006-3568(2006)56[987:AGCFSE]2.0.CO;2
Ouyang X., Lee S. Y. (2014). Updated Estimates of Carbon Accumulation Rates in Coastal Marsh Sediments. Biogeosciences 11, 5057–5071. doi: 10.5194/bg-11-5057-2014
Pedersen M. F., Borum J. (1992). Nitrogen Dynamics of Eelgrass Zostera Marina During a Late Summer Period of High Growth and Low Nutrient Availability. Marine Ecol. Prog. Ser. 80, 65–73. doi: 10.3354/meps080065
Peterson B. J., Fry B. (1987). Stable Isotopes in Ecosystem Studies. Annu. Rev. Ecol. Systematics 18, 293–320. doi: 10.1146/annurev.es.18.110187.001453
Phang V. X. H., Chou L. M., Friess D. A. (2015). Ecosystem Carbon Stocks Across a Tropical Intertidal Habitat Mosaic of Mangrove Forest, Seagrass Meadow, Mudflat and Sandbar. Earth Surf Process Land 40, 387–1400. doi: 10.1002/esp.3745
Phillips D. L., Gregg J. W. (2003). Source Partitioning Using Stable Isotopes: Coping With Too Many Sources. Oecologia 136 (2), 261–269. doi: 10.1007/s00442-003-1218-3
Pniewski F., Sylwestrzak Z. (2018). Influence of Short Periods of Increased Water Temperature on Species Composition and Photosynthetic Activity in the Baltic Periphyton Communities. Biológia 73 (11), 1067–1072. doi: 10.2478/s11756-018-0122-6
Pollard P. C., Moriarty D. J. W. (1991). OC Decomposition, Primary and Bacterial Productivity, and Sulphate Reduction, in Tropical Seagrass Beds of the Gulf of Carpentaria, Australia. Mar Ecol. Prog. Ser. 69, 149–159. doi: 10.3354/meps069149
Poppe K. L., Rybczyk J. M. (2018). Carbon Sequestration in a Pacific Northwest Eelgrass (Zostera Marina) Meadow. Northwest Sci. 92 (2), 80–91. doi: 10.3955/046.092.0202
Postlethwaite V. R., McGowan A. E., Kohfeld K. E., Robinson C. L. K., Pellatt M. G. (2018). Low Blue Carbon Storage in Eelgrass (Zostera Marina) Meadows on the Pacific Coast of Canada. PloS One 13 (6), e0198348–e0198348. doi: 10.1371/journal.pone.0198348
Pratt D. R., Lohrer A. M., Thrush S. F., Hewitt J. E., Townsend M., Cartner K., et al. (2015). Detecting Subtle Shifts in Ecosystem Functioning in a Dynamic Estuarine Environment. PloS One 10, e0133914. doi: 10.1371/journal.pone.0133914
Prentice C., Hessing-Lewis M., Sanders-Smith R., Salomon A. K. (2019). Reduced Water Motion Enhances OC Stocks in Temperate Eelgrass Meadows. Limnol. Oceanogr. 64 (6), 2389–2404. doi: 10.1002/lno.11191
Prentice C., Poppe K. L., Lutz M., Murray E., Stephens T. A., Spooner A., et al. (2020). A Synthesis of Blue Carbon Stocks, Sources, and Accumulation Rates in Eelgrass (Zostera Marina) Meadows in the Northeast Pacific. Glob. Biogeochem. 34 (2), e2019GB006345. doi: 10.1029/2019GB006345
Redfield A.C., Ketchum B.A., Richards F.A. (1963). "The Influence of Organisms on the Composition of Sea-Water," in The Sea (Vol 2). Ed. Hill M. N. (Wiley). pp. 26–77. Available at: https://www.vliz.be/en/imis?module=ref&refid=28944&printversion=1&dropIMIStitle=1.
Rogers K., Macreadie P. I., Kelleway J. J., Saintilan N. (2019). Blue Carbon in Coastal Landscapes: A Spatial Framework for Assessment of Stocks and Additionality. Sustainability Sci. 14, 453–467. doi: 10.1007/s11625-018-0575-0
Röhr E., Boström C., Canal-Vergés P., Holme M. (2016). Blue Carbon Stocks in Baltic Sea Eelgrass (Zostera Marina) Meadows. Biogeosciences 13, 6139–6153. doi: 10.5194/bg-13-6139-2016
Röhr M. E., Holmer M., Baum J. K., Bjork M., Boyer K., Chin D., et al. (2018). Blue carbon storage capacity of temperate eelgrass (zostera marina) meadows. Glob. Biogeochem. 32 (10), 1457–1475. doi: 10.1029/2018GB005941
Ruesink J. L., Hong J. S., Wisehart L., Hacker S. D., Dumbauld B. R., Hessing-Lewis M., et al. (2010). Congener Comparison of Native (Zostera Marina) and Introduced (Z. Japonica) Eelgrass at Multiple Scales Within a Pacific Northwest Estuary. Biol. Invasions 12, 1773–1789. doi: 10.1007/s10530-009-9588-z
Ruesink J. L., Yang S., Trimble A. C. (2015). Variability in Carbon Availability and Eelgrass (Zostera Marina) Biometrics Along an Estuarine Gradient in Willapa Bay, WA, USA. Estuaries Coasts 38, 1908–1917. doi: 10.1007/s12237-014-9933-z
Ruiz-Fernández A. C., Carnero-Bravo V., Sanchez-Cabeza J. A., Pérez-Bernal L. H., Amaya-Monterrosa O. A., Bojórquez-Sánchez S., et al. (2018). Carbon Burial and Storage in Tropical Salt Marshes Under the Influence of Sea Level Rise. Sci. Total Environ. 630, 1628–1640. doi: 10.1016/j.scitotenv.2018.02.246
Saderne V., Geraldi N. R., Macreadie P. I., Maher D. T., Middelburg J. J., Serrano O., et al. (2019). Role of Carbonate Burial in Blue Carbon Budgets. Nat. Commun. 10 (1), 1106–1106. doi: 10.1038/s41467-019-08842-6
Sanders C. J., Smoak J. M., Naidu A. S., Sanders L. M., Patchineelam S. R. (2010). OC Burial in a Mangrove Forest, Margin and Intertidal Mud Flat. Estuarine Coastal Shelf Sci. 90, 168–172. doi: 10.1016/j.ecss.2010.08.013
Sasmito S. D., Kuzyakov Y., Lubis A. A., Murdiyarso D., Hutley L. B., Bachri S., et al. (2020). OC Burial and Sources in Soils of Coastal Mudflat and Mangrove Ecosystems. Catena (Giessen) 187, 104414. doi: 10.1016/j.catena.2019.104414
Schnurr P. J., Drever M. C., Elner R. W., Harper J., Arts M. T. (2020). Peak Abundance of Fatty Acids From Intertidal Biofilm in Relation to the Breeding Migration of Shorebirds. Front. Marine Sci. 7, 63. doi: 10.3389/fmars.2020.00063
Schuerholz G. (2006). Background to Cowichan Estuary (Duncan BC, Canada: Cowichan Estuary Restoration and Conservation Association (CERCA). Available at: http://www.cowichanestuary.com/background-to-cowichan-estuary/.
Schuerholz G. (2017). Cowichan Estuary Habitat Map (Duncan BC, Canada: Cowichan Estuary Restoration and Conservation Association (CERCA). Available at: https://www.cowichanestuary.com/projects-2.
Schuerholz G. (2018). Final Report on CERCA’s Cowichan Estuary Oyster Research (Duncan BC, Canada: Cowichan Estuary Restoration and Conservation Association (CERCA). Available at: https://www.cowichanestuary.com/final-report-on-cercas-cowichan-estuary-oyster-research.
Serrano O., Mateo M. A., Renom P., Julià R. (2012). Characterization of Soils Beneath a Posidonia Oceanica Meadow. Geoderma 185, 26–36. doi: 10.1016/j.geoderma.2012.03.020
Sharma S., MacKenzie R. A., Tieng T., Soben K., Tulyasuwan N., Resanond A., et al. (2020). The Impacts of Degradation, Deforestation and Restoration on Mangrove Ecosystem Carbon Stocks Across Cambodia. Sci. Total Environ. 706, 135416. doi: 10.1016/j.scitotenv.2019.135416
Spooner A. M. (2015). Blue Carbon Sequestration Potential in Zostera Marina Eelgrass Beds of the K’ómoks Estuary, British Columbia (Victoria, BC: M.S. Thesis, Royal Roads University).
Statistics Canada. (2017). Cowichan Valley G, RDA [Census subdivision], British Columbia and British Columbia [Province] (table). Census Profile. 2016 Census. Statistics Canada Catalogue no. 98-316-X2016001. Ottawa. Released November 29, 2017. Available at: https://www12.statcan.gc.ca/census-recensement/2016/dp-pd/prof/index.cfm?Lang=E (accessed April 9, 2022).
Thom R. M. (1990). Spatial and Temporal Patterns in Plant Standing Stock and Primary Production in a Temperate Seagrass System. Botanica Marina 33, 497–510. doi: 10.1515/botm.1990.33.6.497
Touchette B. W., Burkholder J. M. (2000). Overview of the Physiological Ecology of Carbon Metabolism in Seagrasses. J. Exp. Mar. Bio. Ecol. 250 (1), 169–205. doi: 10.1016/S0022-0981(00)00196-9
Touchette B. W., Burkholder J. M., Glasgow H. B. (2003). Variations in Eelgrass (Zostera Marina L.) Morphology and Internal Nutrient Composition as Influenced by Increased Temperature and Water Column Nitrate. Estuaries 26 (1), 142–155. doi: 10.1007/BF02691701
Tripathee R., Schäfer K. V. R. (2014). Above- and Belowground Biomass Allocation in Four Dominant Salt Marsh Species of the Eastern United States. Wetlands (Wilmington N.C.) 35 (1), 21–30. doi: 10.1007/s13157-014-0589-z
Turner R. E., Swenson E. M., Milan C. S., Lee J. M., Oswald T. A. (2004). Below-Ground Biomass in Healthy and Impaired Salt Marshes: Salt Marsh Resilience Below-Ground. Ecol. Res. 19 (1), 29–35. doi: 10.1111/j.1440-1703.2003.00610.x
Underwood G. J. C., Kromkamp J. (1999). Primary Production by Phytoplankton and Microphytobenthos in Estuaries. Adv. Ecol. Res. 29, 93–153. doi: 10.1016/S0065-2504(08)60192-0
Valiela I., Teal J. M., Deuser W. G. (1978). The Nature of Growth Forms in the Salt Marsh Grass Spartina Alterniflora. Am. Nat. 112 (985), 461–470. doi: 10.1086/283290
Valiela I., Teal J. M., Persson N. Y. (1976). Production and Dynamics of Experimentally Enriched Salt Marsh Vegetation: Belowground Biomass. Limnol. Oceanogr. 21 (2), 245–252. doi: 10.4319/lo.1976.21.2.0245
Van de Broek M., Vandendriessche C., Poppelmonde D., Merckx R., Temmerman S., Govers G. (2018). Long-Term OC Sequestration in Tidal Marsh Sediments Is Dominated by Old-Aged Allochthonous Inputs in a Macrotidal Estuary. Global Change Biol. 24 (6), 2498–2512. doi: 10.1111/gcb.14089
van der Wal D., Wielemaker-van den Dool A., Herman P. M. J. (2010). Spatial Synchrony in Intertidal Benthic Algal Biomass in Temperate Coastal and Estuarine Ecosystems. Ecosystems (New York) 13 (2), 338–351. doi: 10.1007/s10021-010-9322-9
Van Duyl F. C., de Winder B., Kop A. C., Wollenzien U. (1999). Tidal Coupling Between Carbohydrate Concentrations and Bacterial Activities in Diatom-Inhabited Intertidal Mudflats. Mar Ecol. Prog. Ser. 191, 19–32. doi: 10.3354/meps191019
Vaughn D. R., Bianchi T. S., Shields M. R., Kenney W. F., Osborne T. Z. (2020). Increased OC Burial in Northern Florida Mangrove-Salt Marsh Transition Zones. Glob. Biogeochem. 34 (5), e2019GB006334. doi: 10.1029/2019GB006334
Ware J. R., Smith S. V., Reaka-kudla M. L. (1992). Coral Reefs: Sources or Sinks of Atmospheric CO2? Coral Reefs 11, 127–130. doi: 10.1007/BF00255465
Winterwerp J. C., Van Kesteren W. G. (2004). Introduction to the Physics of Cohesive Sediment Dynamics in the Marine Environment Vol. 56 (San Diego, CA: Elsevier).
Yang S., Wheat E. E., Horwith M. J., Ruesink J. L. (2013). Relative Impacts of Natural Stressors on Life History Traits Underlying Resilience of Intertidal Eelgrass (Zostera Marina L.). Estuaries Coasts 36, 1006–1013. doi: 10.1007/s12237-013-9609-0
Ye S., Laws E. A., Yuknis N., Ding X., Yuan H., Zhao G., et al. (2015). Carbon Sequestration and Soil Accretion in Coastal Wetland Communities of the Yellow River Delta and Liaohe Delta, China. Estuaries Coasts 38 (6), 1885–1897. doi: 10.1007/s12237-014-9927-x
Yin K., Zetsche E., Harrison P. J. (2016). Effects of Sandy vs Muddy Sediments on the Vertical Distribution of Microphytobenthos in Intertidal Flats of the Fraser River Estuary, Canada. Environ. Sci. Pollution Res. 23, 14196–14209. doi: 10.1007/s11356-016-6571-y
Ysebaert T. (2000). Macrozoobenthos and Waterbirds in the Estuarine Environment: Spatio-Temporal Patterns at Different Scales. PhD thesis (Antwerp: University of Antwerp), 180 p.
Zehetner F. (2010). Does OC Sequestration in Volcanic Soils Offset Volcanic CO2 Emissions? Quat. Sci. Rev. 29, e1313–e1316. doi: 10.1016/j.quascirev.2010.03.003
Keywords: Blue carbon, carbon sequestration, mudflat, sediment organic carbon, salt marsh, Zostera mariana (eelgrass), temperate estuarine ecosystem, seagrass
Citation: Douglas TJ, Schuerholz G and Juniper SK (2022) Blue Carbon Storage in a Northern Temperate Estuary Subject to Habitat Loss and Chronic Habitat Disturbance: Cowichan Estuary, British Columbia, Canada. Front. Mar. Sci. 9:857586. doi: 10.3389/fmars.2022.857586
Received: 18 January 2022; Accepted: 28 March 2022;
Published: 27 April 2022.
Edited by:
Catherine Lovelock, The University of Queensland, AustraliaReviewed by:
Joanna Carey, Babson College, United StatesSavanna Barry, University of Florida, United States
Copyright © 2022 Douglas, Schuerholz and Juniper. This is an open-access article distributed under the terms of the Creative Commons Attribution License (CC BY). The use, distribution or reproduction in other forums is permitted, provided the original author(s) and the copyright owner(s) are credited and that the original publication in this journal is cited, in accordance with accepted academic practice. No use, distribution or reproduction is permitted which does not comply with these terms.
*Correspondence: Tristan J. Douglas, dHJpc3RhbmpvaG5kb3VnbGFzQGdtYWlsLmNvbQ==