 Cong Wang
 Jingtian Wang
 Ling Li1,3
 Senjie Lin
- 1State Key Laboratory of Marine Environmental Science, Xiamen University, Xiamen, China
- 2College of the Environment and Ecology, Xiamen University, Xiamen, China
- 3College of Ocean and Earth Sciences, Xiamen University, Xiamen, China
- 4Department of Marine Sciences, University of Connecticut, Groton, CT, United States
Global warming is expected to cause decreases in nutrient availability, photosynthesis, and potentially carbon export in the ocean. But how, and by what molecular mechanisms, nutrient limitation affects biological pump (BP) efficiency of phytoplankton are poorly understood. Here, using transcriptomics, miRNAomics, and physiological measurements, we report that phosphorus (P)-limitation increased cellular carbon and calcium contents and sinking rate of the cosmopolitan phytoplankton Emiliania huxleyi. Under P-limitation, when photosynthesis was depressed, there were substantial increases in cellular organic (3.4-fold) and inorganic (fivefold) carbon contents due to cell division arrest and, as our transcriptomic data suggest, CO2 incorporation into C4 compounds. Furthermore, calcification was increased by 46% through transcriptional and epigenetic regulations. An increase in sinking rate by 37-44% was detected. Although calcification releases equivalent amounts of CO2, the considerable increase in cellular carbon content and sinking rate far outweighed the CO2 release, leading to an elevated efficiency of carbon export by E. huxleyi, which would partially offset the decrease in BP capacity resulting from lower growth rate under P deficiency. However, how the observed sinking rate and its increase under P limitation on the laboratory cultures will translate into BP efficiency still requires further examination using in situ or mesocosm experiments.
Introduction
Phytoplankton contribute about 50% of global primary production (Field et al., 1998) while absorbing CO2 and producing organic carbon. Up to 20% of the produced particulate organic carbon (POC) sinks to and is sequestered in the deep sea (Omand et al., 2020), driving the drawdown of atmospheric CO2 into the ocean, a process termed biological pump (BP). This process serves to mitigate the increase in atmospheric CO2 due to anthropogenic emission and prevent accelerated global warming (Schlesinger and Bernhardt, 2013). Coccolithophores, a nearly ubiquitous group of phytoplankton producing shells of calcium carbonate (coccolith), are some of the dominant contributors to the carbonate pump. As an abundant marine calcifying phytoplankton in the world’s oceans (Taylor et al., 2017), coccolithophores contribute about 1–10% to marine primary production (Poulton et al., 2007) and about 50% to pelagic CaCO3 deposition in marine sediments (Broecker and Clark, 2009), therefore playing a vital role in biogeochemical cycles of carbon by absorbing CO2 from the atmosphere through photosynthesis and conveying fixed carbon to the interior or floor of the ocean due to the ballasting effect of the coccoliths (Vanderwal et al., 1995). In this process, both POC within the cells and particulate inorganic carbon (PIC) in the coccoliths are exported via BP and carbonate pump in combination (Rost and Riebesell, 2004), which exerts a major influence on global carbon cycle and the Earth’s climate (Westbroek et al., 1993).
BP capacity is determined by the amount of carbon exported whereas BP efficiency is percentage of fixed carbon that is exported, expressed by the amount of carbon exported from the surface divided by the total carbon produced through photosynthesis (Ducklow et al., 2001). These are mainly determined by phytoplankton POC production and sinking rate (Kim et al., 2011). Community POC production is in general positively correlated with nutrient abundance (Mustaffa et al., 2020), the main limiting factor, apart from light and temperature, for the growth of phytoplankton (Marinov et al., 2010). Even though calcification is controlled by many environmental factors, including temperature, nutrient concentrations, light, and carbonate chemistry (Raven and Crawfurd, 2012; Bach et al., 2015), it is positively correlated with photosynthesis (Poulton et al., 2007), suggesting potential nutrient effects on BP capacity and efficiency in the coccolithophore. However, global warming will result in intensified surface water stratification, thereby decreasing nutrient concentrations in the upper ocean (Sarmiento et al., 2004) where coccolithophores reside, and this would exert influence on the CO2 fixation and hence BP efficiency as well as capacity (Sarmiento and Toggweiler, 1984).
Phosphate (dissolved inorganic phosphorus, DIP) is one of the major nutrients that support phytoplankton growth, and it influences phytoplankton abundance and diversity (Björkman and Karl, 2003; Moore et al., 2005; Zubkov et al., 2007). Phosphate is commonly considered as the ultimate limiting nutrient with the longest ocean residence time among the major biologically limiting nutrients (Tyrrell, 1999). As N deficiency may be mitigated by N fixation, there is no equivalent source of phosphate. The intensified surface ocean stratification reduces upwelled supply of phosphate under climate warming and limits marine productivity and carbon export (Bopp et al., 2013). Phytoplankton evolved several strategies to cope with P limitation, from molecular processes to species-specific and community responses (Ivančić et al., 2016; Lin et al., 2016). Cells can reduce cellular P demand. Cyanobacteria and some eukaryotic phytoplankton have the ability to use sulfo- or nitrogen-lipids to substitute phospholipids in response to P scarcity (Van Mooy et al., 2009; Dyhrman et al., 2012; Shemi et al., 2016).
Furthermore, substantially higher lipid production in oligotrophic conditions was observed (Novak et al., 2019). Considering lipids are carbon rich molecules, the lipid remodeling caused by P limitation would influence the carbon allocation and this would be reflected in the modification of the carbon pump, as lipids have lower decay constant than carbohydrates and proteins (Benner and Amon, 2015; Novak et al., 2019). In addition, P limitation is known to increase cellular carbon content in phytoplankton (Paasche, 1998; Li et al., 2016). Another mode of response to P limitation is to enhance the efficiency of phosphate uptake. This can be achieved either by raising the expression of high-affinity phosphate transporters (Riegman et al., 2000) or by enriching phosphate transporters under P deficiency (Wurch et al., 2014).
The third mode of response to P limitation is to utilize dissolved organic phosphorus such as phosphoesters and phosphonates. A wide range of phytoplankton showed the ability to hydrolyze phosphoesters to obtain phosphate via the action of alkaline phosphatase (Nicholson et al., 2006; Ivančić et al., 2016), while cyanobacteria and only some eukaryotic phytoplankton could use phosphonates as the sole P source under P limitation (Dyhrman et al., 2006; Wang et al., 2016). Finally, phytoplankton can also perform phagotrophy to acquire P and other nutrients. Many species of phytoplankton are capable of phagotrophy, which is induced by low nutrient stress or nutrient limitation (Lin et al., 2016).
The cosmopolitan coccolithophorid species E. huxleyi accounts for 20%-50% of the coccolithophores in most waters (Mohan et al., 2008), and can form massive blooms visible to satellites from space (Brown and Yoder, 1994). This species thrives in oligotrophic open oceans, especially in P-stressed waters (Rost and Riebesell, 2004), and P nutrient limitation was reported to cause an elevated PIC/POC ratio (Raven and Crawfurd, 2012), suggesting an increased calcification relative to photosynthesis. However, sea surface nutrient supplied from the deep ocean will likely decrease in the future ocean due to the intensified stratification resulting from the climate-driven ocean warming (Boyd et al., 2008), hence the primary productivity and calcification, and consequently carbon export, are predicted to decline. In addition, one study reported that in the nutrient-depleted subtropical gyres, C/P ratios of the exported organic matter were high, although organic matter export was relatively low, leading the authors to suggest that the future expansion of nutrient-depleted ocean could result in a shift to more efficient carbon export, which can compensate for the expected decline in productivity (Teng et al., 2014). Such a proposition has yet to be examined experimentally for major contributors of carbon export such as E. huxleyi (Holligan et al., 1983; Laber et al., 2018). Besides, what molecular mechanisms are responsible for such effects also remains to be investigated. This study was aimed to address the gap of knowledge using E. huxleyi as the model and P limitation as the nutrient deficient condition employing an integrative molecular coupled with physiological approach.
Materials and Methods
Experimental Setup
Emiliania huxleyi PMLB92/11 was grown at 20°C on a 14 h:10 h light:dark cycle (80 μE·m-2·s-1). Batch cultures with L1 (with 36-μM phosphate as P source) or L1-P (without P source, hereafter referred to as P-) medium without Si based on artificial seawater (Wang et al., 2020) were setup, and L1 was used as the control while P- referred to the P-limited treatments. Each treatment was set up in triplicate. P- cultures were set up by diluting the stock L1 culture using the P free version of the L1 medium to yield phosphate concentration less than 1 μM. The initial cell concentration was set at 5×10⁴ cells/mL for both groups.
Measurements of Physiological Parameters
The cell concentration in each culture was monitored daily as previously reported (Wang et al., 2016) during the 8-day experimental period (Figure 1A). A 1-mL sample was removed from each culture and fixed using Lugol’s iodine solution (10 g potassium iodide and 5 g iodine in 100 mL distilled water) and dispensed to the Sedgewick-Rafter counting chamber (Phycotech, St. Joseph, MI). Cell count was conducted under the microscope after 20-min sedimentation. Exponential growth rates were calculated by linear regression of log-transformed cell concentrations over time.
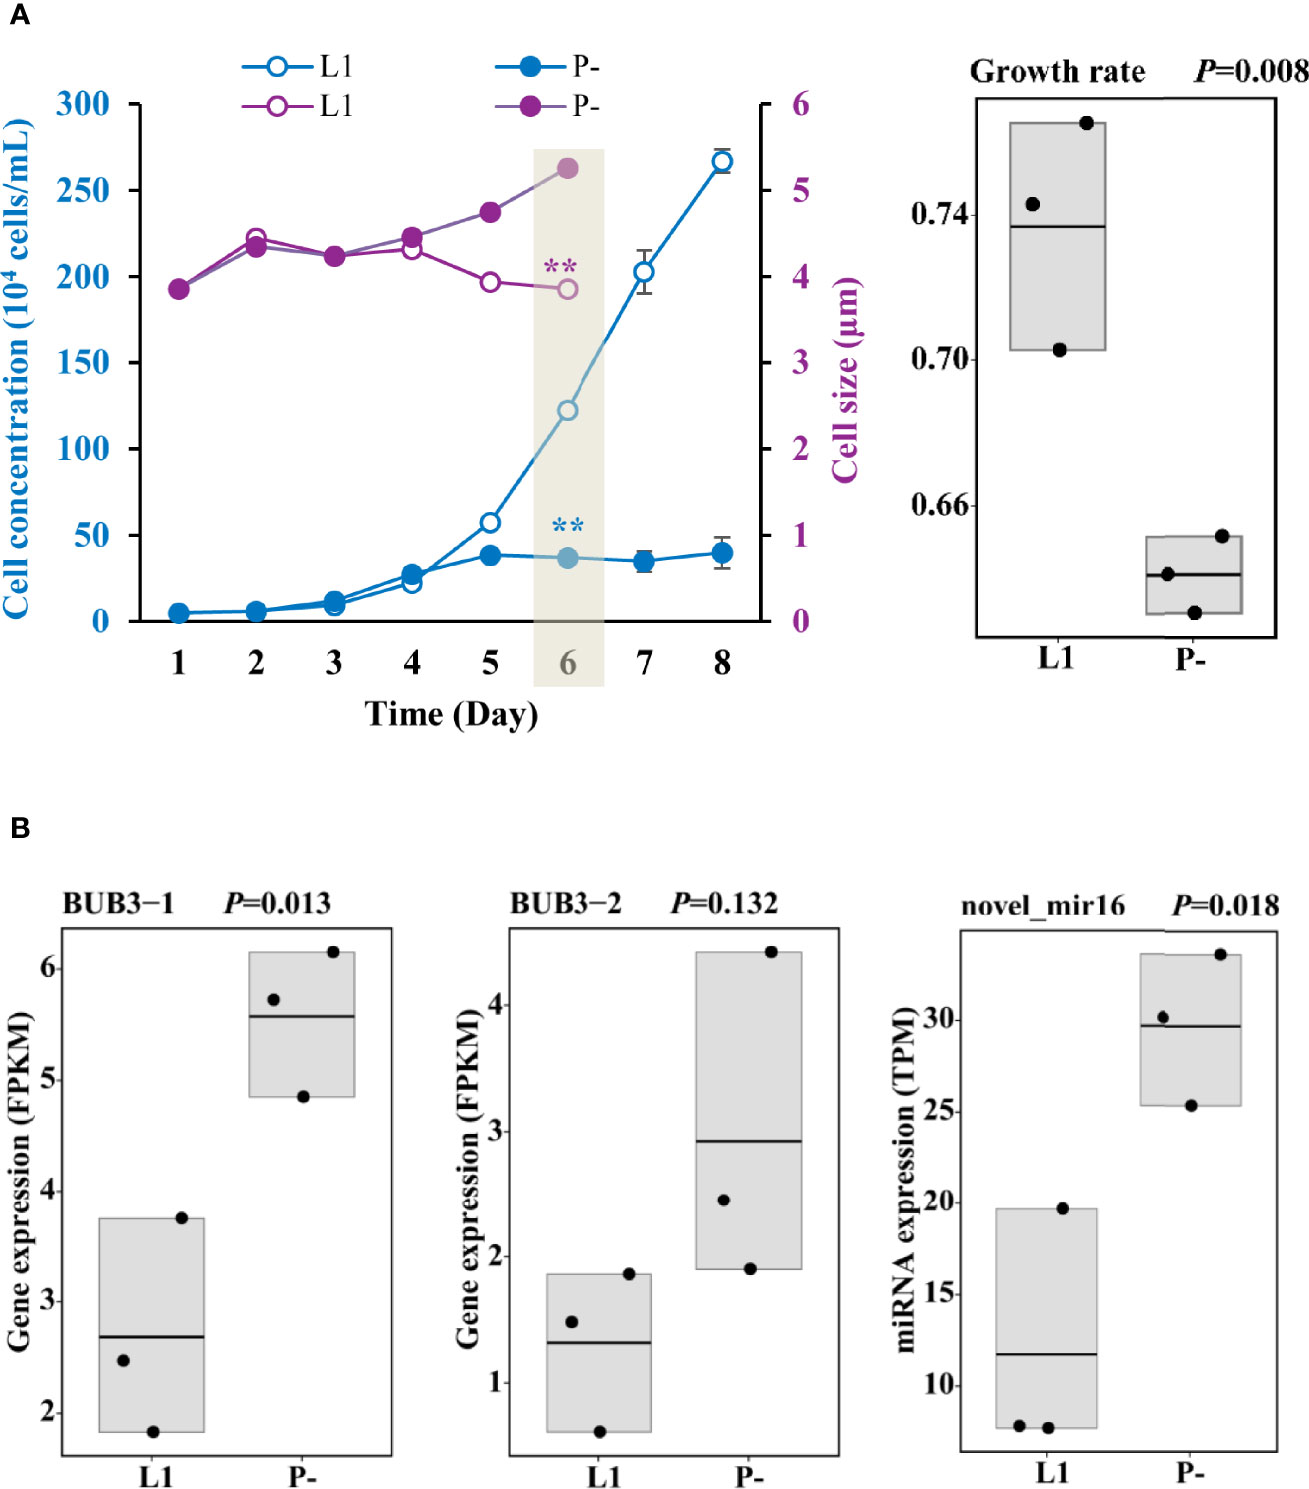
Figure 1 Responses of growth and cell size to P-limitation (P-) compared to P-replete condition (L1) and the corresponding gene expression. (A) Depressed growth, enlarged cell size, and inhibited growth rate on Day 6 in P- treatment relative to L1. Shading indicates when samples for RNA and miRNA sequencing were collected. Asterisks indicating significant differences between P- and L1 cultures, with blue color for cell concentration and purple color for cell size. ** indicates p < 0.001 in t-test. Error bars denote ± s.d. of the mean (n = 3). (B) Up-regulation of cell cycle arrest protein (BUB3) genes and miRNA (novel_mir16) predicted to negatively regulate cell growth. FPKM is the fragments per kilobase million and used for RNA normalization.
Additionally, samples were collected daily from Day 1 to Day 6 for the measurements of DIP concentration, cell size, and AP activity, while samples were collected every 3 days from Day 4 to Day 21 for the measurements of cellular C and N quotas, and from Day 4 to Day 10 for sinking rate. A 25-mL culture was filtered through a 0.45-μm mixed cellulose ester membrane, and DIP in the filtrate was determined colorimetrically following the Phosphorus Molybdenum Blue Method (Karl and Tien, 1992). Meanwhile, 10 mL culture was collected and the average cell size was measured using Beckman Counter. Bulk AP activity was measured by adding 50 μL of 20 mM p-nitro-phenylphosphate (p-NPP; prepared in 1 M Tris buffer at pH 9.0) into 1 mL culture sample (Li et al., 2018). This reaction was carried out in sterile microcentrifuge tubes incubated at 25°C in the dark for 2 h. Then the samples were vortexed, centrifuged at 10,000 g for 2 min, and put on ice immediately to stop further reaction. The supernatant was removed for OD measurement of PNP (hydrolysate of pNPP by AP) at 405 nm on NanoDrop.
Measurements of Cellular C and N Content, Surface Ca Abundance, and Sinking Rate
Samples were collected every three days for cellular carbon and nitrogen measurement during the three-week experimental period onto pre-combusted (450°C for 5 h in a Muffle furnace oven) Whatman GF/F filters (25 mm in diameter, 0.7 µm in pore size) and frozen at -80°C. PIC was removed by fuming the filters under 1N HCl overnight for POC analysis, while samples for total particulate carbon (TPC) were not treated with HCl. All filtered samples were dried at 56°C for 24 h and analyzed using Vario EL cube. PIC was calculated as the difference between TPC and POC. The PP (particulate phosphorus) in the cells was measured using the protocol described in our previous study (Wang et al., 2022). The C or N content was characterized as pg POC/PIC or PON per cell, respectively. Approximately 105 cells from each treatment were fixed on cover glasses and dried using Leica EM CPD300 Critical Point Dryer, then sputter-coated with gold-palladium. Cell surface elemental analysis was conducted using the energy dispersive spectrometry (EDS) system and the relative abundance of Ca among C, N, O, and Si was measured after 7, 13, 22, and 28 days of P limitation. The fold change of PIC content was the average of the data from Days 15, 18, and 21, while the fold change of POC and PON content also included the data from Days 7 and 10, but the calcium abundance was the average of Days 22 and 28.
The sinking rate of E. huxleyi was measured using the SETCOL method described by Bienfang, 1981, following our previous study (Wang et al., 2022). In brief, a 50-mL centrifuge tube was selected as a settling column and the sinking rate measurement was conducted 6 h after the start of the light period. After 2-h sinking in the medium, the supernatant was carefully siphoned out using a flexible plastic tubing connected with a 200 μL-pipette tip to go down below the surface of the culture and move down slowly with the decline of liquid level, while the other end of the tubing was connected to a hand bulb ear syringe to reduce the air pressure. Siphoning was stopped when 5-mL liquid remained in the bottom. The sinking rate was calculated following the formula:
where S is the sinking rate (m·d-1); Nt is the total number of cells in the column; Ns is the total number of settled cells; L is the height of the column; and t is the duration of settling (2 h).
Total RNA Isolation, (mi)RNA-Seq, and Bioinformatic Analysis
Approximately 2×10⁷ cells were harvested (12,000 g for 5 min at 4°C) from each L1 and P- cultures on Day 6 (Figure 1A) for RNA isolation, then fixed using TRI reagent (Sigma, St. Louis, MO) and stored at -80°C freezer immediately. Ethanol precipitation method was conducted to isolate total RNA (Shi et al., 2017), and used for library construction and sequencing (BGI Genomics Co., Ltd) with high quality (RNA Integrity Number > 8.0). All the raw sequencing data in this study have been deposited to NCBI’s Sequence Read Archive database under the project number PRJNA717369 and PRJNA718005.
Total RNA was subjected to DNA removal and mRNA enrichment using oligo (dT)-attached magnetic beads. The resultant mRNA was then fragmented and used in cDNA synthesis, end repair, A-addition, and adaptor ligation. Meanwhile, 0.2-1 μg RNA was used to separate small RNA using PAGE gel, and the selected 18-30 nt strip was recycled, purified, and ligated with an adaptor. RT-qPCR was carried out to get double-stranded cDNA, which was heat-denatured and circularized afterward to form the single strand circle DNA library, then sequenced using the BGISEQ-500 platform.
Raw reads from mRNA-Seq and small RNA-seq were quality filtered to produce clean data for downstream analyses. The clean reads were aligned against the genome of E. huxleyi (Read et al., 2013) using HISAT2, and results indicate that the total mapping ratio of each sample was more than 75%, while the uniquely mapped ratio was more than 35% (Supplementary Table S1). Bowtie2 was used to align the clean reads against the reference genes and the results were fed to RSEM for transcript quantification. The differential expressed genes were detected using DEGseq for each treatment relative to the control, and then were used for Gene Ontology (GO) functional classification and biological pathway analysis.
Small RNA-seq output was filtered by removing adaptors and poor-quality reads. These clean tags were mapped to the genome and other small RNA databases (miRBase, Rfam, siRNA, piRNA, snoRNA, etc.) using AASRA (except Rfam which was performed using cmsearch). The mapped small RNA tags were blasted against the small RNA databases to match known small RNAs, while the remaining unmatched sequences were analyzed using miRDeep2 (for animal) and RIPmiR (for plant) to predict novel small RNA. Computational prediction of miRNA targets (mRNA) was carried out through multiple software packages. The miRNA expression level was normalized by TPM (transcripts per kilobase million), and differential expressed miRNAs between L1 and P- were collected using DEGseq. GO and biological pathway enrichment analysis were performed to screen the differential expressed miRNA target genes.
RT-qPCR to Verify RNA-Seq Results
In total, 11 target genes were selected for expression quantification using RT-qPCR (reverse-transcription quantitative PCR) to verify RNA-seq results. For each sample, 400 ng total RNA was used in cDNA synthesis using PrimeScript™ RT reagent Kit (Takara, Clontech, Japan) containing the genomic erase buffer. Eleven genes with stable expression between L1 and P- (Supplementary Table S2) were selected and their candidacy as reference genes was assessed using GeNorm (Vandesompele et al., 2002) and NormFinder (Andersen et al., 2004). From these, the top two qualified candidates (17284063 and 17279548) were selected as reference genes with which to normalize the expression of target genes.
Statistical Analysis
Results were expressed as the average of three biological replicates. Statistical analyses of physiological parameters and gene expression between P- treatment and L1 control at different time points were performed using PASW statistics software 18 with independent-samples T test after homogeneity (Levene’s) tests.
Results
P-Deficiency Depressed Growth and Photosynthesis but Increased Cellular Carbon Content
P-limitation in the P- cultures was characterized by the undetectable DIP in the medium, the remarkably elevated AP activity, and as high as 11-fold up-regulation of AP gene expression (Supplementary Figure S1 and Supplementary Table S3), as well as the significantly depressed cell concentration increase from Day 5 on (Figure 1A). Cells were harvested on Day 6 for RNA analysis, and the transcriptomic data showed up-regulation of two cell cycle arrest protein (BUB3) genes and one miRNA (novel_mir16) predicted to negatively regulate cell growth under P-deprivation (Figure 1B and Supplementary Table S4). Consistently, cell size enlargement in P- (Figure 1A) was observed from Day 4.
Our transcriptomic data also indicated that enzymes responsible for phospholipids (phosphatidylcholine, PC) hydrolysis, including PLC (phospholipase C) and PLA (phospholipase A), were transcriptionally up-regulated under P-deficiency (Figure 2 and Supplementary Table S5), so were genes for the biosynthesis of the galactolipid DGDG (digalactosyldiacylglycerol) and the sulfolipid SQDG (sulfoquinovosyldiacylglycerol). Consistently, one down-regulated miRNA (novel_mir22) observed under P-deprivation was involved in sulfur metabolism, suggesting its up-regulation to favor cellular galactolipid and sulfolipid biosynthesis (Supplementary Figure S1 and Supplementary Table S4).
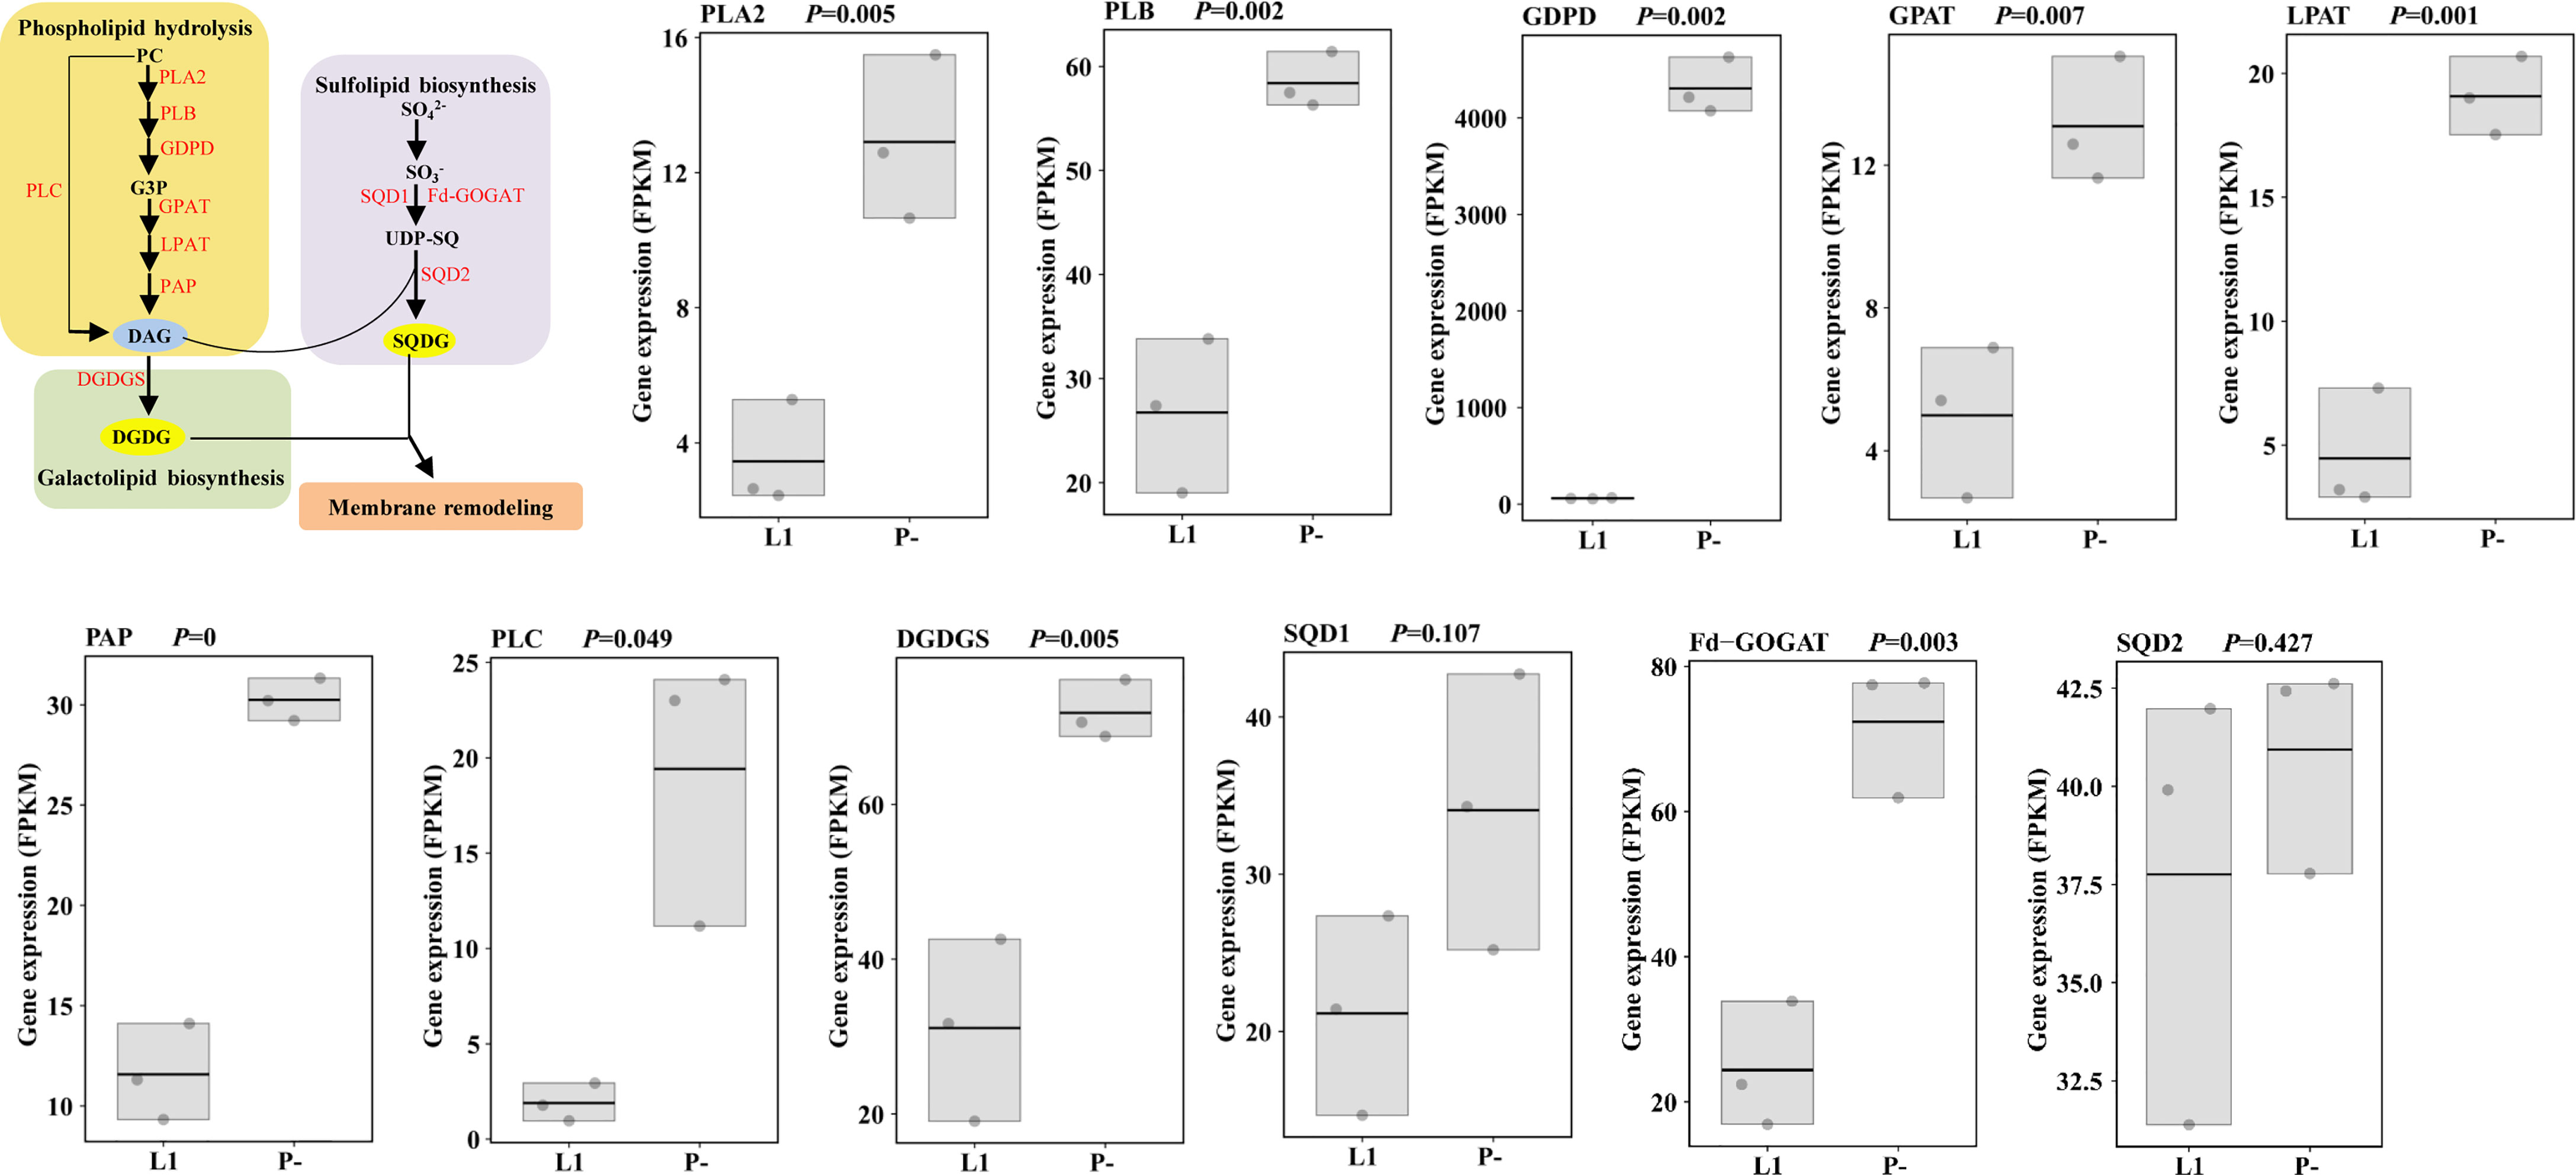
Figure 2 Membrane remodeling under P-limitation (P-) compared to P-replete condition (L1) and the corresponding gene expression. Processes of phospholipid hydrolysis, and galactolipid and sulfolipid biosynthesis were up-regulated characterized by the up-regulation of the responsible enzymes (in red color). PC, phosphatidylcholine; PLA2, secretory phospholipase A2; PLB, lysophospholipase/phospholipase B; GDPD, glycerophosphodiester phosphodiesterase; G3P, (sn)-glycerol-3-phosphate; GPAT, glycerol-3-phosphate acyltransferase; PA, phosphatidic acid; PAP, phosphatidic acid phosphatase; DAG, diacylglycerol; PLC, phospholipase C; DGDG, digalactosyldiacylglycerol; DGDGS, digalactosyldiacylglycerol synthase; SQDG, sulfoquinovosyldiacylglycerol; SQD1, UDP-SQ synthase; UDP-SQ, UDP-sulfoquinovose; Fd-GOGAT, ferredoxin-dependent glutamate synthase; SQD2, SQDG synthase; RuBP, ribulose-1,5-bisphosphate; RuBisCo, ribulose-1,5-bisphosphate carboxylase-oxygenase; PK, phosphoglycerate kinase; GAPDH, glyceraldehyde 3-phosphate dehydrogenase; 1,3BPGA, 1,3-bisphosphoglycerate; G3P, glyceraldehyde 3-phosphate; PEP, phosphoenolpyruvate; PEPC, PEP carboxylase; OAA, oxaloacetic acid; PEPCK, phosphoenolpyruvate carboxykinase.
A marked increase in cellular POC content (by 3.4-fold) was detected in P- relative to L1 (Figure 3A). Cellular PON content also increased (by twofold) under P-deficiency (Figure 3B). Combined, these gave an elevated C/N ratio (by 42%) under P-limitation (Figure 3C). In addition, all these P limitation-induced increases were observed again in a repeated experiment (Supplementary Figure S2), including an increase of cellular C/P. However, we observed down-regulation of photosynthesis (Figure 3D) and transporter genes (Figure 3E), but up-regulation of the C4 pathway core enzyme PEPC (phosphoenolpyruvate carboxylase), responsible for CO2 fixation to oxaloacetic acid (OAA) and phosphate release (Figure 3F).
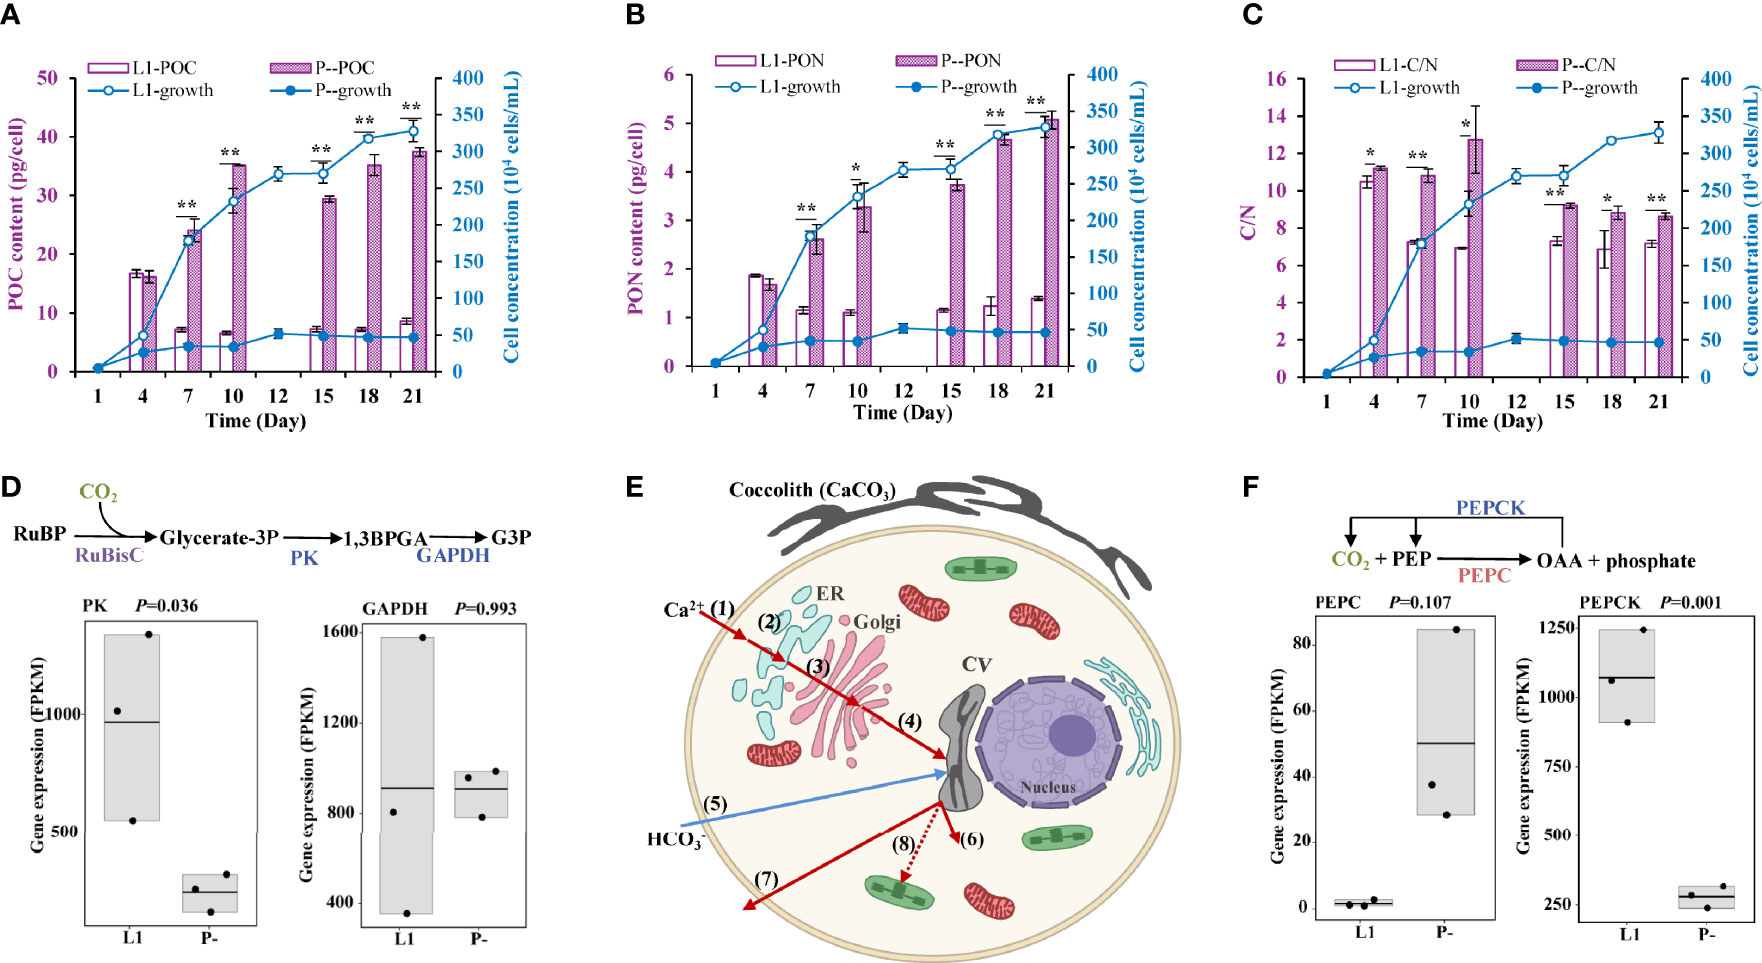
Figure 3 Physiological and the corresponding molecular responses to P-limitation (P-) compared to P-replete condition (L1). (A-C) Cellular particulate organic carbon (POC), organic nitrogen (PON), and C/N ratio in L1 and P- cultures. * indicates p < 0.05 in t-test while ** indicates p < 0.001. Error bars denote ± s.d. of the mean (n = 3). (D) down-regulation of photosynthetic CO2 fixation genes (in blue color). (E) Cellular processes of calcification in E. huxleyi and the effects of P limitation. Shown are the up-regulation of Ca2+ uptake and transport (red-color arrows), down-regulation of uptake (blue-color arrows), and up-regulation of H+ removal (red-color arrows) based on the transcriptomic data. (1) Entry of Ca2+ into the plasma through Ca2+-permeable PM channels; (2-4) Ca2+ transport across endomembrane compartment, from plasma to ER (2), to Golgi (3), then to CV (4) via Ca2+/H+ exchanger and supported by Ca2+-ATPase; (5) uptake via transporter and anion exchanger; (6) H+ removal from CV to the cytosol driven by V-type H+ transporting ATPase; (7) some H+ leaves the cell via voltage-gated H+ channel; (8) some H+ may be transported to chloroplast to support photosynthesis. (F) Up-regulation of PEPC gene (in red color) for CO2 incorporation into C4 molecules and down-regulation of PEPCK gene (in blue color) for CO2 release.
P-Deficiency Enhanced Calcification and Sinking Rate
In the P- cultures, cellular PIC content increased by fivefold on average after a 2-week P-limitation (Figure 4A), suggestive of enhanced calcification. In accordance, elemental analyses using EDS showed that the relative abundance of calcium among the five measured elements (C, N, O, Si, Ca) increased by ~46% after a 3-week P-deficiency (Figure 4B). More strikingly, the sinking rates of E. huxleyi ranged from 0.12-0.14 m/d in L1 and in P- they ranged from 0.13-0.20 m/d. P limitation increased sinking rates by 37-44% relative to L1 from Day 4 to Day10, when the P-deficiency was prolonged (Figure 4C).
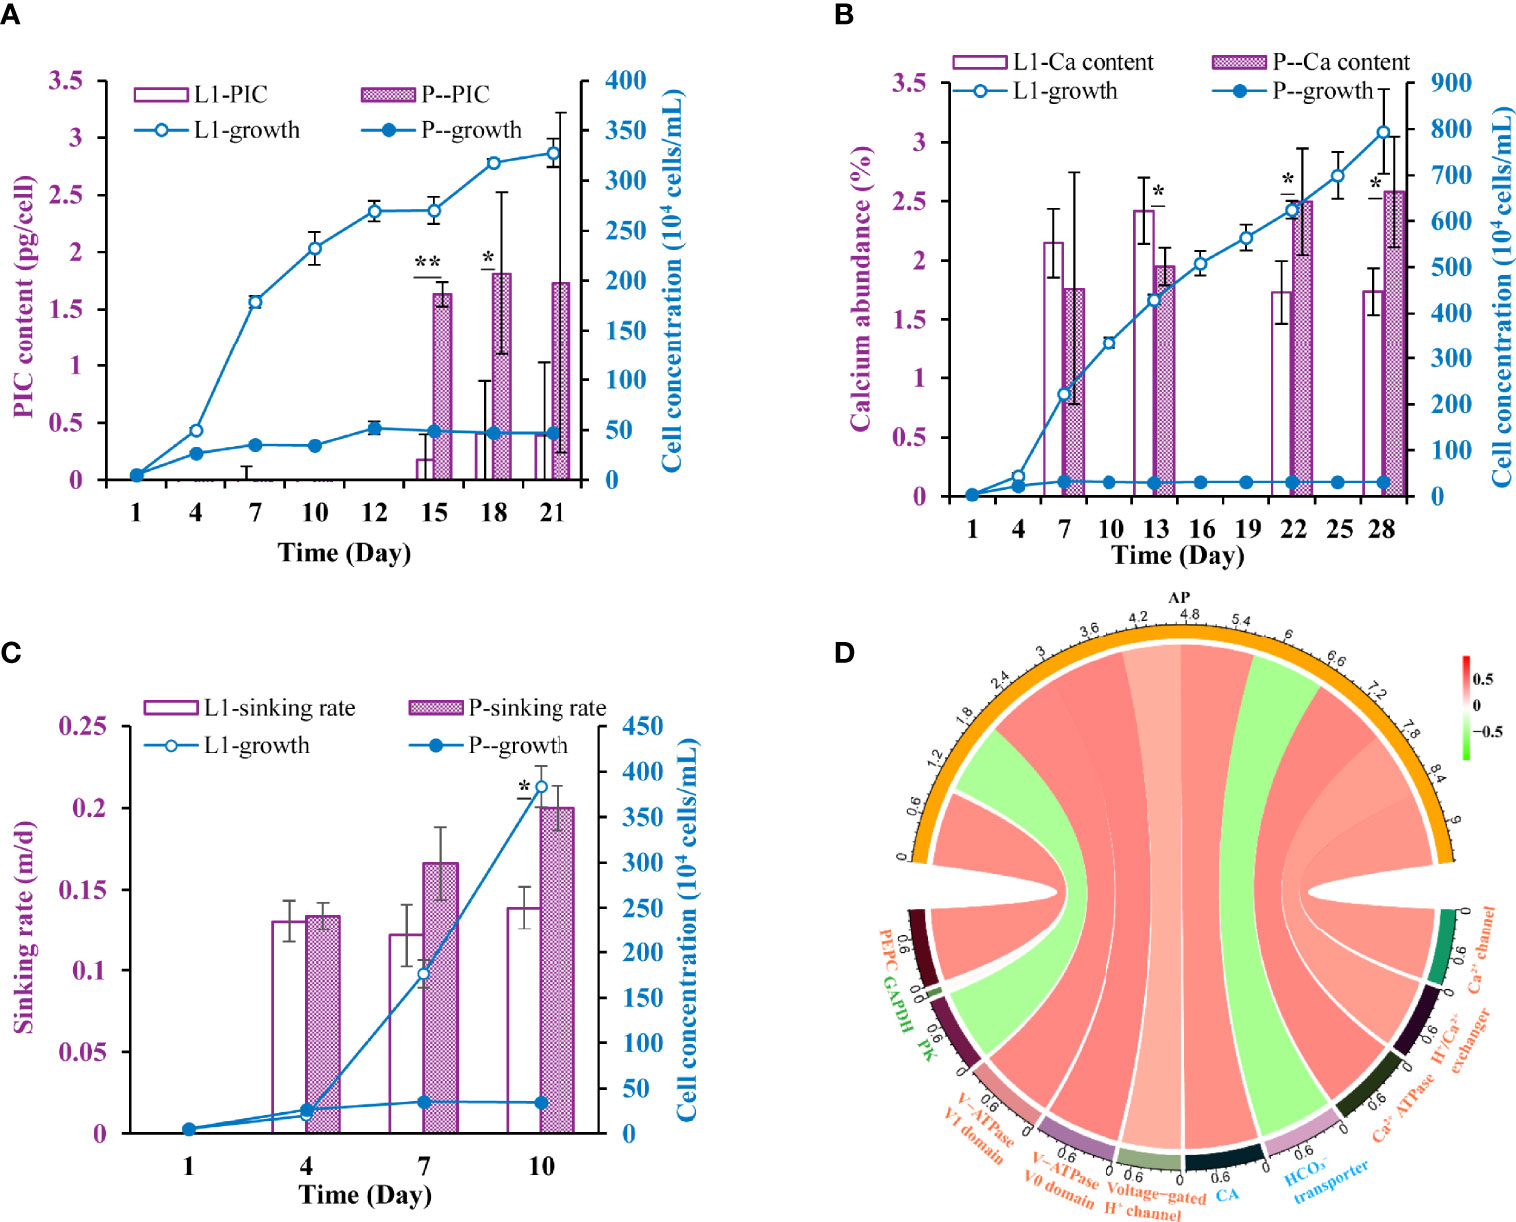
Figure 4 Physiological responses and the underlying molecular mechanism under P-limited conditions. (A-C) Cellular particulate inorganic carbon (PIC), calcium abundance, sinking rate in L1 and P- cultures. * indicates p < 0.05 in t-test while ** indicates p < 0.001. Error bars denote ± s.d. of the mean (n = 3). (D) Circos plot displaying the correlation between the expression of AP genes and that of calcification and photosynthesis related genes. The red ribbon indicates positive correlations while the green ribbon indicates negative correlations.
To better understand the mechanisms underlying the observed calcification enhancement under P deficiency, transcriptomes sequenced for the samples from the P- and the L1 were analyzed in depth (Figure 1A). Out of the total of 31,641 genes found in these transcriptomes, 12,287 up- and 3437 down-regulated genes and 19 up- and 4 down-regulated miRNAs were identified, under P-deficiency relative to L1 control (Supplementary Figure S1).
A wide range of genes related to calcification, including Ca2+ transport, inorganic carbon transport, and H+ transport genes (Supplementary Table S6), were identified to be differentially expressed in P- relative to L1. Total expression of Ca2+ transporters was up-regulated (Figure 4D), and the miRNA regulating calcium storage and release process in the endoplasmic and sarcoplasmic reticulum (novel_mir36 in Supplementary Table S4) was down-regulated (Supplementary Figure S1) consistently. The expression of H+ transport genes showed a similar uptick trend under P-deficiency (Figure 4D), and regulation of both Ca2+ transport and H+ transport genes was verified by RT-qPCR results (Supplementary Figure S3).
Discussion
Membrane Remodeling Under P Limitation to Decrease P Requirement
Phytoplankton are able to decease the cellular P demand to cope with P scarcity in the environment (Geider and La Roche, 2002; Bertilsson et al., 2003). A study showed that phosphate uptake for phospholipid biosynthesis declined about 100-fold while the ambient phosphate concentration decreased about 10-fold in the Sargasso Sea compared to the South Pacific subtropical gyre (Van Mooy et al., 2009). In this case, the non-phosphorus membrane lipid SQDG was used to substitute for the phospholipid phosphatidylglycerol (PG) in cyanobacteria while betaine lipid was used to substitute for phosphatidylcholine (PC) in eukaryotic phytoplankton. Upon P limitation, the percentage of phospholipid out of the intact polar lipid in E. huxleyi could drop from 33% to 2%, and this decrease was mainly attributed to the decline of PC (Shemi et al., 2016). However, genes underpinning the metabolic switch between phospholipids to non-P lipids in phytoplankton have not been unraveled in E. huxleyi but revealed in our study (Figure 2).
Two pathways of PC hydrolysis were identified by the up-regulation of PLA and PLC, in which more available phosphate would be released. With the production of the intermediate diacylglycerol (DAG), galactolipid (DGDG) and sulfolipid (SQDG) were further synthesized, indicated by the up-regulation of the typical SGDG synthase and SQDG synthase, respectively (Figure 2) (Nakamura, 2013). Consistently, miRNAs (negative regulators of gene expression) involved in sulfur metabolism were down-regulated, demonstrating the miRNA-mRNA-lipid biosynthesis regulatory cascade as the mechanism to up-regulate sulfolipid biosynthesis. However, homologues for the betaine lipids synthesis (Klug and Benning, 2001; Murakami et al., 2018) were not identified in our study, consistent with the study by Shemi et al. (Shemi et al., 2016) but at odds with that by Van Mooy et al. (Van Mooy et al., 2009), indicating a potential strain-specific metabolic shifting scheme in E. huxleyi. Furthermore, both betaine lipid and PC contain one atom of nitrogen per molecule, whereas the sulfolipid and galactolipid contain no N, thus the substitution for PC minimizes the requirement of cellular nitrogen. If confirmed by further studies, this will suggest that differential phospholipid substitution schemes confer E. huxleyi the plasticity to maintain growth in the face of both phosphorus and nitrogen limitation in the ocean and prevent large swings of N to P stoichiometry.
Promoting Effects of P Limitation on Calcification Through Transcriptomic and miRNA Regulations
This is the first documentation of physiological coupled molecular evidence for enhanced calcification under P-deprivation in E. huxleyi, substantiating the previous proposition along this line (Mackinder et al., 2010). Calcification involves the uptake of Ca2+ and , and the removal of H+. According to our transcriptomic analysis, expressions of Ca2+ uptake, H+ removal, and carbonic anhydrase (CA) genes (Supplementary Table S6) were up-regulated under P limitation and positively correlated with AP gene expression, combined with the down-regulation of miRNA responsible for the cellular transport of calcium (novel_mir36 in Supplementary Table S4), indicating the promoting effects of P limitation on calcification in E. huxleyi (Figure 3E).
These indicators of enhanced calcification are consistent with the observed increase in PIC content (Figure 4A) and calcium abundance (Figure 4B) in the cells under P-limitation in this study, and this had also been confirmed in the batch cultures in our repeated experiment (Supplementary Figure S2). Consistently, the number of coccolith per cell was reported to increase more than twofold and the calcium content per coccolith increased by 15% under strong P limitation in both the batch and chemostat cultures of E. huxleyi (Paasche, 1998). However, stable PIC content and declined calcification of E. huxleyi under P limitation have also been reported (Langer et al., 2013). These opposing responses may reflect inter-strain differences or a result of different experimental method, that is, batch vs. (semi-) continuous cultures (Langer et al., 2013). Studies on other coccolithophores have reported that the calcification of Calcidiscus leptoporus and Coccolithus pelagicus were not sensitive to P limitation (Langer et al., 2012; Gerecht et al., 2014). The species- or strain-specific adaption can potentially cause shifts in dominant contributors to BP among the coccolithophorid species or strains in the future ocean.
Furthermore, our observed stoichiometrically disproportionate increase in PIC (fivefold, relative to 46% of calcium abundance increase) under P-deprivation suggests that there is excess inorganic carbon storage in the P-deprived E. huxleyi cells, likely the result of the up-regulated CO2 to . The conversion of CO2 to in E. huxleyi is believed to be accomplished by the gamma class of CA (Sotoj et al., 2006), which was found to be up-regulated about 25-fold under calcifying vs. non-calcifying conditions of E. huxleyi, and was considered to be located in the coccolith vesicle (CV) for function in calcification. In that study, authors hypothesized that the converted by gamma CA from CO2 would be transported out of the CV and serve to increase cellular inorganic carbon, for use in photosynthesis after being transported into the chloroplast. This is possibly the case in our study. Then it is probable that the up-regulation of gamma CA under P limitation (Supplementary Figure S4) converted more CO2 to , thus contributing to the increase of the cellular PIC and calcification. The homologs of gamma CA were also observed to express specifically in the coccolith-bearing cells of the coccolithophore Pleurochrysis haptonemofera, and were expected to catalyze the conversion of CO2 to in calcification (Fujiwara et al., 2007).
Potential Role of C4 Pathway in Maintaining Photosynthesis and Recycling P Under P-Limitation
The transport of to the chloroplast could support photosynthesis by the C4 pathway, a scenario consistent with the up-regulation of phosphoenolpyruvate carboxylase (PEPC) (Ausenhus and O’Leary, 1992; Reinfelder et al., 2000). With the action of PEPC, CO2 reacts with phosphoenolpyruvate (PEP) to produce the C4 compound oxaloacetate (OAA) and phosphate (Figure 3F). While OAA will provide CO2 for Rubisco, the released phosphate can be recycled for use in the regeneration of ribulose-3,5-bisphosphate, the essential substrate of Rubisco. This way, photosynthesis can be relieved of P limitation to some extent. In support of this scenario is the stable expression of RubisCo (Figure 3D) and maintained cell growth (Figure 1A) we observed in the P-limited cultures. However, all these scenarios need further experimental confirmation.
Biogeochemical Implications (Carbon Export) of the Increased Carbon Content and Sinking Rate of Cells Under P-Limitation
From the biogeochemical perspective, the increased cellular PIC content, together with the molecular evidence of carbon incorporated into C4 compounds, further capacitate P-deprived E. huxleyi cells for carbon storage potential. As the production of one mole CaCO3 releases one mole of CO2, the 46% increase in calcium abundance in P-deprived E. huxleyi cells would involve 46% reduction of atmospheric CO2 drawdown by the cells (Figure 5). However, our observed 3.4-fold elevation in cellular POC (Figure 3A) indicates that the increase of the sequestrated CO2 caused by the enlarged and C-enriched cells exceeds that of the calcification-related CO2 release, and possibly an atmospheric drawdown. In support of this proposition, generally positive correlations between calculated coccolith carbonate and organic carbon daily fluxes has been observed in the global ocean (Ziveri et al., 2007).
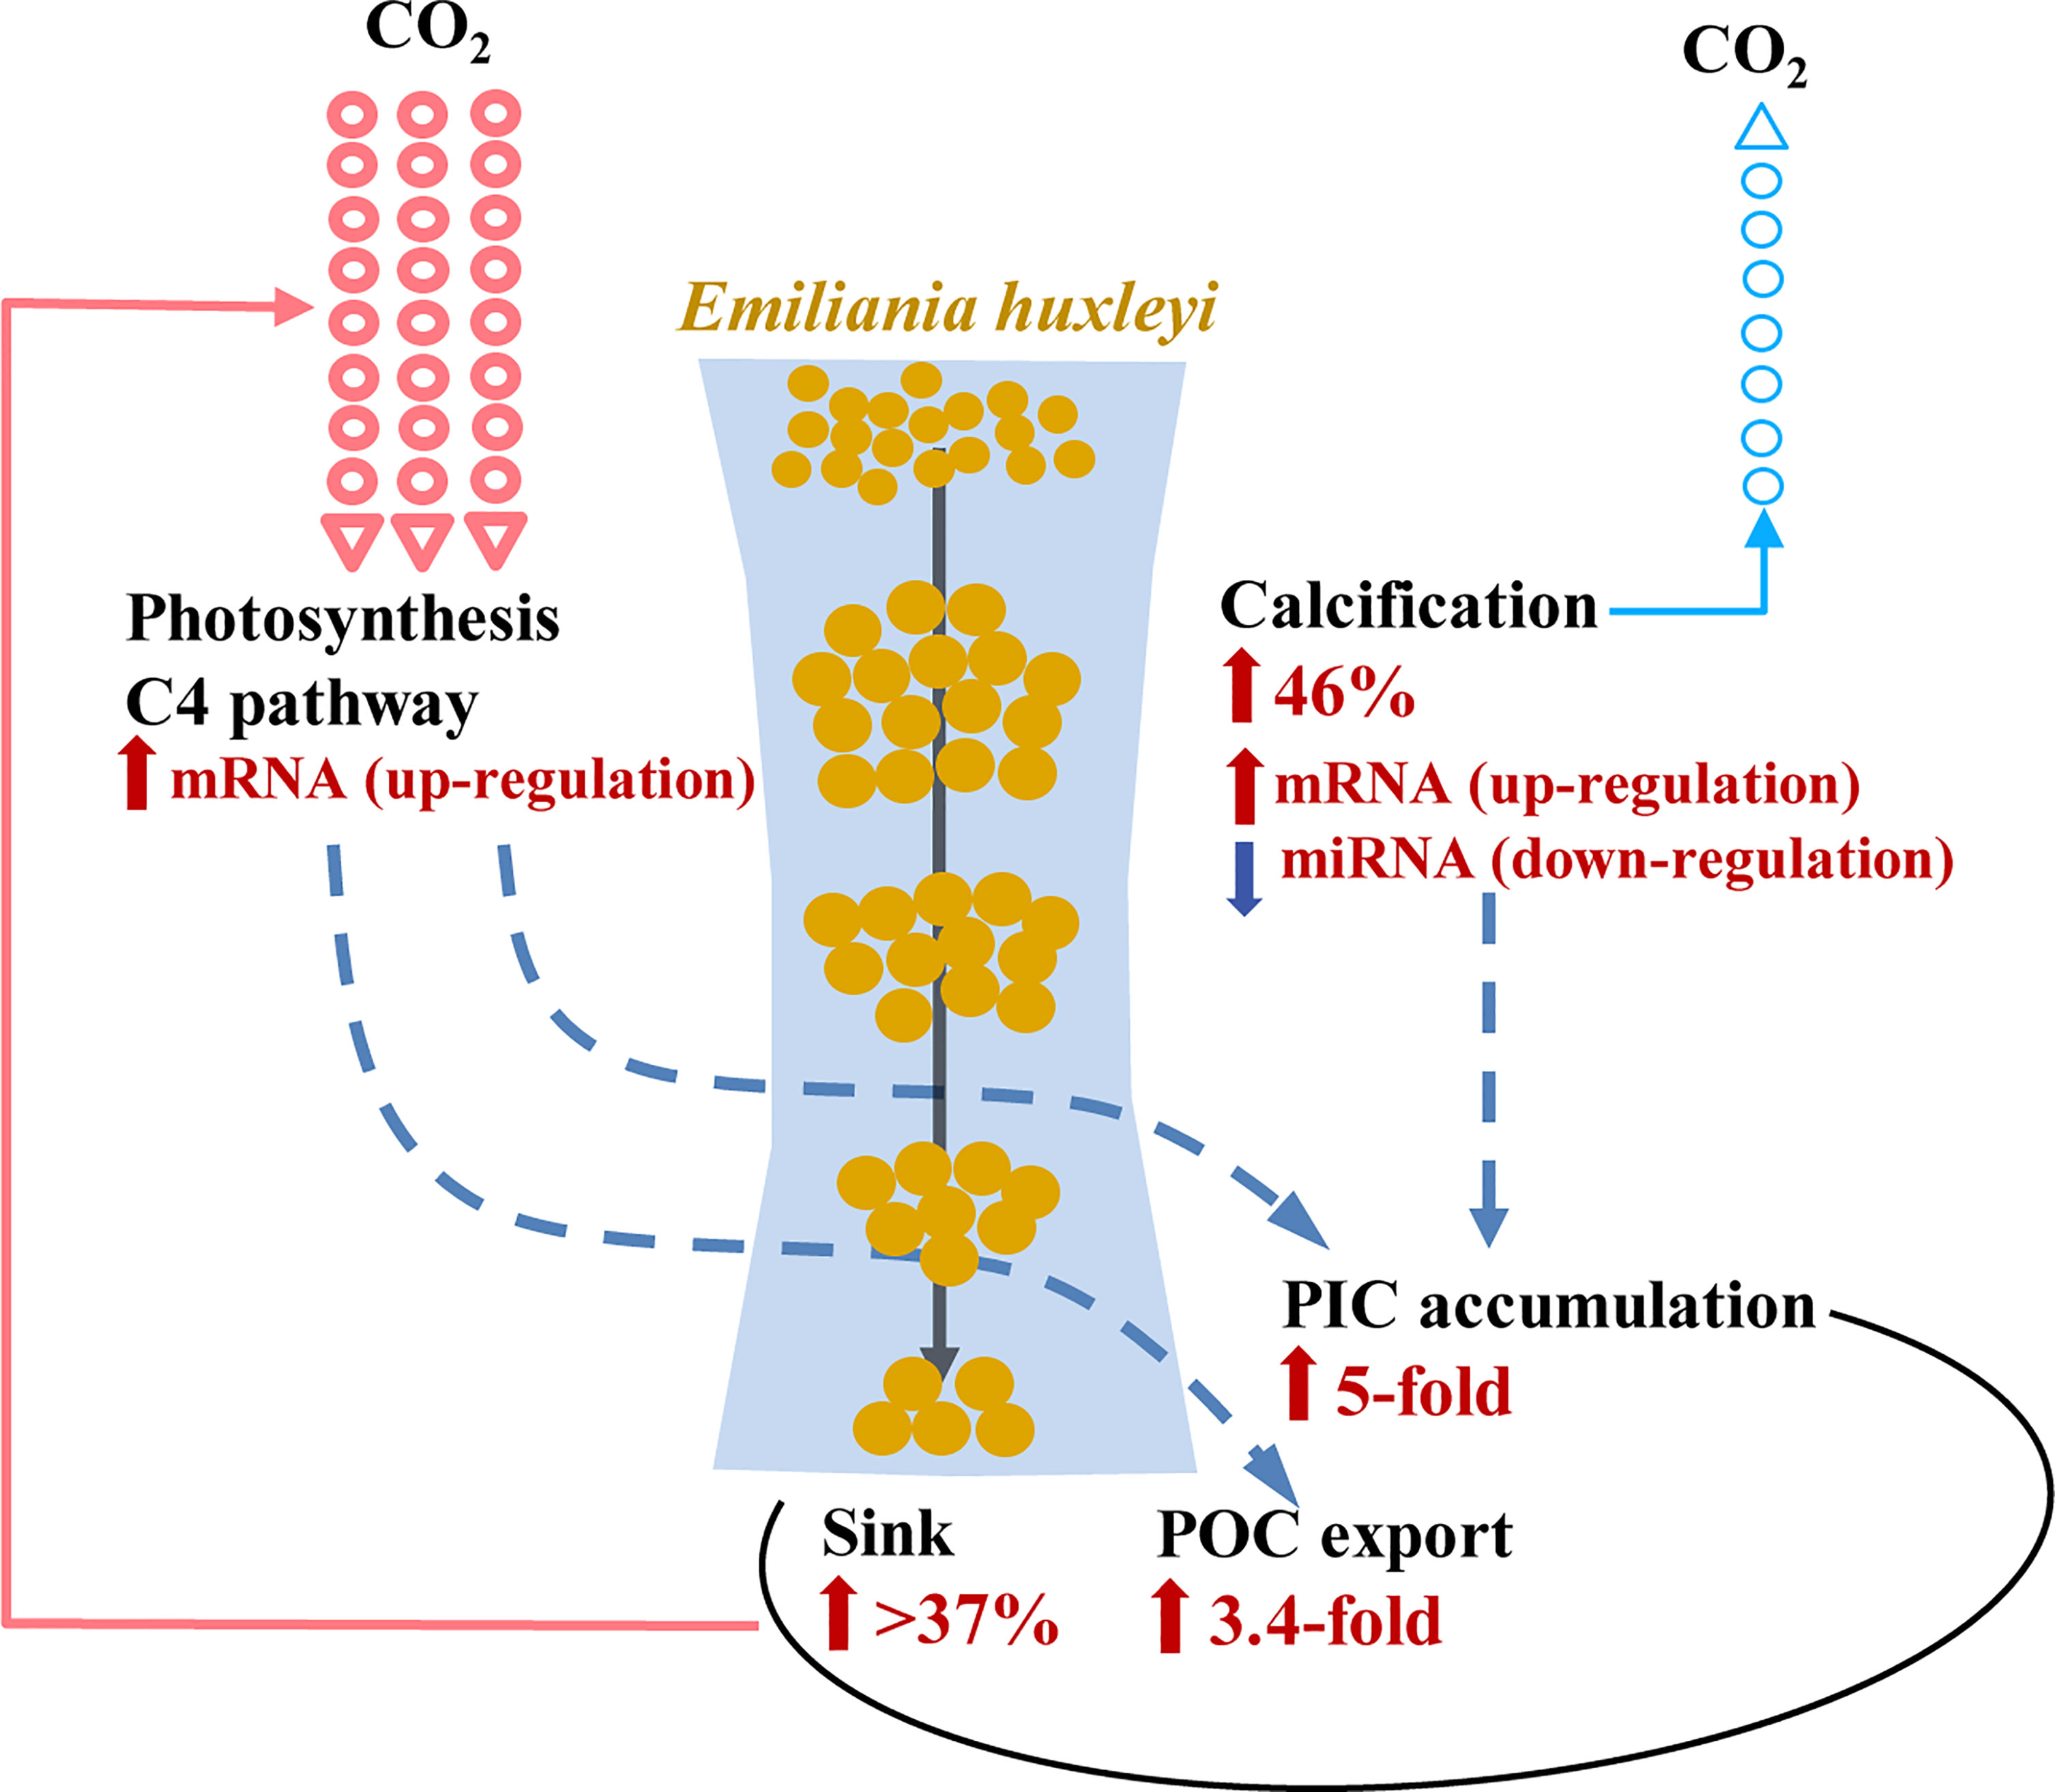
Figure 5 Schematic of the enhanced efficiency of E. huxleyi-mediated biological pump and the underlying molecular mechanisms under P limitation. Increases of cellular store of organic carbon (POC, by 3.4-fold) and inorganic carbon (PIC, by fivefold) under P limitation were due to continued (despite reduced) photosynthesis underlying the up-regulation of mRNA involved in C4 photosynthesis. Enhanced calcification (by 46%) was regulated by the corresponding up-regulation of mRNA and down-regulation of miRNA. Increased cell ballasting was due to depressed cell division and increased sinking rate (> 37%). The resulting increase in cellular carbon export outweighs the increase of CO2 release due to calcification enhancement.
Furthermore, the sinking rate of E. huxleyi increased by 37-44% under P limitation (Figure 4C), from 0.12-0.14 m/d to 0.13-0.20 m/d, which is comparable with previous estimates (raised by 29%, from 0.17 to 0.22 with an increase of pCO2) (Milner et al., 2016). This has the implications to atmospheric CO2 drawdown by E. huxleyi in a P-deficient ocean in terms of carbon export per mol carbon fixed or per mol nitrogen nutrient used (Figure 5). However, how the observed sinking rate and its increase under P limitation on the laboratory cultures will translate into actual sinking rate in the ocean still requires further studies conducted in situ or using mesocosms. Nevertheless, as alluded to earlier based on the literature, E. huxleyi is widely recognized as a major contributor of carbon export in the ocean (Holligan et al., 1983; Laber et al., 2018; Hernandez et al., 2020).
In the present study, the reallocation of cellular P under P-limitation was observed to cause an increase not only in the cellular PON content but also in the C/N and C/P ratio in E. huxleyi, and a higher C/N ratio signals more carbon fixed per N consumed, further bolstering the potential of P limitation to promote carbon export efficiency of E. huxleyi. In the ocean, besides warming and its associated water stratification, other factors exist. For example, ocean acidification resulting from increasing CO2 might be unfavorable to E. huxleyi cells sinking (Riebesell et al., 2017), iron deficiency, which could be caused by ocean acidification (Shi et al., 2010) can increase silica deposition and sinking rates in diatoms (Hutchins and Bruland, 1998). Our study underscores the need for more research effort to understand the effects of multiple environmental variables relevant to projected warming and acidified oceans on BP efficiency and the underlying mechanisms.
Data Availability Statement
The datasets presented in this study can be found in online repositories. The names of the repository/repositories and accession number(s) can be found below: https://www.ncbi.nlm.nih.gov/, PRJNA717369 https://www.ncbi.nlm.nih.gov/, PRJNA718005.
Author Contributions
SL led and CW contributed to the writing of the initial manuscript. JW conducted the data analysis and created some figures. LL and YW contributed the technical advice and logistic support. All authors contributed to the article and approved the submitted version.
Funding
This study was supported by the National Key Research and Development Program of China grant 2016YFA0601202, National Natural Science Foundation of China grant NSFC41776116 and NSFC42006132.
Conflict of Interest
The authors declare that the research was conducted in the absence of any commercial or financial relationships that could be construed as a potential conflict of interest.
Publisher’s Note
All claims expressed in this article are solely those of the authors and do not necessarily represent those of their affiliated organizations, or those of the publisher, the editors and the reviewers. Any product that may be evaluated in this article, or claim that may be made by its manufacturer, is not guaranteed or endorsed by the publisher.
Acknowledgments
We wish to thank Nanjing Ji at Jiangsu Ocean University, China, and Xiaohong Yang at China Geological Survey for the technical help in reference genes selection.
Supplementary Material
The Supplementary Material for this article can be found online at: https://www.frontiersin.org/articles/10.3389/fmars.2022.860222/full#supplementary-material
References
Andersen C. L., Jensen J. L., Orntoft T. F. (2004). Normalization of Real-Time Quantitative Reverse Transcription-PCR Data: A Model-Based Variance Estimation Approach to Identify Genes Suited for Normalization, Applied to Bladder and Colon Cancer Data Sets. Cancer Res. 64 (15), 5245–5250. doi: 10.1158/0008-5472.Can-04-0496
Ausenhus S. L., O’Leary M. H. (1992). Hydrolysis of Phosphoenolpyruvate Catalyzed by Phosphoenolpyruvate Carboxylase From Zea Mays. Biochemistry 31 (28), 6427–6431. doi: 10.1021/bi00143a010
Bach L. T., Riebesell U., Gutowska M. A., Federwisch L., Schulz K. G. (2015). A Unifying Concept of Coccolithophore Sensitivity to Changing Carbonate Chemistry Embedded in an Ecological Framework. Prog. Oceanogr. 135, 125–138. doi: 10.1016/j.pocean.2015.04.012
Benner R., Amon R. M. W. (2015). The Size-Reactivity Continuum of Major Bioelements in the Ocean. Annu. Rev. Mar. Sci. 7 (1), 185–205. doi: 10.1146/annurev-marine-010213-135126
Bertilsson S., Berglund O., Karl D. M., Chisholm S. W. (2003). Elemental Composition of Marine Prochlorococcus and Synechococcus: Implications for the Ecological Stoichiometry of the Sea. Limnol. Oceanogr. 48 (5), 1721–1731. doi: 10.4319/lo.2003.48.5.1721
Bienfang P. K. (1981). Setcol - a Technologically Simple and Reliable Method for Measuring Phytoplankton Sinking Rates. Can. J. Fish. Aquat. Sci. 38 (10), 1289–1294. doi: 10.1139/F81-173
Björkman K. M., Karl D. M. (2003). Bioavailability of Dissolved Organic Phosphorus in the Euphotic Zone at Station ALOHA, North Pacific Subtropical Gyre. Limnol. Oceanogr. 48 (3), 1049–1057. doi: 10.4319/lo.2003.48.3.1049
Bopp L., Resplandy L., Orr J. C., Doney S. C., Dunne J. P., Gehlen M., et al. (2013). Multiple Stressors of Ocean Ecosystems in the 21st Century: Projections With CMIP5 Models. Biogeosciences 10 (10), 6225–6245. doi: 10.5194/bg-10-6225-2013
Boyd P. W., Doney S. C., Strzepek R., Dusenberry J., Lindsay K., Fung I. (2008). Climate-Mediated Changes to Mixed-Layer Properties in the Southern Ocean: Assessing the Phytoplankton Response. Biogeosciences 5 (3), 847–864. doi: 10.5194/bg-5-847-2008
Broecker W., Clark E. (2009). Ratio of Coccolith CaCO3 to Foraminifera CaCO3 in Late Holocene Deep Sea Sediments. Paleoceanography 24, PA3205. doi: 10.1029/2009PA001731
Brown C. W., Yoder J. A. (1994). Coccolithophorid Blooms in the Global Ocean. J. Geophys. Res.-Ocean. 99 (C4), 7467–7482. doi: 10.1029/93jc02156
Ducklow H. W., Steinberg D. K., Buesseler K. O. (2001). Upper Ocean Carbon Export and the Biological Pump. Oceanography 14 (4), 50–58. doi: 10.5670/oceanog.2001.06
Dyhrman S. T., Chappell P. D., Haley S. T., Moffett J. W., Orchard E. D., Waterbury J. B., et al. (2006). Phosphonate Utilization by the Globally Important Marine Diazotroph Trichodesmium. Nature 439 (7072), 68–71. doi: 10.1038/nature04203
Dyhrman S. T., Jenkins B. D., Rynearson T. A., Saito M. A., Mercier M. L., Alexander H., et al. (2012). The Transcriptome and Proteome of the Diatom Thalassiosira Pseudonana Reveal a Diverse Phosphorus Stress Response. PLos One 7 (3), e33768. doi: 10.1371/journal.pone.0033768
Field C. B., Behrenfeld M. J., Randerson J. T., Falkowski P. (1998). Primary Production of the Biosphere: Integrating Terrestrial and Oceanic Components. Science 281 (5374), 237–240. doi: 10.1126/science.281.5374.237
Fujiwara S., Hirokawa Y., Takatsuka Y., Suda K., Asamizu E., Takayanagi T., et al. (2007). Gene Expression Profiling of Coccolith-Bearing Cells and Naked Cells in Haptophyte Pleurochrysis Haptonemofera With a cDNA Macroarray System. Mar. Biotechnol. 9, 550–560. doi: 10.1007/s10126-007-9039-8
Geider R., La Roche J. (2002). Redfield Revisited: Variability of C: N: P in Marine Microalgae and its Biogeochemical Basis. Eur. J. Phycol. 37, 1–17. doi: 10.1017/S0967026201003456
Gerecht A. C., Šupraha L., Edvardsen B., Probert I., Henderiks J. (2014). High Temperature Decreases the PIC/POC Ratio and Increases Phosphorus Requirements in Coccolithus Pelagicus (Haptophyta). Biogeosciences 11 (13), 3531–3545. doi: 10.5194/bg-11-3531-2014
Hernandez A. S. R., Trull T. W., Nodder S. D., Flores J. A., Bostock H., Abrantes F., et al. (2020). Coccolithophore Biodiversity Controls Carbonate Export in the Southern Ocean. Biogeosciences 17 (1), 245–63. doi: 10.5194/bg-17-245-2020
Holligan P. M., Viollier M., Harbour D. S., Camus P., Champagnephilippe M. (1983). Satellite and Ship Studies of Coccolithophore Production Along a Continental-Shelf Edge. Nature 304 (5924), 339–342. doi: 10.1038/304339a0
Hutchins D. A., Bruland K. W. (1998). Iron-Limited Diatom Growth and Si: N Uptake Ratios in a Coastal Upwelling Regime. Nature 393 (6685), 561–564. doi: 10.1038/31203
Ivančić I., Pfannkuchen M., Godrijan J., Djakovac T., Pfannkuchen D. M., Korlević M., et al. (2016). Alkaline Phosphatase Activity Related to Phosphorus Stress of Microphytoplankton in Different Trophic Conditions. Prog. Oceanogr. 146, 175–186. doi: 10.1016/j.pocean.2016.07.003
Karl D. M., Tien G. (1992). MAGIC: A Sensitive and Precise Method for Measuring Dissolved Phosphorus in Aquatic Environments. Limnol. Oceanogr. 37 (1), 105–116. doi: 10.4319/lo.1992.37.1.0105
Kim J.-M., Lee K., Shin K., Yang E. J., Engel A., Karl D. M., et al. (2011). Shifts in Biogenic Carbon Flow From Particulate to Dissolved Forms Under High Carbon Dioxide and Warm Ocean Conditions. Geophys. Res. Lett. 38 (8), L08612. doi: 10.1029/2011GL047346
Klug R. M., Benning C. (2001). Two Enzymes of Diacylglyceryl-O-4′-(N, N, N,-Trimethyl) Homoserine Biosynthesis are Encoded by btaA and btaB in the Purple Bacterium Rhodobacter Sphaeroides. Proc. Natl. Acad. Sci. 98 (10), 5910–5915. doi: 10.1073/pnas.101037998
Laber C. P., Hunter J. E., Carvalho F., Collins J. R., Hunter E. J., Schieler B. M., et al. (2018). Coccolithovirus Facilitation of Carbon Export in the North Atlantic. Nat. Microbiol. 3 (5), 537–547. doi: 10.1038/s41564-018-0128-4
Langer G., Oetjen K., Brenneis T. (2012). Calcification of Calcidiscus Leptoporus Under Nitrogen and Phosphorus Limitation. J. Exp. Mar. Biol. Ecol. 413, 131–137. doi: 10.1016/j.jembe.2011.11.028
Langer G., Oetjen K., Brenneis T. (2013). Coccolithophores do Not Increase Particulate Carbon Production Under Nutrient Limitation: A Case Study Using Emiliania Huxleyi (PML B92/11). J. Exp. Mar. Biol. Ecol. 443, 155–161. doi: 10.1016/j.jembe.2013.02.040
Li T. C., Guo C. T., Zhang Y. Q., Wang C., Lin X., Lin S. J. (2018). Identification and Expression Analysis of an Atypical Alkaline Phosphatase in Emiliania Huxleyi. Front. Microbiol. 9. doi: 10.3389/fmicb.2018.02156
Lin S., Litaker R. W., Sunda W. G. (2016). Phosphorus Physiological Ecology and Molecular Mechanisms in Marine Phytoplankton. J. Phycol. 52 (1), 10–36. doi: 10.1111/jpy.12365
Li M., Shi X., Guo C., Lin S. (2016). Phosphorus Deficiency Inhibits Cell Division But Not Growth in the Dinoflagellate Amphidinium Carterae. Front. Microbiol. 7, 826. doi: 10.3389/fmicb.2016.00826
Mackinder L., Wheeler G., Schroeder D., Riebesell U., Brownlee C. (2010). Molecular Mechanisms Underlying Calcification in Coccolithophores. Geomicrobiol. J. 27 (6-7), 585–595. doi: 10.1080/01490451003703014
Marinov I., Doney S. C., Lima I. D. (2010). Response of Ocean Phytoplankton Community Structure to Climate Change Over the 21st Century: Partitioning the Effects of Nutrients, Temperature and Light. Biogeosciences 7 (12), 3941–3959. doi: 10.5194/bg-7-3941-2010
Milner S., Langer G., Grelaud M., Ziveri P. (2016). Ocean Warming Modulates the Effects of Acidification on Emiliania Huxleyi Calcification and Sinking. Limnol. Oceanogr. 61 (4), 1322–1336. doi: 10.1002/lno.10292
Mohan R., Mergulhao L. P., Guptha M. V. S., Rajakumar A., Thamban M., AnilKumar N., et al. (2008). Ecology of Coccolithophores in the Indian Sector of the Southern Ocean. Mar. Micropaleontol. 67 (1), 30–45. doi: 10.1016/j.marmicro.2007.08.005
Moore L., Ostrowski M., Scanlan D., Feren K., Sweetsir T. (2005). Ecotypic Variation in Phosphorus-Acquisition Mechanisms Within Marine Picocyanobacteria. Aquat. Microbial. Ecol. 39 (3), 257–269. doi: 10.3354/ame039257
Murakami H., Nobusawa T., Hori K., Shimojima M., Ohta H. (2018). Betaine Lipid Is Crucial for Adapting to Low Temperature and Phosphate Deficiency in Nannochloropsis. Plant Physiol. 177 (1), 181–193. doi: 10.1104/pp.17.01573
Mustaffa N. I. H., Kallajoki L., Hillebrand H., Wurl O., Striebel M. (2020). Sea Surface Phytoplankton Community Response to Nutrient and Light Changes. Mar. Biol. 167 (123), 1–15. doi: 10.1007/s00227-020-03738-2
Nakamura Y. (2013). Phosphate Starvation and Membrane Lipid Remodeling in Seed Plants. Prog. Lipid Res. 52 (1), 43–50. doi: 10.1016/j.plipres.2012.07.002
Nicholson D., Dyhrman S., Chavez F., Paytan A. (2006). Alkaline Phosphatase Activity in the Phytoplankton Communities of Monterey Bay and San Francisco Bay. Limnol. Oceanogr. 51 (2), 874–883. doi: 10.4319/lo.2006.51.2.0874
Novak T., Godrijan J., Pfannkuchen D. M., Djakovac T., Medić N., Ivančić I., et al. (2019). Global Warming and Oligotrophication Lead to Increased Lipid Production in Marine Phytoplankton. Sci. Tot. Environ. 668, 171–183. doi: 10.1016/j.scitotenv.2019.02.372
Omand M. M., Govindarajan R., He J., Mahadevan A. (2020). Sinking Flux of Particulate Organic Matter in the Oceans: Sensitivity to Particle Characteristics. Sci. Rep. 10 (1), 5582. doi: 10.1038/s41598-020-60424-5
Paasche E. (1998). Roles of Nitrogen and Phosphorus in Coccolith Formation in Emiliania Huxleyi (Prymnesiophyceae). Eur. J. Phycol. 33 (1), 33–42. doi: 10.1017/S0967026297001480
Poulton A. J., Adey T. R., Balch W. M., Holligan P. M. (2007). Relating Coccolithophore Calcification Rates to Phytoplankton Community Dynamics: Regional Differences and Implications for Carbon Export. Deep. Sea. Res. Part II.: Top. Stud. Oceanogr. 54 (5), 538–557. doi: 10.1016/j.dsr2.2006.12.003
Raven J. A., Crawfurd K. (2012). Environmental Controls on Coccolithophore Calcification. Mar. Ecol. Prog. Ser. 470, 137–166. doi: 10.3354/meps09993
Read B. A., Kegel J., Klute M. J., Kuo A., Lefebvre S. C., Maumus F., et al. (2013). Pan Genome of the Phytoplankton Emiliania Underpins its Global Distribution. Nature 499 (7457), 209–213. doi: 10.1038/nature12221
Reinfelder J. R., Kraepiel A. M., Morel F. M. (2000). Unicellular C4 Photosynthesis in a Marine Diatom. Nature 407 (6807), 996–999. doi: 10.1038/35039612
Riebesell U., Bach L. T., Bellerby R. G. J., Monsalve J. R. B., Boxhammer T., Czerny J., et al. (2017). Competitive Fitness of a Predominant Pelagic Calcifier Impaired by Ocean Acidification. Nat. Geosci. 10 (1), 19–23. doi: 10.1038/NGEO2854
Riegman R., Stolte W., Noordeloos A. A. M., Slezak D. (2000). Nutrient Uptake, and Alkaline Phosphate (EC 3: 1: 3: 1) Activity of Emiliania Huxleyi (Prymnesiophyceae) During Growth Under N and P Limitation in Continuous Cultures. J. Phycol. 36 (1), 87–96. doi: 10.1046/j.1529-8817.2000.99023.x
Rost B., Riebesell U. (2004). “Coccolithophores and the Biological Pump: Responses to Environmental Changes,” in Coccolithophores (Berlin, Heidelberg: Springer).
Sarmiento J. L., Slater R., Barber R., Bopp L., Doney S., Hirst A., et al. (2004). Response of Ocean Ecosystems to Climate Warming. Global Biogeochem. Cycle. 18 (3), GB3003. doi: 10.1029/2003GB002134
Sarmiento J. L., Toggweiler J. R. (1984). A New Model for the Role of the Oceans in Determining Atmospheric P Co2. Nature 308 (5960), 621–624. doi: 10.1038/308621a0
Schlesinger W. H., Bernhardt E. S. (2013). Biogeochemistry: An Analysis of Global Change. Waltham and Academic Press.
Shemi A., Schatz D., Fredricks H. F., Van Mooy B. A., Porat Z., Vardi A. (2016). Phosphorus Starvation Induces Membrane Remodeling and Recycling in Emiliania Huxleyi. New Phytol. 211 (3), 886–898. doi: 10.1111/nph.13940
Shi X., Lin X., Li L., Li M., Palenik B., Lin S. (2017). Transcriptomic and Micrornaomic Profiling Reveals Multi-Faceted Mechanisms to Cope With Phosphate Stress in a Dinoflagellate. ISME. J. 11), 2209–2218. doi: 10.1038/ismej.2017.81
Shi D., Xu Y., Hopkinson B. M., Morel F. M. (2010). Effect of Ocean Acidification on Iron Availability to Marine Phytoplankton. Science 327 (5966), 676–679. doi: 10.1126/science.1183517
Sotoj A. R., Zheng H., Shoemaker D., Rodriguez J., Read B. A., Wahlund T. M. (2006). Identification and Preliminary Characterization of Two cDNAs Encoding Unique Carbonic Anhydrases From the Marine Alga Emiliania Huxleyi. Appl. Environ. Microbiol. 72 (8), 5500–5511. doi: 10.1128/Aem.00237-06
Taylor A. R., Brownlee C., Wheeler G. (2017). Coccolithophore Cell Biology: Chalking Up Progress. Annu. Rev. Mar. Sci. 9, 283–310. doi: 10.1146/annurev-marine-122414-034032
Teng Y. C., Primeau F. W., Moore J. K., Lomas M. W., Martiny A. C. (2014). Global-Scale Variations of the Ratios of Carbon to Phosphorus in Exported Marine Organic Matter. Nat. Geosci. 7 (12), 895–898. doi: 10.1038/Ngeo2303
Tyrrell T. (1999). The Relative Influences of Nitrogen and Phosphorus on Oceanic Primary Production. Nature 400 (6744), 525–531. doi: 10.1038/22941
Vanderwal P., Kempers R. S., Veldhuis M. J. W. (1995). Production and Downward Flux of Organic-Matter and Calcite in a North-Sea Bloom of the Coccolithophore Emiliania Huxleyi. Mar. Ecol. Prog. Ser. 126 (1-3), 247–265. doi: 10.3354/meps126247
Vandesompele J., De Preter K., Pattyn F., Poppe B., Van Roy N., De Paepe A., et al. (2002). Accurate Normalization of Real-Time Quantitative RT-PCR Data by Geometric Averaging of Multiple Internal Control Genes. Genome Biol. 3 (7), research0034.1–0034.11. doi: 10.1186/gb-2002-3-7-research0034
Van Mooy B. A., Fredricks H. F., Pedler B. E., Dyhrman S. T., Karl D. M., Koblížek M., et al. (2009). Phytoplankton in the Ocean Use non-Phosphorus Lipids in Response to Phosphorus Scarcity. Nature 458 (7234), 69–72. doi: 10.1038/nature07659
Wang C., Baseler S., Lin S. J. (2020). Glycerol Utilization By Phytoplankton(1). J. Phycol. 56 (5), 1157–1167. doi: 10.1111/jpy.13031
Wang C., Lin X., Li L., Lin S. (2016). Differential Growth Responses of Marine Phytoplankton to Herbicide Glyphosate. PLos One 11 (3), e0151633. doi: 10.1371/journal.pone.0151633
Wang C., Sun X., Wang J., Tang J.-M, Gu Y., Lin S., et al. (2022). Physiological and Metabolic Effects of Glyphosate as the Sole P Source on a Cosmopolitan Phytoplankter and Biogeochemical Implications. Sci. Total Environ. 832, 155094. doi: 10.1016/j.scitotenv.2022.155094
Westbroek P., Brown C. W., Vanbleijswijk J., Brownlee C., Brummer G. J., Conte M., et al. (1993). A Model System Approach to Biological Climate Forcing - The Example of Emiliania Huxleyi. Global Planet. Change 8 (1-2), 27–46. doi: 10.1016/0921-8181(93)90061-R
Wurch L. L., Gobler C. J., Dyhrman S. T. (2014). Expression of a Xanthine Permease and Phosphate Transporter in Cultures and Field Populations of the Harmful Alga Aureococcus Anophagefferens: Tracking Nutritional Deficiency During Brown Tides. Environ. Microbiol. 16 (8), 2444–2457. doi: 10.1111/1462-2920.12374
Ziveri P., de Bernardi B., Baumann K. H., Stoll H. M., Mortyn P. G. (2007). Sinking of Coccolith Carbonate and Potential Contribution to Organic Carbon Ballasting in the Deep Ocean. Deep.-Sea0 Res. Part Ii-Top. Stud. Oceanogr. 54 (5-7), 659–675. doi: 10.1016/j.dsr2.2007.01.006
Keywords: global warming, phosphorus-limitation, Emiliania huxleyi, biological pump efficiency, molecular mechanisms
Citation: Wang C, Wang J, Li L, Wang Y and Lin S (2022) P-Limitation Promotes Carbon Accumulation and Sinking of Emiliania huxleyi Through Transcriptomic Reprogramming. Front. Mar. Sci. 9:860222. doi: 10.3389/fmars.2022.860222
Received: 22 January 2022; Accepted: 20 April 2022;
Published: 23 May 2022.
Edited by:
Gordon T. Taylor, Stony Brook University, United StatesReviewed by:
Michael William Lomas, Bigelow Laboratory for Ocean Sciences, United StatesJelena Godrijan, Rudjer Boskovic Institute, Croatia
Copyright © 2022 Wang, Wang, Li, Wang and Lin. This is an open-access article distributed under the terms of the Creative Commons Attribution License (CC BY). The use, distribution or reproduction in other forums is permitted, provided the original author(s) and the copyright owner(s) are credited and that the original publication in this journal is cited, in accordance with accepted academic practice. No use, distribution or reproduction is permitted which does not comply with these terms.
*Correspondence: Senjie Lin, c2VuamllLmxpbkB1Y29ubi5lZHU=