 Martina Mulas
 Jacob Silverman
 Tamar Guy-Haim
 Simona Noè
 Gil Rilov
- 1Israel Oceanographic and Limnological Research, National Institute of Oceanography, Haifa, Israel
- 2Department of Marine Biology, Leon H. Charney School of Marine Sciences, University of Haifa, Haifa, Israel
Ocean warming is a major threat to marine ecosystems, especially to species with a narrow thermal niche width and narrow biogeographic distribution, like some habitat-forming seaweeds. Declines of marine forests have been reported for several canopy-forming species in temperate regions, including the Mediterranean Sea, where they are dominated by species from the order Fucales, but most of the information on their ecology and status comes from the western basin. Here, we studied the thermal vulnerability and metabolic functioning of the endemic Gongolaria rayssiae located in fast-warming waters of the Israeli Mediterranean coast. We followed seasonal changes in phenology and ecology of G. rayssiae and its associated community during 2018-2020. Its highest biomass, density and thallus length were documented in spring-early summer (March-mid June). When seawater temperature exceeded 25°C, it shed its branches until February, when re-growth normally occurred. The thermal performance curve of G. rayssiae was determined by exposing it to 11 temperature levels in the range 15-35°C. The thermal optimum temperature for gross oxygen production, determined from the fitted curve, was 24.5°C. This relatively low thermal optimum suggests marked sensitivity to warming and supports the notion that G. rayssiae is a temperate relict species in the area. Additionally, we conducted seasonal ex-situ incubations during daytime and nighttime and recorded the highest primary productivity in spring, when it is at its peak of growth. In this season, its net inorganic carbon uptake was 42 ± 11 µmol C g dw-1 h-1 ( ± SD), while in its branchless form during late summer, it decreased six-fold. Due to the fast ocean warming conditions of the area, we hypothesize that the growth season of the species will shrink, and the species may eventually disappear. Finally, when exposed to high temperatures in natural and manipulative conditions, G. rayssiae exhibited a dramatic decline in its carbon sequestration rates with important implication for the carbon budget of the reef. This study highlights the importance of establishing a species phenology and environmental sensitivity (and especially that of endemic ones) in rapidly warming ecosystems, to estimate its potential fate due to climate change.
Introduction
Global climate change is a major threat to marine biodiversity (Hillebrand et al., 2012). Ocean warming triggers the redistribution of species and is of especially high risk to ecologically important endemic species with restricted distributions and relatively narrow thermal tolerance ranges (Pimm et al., 2014; Da Silva et al., 2019; Alfonso et al., 2021). Species with small distribution ranges face three possible future scenarios: (1) shifting their distribution to an optimal or sustainable thermal habitat, (2) adapting to the temperature change, or (3) undergoing decline and possibly extinction (Sunday et al., 2015). Macroalgae distribution, in particular, is strongly constrained by temperature (Breeman, 1990; Ji and Gao, 2021). However, there is a lack of knowledge on the impacts of ocean warming on narrow range endemic macroalgae and the consequences of their decline on the associated communities (Alfonso et al., 2021).
Brown macroalgae like kelps and fucoids are the main habitat-forming species on most temperate rocky shores (Wernberg and Filbee-Dexter, 2019). Recent studies showed they have indeed been strongly impacted by ocean warming (Smale et al., 2015; Pessarrodona et al., 2018; Teagle and Smale, 2018; Smale et al., 2020). In the fast warming Mediterranean Sea (Lejeusne et al., 2010), the most representative species forming underwater forests belong to the genera Cystoseira sensu lato and Sargassum (Ballesteros, 1992; Orellana et al., 2019). Such species provide structurally complex habitats, sustain complex food webs, maintain high biodiversity in coastal ecosystems (Steneck et al., 2002), and play a significant role in carbon turnover and sequestration (Duarte and Cebrián, 1996). Currently, many of these species are suffering extensive population declines worldwide, which have been attributed to local and global stressors in the context of global change (Mineur et al., 2015; Piazzi et al., 2017). Mediterranean rocky habitats, dominated by canopy-forming algae, have been recently classified as endangered in the European Red List of Habitats (Gubbay et al., 2009), and a severe depletion of erect algal cover could eventually lead to the creation of unproductive areas of low complexity, a transition considered catastrophic (Steneck et al., 2002; Airoldi et al., 2014).
Since the beginning of the 20th century, a large number of studies have been conducted on macrophyte communities that focused mostly on the Western Mediterranean basin (Serio et al., 2006; Mangialajo et al., 2008a; Ballesteros et al., 2009; Cormaci et al., 2012; Taşkin et al., 2012; Vergés et al., 2014; Thibaut et al., 2015; Mineur et al., 2015; Iveša et al., 2016; Mancuso et al., 2018; Valdazo et al., 2020; Medrano et al., 2020; Orlando-bonaca et al., 2021). In contrast, information on distribution, dynamics, and ecology of these forests in the Eastern basin and specifically in the Levantine Sea, is scarce. This region is the warmest in the entire Mediterranean Sea and one of the fastest warming regions globally. Where, it has been estimated that Levantine Surface Water have warmed at a rate of +1.2 ± 0.2°C per decade during the period 1978-2014 (Ozer et al., 2016). Therefore, it is very likely that the responses of seaweeds to global change will occur within a much shorter time frame in the Levantine.
In the Southeastern Levantine Coast (Israel) in particular, there are very few habitat-forming species belonging to the Fucales order. In this study, we focused on the endemic Gongolaria rayssiae (Ramon) Molinari & Guiry, a species with a very narrow distribution, that is only known, so far, from the Israeli and Lebanese coasts (Ramon, 2000; Einav and Israel, 2008; Badreddine et al., 2018; Mulas et al., 2020). Preliminary work showed that G. rayssiae, like most species of the same genus, undergoes an annual thallus loss when the fronds break at the base (Buonomo et al., 2017; Mulas et al., 2020). Unlike other congeneric species, the thallus loss of G. rayssiae appears to occur in the middle/end of June (early summer), hinting at its thermal sensitivity. In this context, ocean warming might act as a considerable stress factor on the phenology of this species, coupled with overgrazing pressure by invasive rabbitfish (Rilov et al., 2018). We hypothesize that the seasonal changes in algal phenology are primarily driven by temperature. Information on the species thermal performance as well as seasonality in its growth could help to predict its potential sensitivity to future ocean warming and its annual contribution to the potential blue carbon. Hence, to assess the thermal vulnerability of this highly threatened endemic species to global change and to evaluate its ecological role in terms of ecosystem functions and services, we: (1) describe G. rayssiae’s seasonal phenology; (2) quantify its seasonal metabolic rates and annual production; (3) define its thermal performance pattern.
Materials and methods
Study site and abiotic parameters
Our study area was Tel Shikmona in Haifa (32°49’29.77’’N, 34°57’18.93’’E) (site name ‘SK1’), where the largest known shallow (1.5–2 meters deep) and dense G. rayssiae’s forest exists along the Israeli Mediterranean coast (Supplementary Figure S1). Based on the local synoptic definition of the seasons for the Eastern Mediterranean Sea, we applied the seasonal clustering as explained in Mulas et al. (2022). Since the seasonal thallus loss in G. rayssiae appears to occur in the early summer, while in other congeneric species it is known to occur at the end of the summer season (Buonomo et al., 2017), we decided to divide the summer into ‘early Summer’ and ‘mid-Summer’ considering that in June (‘early Summer’) G. rayssiae still has branches, while in mid-Summer (July–September) it shifts to the branchless habitus. Temperature in the area was monitored hourly using Onset Hobo loggers deployed at ca. 1m depth. In addition, ambient nutrient levels were obtained from the monthly measurements of Nitrate+Nitrite (NOx) and soluble reactive phosphate (SRP) in the study site conducted by the national monitoring program. Finally, Global Radiation (GR) data was collected at 20-min intervals on the rooftop of the nearby IOLR building.
Phenological changes in density, length and cover
To quantify seasonal patterns of this macroalga, from January 2018 to June 2020, we marked ten 50x50cm2 quadrats, 2–3 meters apart from one another and deployed in a circle. The quadrats were visited monthly by SCUBA or snorkeling to measure the density of thalli per m2 (Reynes et al., 2021), their individual lengths (Åberg, 1990) and to take photos for percent cover analysis. Photoquadrats were processed in CoralNet®, a repository and online annotation tool for benthic survey images (Beijbom et al., 2015), which allowed us to quantify the monthly percent cover of G. rayssiae.
Initially, we marked five individuals within each quadrat in order to follow them throughout the years, but due to wave action and/or human impacts such as fishing, the tags were soon lost. We decided to continue following the quadrats and counting the number of individuals in each quadrat to have monthly density data for the whole of 2019 (except October due to sea conditions). The population dynamics was described considering the specimens spotted within the quadrats and by measuring the maximum thallus length directly in the field with a ruler (from the holdfast to the top of the longest branchlet) (Medrano et al., 2020; Valdazo et al., 2020; Reynes et al., 2021). Population size structure was defined with the characterization of six different size classes as follows: 1 ≤ 5, 2 = 5.1–10, 3 = 10.1–15, 4 = 15.1–20, 5 = 20.1–25, and 6 ≥ 25 cm (Åberg, 1990; Valdazo et al., 2020), separated by season and year.
Biomass-based annual production estimation
In order to assess annual production of the seaweed, we first performed allometric measurements. For that, during the monitoring period (2018-2020), we collected a total of 130 specimens, in a bimonthly frequency. Each of these individuals was photographed and the images were processed with ImageJ v.2.0.0 (Schneider et al., 2012) to measure the total thallus length. Subsequently, fresh (‘WW’) and dry (‘DW’) weights were measured after blotting and after 48h or until weight stabilization at 60°C, respectively.
When seaweeds grow, the increase in length is coupled with the augmentation in width and thickness, expressed by a non-linear relationship such as the power-scaling formula:
Where W represents the weight expressed in g, L stands for the length expressed in cm, and a and b are constants. Non-linear data in unit space can be transformed into linear relationships (which are easier to handle) in a logarithmic space, leading to a linear regression expressed by:
The two equations are thus interchangeable in the calculation of the antilog of the intercept (10-a = a), while b remains the same (Warton et al., 2006). These results allowed us to convert the measurements from the field into biomass and validated it with other samples. Finally, to choose the best model between the two, we used the minimum Akaike information criterion (AIC) and the maximum determination coefficient (R2), for both the allometric relationships between wet weight and length, and dry weight and length.
To quantify the seaweed standing stock, we calculated the annual biomass production of the studied forest. The mean density data per m2 measured in the fixed quadrats was multiplied by the average length recorded within the same quadrats, then this value was converted into biomass with the allometric equation and finally transformed into C standing stock according to the conversion factor (0.34) introduced by Ballesteros (1990a). The validation of the biomass obtained from length and density was conducted on direct measurements of biomass samples collected in 2020. Once per season, the biomass of five random 25x25cm quadrats (this size is considered above the minimum suggested sampling area considering the Mediterranean littoral assemblages by Ballesteros (1992)) was scraped off, and directly weighted in the lab according to the procedure previously explained. Finally, we tested which environmental variables, including temperature, GR, NOx and SRP explained best the length and fresh weight data.
Metabolic rates and annual production of G. rayssiae
To measure the metabolic functionality of the seaweed, between early summer (June) 2020 and spring (April) 2021, each season we collected five whole specimens of G. rayssiae to investigate the primary productivity and its role in carbon sequestration. After collection, algae were transferred to the outdoor water table of the IOLR and placed inside aquaria supplied by fresh running seawater from the same site under natural irradiance. We proceeded with the removal of epiphytic organisms, and after a few hours of acclimation, we incubated the algae in glass-jars with filtered seawater maintained at constant temperature in the water table with free running water. Prior to the incubation, each specimen was weighted and photographed, subsequently placed in the jars (0.75 L) and incubated for ~ 1–2 hours, at the peak of the light (11am–2pm) and at least one hour after sunset (7pm–11pm) (the time varied according to the sunset time) with light measurement conducted by a LI-193 Spherical Underwater Quantum Sensor (LI-COR Bioscience, Lincoln, USA). Irradiance in the water table was similar to the light intensity measured at the depth from which the specimens were collected and followed the natural photoperiodicity (500 µmol photons·m-2·s-1 in summer, 330 µmol photons·m-2·s-1 in fall, 300 µmol photons·m-2·s-1 in winter and 500 µmol photons·m-2·s-1 in spring). In both daytime and nighttime incubations, seawater controls (without algae) were included.
In order to maintain a constant temperature in the incubation jars during the incubation period, these jars were positioned within a plastic transparent bath receiving continuous fresh running seawater with high exchange rates. Boundary layer effects at the beginning and end of the incubations were avoided by stirring the water in the jar with the oxygen probe until the readings stabilized, before recording the measurements. Water samples for lab analysis were taken after the oxygen measurements were recorded.
Dissolved oxygen was measured at the beginning and at the end of each incubation with a hand-held optode WTW 3420 (DO expressed as mg/L corrected for salinity). Additionally, we collected water samples for subsequent spectrophotometric measurements of pH (total hydrogen scale at T = 25°C), total alkalinity (TA) and dissolved inorganic carbon (DIC) in the lab. Water samples were filtered through 0.45 mm syringe into 120 mL brown glass bottles with screw caps and kept refrigerated at 4°C. TA was determined by a potentiometric Gran titration of ca. 22 mg subsamples, using a Metrohm Titrino 785 Titrameter with a temperature corrected pH probe. The calculation of TA from acid volume and pH measurements used the method described by Sass and Ben-Yaakov (1977) and calibrated using CRMs from the Dickson Lab (Scripps Institution of Oceanography, USA) with a precision of ~ ± 2 mmol/kg (2 internal replicates per samples). The pH was measured with a CONTROS HydroFIA® spectrophotometric thermally controlled system by injecting a known volume of m-Cresol purple dye to a known volume of water sample. The pH values were determined by means of VIS absorption spectrometry at 25°C temperature and set salinity (~39). DIC values were obtained by acidifying water with phosphoric acid (H3PO4, 10%) using a custom automated CO2 extractor and delivery system (AERICA by MARIANDA) and high grade off N2 (99.999%) as a carrier gas connected online with a LiCor 7000 IR CO2 gas analyzer calibrated using CRMs with a repeatability of the measurements equals to 2.1 ± 2 mmol/kg. To accelerate the process, after some direct measurements, the DIC values were extracted with the program CO2SYS2 (Robbins et al., 2010) from TA and pH with a percentage error of ± 0.3%. We assumed that the measured changes in TA were caused by carbonate uptake/production (precipitation/dissolution of CaCO3) resulting in a 2:1 (ΔTA/ΔDIC=2/1) change in DIC. Thus, ΔDIC related to organic production was calculated taking into account the change in total DIC minus the change in DIC resulting from TA/2 uptake/production or ΔDICorg = ΔDICtot – ΔTA/2. Gross primary production (GPP), respiration (R) and net production (NP) both in terms of DO and DIC were calculated as well as calcification/dissolution rates from the initial and final values in each incubation jar during the day and nighttime and then converted into diel and annual metabolic rates (for the equations see Guy-Haim et al., 2016). All these rates were expressed per grams of dry weight based on the seasonal conversion factors for WW : DW (Mulas et al., 2022).
Thermal performance curve
To determine the thermal vulnerability of the seaweed in April 2013, an experiment was conducted to obtain the thermal performance curve (following Angilletta, 2006), which was used to derive the optimal temperatures for photosynthesis and respiration of G. rayssiae. The experiment was carried out towards the peak of its seasonal production, as observed in the field, and therefore the algae were in healthy condition (Savva et al., 2018). About 40 algae specimens were collected at 1m depth from the same algal forest in Tel Shikmona, transferred to the lab, rinsed, and cleaned from epiphytes. Out of the 40, thirty-three marked fragments (Staehr and Wernberg, 2009; Wernberg et al., 2016; Savva et al., 2018) were selected, photographed, and weighted. Subsequently, each fragment was assigned to a 1L glass jar that was submerged in the experimental thermobath units (n=3 jars per unit) of an outdoor microcosm. This is a custom-made closed system consisting of 11 thermobath tanks where temperature can be manipulated and independently controlled (NOVUS N1020, ± 0.4°C) (see details in Guy-Haim et al., 2016). The average daytime irradiance level during the thermal performance curve experiment was ca. 450 µmol photons·m-2·s-1. Every 36–48h we manually replaced the seawater inside the jars with beforehand warmed or cooled seawater according to the treatment level to reduce stress. After the acclimation time at 19°C ambient temperature for 10 days, the water temperatures in each thermal unit were increased or decreased to the target temperature at a rate of 2°C per day, reaching all target temperatures within 12 days. During the experiment, photosynthetic performances were measured through short incubations of 1–2 hours during the daytime (at local noon) and nighttime (one hour after sunset) by measuring dissolved oxygen (DO) with a hand-held optode WTW 3420. The incubations were performed 10 days after reaching the target temperatures. The rates were normalized for biomass dry weight and plotted against the temperatures. Thermal performance curves for net oxygen production during the daytime (NP), nighttime respiration (R) and daytime gross photosynthesis (GPP=NP+R) were determined by fitting the best model out of all the 24 biologically plausible functions describing the relationship between temperature (T) and performance (P) included in the rTPC’ R package (Padfield et al., 2021). The best fitting model was chosen based on the lowest Akaike’s Information Criterion (AIC). The optimal performance temperature (TOPT), the minimum (CTMIN) and the maximum critical temperature (CTMAX) were also included in the output of the chosen model. To visualize the uncertainties and produce confidence intervals of estimated parameters, bootstrapping weighted non-linear least squares was applied to calculate 95% confidence intervals (CIs) (Padfield et al., 2021).
Statistical analysis
Statistical analyses were performed with RStudio version 3.6.3 (RStudio Team, 2020) using the packages ’ggplot2’ (Wickham, 2016), ‘vegan’ (Oksanen et al., 2020) and ‘car’ (Fox and Weisberg, 2019). The data collected in the fixed quadrats were analyzed with One-way Repeated ANOVA for each year and the seasons between the years. Whenever the assumptions were violated, the analysis was performed on untransformed data and results were considered robust if not significant at p > 0.05 or significant at p < 0.01, to compensate for the increased probability of Type 1 error (Underwood, 1997).
A one-way ANOVA was run to test differences in seasonal biomass and seasonal percent cover after testing for the homogeneity of variance (Levene’s test) and normality (Shapiro-Wilk’s test).
The allometric ratio between length and dry weight was obtained with the packages ‘smatr’ (Warton et al., 2012) and ‘lmodel2’ (Legendre, 2001) and performed as standardized major axis regression in R version 3.6.3 (RStudio Team, 2020).
The relative contribution of the environmental variables (T, GR, SRP and NOx) to length and fresh weight of the seaweed was tested using JMP Pro v. 16.1.0 (SAS Institute Inc., Cary, North Carolina, USA) by fitting standard least squares.
Metabolic rates for the single species were investigated by One-way ANOVA and Tukey HSD post-hoc test or by the corresponding non-parametric Kruskal-Wallis test followed by Dunn’s test whenever a violation of the assumptions was detected.
Results
Phenological changes in density, length and cover
During the field study period, the temperature varied from a maximum of 31.3°C, recorded in summer 2018, to a minimum of 14.5°C in winter 2019, with a general average temperature in the peak of summer (August) and winter (February), 30.2 ± 0.1°C and 18.3 ± 0.5°C (mean ± SD), respectively (Supplementary Figure S2; Supplementary Table S1). The highest seaweed density was recorded from March to June (spring and early summer) and varied between 22 ± 14 to 26 ± 17 individuals/m2 (± SD), and then decreased to 6 ± 5 specimens/m2 (± SD) in January, with significant differences in terms of density between months (One-way Repeated ANOVA, F (10, 10) = 5.55, p = 0.006, η2g= 0.85) (Figure 1A).
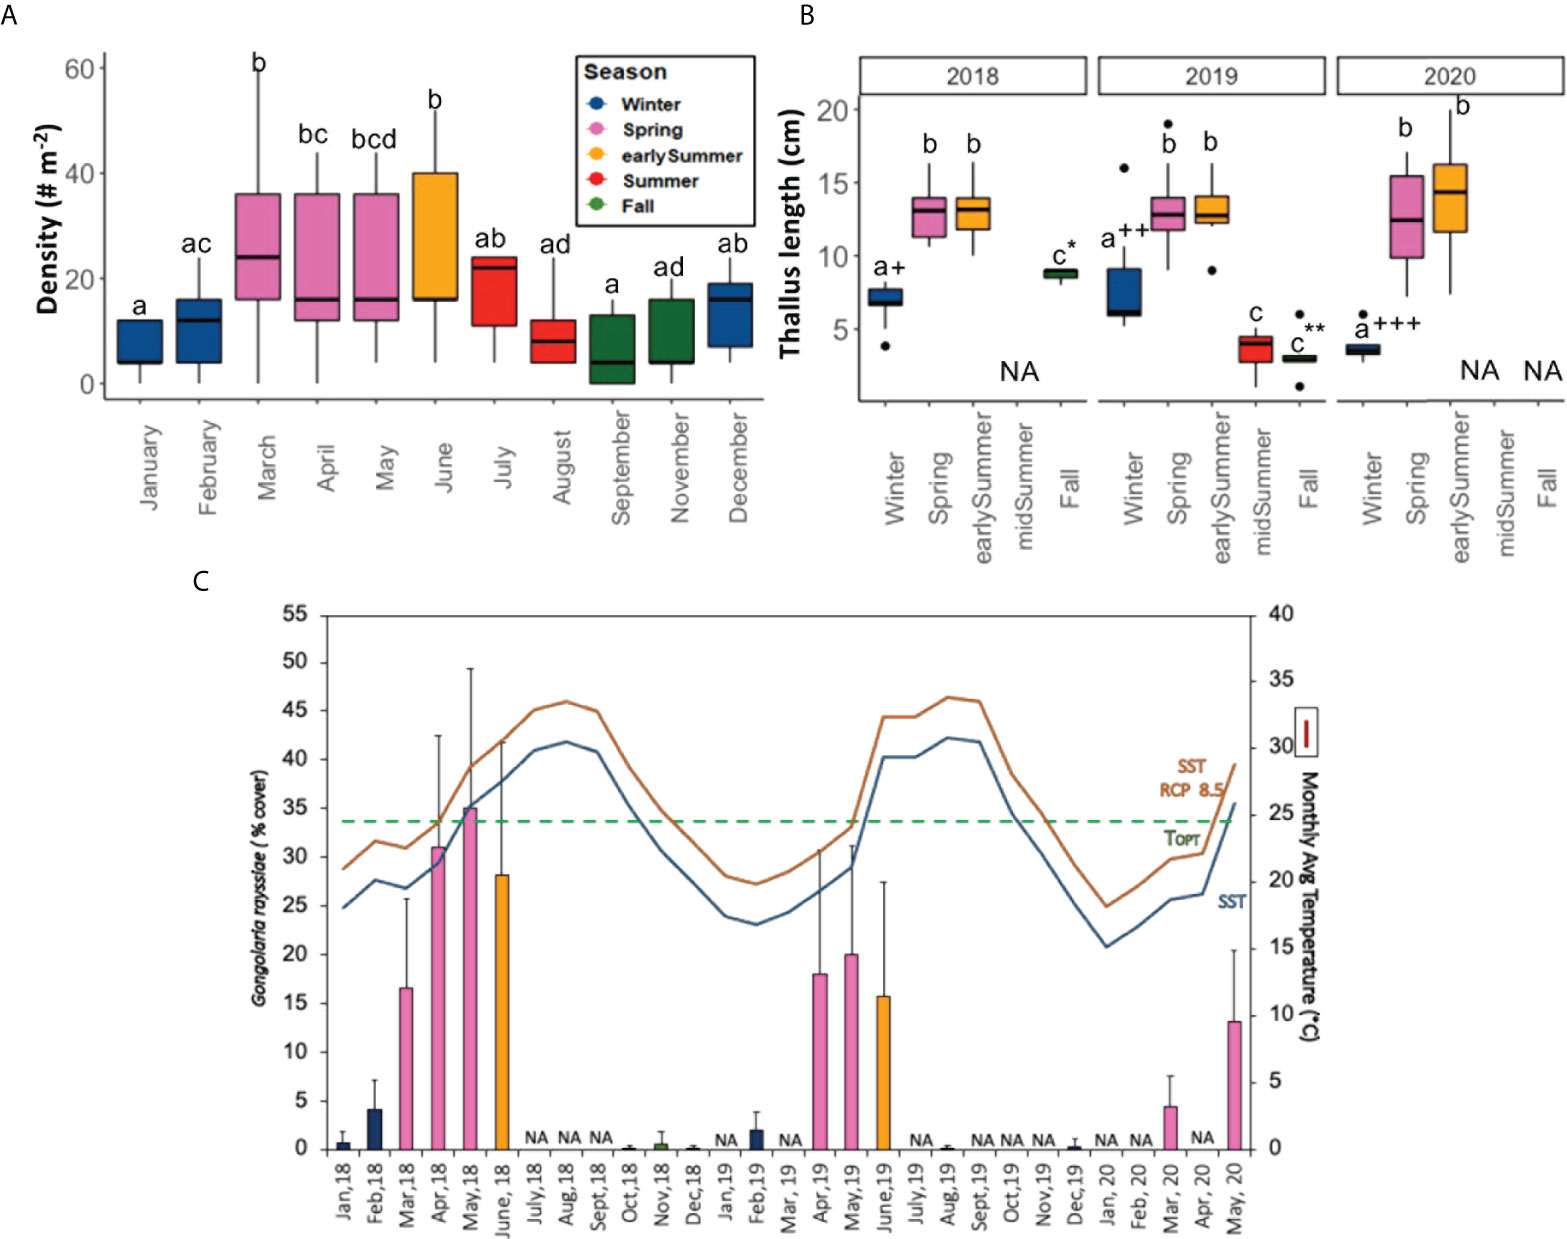
Figure 1 Temporal dynamics of Gongolaria rayssiae in the Tel-Shimona site during the period 2018–2020, based on the permanent quadrats (50x50 cm2) seasonally visited throughout the entire period and monthly during 2019: (A) Density of individual plants per m2 recorded in 2019 ( ± SD); (B) Seasonal maximum thallus length (cm ± SD) throughout the study period; (C) Monthly percentage cover ( ± SD) over three years (January 2018-May 2020). Temperature is plotted with a blue line, while the orange one is the RCP 8.5 (3°C higher than today); dashed green line indicates G.rayssiae’s TOPT. Significant differences within the same year are reported with different letters, while symbols represent comparisons between same season in different years (p < 0.05) (n= 5–9). NA = not available data.
During the three years of the study, some of the quadrats were not found in some of the seasonal samplings, therefore the number of replicates (n) reported in the caption of Figure 1 ranges between 5 and 9. Along this period, we measured 499 G. rayssiae individuals in the fixed quadrats, and the longest thallus length (27 cm) was recorded in May 2020, during the peak of the growth season. The class size frequency distribution showed strong seasonality with prevalence of the small class size (mostly cauloids) in fall and winter, and intermediate and large fully branched classes in spring and early summer (Figure 1B, Supplementary Figure S3). There were some inter-annual differences within seasons but only during the branchless seasons of winter and fall (e.g., size in winter 2020 was almost three-fold smaller than in winter 2019 and two-fold in winter 2018). Percent cover was the lowest in fall and mid-summer followed by winter, and highest in spring and early summer (p < 0.05). Spring and early summer cover decreased from an average of nearly 40% in 2018 to around 10% in 2020 (Figure 1C).
When considering the 25x25cm quadrats, the highest biomass of G. rayssiae was recorded in the early summer (June, 266.13 ± 103.86 g dw per m2 ((± SD)), while the lowest was in fall (101.9 ± 40.8 g dw per m2 (± SD); early summer vs. fall and vs. winter F (4, 20) = 4.387, p = 0.01, Figure 2A). Percentage cover was the highest in spring [30 ± 9.1% (± SD)], followed by early summer (24.5 ± 11.7% ( ± SD)) and was lowest in fall (2.2 ± 1.8% ( ± SD)) (H (4) = 16.604, p = 0.002, Figure 2B).
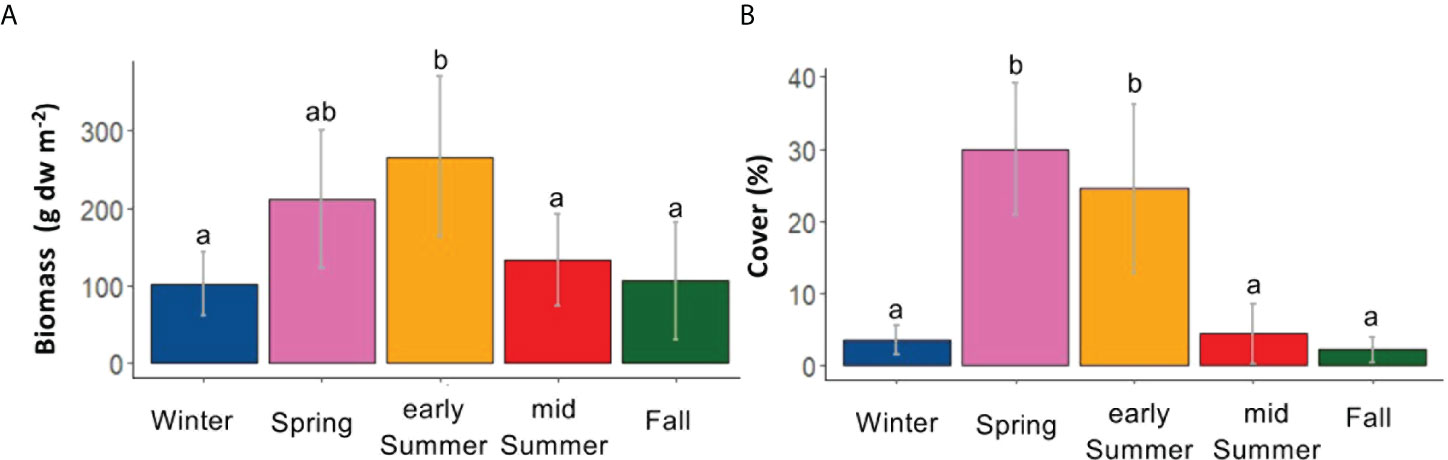
Figure 2 Barplots of the seasonal variability in terms of (A) biomass (g dw m-2 ± SD) and (B) cover (% ± SD) of Gongolaria rayssiae. Letters represent statistical differences between the seasons.
Annual production
Based on density, length and allometric relationships between wet weight and length and between dry weight and length (with linear regression after log-transformation), we assessed the annual production (biomass) of G. rayssiae in the study area. The AIC and R2 identified linear models as the best fitting in both allometric relationships (Supplementary Figure S4 and Supplementary Table S2). The calculated mean biomass annual production was 217.2 g dw m-2 y-1. When converted into g C m-2 y-1 using the conversion factor of 0.34 (Ballesteros, 1990a), the value was 73.8 g C m-2 y-1 (Table 1).
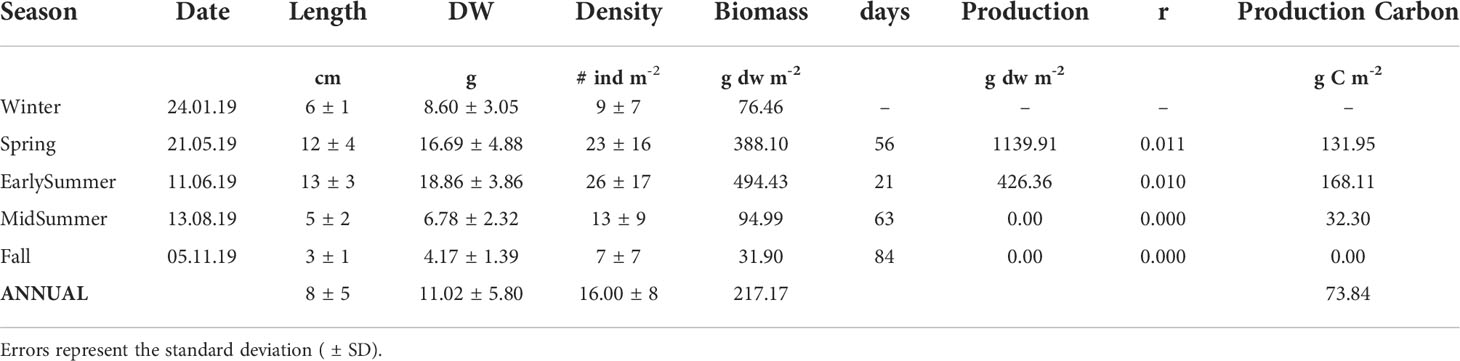
Table 1 Seasonal and annual production estimation of biomass (g dw/m2) and carbon (g C/m2) and daily biomass turnover (r) estimated by the formula by Cebrian and Ballesteros (2012).
The standard least squares analysis identified global radiation (GR) as the best explanatory variable positively correlating with the length and fresh weight of the macroalgae (Supplementary Tables S3, S4). For length, temperature followed GR (Supplementary Figure S5, Supplementary Table S3), (negative correlation), while for fresh weight phosphate (SRP) (positive) followed GR, and then temperature (negative correlation) (Supplementary Figure S6, Supplementary Table S4).
Metabolic rates of G. rayssiae
Seasonal ambient conditions of the seawater chemistry during the daytime and nighttime incubations are reported in the Supplementary Material (Supplementary Table S5). Net photosynthetic production was the highest in spring (38.98 ± 13.59 µmol O2 g dw-1 h-1 ( ± SD)), and the lowest in fall (3.72 ± 2.22 µmol O2 g dw-1 h-1 ( ± SD)). Significant differences were found between fall and spring, and early summer and spring vs. mid-summer (H (4) = 20.82, p = 3.4e-4, Figure 3A). Similar trends were obtained in net production calculated from changes in DIC: the highest values (-42.48 ± 11.50 µmol C g dw-1 h-1 (± SD)) were recorded in spring and the lowest (-7.73 ± 1.91 µmol C g dw-1 h-1 ( ± SD)) in fall (F (4, 18) = 15.76, p = 1.05e-5, Figure 3B). The highest nighttime respiration rates in terms of DO (R(DO)) was recorded in spring (-5.52 ± 0.81 µmol O2 g dw-1 h-1 ( ± SD)), being almost five-fold the winter one (-1.50 ± 0.39 µmol O2 g dw-1 h-1 ( ± SD)). Significant differences were obtained between early summer vs. winter and fall, spring vs. fall, mid-summer and winter, and winter vs. mid-summer (F (4,19) = 46.62, p = 1.44e-9, Figure 4A). Nighttime in terms of DIC (R(DIC)) showed differences between mid-summer vs. spring and winter (F (4,19) = 6.22, p = 2.25e-3) (Figures 3A, B). Gross primary production (GPP), measured for both DO and DIC, was the highest in spring. GPP(DO) in fall was almost seven-fold lower than in spring and ca. three times than in early summer (H (4) = 20.71, p = 3.62e-4), while GPP(DIC) was the highest in spring, respectively almost four and three times the rates recorded in fall and winter (F (4,17) = 11.06, p = 1.32e-4).
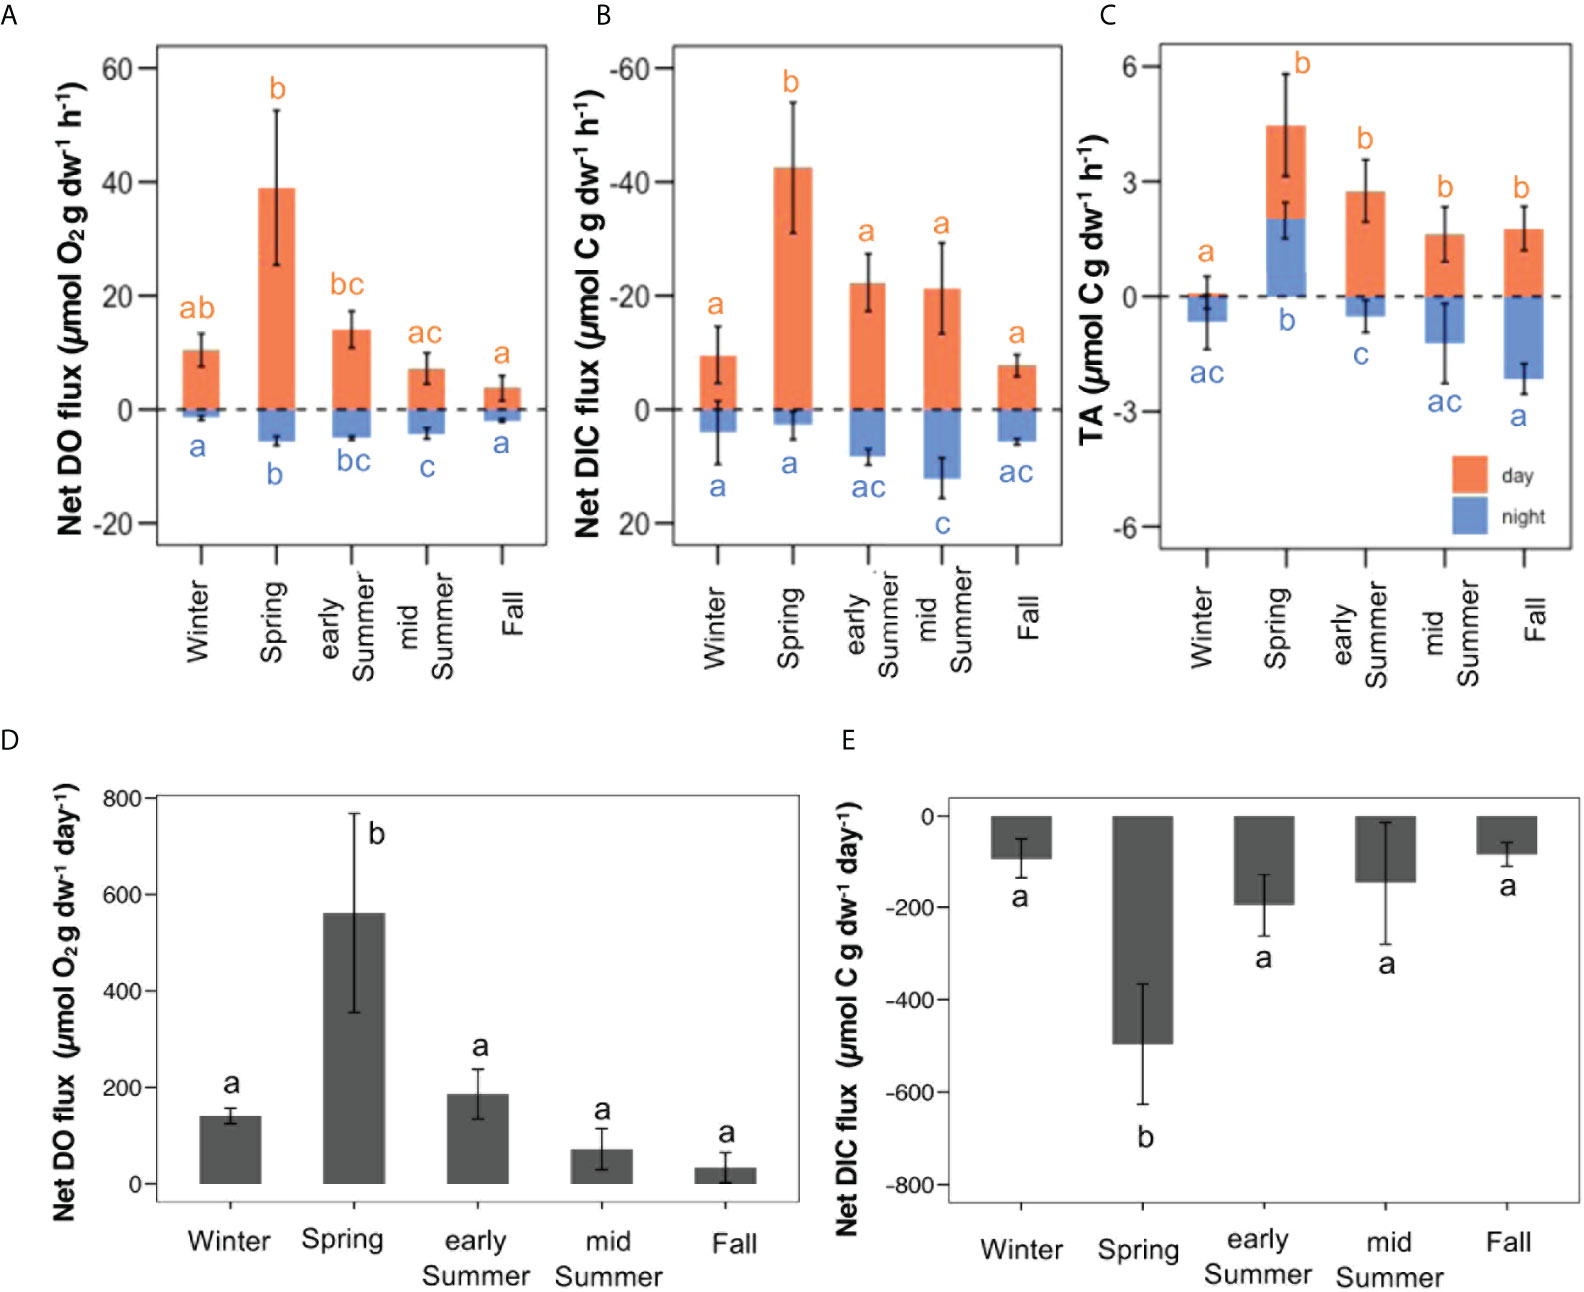
Figure 3 Seasonal metabolic rates measured in laboratory daytime (orange bars) and nighttime (blue bars) incubations, and corresponding diel DO and DIC fluxes calculated from the measured rates. (A) Measured net hourly rates of dissolved oxygen production (positive values indicate net photosynthesis and negative values indicate respiration); (B) Measured net hourly rates of dissolved inorganic carbon (DIC) production (negative values indicate net photosynthesis and positive values indicate respiration); (C) Measured net hourly rates of total alkalinity (TA) production; (D) Calculated average diel rates of oxygen production; (E) Calculated average diel rates of DIC production. All the error bars represent standard deviation (± SD). Letters represent statistical differences between the seasons.
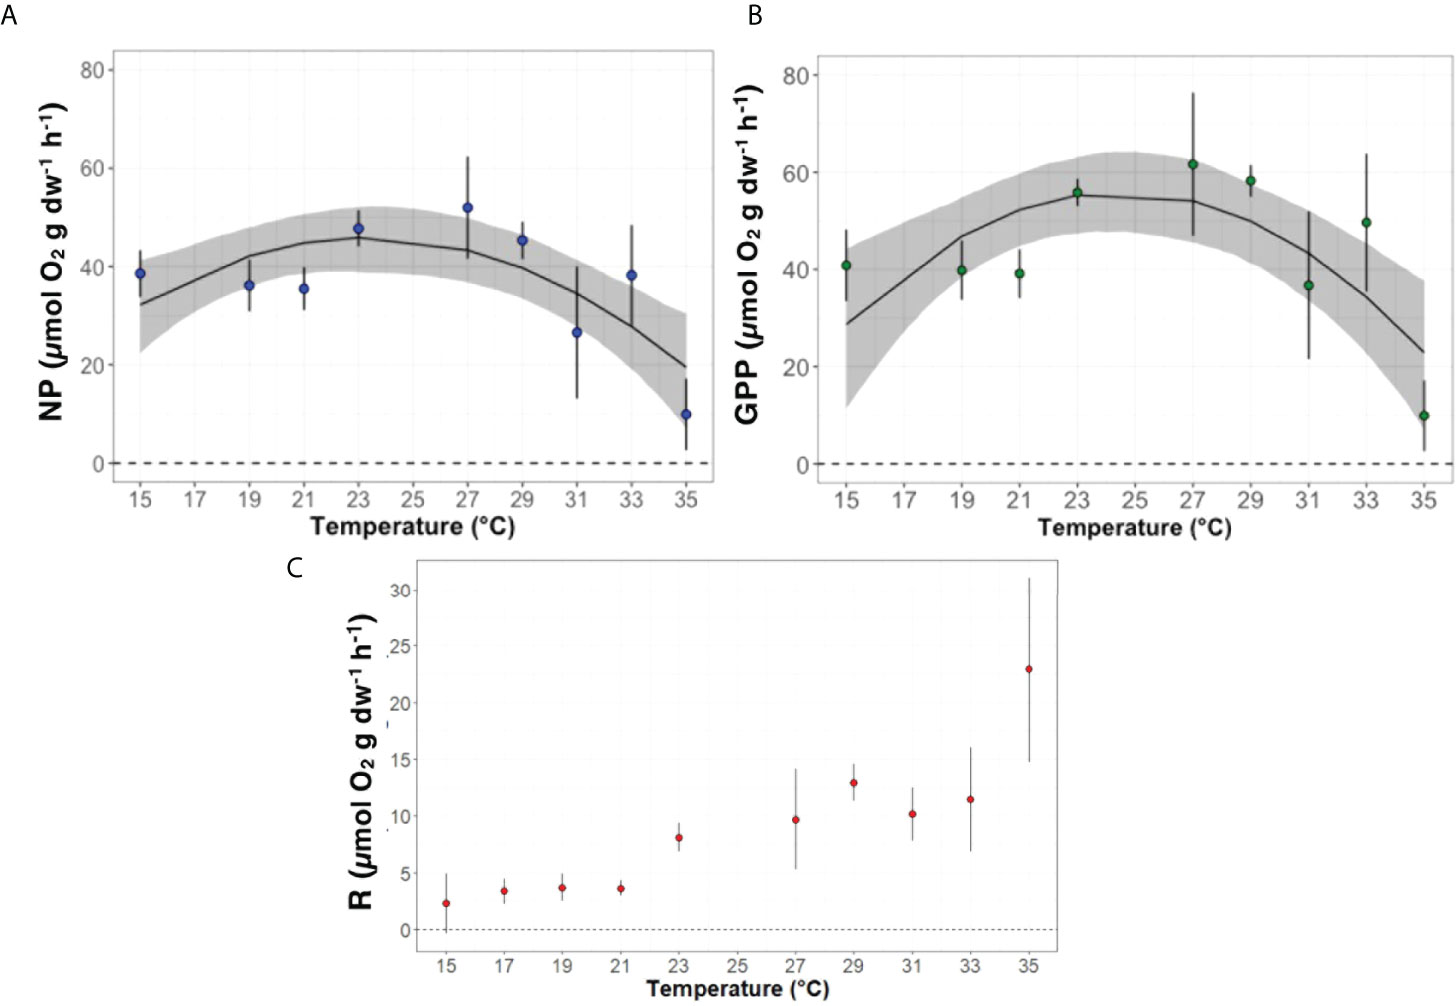
Figure 4 Experimental fitted thermal performance curves (TPC) of (A) gross (GPP), (B) net primary production (NP) and (C) respiration (R) along a thermal gradient from 15 to 35°C. Blue, green and red dots represent the mean values and the grey curve represent the 95% Confidence Interval.
Seasonal diel fluctuations of oxygen and carbon budgets of G. rayssiae were evident, spring had the highest values, while fall the lowest (561.75 ± 206.29 µmol O2 g dw-1 day-1 and 33.41 ± 31.58 µmol O2 g dw-1 day-1, and -570.90 ± 154.61 µmol C g dw-1 day-1 and -119.48 ± 28.33 µmol C g dw-1 day-1 ( ± SD), respectively for O2 and DIC, F (4,18) = 20.55, p = 1.63e-6; F (4,17) = 15.59, p = 1.58e-5; Figures 3D,E). Accordingly, when we calculated diel oxygen and diel DIC fluctuation in spring and were always significantly different from the other seasons (Figures 3D,E). Annual oxygen production and carbon sequestration rates, respectively 24.20 mmol O2 g dw-1 y-1 and 24.98 mmol C g dw-1 y-1, reported an overall photosynthetic quotient (PQ) of ~1. When G. rayssiae was in its frondose habitus in spring (T (°C) = 21.94 ± 2.56 ( ± SD)) and early summer (T (°C) = 27.16 ± 1.06 ( ± SD)).
Changes in total alkalinity (TA) between the initial and final value for each incubation, displayed general low levels of uptake and production, particularly during daytime when we recorded positive differences, indicating net production of TA. During the day, the lowest value was recorded in winter (essentially equal to zero), significantly different from all the other seasons (F (4, 20) = 11.64, p = 4.80-5). During the night, we measured net production of TA in all seasons except for spring when net alkalinity uptake occurred; spring differed from all the seasons, and early summer differed from fall (F (4,20) = 21.18, p = 5.87e-7) (Figure 3C).
Thermal performance curve
Gross and net primary production of G. rayssiae showed a typical quadratic distribution produced by the ‘quadratic_2008’ fitting model (Montagnes et al., 2008; Padfield et al., 2021) (Figure 4, Table 2). This model is defined as
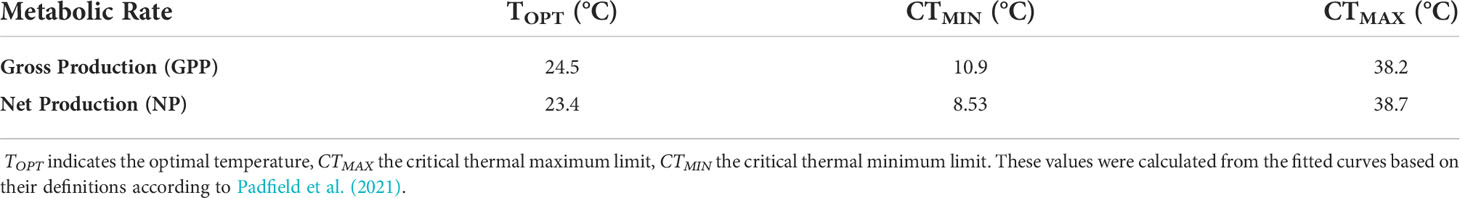
Table 2 Parameters associated with thermal performance curve for gross primary production (GPP) and net production (NP).
where T is the temperature (°C), a is a parameter that defines the rate at 0 °C and b and c are shape parameters without any biological meaning. Gross (Figure 4A) and net (Figure 4B) metabolic rates showed optimum performances respectively at 24.5 and 23.4°C inferring a higher sensitivity of G. rayssiae to small changes of temperature exceeding its optimum value in the net primary productivity. Unlike photosynthesis, respiration rates increased exponentially with warming (AIC =156.19, R2 = 0.66; Figure 4C, Supplementary Figure S7). However, when we removed the data recorded at 35°C (when necrosis was recorded in the algae), the slight decrease of the curve resulted in 30.6°C as optimum temperature with ‘gaussian_1987’ (Lynch and Wilfried, 1987) as the best fitting model (Supplementary Figure S7A). The Gaussian model is defined as
where T is the temperature (°C), rmax is the maximum rate at optimum temperature, Topt is the optimum temperature (°C) and a is a parameter related to the full curve width.
Considering together the respiration and net primary production data that were recorded at 35°C, we noticed a very high increase in respiration, which we attributed to microbial respiratory activity as G. rayssiae was already in a state of necrosis. Therefore, in the graphical representation of the gross primary productivity, the value recorded at 35°C refers only to the net production without considering respiratory activity (Figure 4A).
Discussion
Phenological and ecological features
The genus Cystoseira s.l., belonging to the order Fucales, has been compared to kelp forests and seagrass meadows in terms of Blue Carbon importance and as habitat-forming species (Steneck et al., 2002). On the Levantine coast, the endemic G. rayssiae exhibits a maximum biomass, cover, density and thallus length in spring/early summer. Currently, around mid-June, when seawater temperatures pass ca. 25°C, G. rayssiae rapidly degrades and loses its branches until new ones start growing in late February/beginning of March. During this season, seawater temperature reaches its lowest (ca. 17-18°C), suggesting that this coldest temperature is the trigger for branching. Occasionally, during the fall, when rapid cold snaps occur under unique synoptic conditions shallow water temperatures can drop by as much as 6°C and go back to normal levels shortly after the winds subside (Zamir et al., 2018). During this rapid cooling, branching can be trigger branching several weeks earlier (Guy-Haim, unpublished data). Studies conducted on other Cystoseira s.l. species in the Western Mediterranean Sea, report similar phenological shifts, although the branch loss is recorded only at the end of the summer (Feldmann, 1937; Ballesteros, 1992; Buonomo et al., 2017). Albeit reproductive development stage data were not quantitatively investigated, qualitative observations indicated that this species starts to become fertile in March (Mulas personal observations) in accordance with the increasing number of individuals per m2 recorded later in spring, which may indicate recruitment. The standard least squares models showed that GR was the main variable positively driving the growth of G. rayssiae, followed by temperature (overall affecting negatively) and least was nutrients (only SRP).
The annual biomass of G. rayssiae was estimated to range between 162.4 and 216.9 g dw m-2 y-1 (the range between the direct measurements and biomass-based values). The differences between these values could be explained, considering that the biomass-based one does not take into account the loss of biomass due to grazing and extreme event pressures together with resource allocation investment and exudation. Values known from other congeneric species such as Ericaria crinita (1230 g dw m-2 y-1) (Sales and Ballesteros, 2012), Ericaria brachycarpa (previously known as Cystoseira caespitosa) (630 g dw m-2 y-1) (Ballesteros, 1990a), Ericaria mediterranea (2600 g dw m-2 y-1) (Ballesteros, 1988), Ericaria zosteroides (70 g dw m-2 y-1) (Ballesteros, 1990b) place G. rayssiae at the lowest range of biomass of this group. This may be related to different environmental adaptations to nutrient availability (G. rayssiae grows in an ultraoligotrophic region), temperature, light intensity, and wave action, all having a strong influence on their growth and primary productivity (Ballesteros, 1989). Indeed, our findings confirmed the importance of global radiation, phosphate, and temperature as drivers of G. rayssiae’s growth, as obtained in other studies of congeneric species (Valdazo et al., 2020).
Metabolic rates and annual production of G. rayssiae
G. rayssiae’s role as a potent carbon sink is highly seasonal. During its branchless period (normally from July to February), it shows very low production and biomass. Metabolic rate measurements were expressed in grams of dry weight per hour, suggesting that the perennial part is not very productive, especially when compared to the branches, which represent the bulk of biomass in spring/early summer. This species is non-calcifying, therefore the apparent production and uptake of TA might be attributed to the remains of calcareous epiphytes left on the thalli after cleaning, as foraminifera are especially abundant on G. rayssiae (Gruber et al., 2007). Furthermore, CaCO3 may have deposited chemically on the surface of the algae or intracellularly during light incubation, while during dark incubations, CaCO3 probably dissolved due to increase levels of CO2 and reduced pH near the surface of the algae and intracellularly. Finally, while very unlikely considering the relatively large changes in total alkalinity, the uptake and/or production of nitrate/ammonium could have also affected the alkalinity in our incubations.
Conversion of direct biomass measurements to annual carbon budget during 2020 resulted in 55.2 g C m-2 y-1, very similar to the average net production 48.7 g C m-2 y-1 measured in the jar incubations (2020–2021) and converted to surface area, validating the effectiveness of productivity estimation on biomass-based data.
Thermal vulnerability
The thermal performance curves of G. rayssiae for gross and net primary production indicated slightly different optimal temperatures at 24.5°C and 23.4°C, respectively. These temperatures occur during May-June (spring/early summer) in the study area (23.4 ± 3.3°C). This is also the period when we recorded the highest biomass and photosynthetic activity. The degree shift in the GPP from NP optimal temperature arise from the increase of respiration with temperatures without reaching a clear optimum (Collier et al., 2017; Piñeiro-Corbeira et al., 2018). The respiration rates we measured exponentially increased with the temperature as it was shown in other seaweed species (Piñeiro-Corbeira et al., 2018; Díaz-acosta et al., 2021) and it could indicate a possible shift towards heterotrophic metabolism (Brown et al., 2004; Bennett et al., 2022b). Studies conducted on other representatives of the order Fucales showed marked signs of tissue necrosis at higher temperatures (Flukes et al., 2015; Graiff et al., 2015; Urrea-Victoria et al., 2020). Similarly, the high respiration rate we recorded at 35°C (Figure 4C) is likely to be the result of microbial community activity associated to the decaying seaweed, as indicated by G. rayssiae’s discoloration, tissue necrosis and deterioration at these higher temperatures (Supplementary Figure S8).
Calculated CTMIN were 10.9°C and 8.5°C in the gross and net production analysis, respectively, and these findings support the notion that G. rayssiae is a temperate relict species in the area (Orfanidis, 1991; Mulas et al., 2020) and very likely already affected by the fast ocean warming conditions in the study region.
Although our ecological time series is too short to show long-term trends, Figure 1C shows signs of decline of % cover in spring from 2018 to 2020. Considering the monthly percentage cover with the temperature time series for the site, there was a sharper warming trend between spring (April-May) and early summer (June) in both 2019 and 2020 compared to 2018. This faster warming may have reduced growth and facilitated earlier decay in the seaweed. This suggests that the general increase of summer temperatures plus earlier seasonal increase in warming (both above the optimal temperature of our species), might lead to a seasonal shift in its growth season, the shrinking of the growth season or, in more extreme scenario, to its overall decline. Considering the recent ‘business as usual’ (RCP 8.5) IPCC scenario (Portner et al., 2019), the sea water temperature will increase by 3°C (and perhaps even more in the fast-warming Levantine basin), threatening the survival of the species as it gets closer to its CTMAX.
Unfortunately, thermal performance curves have rarely been developed for species of the genus Cystoseira s.l. to allow direct comparison, and in many cases they were based on different responses such as growth rates (Orfanidis, 1991; Savva et al., 2018; Bennett et al., 2022b). However, many ecological and a few experimental studies, conducted within the Mediterranean Sea on several Cystoseira s.l. species, described different maximum development periods depending on the species, biogeographical distribution and depth range (see Table 3). Finally, due to the limited narrow geographical distribution, translocation studies or common garden experiments evaluating the responses of different populations of the species to the local thermal conditions cannot be performed (such as Bennett et al., 2015; Bennett et al., 2022a; Bennett et al., 2022b), limiting the investigation at the local scale and so our conclusions.
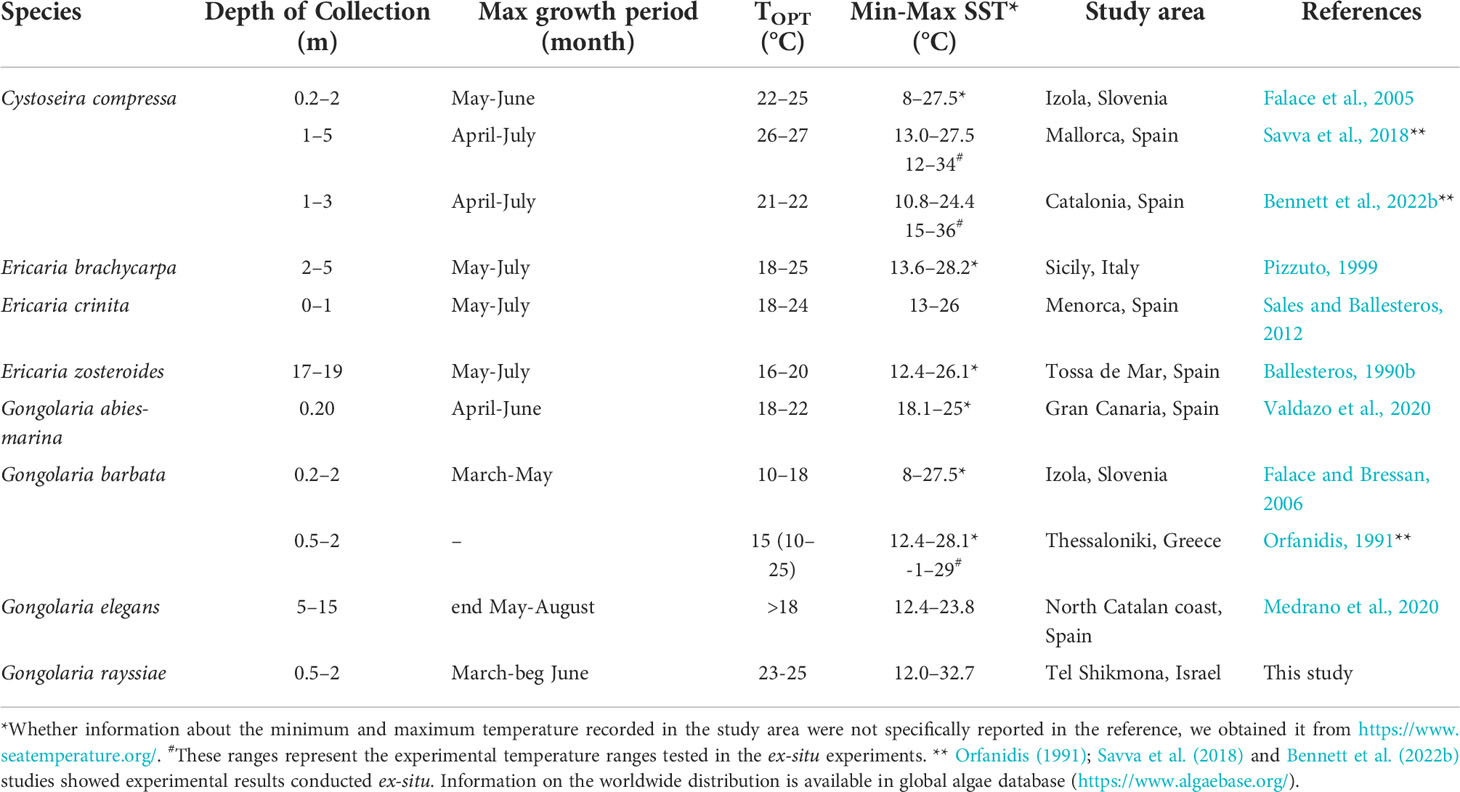
Table 3 Maximum development period, optimal temperature, depth, and temperature distribution ranges of Mediterranean Cystoseira s.l. species reported in the scientific literature.
Final remarks
Most species of Cystoseira exhibit narrow environmental tolerance range and thus are sensitive to many stressors, making them suitable as bioindicators in ecological status assessments (e.g. CARLIT index) (Ballesteros et al., 2007; Mangialajo et al., 2008b). Hence, the majority of Cystoseira s.l. are listed as protected in the Annex I of Bern Convention and the Mediterranean Action Plan (Barcelona Convention), except for C. compressa, which is considered less vulnerable. Gongolaria rayssiae was proposed as a species of concern by Verlaque in the UNEP Mediterranean Action Plan 2009 (United Nations Environment Programme, 2009) and then in 2019 included within Annex II (‘endangered and threatened species’) of the Barcelona Convention (Mediterranean Action Plan of the United Nations) (Verlaque et al., 2019), stressing the importance of its limited distribution and scant information regarding it.
This study expands our ecological knowledge on an endemic Mediterranean species limited to the southeastern Levantine basin. Here we combined empirical data obtained from metabolic rate investigations considering seasonal variability, together with the ones resulting from manipulative experiments applied on constant predetermined conditions, such as the TPC experiment. Both show a strong seasonal variability in the phenology and ecology of G. rayssiae characterized by a narrow growth season (late February/March to mid-June), which makes it highly vulnerable to additional ocean warming in the already warmest and fastest-warming part of the Mediterranean Sea. Because of the absence of historical data, we could not determine changes in phenology or abundance that co-vary with the fast rate of seawater warming in the Eastern Mediterranean, which could help in forecasting its possible fate. However, studies conducted on other representatives of the Cystoseira s.l. group such as Ericaria zosteroides (Capdevila et al., 2019), E. crinita (Verdura et al., 2021), and E. giacconei (Falace et al., 2021) reported important negative warming effects on sensitive life stages of the species.
Interestingly, while no negative effects on the adults was recorded on the south-Mediterranean cold-affinity E. giacconei, Falace et al. (2021) reported disruptive effect of temperature on its early life stage. They further reported a decrease in settlement efficiency of the zygotes at 24°C followed by a significant drop at 28°C. Furthermore, the mortality of germlings sharply increased at 18°C, and at 28°C, no germling survived. Although such studies have not been conducted on G. rayssiae, we have evidence that many native species have already become locally extinct in the southeast Levantine Sea (Yeruham et al., 2015; Rilov, 2016; Albano et al., 2021). If the same happens to G. rayssiae, due to its limited distribution, this might become globally extinct, and this could have repercussion on many other associated species. To the best of our knowledge, no endemic macroalga has gone through a global extinction yet, but a similar rare example for an endemic habitat-forming macroalgae in sharp decline (90% in the last 30 years) that may face global extinction due to ocean warming is Gelidium canariense in the Canary Islands (Alfonso et al., 2021). Additionally, the limited narrow geographical distribution of G. rayssiae in the Levantine basin does not allow for comparisons among warm-, central- and cool-edge populations (Bennett et al., 2022a; Bennett et al., 2022b), so that adaptive management strategy including targeted translocations cannot be applied.
Because G. rayssiae provides a habitat for a diverse associated community and it plays an important role as a carbon sink in the area (Peleg et al., 2020), its loss could have a strong effect on the ecosystem functions of shallow reefs along the SE Levantine shores. In addition to temperature, photoperiod may also trigger crucial steps in the life cycle of the species (Dring, 1982), and the interaction of both factors could further narrow the seasonal interval suitable for reproduction and growth. Furthermore, because the Levant is being rapidly occupied by many alien species, many of which are macroalgae, it is of paramount importance to determine if they can compensate for some of the ecosystem functions that may be lost with the loss of natives. Peleg et al. (2020) already showed that a highly abundant Indo-Pacific invader, Galaxaura rugosa, could replace some but not all functions of G. rayssiae. Hence, further investigations should aim at filling the gaps regarding reproductive patterns, recruitment and the role of different environmental variables (besides temperature) in affecting the spatio-temporal dynamics of the endemic G. rayssiae. In addition, studies involving lab cultivation as well as in-situ restoration projects should be encouraged as a tool of paramount importance to understand the past and ensure the future of this peculiar Levantine species.
Data availability statement
The raw data supporting the conclusions of this article will be made available by the authors, without undue reservation.
Author contributions
MM, GR, JS, and TG-H conceived the project. MM and TG-H collected the data and conducted the experiments. MM, TG-H, and SN analyzed the data. MM and GR wrote the first draft. All the authors contributed to interpreting the results, writing and approved the submission.
Funding
This work was supported by the Israeli Science Foundation (ISF) [grant number 1982/16], by the join German-Israeli Foundation for Scientific Research and Development (BMBF-MOST) [grant number 3-15216], and partly by the Horizon2020 EU project FutureMARES [grant number 869300].
Acknowledgments
We would like to give very special thanks to Dar Golomb, who was instrumental in all the field and in the lab, as well as Maura Schonwald and Lior Bartal from the Rilov lab for their continuous field and lab assistance throughout the study period, and to Ximena Velasquez-Dubinsky for her help in the sorting procedures. A special thank also to Dr. Alvaro Israel for his support and to Dr. Sofia Sadogurska.
Conflict of interest
The authors declare that the research was conducted in the absence of any commercial or financial relationships that could be construed as a potential conflict of interest.
Publisher’s note
All claims expressed in this article are solely those of the authors and do not necessarily represent those of their affiliated organizations, or those of the publisher, the editors and the reviewers. Any product that may be evaluated in this article, or claim that may be made by its manufacturer, is not guaranteed or endorsed by the publisher.
Supplementary material
The Supplementary Material for this article can be found online at: https://www.frontiersin.org/articles/10.3389/fmars.2022.862332/full#supplementary-material
References
Åberg P. (1990). Measuring size and choosing category size for a transition matrix study of the seaweed Ascophyllum nodosum. Mar. Ecol. Prog. Ser. 63, 281–287. doi: 10.3354/meps063281
Airoldi L., Ballesteros E., Buonuomo R., Van Belzen J., Bouma T. J., Cebrian E., et al. (2014). Marine forests at risk: solutions to halt the loss and promote recovery of Mediterranean canopy-forming seaweeds. Proc. 5th Mediterr. Symp. Mar. Veg. 251, 28–33.
Albano P. G., Steger J., Bošnjak M., Dunne B., Guifarro Z., Turapova E., et al. (2021). Native biodiversity collapse in the eastern Mediterranean. Proc. R. Soc B Biol. Sci. 288, 20202469. doi: 10.1098/rspb.2020.2469
Alfonso B., Hernández J. C., Sangil C., Martín L., Expósito F. J., Díaz J. P., et al. (2021). Fast climatic changes place an endemic canary island macroalga at extinction risk. Reg. Environ. Change 21, 113. doi: 10.1007/s10113-021-01828-5
Angilletta M. J. (2006). Estimating and comparing thermal performance curves. J. Therm. Biol. 31, 541–545. doi: 10.1016/j.jtherbio.2006.06.002
Badreddine A., Abboud-Abi Saab M., Gianni F., Ballesteros E., Mangialajo L. (2018). First assessment of the ecological status in the Levant basin: Application of the CARLIT index along the Lebanese coastline. Ecol. Indic. 85, 37–47. doi: 10.1016/j.ecolind.2017.10.006
Ballesteros E. (1988). Estructura y dinamica de la comunidad de Cystoseira mediterranea sauvageau en el mediterraneo noroccidental. Inv Pesq 52, 313–334.
Ballesteros E. (1989). Production of seaweeds in northwestern Mediterranean marine communities: its relation with environmental factors. Sci. Mar. 53, 357–364.
Ballesteros E. (1990a). Structure and dynamics of the community of Cystoseira caespitosa (Fucales, phaeophyceae) in the northwestern Mediterranean. Sci. Mar. 54, 155–158.
Ballesteros E. (1990b). Structure and dynamics of the community of Cystoseira zosteroides. Sci. Mar. 54, 217–229.
Ballesteros E. (1992). Els vegetals i la zonació litoral: especies, comunitats i factors que influeixen en la seva distribució. Institut catala’ bibliografia. doi: 10.1017/CBO9781107415324.004
Ballesteros E., Garrabou J., Hereu B., Zabala M., Cebrian E., Sala E. (2009). Deep-water stands of Cystoseira zosteroides c. agardh (Fucales, ochrophyta) in the northwestern Mediterranean: Insights into assemblage structure and population dynamics. Estuar. Coast. Shelf Sci. 82, 477–484. doi: 10.1016/j.ecss.2009.02.013
Ballesteros E., Torras X., Pinedo S., García M., Mangialajo L., de Torres M. (2007). A new methodology based on littoral community cartography dominated by macroalgae for the implementation of the European water framework directive. Mar. pollut. Bull. 55, 172–180. doi: 10.1016/j.marpolbul.2006.08.038
Beijbom O., Edmunds P. J., Roelfsema C., Smith J., Kline D. I., Neal B. P., et al. (2015). Towards automated annotation of benthic survey images: Variability of human experts and operational modes of automation. PloS One 10, 1–22. doi: 10.1371/journal.pone.0130312
Bennett S., Alcoverro T., Kletou D., Antoniou C., Boada J., Buñuel X., et al. (2022a). Resilience of seagrass populations to thermal stress does not reflect regional differences in ocean climate. New Phytol 233 (4), 1657–1666. doi: 10.1111/nph.17885
Bennett S., Vaquer-Sunyer R., Jorda G., Forteza M., Roca G., Marbà N. (2022b). Thermal performance of seaweeds and seagrasses across a regional climate gradient. Front. Mar. Sci. 9. doi: 10.3389/fmars.2022.733315
Bennett S., Wernberg T., Arackal Joy B., de Bettignies T., Campbell A. (2015). Central and rear-edge populations can be equally vulnerable to warming. Nat. Commun. 6, 10280. doi: 10.1038/ncomms10280
Breeman A. M. (1990). ““Expected effects of changing seawater temperatures on the geographic distribution of seaweed species,”,” in Expected effects of climate change on marine coastal ecosystems (Dordrecht, the Netherlands: Springer), 69–76.69–76. doi: 10.1007/978-94-009-2003-3_9
Brown J. H., Gillooly J. F., Allen A. P., Savage Van M., West G. B. (2004). Towards a metabolic theory of ecology. Ecology 85, 1771–1789. doi: 10.1890/03-9000
Buonomo R., Assis J., Fernandes F., Engelen A. H., Airoldi L., Serrão E. A. (2017). Habitat continuity and stepping-stone oceanographic distances explain population genetic connectivity of the brown alga Cystoseira amentacea. Mol. Ecol. 26, 766–780. doi: 10.1111/mec.13960
Capdevila P., Hereu B., Salguero-Gómez R., Rovira G., Medrano A., Cebrian E., et al. (2019). Warming impacts on early life stages increase the vulnerability and delay the population recovery of a long-lived habitat-forming macroalga. J. Ecol. 107, 1129–1140. doi: 10.1111/1365-2745.13090
Collier C. J., Ow Y. X., Langlois L., Uthicke S., Johansson C. L., O’Brien K. R., et al. (2017). Optimum temperatures for net primary productivity of three tropical seagrass species. Front. Plant Sci. 8. doi: 10.3389/fpls.2017.01446
Cormaci M., Furnari G., Catra M., Alongi G., Giaccone G. (2012). Flora marina bentonica del mediterraneo: Phaeophyceae. Boll. dell’Accademia Gioenia di Sci. Nat. 45, 1–508.
Da Silva J. M. C., Rapini A., Barbosa L. C. F., Torres R. R. (2019). Extinction risk of narrowly distributed species of seed plants in Brazil due to habitat loss and climate change. PeerJ 2019, 1–17. doi: 10.7717/peerj.7333
Díaz-acosta L., Barreiro R., Provera I., Pi C. (2021). Physiological response to warming in intertidal macroalgae with different thermal affinity. Mar. Environ. Res. 169, 105350. doi: 10.1016/j.marenvres.2021.105350
Dring M. J. (1982). The biology of marine plants. viii, 199 pp. Edward arnold. (Contemporary biology series). J. Mar. Biol. Ass. U.K. 63 (3), 737–739. doi: 10.1017/S002531540007106X
Duarte C. M., Cebrián J. (1996). The fate of marine autotrophic production. Limnol. Oceanogr. 41, 1758–1766. doi: 10.4319/lo.1996.41.8.1758
Einav R., Israel A. (2008). Checklist of seaweeds from the Israeli Mediterranean: Taxonomical and ecological approaches. Isr. J. Plant Sci. 56, 127–191. doi: 10.1560/IJPS.57.1
Falace A., Marletta G., Savonitto G., Candotto Carniel F., Srijemsi M., Bevilacqua S., et al. (2021). Is the south-Mediterranean canopy-forming Ericaria giacconei (=Cystoseira hyblaea) a loser from ocean warming? Front. Mar. Sci. 8. doi: 10.3389/fmars.2021.760637
Falace A., Zanelli E., Bressan G.. (2005). Morphological and reproductive phenology of Cystoseira compressa (Esper) Gerloff & Nizamuddin (Fucales, Fucophyceae) in the Gulf of Trieste (North Adriatic)? Ann. Ser. Hist. Nat. 15, 71–78.
Falace A., Bressan G. (2006). Seasonal variations of Cystoseira barbata (Stackhouse) C. Agardh Frond Architecture? Hydrobiologia 555, 193. doi: 10.1007/s10750-005-1116-2
Flukes E. B., Wright J. T., Johnson C. R. (2015). Phenotypic plasticity and biogeographic variation in physiology of habitat-forming seaweed: Response to temperature and nitrate. J. Phycol. 51, 896–909. doi: 10.1111/jpy.12330
Fox J., Weisberg S. (2019). An r companion to applied regression. 3rd ed. (Sage, Thousand Oaks, CA). Available at: https://socialsciences.mcmaster.ca/jfox/Books/Companion/.
Graiff A., Liesner D., Karsten U., Bartsch I. (2015). Temperature tolerance of western Baltic Sea Fucus vesiculosus - growth, photosynthesis and survival. J. Exp. Mar. Bio. Ecol. 471, 8–16. doi: 10.1016/j.jembe.2015.05.009
Gruber L., Almogi-Labin A., Sivan D., Herut B. (2007). The life cycle of the symbiont-bearing foraminifera Amphistegina lobifera, a new arrival at the Israeli shelf. Rapp. Commun. Int. Mer Médit. 38, 491.
Gubbay S., Sanders N., Haynes T., Janssen J. A. M., Rodwell J. R., Nieto A., et al. (2009). European Red list of Habitat. Part 1: Marine habitats. (Luxembourg: Publication office of the European Union), 52. doi: 10.2779/032638
Guy-Haim T., Silverman J., Raddatz S., Wahl M., Israel A., Rilov G. (2016). The carbon turnover response to thermal stress of a dominant coralline alga on the fast warming Levant coast. Limnol. Oceanogr. 61 (3), 1120–1133. doi: 10.1002/lno.10279
Hillebrand H., Burgmer T., Biermann E. (2012). Running to stand still: Temperature effects on species richness, species turnover, and functional community dynamics. Mar. Biol. 159, 2415–2422. doi: 10.1007/s00227-011-1827-z
Ivesa L., Djakovac T., Devescovi M. (2016). Long-term fluctuations in Cystoseira populations along the west istrian coast (Croatia) related to eutrophication patterns in the northern Adriatic Sea. Mar. pollut. Bull. 106, 162–173. doi: 10.1016/j.marpolbul.2016.03.010
Ji Y., Gao K. (2021). Chapter two - Effects of climate change factors on marine macroalgae: A review. Adv. Mar. Biol. 88, 91–136 doi: 10.1016/bs.amb.2020.11.001
Legendre P. (2001) Model II regression - user’s guide. Available at: http://www.fas.umontreal.ca/biol/legendre/.
Lejeusne C., Chevaldonné P., Pergent-Martini C., Boudouresque C.-F., Pérez T. (2010). Climate change effects on a miniature ocean: the highly diverse, highly impacted Mediterranean Sea. Trends Ecol. Evol. 25, 250–260. doi: 10.1016/j.tree.2009.10.009
Lynch M., Wilfried G. (1987). Environmental tolerance. Am. Nat. 129, 284–303. doi: 10.1016/B978-008045405-4.00826-0
Mancuso F. P., Strain E. M. A., Piccioni E., De Clerck O., Sarà G., Airoldi L. (2018). Status of vulnerable Cystoseira populations along the Italian infralittoral fringe, and relationships with environmental and anthropogenic variables. Mar. pollut. Bull. 129, 762–771. doi: 10.1016/j.marpolbul.2017.10.068
Mangialajo L., Chiantore M., Cattaneo-Vietti R. (2008a). Loss of fucoid algae along a gradient of urbanisation, and structure of benthic assemblages. Mar. Ecol. Prog. Ser. 358, 63–74. doi: 10.3354/meps07400
Mangialajo L., Sartoni G., Giovanardi F. (2008b). Quaderno metodologico sull’elemento biologico MACROALGHE e sul calcolo dello stato ecologico secondo la metodologia CARLIT (ISPRA, Istituto Superiore per la protezione e la Ricerca Ambientale). 105.
Medrano A., Hereu B., Mariani S., Neiva J., Pagès-Escolà M., Paulino C., et al. (2020). Ecological traits, genetic diversity and regional distribution of the macroalga Treptacantha elegans along the Catalan coast (NW Mediterranean Sea). Sci. Rep. 10, 1–10. doi: 10.1038/s41598-020-76066-6
Mineur F., Arenas F., Assis J., Davies A. J., Engelen A. H., Fernandes F., et al. (2015). European Seaweeds under pressure: Consequences for communities and ecosystem functioning. J. Sea Res. 98, 91–108. doi: 10.1016/j.seares.2014.11.004
Montagnes D. J. S., Morgan G., Bissinger J. E., Atkinson D., Weisse T. (2008). Short-term temperature change may impact freshwater carbon flux: A microbial perspective. Glob. Change Biol. 14, 2823–2838. doi: 10.1111/j.1365-2486.2008.01700.x
Mulas M., Neiva J., Sadogurska S. S., Ballesteros E., Serrão E. A., Rilov G., et al. (2020). Genetic affinities and biogeography of putative levantine-endemic seaweed Treptacantha rayssiae (Ramon) M.Mulas, J.Neiva & Á .Israel, comb. nov. (Phaeophyceae). Cryptogam. Algol. 41, 91–103. doi: 10.5252/cryptogamie-algologie2020v41a10
Mulas M., Silverman J., Rilov G. (2022). Biomass calibration of nine dominant native and non native levantine seaweeds. Aquat. Bot. 178, 103496. doi: 10.1016/j.aquabot.2022.103496
Oksanen J., Blanchet G., Friendly M., Roeland K., Legendre P., McGlinn D., et al. (2020). “Vegan: Community ecology package,” in R package version 2.5-7. Available at: https://CRAN.R-project.org/package=vegan.
Orellana S., Hernández M., Sansón M. (2019). Diversity of Cystoseira sensu lato (Fucales, phaeophyceae) in the eastern Atlantic and Mediterranean based on morphological and DNA evidence, including Carpodesmia gen. emend. and Treptacantha gen. emend. Eur. J. Phycol. 0, 1–19. doi: 10.1080/09670262.2019.1590862
Orfanidis S. (1991). Temperature responses and distribution of macroalgae belonging to the warm-temperate Mediterranean-Atlantic distribution group. Bot. Mar. 34, 541–552. doi: 10.1515/botm.1991.34.6.541
Orlando-bonaca M., Pitacco V., Slavinec P., Šiško M., Makovec T., Falace A. (2021). First restoration experiment for gongolaria barbata in Slovenian coastal waters. what can go wrong? Plants 10, 239. doi: 10.3390/plants10020239
Ozer T., Gertman I., Kress N., Silverman J., Herut B. (2016). Interannual thermohaline, (1979–2014) and nutrient, (2002–2014) dynamics in the levantine surface and intermediate water masses, SE Mediterranean Sea. Glob. Planet. Change. 151, 60–67. doi: 10.1016/j.gloplacha.2016.04.001
Padfield D., O’Sullivan H., Pawar S. (2021). rTPC and nls.multstart: A new pipeline to fit thermal performance curves in r. Methods Ecol. Evol. 2021, 1–6. doi: 10.1111/2041-210X.13585
Peleg O., Guy-Haim T., Yeruham E., Silverman J., Rilov G. (2020). Tropicalisation may invert trophic state and carbon budget of shallow temperate rocky reefs. J. Ecol. 108, 844–854. doi: 10.1111/1365-2745.13329
Pessarrodona A., Foggo A., Smale D. A. (2018). Can ecosystem functioning be maintained despite climate-driven shifts in species composition? insights from novel marine forests. J. Ecol. 107 (1), 91–104. doi: 10.1111/1365-2745.13053
Piazzi L., Balata D., Ceccherelli G. (2017). Resilience of Cystoseira beds: lack of canopy effects on recruitment. Bot. Mar. 60, 1–6. doi: 10.1515/bot-2016-0088
Pimm S. L., Jenkins C. N., Abell R., Brooks T. M., Gittleman J. L., Joppa L. N., et al. (2014). The biodiversity of species and their rates of extinction, distribution, and protection. Science. 344, 6187. doi: 10.1126/science.1246752
Piñeiro-Corbeira C., Barreiro R., Cremades J., Arenas F. (2018). Seaweed assemblages under a climate change scenario: Functional responses to temperature of eight intertidal seaweeds match recent abundance shifts. Sci. Rep. 8, 1–9. doi: 10.1038/s41598-018-31357-x
Pizzuto F (1999). On the structure, typology and periodism of a Cystoseira brachycarpa J. Agardh emend. Giaccone community and of a Cystoseira crinita Duby community from the eastern coast of Sicily (Mediterranean Sea), Plant Biosystems. Int.J. Plant Biol. 133 (1), 15–35. doi: 10.1080/11263509909381529
Portner H.-O., Roberts D. C., Masson-Demotte V., Zhai P., Tignor M., Poloczanska, Elvira S., et al. (2019). ““IPC 2019: Summary for policymakers,”,” in IPCC special report on the ocean and cryosphere in a changing climate (Cambridge, United Kingdom and New York, NY, USA: Cambridge University Press), 3–35. doi: 10.1017/9781009157964.001
Ramon E. (2000). Cystoseira rayssiae - a new Cystoseira (Cystoseiraceae, fucophyceae) from the shores of Israel, Eastern Mediterranean Sea. Isr. J. Plant Sci. 48, 59–65. doi: 10.1560/RYEN-TPBH-AQKW-FFHD
Reynes L., Aurelle D., Chevalier C., Pinazo C., Valero M., Mauger S., et al. (2021). Population genomics and Lagrangian modeling shed light on dispersal events in the Mediterranean endemic Ericaria zosteroides (=Cystoseira zosteroides) (Fucales). Front. Mar. Sci. 8. doi: 10.3389/fmars.2021.683528
Rilov G. (2016). Multi-species collapses at the warm edge of a warming sea. Sci. Rep. 6, 36897. doi: 10.1038/srep36897
Rilov G., Peleg O., Yeruham E., Garval T., Vichik A., Raveh O. (2018). Alien turf: overfishing, overgrazing and invader domination in south-eastern Levant reef ecosystems. Aquat. Conserv. Mar. Freshw. Ecosyst. 28, 351–362. doi: 10.1002/aqc.2862
Robbins L. L., Hansen M. E., Kleypas J., Meylan S. C. (2010). CO2calc- a user-friendly carbon calculator for windows , mac OS X , and iOS ( iPhone ) Florida shelf ecosystems response to climate change project CO2calc : A user-friendly seawater carbon calculator for windows , mac OS X , and iOS ( iPhone ). United States Geol. Surv. 1280, 1210–1280.
Sales M., Ballesteros E. (2012). Seasonal dynamics and annual production of Cystoseira crinita (Fucales: Ochrophyta)-dominated assemblages from the northwestern Mediterranean. Sci. Mar. 76, 391–401. doi: 10.3989/scimar.03465.16D
Sass E., Ben-Yaakov S. (1977). The carbonate system in hypersaline solutions: Dead Sea brines. Mar. Chem. 5 (2), 183–199. doi: 10.1016/0304-4203(77)90006-8
Savva I., Bennett S., Roca G., Jordà G., Marbà N. (2018). Thermal tolerance of Mediterranean marine macrophytes: Vulnerability to global warming. Ecol. Evol. 8, 12032–12043. doi: 10.1002/ece3.4663
Schneider C. A., Rasband W. S., Eliceiri K. W. (2012). NIH Image to ImageJ: 25 years of image analysis. Nat. Methods 9, 671–675. doi: 10.1038/nmeth.2089
Serio D., Alongi G., Catra M., Cormaci M., Furnari G. (2006). Changes in the benthic algal flora of linosa island (Straits of Sicily, Mediterranean Sea). Bot. Mar. 49, 135–144. doi: 10.1515/BOT.2006.018
Smale D. A., Pessarrodona A., King N., Burrows M. T., Yunnie A., Vance T., et al. (2020). Environmental factors influencing primary productivity of the forest-forming kelp laminaria hyperborea in the northeast Atlantic. Sci. Rep. 10, 1–12. doi: 10.1038/s41598-020-69238-x
Smale D. A., Wernberg T., Yunnie A. L. E., Vance T. (2015). The rise of Laminaria ochroleuca in the Western English channel (UK) and comparisons with its competitor and assemblage dominant Laminaria hyperborea. Mar. Ecol. 36, 1033–1044. doi: 10.1111/maec.12199
Staehr P. A., Wernberg T. (2009). Physiological responses of Ecklonia radiata (Laminariales) to a latitudinal gradient in ocean temperature. J. Phycol. 45, 91–99. doi: 10.1111/j.1529-8817.2008.00635.x
Steneck R., Graham M. H., Bourque B. J., Corbett D., Erlandson J. M., Estes J. A., et al. (2002). Kelp forest ecosystems: Biodiversity, stability, resilience and future. Environ. Conserv. 29, 436–459. doi: 10.1017/S0376892902000322
Sunday J. M., Pecl G. T., Frusher S., Hobday A. J., Hill N., Holbrook N. J., et al. (2015). Species traits and climate velocity explain geographic range shifts in an ocean-warming hotspot. Ecol. Lett. 18, 944–953. doi: 10.1111/ele.12474
Taşkin E., Jahn R., Öztürk M., Furnari G., Cormaci M. (2012). The Mediterranean Cystoseira (with photographs). Publ. Celal Bayar Univ. Manisa Turkey. 4, 75.
Teagle H., Smale D. A. (2018). Climate-driven substitution of habitat-forming species leads to reduced biodiversity within a temperate marine community. Divers. Distrib 24 (10), 1367–1380. doi: 10.1111/ddi.12775
Thibaut T., Blanfuné A., Boudouresque C.-F., Verlaque M. (2015). Decline and local extinction of fucales in the French Riviera: The harbinger of future extinctions? Mediterr. Mar. Sci. 16, 206–224. doi: 10.12681/mms.1032
Underwood A. J. (1997). Experiments in ecology: their logical design and interpretation using analysis of variance (Cambridge University Press Cambridge, United Kingdom: Cambridge University Press). Cambridge, ed.
United Nations Environment Programme (2009). Proposals for amendment of annexes II and III of the SPA/BD protocol (Floriana, Malta: 9th Meeting of Focal Points for SPAs). doi: 10.1002/9780470670590.wbeog931
Urrea-Victoria V., Nardelli A. E., Floh E. I. S., Chow F. (2020). Sargassum stenophyllum (Fucales, ochrophyta) responses to temperature short-term exposure: photosynthesis and chemical composition. Rev. Bras. Bot. 43, 733–745. doi: 10.1007/s40415-020-00639-y
Valdazo J., Viera-Rodríguez M. A., Tuya F. (2020). Seasonality in the canopy structure of the endangered brown macroalga Cystoseira abies-marina at gran canaria island (Canary islands, eastern Atlantic). Eur. J. Phycol. 00, 1–13. doi: 10.1080/09670262.2019.1696989
Verdura J., Santamaria J., Ballesteros E., Smale D. A., Cefalì M. E., Golo R., et al. (2021). Local-scale climatic refugia offer sanctuary for a habitat-forming species during a marine heatwave. J. Ecol. 109, 1758–1773. doi: 10.1111/1365-2745-13599
Vergés A., Steinberg P. D., Hay M. E., Poore A. G.B., Campbell A. H., Ballesteros E., et al. (2014). The tropicalization of temperate marine ecosystems: climate-mediated changes in herbivory and community phase shifts. Proc. R. Soc B Biol. Sci. 281, 20140846. doi: 10.1098/rspb.2014.0846
Verlaque M., Boudouresque C., Perret-Boudouresqu M. (2019). Mediterranean Seaweeds listed as threatened under the Barcelona convention: a critical analysis. Sci. Rep. Port-Cros. Natl. Park 33, 179–214.
Warton D. I., Duursma R. A., Falster D. S., Taskinen S. (2012). Smatr 3- an r package for estimation and inference about allometric lines. Methods Ecol. Evol. 3, 257–259. doi: 10.1111/j.2041-210X.2011.00153.x
Warton D. I., Wright I. J., Falster D. S., Westoby M. (2006). Bivariate line-fitting methods for allometry. Biol. Rev. Camb. Philos. Soc 81, 259–291. doi: 10.1017/S1464793106007007
Wernberg T., de Bettignies T., Joy B. A., Finnegan P. M. (2016). Physiological responses of habitat-forming seaweeds to increasing temperatures. Limnol. Oceanogr. 61, 2180–2190. doi: 10.1002/lno.10362
Wickham H (2016). ggplot2: elegant graphics for data analysis. New York: SpringerVerlag. doi: 10.1007/978-0-387-98141-3
Wernberg T., Filbee-Dexter K. (2019). Missing the marine forest for the trees. Mar. Ecol. Prog. Ser. 612, 209–215. doi: 10.3354/meps12867
Yeruham E., Rilov G., Shpigel M., Abelson A. (2015). Collapse of the echinoid Paracentrotus lividus populations in the Eastern Mediterranean–result of climate change? Sci. Rep. 5, 13479. doi: 10.1038/srep13479
Keywords: climate change, Mediterranean Sea, Fucales, metabolic rates, primary production, respiration, carbon sequestration, thermal performance
Citation: Mulas M, Silverman J, Guy-Haim T, Noè S and Rilov G (2022) Thermal vulnerability of the Levantine endemic and endangered habitat-forming macroalga, Gongolaria rayssiae: implications for reef carbon. Front. Mar. Sci. 9:862332. doi: 10.3389/fmars.2022.862332
Received: 25 January 2022; Accepted: 15 July 2022;
Published: 08 August 2022.
Edited by:
Yuanyuan Feng, Shanghai Jiao Tong University, ChinaReviewed by:
Deevesh Ashley Hemraj, The University of Hong Kong, Hong Kong SAR, ChinaPamela A. Fernández, Universidad de Los Lagos, Chile
Iván Gómez, Universidad Austral de Chile, Chile
Copyright © 2022 Mulas, Silverman, Guy-Haim, Noè and Rilov. This is an open-access article distributed under the terms of the Creative Commons Attribution License (CC BY). The use, distribution or reproduction in other forums is permitted, provided the original author(s) and the copyright owner(s) are credited and that the original publication in this journal is cited, in accordance with accepted academic practice. No use, distribution or reproduction is permitted which does not comply with these terms.
*Correspondence: Martina Mulas, bXVsYXNtYXJ0aW5hODhAZ21haWwuY29t
†Present address: Simona Noè, Marine Animal Conservation and Public Engagement, Stazione Zoologica Anton Dohrn, Naples, Italy