 Katherine N. Lawson
 Brianna M. Tracy1,3†
 Jim R. Muirhead
- 1Marine Invasions Laboratory, Smithsonian Environmental Research Center, Edgewater, MD, United States
- 2Environmental Biology Department, State University of New York Environmental College of Science and Forestry, Syracuse, NY, United States
- 3Oceanography Department, United States Naval Academy, Annapolis, MD, United States
- 4Thriving Earth Exchange, American Geophysical Union, Washington, DC, United States
Citizen science is an important and useful approach to research that broadens public science engagement and expands the scale at which science can be conducted. Monitoring for marine non-native species has been repeatedly identified as a venue for citizen scientists to make substantial contributions. In this study, we evaluated the accuracy of identifications made by volunteers of marine invertebrates on the project Invader ID, hosted on the online citizen science portal Zooniverse. We tested the efficiency and accuracy of invertebrate identifications made through consensus, where more than one volunteer must agree on a final identification before it is added to the database. Using the Matthew’s Correlation Coefficient, we found that four volunteers in consensus balanced efficiency and accuracy when compared to gold standard scientist identifications. Common, large taxa were identified most accurately; Branching Bryozoa identifications made by four volunteers were 85% accurate, Solitary Tunicates 91% accurate, and Colonial Tunicates 64%. In community-based comparisons, the identity of the taxonomist (volunteer or scientist) had a small impact on overall community composition, while site and salinity gradients had a strong impact on composition. We suggest that citizen science monitoring programs focused on highly recognizable taxonomic groups, or on a few species within those groups that can provide crucial information for managers aiming to quickly identify new invasions. Moreover, long-term assessments of composition could be successfully monitored by volunteers from photographs, helping to bolster understanding of ongoing impacts of invasive species or climate change.
Introduction
Invasive species are a leading threat to biodiversity worldwide due to difficulties in predicting species movements and the understanding of future impacts (Stachowicz et al., 1999; Ruiz et al., 1999; Bax et al., 2001; Ruiz et al., 2015). Tracking world-wide movements of non-native species and monitoring ecological impacts requires a coordinated network. However, due to challenges presented by large-scale research efforts (Ruiz et al., 1997; Stachowicz et al., 2002; Thiel et al., 2014), scientists have increasingly begun to develop citizen science programs to expand research capacity (Dickinson et al., 2010; McKinley et al., 2017; Irwin, 2018). Citizen science, or involvement of the public in collecting and analyzing scientific data, is an important and useful approach to research that broadens public science engagement and expands the scale at which science can be conducted. Monitoring for non-native species has been repeatedly identified as a venue for citizen scientists to make substantial contributions (see Lodge et al., 2006; Delaney et al., 2008; Cooper et al., 2014).
Citizen science projects can have numerous benefits, both for participants and for researchers (Bonney et al., 2009; Conrad and Hilchey, 2011; Walker et al., 2020). At a community level, citizen science can help democratize science and make data more widely available (Landström et al., 2019; de Sherbinin et al., 2021), and is seen as an important element of tracking and attaining the United Nations Sustainable Development Goals (Fritz et al., 2019). Citizen science can also change individual behaviors (e.g. Santori et al., 2021), increase scientific knowledge (e.g. Masters et al., 2016), increase scientific literacy (e.g. Ballard et al., 2017), increase trust in scientists and the research process (e.g. Masterson et al., 2019), and raise awareness regarding environmental issues (e.g. Meschini et al., 2021). Further, citizen science can expand spatial and temporal resolution of samples (Pocock et al., 2014; Sun et al., 2018), provide a cost-effective mechanism for collecting large amounts of data (e.g. Theobald et al., 2015; Sousa et al., 2020), and allow for inclusion of multiple knowledge sources, including stakeholder and traditional ecological knowledge, in projects, into research projects, questions, and methods (e.g. Carr and Ranco, 2017; Bonney et al., 2021).
The number and scope of citizen science continues to grow, with projects run by universities, non-profit organizations, and government groups (McKinley et al., 2017; Irwin, 2018). Studies have found that when projects are well designed and volunteers are appropriately trained, citizen science-based projects produce high quality data that can be used for a wide range of purposes (e.g. Kosmala et al., 2016; Brown and Williams, 2018), and there is a long history of citizen science data being used as part of major scientific studies (e.g. Cooper et al., 2014; Ries and Oberhauser, 2015). Despite this, some remain skeptical of the quality of data produced by citizen scientists (e.g. Aceves-Bueno et al., 2017, but see response by Specht and Lewandowski, 2018), largely related to concerns about levels of skill and experience that volunteers might possess (Alabri and Hunter, 2010; Dickenson et al., 2010). However, high data quality standards and procedures are important across all research projects, not only those that include citizen science data (Downs et al., 2021; McCord et al., 2021), and many similar best practices can be utilized to improve data quality regardless of the data collectors, including proper training, use of standardized equipment and protocols, and appropriate verification or vouchering procedures (Kosmala et al., 2016; NASA, 2020; Downs et al., 2021).
In-person citizen science projects are common, and there are many successful examples (e.g. the Front Range Pika Project, Beever et al., 2010; Gardenroots, Ramirez-Andreaotta et al., 2015; Coastal Observation and Seabird Survey Team, Parrish et al., 2017; National Bat Monitoring Program, Barlow et al., 2015) but they are often place-based, with participation limited to specific region. Moreover, in-person ocean-based citizen science projects often require access to the coast or specialized skills, which can perpetuate issues of inequality and access to science (e.g. cultural differences in swimming ability, high costs associated with diving and boating) (Cigliano et al., 2015). Online projects have increased the prevalence of citizen science (Jennett et al., 2016) in part because improved technology has increased the scale at which scientists can engage volunteers and quality of data collection tools available to participants (Bonney et al., 2014). Online citizen science is well suited to projects that are image or photo-based due to the ease of uploading, sharing, and annotating images, as well as the existence of photo-based citizen science-focused platforms like iNaturalist (iNaturalist, 2021), eBird (Sullivan et al., 2009), eMammal (McShea et al., 2016), and Zooniverse (Lintott, 2019). Additionally, virtual photo-based projects give scientists the ability to gather data without time constraints inherent to in-situ examination and enable citizen scientists to participate at times and from locations that are convenient to them.
Our online research project, Invader ID, is hosted by the citizen science platform Zooniverse, which hosts nearly 100 active and 173 paused or finished projects that have successfully engaged over a million volunteers worldwide (Lintott, 2019). The Zooniverse platform helps facilitate online projects by providing low barriers to entry, increasing the reach of the project to their large user base, and aggregating identifications and classifications to improve comparability among volunteers and with scientists (Dennis et al., 2017). Zooniverse projects such as Penguin Watch (Jones et al., 2018), Snapshot Serengeti (Swanson et al., 2015; Swanson et al., 2016), and Galaxy Zoo (Ponciano et al., 2014) have published resultant data and reported on the volunteer data accuracy. As of July 2020, at least 250 publications have resulted from data gathered on Zooniverse (Zooniverse Publications, 2020).
Ocean-focused citizen science projects are a minority and often focus on popular, charismatic animals like whales and sharks (Follett and Strezov, 2015; Cigliano et al., 2015; Sandahl and Tøttrup, 2020). However, marine invertebrates are the base of marine food chains and changes to the sessile invertebrate community composition can be tied to major environmental or biological changes, like warming climates, precipitation events, or invasive species (e.g. Chang et al., 2018). The biofouling community offers an accessible subject for citizen science projects; it is unmoving, easily removed from the coast, does not require in-water access, and – most importantly – is one of the most critical frontiers of marine non-native species (Ruiz et al., 2000). Citizen scientists have contributed to a broad range of published and unpublished aquatic invasive species research (Boudreau and Yan, 2004; Delaney et al., 2008; Crall et al., 2010; Azzurro et al., 2013; Zenetos et al., 2013; Scyphers et al., 2014; Maistrello et al., 2016). We established the Invader ID project to monitor invertebrate communities of coastal bays with a high potential for invasive species to impact the balance of native species.
In this study, we assessed the accuracy of marine invertebrate identifications made by volunteers in the Zooniverse project Invader ID in comparison to identifications made by scientists. We analyzed five years of data from marine invertebrate fouling communities from San Francisco Bay, California by comparing volunteer and scientist functional group identifications made from photographs and two methods of community composition measurements. We expected that large, conspicuous functional groups like Solitary Tunicates and Branching Bryozoa would be more accurately identified by volunteers from photos than taxa with smaller features like Encrusting Bryozoa or locally rare taxa like Anemones (Newcomer et al., 2019) but that due to the abundance of recognizable taxa, community composition analyses comparing volunteers to scientists would be similar. We expected volunteers to easily agree on recognizable taxa, but there would be fewer instances of volunteer consensus for less common and more cryptic taxa.
Material and Methods
Based on experience developing citizen science projects with the Smithsonian Environmental Research Center (SERC), and supported by suggestions made in Kosmala et al. (2016), we developed Invader ID with many opportunities for input from volunteers. These opportunities included two volunteer focus groups, two volunteer beta tests, and two in-house pilot launches of Invader ID. The subjects of our study are photographs taken of marine settlement panels deployed in a 20-year standardized biofouling survey conducted by SERC’s Marine Invasions Research Lab (e.g. Chang et al., 2018; Marraffini et al., 2017; Tamburini et al., 2021). The citizen science component of this study was developed only after testing the use of these photographs by trained scientists (Newcomer et al., 2019). In this study, we evaluated a subset of data collected by citizen scientists to confirm accuracy against identifications made from the same photos by our expert team.
Study Area and Field Methods
We deployed replicate settlement panels (n = 10) at ten sites throughout San Francisco Bay, California, USA (37°42′30″N, 122°16′49″W) over a five-year timespan from 2012 through 2016. Settlement panels (hereafter “panels”) have been widely adopted for invasive biofouling surveys (Sutherland, 1974; Bax et al., 2003; Marraffini and Geller, 2015) and are ideally suited for photographic analyses, as they offer a relatively small, standardized, and flat area that is easily photographable. After a three-month deployment period, panels were removed and photographed with a Canon® EOS Rebel T5 camera. For more details on field methods, see Newcomer et al. (2019). Of 100 panels deployed each year, we randomly chose 40 panels per year (n = 200, across all years) for comparison.
Design of Citizen Science Project
We designed the project to identify the whole invertebrate community of each panel, and assessed community composition via point counts. This approach will enable us to monitor and compare past and future community composition trends from projects such as the Smithsonian’s biofouling survey. Moreover, the colonial morphology of our target taxa precludes simple “counting” that is common to Zooniverse photo projects (e.g. Penguin Watch, Jones et al., 2018; Snapshot Serengeti, Swanson et al., 2015; Swanson et al., 2016), so a point-count method better estimates abundance of fouling organisms. See Table 1 for an extensive explanation of terms.
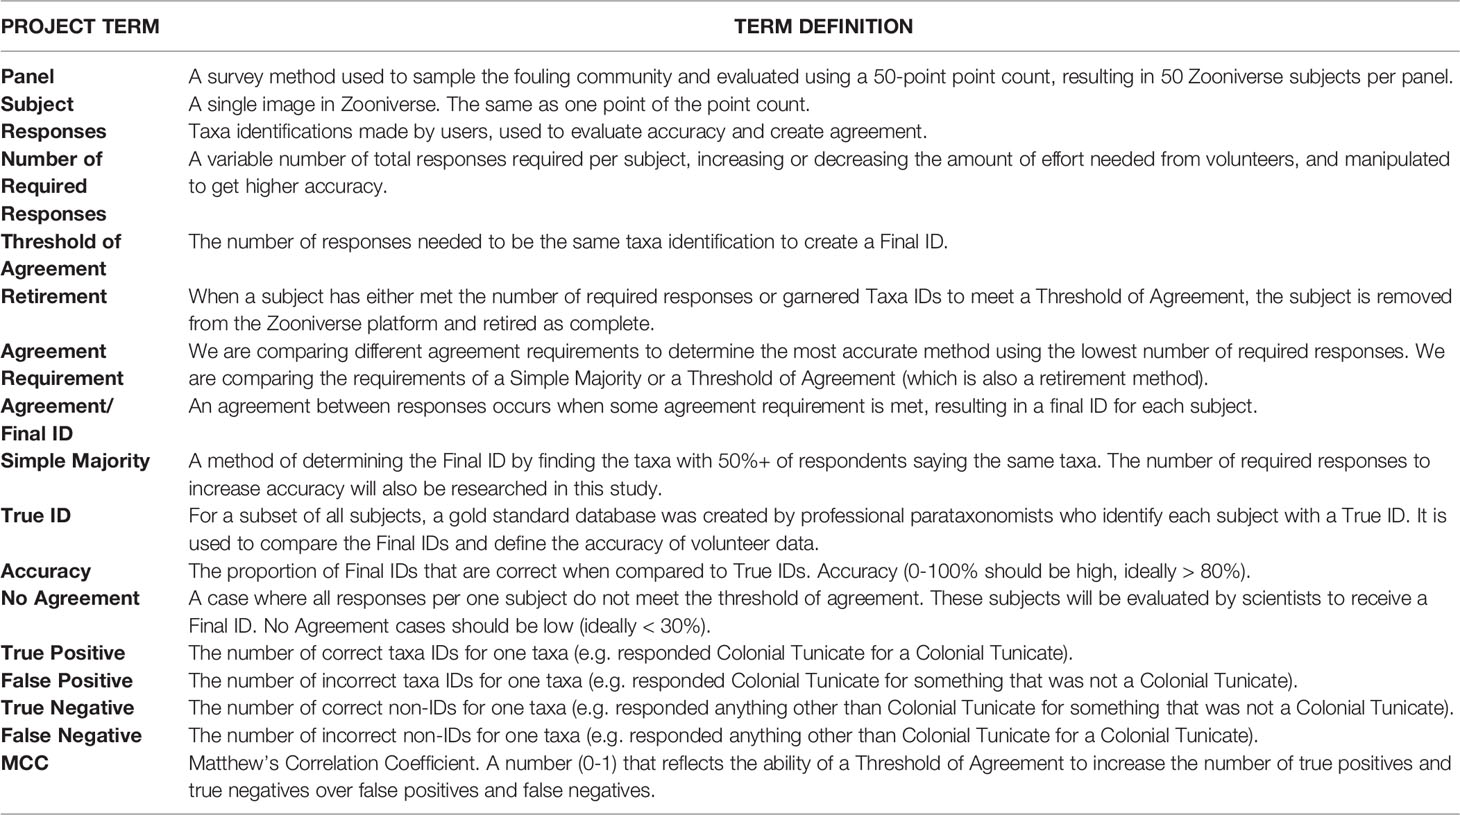
Table 1 A record of Invader ID and Zooniverse specific terms with their definitions.
Other citizen science projects have discussed the negative impacts of identification fatigue or high cognitive load per task (Ponciano et al. 2014; Hines et al., 2015; Jones et al., 2018). Consequently, volunteers are only tasked with identifying one point of the point count on an individual image. This decision was also driven by feedback from volunteer focus groups who provided feedback and insight in the early stages of project development. For each settlement panel, we highlighted a single point on a 7x7 grid (and one random point for n = 50 points total) using image overlays of bullseye targets that did not obstruct the taxa in the center (Figure 1). In this way, each panel appears in 50 photos in the dataset, with 1 of 50 points overlaid (n = 200 panels, n = 10,000 photos). Analysis-ready images (i.e. overlaid with target points) were prepared in R (R Core Team, 2021). We expected that by presenting only one point per Zooniverse round, volunteers could complete rounds faster and complete more rounds per login session. Although other ecological Zooniverse projects require more than one activity per round (e.g. counting, identifying all present taxa, identifying ‘age’), those projects have familiar or charismatic target species. Moreover, boring or difficult tasks can reduce overall participation (Lewandowski and Specht, 2015; Jennett et al., 2016). Based on input from our focus groups and the unfamiliarity of our target taxa, we reduced the activities per round to ensure that each task was as simple and straightforward as possible.
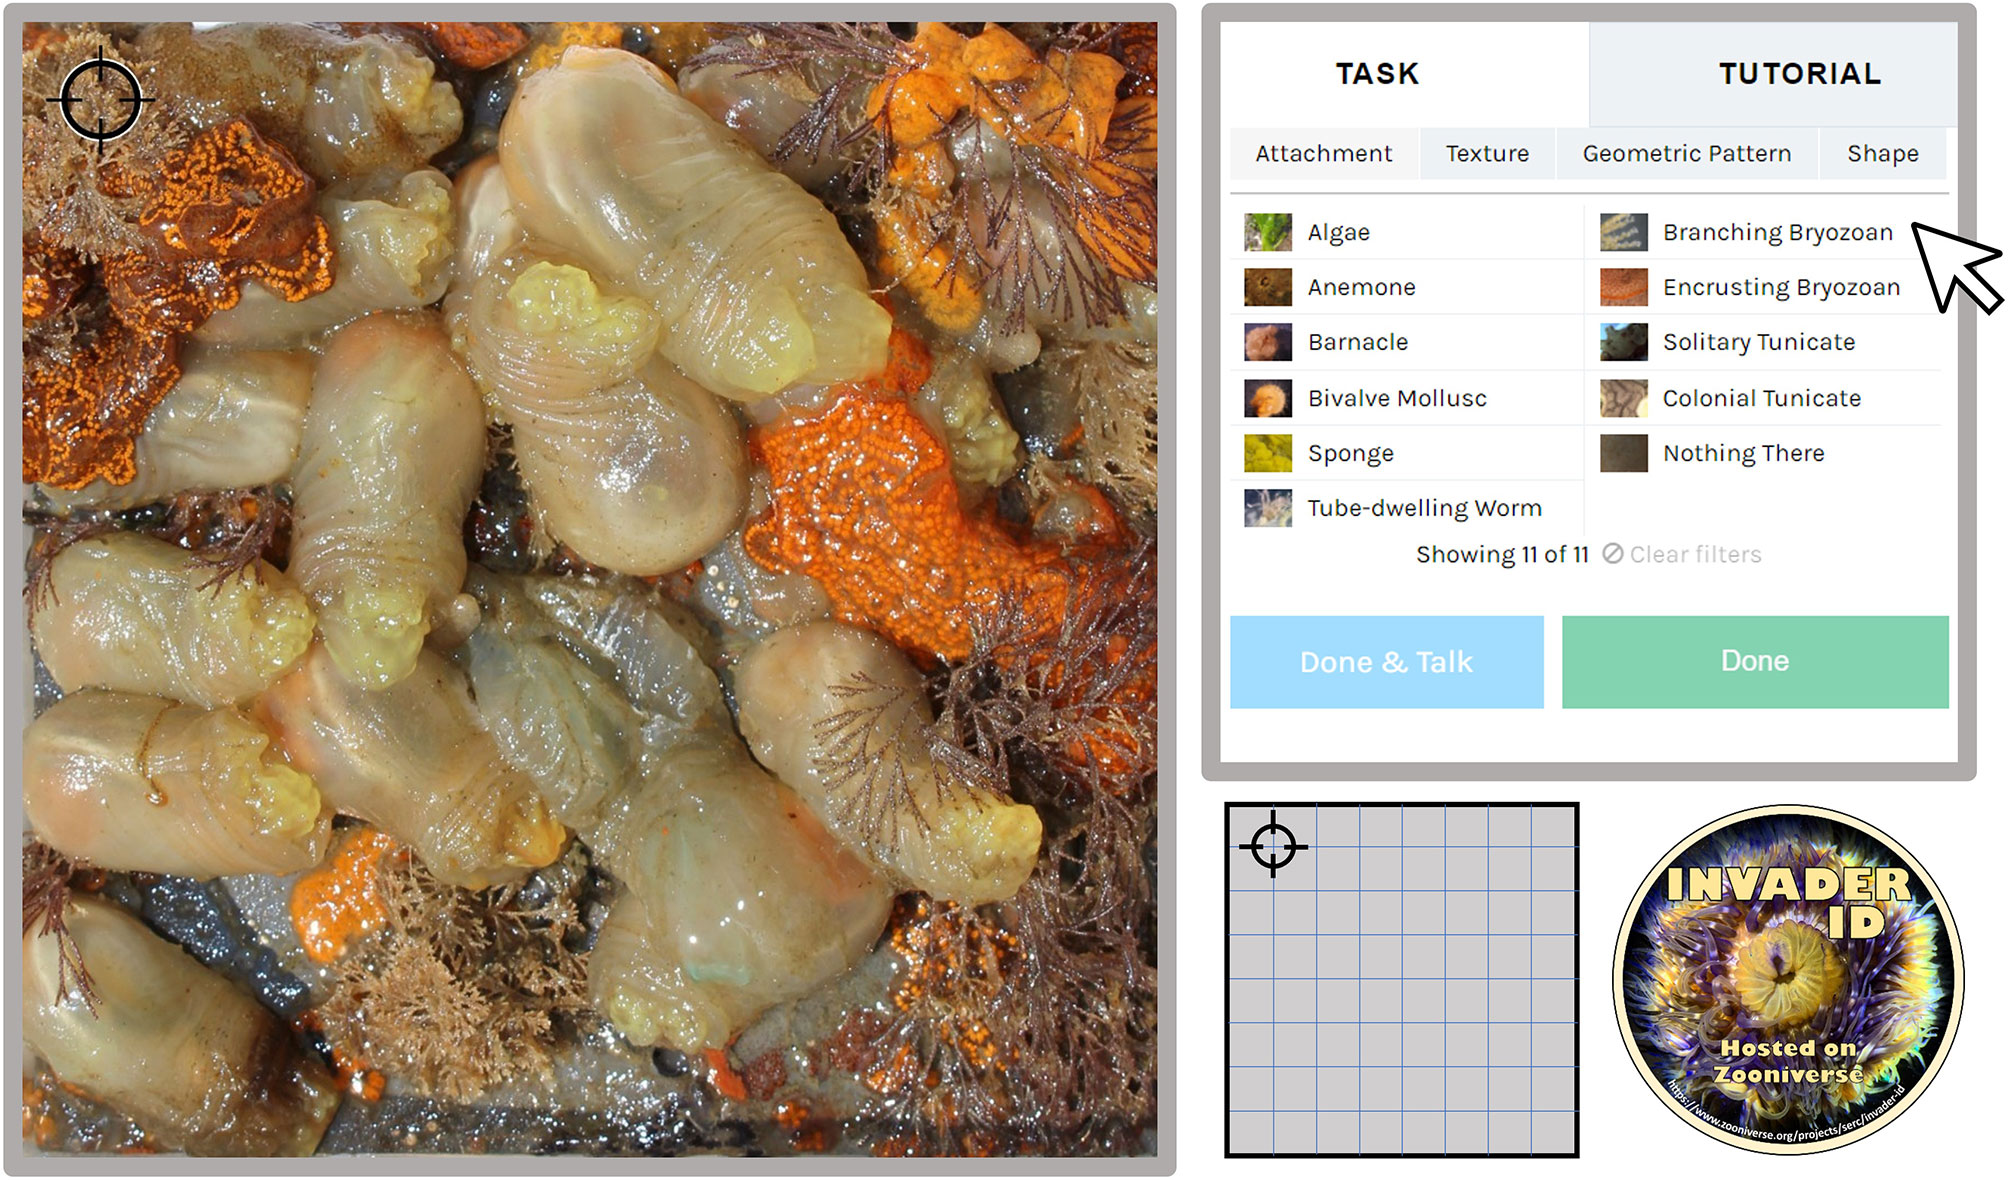
Figure 1 Example workflow of Invader ID from the online Zooniverse portal. Volunteers identify the taxa in the center of the black target (upper left of panel) using the information provided from the identification key (top right). This panel will appear in 49 other iterations with the target moved along a 7x7 grid (see example in bottom center of Figure) and one randomly placed location to create a 50-point count. Photo credit to the Smithsonian Environmental Research Center, Marine Invasions Lab Fouling Survey.
Volunteer Identification of Marine Invertebrates
Prior research on the reliability of species-level data collected by citizen scientists (Lodge et al., 2006; Thiel et al., 2014) and from photographs (Newcomer et al., 2019) informed our decision to focus on higher level community analyses. Analyses using functional guilds or Phylum-level resolution have been shown to successfully detect impacts for studies of water discharge (Defeo and Lercari, 2004) habitat differences in subtidal communities (Pagola-Carte et al., 2002) or spatial variation in mangroves (Chapman, 1998). We organized sessile fouling community organisms into functional groups based on Newcomer et al. (2019) and solicited feedback from volunteers. Functional groups included in this study are Algae, Anemones, Barnacles, Bivalves, Branching Bryozoans, Colonial Tunicates, Encrusting Bryozoans, Solitary Tunicates, and Tube-Dwelling Worms. Other sessile fouling organisms, such as kamptozoans and hydroids, were not recorded due to the low likelihood of being visible on panel photographs. Taxa guides were created for each functional group, with example photos, drawn examples, and extensive notes on physical appearance. Users were also able to narrow the possible functional group list using major morphological characteristics, akin to a dichotomous key, including texture (hard or soft), attachment type (upright or flat), pattern (present or not), and shape (‘balloon’, ‘tree’, ‘carpet’, ‘feather’, ‘shelled’, ‘tentacled’, ‘tube’, and ‘volcano’). These characteristics and names were carefully chosen in collaboration with volunteers with varied level of classification experience. Like other identification-based projects on Zooniverse, we did not offer an “I don’t know” option, as volunteers can underestimate their own ability to recognize species and therefore “skip” many photos (Swanson et al., 2015; Swanson et al., 2016). Since these taxa were most likely new to many volunteers, we did not want to encourage self-doubt when accuracy could be assessed and adjusted post-hoc.
Creating Consensus Among Volunteers
One benefit of the Zooniverse platform is widespread use of the consensus method, which gathers identifications from many users and compiles final identifications from the agreement among volunteers. Photos appear to a set number of users and are removed from rotation – called ‘retiring’ – when the pre-set number of identifications have been completed. Photos can be retired after an assigned number of people have made judgements, though deciding how many users are needed to create consensus differs among projects and tasks. After reviewing results from other projects, we set a threshold of 10 classifications per subject before a subject is retired. Some projects retire blank or blurry images more quickly (Penguin Watch, Jones et al., 2018; Snapshot Serengeti, Swanson et al., 2015; Swanson et al., 2016) but due to visual similarity between a blank panel and some fouling taxa groups, we kept all photos in rotation for 10 rounds of identification. We used this dataset to determine the most efficient retirement method, which we will use in future Invader ID projects.
A subset (n = 2,428 points, or roughly a quarter, and n = 24,186 volunteer identifications) of identifications were directly compared between volunteers and project scientists to evaluate volunteer accuracy by taxa, and to determine the agreement threshold required to create a trustworthy consensus identification.
To determine the number of respondents needed to meet agreement requirements, we estimated the probability of having at least N volunteers match identifications over the number of volunteers via Monte Carlo resampling. In this method, we chose thresholds of 2–5 agreements and calculated the number of identification matches for each threshold as the number of volunteers was increased from 1 to 10. This procedure was repeated for 100 iterations where the order of volunteers was randomized between iterations. The probability of matching was determined by the proportion of 100 simulations where identification matching occurred for each combination of the identification threshold desired and number of volunteers required to meet that threshold.
Many accuracy measurements are available to determine the success of volunteer identifications and we chose to compare the results between two of these common methods: Threshold of Agreement and a Simple Majority (SM). To evaluate the best possible Threshold of Agreement, we also calculated the Matthew’s Correlation Coefficient (MCC; Boughorbel et al., 2017; Rosenthal et al., 2018; Chicco and Jurman, 2020). By comparing these two methods we can better choose a) the method of retirement – either the number of total respondents or the number of respondents in agreement for photos on Zooniverse, and b) what number of respondents or agreements are needed to retire a photo. By reducing the number of respondents needed to evaluate a picture, we can better use volunteer time to maximize the number of accurate identifications made by volunteers. Statistical analyses were performed in the R statistical computing environment (R Core Team, 2021).
The MCC uses a confusion matrix to determine accuracy of responses at each possible threshold of volunteer agreement (1-10 people agreeing on a single identification):
where TP, FP, TN and FN refer to true and false positive, true and false negative identifications.
The SM method evaluates the likelihood of a correct identification if over 50% of respondents need to agree (1–10 people identifying one point). To identify the number of required responses needed to increase the accuracy of the SM method, we created a database of every possible combination of our volunteer responses per subject for every possible number of respondents (1-10). We then calculated the proportion of those combinations that found an accurate Final ID if 50% of respondents needed to agree.
To supplement this analysis, we evaluated points that volunteers were unable to identify and explored if some functional groups were more likely to cause disagreement than others. To do this, we compiled two groups to compare with Peterson Chi-Square tests: observed data of points that were unable to reach volunteer agreement and the expected data of an equal number of randomly selected points from the entire dataset. We then compared the frequencies that each functional group appeared in either group to determine if some taxa were disproportionately represented in the observed data than in their normal frequency from the expected data.
Community Composition Comparison Between Methods
Once we evaluated the best methods for creating consensus on invertebrate identifications per point, we used this data to compare the community composition of each panel in San Francisco Bay. Although we expected that some percentage of volunteer Final IDs may be wrong, we predicted that overall community composition per panel might not be strongly affected by a small proportion of incorrect identifications. To evaluate community composition, we directly compared point count measurements made by scientists from photos and those identified via Invader ID.
Each panel analyzed in Invader ID was also examined from photos by professional parataxonomists. Specific methodology of this examination is included in Newcomer et al. (2019). Individual organisms attached to the panel directly underneath grid intersections were morphologically identified to functional group, for a total 50 recorded points. Any sessile taxa under the point were recorded.
Point counts were compiled from Zooniverse volunteer data using the Final ID for each of 50 subjects per panel found using the Four Agreed agreement requirement, developed above and determined to be the most accuracy and efficient method. Some subjects garnered two Final IDs due to two taxa directly atop each other underneath the target, giving some panels > 50 points. Two datasets – volunteer identifications and scientist identifications – were compared using NMDS plots in R and a PERMANOVA Analysis between point count method (Oksanen et al., 2020). Dispersion affects were tested for non-significance before analysis.
Due to QA/QC strategies on the 100,000 user identification dataset, some user identifications were removed from analysis (final dataset was n = 90,743, See QA/QC information in Supporting Information). In order to be included in the dataset, at least 30 of the 50 points available need to have garnered final identifications by volunteers. Percent cover per panel was calculated based on the actual number of points identified using a total standardization. Future data could be reuploaded to the Zooniverse stream to complete all 50 points, however, studies have shown that the number of points is less important than the number of photo replicates, and point-counts with at least 25 points should be powerful enough community measures (Pante and Dustan, 2012; Perkins et al., 2016).
Volunteer Interest
We compared the efficiency and cost of an entirely professional program to the volunteer program used in this study. Using volunteer participation data automatically collected by Zooniverse (username and IP address), we also calculated the ‘interest’ levels of volunteers using the number of identifications made per volunteer user, the number of times a user returned to the project (repeat sessions), and the number of identifications made per session and day.
Results
Creating Consensus
Analysis of the many options to create a Final User ID resulted in four potential consensus methods: 1) Four Users In Agreement (Four Agreed), 2) Five Users in Agreement (Five Agreed), 3) a simple majority from eight users (Eight Observers), and 4) a simple majority of nine users (Nine Observers). An agreement of four users is, on average for all taxa, up to 11% less accurate than the other preferred methods, although it identifies a higher number of individuals of each taxa group with up to 18% more correct identifications, because the lower requirement of agreement allows for more points gaining identifications. An agreement of five users or a simple majority of nine uses are the most accurate methods overall, but both simple majority methods were much less efficient than agreement methods (Figure 2). Few taxa were identified fairly accurately when only one person identified (Solitary Tunicates 63% accurate), but most were not (Supporting Information). All proposed consensus methods improved accuracy for all taxa when compared to one user identification.
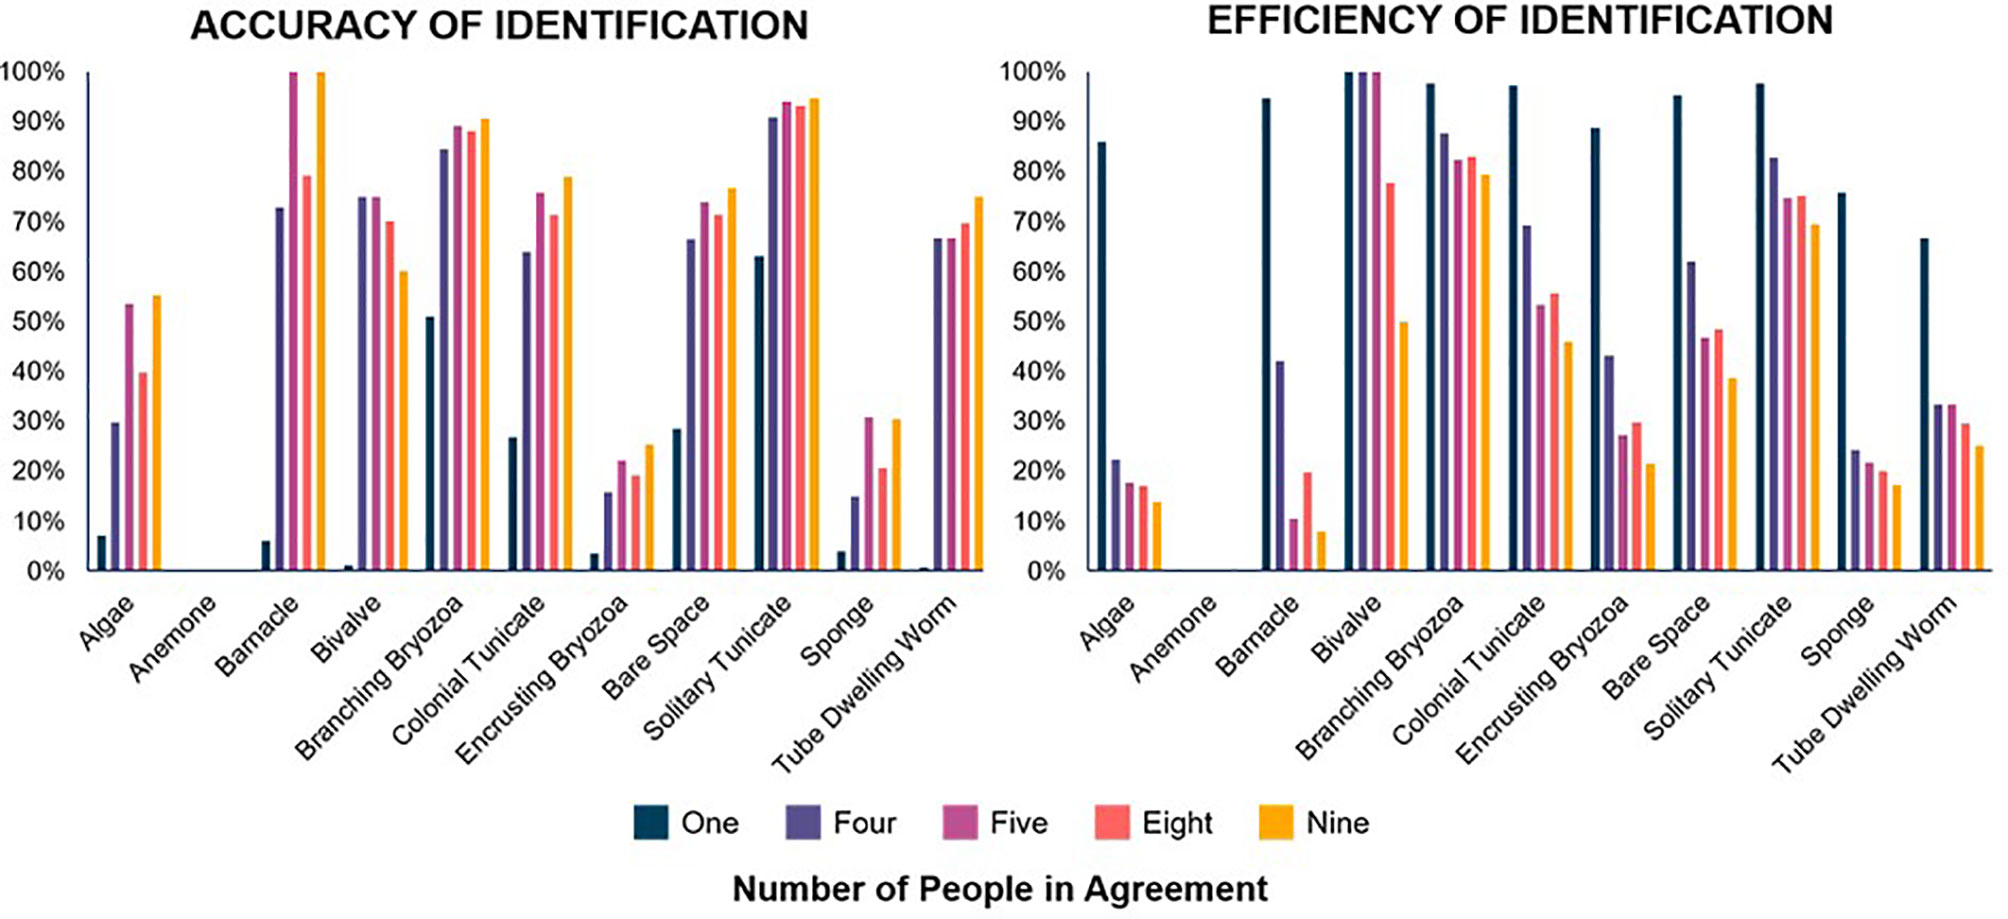
Figure 2 Accuracy (left) and efficiency (right) of the four proposed consensus methods and a single person. Accuracy shows the proportion of volunteer identifications of each taxa that were correct. Efficiency shows the proportion of the actual total of each taxa correctly identified by volunteers. Graphs compare identifications made by one volunteer, four people in agreement, five people in agreement, eight observers without regard to agreement, and nine observers. Four agreed (purple) and five agreed (pink) are more efficient than eight observers (coral) and nine observers (yellow) but accuracy is somewhat variable between all methods. It is common that at least one of the 10 people surveyed will identify each true identification (efficiency), but overall single person accuracy is more often worse.
According to simulations fit to the subset data, for agreement between four people to be met in 100% of cases, each photo should be shown to eight volunteers. For agreement between five people, each photo should be shown to nine volunteers. More than 50% of points would likely need only six users to view (for four in agreement) or eight (for five in agreement; Figure 3). In the simple majority method, a standard number of users are shown each photo (eight or nine in our case), so the Four Agreed or Five Agreed agreement method offers the chance to reduce the effort needed from volunteers.
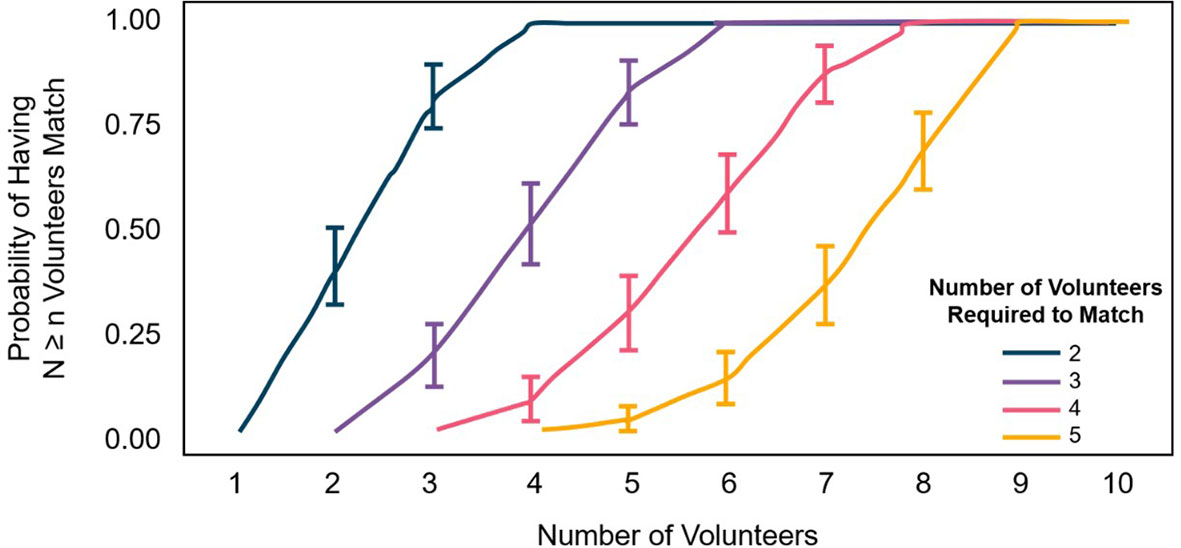
Figure 3 Probability (with 95% CL) of having the number of volunteers who need to identify each photo in order for an agreement of 2 (blue), 3 (purple), 4 (red), or 5 (yellow).
More taxa reached peak MCC – therefore balancing the accuracy of volunteer identifications with the number of identifications successfully reached – when four users agreed (Figure 4). Some taxa reached their peak with five users in agreement, but these taxa were much less abundant (Algae, Sponges). Anemones, Bivalves, and Tube Dwelling Worms had equal MCCs for four and five users agreed, though Anemones should be carefully considered as only one anemone was in the subset, and no volunteer users identified it. Due to the lack of efficiency in simple majority methods and the results from the MCC tests, we determined that Four Agreed was the most effective method of volunteer agreement.
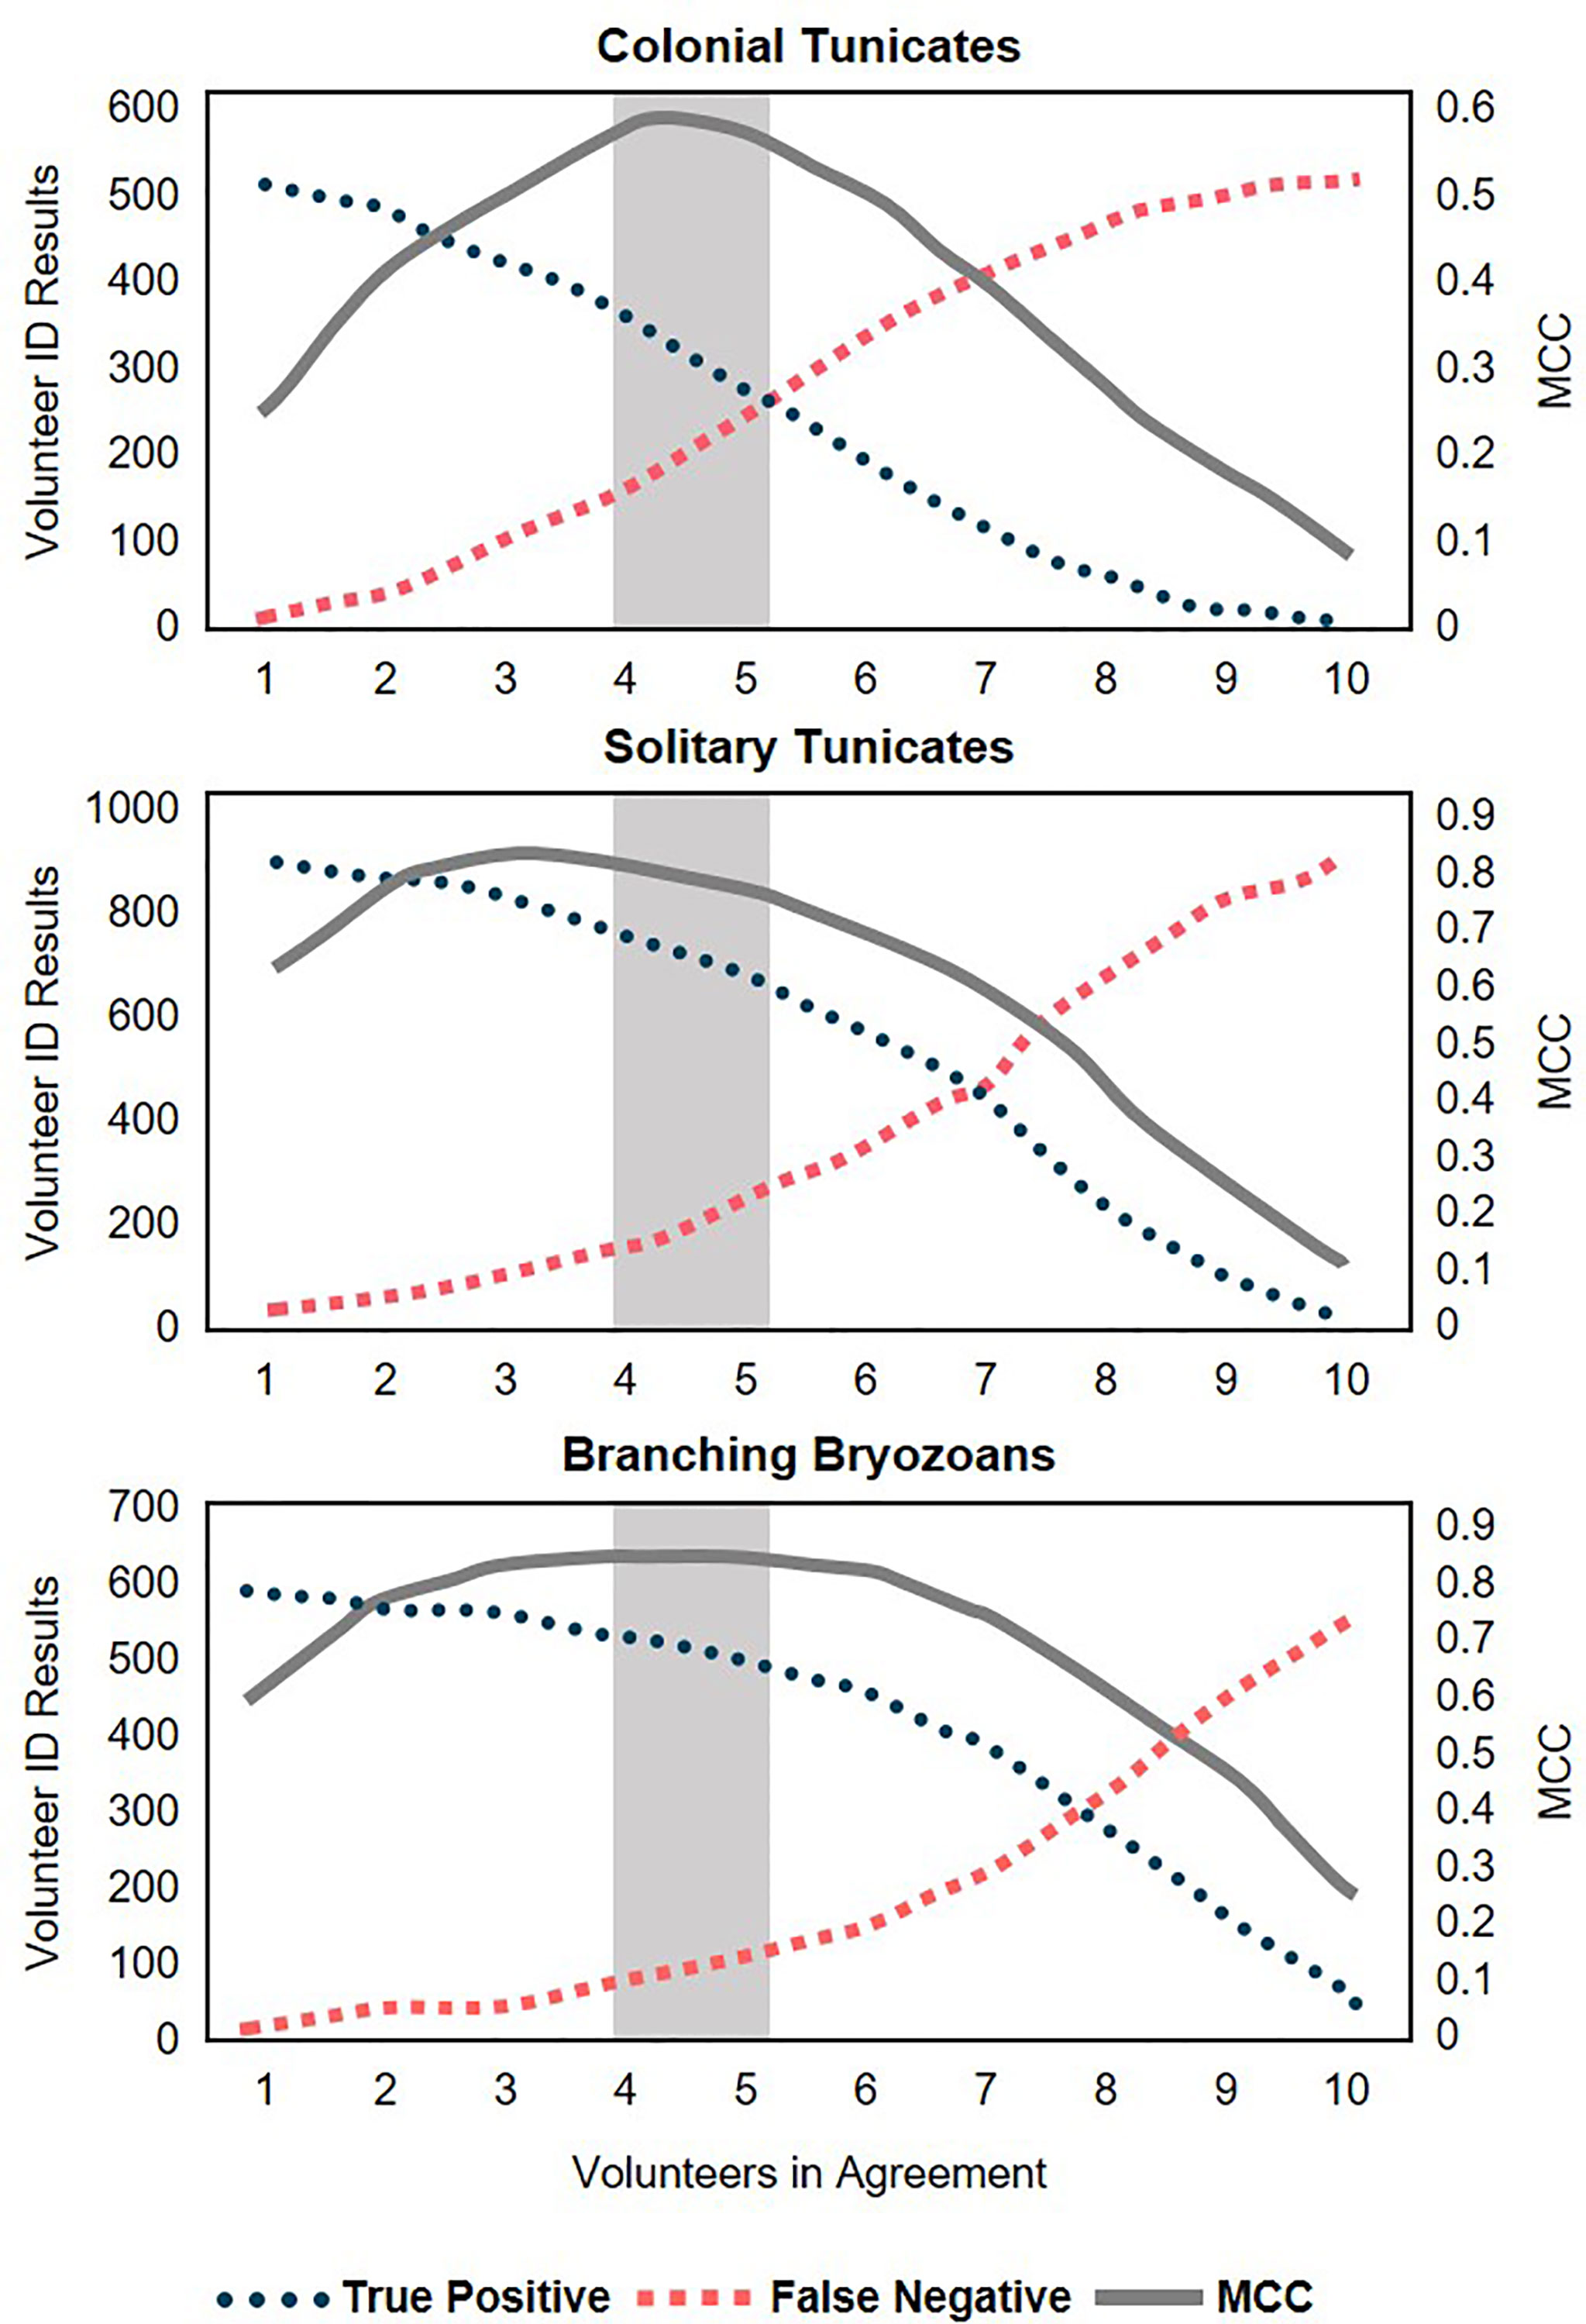
Figure 4 Peak Mathew’s Correlation Coefficient (MCC) reflecting the trade-off between accuracy (highest number of true positives) and false negatives as more users are required to agree. Shaded area between two potential consensus methods of Four Agreed and Five Agreed.
Volunteer Accuracy
For the common taxa (those with at least 100 points represented in the sub sample), Branching Bryozoans (Four Agreed 85%, Five Agreed 89%) and Solitary Tunicates (Four Agreed 91%, Five Agreed 94%) were identified with high accuracy (Figure 2). Other common taxa were identified correctly more often than not; Colonial Tunicates, (Four Agreed 64%, Five Agreed 76%) and Bare Space (Four Agreed 67%, Five Agreed 74%).
Comparisons of points where volunteers were unable to come to consensus showed that there is a significant difference in the type of taxa that volunteers were likely to disagree on. We compiled scientists’ identifications for points that were unable to reach consensus by volunteers to a random subset of identifications. Volunteers disproportionately missed or successfully identified different taxa compared to their expected distribution at both the threshold of both Four Agreed (χ2 = 18.932, df = 7, p = 0.008) and Five Agreed (χ2 = 18.925, df = 8, p = 0.015). At the threshold of Four Agreed, volunteers were more likely to disagree on a point when it showed a bare point or a Barnacle. Volunteers did better than expected for Branching Bryozoans and Solitary Tunicates in particular. At the threshold of Five Agreed, volunteers were still likely to disagree on Bare points, but with the higher threshold of agreement Colonial Tunicates and Algae were also more likely to not get identifications. Solitary Tunicates remained identified better than expected, as did Branching Bryozoans.
Community Composition
Although models predicted 100% agreement for Four Agreed and Five Agreed, if at least eight or nine people viewed each photo respectively, and in our dataset ten people viewed each photo, a portion of photos did not reach consensus. For Four Agreed, 721 of 9,115 points (7.9%) were unable to reach agreement and for Five Agreed, 2,020 of 9,115 points (22.2%) were unable to reach agreement.
Non-metric multi-dimensional scaling on 186 panels with at least 30 points identified by volunteers (via the Four Agreed Method) showed evident overlap between communities measured by volunteers and scientists (R2 = 0.971, stress = 0.17, Figure 5). PERMANOVA analysis on the same dataset revealed that there is a significant difference between the composition measured by each group, but that it accounts for an extremely low percent of the variation in the dataset (Block: Panel, r2 = 0.017, p = 0.001). The panel location in San Francisco Bay had a much stronger impact on community composition (PERMANOVA, r2 = 0.35, p = 0.001). Barnacles (1.97, -0.75), Branching Bryozoans (-0.60, -0.75) and Solitary Tunicates (-0.48, 0.55) were responsible for most of the difference between measurements (Figure 5) which reflects common functional differences between invertebrate communities within San Francisco Bay (personal observation, authors).
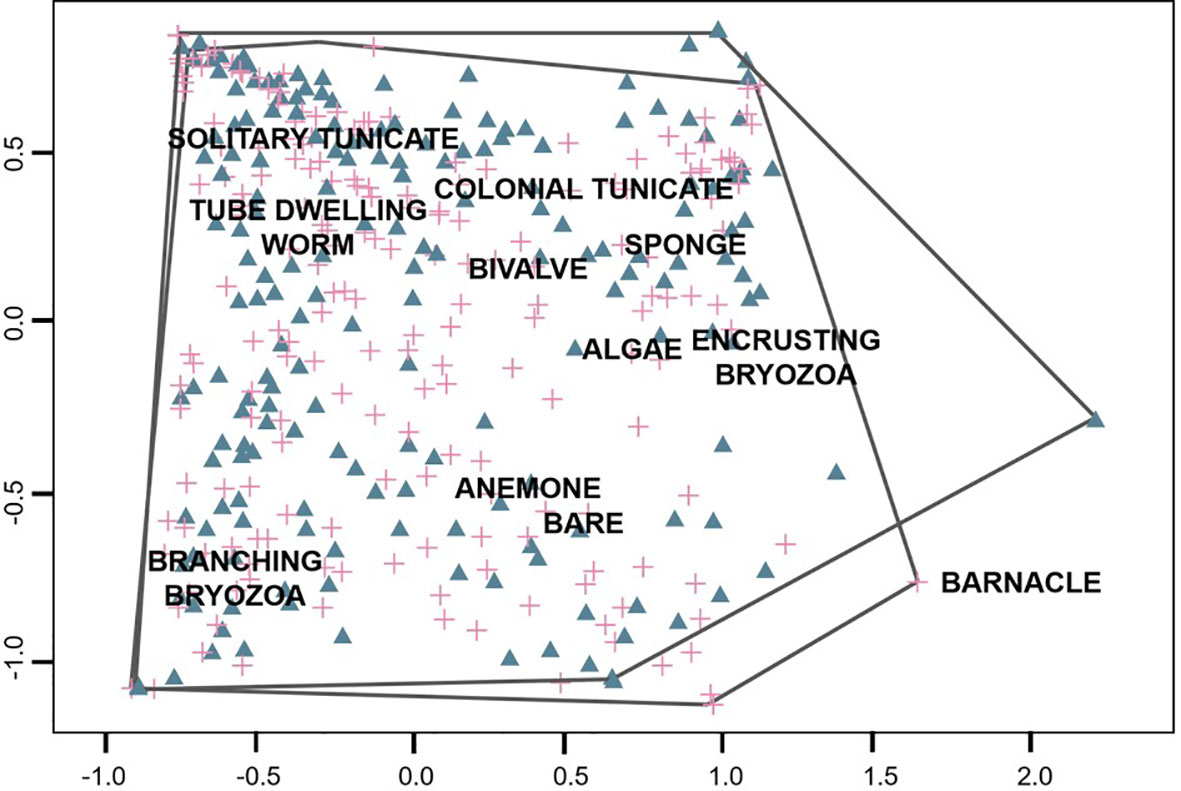
Figure 5 NMDS plot of community measurements taken by volunteers and scientists (enclosures). Panel measurements are represented in triangles (volunteers) and crosses (scientists).
Volunteer Efficiency
Between 17 October 2017 and 2 January 2020 there were 4,089 individually identifiable online volunteers, with at least 200 more potential unique users. Each user identified 1.76 points per session on average (median of 1 identification per session). Per identifiable unique individual, users returned on average for 1.76 sessions and completed an average of 23.4 points during the study interval. A small portion of volunteers was responsible for the vast majority of identifications, with 3% of all volunteers identifying 63% of all points, and 115 people identifying 100 or more points. The project gained an average of 146.87 identifications per day, with the official social media launch week contributing the most identifications (Figure 6).
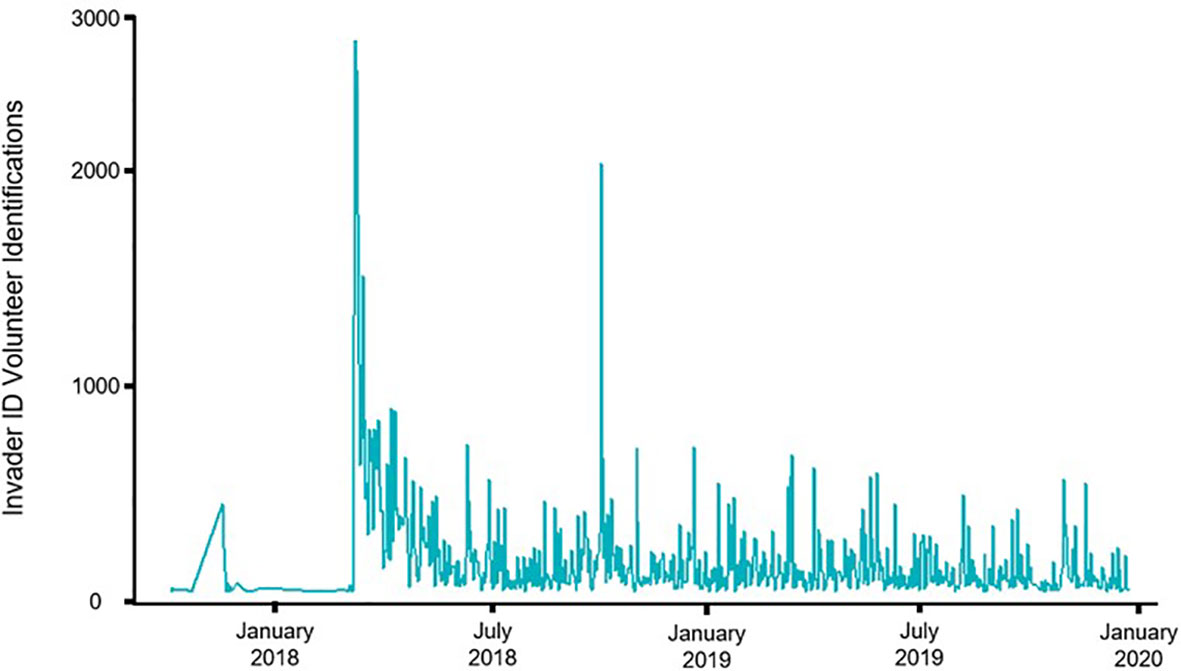
Figure 6 Volunteer identifications over time on Invader ID, the official public launch occurred in March 2018.
Discussion
Our results from Invader ID show that volunteer identifications of the biofouling community accurately reflect similar measurements made by scientists. By utilizing the consensus method, researchers can rely on the accuracy of identifications made by volunteers. Volunteers were especially good at identifying Branching Bryozoans and Solitary Tunicates, suggesting that large and easily recognizable taxa are good future subjects for citizen science research. Our community analysis showed that although compositions recorded by volunteers or scientists were significantly different, this had a minimal overall impact on community composition when compared to the panel’s location in the Bay. Very little separation between volunteers and scientists existed on NMDS plots, suggesting that community composition measurements were relatively similar between methods, despite strong site-based variation. Because volunteers were often unable to come to a consensus when a point was unoccupied (Bare), our research also suggests that better user training to recognize Bare spaces in particular could greatly improve the accuracy of community analyses and further strengthen our citizen science program.
There is not a set standard for volunteer accuracy requirements in citizen science, and any suggested standards would vary across ecological systems and data uses (Lewandowski and Specht, 2015). In our study, community composition measurements from photos were shown to be comparable between scientists and volunteers; however, some individual taxa groups were frequently misidentified by volunteers. We recommend future biofouling citizen science projects to look at either whole community composition, or within the highly accurate taxa groups (Solitary Tunicates and Branching Bryozoans). Further research on volunteer accuracy among the taxa groups that were rare in our study (e.g. Anemones, Bivalves, Barnacles) is warranted to determine if infrequent taxa occurrence impacted volunteer’s ability to recognize them. Selecting the best consensus method, four people in agreement in our case, depends on the priorities of each project, and evaluations should incorporate both accuracy and minimizing the effort required by volunteers.
For the purpose of this study, we assumed that gold standard identifications were accurate and without error, though this is unlikely (Barratt et al., 2003; Gardiner et al., 2012). Identifications made from photographs inherently include some error, regardless of who is making the identifications (professionals or volunteers) and we assumed that the identifications made in the gold standard database are the “correct” identifications as they are likely the best available. We recognize that the gold standard identifications may include identification errors, as even amongst experts there may be some disagreement and error.
This type of volunteer work allows scientists to focus on project elements that require specific access or deep expertise, like deploying panels and analyzing data, rather than processing sample data. We believe that continued use of volunteer data will help invasive species scientists track community-level changes and expand their monitoring efforts to new sites. Besides the benefits of volunteer efforts to increase the scope of this project beyond the capacity of professional scientists, citizen science has many other important societal benefits such as the potential to increase scientific literacy, increase trust in science, and increase the ownership of conservation issues by the public (Walker et al., 2020). Additionally, virtual citizen science platforms and online engagement expand access to participation for those with different levels of physical ability or resources. Reducing the amount of travel required to complete global monitoring networks should be a priority of any conservation program, and photo-based analysis could allow for local participants to collect data for analysis by worldwide volunteers. This would also open up opportunities for us to support community-developed questions and focus on specific species of regional interest. Invader ID, and online programs like it, provides the opportunity for volunteers to better understand the scientific method and research process, the best examples of which are through direct communication on the chat boards with invertebrate experts and through exposure to dichotomous keys, morphology, and taxonomy.
Volunteer recruitment efforts could greatly increase the speed at which subjects are identified through Zooniverse. Other studies have shown that projects should pay more attention to rewarding volunteer time, develop ways to become a useful or fun resource for volunteers, and increase online interaction between scientists and volunteers to increase participation (Sullivan et al., 2009; Jennett et al., 2016). Moreover, the chatboard gives volunteers the opportunity to check their answers and not become frustrated with the project. We therefore expect that increased activity on Zooniverse chatboards, more useful online toolkits like identification maps and record log books, and increased in-person interaction with volunteers in classrooms would expand our userbase in the future.
Our participation data shows that most of our volunteers try Invader ID only once. Other studies also documented that the most volunteer effort is short lived, often lasting for only one day (Galaxy Zoo and Milky Way Project, Ponciano et al. 2014). Online citizen science projects, including other Zooniverse projects, typically have skewed participation, where a lot of people participate a little (Jennett et al., 2016; Masters et al., 2016). This is common to online projects because of the low bar to entry. This participation level is therefore not disheartening, but representative of the broad reach of Zooniverse platform.
Invader ID data can be used in many ways. It can create temporal models, track seasonality or settlement periods to identify the best season to attempt an eradication, and create geographical maps of taxa abundance, track phase shifts, or be used to narrow the search for particular target taxa. Other citizen science programs have had success identifying taxa to the species level if search lists are kept to a limited number of easily identifiable species (See Thiel et al., 2014). Target taxa, especially those species in groups we showed have high user accuracy like Solitary Tunicates, Branching Bryozoans, and Colonial Tunicates, could be tracked on the edges of their non-native range (e.g. Solitary Tunicate Styela clava Herdman, 1881 in Alaska, Branching Bryozoan Bugula neritina (Linnaeus, 1758) in Alaska, Amathia verticillata (delle Chiaje, 1822) in California, Colonial Tunicate Didemnum vexillum Kott, 2002 in Alaska) by volunteers and flagged for early detection and rapid response management. Furthermore, data gathered by volunteers on the abundance of nuisance species like solitary tunicates, can be important for fisheries planning, as such species have been known to have significant economic impacts (Uribe and Etchepare, 2002; Edwards and Leung, 2009). Finally, this type of annotated time-lapse imagery can be employed as a training tool for machine learning algorithms to automate data extraction.
The Invader ID pilot project has laid the foundation for a large, online citizen science management network for the marine biofouling community. With the confirmation of community measurement accuracy, and the determination of the most reliable taxa to further examine by species, we can now launch our verified methods and protocols to new places. With a repeatable field method in settlement panels, a proven consensus method for volunteer identifications, and a network of trained invasive species experts to identify species and locations of interest, we believe Invader ID and citizen science can greatly contribute to future non-native management efforts.
Data Availability Statement
The raw data supporting the conclusions of this article will be made available by the authors, without undue reservation.
Author Contributions
KL, BT, and AC contributed to the conception and design of the study. AC and MS administered the online program. KL and JM completed formal analyses. KL organized the data. KL, BT, and AC wrote the first draft of the manuscript. BT prepared visualizations. All authors contributed to manuscript revision, read, and approved the submitted version.
Funding
This publication uses data generated via the Zooniverse.org platform, development of which is funded by generous support, including a Global Impact Award from Google, and by a grant from the Alfred P. Sloan Foundation. This manuscript is also supported by the SI Hunterdon Fund.
Conflict of Interest
The authors declare that the research was conducted in the absence of any commercial or financial relationships that could be construed as a potential conflict of interest.
Publisher’s Note
All claims expressed in this article are solely those of the authors and do not necessarily represent those of their affiliated organizations, or those of the publisher, the editors and the reviewers. Any product that may be evaluated in this article, or claim that may be made by its manufacturer, is not guaranteed or endorsed by the publisher.
Acknowledgments
Thanks to K. Larson and N. Hitchcock for helping us create the gold standard dataset. Thanks to M. Minton for statistical analysis advice. Thanks to the staff and interns on the Marine Invasions Fouling team for collecting the panels and photographing each panel during the course of their project. Thanks to Z. Ročkaiová for volunteering on Zooniverse and helping to moderate the Invader ID talk pages. Thanks to Zooniverse for help during the project builder phase. Thanks to Smithsonian Volunteers E. Anderson, Kallan Benson, Kim Benson, R. Benson, R. Kang, G. G. Lang, J. Miller, S. Myers, D. Norman, J. O’Malley, J. Pettigrew, C. Simkanin, J. Whitman, and A. Yeh, for participating in our focus groups.
Supplementary Material
The Supplementary Material for this article can be found online at: https://www.frontiersin.org/articles/10.3389/fmars.2022.862430/full#supplementary-material
References
Aceves-Bueno E., Adeleye A. S., Feraud M., Huang Y., Tao M., Yang Y., et al. (2017). The Accuracy of Citizen Science Data Review: A Quantitative Review. Bull. Ecol. Soc. America 98 (4), 278–290. doi: 10.1002/bes2.1336
Alabri A., Hunter J. (2010). “Enhancing the Quality and Trust of Citizen Science Data,” in 2010 IEEE Sixth International Conference. 81–88.
Azzurro E., Broglio E., Maynou F., Bariche M. (2013). Citizen Science Detects the Undetected: The Case of Abudefduf Saxatilis From the Mediterranean Sea. Manage. Biol. Invasions 4 (2), 167–170. doi: 10.3391/mbi.2013.4.2.10
Ballard H. L., Dixon C. G. H., Harris E. M. (2017). Youth-Focused Citizen Science: Examining the Role of Environmental Science Learning and Agency for Conservation. Biol. Conserv. 208, 65–75. doi: 10.1016/j.biocon.2016.05.024
Barlow K. E., Briggs P. A., Haysom K. A., Hutson A. M., Lechiara N. L., Racey P. A., et al. (2015). Citizen Science Reveals Trends in Bat Populations: The National Bat Monitoring Programme in Great Britain. Biol. Conserv. 182, 14–26. doi: 10.1016/j.biocon.2014.11.022
Barratt B. I. P., Derraik J. G. B., Rufaut C. G., Goodman A. J., Dickinson K. J. M. (2003). Morphospecies as a Substitute for Coleoptera Species Identification, and the Value of Experience in Improving Accuracy. J. R. Soc. New Z. 33 (2), 583–590. doi: 10.1080/03014223.2003.9517746
Bax N., Carlton J., Mathews-Amos A., Haedrich R., Howarth F., Purcell J., et al. (2001). The Control of Biological Invasions in the World’s Oceans. Conserv. Biol. 15 (5), 1234–1246. doi: 10.1046/j.1523-1739.2001.99487.x
Bax N., Williamson A., Aguero M., Gonzalez E., Geeves W. (2003). Marine Invasive Alien Species: A Threat to Global Biodiversity. Marine Policy 27 (4), 313–323. doi: 10.1016/S0308-597X(03)00041-1
Beever E. A., Ray C., Mot E. P. W., Wilkening J. L. (2010). Testing Alternative Models of Climate-Mediated Extirpations. Ecol. Applications. 20 (1), 164–178. doi: 10.1890/08-1011.1
Bonney R., Byrd J., Carmichael J. T., Cunningham L., Oremland L., Shirk J., et al. (2021). Sea Change: Using Citizen Science to Inform Fisheries Management. BioScience 71 (5), 519–530. doi: 10.1093/biosci/biab016
Bonney R., Cooper C. B., Dickinson J., Kelling S., Phillips T., Rosenberg K. V., et al. (2009). Citizen Science: A Developing Tool for Expanding Science Knowledge and Scientific Literacy. BioScience 59 (11), 977–984. doi: 10.1525/bio.2009.59.11.9
Bonney R., Shirk J. L., Phillips T. B., Wiggins A., Ballard H. L., Miller-Rushing A. J., et al. (2014). Next Steps for Citizen Science. Science 343 (6178), 1436–1437. doi: 10.1126/science.1251554
Boudreau S. A., Yan N. D. (2004). Auditing the Accuracy of a Volunteer-Based Surveillance Program for an Aquatic Invader Bythotrephes. Environ. Monitoring Assess. 91 (1–3), 17–26. doi: 10.1023/B:EMAS.0000009228.09204.b7
Boughorbel S., Jarray F., El-Anbari M. (2017). Optimal Classifier for Imbalanced Data Using Matthews Correlation Coefficient Metric. PloS One 12 (6), e0177678. doi: 10.1371/journal.pone.0177678
Brown E. D., Williams B. K. (2018). The Potential for Citizen Science to Produce Reliable and Useful Information in Ecology. Conserv. Biol. 33 (3), 561–569. doi: 10.1111/cobi.13223
Carr T., Ranco D. (2017). Citizen Science and Traditional Ecological Knowledge – Values of Inclusion in the Wabanaki Youth Science Program. Marine Policy Review 26 (2), 86–88.
Chang A. L., Brown C. W., Crooks J. A., Ruiz G. M. (2018). Dry and Wet Periods Drive Rapid Shifts in Community Assembly in an Estuarine Ecosystem. Global Change Biol. 24 (2), e627–e642. doi: 10.1111/gcb.13972
Chapman M. (1998). Relationships Between Spatial Patterns of Benthic Assemblages in a Mangrove Forest Using Different Levels of Taxonomic Resolution. Mar Ecol. Prog. Ser. 162, 71–78. doi: 10.3354/meps162071
Chicco D., Jurman G. (2020). The Advantages of the Matthews Correlation Coefficient (MCC) Over F1 Score and Accuracy in Binary Classification Evaluation. BMC Genomics 21 (1), 6. doi: 10.1186/s12864-019-6413-7
Cigliano J. A., Meyer R., Ballard H. L., Freitag A., Phillips T. B., Wasser A. (2015). Making Marine and Coastal Citizen Science Matter. Ocean Coastal Manage. 115, 77–87. doi: 10.1016/j.ocecoaman.2015.06.012
Conrad C. C., Hilchey K. G. (2011). A Review of Citizen Science and Community-Based Environmental Monitoring: Issues and Opportunities. Environ. Monitoring Assess. 176 (1–4), 273–291. doi: 10.1007/s10661-010-1582-5
Cooper C. B., Shirk J., Zuckerberg B. (2014). The Invisible Prevalence of Citizen Science in Global Research: Migratory Birds and Climate Change. PloS One 9 (9), e106508 doi: 10.1371/journal.pone.0106508
Crall A. W., Newman G. J., Jarnevich C. S., Stohlgren T. J., Waller D. M., Graham J. (2010). Improving and Integrating Data on Invasive Species Collected by Citizen Scientists. Biol. Invasions 12 (10), 3419–3428. doi: 10.1007/s10530-010-9740-9
Defeo O., Lercari D. (2004). Testing Taxonomic Resolution Levels for Ecological Monitoring in Sandy Beach Macrobenthic Communities. Aquat. Conserv: Marine Freshwater Ecosyst 14 (1), 65–74. doi: 10.1002/aqc.594
Delaney D. G., Sperling C. D., Adams C. S., Leung B. (2008). Marine Invasive Species: Validation of Citizen Science and Implications for National Monitoring Networks. Biol. Invasions 10 (1), 117–128. doi: 10.1007/s10530-007-9114-0
Dennis E. B., Morgan B. J. T., Brereton T. M., Roy D. B., Fox R. (2017). Using Citizen Science Butterfly Counts to Predict Species Population Trends. Conserv. Biol. 31 (6), 1350–1361. doi: 10.1111/cobi.12956
de Sherbinin A., Bowser A., Chuang T. R., Cooper C., Danielsen F., Edmunds R., et al. (2021). The Critical Importance of Citizen Science Data. Front. Climate 3, 20. doi: 10.3389/fclim.2021.650760
Dickinson J. L., Zuckerberg B., Bonter D. N. (2010). Citizen Science as an Ecological Research Tool: Challenges and Benefits. Annu. Rev. Ecol Evol Syst 41 (1), 149–172. doi: 10.1146/annurev-ecolsys-102209-144636
Downs R. R., Ramapriyan H. K., Peng G., Wei Y. (2021). Perspectives on Citizen Science Data Quality. Front. Climate. 3. doi: 10.3389/fclim.2021.615032
Edwards P. K., Leung B. (2009). Re-Evaluating Eradication of Nuisance Species: Invasion of the Tunicate, Ciona Intestinalis. Front. Ecol. Environ. 7 (6), 326–332. doi: 10.1890/070218
Follett R., Strezov V. (2015). An Analysis of Citizen Science Based Research: Usage and Publication Patterns. PloS One 10 (11), e0143687. doi: 10.1371/journal.pone.0143687
Fritz S., See L., Carlson T., Haklay M., Oliver J. L., Fraisl D., et al. (2019). Citizen Science and the United Nations Sustainable Development Goals. Nat. Sustainability 2, 922–930. doi: 10.1038/s41893-019-0390-3
Gardiner M. M., Allee L. L., Brown P. M., Losey J. E., Roy H. E., Smyth R. R. (2012). Lessons From Lady Beetles: Accuracy of Monitoring Data From US and UK Citizen-Science Programs. Front. Ecol. Environ. 10 (9), 471–476. doi: 10.1890/110185
Hines G., Swanson A., Kosmala M., Lintott C. (2015). “Aggregating User Input in Ecology Citizen Science Projects,” in Proceedings of the Twenty-Seventh Conference on Innovative Applications of Artificial Intelligence. AAAI.
iNaturalist (2021) Inaturalist. Available at: https://www.inaturalist.org/pages/about (Accessed 6 October 2021).
Irwin A. (2018). No PhDs Needed: How Citizen Science is Transforming Research. Nature 562 (7726), 480–483. doi: 10.1038/d41586-018-07106-5
Jennett C., Kloetzer L., Schneider D., Iacovides I., Cox A., Gold M., et al. (2016). Motivations, Learning and Creativity in Online Citizen Science. J. Sci. Commun 15 (03), A05. doi: 10.22323/2.15030205
Jones F. M., Allen C., Arteta C., Arthur J., Black C., Emmerson L. M., et al. (2018). Time-Lapse Imagery and Volunteer Classifications From the Zooniverse Penguin Watch Project. Sci. Data 5 (1), 1–13. doi: 10.1038/sdata.2018.124
Kosmala M., Wiggins A., Swanson A., Simmons B. (2016). Assessing Data Quality in Citizen Science. Front. Ecol. Environ. 14 (10), 551–560. doi: 10.1002/fee.1436
Landström C., Becker M., Odoni N., Whatmore S. J. (2019). Community Modelling: A Technique for Enhancing Local Capacity to Engage With Flood Risk Management. Environ. Sci. Policy. 92, 255–261. doi: 10.1016/j.envsci.2018.11.009
Lewandowski E., Specht H. (2015). Influence of Volunteer and Project Characteristics on Data Quality of Biological Surveys. Conserv. Biol. 29 (3), 713–723. doi: 10.1111/cobi.12481
Lintott C. (2019). The Crowd and the Cosmos: Adventures in the Zooniverse (Oxford, United Kingdom: Oxford University Press).
Lodge D. M., Williams S., MacIsaac H. J., Hayes K. R., Leung B., Reichard S., et al. (2006). Biological Invasions: Recommendations for U.S. Policy and Management. Ecol. Appl. 16 (6), 2035–2054. doi: 10.1890/1051-0761(2006)016[2035:BIRFUP]2.0.CO;2
Maistrello L., Dioli P., Bariselli M., Mazzoli G. L., Giacalone-Forini I. (2016). Citizen Science and Early Detection of Invasive Species: Phenology of First Occurrences of Halyomorpha Halys in Southern Europe. Biol. Invasions 18 (11), 3109–3116. doi: 10.1007/s10530-016-1217-z
Marraffini M., Ashton G., Brown C., Chang A., Ruiz G. (2017). Settlement Plates as Monitoring Devices for non-Indigenous Species in Marine Fouling Communities. Manage. Biol. Invasions 8 (4), 559–566. doi: 10.3391/mbi.2017.8.4.11
Marraffini M. L., Geller J. B. (2015). Species Richness and Interacting Factors Control Invasibility of a Marine Community. Proc. R. Soc. B: Biol. Sci. 282 (1812), 20150439. doi: 10.1098/rspb.2015.0439
Masters K., Oh E. Y., Cox J., Simmons B., Lintott C., Graham G., et al. (2016). Science Learning via Participation in Online Citizen Science. J. Sci. Commun 15 (03), A07. doi: 10.22323/2.15030207
Masterson J., Meyer M., Ghariabeh N., Hendricks M., Lee R. J., Musharrat S., et al. (2019). Interdisciplinary Citizen Science and Design Projects for Hazard and Disaster Education. Int. J. mass emergencies disasters 37 (1), 6.
McCord S. E., Webb N. P., Zee J. W. V., Burnett S. H., Christensen E. M., Courtright E. M., et al. (2021). Provoking a Cultural Shift in Data Quality. BioScience 71 (6), 647–657. doi: 10.1093/biosci/biab020
McKinley D. C., Miller-Rushing A. J., Ballard H. L., Bonney R., Brown H., Cook-Patton S. C., et al. (2017). Citizen Science can Improve Conservation Science, Natural Resource Management, and Environmental Protection. Biol. Conserv. 208, 15–28. doi: 10.1016/j.biocon.2016.05.015
McShea W. J., Forrester T., Costello R., He Z., Kays R. (2016). Volunteer-Run Cameras as Distributed Sensors for Macrosystem Mammal Research. Landscape Ecol. 31 (1), 55–66. doi: 10.1007/s10980-015-0262-9
Meschini M., Prati F., Simoncini G. A., Airi V., Caroselli E., Prada F., et al. (2021). Environmental Awareness Gained During a Citizen Science Project in Touristic Resorts is Maintained After 3 Years Since Participation. Front. Marine Science. 8. doi: 10.3389/fmars.2021.584644
NASA (2020) Earth Sciences Data Systems Citizen Science Data Working Group White Paper. Version 1.0. Available at: https://cdn.earthdata.nasa.gov/conduit/upload/14273/CSDWG-White-Paper.pdf (Accessed 24 April 2020).
Newcomer K., Tracy B. M., Chang A. L., Ruiz G. M. (2019). Evaluating Performance of Photographs for Marine Citizen Science Applications. Front. Marine Sci. 6. doi: 10.3389/fmars.2019.00336
Oksanen J., Guillaume Blanchet F., Firendly M., Kindt R., Legendre P., Minchin P. R., et al (2020). vegan: Community Ecology Package. R package version 2.5-7. Available at: https://CRAN.R-project.org/package=vegan.
Pagola-Carte S., Urkiaga-Alberdi J., Bustamante M., Saiz-Salinas J. I. (2002). Concordance Degrees in Macrozoobenthic Monitoring Programmes Using Different Sampling Methods and Taxonomic Resolution Levels. Marine Pollut Bull. 44 (1), 63–70. doi: 10.1016/S0025-326X(01)00187-4
Pante E., Dustan P. (2012). Getting to the Point: Accuracy of Point Count in Monitoring Ecosystem Change. J. Marine Biol Hindawi. 2012, 802875 doi: 10.1155/2012/802875
Parrish J. K., Litle K., Dolliver J., Hass T., Burgess H. K., Frost E., et al. (2017). Defining the Baseline and Tracking Change in Seabird Populations: The Coastal Observation and Seabird Survey Team (COASST. Citizen Sci. coastal marine Conserv., 19–38. doi: 10.4324/9781315638966
Perkins N. R., Foster S. D., Hill N. A., Barrett N. S. (2016). Image Subsampling and Point Scoring Approaches for Large-Scale Marine Benthic Monitoring Programs. Estuarine Coastal Shelf Sci. 176, 36–46. doi: 10.1016/j.ecss.2016.04.005
Pocock M. J. O., Chapman D. S., Sheppard L. J., Roy H. E. (2014). A Strategic Framework to Support the Implementation of Citizen Science for Environmental Monitoring (Wallingford, Oxfordshire: Centre for Ecology & Hydrology). Available at: http://www.ceh.ac.uk/products/publications/understanding.
Ponciano L., Brasileiro F., Simpson R., Smith A. (2014). Volunteers’ Engagement in Human Computation for Astronomy Projects. Comput Sci. Eng. 16 (6), 52–59. doi: 10.1109/MCSE.2014.4
Ramirez-Andreotta M. D., Brusseau M. L., Artiola J., Maier R. M., Gandolfi A. J. (2015). Building a Co-Created Citizen Science Program With Gardeners Neighboring a Superfund Site: The Gardenroots Case Study. Int. Public Health J. 7 (1), 13.
R Core Team (2021). “R: A Language and Environment for Statistical Computing,” R Foundation for Statistical Computing (Vienna, Austria). Available at: https://www.R-project.org/.
Ries L., Oberhauser K. (2015). A Citizen Army for Science: Quantifying the Contributions of Citizen Scientists to Our Understanding of Monarch Butterfly Biology. BioScience 65 (4), 419–430. doi: 10.1093/biosci/biv011
Rosenthal I. S., Byrnes J. E. K., Cavanaugh K. C., Bell T. W., Harder B., Haupt A. J., et al. (2018). Floating Forests: Quantitative Validation of Citizen Science Data Generated From Consensus Classifications arXiv preprint arXiv: 1801.08522. doi: 10.48550/arXiv.1801.08522
Ruiz G. M., Carlton J. T., Grosholz E. D., Hines A. H. (1997). Global Invasions of Marine and Estuarine Habitats by Non-Indigenous Species: Mechanisms, Extent, and Consequences. Am. Zool 37 (6), 621–632. doi: 10.1093/icb/37.6.621
Ruiz G. M., Fofonoff P. W., Carlton J. T., Wonham M. J., Hines A. H. (2000). Invasion of Coastal Marine Communities in North America: Apparent Patterns, Processes, and Biases. Ann Rev Ecol Systematics 31 (1), 481–531.
Ruiz G. M., Fofonoff P., Hines A. H., Grosholz E. D. (1999). Non-Indigenous Species as Stressors in Estuarine and Marine Communities: Assessing Invasion Impacts and Interactions. Limnol Oceanogr 44 (3part2), 950–972. doi: 10.4319/lo.1999.44.3_part_2.0950
Ruiz G. M., Fofonoff P. W., Steves B. P., Carlton J. T. (2015). Invasion History and Vector Dynamics in Coastal Marine Ecosystems: A North American Perspective. Aquat. Ecosystem Health Manage. 18 (3), 299–311. doi: 10.1080/14634988.2015.1027534
Sandahl A., Tøttrup A. P. (2020). Marine Citizen Science: Recent Developments and Future Recommendations. Citizen Science: Theory Practice 5 (1), 24. doi: 10.5334/cstp.270
Santori C., Keith R. J., Whittington C. M., Thompson M. B., Dyke J. U. V., Spencer R.-J. (2021). Changes in Participant Behaviour and Attitudes are Associated With Knowledge and Skills Gained by Using Turtle Conservation Citizen Science App. People Nature. 3 (1), 66–76. doi: 10.1002/pan3.10184
Scyphers S. B., Powers S. P., Akins J. L., Drymon J. M., Martin C. W., Schobernd Z. H., et al. (2014). The Role of Citizens in Detecting and Responding to a Rapid Marine Invasion. Conserv. Lett. 8 (4), 242–250. doi: 10.1111/conl.12127
Sousa L. B., Fricker S. R., Doherty S. S., Webb C. E., Baldock K. L., Williams C. R. (2020). Citizen Science and Smartphone E-Entomology Enables Low-Cost Upscaling of Mosquito Surveillance. Sci. Total Environ 704 (135349), 135349. doi: 10.1016/j.scitotenv.2019.135349
Specht H., Lweandowski E. (2018). Biased Assumptions and Oversimplifications in Evaluations of Citizen Science Data Quality. Bull. Ecol. Soc. America 99 (2), 251–256. doi: 10.1002/bes2.1388
Stachowicz J. J., Fried H., Osman R. W., Whitlatch R. B. (2002). Biodiversity, Invasion Resistance, and Marine Ecosystem Function: Reconciling Pattern and Process. Ecology 83 (9), 2575–2590. doi: 10.1890/0012-9658(2002)083[2575:BIRAME]2.0.CO;2
Stachowicz J. J., Whitlatch R. B., Osman R. W. (1999). Species Diversity and Invasion Resistance in a Marine Ecosystem. Science 286 (5444), 1577–1579. doi: 10.1126/science.286.5444.1577
Sullivan B. L., Wood C. L., Iliff M. J., Bonney R. E., Fink D., Kelling S. (2009). Ebird: A Citizen-Based Bird Observation Network in the Biological Sciences. Biol. Conserv. 142 (10), 2282–2292. doi: 10.1016/j.biocon.2009.05.006
Sun C. C., Fuller A. K., Hurst J. E. (2018). Citizen Science Data Enhance Spatio-Temporal Extent and Resolution of Animal Population Studies. bioRxiv 352708. doi: 10.1101/352708
Sutherland J. P. (1974). Multiple Stable Points in Natural Communities. Am. Nat., 108 (964), 859–873. doi: 10.1086/282961
Swanson A., Kosmala M., Lintott C., Packer C. (2016). A Generalized Approach for Producing, Quantifying, and Validating Citizen Science Data From Wildlife Images. Conserv. Biol. 30 (3), 520–531. doi: 10.1111/cobi.12695
Swanson A., Kosmala M., Lintott C., Simpson R., Smith A., Packer C. (2015). Snapshot Serengeti, High-Frequency Annotated Camera Trap Images of 40 Mammalian Species in an African Savanna. Sci. Data 2 (1), 1–14. doi: 10.1038/sdata.2015.26
Tamburini M., Keppel E., Marchini A., Repetto M. F., Ruiz G. M., Ferrario J., et al. (2021). Monitoring Non-Indigenous Species in Port Habitats: First Application of a Standardized North American Protocol in the Mediterranean Sea. Front. Marine Sci. 8, 904. doi: 10.3389/fmars.2021.700730
Theobald E. J., Ettinger A. K., Burgess H. K., DeBey L. B., Schmidt N. R., Froehlich H. E., et al. (2015). Global Change and Local Solutions: Tapping the Unrealized Potential of Citizen Science for Biodiversity Research. Biol. Conserv. 181, 236–244. doi: 10.1016/j.biocon.2014.10.021
Thiel M., Penna-Díaz M. A., Luna-Jorquera G., Salas S., Sellanes J., Stotz W. (2014). Citizen Scientists and Marine Research: Volunteer Participants, Their Contributions, and Projection for the Future. Oceanogr Marine Biol: Annu. Rev. 52, 257–314. doi: 10.1201/b17143-6
Uribe E., Etchepare I. (2002). Effects of Biofouling by Ciona Intestinalis on Suspended Culture of Argopecten Purpuratus in Bahia Inglesa, Chile. Bull. Aquacult Assoc. Canada 102, 93–95.
Walker D. W., Smigaj M., Tani M. (2020). The Benefits and Negative Impacts of Citizen Science Application to Water as Experienced by Participants and Communities. Wiley Interdiscip. Reviews: Water 8 (1), 1488. doi: 10.1002/wat2.1488
Zenetos A., Koutsogiannopoulos D., Ovalis P., Poursanidis D. (2013). The Role Played by Citizen Scientists in Monitoring Marine Alien Species in Greece. Cahiers Biol Marine 54 (3), 419–426.
Keywords: citizen science (CS), fouling, invasive (exotic non-native) species, benthos, taxonomy, photos
Citation: Lawson KN, Tracy BM, Sharova M, Muirhead JR and Cawood A (2022) Engaging Online Citizen Scientists and the Consensus Method to Monitor the Marine Biofouling Community. Front. Mar. Sci. 9:862430. doi: 10.3389/fmars.2022.862430
Received: 25 January 2022; Accepted: 07 March 2022;
Published: 13 April 2022.
Edited by:
Anne Chenuil, Centre National de la Recherche Scientifique (CNRS), FranceReviewed by:
Lucia Fanini, Hellenic Center for Marine Research, GreeceJohn A. Cigliano, Cedar Crest College, United States
Copyright © 2022 Lawson, Tracy, Sharova, Muirhead and Cawood. This is an open-access article distributed under the terms of the Creative Commons Attribution License (CC BY). The use, distribution or reproduction in other forums is permitted, provided the original author(s) and the copyright owner(s) are credited and that the original publication in this journal is cited, in accordance with accepted academic practice. No use, distribution or reproduction is permitted which does not comply with these terms.
*Correspondence: Katherine N. Lawson, bmV3Y29tZXIua2F0eUBnbWFpbC5jb20=
†ORCID: Katherine N. Lawson, orcid.org/0000-0003-4062-0979
Brianna M. Tracy, orcid.org/0000-0002-6897-6320
Jim R. Muirhead, orcid.org/0000-0002-0264-3662
Alison Cawood, orcid.org/0000-0002-7849-0412