 Kyra A. St. Pierre1,2*
 Brian P. V. Hunt1,2,3
 Ian J. W. Giesbrecht2,4
 Suzanne E. Tank2,5Ken P. Lertzman2,4Justin Del Bel Belluz2
 Margot L. Hessing-Lewis1,2Angeleen Olson2Tyrel Froese2
- 1Institute for the Oceans and Fisheries, University of British Columbia, Vancouver, BC, Canada
- 2Hakai Institute, Heriot Bay, BC, Canada
- 3Department of Earth, Oceans and Atmospheric Sciences, University of British Columbia, Vancouver, BC, Canada
- 4School of Resource and Environmental Management, Simon Fraser University, Burnaby, BC, Canada
- 5Department of Biological Sciences, University of Alberta, Edmonton, AB, Canada
Globally, coastal waters are considered biogeochemical hotspots because they receive, transform, and integrate materials and waters from both land and the open ocean. Extending from northern California to southeast Alaska, the Northeast Pacific Coastal Temperate Rainforest (NPCTR) region is no exception to this, and hosts a diversity of watershed types (old-growth rainforest, bog forest, glaciers), and tidal (sheltered, exposed) and pelagic marine (deep fjord, shallow estuary, well-mixed channel) environments. With large freshwater fluxes to the coastal ocean, cross-ecosystem connectivity in the NPCTR is expected to be high, but seasonally variable, with pulses in runoff from rainfall, snowmelt and glacial melt, and primary production associated with changes in ocean upwelling and incident light. However, the relative contribution of each ecosystem to surface ocean organic matter pools over time and space remains poorly constrained, despite their importance for the structure and function of coastal marine ecosystems. Here, we use a four-year dataset of particulate organic matter (POM) chemical composition (δ13C, δ15N, C:N ratio) to quantify the relative contributions of watershed materials via riverine inputs, marine phytoplankton, and macrophytes (macroalgae and seagrass) to surface waters (0-10 m) at 11 stations representing fjord, shallow non-fjord estuary, sheltered channel and well-mixed coastal environments at the heart of the NPCTR in British Columbia, Canada. Watershed, marine phytoplankton, and macrophyte contributions to surficial POM ranged between 5-78%, 22-88%, and 0.1-18%, respectively, and varied by season and station. Watershed inputs were the primary source of POM across all stations in winter and were important throughout the year within the fjord. Marine phytoplankton were the principal source of POM in spring and at all stations outside of the fjord through summer and autumn, while macrophyte contributions were greatest in summer. These results demonstrated high, but seasonally and spatially variable, connectivity between ecosystems that are often considered in isolation of one another and highlight the need to consider coastal waters as integrated land-ocean meta-ecosystems. Future work should investigate how heterogeneity in POM sources determines its fate in coastal ecosystems,and the relative importance of different basal organic matter sources for the marine food web.
1 Introduction
Coastal waters experience hydrological, geochemical, and biological forcings from both land and the open ocean (Ward et al., 2020). These forces have combined to shape diverse and productive ecosystems like shallow estuaries, tidal wetlands/rivers/forests, and deep fjords, all systems with immense social, cultural, and economic value (Martínez et al., 2007). Coastal ecosystems are biogeochemical and biodiversity hotspots largely because of the role that large fluxes and the subsequent transformation of terrestrial materials, termed cross-ecosystem subsidies, ultimately play in governing coastal ecosystem function and structure (Bauer et al., 2013; Ward et al., 2017; Gounand et al., 2018). Because of the inherent complexity of coastal ecosystems, the relative influence of watershed (freshwater/terrestrial) and marine drivers for coastal food webs remain poorly resolved over time and space (Ward et al., 2020).
Organic matter forms the foundation of many pelagic food webs. Source is often thought to be a key determinant of organic matter lability, and by extension, its fate in coastal waters (Liu and Xue, 2020). One way in which watershed and marine sources of organic matter can be traced is through the chemical composition of particulate organic matter (POM). POM is an aggregate of all organic materials suspended in the water column, operationally defined here as exceeding 0.7 µm. In coastal waters, the POM pool may include detritus of freshwater and/or marine origin, bacteria, phytoplankton, and microzooplankton (Berto et al., 2013; Liénart et al., 2017). Because each of these POM sources has a distinct chemical profile, chemical characteristics like stable isotope signatures of carbon (δ13C-POC) and nitrogen (δ15N-PN), and molar carbon-to-nitrogen (C:N) ratios can be used to trace watershed, macrophyte, and marine subsidies to coastal surface waters (Walsh et al., 2008; Savoye et al., 2012; Berto et al., 2013; Liénart et al., 2017; Liénart et al., 2020), enabling a quantitative estimate of connectivity between system components (Conway-Cranos et al., 2015).
The northeast Pacific coastal temperate rainforest region (NPCTR) extends from southeast Alaska to northern California and is characterized by ecosystem diversity both on land and in the adjacent coastal ocean (Bidlack et al., 2021). Coastal watersheds within the NPCTR receive upwards of 3000 mm of precipitation per year most of which falls between October and March. These watersheds range from small, low relief, rainfall-dominated watersheds that export substantial quantities of organic matter to coastal waters (Oliver et al., 2017) to larger mainland watersheds that export a mix of rain, snow and glacial melt waters (Giesbrecht et al., 2021). Coastal waters within this region also receive upwelled nutrients and materials from offshore and inshore features (e.g., sills) that fuel high primary production during the spring and summer (Foreman et al., 2011; Jackson et al., 2015). Marine phytoplankton, together with cosmopolitan macrophyte communities that include dominant species like eelgrass (Zostera spp.), rockweed (Fucus spp.), and sea lettuce (Ulva spp.; Blanchette et al., 2008), support many higher trophic level species of local importance (Lucas et al., 2007). Earlier work in parts of the NPCTR has examined watershed carbon contributions to intertidal sediments (Olson et al., 2019), estuarine benthic invertebrates (e.g., Harding and Reynolds, 2014; Conway-Cranos et al., 2015), and fjord pelagic food webs (Arimitsu et al., 2018), in addition to macrophyte contributions to pelagic ecosystems (Ramshaw et al., 2017). However, the relative contributions of watershed organic matter, marine phytoplankton, and macrophytes to coastal pelagic ecosystems of the NPCTR have not been examined despite their co-occurrence.
To address this knowledge gap, we quantified the relative contributions of watersheds (integrated riverine signature that includes soil organic matter, terrestrial detritus, freshwater phytoplankton and macrophytes, glacial exports, etc.), marine macrophytes, and marine phytoplankton to coastal surface (0-10 m) waters across a ~300 km2 seascape of the Central Coast of British Columbia, Canada (Figure 1) using δ13C-POC, δ15N-PN and C:N ratios. Marine ecosystems across this seascape are broadly representative of the inner coastal waters of the more northerly reaches of the NPCTR, characterized by a complex coastline, deep fjords, and a wide continental shelf (Bidlack et al., 2021). We used a four year (2015-2018) dataset of over 700 discrete POM samples collected from 11 coastal marine stations across fjord, estuary, sheltered channel, and well-mixed inner coastal environments that receive varying proportions of rainfall, snow, and glacial melt exports from land. Seasonality across this area is therefore highly complex, driven simultaneously by the variable timing of peak terrestrial runoff and oceanographic dynamics that control upwelling and incident light (Figure 2). Our objectives were therefore to: examine a) seasonal and b) spatial variability in the quantity and composition (δ13C, δ15N, C:N) of POM in marine surface waters across the Central Coast, and c) quantify the relative contributions of watershed materials, marine phytoplankton, and macrophytes to the coastal organic matter pool over time and space using a Bayesian mixing model. We then discuss how source may affect the fate of POM in coastal waters and highlight the need to examine coastal ecosystems as integrated land-ocean meta-ecosystems to fully understand how connectivity shapes ecosystem structure and function both now and into the future.
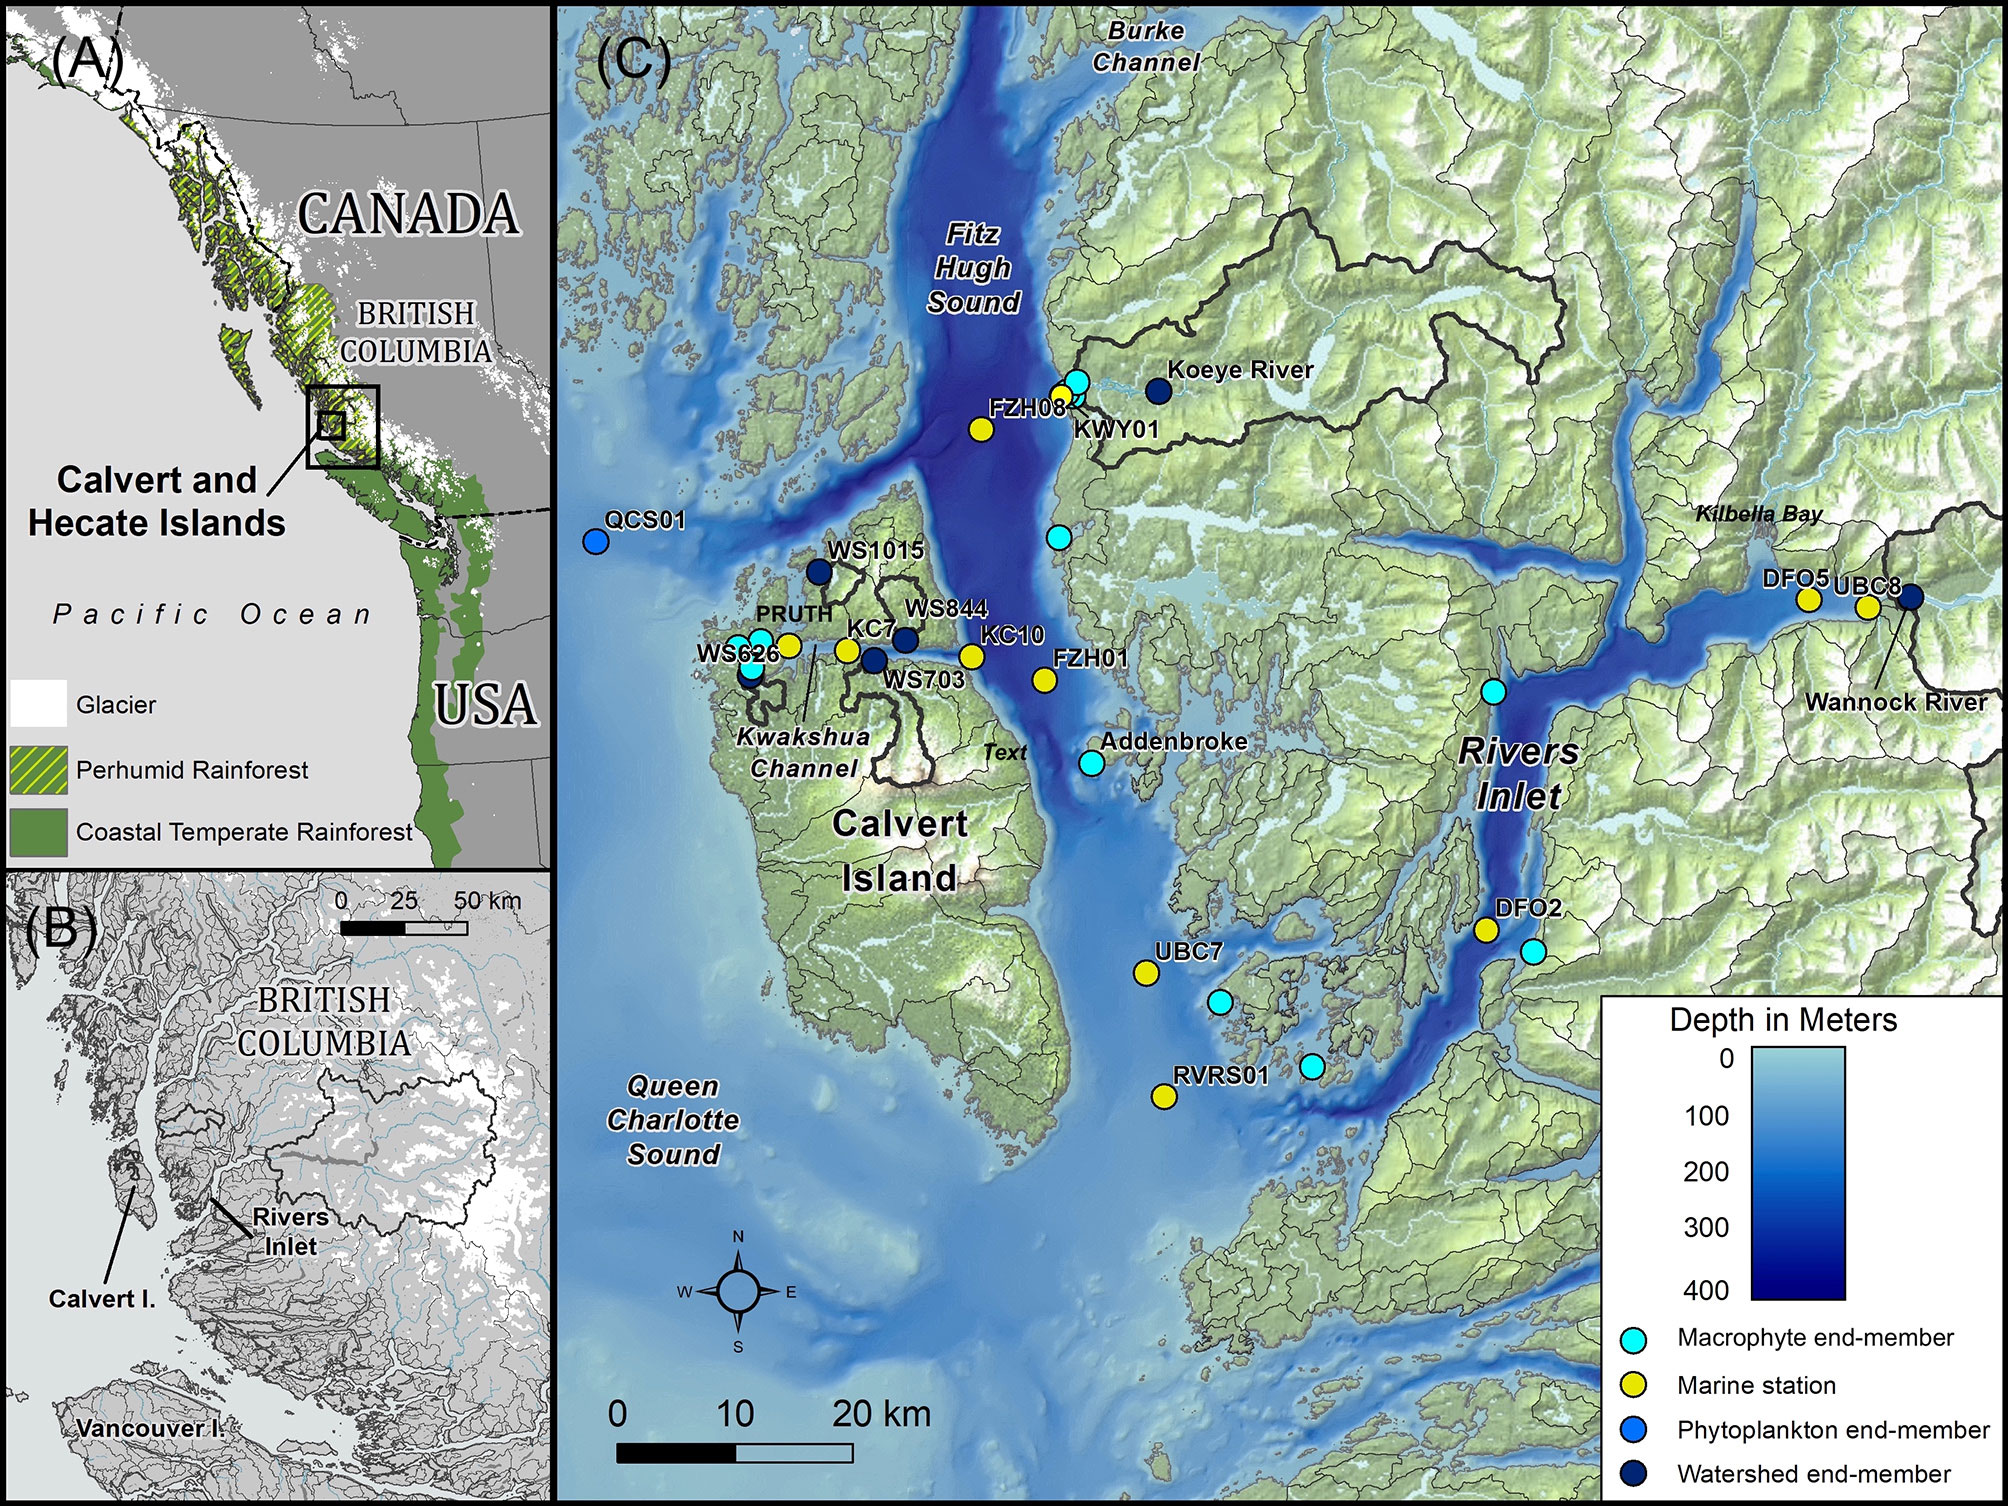
Figure 1 Map of the study area along the Central Coast of British Columbia, Canada. (A) Study area within the Northeast Pacific Coastal Temperate Rainforest region, showing the extent of glaciers along the coast. (B) Inset of the study area showing the entirety of the watersheds draining into Rivers Inlet. (C) Sampling locations within the study area. Watersheds greater than 2.5 km2 are delineated in grey, with sampled watersheds indicated by thick black outlines.
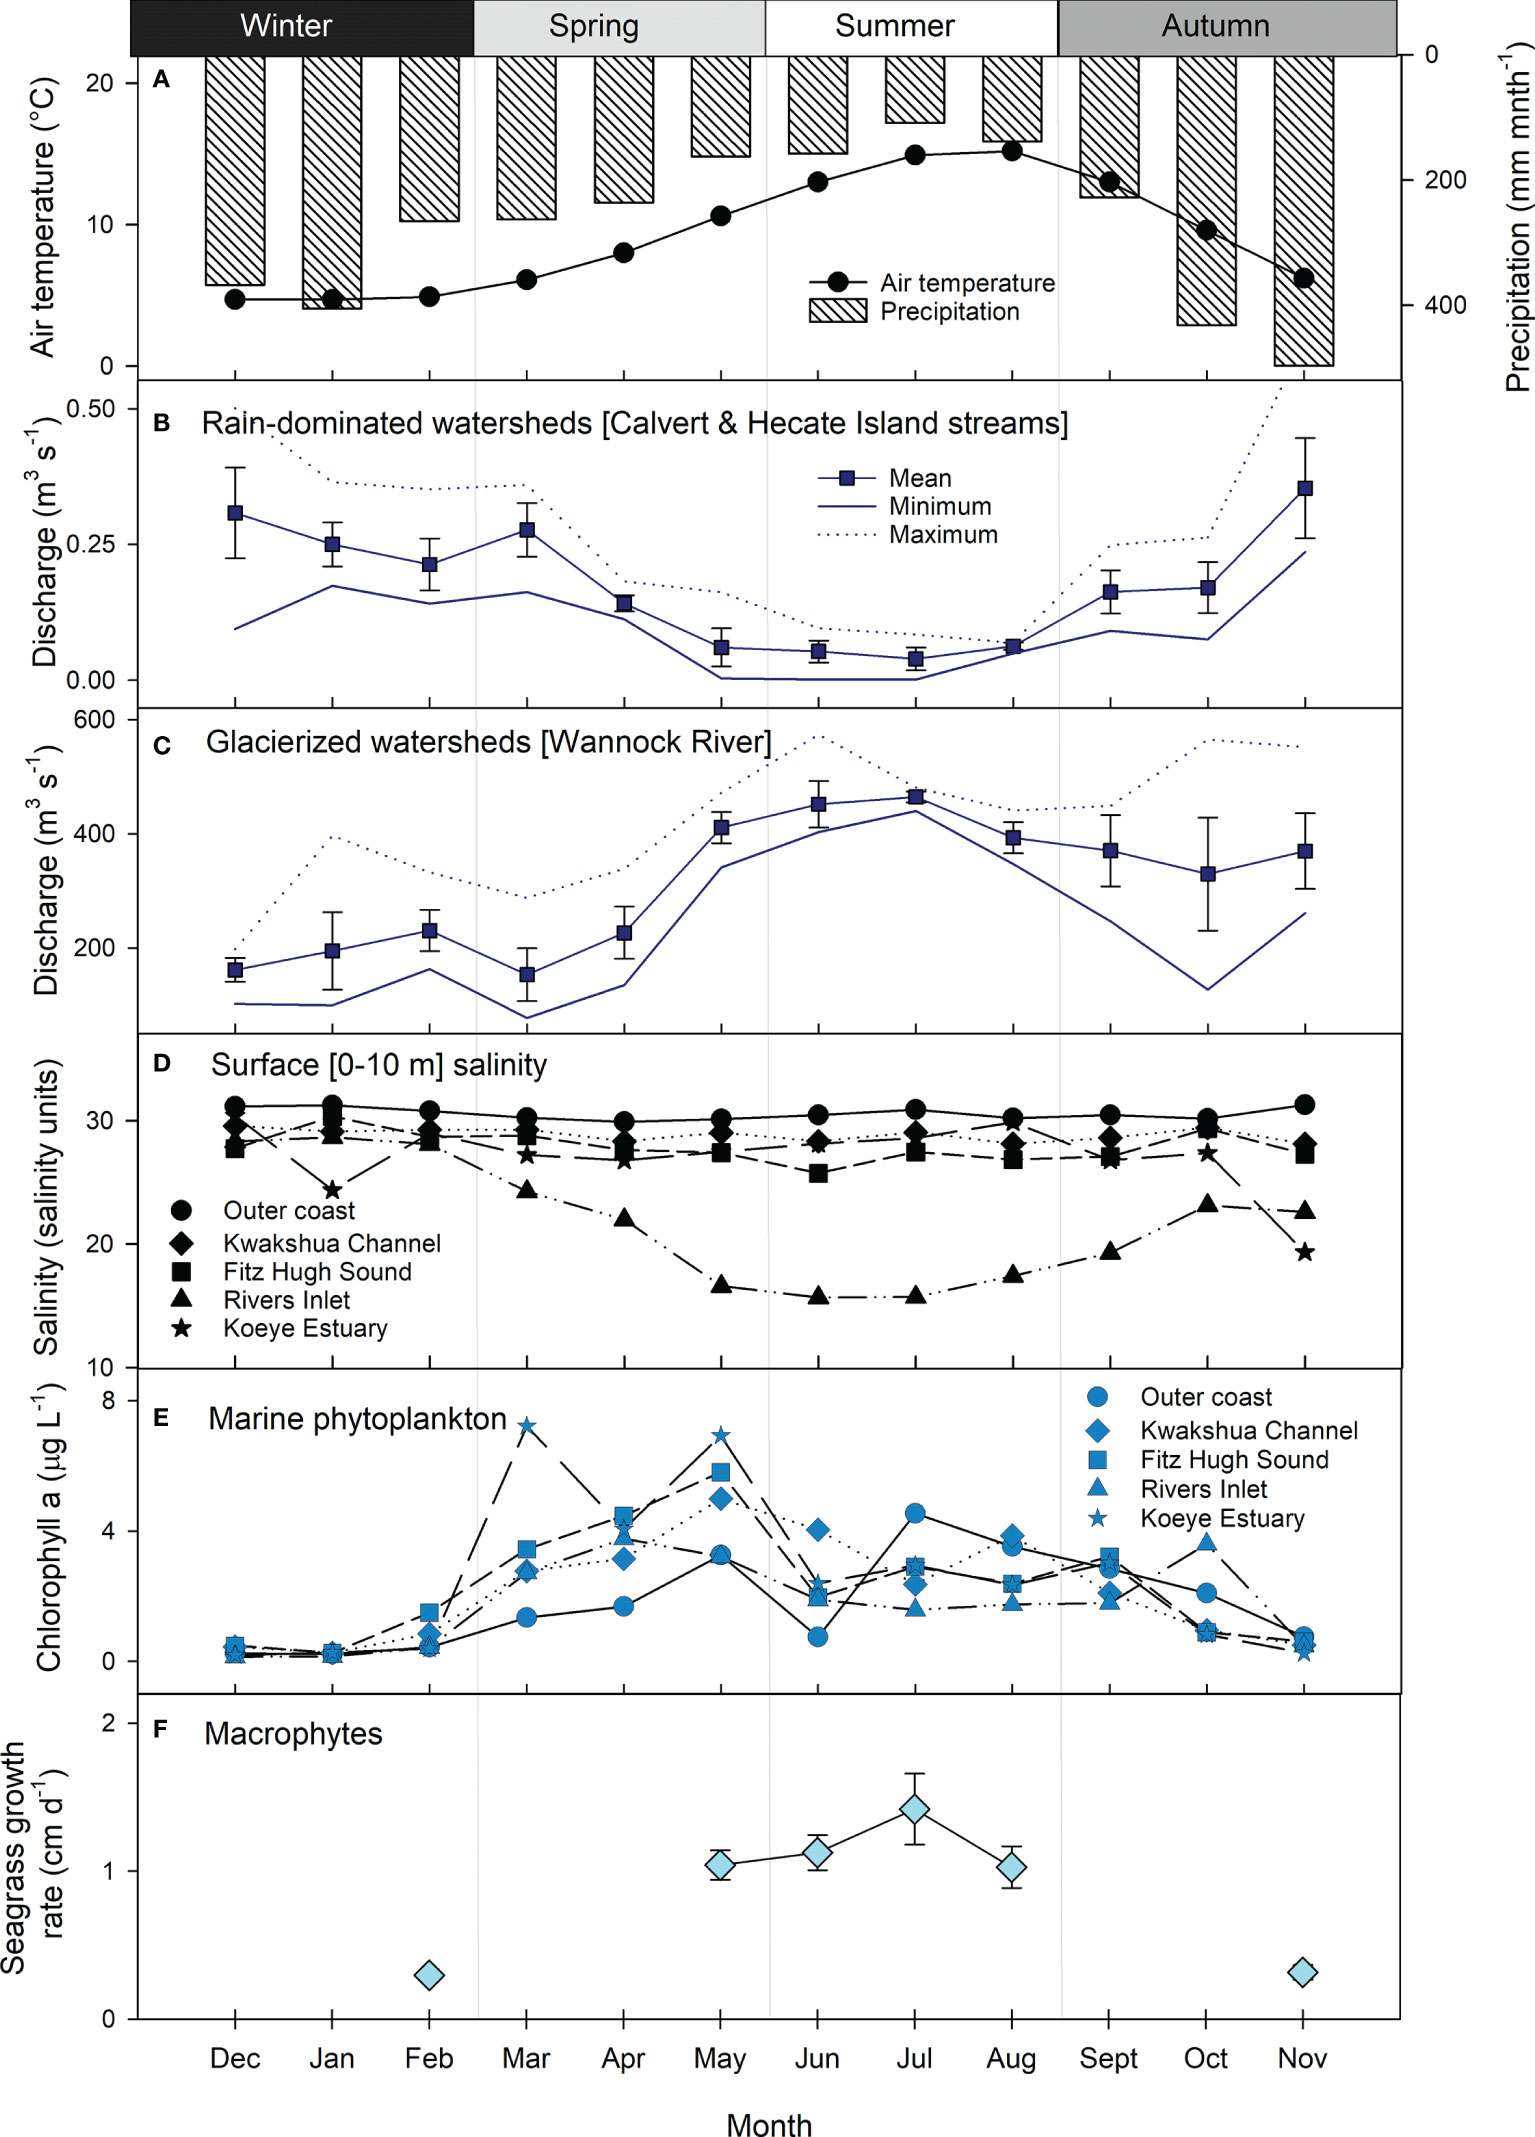
Figure 2 Seasonality indicators across freshwater and marine ecosystems of the NPCTR: (A) mean monthly air temperature (circles) and precipitation (bars) at sea level (Addenbroke Island 1981-2010 normal, Environment and Climate Change Canada station 1060080, 21 m.a.s.l.); mean monthly ± SD stream/river discharge summary statistics (mean ± SD, minimum, maximum) for the period 2015-2018 from (B) rain-dominated watersheds represented by Calvert and Hecate Island streams (Korver et al., 2020), and (C) glacierized watersheds represented by the Wannock River (station 08FA002); (D) mean monthly surface (0-10 m) water salinity across the study region, (E) mean monthly chlorophyll a concentrations as representative of marine phytoplankton biomass across the study region; (F) mean ± SD in seagrass growth rate representing the marine macrophyte end-member. Outer coast is station QCS01, Kwakshua Channel is the mean of stations Pruth, KC7 and KC10, Fitz Hugh Sound is the mean of stations FZH08, FZH01, UBC7 and RVRS01, Rivers Inlet is the mean of stations DFO2, DFO5 and UBC8, and Koeye Estuary is station KWY01.
2 Materials and Methods
2.1 Study Area Description
The Central Coast of British Columbia, Canada lies at the heart of the NPCTR, which extends from northern California to southeast Alaska (Figure 1). The study area was delimited by Fitz Hugh Sound at the Koeye Estuary to the north (51.76°N, 127.94°W; station FZH08), the southern waters of Fitz Hugh Sound at the entrance to Rivers Inlet to the south (51.44°N, 127.80°W; station RVRS01), Pruth Bay to the west (51.66°N, 128.09°W), and the Wannock River watershed on mainland British Columbia to the east (51.68°N, 127.23°W).
The Koeye Estuary is a dynamic tidal environment influenced by both the Koeye River and waters from Fitz Hugh Sound (Reshitnyk, 2015; Seitz et al., 2020). The estuary includes eelgrass (Zostera marina) beds, salt marsh, and expanses of rockweed (Reshitnyk, 2015) and is an important nursery for multiple fish species (Seitz et al., 2020). Fitz Hugh Sound is a deep inner coastal water body that extends from Rivers Inlet in the south to Burke and Fisher Channels beyond the Koeye Estuary to the north. Kwakshua Channel is a narrow sheltered waterway separating Calvert and Hecate Islands, which exchanges waters with Fitz Hugh Sound to the east and Hakai Pass via Meay Channel to the north. Eelgrass beds are found in shallow areas of the channel, as are rockweed and sea lettuce. Rivers Inlet is a 45-km long, 340-m deep fjord, separated from Fitz Hugh Sound by a 140-m sill (Pickard, 1961). Large riverine fluxes of snow and glacial melt waters, the most important of which comes from the Wannock River, contribute to estuarine circulation within the inlet (Hodal, 2010). Expanses of salt marsh are located near the head of the inlet in Kilbella Bay (MacKenzie et al., 2000), though much of the inlet is characterized by steep shorelines.
Varying proportions of rain, snowmelt, and glacial meltwater contributions to terrestrial runoff occur across the region, often following a topographic gradient from small, low relief rainfall-dominated watersheds on outer-coast islands to larger mainland watersheds that transport a mix of rain, snowmelt, and glacial melt to fjords (Giesbrecht et al., 2022). A longitudinal transect across the study area reflects just such a gradient (Giesbrecht et al., 2021). Rain-dominated watersheds occur at low-to-moderate elevations and are exemplified in this study by the Koeye River (171 km2; maximum elevation = 1304 meters above sea level (m.a.s.l.) that originates in the Coast Mountains on the British Columbia mainland and four small streams (numbered 626, 1015, 844, 703; 3.2 to 12.8 km2; maximum elevation = 164 to 1014 m.a.s.l.) with bog forests and extensive wetlands on Calvert and Hecate Islands (Supplementary Material and Table S1). Glacierized mountain watersheds originate at high elevations and are exemplified here by the Wannock River (3947 km2; 15% ice cover; Table S1). There are no major agricultural or industrial activities in any of the six watersheds, though logging has occurred within the Wannock River watershed.
2.1.1 Climate and Coastal Circulation
Mean annual air temperature and precipitation near sea level at Addenbroke Island (Figure 1) are 9.2 ± 1.1°C and 3260 mm, respectively (1981-2010 climate normal, 21 m.a.s.l., Environment and Climate Change Canada station 1060080). Annually at sea level, temperature reaches a maximum (15.2°C in August; Figure 2A) in the summer, coinciding with the period of lowest rainfall (< 200 mm month-1). Rainfall begins to increase in September and remains high through February. Around 98% of precipitation at sea level falls as rain. Across the watersheds sampled in this study, mean annual air temperature varies between 3.1°C (Wannock River watershed; maximum elevation = 3106 m.a.s.l.) and 8.4°C (watershed 626; maximum elevation = 164 m.a.s.l.), while precipitation ranges between 3187 and 3762 mm (Table S1; ClimateWNA model output; Wang et al., 2016). In the smaller watersheds of Calvert and Hecate Islands, between 4 and 7% of annual precipitation falls as snow, compared to 10% and 45% for the Koeye and Wannock River watersheds, respectively (Table S1).
The spring transition across the region occurs between March and May with the shift to upwelling-favourable northwesterly winds that bring cold, dense and nutrient-rich waters from the open ocean onto the continental shelf (Foreman et al., 2011). There are typically two peaks in primary production: the first occurs in spring and the second between July and the end of September, the timing of which differs slightly along the coast (Jackson et al., 2015). Between September and November, downwelling-favourable southeasterly winds begin to dominate, leading to the retention of surface waters in coastal areas. We define the seasons based on these dynamics, where winter is December-January-February (DJF), spring is March-April-May (MAM), summer is June-July-August (JJA), and autumn is September-October-November (SON) (St. Pierre et al., 2021).
2.2 Sampling Scheme and Sample Collection
To understand the relative influences of watershed, and marine macrophyte and pelagic sources of POM on coastal pelagic ecosystems, surface waters (0-10 m) at 11 oceanographic stations were sampled across the study area (Figure 1 and Table S2).Samples were then also collected to quantitatively describe the various watershed and marine contributors.
2.2.1 Oceanographic Sample Collection
The 11 oceanographic stations were located in the Koeye Estuary, Fitz Hugh Sound, Kwakshua Channel, and Rivers Inlet and sampled between 21-Jan-2015 and 11-Sept-2018 (Table S2). Station KWY01 was situated within the Koeye Estuary at the mouth of the Koeye River. From west to east, the Kwakshua Channel stations were Pruth, KC7, and KC10 (Figure 1). From north to south in Fitz Hugh Sound were stations FZH08 (near the Koeye Estuary), FZH01, UBC7, and RVRS01. Within Rivers Inlet, from west near Fitz Hugh Sound to east at the mouth of the Wannock River, were stations DFO2, DFO5, and UBC8. Stations were consistently sampled at 0 and 5 m, and less frequently at 1 and 10 m. Most stations were sampled on an approximately monthly basis over the sampling period with the exceptions of FZH08, KC7, and UBC7, which were sampled only until 02-Nov-2015, 27-Feb-2016, and 01-Nov-2015, respectively.
At each station, bulk water samples for the determination of POC, δ13C-POC, PN, δ15N-PN, and chlorophyll a (chl a) were collected using a Niskin bottle and subsampled into triple-rinsed bottles that were kept cool until processing at the Hakai Calvert Island Ecological Observatory within six hours of collection. Following sample collection, a RBR CTD was deployed to measure water column profiles of temperature, conductivity, and pressure, from which salinity was derived following the procedure in Halverson et al. (2017) and binned to 1-m intervals. Temperature and salinity data from ~1 m were applied to surface (0 m) samples for descriptive purposes.
2.2.2 Macrophyte End-Member Collection
We focused on three of the dominant macrophyte taxa in the region, all of which are widely distributed (cosmopolitan), and capture macrophyte production from both protected and exposed shorelines. The macrophyte end-member consisted of eelgrass (Zostera marina), rockweed (Fucus spp.), and sea lettuce (Ulva spp.) (Froese et al., 2019). Zostera marina is a flowering angiosperm that grows in soft sediment. A shoot blade emerges from its rhizome, which provides attachment to the benthos. It prefers protected waters, but is also found in deeper (e.g., 2-5 m), high current and wave-exposed waters in this region (Monteith et al., 2019). Z. marina grows year-round with blade production rates increasing during the summer months (Monteith et al., 2019). Fucus spp. is a genus of brown algae that grows attached to rocky shores and boulders along both protected and exposed shorelines. Fucus spp. cover is found throughout the year, but its density increases in summer (Froese et al., 2020). Ulva spp. is a green algae, which can grow in both protected and exposed shores. Ulva spp. biomass and density exhibits the strongest seasonal peak in summer between these three species. Samples were collected between 06-Jul-2015 and 24-Aug-2017 across a variety of different nearshore habitats.
Sampling methods varied somewhat depending on the habitat, survey program, and target species, as detailed in the associated data package (Froese et al., 2019). Whole shoots (new and third blades), single branches, and blade sections were sampled for the Z. marina, Fucus spp. and Ulva spp., respectively. Only living tissues were sampled from all specimens.
2.2.3 Watershed End-Member Collection
Bulk freshwater samples were collected in triple-rinsed bottles from the main stem of the Koeye River, streams 626, 1015, 844, and 703 on Calvert and Hecate Islands, and the Wannock River (Table S1). Operationally, the watershed end-member therefore includes soil organic matter, terrestrial detritus (e.g., leaf and conifer needles), freshwater phytoplankton and macrophytes, and glacial exports. Samples were kept cool and out of the light until processing within six hours of collection at the Hakai Calvert Island Ecological Observatory. Sampling of each river/stream system occurred on an approximately monthly basis between 13-Jun-2018 and 14-Nov-2018, 22-Jan-2015 and 24-Feb-2017, and 10-Jun-2018 and 17-Nov-2018 for the Koeye River, Calvert/Hecate Island streams, and the Wannock River, respectively.
2.3 POM Sample Preparation and Analysis
For POC, δ13C-POC, PN, and δ15N-PN determination for the watershed end-member and oceanographic stations, a known volume of water (up to 2 L) was filtered in parallel through two pre-combusted 25 mm Whatman glass fiber (GF/F, 0.7 µm) filters until colour was noticeable. For all sites except watersheds 626, 1015, 844, and 703, where pH is typically below 5.0 (St. Pierre et al., 2020), one of the filters was then acidified with 2 mL of 1 M HCl to remove carbonate minerals (particulate inorganic carbon; Lorrain et al., 2003). After 30 seconds, the HCl was rinsed off the filter with ~5 mL of seawater (for the oceanographic stations) or freshwater (for Koeye, Wannock rivers) filtered through a 0.45 µm polyethylsulfonate (PES) filter. The acidified filter was used to quantify POC concentration and δ13C-POC. The second filter was left untreated and used to quantify PN concentration andδ15N-PN. Each filter was folded and sealed in a foil packet and stored at -20°C. Filters were dried at 60°C for 24 h, weighed and transported in a travel desiccator to the Hakai Field Station on Quadra Island. Each whole filter was packed in a tin capsule that was crimped.
Macrophyte samples were gently cleaned of sediment, epiphytes and epifauna, if present. Samples were then rinsed two times with deionized water and oven dried at 60°C for at least 24 h or until dry. Samples were ground using a mortar and pestle. Around 2.0 – 3.0 g of the ground sample was then encapsulated in a crimped tin capsule.
All samples were analyzed at the University of California Davis Stable Isotope Facility (Davis, California, USA). There, samples were quantified using either a Vario EL Cube or Micro Cube elemental analyzer (Elementar Analysensysteme GmbH, Hanau, Germany) coupled to either a PDZ Europa 20-20 continuous flow IRMS (Sercon, Cheshire, UK) or Isoprime VisION IRMS (Elementar UK, Ltd, Cheadle, UK). Samples were interspersed with several replicates of two different laboratory standards calibrated against NIST Standard Reference Materials. Preliminary isotopic ratios were measured relative to reference gases analyzed with each sample and finalized by correcting the values for the entire batch based on the laboratory standards. Final δ13C-POC and δ15N-PN isotopic values are expressed relative to the international standards Vienna PeeDee Belemnite (VPDB) and air, respectively. Long term standard deviations for δ13C and δ15N were 0.2‰ and 0.3‰, respectively. (St. Pierre et al., 2022)
2.4 Chlorophyll a Sample Preparation and Analysis
At most sites, bulk chlorophyll a (chl a) concentration was quantified with 250 mL of sample water filtered through a 47 mm GF/F (0.7 µm) filter. On a small fraction of sampling dates, bulk chl a concentrations were determined by filtering 250 mL of sample water through three stacked 47 mm filters with decreasing pore sizes (20 µm and 3 µm polycarbonate, 0.7 µm GF/F). Each filter was then placed into a Falcon tube and stored in a black bag at -20°C until analysis on site. Concentrations were quantified using a Trilogy Laboratory Fluorometer (Turner Designs, San Jose, USA) following the protocols of Holm-Hansen et al. (1965). For the size fractionated samples, chl a concentrations across all filters were summed to determine the bulk chl a concentration. For cases when both summed and single filter (0.7 µm) concentrations were determined, the single filter concentration was used, so as to minimize sample handling and processing.
2.5 Bayesian Mixing Model
The relative contributions of watershed and marine sources to surface water POM across the Central Coast were quantified using a Bayesian mixing model specified with the MixSIAR package in R (R Stock et al., 2018; Stock and Semmens, 2018; R Core Team, 2020). Discrimination was set to 0 for all sources in the absence of explicit trophic connections. An uninformative prior (Figure S1) was used, giving equal probabilities to all three sources (i.e., watershed, macrophyte, and marine phytoplankton). Station and season (winter, spring, summer, autumn) were specified as fixed effects and the model was fit using a residual by process error structure (Stock and Semmens, 2016).
2.5.1. Model Inputs
2.5.1.1 Sources
The marine phytoplankton end-member was determined by calculating the POC:chl a mass ratio for samples collected as above at station QCS01 (51.705°N, 128.238°W), located just off of the outer coast of Calvert Island in Queen Charlotte Sound (Figure 1). QCS01 is located ~150 km inshore from the continental margin, and as such, is still representative of coastal waters, rather than the open ocean. POC:chl a was then used to distinguish between detrital material and living phytoplankton, where POC:chl a less than 200 g g-1 indicate marine phytoplankton-dominated POM (Liénart et al., 2017). Data from QCS01 satisfying this criterion were then identified and the δ13C-POC, δ15N-PN and molar C:N ratio of these samples were used to define the marine phytoplankton end-member. Of the samples (n = 38) that satisfied this criterion, 39.4% and 31.6% were from the spring and autumn, respectively, with the balance from the summer (23.7%) and winter (5.2%; Table S3). In using only data from QCS01, it is assumed that the marine phytoplankton signatures from this station are representative of all other marine stations included in the analysis. Note that salinity and chl a concentrations from QCS01 were used to describe waters directly connected to offshore waters, and are therefore designated as “outer coast” in those descriptions (Figure 2).
The marine macrophyte end-member was determined by subsetting the data from Froese et al. (2019) to include only those stations within the region of interest (Figure 1). This end-member was a combination of representatives from the Fucus (n = 35), Ulva (n = 30) and Zostera (n = 104) genera (Table S4). The marine macrophyte end-member thus includes representatives of both macroalgae and seagrass communities. The vast majority (61.5%) of samples were collected in the summer with fewer in the spring (13.0%), autumn (23.7%), and winter (1.2%; Table S3). Although the three genera displayed large isotopic and C:N differences, all were significantly different from the other two end-members and the mixture dataset, supporting the use of a single end-member to represent the range of isotopic and elemental composition of macrophytes within the region.
The watershed end-member included data from the Koeye River (n = 5), the Wannock River (n = 6), and the four Calvert/Hecate Island streams (n = 95; Table S4). Rain-dominated (Koeye and Calvert/Hecate streams) and glacierized (Wannock) watershed types were combined into an aggregate end-member due to the large differences in the number of samples from each watershed type. Across all rivers and streams, the majority of samples were from the summer (34%), with the remainder from the autumn (27%), winter (20%), and spring (19%; Table S3).
Seasonally and spatially aggregated end-members were used owing to very low winter sample sizes for the phytoplankton (n = 2) and macrophyte (n = 3) end-members. The stormy winter season poses significant challenges to site access in this remote region of the British Columbia coast that must be accessed by either float plane or boat. The implications of seasonal and spatial variability in the end-members are discussed below.
2.5.1.2 Mixture Data
The mixture dataset consisted of 728 discrete measurements from the oceanographic stations with δ13C-POC, δ15N-PN and C:N ratio data. These data were predominately collected in spring (39.7%) and summer (33.4%), with fewer measurements in autumn (17.5%) and winter (9.4%). Data were available across all oceanographic stations for spring through the autumn, but only six of the 11 stations had winter measurements, reflecting winter challenges with site access (Table S5).
2.5.2 Model Run, Fit and Interpretation
The “very long” Markov Chain Monte Carlo settings in MixSIAR were used for the presented model: three chains with a length of 1,000,000 each, burn-in of 500,000, and thin of 500 (Stock and Semmens, 2018). Model fit was assessed using the Gelman-Rubin diagnostic, as well as visual assessment of the autocorrelation and running mean plots. The model was deemed to have converged based on the Gelman-Rubin diagnostic not exceeding 1.05 on any variable and the assessment of the autocorrelation and running mean plots. Model outputs are described as medians and 95% Bayesian credible intervals throughout.
In choosing to use the C:N ratio rather than the N:C ratio, we acknowledge that the model is biased towards describing the mixing of nitrogen rather than carbon (Perdue and Koprivnjak, 2007): two parameters (δ15N-PN and C:N) in the model describe nitrogen compared to only one – δ13C-POC – that describes the mixing of carbon sources. The primary focus of this study is in the mixing of POM, which includes both carbon and nitrogen; however, nitrogen is thought to be limiting in these waters (St. Pierre et al., 2021), and as such, cross-ecosystems subsidies of nitrogen are of particular interest, justifying the selection of C:N over N:C.
2.5.3 Supporting Data and Additional Statistics
The distribution of POC, PN, δ13C-POC, δ15N-PN and C:N ratios were assessed using the Shapiro-Wilk normality test. These data were not normally distributed, and medians and interquartile ranges or ranges are therefore presented unless otherwise specified. Means and standard deviations are used when describing δ13C-POC values, δ15N-PN values and C:N ratios as end-members in the Bayesian mixing model, and for describing monthly discharge, salinity, chl a, and seagrass growth rates (Figure 2).
3 Results
3.1 Seasonal Context at the Land-Ocean Interface of the NPCTR
Seasonal freshwater exports (discharge) differed between the rain-dominated and glacierized watersheds during the study period. The seasonal precipitation cycle (Figure 2A) was generally reflected in discharge from the rain-dominated watersheds (Figure 2B). Mean monthly discharge from the Calvert and Hecate Island streams peaked in late autumn (>0.3 m3 s-1) and was lowest in the summer (<0.1 m3 s-1). In contrast, discharge from the glacier-fed Wannock River was lowest in the winter (mean monthly discharge ≤ 200 m3 s-1), increased through the end of spring and peaked in the summer (≥ 400 m3 s-1; Figure 2C). This pattern largely reflected air temperature (Figure 2A), the primary control on snow and ice melt. Higher flows were sustained through the autumn likely due to a combination of increased rainfall and delayed meltwater exports via Owikeno Lake.
Surface waters across the region were generally quite fresh (< 30 practical salinity units), but salinity varied over time and space (Figure 2D). The lowest salinity was observed in Rivers Inlet during the summer, concomitant with the highest discharge from the Wannock River. Seasonal variability in salinity was also observed within the Koeye Estuary, with lower salinity in the autumn and winter, reflecting exports from the rain-dominated Koeye River (Giesbrecht et al., 2021). Salinity within Kwakshua Channel and Fitz Hugh Sound were similar and exhibited little seasonal variation. Outer coast waters consistently had the highest salinity of all water bodies and little seasonal variation.
Marine chl a concentrations, a proxy for phytoplankton biomass, peaked in spring (Figure 2E). The highest mean monthly chl a concentrations were recorded in the Koeye Estuary in March (7.22 ± 8.35 µg L-1) and May (6.93 ± 4.62 µg L-1). A second peak in chl a was observed across most oceanographic stations in the summer, with the exception of Rivers Inlet, where a second peak was observed in October. Mean monthly chl a concentrations in the winter months ranged between 0.14 and 1.49 µg L-1. Seagrass growth rates, an indicator of macrophyte production, were highest in the summer (>1 cm d-1) and lowest in the winter (February) and autumn (November) months when growth rate measurements were conducted (Figure 2F).
3.2 Carbon and Nitrogen Isotopes and Content in Watershed, Marine Phytoplankton and Macrophyte Sources
Watershed materials, marine phytoplankton, and macrophytes were distinct within δ13C-POC/δ15N-PN/C:N ratio space (Figure 3), supporting their use as end-members in the mixing model. Mean δ13C-POC values were highest and lowest for the marine macrophyte (-12.00 ± 4.02‰) and watershed (-27.34 ± 0.62‰) end-members, respectively, with marine phytoplankton exhibiting intermediate values (-22.28 ± 1.80‰; Table S4). Mean δ15N-PN values for the watershed end-member (2.89 ± 1.36‰) was lower and distinct from the phytoplankton (6.09 ± 1.30‰) and macrophytes (6.94 ± 1.06‰). The highest and most variable C:N ratios (28.81 ± 17.87) were observed for the macrophytes, more than two- and five-times the mean C:N ratio for the watershed end-member (12.69 ± 7.62) and marine phytoplankton (5.57 ± 1.66), respectively.
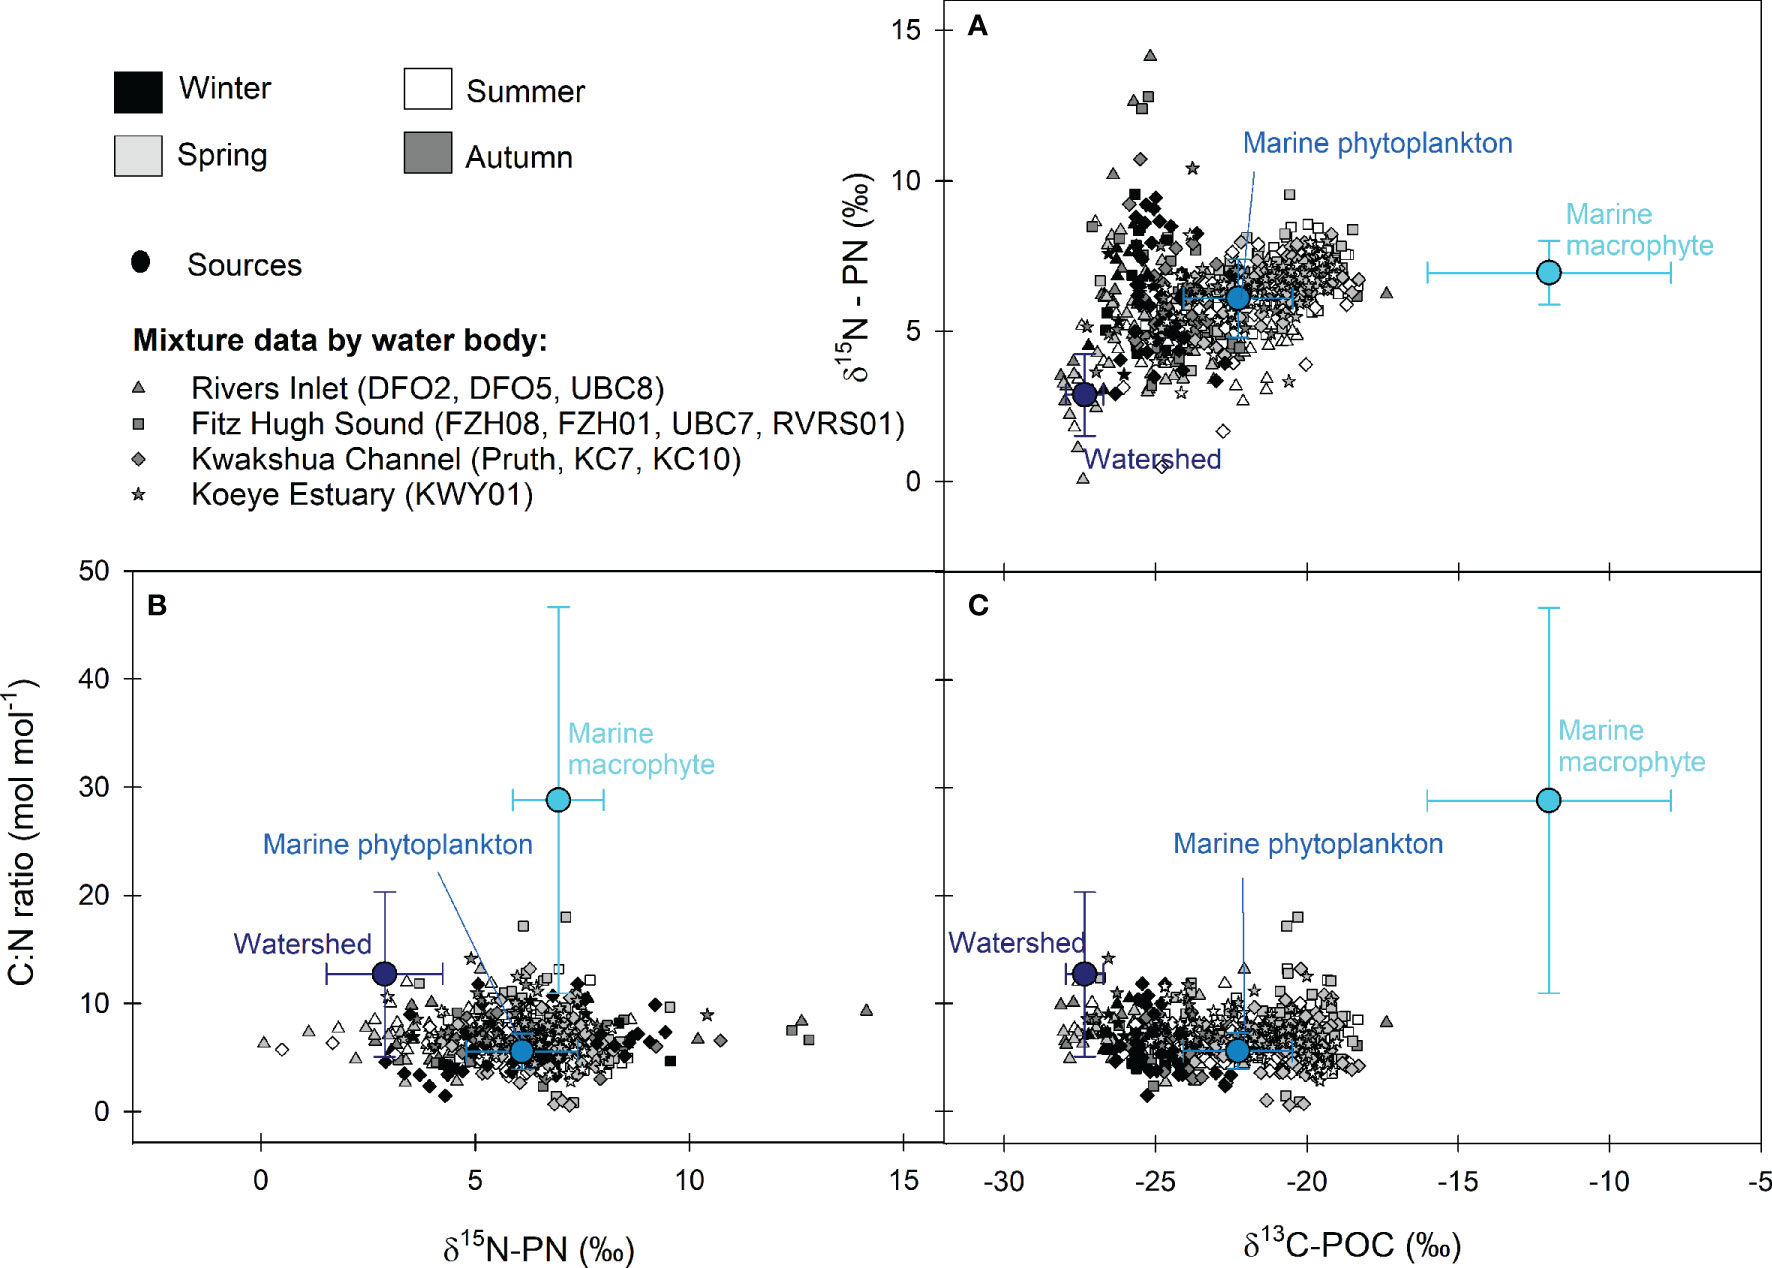
Figure 3 Isospace plots showing all mixture data by season (greyscale) and main water body (shape) and the mean ± SD for the three end-members in (A)δ13C-POC – δ15N-PN, (B)δ15N-PN – C:N molar ratio, and (C)δ13C-POC – C:N molar ratio space. Rivers Inlet (triangles) includes stations UBC8, DFO5 and DFO2. Fitz Hugh Sound (squares) includes stations RVRS01, UBC7, FZH01 and FZH08. Kwakshua Channel (diamonds) includes stations Pruth, KC7 and KC10 and the Koeye Estuary (stars) is station KWY01.
3.3 Carbon and Nitrogen Content and Composition in Coastal Surface Waters
Across the 11 marine stations, the quantity and composition of POM in surface waters varied throughout the year. At stations in Fitz Hugh Sound, Kwakshua Channel and the Koeye Estuary, POC (Figure S2) and PN (Figure S3) concentrations were higher in spring (median: POC = 26.06 µM, PN = 4.11 µM) and summer (median: POC = 26.71 µM, PN = 3.79 µM) compared to the autumn (median: POC = 14.63 µM, PN = 2.28 µM) and winter (median: POC = 8.07 µM, PN = 1.40 µM; Table 1). In Rivers Inlet, seasonal variability in POC and PN concentrations was muted, but also differed depending on distance from the Wannock River. At the stations closest to the Wannock River (UBC8, DFO5), both POC (range = 4.02 to 49.60 µM; Figure S2) and PN (range = 0.81 to 6.80 µM; Figure S3) concentrations were consistently among the lowest observed with little seasonal variability (Table 1). Around 30 km from the Wannock River (DFO2), POC and PN concentrations began to change seasonally in step with stations outside of Rivers Inlet (Figures S2, S3). Low PN concentrations were also observed at UBC7 in Fitz Hugh Sound. Most (94%) C:N ratios were less than 10. Seasonal variability in C:N was not consistent between stations or water bodies (Table 1 and Figure S4). The lowest C:N ratios were typically observed in summer (stations FZH01, Pruth, KC10, RVRS01), whereas the highest C:N ratios (>10) were observed in all seasons and at stations throughout the region.
POC:chl a ratios were highly variable across the study area (range = 5 – 8420 g g-1; Figure S5; Table 1). Half or more winter POC:chl a measurements exceeded 200 g g-1 at the six stations for which winter data were available and throughout the rest of the year at stations DFO5 and UBC8 near the Wannock River. Perhaps surprisingly, POC:chl a in excess of 1000 g g-1 were more often observed in spring and summer. This may reflect that a larger number of samples were collected during those seasons (Table S5) and/or a relatively higher contribution of heterotrophic biomass that contains carbon, but not chlorophyll (Savoye et al., 2003).
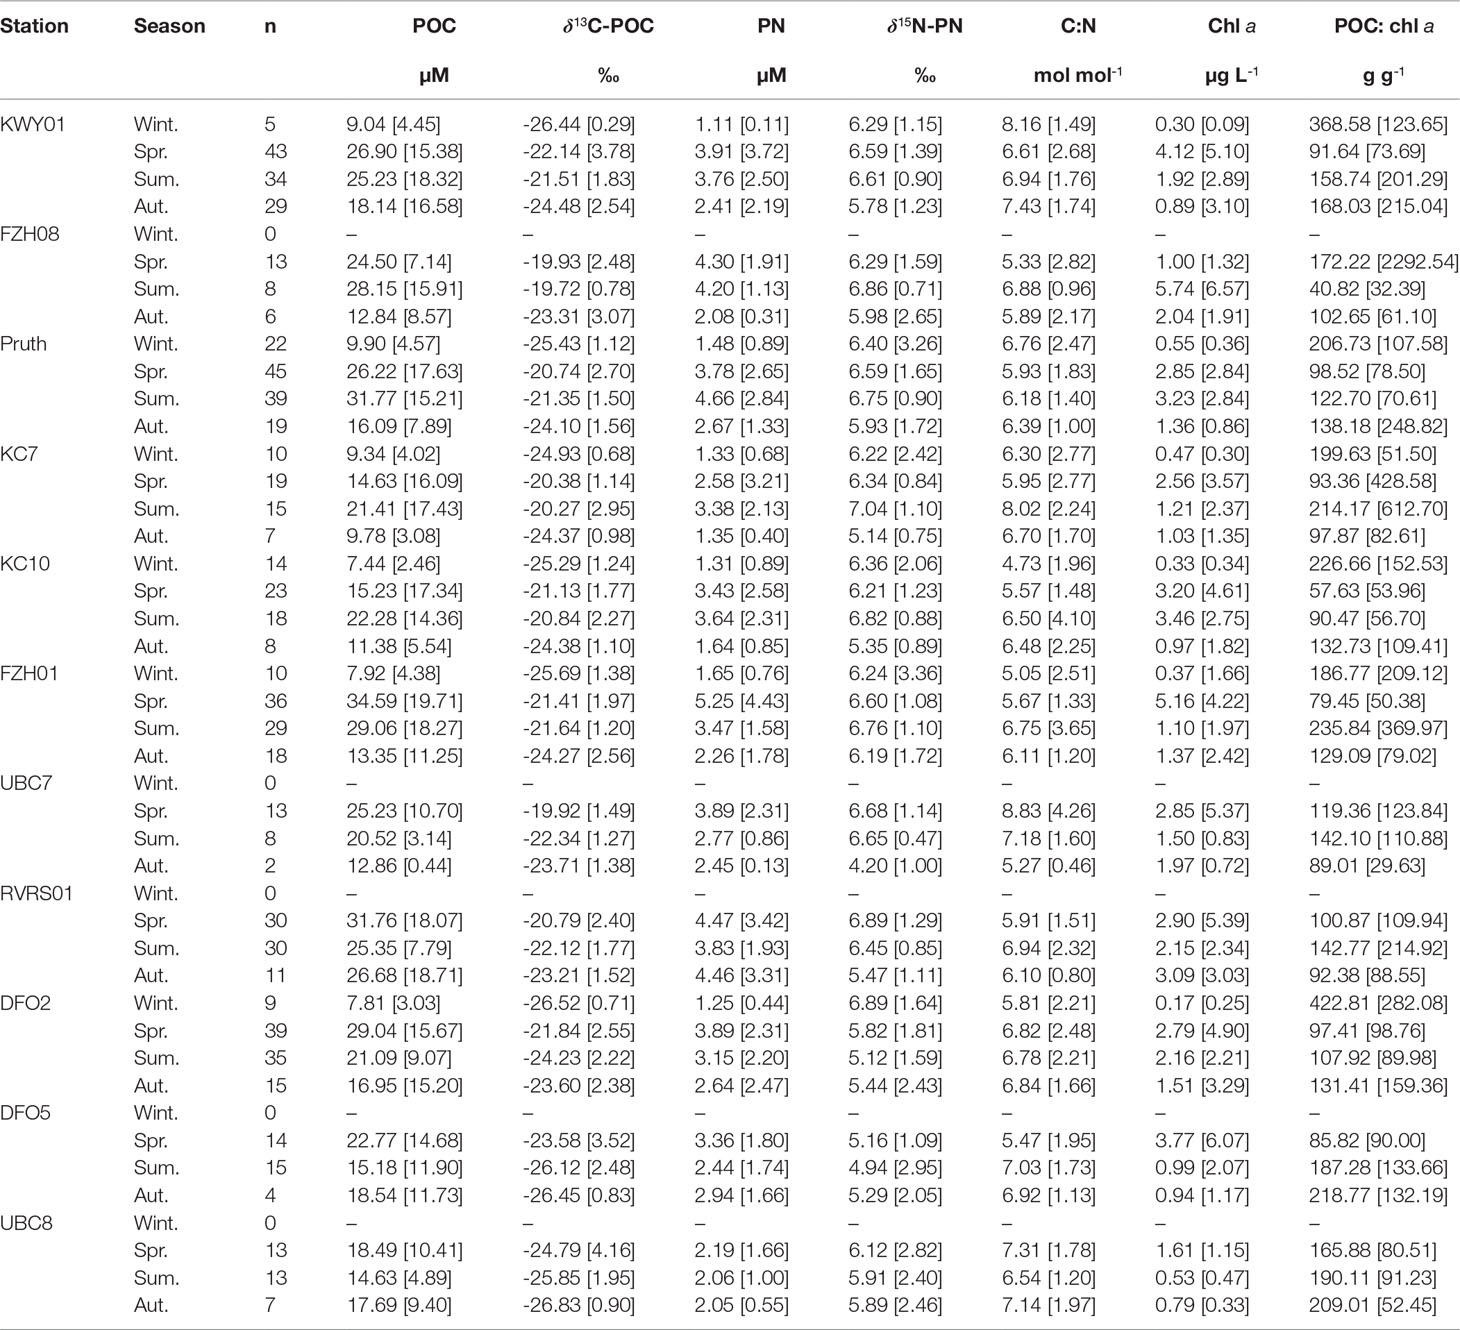
Table 1 Median [interquartile range] seasonal particulate organic carbon (POC) concentration, δ13C-POC, particulate nitrogen (PN) concentration, δ15N-PN, C:N molar ratio, chlorophyll a concentration and POC:chl a ratio, where winter is Dec-Feb, spring is Mar-May, summer is Jun-Aug, autumn is Sept-Nov.
Across each station, δ13C-POC was generally higher in the spring and summer than in the winter and autumn (Table 1 and Figure S6). Whereas high δ13C-POC persisted through the summer outside of Rivers Inlet, δ13C-POC was lower during summer at those stations closest to the Wannock River (-26.12 to -24.23‰). Median seasonal δ15N-PN values were relatively invariant throughout the year across all stations (4.20 –7.04‰; Table 1 and Figure S7). In general, greater δ15N-PN variability was observed in autumn and winter and throughout the year within Rivers Inlet.
3.4 Relative Contributions of Watershed and Marine Sources to the Surface Carbon Pool
The relative POM contributions from watershed, marine phytoplankton and macrophyte sources differed substantially by season (Figure 4). Across the stations for which winter data were available, modelling outputs indicated that watersheds were the primary source of organic matter within surface waters, accounting for between 53.4 and 77.6% of the POM pool. The highest watershed contributions were observed at stations close to the Koeye River (KWY01, 69.6%) and within Rivers Inlet (DFO2, 77.6%). Marine phytoplankton accounted for the remainder of wintertime POM (range: 22.2 - 46.3%), with macrophyte contributions accounting for less than 1% across all stations (Table S6).
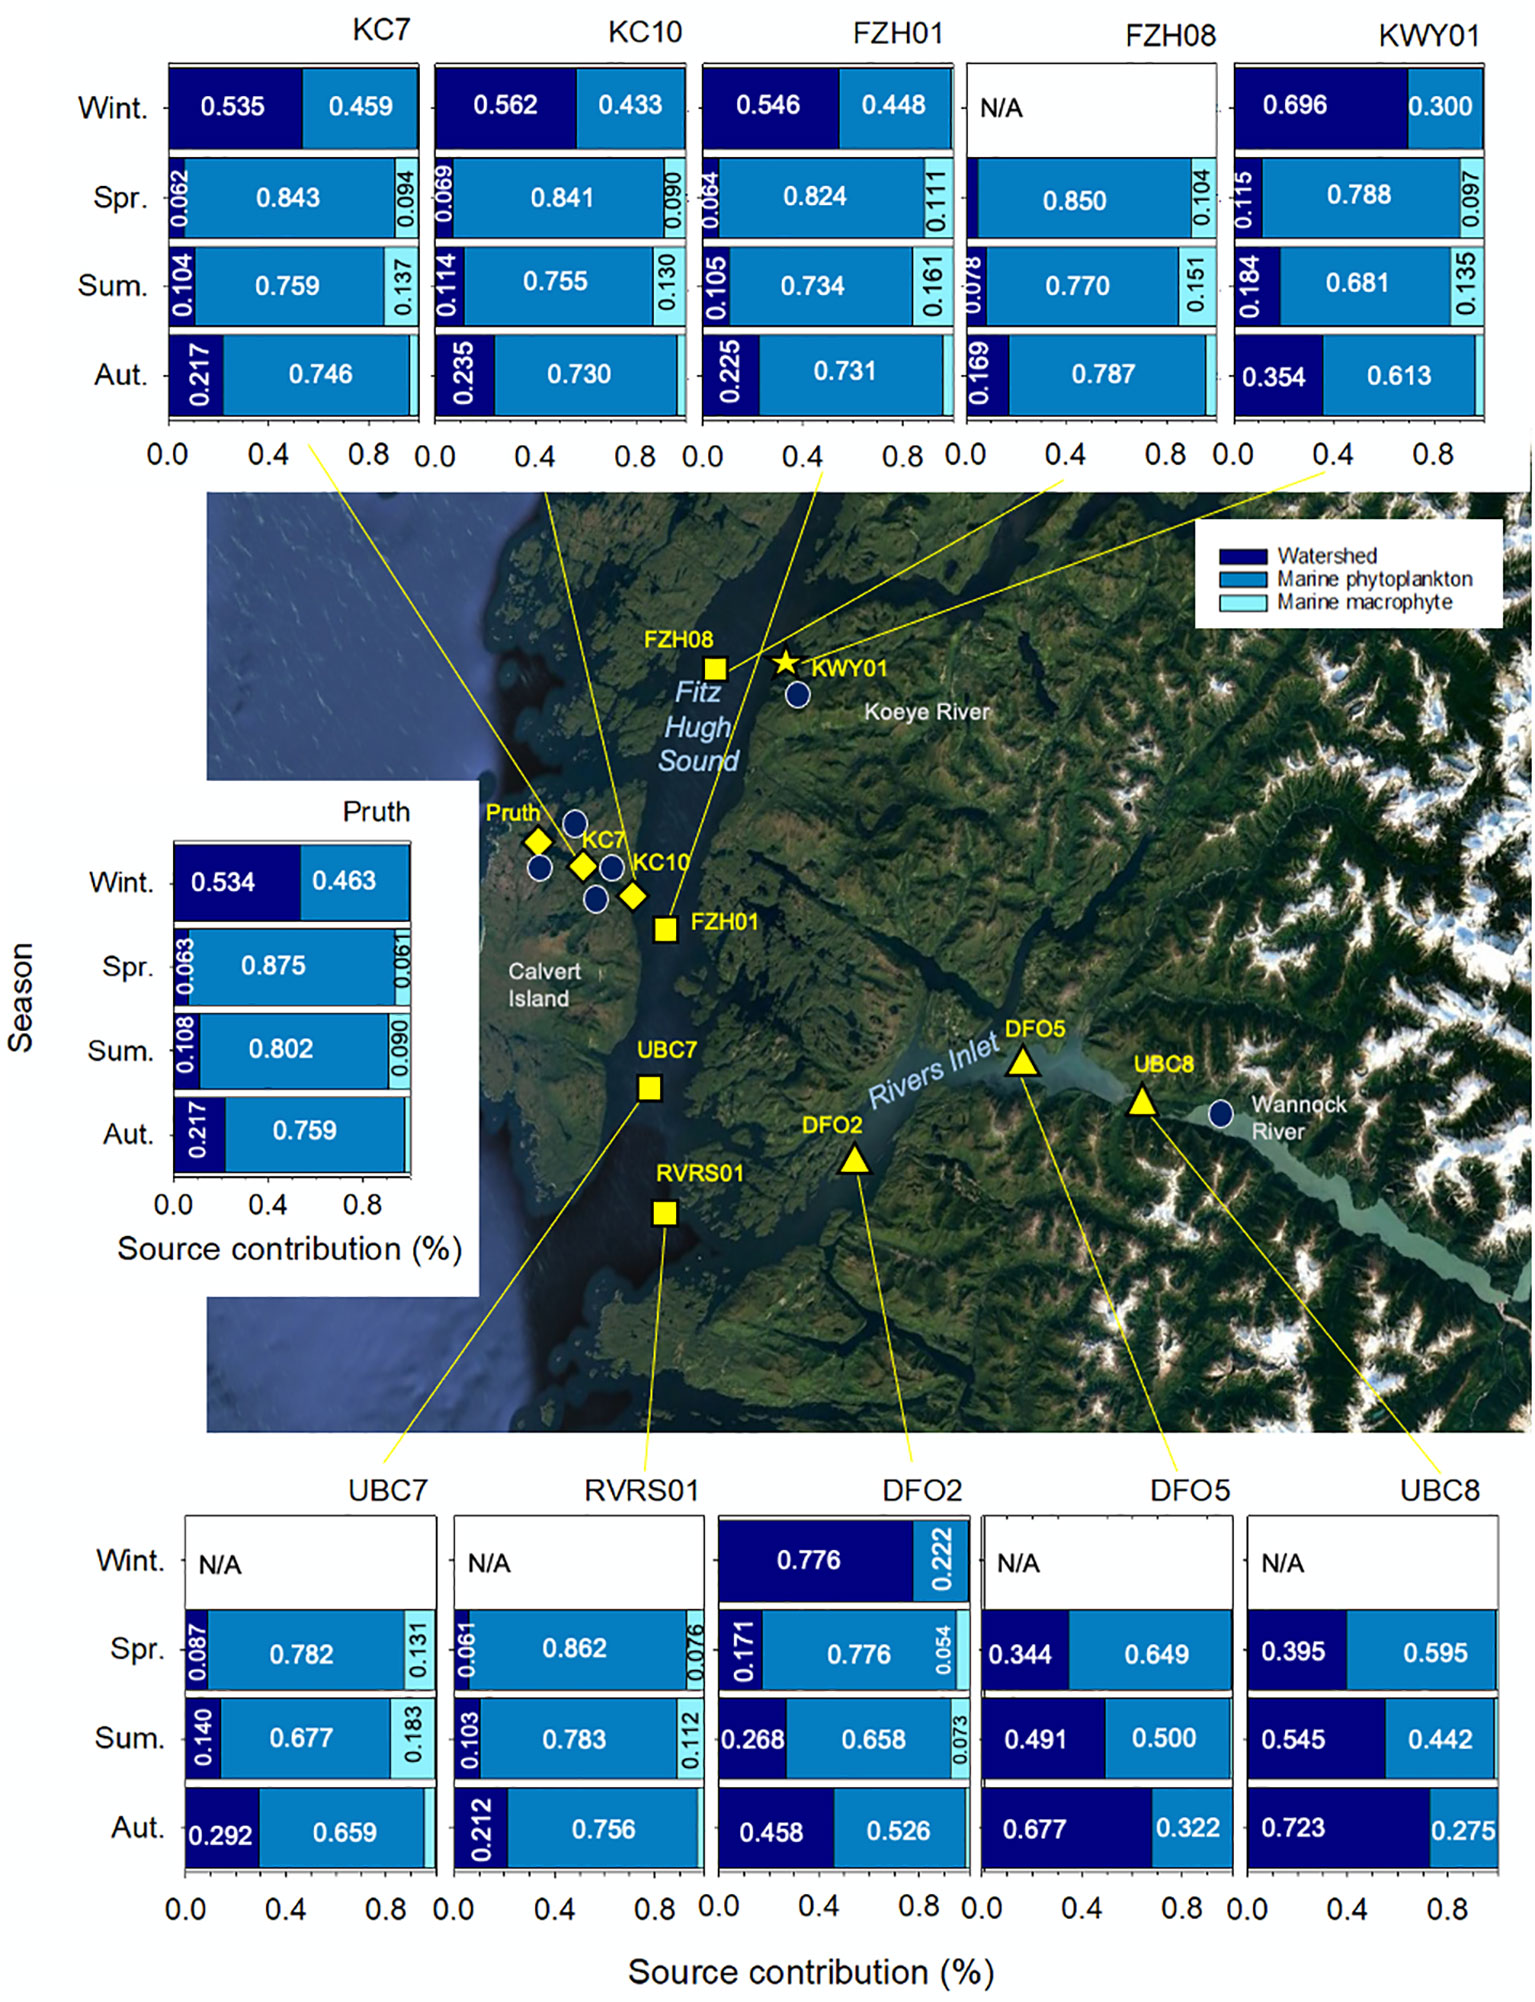
Figure 4 Relative contributions of watershed, marine phytoplankton and marine macrophytes to the surface (0-10 m) water particulate organic matter pool across 11 marine stations in the coastal northeast Pacific Ocean. Median values are shown for all contributions exceeding 0.05 (5%). Winter is defined as December through February, spring is March through May, summer is June through August and autumn is September through November. Median Bayesian credible intervals are shown. 95% credible intervals are presented in Table S6. Station symbols indicate major water bodies in the region: Rivers Inlet (triangles), Fitz Hugh Sound (squares), Kwakshua Channel (diamonds), and the Koeye Estuary (star). Centre map data: Google, TerraMetrics.
In spring, marine phytoplankton were by far the most important source of POM in surface waters, accounting for between 59.5 and 87.5% of POM. This is consistent with the period of time for which the highest chl a concentrations were observed (Table 1). Across all stations except for those in Rivers Inlet (UBC8, DFO5, DFO2), macrophytes were the second largest springtime contributor, accounting for up to 13.1% of POM.
In summer, marine phytoplankton contributed at least half of POM at all sites except UBC8 (39.5%). Summertime macrophyte and watershed contributions were similar at all sites except for those in Rivers Inlet, accounting for between 7.8 and 18.3% of POM (Figure 4; Table S6).
In autumn, marine phytoplankton still accounted for more than 50% of POM across all sites outside of the inlet. Watersheds contributed most of the remainder (range: 16.9-35.4%) outside of the inlet, with macrophyte contributions restricted to less than 5.0% of POM across all sites.
The three Rivers Inlet stations (UBC8, DFO5, DFO2) exhibited clear spatial and seasonal trends that differed from the rest of the stations (Figure 4). From spring through autumn, watershed contributions decreased with increasing distance from the Wannock River. In summer, watersheds accounted for roughly half of POM in surface waters at those stations closest to the Wannock River outlet (UBC8 and DFO5). In contrast to the rest of the region, watersheds continued to be the dominant source of POM in surface waters in autumn (52.6-72.3%). At UBC8 and DFO5, marine macrophyte communities had little bearing on the POM pool regardless of season. At DFO2, the Rivers Inlet station farthest from the Wannock River, macrophyte contributions exceeded 5% in spring and summer, but were still less than outside of the fjord.
4 Discussion
We used a dataset consisting of over 700 discrete measurements of POM chemical composition to show that watershed, marine phytoplankton, and macrophyte contributions to the surface water POM pool differed by season and location across oceanographic stations along the Central Coast of British Columbia, Canada. Marine phytoplankton were the dominant source of POM across the study area in the spring and all but two stations in the summer. Watersheds were the largest source of POM in the winter across all stations, detectable throughout the year, and of particular importance in the Rivers Inlet fjord ecosystem. Here we discuss these results in the context of the spatial and temporal dynamics of each of the major POM sources, possible food web implications, and the impact of predicted changes on land-ocean connectivity across the NPCTR.
4.1 Temporal Variability in POM Sources to Coastal Surface Waters of the NPCTR
Watershed contributions to the surface ocean POM pool were detectable throughout the year across the region, but were especially prominent during the winter months. Although POC concentrations were up to four-fold lower in winter than during the spring peak (Table 1 and Figure S2), watershed inputs were the primary source of POM across all stations in this complex coastal system through the winter. The timing of peak watershed contributions suggests that rain-dominated watersheds, and presumably rain-dominated exports from lower elevations of glacierized mountain watersheds in Rivers Inlet, were the primary source of wintertime POM to coastal waters (Figure 2B).
Marine phytoplankton dominated the surface POM pool throughout the region in spring (Figure 4), coincident with increasing incident light, the switch to upwelling-favourable winds, and the replenished inorganic nutrient pool [NO3-, PO4-, Si(OH)4] in surface waters (Wolfe et al., 2016). While the dominance of marine phytoplankton in surface waters during the spring and summer was unsurprising, their contribution also represented up to 46.3% of the wintertime POM pool in surface waters of the region. Along the Oregon shelf, wintertime marine phytoplankton production may equate to ~20% of the summer carbon fixation, fueled by riverine inputs of nutrients, iron, and organic matter (Wetz et al., 2006). In British Columbia, light is likely a more important factor limiting wintertime primary production than in the more southerly NPCTR waters of Oregon, where winter chl a concentrations (4 – 5.5 µg L-1; Wetz et al., 2012) far exceed those measured in this study (0.14 – 1.49 µg L-1).
Mixotrophic taxa like prasinophytes and cryptophytes may play an important seasonal role in the central and northern NPCTR, as they do further south in the Strait of Georgia (Del Bel Belluz et al., 2021). The ability to adopt both autotrophy and heterotrophy would make mixotrophic taxa particularly well adapted to the coastal waters of the NPCTR because of the seasonal variability in light and nutrients, the latter driven by both ocean dynamics and watershed exports. Higher surface inorganic nutrient concentrations following deep winter mixing are observed in the spring and favour autotrophy, whereas rain-dominated watershed exports of largely organic matter-associated nutrients peak in the autumn and winter (St. Pierre et al., 2021) and likely favour heterotrophy (McKie-Krisberg et al., 2015). POC:chl a of mixotrophs can be highly variable, with the ratios for some species falling below the 200 g g-1 that we used to define the marine phytoplankton end-member (e.g., 25 to 103 for Strombidium sp.; Putt, 1990), and others exceeding that threshold (e.g., 200 to 232 for Laboea strobila; Putt, 1990). Mixotrophic taxa contributions to the overall chl a pool is modest but non-trivial (up to 20%) in some environments (Stoecker et al., 2017), especially at times of the year with low chl a (e.g., up to 24% when chl a < 0.2 µg L-1; Putt, 1990). Confirming heterotrophic activity in natural microplankton communities, though, remains challenging (Stoecker and Lavrentyev, 2018). The marine phytoplankton end-member defined here therefore likely includes some though perhaps not all mixotrophic taxa.
Maximum marine macrophyte contributions to surface waters in Fitz Hugh Sound and Kwakshua Channel occurred during the summer in concert with peak growth rates for the macrophyte communities. This timing coincides with maximum kelp-derived detrital contributions to surface water POM pools along the west coast of Vancouver Island, driven by the shedding of summer growth (Ramshaw et al., 2017). In other coastal regions, turbulent mixing during storm events can transport seagrass detritus away from the beds (Thresher et al., 1992). Small and meso-scale oceanography are therefore especially important for determining macrophyte contributions to the POM pool (Ramshaw et al., 2017), and may explain why the highest macrophyte contributions (up to 18.3%) were determined at stations in Fitz Hugh Sound, which is more exposed and heavily influenced by offshore waters via Queen Charlotte Sound and Hakai Pass.
4.2 Fjords as Hotspots of Land-Ocean Ecosystem Connectivity
Seasonal phytoplankton, macrophyte, and watershed contributions to POM were relatively consistent between stations in Kwakshua Channel and Fitz Hugh Sound. However, the Rivers Inlet stations (UBC8, DFO5, DFO2) were more heavily influenced by watershed exports, including during the spring and summer, when phytoplankton were the dominant source of POM elsewhere. Rivers Inlet is one of the many fjords found across the northerly reaches of both the NPCTR and other CTR regions in Norway, Chile, and New Zealand (Bidlack et al., 2021). Fjords have a small surface area relative to that of their drainage basin and their connection to offshore waters are modulated by narrow openings and shallow sills. These characteristics strengthen the land-ocean connection and fjords have consequently been coined “aquatic critical zones” (Smith et al., 2015; Bianchi et al., 2020). While deep waters within Rivers Inlet are strongly affected by offshore waters that are exchanged across the sill (Jackson et al., 2018; Jackson et al., 2021), surface waters are more strongly tied to the water and materials exported from land (Hare et al., 2020). These dynamics have created coastal environments that are highly sensitive to processes occurring on land that ultimately affect exports to the coastal ocean and the uptake of land-derived materials in coastal food webs (Lafon et al., 2014). We note that seasonal hotspots of land-ocean connectivity may also occur in other locations along the NPCTR coast, especially in shallow estuaries downstream of medium to large rivers, as was observed in the autumn and winter months in the Koeye Estuary.
4.3 Additional POM Sources Not Accounted for and Future Model Refinements
There exist a few other potential sources of POM that were not explicitly accounted for within the mixing model, including deep waters remixed to the surface during storms, bacteria and archaea, and nano- and microzooplankton. Several autumn POM samples fell outside of the δ13C-δ15N space (Figure 3), largely because of high (>10.00‰) δ15N-PN values. These samples were all collected within a week-long period at the end of November 2016, suggesting that they may reflect a specific event along the coast. Indeed, δ15N-PN of these samples were similar to a small number of deeper (≥ 200 m) water samples collected in autumn and winter from stations FZH01 and KC10 (median δ15N-PN = 10.71‰, n = 3). The November 2016 sampling dates followed a large, prolonged rain event, a drop in the barometric pressure at sea level, and shifts in wind direction from north/northwesterly to south/southwesterly (Figure S8), all of which indicate unsettled conditions that may have led to the mixing of deep waters to the surface. Subsurface δ15N-PN values tend to be higher than their near surface counterparts due to enrichment in 15N during POM degradation and consumption by bacteria (Sigman and Casciotti, 2001). Although this small number of deep water samples were unique in their δ15N, they could not be distinguished from the other end-members based on δ13C and C:N. Their inclusion in the mixing model thus would have led to an overestimation of their contribution and a concomitant underestimation of the contribution of other sources.
Other potentially important contributors to the coastal POM pool that could not be explicitly accounted for were bacteria and archaea. Bacteria and archaea play an important role in the processing of POM, and may be especially prevalent in coastal waters that receive large fluxes of materials from land (Liénart et al., 2020). However, bacterial contributions to the bulk POM pool are extremely difficult to quantify because their stable isotope signatures tend to match their substrate, regardless of origin (Liénart et al., 2020). Instead, measurements like fatty acid biomarkers are required to identify bacteria from which their contributions to the bulk POM pool can be qualitatively inferred (Dalsgaard et al., 2003; Liénart et al., 2020). Given the ubiquity of bacteria and archaea, a microbial end-member would likely have reduced the contributions of each of the three defined end-members.
Nano- (2-20 µm) and microzooplankton (20-200 µm) may also be captured within the POM pool. They may be important conduits for terrestrial materials via bacteria and archaea to higher trophic levels (Aytan et al., 2018), and can affect the POM pool through grazing (Talmy et al., 2016). Model simulations suggest that microzooplankton lower the C:N ratio of the POM pool by preferentially respiring C-rich compounds (Talmy et al., 2016), though considerable interspecific differences exist (Golz et al., 2015). In coastal ecosystems affected by the Mississippi River, grazing by microzooplankton plays an important role in determining the fate of POM in coastal waters: higher grazing rates during peak primary production lead to reduced vertical export, whereas lower grazing rates outside of the bloom periods result in a greater fraction of primary production exported to depth (Redalje and Fahnenstiel, 1994). Within the coastal NPCTR, we might therefore expect contributions from microzooplankton to be lowest through the late autumn and winter and highest through the spring to early autumn, tracking primary production and overall availability of POM (Table 1). A nano- and microzooplankton end-member would have likely been very difficult to separate from the phytoplankton in δ13C - δ15N – C:N space, and assessing their contributions may have required the use of additional chemical markers (e.g., compound-specific stable isotopes).
We also acknowledge that there was likely significant seasonal variability in the end-members that could not be accounted for because of the small number of samples for marine phytoplankton (n = 2) and macrophytes (n = 3) during the winter months. For example, in Hood Canal in nearby Washington state, seasonal δ13C depletion as high as 8‰ have been observed for autotrophs in winter, such that they look isotopically much more similar to organic matter of terrestrial origin (Simenstad and Wissmar, 1985). This seasonal difference was largely attributed to an important role for freshwater dissolved inorganic carbon (DIC) as a carbon source in winter (Simenstad and Wissmar, 1985). How these seasonal transitions affect δ15N and C:N in autotrophs remain an open question. In a similar vein, spatial variability in the marine phytoplankton and macrophyte end-members was likely not fully captured by the use of aggregate end-members. This variability would reflect varying contributions from land (e.g., sites closer to large riverine inputs affected by freshwater DIC contributions as above) and the open ocean.
Because there was a much smaller number of glacierized (Wannock) river samples (n = 6) compared to those from rain-dominated watersheds (n = 100), we defined a single watershed end-member by combining samples from rain-dominated and glacierized watersheds. Notably, however, the six glacierized watershed samples had lower δ15N-PN and lower C:N than samples collected from the rain-dominated systems (Table S4). This likely reflects greater microbial contributions to the POM from glacial environments (Hood et al., 2009), a difference which could ultimately affect how these materials are processed in coastal waters (Fellman et al., 2010). One future refinement to the mixing model would therefore be to resolve the relative importance of different watershed types on the POM pool in coastal waters. This is especially important given the projected declines in glacial runoff for the region (Bliss et al., 2014), which would result in a transition from glacierized to snow- and rain-dominated watersheds with a concomitant reduction in the particulate fraction (Hood et al., 2020). Such a transition could have important implications for the biogeochemistry and ecology of coastal waters across the NPCTR, but especially for fjords like Rivers Inlet that are now strongly influenced by glacial meltwaters (Hood and Berner, 2009).
4.4 Fate of POM in Surface Waters of the NPCTR
One outstanding question is the role that source may play in determining the fate of POM in coastal waters. The two primary fates of POM are settling out of the water column and uptake by organisms. Remineralization and subsequent loss of carbon dioxide (CO2) to the atmosphere may result from either of these two pathways, though burial efficiency tends to be quite high within the NPCTR, especially within its fjords (Johannessen et al., 2003; Cui et al., 2016; Hage et al., 2020). Quantifying the atmospheric flux of CO2 from coastal systems and determining how it relates to cross-ecosystem (land-ocean, aquatic-atmosphere) fluxes is a priority area for future study and critical for understanding how these connections affect the carbon balance of coastal ecosystems.
POM settling out of the water column is an effective sink for organic carbon over geological time scales across many different coastal environments. Globally, organic carbon burial rates in fjords are 100-times the oceanic average primarily due to the large watershed inputs characteristic of these systems (Smith et al., 2015; Hage et al., 2020). Watershed contributions to benthic sediments in fjords therefore tend to scale with distance from riverine inputs (Prahl et al., 1994; Nuwer and Keil, 2005; Walsh et al., 2008), much as we observed in the surface waters of Rivers Inlet. In eelgrass beds of the Central Coast, around 41% of sedimentary organic carbon comes from land, with the remainder split between kelp (33%) and eelgrass (25%) (marine phytoplankton contributions not quantified; Prentice et al., 2019). Outside of these beds, contributions to sediments from macrophytes are likely diminished, though transport of detrital materials during storm events may result in some locations with sporadically higher macrophyte contributions. We note, however, that most studies considering source contributions to sediments investigate only two of the three sources quantified here at any given time, precluding a direct comparison to these results. Given the dynamics and diversity of coastal ecosystems across the NPCTR, we would expect there to be significant variability in source contributions to sediments across the region, even over short distances.
POM derived from marine phytoplankton is typically considered more available for uptake than watershed or macrophyte materials due to a higher relative nitrogen content (lower C:N ratio; see Table 1) and the size limitations of zooplankton feeding. Combined with the fact that phytoplankton can account for up to 87% of POM during seasons with the highest POC concentrations (Figure 4 and Figure S2), this likely supports a foundational role for phytoplankton in classic marine food webs in the NPCTR (e.g., phytoplankton-zooplankton-fish-whale). Terrestrial and other detrital materials may, however, be important direct subsidies to marine microbial communities (Wikner and Andersson, 2012), zooplankton (Vargas et al., 2011; Lafon et al., 2014), and other coastal invertebrates (Sakamaki and Richardson, 2008; Harding and Reynolds, 2014; Howe et al., 2017) that can contribute to higher trophic level organisms like fish and birds (Arimitsu et al., 2018). Despite the strong connection between land, nearshore environments, and marine surface waters demonstrated here, comparatively less is known about the relevance of cross-ecosystem subsidies to pelagic food webs (but see Arimitsu et al., 2018). Understanding the base of these food webs is critical given that pelagic waters of the coastal NPCTR are important spawning, nursery, and foraging habitat for species of local importance, like herring, eulachon, salmon, and orca.
Marine macrophyte contributions to pelagic food webs are likely highly variable, but have received relatively little attention, despite the prevalence of these communities along temperate coasts (e.g., Murphy et al., 2021). In Tasmania, for example, δ13C signatures and gut contents of young gadoid larvae indicated a diet largely based on seagrass detritus (Thresher et al., 1992). Winter storms were an important factor in the offshore transport of seagrass detritus in that system. In the Central Coast region of British Columbia, macrophytes accounted for less than 1% of the pelagic winter POM pool, suggesting a comparatively small role for macrophyte-derived POM in pelagic food webs during this season. However, detritus may be locally important in summer when they can make up to 18.3% of the surface water POM pool in areas like southern Fitz Hugh Sound and the Koeye Estuary, and in nearshore benthic environments like eelgrass beds (Prentice et al., 2019).
4.5 Future Perspectives on Land-Ocean Connectivity in the NPCTR
Across the NPCTR, climate change is predicted to fundamentally alter the connection between land and the coastal ocean by amplifying seasonal contrasts through increased winter but reduced summer rainfall (Radić; et al., 2015; Bidlack et al., 2021), increased landslide occurrence (Jakob and Lambert, 2009; Sobie, 2020), enhanced glacial melt in the near term but reduced glacial inputs in the longer term (Bliss et al., 2014; Huss and Hock, 2018), and greater incidence and severity of extreme marine and terrestrial heatwaves (Frölicher et al., 2018; Frölicher and Laufkötter, 2018; Perkins-Kirkpatrick and Lewis, 2020). On top of these changes, we must also consider the effects that logging and other land use practices have on the connection between land and the coastal ocean (e.g., via impacts on slope stability and the accumulation of woody debris under estuarine log storage areas; Sedell et al., 1991; Nahirnick et al., 2019). The ecological consequences of these changes and activities for the base of coastal food webs are poorly understood, but may include changing phytoplankton (Jackson et al., 2015) and macrophyte community composition and productivity (Murphy et al., 2021) and changes in the composition and amount of watershed-derived POM being exported to the coast (Hood et al., 2020).
Coastal marine ecosystems have traditionally fallen under the purview of marine planning and management, but should – by necessity – also be included in watershed planning and management processes, a holistic approach that recognizes that what happens on land has far reaching consequences. The fact that these changes are already occurring (e.g., Jackson et al., 2018; Johannessen et al., 2020; Traving et al., 2021) underscores the need to recognize coastal ecosystems as integrators of physicochemical processes and biological communities operating both on land and in the ocean. The extent of these changes highlights the need for concerted, long-term efforts to monitor freshwater and marine water quality against which future changes can be compared and understood. Although additional work is needed to understand whether/how these connections propagate to higher trophic levels, especially for pelagic species that spend extended periods of time in coastal areas (e.g., coho salmon), the results presented here suggest that ignoring the diversity of contributions to pelagic ecosystems may greatly underestimate the importance of ecosystem connectivity in coastal waters and the impacts of climate and other changes on coastal ecosystem health and function. Given that watershed and macrophyte contributions were consistently a part of – and at times even dominated – the organic matter pool in surface waters in this region, these connections are fundamental to these systems. These results emphasize that coastal waters need to be examined, stewarded, and managed as integrated land-ocean meta-ecosystems.
Data Availability Statement
The datasets presented in this study can be found in online repositories. The names of the repository/repositories and accession number(s) can be found below: https://doi.org/10.21966/hpqq-0k76.
Author Contributions
KS curated the surface water and marine POM datasets, completed all formal analyses, and wrote the original draft of the study. BH, IG, ST, and KL conceptualized the project, designed and coordinated collection of the freshwater and marine POM datasets, and provided feedback throughout the analyses. JD curated the chlorophyll a dataset, and provided expertise in phytoplankton ecology. TF, MH-L and AO curated the macrophyte dataset, and provided expertise in macrophyte ecology. All authors reviewed and edited the manuscript. All authors contributed to the article and approved the submitted version.
Funding
This work was funded by the Tula Foundation.
Conflict of Interest
The authors declare that the research was conducted in the absence of any commercial or financial relationships that could be construed as a potential conflict of interest.
Publisher’s Note
All claims expressed in this article are solely those of the authors and do not necessarily represent those of their affiliated organizations, or those of the publisher, the editors and the reviewers. Any product that may be evaluated in this article, or claim that may be made by its manufacturer, is not guaranteed or endorsed by the publisher.
Acknowledgments
We gratefully acknowledge that this research took place on the traditional, ancestral and unceded territories of the Haíɫzaqv and W’ui’kinuxv First Nations. William Housty, Larry Jorgensen, Dave Rolston, and Jennifer Walkus were instrumental in facilitating river sample collections within these territories. We thank William Housty and Jennifer Walkus for excellent discussions about land-ocean connectivity, the applications and implications of this work, and for reviewing the manuscript. Jennifer Jackson coordinated the oceanographic sampling campaigns. Fieldwork supporting this work was skillfully conducted by staff of the Hakai Institute, including Christopher Coxson, Isabelle Desmarais, Bryn Fedje, Emily Haughton, Maartje Korver, Chris Mackenzie, Skye McEwan, Zach Monteith, Emma Myers, Chris O’Sullivan, Carolyn Prentice, and Rob White. Santiago Gonzalez Arriola helped with watershed delineations and generating watershed statistics, and Keith Holmes generated Figure 1. K.A.St.P. acknowledges the support of Hakai Coastal Initiative and Banting Postdoctoral Fellowships. S.E.T. acknowledges salary support from the Campus Alberta Innovates Program.
Supplementary Material
The Supplementary Material for this article can be found online at: https://www.frontiersin.org/articles/10.3389/fmars.2022.863209/full#supplementary-material
References
Arimitsu M. L., Hobson K. A., Webber D., Piatt J. F., Hood E. W., Fellman J. B. (2018). Tracing Biogeochemical Subsidies From Glacier Runoff Into Alaska’s Coastal Marine Food Webs. Global Change Biol. 24, 387–398. doi: 10.1111/gcb.13875
Aytan U., Feyzioglu A. M., Valente A., Agirbas E., Fileman E. S. (2018). Microbial Plankton Communities in the Coastal Southeastern Black Sea: Biomass, Composition and Trophic Interactions. Oceanologia 60, 139–152. doi: 10.1016/j.oceano.2017.09.002
Bauer J. E., Cai W.-J., Raymond P. A., Bianchi T. S., Hopkinson C. S., Regnier P. (2013). The Changing Carbon Cycle of the Coastal Ocean. Nature 504, 61–70. doi: 10.1038/nature12857
Berto D., Rampazzo F., Noventa S., Cacciatore F., Gabellini M., Aubry F. B., et al. (2013). Stable Carbon and Nitrogen Isotope Ratios as Tools to Evaluate the Nature of Particulate Organic Matter in the Venice Lagoon. Estuar. Coast. Shelf Sci. 135, 66–76. doi: 10.1016/j.ecss.2013.06.021
Bianchi T. S., Arndt S., Austin W. E. N., Benn D. I., Bertrand S., Cui X., et al. (2020). Fjords as Aquatic Critical Zones (ACZs). Earth Sci. Rev. 203, 103145. doi: 10.1016/j.earscirev.2020.103145
Bidlack A. L., Bisbing S. M., Buma B. J., Diefenderfer H. L., Fellman J. B., Floyd W. C., et al. (2021). Climate-Mediated Changes to Linked Terrestrial and Marine Ecosystems Across the Northeast Pacific Coastal Temperate Rainforest Margin. BioScience 71, 581–595. doi: 10.1093/biosci/biaa171
Blanchette C. A., Melissa Miner C., Raimondi P. T., Lohse D., Heady K. E. K., Broitman B. R. (2008). Biogeographical Patterns of Rocky Intertidal Communities Along the Pacific Coast of North America. J. Biogeogr. 35, 1593–1607. doi: 10.1111/j.1365-2699.2008.01913.x
Bliss A., Hock R., Radić V. (2014). Global Response of Glacier Runoff to Twenty-First Century Climate Change. J. Geophys. Res.: Earth Surf. 119, 717–730. doi: 10.1002/2013JF002931
Conway-Cranos L., Kiffney P., Banas N., Plummer M., Naman S., Maccready P., et al. (2015). Stable Isotopes and Oceanographic Modeling Reveal Spatial and Trophic Connectivity Among Terrestrial, Estuarine, and Marine Environments. Mar. Ecol. Progr. Ser. 533, 15–28. doi: 10.3354/meps11318
Core Team R. (2020). R: A Language and Environment for Statistical Computing (Vienna, Austria: R Foundation for Statistical Computing).
Cui X., Bianchi T. S., Jaeger J. M., Smith R. W. (2016). Biospheric and Petrogenic Organic Carbon Flux Along Southeast Alaska. Earth Planet. Sci. Lett. 452, 238–246. doi: 10.1016/j.epsl.2016.08.002
Dalsgaard J., St. John M., Kattner G., Müller-Navarra D. (2003). Fatty Acid Trophic Markers in the Pelagic Marine Environment. Adv. Mar. Biol. 46, 225–340. doi: 10.1016/S0065-2881(03)46005-7
Del Bel Belluz J., Peña M. A., Jackson J. M., Nemcek N. (2021). Phytoplankton Composition and Environmental Drivers in the Northern Strait of Georgia (Salish Sea), British Columbia, Canada. Estuaries Coasts 44, 1419–1439. doi: 10.1007/s12237-020-00858-2
Fellman J. B., Spencer R. G. M., Hernes P. J., Edwards R. T., D’amore D. V., Hood E. (2010). The Impact of Glacier Runoff on the Biodegradability and Biochemical Composition of Terrigenous Dissolved Organic Matter in Near-Shore Marine Ecosystems. Mar. Chem. 121, 112–122. doi: 10.1016/j.marchem.2010.03.009
Foreman M. G. G., Pal B., Merryfield W. J. (2011). Trends in Upwelling and Downwelling Winds Along the British Columbia Shelf. J. Geophys. Res.: Oceans 116, C10023. doi: 10.1029/2011JC006995
Froese T., Gehman A., Hessing-Lewis M., Sadlier-Brown G. (2020). Fucus Point Intercept Survey Data From BC Central Coast 2016-2019 (Heriot Bay, BC, Canada: Hakai Institute). doi: 10.21966/v57r-g944
Froese T., Sadlier-Brown G., Olson A. M., Hessing-Lewis M. (2019). Nearshore Macrophyte Stable Isotope Results From BC’s Central Coast 2014-2018 (Heriot Bay, BC, Canada: Hakai Institute). doi: 10.21966/q31x-qg72
Frölicher T. L., Fischer E. M., Gruber N. (2018). Marine Heatwaves Under Global Warming. Nature 560, 360–364. doi: 10.1038/s41586-018-0383-9
Frölicher T. L., Laufkötter C. (2018). Emerging Risks From Marine Heat Waves. Nat. Commun. 9, 650. doi: 10.1038/s41467-018-03163-6
Giesbrecht I. J. W., Floyd W. C., Tank S. E., Lertzman K. P., Hunt B. P. V., Korver M. C., et al. (2021). The Kwakshua Watersheds Observatory, Central Coast of British Columbia, Canada. Hydrol. Processes 35, e14198. doi: 10.1002/hyp.14198
Giesbrecht I., Tank S. E., Frazer G. W., Hood E. W., Gonzalez Arriola S. G., Butman D. E., et al. (2022). Watershed Classification Predicts Streamflow Regime and Organic Carbon Dynamics in the Northeast Pacific Coastal Temperate Rainforest. Global Bigeochem. Cycles 36, e2021GB007047. doi: 10.1029/2021GB007047
Golz A.-L., Burian A., Winder M. (2015). Stoichiometric Regulation in Micro- and Mesozooplankton. J. Plankton Res. 37, 293–305. doi: 10.1093/plankt/fbu109
Gounand I., Little C. J., Harvey E., Altermatt F. (2018). Cross-Ecosystem Carbon Flows Connecting Ecosystems Worldwide. Nat. Commun. 9, 4825. doi: 10.1038/s41467-018-07238-2
Hage S., Galy V. V., Cartigny M. J. B., Acikalin S., Clare M. A., Gröcke D. R., et al. (2020). Efficient Preservation of Young Terrestrial Organic Carbon in Sandy Turbidity-Current Deposits. Geology 48, 882–887. doi: 10.1130/G47320.1
Halverson M., Jackson J., Richards C., Melling H., Hunt B., Brunsting R., et al. (2017). Guidelines for Processing RBR CTD Profiles (Sidney, BC, Canada: Fisheries and Oceans Canada).
Harding J. M. S., Reynolds J. D. (2014). From Earth and Ocean: Investigating the Importance of Cross-Ecosystem Resource Linkages to a Mobile Estuarine Consumer. Ecosphere 5, 54. doi: 10.1890/ES14-00029.1
Hare A., Evans W., Pocock K., Weekes C., Gimenez I. (2020). Contrasting Marine Carbonate Systems in Two Fjords in British Columbia, Canada: Seawater Buffering Capacity and the Response to Anthropogenic CO2 Invasion. PloS One 15, e0238432. doi: 10.1371/journal.pone.0238432
Hodal M. (2010). Net Physical Transports, Residence Times, and New Production for Rivers Inlet, British Columbia M.Sc. Thesis (Vancouver, BC, Canada: University of British Columbia).
Holm-Hansen O., Lorenzen C. J., Holmes R. W., Strickland J. D. H. (1965). Fluorometric Determination of Chlorophyll. ICES J. Mar. Sci. 30, 3–15. doi: 10.1093/icesjms/30.1.3
Hood E., Berner L. (2009). Effects of Changing Glacial Coverage on the Physical and Biogeochemical Properties of Coastal Streams in Southeastern Alaska. J. Geophys. Res.: Biogeosci. 114, G03001. doi: 10.1029/2009JG000971
Hood E., Fellman J. B., Spencer R. G. M. (2020). Glacier Loss Impacts Riverine Organic Carbon Transport to the Ocean. Geophys. Res. Lett. 47, e2020GL089804. doi: 10.1029/2020GL089804
Hood E., Fellman J., Spencer R. G. M., Hernes P. J., Edwards R., D’amore D., et al. (2009). Glaciers as a Source of Ancient and Labile Organic Matter to the Marine Environment. Nature 462, 1044. doi: 10.1038/nature08580
Howe E., Simenstad C. A., Ogston A. (2017). Detrital Shadows: Estuarine Food Web Connectivity Depends on Fluvial Influence and Consumer Feeding Mode. Ecol. Appl. 27, 2170–2193. doi: 10.1002/eap.1600
Huss M., Hock R. (2018). Global-Scale Hydrological Response to Future Glacier Mass Loss. Nat. Clim. Change 8, 135–140. doi: 10.1038/s41558-017-0049-x
Jackson J. M., Bianucci L., Hannah C. G., Carmack E. C., Barrette J. (2021). Deep Waters in British Columbia Mainland Fjords Show Rapid Warming and Deoxygenation From 1951 to 2020. Geophys. Res. Lett. 48, e2020GL091094. doi: 10.1029/2020GL091094
Jackson J. M., Johnson G. C., Dosser H. V., Ross T. (2018). Warming From Recent Marine Heatwave Lingers in Deep British Columbia Fjord. Geophys. Res. Lett. 45, 9757–9764. doi: 10.1029/2018GL078971
Jackson J. M., Thomson R. E., Brown L. N., Willis P. G., Borstad G. A. (2015). Satellite Chlorophyll Off the British Columbia Coast 1197–2010. J. Geophys. Res.: Oceans 120, 4709–4728. doi: 10.1002/2014JC010496
Jakob M., Lambert S. (2009). Climate Change Effects on Landslides Along the Southwest Coast of British Columbia. Geomorphology 107, 275–284. doi: 10.1016/j.geomorph.2008.12.009
Johannessen S. C., Macdonald R. W., Paton D. W. (2003). A Sediment and Organic Carbon Budget for the Greater Strait of Georgia. Estuar. Coast. Shelf Sci. 56, 845–860. doi: 10.1016/S0272-7714(02)00303-7
Johannessen S. C., Macdonald R. W., Strivens J. E. (2020). Has Primary Production Declined in the Salish Sea? Can. J. Fish. Aquat. Sci. 78, 312–321. doi: 10.1139/cjfas-2020-0115
Korver M. C., Floyd W. C., Brunsting R. (2020). Observed Stream Flow From Seven Small Coastal Watersheds in British Columbia, Canada, Sept. 2013 - Sept. 2019. “ Version 5.0 (Heriot Bay, BC, Canada: Hakai Institute). doi: 10.21966/fh63-w427
Lafon A., Silva N., Vargas C. A. (2014). Contribution of Allochthonous Organic Carbon Across the Serrano River Basin and the Adjacent Fjord System in Southern Chilean Patagonia: Insights From the Combined Use of Stable Isotope and Fatty Acid Biomarkers. Prog. Oceanogr. 129, 98–113. doi: 10.1016/j.pocean.2014.03.004
Liénart C., Savoye N., Bozec Y., Breton E., Conan P., David V., et al. (2017). Dynamics of Particulate Organic Matter Composition in Coastal Systems: A Spatio-Temporal Study at Multi-Systems Scale. Prog. Oceanogr. 156, 221–239. doi: 10.1016/j.pocean.2017.03.001
Liénart C., Savoye N., Conan P., David V., Barbier P., Bichon S., et al. (2020). Relationship Between Bacterial Compartment and Particulate Organic Matter (POM) in Coastal Systems: An Assessment Using Fatty Acids and Stable Isotopes. Estuar. Coast. Shelf Sci. 239, 106720. doi: 10.1016/j.ecss.2020.106720
Liu Z., Xue J. (2020). The Lability and Source of Particulate Organic Matter in the Northern Gulf of Mexico Hypoxic Zone. J. Geophys. Res.: Biogeosci. 125, e2020JG005653. doi: 10.1029/2020JG005653
Lorrain A., Savoye N., Chauvaud L., Paulet Y.-M., Naulet N. (2003). Decarbonation and Preservation Method for the Analysis of Organic C and N Contents and Stable Isotope Ratios of Low-Carbonated Suspended Particulate Material. Analytica Chimica Acta 491, 125–133. doi: 10.1016/S0003-2670(03)00815-8
Lucas B. G., Verrin S., Brown R. (Eds.) (2007). Ecosystem Overview: Pacific North Coast Integrated Management Area (PNCIMA) (Sidney, British Columbia, Canada: Fisheries and Oceans Canada).
MacKenzie W., Remington D., Shaw J. (2000). Estuaries of the North Coast of British Columbia: A Reconnaissance Survey of Selected Sites (Smithers, British Columbia: Ministry of Environment, Lands and Parks, and Ministry of Forests).
Martínez M. L., Intralawan A., Vázquez G., Pérez-Maqueo O., Sutton P., Landgrave R. (2007). The Coasts of Our World: Ecological, Economic and Social Importance. Ecol. Econ. 63, 254–272. doi: 10.1016/j.ecolecon.2006.10.022
McKie-Krisberg Z. M., Gast R. J., Sanders R. W. (2015). Physiological Responses of Three Species of Antarctic Mixotrophic Phytoflagellates to Changes in Light and Dissolved Nutrients. Microbial Ecol. 70, 21–29. doi: 10.1007/s00248-014-0543-x
Monteith Z. L., Olson A. M., Hessing-Lewis M. (2019). Seagrass Subtidal Habitat Survey Data From BC Central Coast (Heriot Bay, BC, Canada: Hakai Institute).
Murphy G. E. P., Dunic J. C., Adamczyk E. M., Bittick S. J., Côté I. M., Cristiani J., et al. (2021). From Coast to Coast to Coast: Ecology and Management of Seagrass Ecosystems Across Canada. FACETS 6, 139–179. doi: 10.1139/facets-2020-0020
Nahirnick N. ,. K., Costa M., Schroeder S., Sharma T. (2019). Long-Term Eelgrass Habitat Change and Associated Human Impacts on the West Coast of Canada. J. Coast. Res. 36, 30–40. doi: 10.2112/JCOASTRES-D-18-00112.1
Nuwer J. M., Keil R. G. (2005). Sedimentary Organic Matter Geochemistry of Clayoquot Sound, Vancouver Island, British Columbia. Limnol. Oceanogr. 50, 1119–1128. doi: 10.4319/lo.2005.50.4.1119
Oliver A. A., Tank S. E., Giesbrecht I., Korver M. C., Floyd W. C., Sanborn P., et al. (2017). A Global Hotspot for Dissolved Organic Carbon in Hypermaritime Watersheds of Coastal British Columbia. Biogeosciences 14, 3743–3762. doi: 10.5194/bg-14-3743-2017
Olson A. M., Hessing-Lewis M., Haggarty D., Juanes F. (2019). Nearshore Seascape Connectivity Enhances Seagrass Meadow Nursery Function. Ecol. Appl. 29, e01897. doi: 10.1002/eap.1897
Perdue E. M., Koprivnjak J. F. (2007). Using the C/N Ratio to Estimate Terrigenous Inputs of Organic Matter to Aquatic Environments. Estuarine Coastal Shelf Sci. 73, 65-72. doi: 10.1016/j.ecss.2006.12.021
Perkins-Kirkpatrick S. E., Lewis S. C. (2020). Increasing Trends in Regional Heatwaves. Nat. Commun. 11, 3357. doi: 10.1038/s41467-020-16970-7
Pickard G. L. (1961). Oceanographic Features of Inlets in the British Columbia Mainland Coast. J. Fisheries Res. Board Canada 18, 907–999. doi: 10.1139/f61-062
Prahl F. G., Ertel J. R., Goni M. A., Sparrow M. A., Eversmeyer B. (1994). Terrestrial Organic Carbon Contributions to Sediments on the Washington Margin. Geochim. Cosmochim. Acta 58, 3035–3048. doi: 10.1016/0016-7037(94)90177-5
Prentice C., Hessing-Lewis M., Sanders-Smith R., Salomon A. K. (2019). Reduced Water Motion Enhances Organic Carbon Stocks in Temperate Eelgrass Meadows. Limnol. Oceanogr. 64, 2389–2404. doi: 10.1002/lno.11191
Putt M. (1990). Abundance, Chlorophyll Content and Photosynthetic Rates of Ciliates in the Nordic Seas During Summer. Deep Sea Res. Part A. 37, 1713–1731. doi: 10.1016/0198-0149(90)90073-5
Radić V., Cannon A. J., Menounos B., Gi N. (2015). Future Changes in Autumn Atmospheric River Events in British Columbia, Canada, as Projected by CMIP5 Global Climate Models. J. Geophys. Res.: Atmos. 120, 9279–9302. doi: 10.1002/2015JD023279
Ramshaw B. C., Pakhomov E. A., Markel R. W., Kaehler S. (2017). Quantifying Spatial and Temporal Variations in Phytoplankton and Kelp Isotopic Signatures to Estimate the Distribution of Kelp-Derived Detritus Off the West Coast of Vancouver Island, Canada. Limnol. Oceanogr. 62, 2133–2153. doi: 10.1002/lno.10555
Redalje D. G., Fahnenstiel G. L. (1994). The Relationship Between Primary Production and the Vertical Export of Particulate Organic Matter in a River-Impacted Coastal Ecosystem. Estuaries 17, 829–838. doi: 10.2307/1352751
Reshitnyk L. (2015). Koeye Estuary Habitat Mapping Report (Heriot Bay, BC, Canada: Hakai Institute).
Sakamaki T., Richardson J. S. (2008). Effects of Small Rivers on Chemical Properties of Sediment and Diets for Primary Consumers in Estuarine Tidal Flats. Mar. Ecol. Progr. Ser. 360, 13–24. doi: 10.3354/meps07388
Savoye N., Aminot A., Tréguer P., Fontugne M., Naulet N., Kérouel R. (2003). Dynamics of Particulate Organic Matter D15n and D13c During Spring Phytoplankton Blooms in a Macrotidal Ecosystem (Bay of Seine, France). Mar. Ecol. Progr. Ser. 255, 27–41. doi: 10.3354/meps255027
Savoye N., David V., Morisseau F., Etcheber H., Abril G., Billy I., et al. (2012). Origin and Composition of Particulate Organic Matter in a Macrotidal Turbid Estuary: The Gironde Estuary, France. Estuar. Coast. Shelf Sci. 108, 16–28. doi: 10.1016/j.ecss.2011.12.005
Sedell J. R., Leone F. N., Duval W. S., Meehan W. R. (1991). “Water Transportation and Storage of Logs,” in Influence of Forest Rangeland Management on Salmonid Fishes and Their Habitats. Ed. (Bethesda, MD, USA: American Fisheries Society), 325–368.
Seitz K. M., Atlas W. I., Millard-Martin B., Reid J., Heavyside J., Hunt B. P. V., et al. (2020). Size-Spectra Analysis in the Estuary: Assessing Fish Nursery Function Across a Habitat Mosaic. Ecosphere 11, e03291. doi: 10.1002/ecs2.3291
Sigman D. M., Casciotti K. L., Steele J. H. (2001). “Nitrogen Isotopes in the Ocean,” in Encyclopedia of Ocean Sciences. Ed. (Oxford: Academic Press), 1884–1894.
Simenstad C. A., Wissmar R. C. (1985). D13c Evidence of the Origins and Fates of Organic Carbon in Estuarine and Nearshore Food Webs. Mar. Ecol. Progr. Ser. 22, 141–152. doi: 10.3354/meps022141
Smith R. W., Bianchi T. S., Allison M., Savage C., Galy V. (2015). High Rates of Organic Carbon Burial in Fjord Sediments Globally. Nat. Geosci. 8, 450–453. doi: 10.1038/ngeo2421
Sobie S. R. (2020). Future Changes in Precipitation-Caused Landslide Frequency in British Columbia. Clim. Change 162, 465–484. doi: 10.1007/s10584-020-02788-1
Stock B. C., Jackson A. L., Ward E. J., Parnell A. C., Phillips D. L., Semmens B. X. (2018). Analyzing Mixing Systems Using a New Generation of Bayesian Tracer Mixing Models. Peer J. 6, e5096. doi: 10.7717/peerj.5096
Stock B. C., Semmens B. X. (2016). Unifying Error Structures in Commonly Used Biotracer Mixing Models. Ecology 97, 2562–2569. doi: 10.1002/ecy.1517
Stock B. C., Semmens B. X. (2018). MixSIAR GUI User Manual V3.1. (San Diego, California, USA: University of California San Diego).
Stoecker D. K., Hansen P. J., Caron D. A., Mitra A. (2017). Mixotrophy in the Marine Plankton. Annu. Rev. Mar. Sci. 9, 311–335. doi: 10.1146/annurev-marine-010816-060617
Stoecker D. K., Lavrentyev P. J. (2018). Mixotrophic Plankton in the Polar Seas: A Pan-Arctic Review. Front. Mar. Sci. 5, 292. doi: 10.3389/fmars.2018.00292
St. Pierre K. A., Hunt B. P. V., Giesbrecht I., Tank S. E., Lertzman K. P., Del Bel Belluz J., et al. (2022). Particulate Organic Matter Composition for Freshwater and Marine Stations From 2015 Through 2018 on the Central Coast (British Columbia, Canada: Hakai Institute). doi: 10.21966/hpqq-0k76
St. Pierre K. A., Hunt B. P. V., Tank S. E., Giesbrecht I., Korver M. C., Floyd W. C., et al. (2021). Rain-Fed Streams Dilute Inorganic Nutrients But Subsidise Organic-Matter-Associated Nutrients in Coastal Waters of the Northeast Pacific Ocean. Biogeosciences 18, 3029–3052. doi: 10.5194/bg-18-3029-2021
St. Pierre K. A., Oliver A. A., Tank S. E., Hunt B. P. V., Giesbrecht I., Kellogg C. T. E., et al. (2020). Terrestrial Exports of Dissolved and Particulate Organic Carbon Affect Nearshore Ecosystems of the Pacific Coastal Temperate Rainforest. Limnol. Oceanogr. 65, 2657–2675. doi: 10.1002/lno.11538
Talmy D., Martiny A. C., Hill C., Hickman A. E., Follows M. J. (2016). Microzooplankton Regulation of Surface Ocean POC:PON Ratios. Global Bigeochem. Cycles 30, 311–332. doi: 10.1002/2015GB005273
Thresher R. E., Nichols P. D., Gunn J. S., Bruce B. D., Furlani D. M. (1992). Seagrass Detritus as the Basis of a Coastal Planktonic Food Chain. Limnol. Oceanogr. 37, 1754–1758. doi: 10.4319/lo.1992.37.8.1754
Traving S. J., Kellogg C. T. E., Ross T., Mclaughlin R., Kieft B., Ho G. Y., et al. (2021). Prokaryotic Responses to a Warm Temperature Anomaly in Northeast Subarctic Pacific Waters. Commun. Biol. 4, 1217. doi: 10.1038/s42003-021-02731-9
Vargas C. A., Martinez R. A., San Martin V., Aguayo M., Silva N., Torres R. (2011). Allochthonous Subsidies of Organic Matter Across a Lake–River–Fjord Landscape in the Chilean Patagonia: Implications for Marine Zooplankton in Inner Fjord Areas. Cont. Shelf Res. 31, 187–201. doi: 10.1016/j.csr.2010.06.016
Walsh E. M., Ingalls A. E., Keil R. G. (2008). Sources and Transport of Terrestrial Organic Matter in Vancouver Island Fjords and the Vancouver-Washington Margin: A Multiproxy Approach Using δ13Corg, Lignin Phenols, and the Ether Lipid BIT Index. Limnol. Oceanogr. 53, 1054–1063. doi: 10.4319/lo.2008.53.3.1054
Wang T., Hamann A., Spittlehouse D., Carroll C. (2016). Locally Downscaled and Spatially Customizable Climate Data for Historical and Future Periods for North America. PloS One 11, e0156720. doi: 10.1371/journal.pone.0156720
Ward N. D., Bianchi T. S., Medeiros P. M., Seidel M., Richey J. E., Keil R. G., et al. (2017). Where Carbon Goes When Water Flows: Carbon Cycling Across the Aquatic Continuum. Front. Mar. Sci. 4. doi: 10.3389/fmars.2017.00007
Ward N. D., Megonigal J. P., Bond-Lamberty B., Bailey V. L., Butman D., Canuel E. A., et al. (2020). Representing the Function and Sensitivity of Coastal Interfaces in Earth System Models. Nat. Commun. 11, 2458. doi: 10.1038/s41467-020-16236-2
Wetz M. S., Hales B., Chase Z., Wheeler P. A., Whitney M. M. (2006). Riverine Input of Macronutrients, Iron, and Organic Matter to the Coastal Ocean Off Oregon, U.S.A., During the Winter. Limnol. Oceanogr. 51, 2221–2231. doi: 10.4319/lo.2006.51.5.2221
Wetz J. J., Hill J., Corwith H., Wheeler P. A. (2012). Nutrient and Extracted Chlorophyll Data From the GLOBEC Long-Term Observation Program 1997-2004. (Corvallis, Oregon, USA: Oregon State University).
Wikner J., Andersson A. (2012). Increased Freshwater Discharge Shifts the Trophic Balance in the Coastal Zone of the Northern Baltic Sea. Global Change Biol. 18, 2509–2519. doi: 10.1111/j.1365-2486.2012.02718.x
Keywords: organic matter, coastal, connectivity, land-to-ocean continuum, carbon, nitrogen
Citation: St. Pierre KA, Hunt BPV, Giesbrecht IJW, Tank SE, Lertzman KP, Del Bel Belluz J, Hessing-Lewis ML, Olson A and Froese T (2022) Seasonally and Spatially Variable Organic Matter Contributions From Watershed, Marine Macrophyte, and Pelagic Sources to the Northeast Pacific Coastal Ocean Margin. Front. Mar. Sci. 9:863209. doi: 10.3389/fmars.2022.863209
Received: 26 January 2022; Accepted: 31 May 2022;
Published: 06 July 2022.
Edited by:
Andrew King, Norwegian Institute for Water Research (NIVA), NorwayReviewed by:
Nicolas Savoye, Universitéde Bordeaux, FranceRoman P. De Jesus, Fullerton College, United States
Copyright © 2022 St. Pierre, Hunt, Giesbrecht, Tank, Lertzman, Del Bel Belluz, Hessing-Lewis, Olson and Froese. This is an open-access article distributed under the terms of the Creative Commons Attribution License (CC BY). The use, distribution or reproduction in other forums is permitted, provided the original author(s) and the copyright owner(s) are credited and that the original publication in this journal is cited, in accordance with accepted academic practice. No use, distribution or reproduction is permitted which does not comply with these terms.
*Correspondence: Kyra A. St. Pierre, ay5zdHBpZXJyZUBvY2VhbnMudWJjLmNh