 Robert H. Weisberg
 Yonggang Liu
- College of Marine Science, University of South Florida, St. Petersburg, FL, United States
We review the evolution of knowledge on the forcing of the west Florida continental shelf by a combination of local winds and deep-ocean influences, and we provide application examples regarding the relationships between the shelf responses to these forcing functions and certain ecological phenomena, including blooms of the harmful alga, Karenia brevis, recruitment of gag juveniles and how Deepwater Horizon hydrocarbons may have affected west Florida reef fish and the shoreline. Our approach employs a coordinated set of observations and numerical circulation model simulations, wherein the observations, by providing reasonable veracity checks on the model simulations, allow for further dynamical analyses that would otherwise be unavailable from the observations alone. For the case of local forcing only, we provide two dynamically consistent definitions of the inner-shelf and outer-shelf regions, and for the case of deep-ocean forcing, we show how the west Florida shelf geometry (with regard to certain geophysical fluid dynamics principles) can result in the entire shelf region being impacted by the Gulf of Mexico Loop Current. Thus, we help to explain why the west Florida shelf experiences large inter-annual variations in shelf ecology, providing impetus for further interdisciplinary study.
1 Introduction
Generally considered as oligotrophic (e.g., Steidinger, 1975; Heil et al., 2001; Vargo et al., 2008; Dixon et al., 2014; O’Neil and Heil, 2014), the west Florida continental shelf (WFS) supports abundant fisheries and, on an inter-annual basis, may experience copious blooms of the toxic dinoflagellate, Karenia brevis. This dichotomy begs the question: How can an oligotrophic shelf have such a vibrant and varied ecosystem? The physics of the WFS circulation provides an answer.
Continental shelves, the regions between the shelf break and the shoreline, come in varying widths. Within this geometrical spectrum, the WFS (Figure 1) is relatively broad and gently sloping. Bounded in the south by the Florida Keys and in the northwest by the Florida Panhandle, and with the shelf break coinciding approximately with the 75 m isobath offshore from Tampa Bay, decreasing to about the 60 m isobath offshore from the Florida Big Bend, the width of the WFS varies from about 120 km offshore from Tampa Bay to about 180 km offshore from either the Florida Big Bend or the Charlotte Harbor estuary coasts. It then narrows in the Florida Panhandle, where the shelf break is at about the 40 m isobath at the DeSoto Canyon head. These dimensions, relative to the horizontal length scales over which new nutrients of either land or deep-ocean origins may extend, determine (under general conditions) the portions of the shelf that may be either deplete or replete with nutrients; hence oligotrophic, or not.
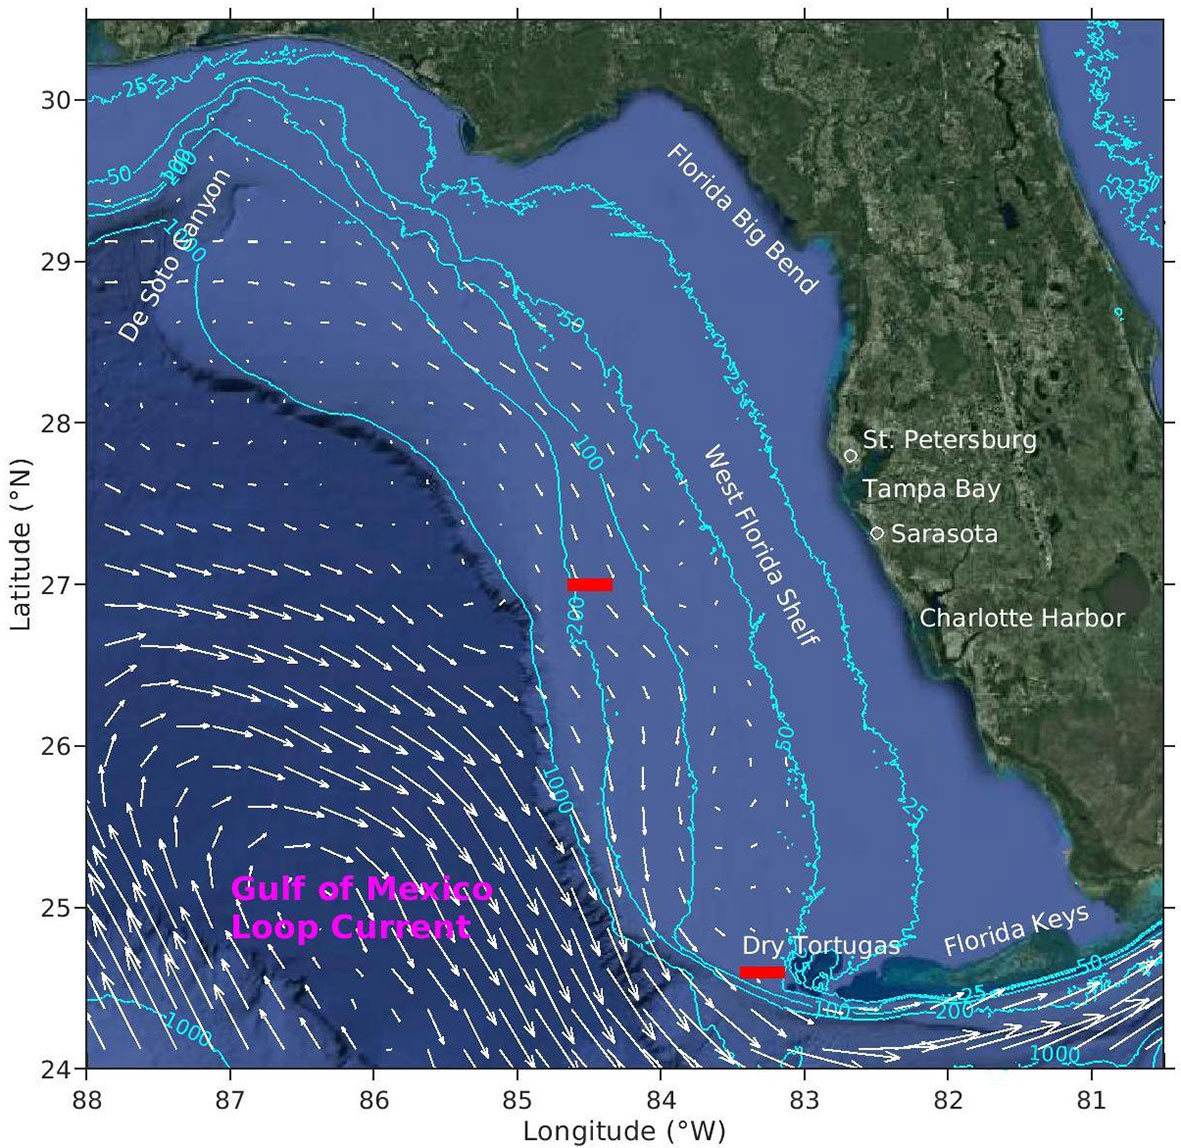
Figure 1 The geometry of the WFS and the various locations referred to in the text. The red lines are of length equivalent to 30 km, the estimated WFS baroclinic, Rossby radius of deformation. Superimposed are surface geostrophic velocity vectors indicating the long-term mean position of the Gulf of Mexico Loop Current (adapted from Liu et al., 2016b).
Separate horizontal length scales apply at the shelf break and the nearshore. At the shelf break, where the frictional boundary layers comprise only a small portion of the water column, the flow dynamics are largely geostrophic, rendering the appropriate horizontal length scale to be the baroclinic Rossby radius of deformation, or the scale over which the pressure gradient and Coriolis forces balance under stratified conditions. WFS observations show this to be about 30 km (He and Weisberg, 2003). The shallower nearshore, where friction is a dominant contributor, is more complex. There the salinity field is of use. Both estuarine and land-drainage inputs of fresh water result in lower nearshore salinity, rendering the salinity gradient region an indicator of how far offshore land-derived nutrients may extend. WFS observations and model simulations suggest some 10-20 km under general conditions (e.g., Figure 2).
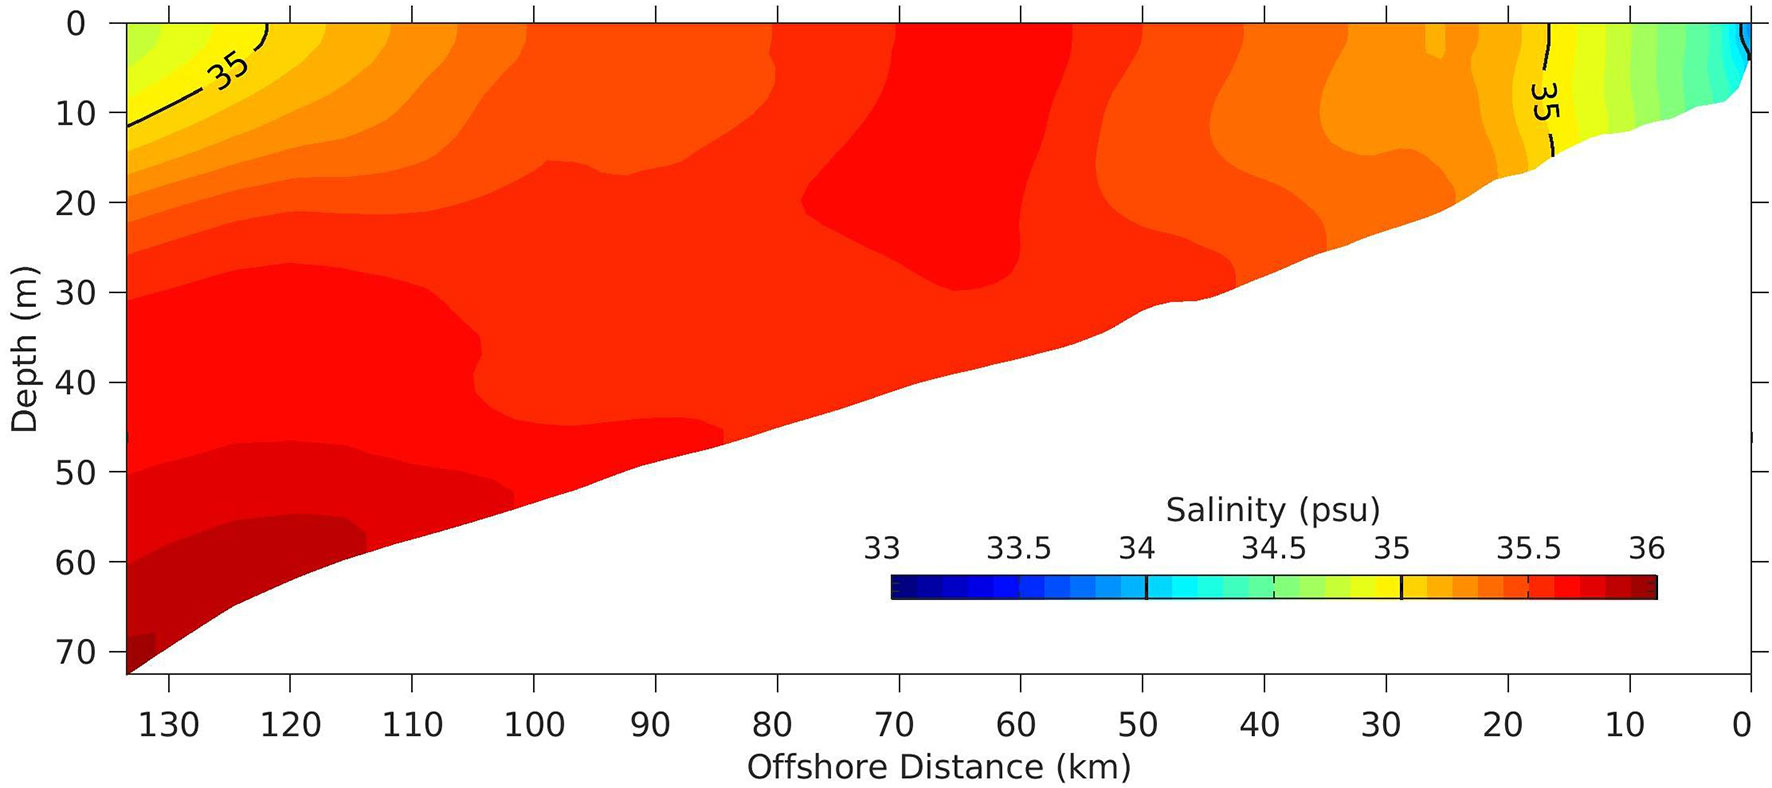
Figure 2 A typical summer season salinity section sampled offshore from Sarasota, FL., as simulated using the West Florida Coastal Ocean Model (WFCOM).
Thus, if deep-ocean and land-drainage influences extend only 30 km and 10-20 km, respectively, then, with a width of between 120-180 km, there is a large, middle portion of the WFS that should (under general conditions) be deplete of nutrients. Three exceptions are noted. The first is along the Florida Panhandle coast, where the shelf, being only about 30 km wide at the Desoto Canyon head, may have its nutrients replenished regularly by adjacent, deeper ocean waters. The second is that under prolonged westerly wind and/or deep-ocean forcing conditions, Mississippi River water, with relatively high nutrient loads, may be advected to the WFS. Dowgiallo (1994) and Ortner et al. (1995) discuss one such event, Gilbes et al. (1996) shows how northern Florida rivers may add to this, He and Weisberg (2002) shows how the baroclinic structure during the spring transition may facilitate southward advection (as found by Gilbes et al., 1996), and Weisberg et al. (2005) provides three different scenarios by which river waters may transit south, one of which is described by both Morey et al. (2003) and Toner et al. (2003). The third, and the most interesting exception, is that owing to the partial closure of the WFS in the south by the Florida Keys, it is possible for the Gulf of Mexico Loop Current, if it contacts the west Florida escarpment near the Dry Tortugas, to set the entire WFS in motion (Hetland et al., 1999). When this occurs, and if it lasts long enough, then WFS waters may be replenished by deeper ocean waters with elevated inorganic nutrient concentrations that are upwelled and transported landward within the bottom Ekman layer. Such occurrence was observed in 1998 and described, along with the associated ecological impacts, by the companion papers of Weisberg and He (2003) and Walsh et al. (2003). This third exception, along with the shelf width, are what makes the WFS such an interesting region to study and what also accounts for the large inter-annual variations in circulation, water properties and ecological responses.
The remainder of the paper is organized as follows. Section 2 provides background information on both local and deep-ocean forcing for the WFS, including the origins and pathways for the new, deeper ocean fluid by which WFS water properties may be renewed through Loop Current-induced upwelling. Section 3 discusses applications to K. brevis harmful algae blooms (HABs), fisheries recruitment and harmful substance tracking. Concluding remarks follow in section 4.
2 Background
In keeping with the theme of how the circulation may affect water properties and thence ecology, the fundamental dynamical question is how fluid may transit either way between the shelf break and the nearshore. Given the water column thickness that changes monotonically (by virtue of a nearly linearly sloping bottom) between these two shelf termini, background discussions begin with the concepts of mass and angular momentum conservation.
From a mass conservation perspective, it is difficult to move fluid from deeper to shallower water depths, for to do so requires the dislocation of water within a proportionately larger nearshore area to accommodate the volume of fluid coming from greater offshore depth. Conversely, to move fluid from shallower to deeper water, the area would have to shrink proportionately. How to accommodate such areal extent changes defies any simple physical conceptualization. Owing to the Earth’s rotation, the changes in relative vorticity (fluid particle angular momentum) are even more difficult to accommodate. Taken together, these two conservation principles, which embody the conservation of potential vorticity, constrain the fluid to flow along lines of constant topography (isobaths). Crossing isobaths requires that these joint mass and angular momentum constraints be broken, either by friction or by the generation of energetic eddy-like motions. A more complete, deductive discussion of these constraints on the local wind, buoyancy and deep-ocean forcing effects for continental shelves may be found in Brink (1998a); Hill (1998), and Brink (1998b), respectively.
Whether moving fluid from deeper to shallower water, or conversely, frictional boundary layers are of primary importance. Ekman (1905) provides the basis for such understanding. A spatially uniform wind stress acting upon the sea surface will set the surface water in motion, and through friction, these surface waters will drive subsurface waters with speed decreasing with depth. The resulting vertical shear will tend to tilt the fluid’s planetary vorticity vector, inducing relative vorticity, unless countered at the same rate by a frictional torque. To do this requires a vertical shear in the direction orthogonal to the wind stress, with this vertical shear also decreasing with depth. As a result, the wind-inducted velocity vector, while decreasing in magnitude, must also rotate to the right (in the northern hemisphere) with depth, the end result being the Ekman spiral that extends over a vertical length scale known as the Ekman depth. The Ekman depth is necessarily of relatively small length scale because the frictional dissipation must be large to avoid inducing too much relative vorticity. Thus, for deep regions that are unbounded by land, a uniform wind stress can only impact the near surface, and, when vertically integrated, causes a net water transport to the right of the wind stress (in the northern hemisphere) within this thin, surface (Ekman) layer. WFS observations and model simulations show the Ekman depth to be only a few to about 10-20 m (e.g., Weisberg et al., 2001). As the water depth decreases toward land and approaches the Ekman depth, the stress of the moving fluid against the bottom modifies the flow, causing a more downwind-directed transport. The coastline further modifies this by allowing water to be set up or down by the Ekman transport divergence, supporting an across-shelf pressure gradient force and an associated geostrophic current that combines with the direct wind-driven current. The geostrophic current, by rubbing against the bottom, results in a bottom Ekman layer with a net transport driven to the left of the geostrophic current because of the pressure gradient. This process of a wind-driven surface flow, causing a geostrophic flow, leading a bottom Ekman layer flow is referred to the Ekman-geostrophic coastal ocean spin-up process (spin-up deriving from the Earth’s rotation), and it occurs over a pendulum day, roughly a calendar day for the WFS. The geostrophic portion is along-isobath, whereas the surface and bottom Ekman layer portions have across-isobath directed components. Once established, the surface and bottom Ekman layers are what facilitate the across-shelf transport of fluid and the material properties (nutrients, phytoplankton, fish larvae, etc.) that are contained therein.
It should be noted that these concepts, rooted in Ekman (1905), are based on the parameterization of complex turbulent processes by a constant eddy coefficient. In reality, turbulence-induced friction is generally flow dependent. This, plus the stabilizing effects of stratification, may alter the evolution of the Ekman layers from the structure as originally presented. Lentz (1995) explored the effects of varying the vertical distribution of the eddy coefficient on the shelf response using a two-dimensional, constant density model. The along-shelf component was found to be insensitive relative to the across-shelf component, and it was the divergence of the across-shelf component that determined the extent of the inner shelf. Weisberg et al. (2000) provided a case study demonstrating the Ekman-geostrophic spin-up process for the WFS. Observed, in response to the sudden onset of upwelling favorable winds, was how the near surface velocity vector initially turned to the right of the wind stress before rotating to become more along-isobath as the geostrophic interior flow set in, and thence how the flow closer to the bottom turned toward the left as bottom friction induced a bottom Ekman layer response. This entire evolution, as observed over the full water column with a moored, Acoustic Doppler Current Profiler (ADCP), occurred over the course of a pendulum day.
2.1 Local Forcing
The WFS is forced regularly by synoptic scale weather systems, particularly in winter months. These generally entail southerly winds in advance of frontal passage, followed by northerly winds in the wake of frontal passage. Pioneering observations on WFS responses to such synoptic scale systems are given by Niiler (1976); Marmorino (1982; 1983) Mitchum and Sturges (1982); Cragg et al. (1983), and Weatherly and Thistle (1997), and pioneering numerical model simulations are given by Hsueh et al. (1982); Marmorino (1982), and Cooper (1987). As anticipated from the associated Ekman-geostrophic spin up discussion, these studies either observed or simulated coastal sea levels tending to rise as the front approaches and fall after the front passes. The observations also showed the Ekman and geostrophic velocity tendencies, but with limited temporal and spatial coverage. Further details had to await the advent of ADCPs for fuller water column sampling and increased computational resources for more realistic model domains and higher spatial resolutions.
Another insightful line of inquiry entailed a time-dependent analytical approach. Gill and Schumann (1974) developed a formalism for projecting wind forcing onto a set of continental shelf wave modes and integrating these in time and space to estimate the continental shelf response. Applications of such forced wave technique to the WFS for cases of idealized wind forcing, including the effects of friction on the wave modes, are given by Clarke and Van Gorder (1986) and Lopez and Clarke (1989), using the coastal boundary condition derived by Mitchum and Clarke (1986a). Mitchum and Clarke (1986b) then demonstrated the utility of this approach in accounting for both the coastal sea level variations associated with frontal passage and for estimating the vertically averaged along-shelf currents calculated geostrophically from the model pressure gradient field. A limitation, however, is that the analytical model effectively eliminates most of the inner-shelf by virtue of its coastal boundary condition being applied seaward of the region of overlapping surface and bottom Ekman layers (Mitchum and Clarke, 1986a) taken to be at about the 25 m isobath. Moreover, by only considering the vertically-averaged along-shelf geostrophic current between the 25m isobath and the shelf break, across-shelf exchanges are not included, nor is the response to major storm events such as hurricanes. Overcoming these limitations requires more complete, numerical circulation models.
In two related papers, Li and Weisberg (1999a; 1999b) applied the Princeton Ocean Model (POM) of Blumberg and Mellor (1987) with constant density, forced from rest by spatially uniform winds, to study the kinematics and dynamics, respectively, of the WFS responses to either upwelling or downwelling favorable winds. By applying a primitive equation model with realistic coastline and bathymetry, plus a flow dependent turbulence closure sub-model (Mellor and Yamada, 1982), the structure of the WFS responses to idealized wind stress and its spin-up was diagnosed, free from other simplifying assumptions.
Two different upwelling and downwelling cases were explored, the upwelling ones being for along-shelf winds (from the north-northwest) and offshore winds (from the east-northeast), and the downwelling ones being for along-shelf winds (from the south-southeast) and onshore winds (from the west-southwest). Under constant density, the along-shelf wind cases showed similar, but opposite responses for upwelling and downwelling. Spin-up occurred over a pendulum day, as expected, with sea levels set up or down by Ekman layer divergences, and an inner-shelf region was clearly definable from the momentum balance equations. As an example, Figure 3 shows the terms in the vertically integrated along-shelf and across-shelf momentum equations sampled after the model simulation approached steady state for an across-shelf section offshore from Sarasota, FL (Figure 1). The across-shelf balance at quasi-steady state is quite simple, i.e., it is geostrophic, with the vertically integrated pressure gradient and Coriolis forces very nearly in balance. The change in sign at the outer edge of the inner-shelf is due to the complete closure (in the model) by the Florida Keys in the south and thus a reversal of flow. The organization of the inner-shelf is evidenced further by the along-shelf momentum balance terms. Seaward of approximately the 50 m isobath is a near balance between the wind stress and the vertically integrated Coriolis term, i.e., an Ekman balance, free from bottom effects. Landward from about the 50 m isobath is a gradual decrease in the vertically integrated Coriolis force, accompanied by a compensating increase in the bottom stress. The smaller increase in the pressure gradient term reflects the fact that the coastline is not straight; the isobaths do converge and diverge, as would be the case for any realistic continental shelf. The inner-shelf is therefore the transition zone in which bottom stress reduces from being a major to a minor contributor to the momentum balance when transiting away from the shoreline. Whether or not the surface and bottom Ekman layers overlap within this transition zone is not a major factor; instead, it is their interaction through divergence that determines the inner-shelf (as will be seen in the stratified case).
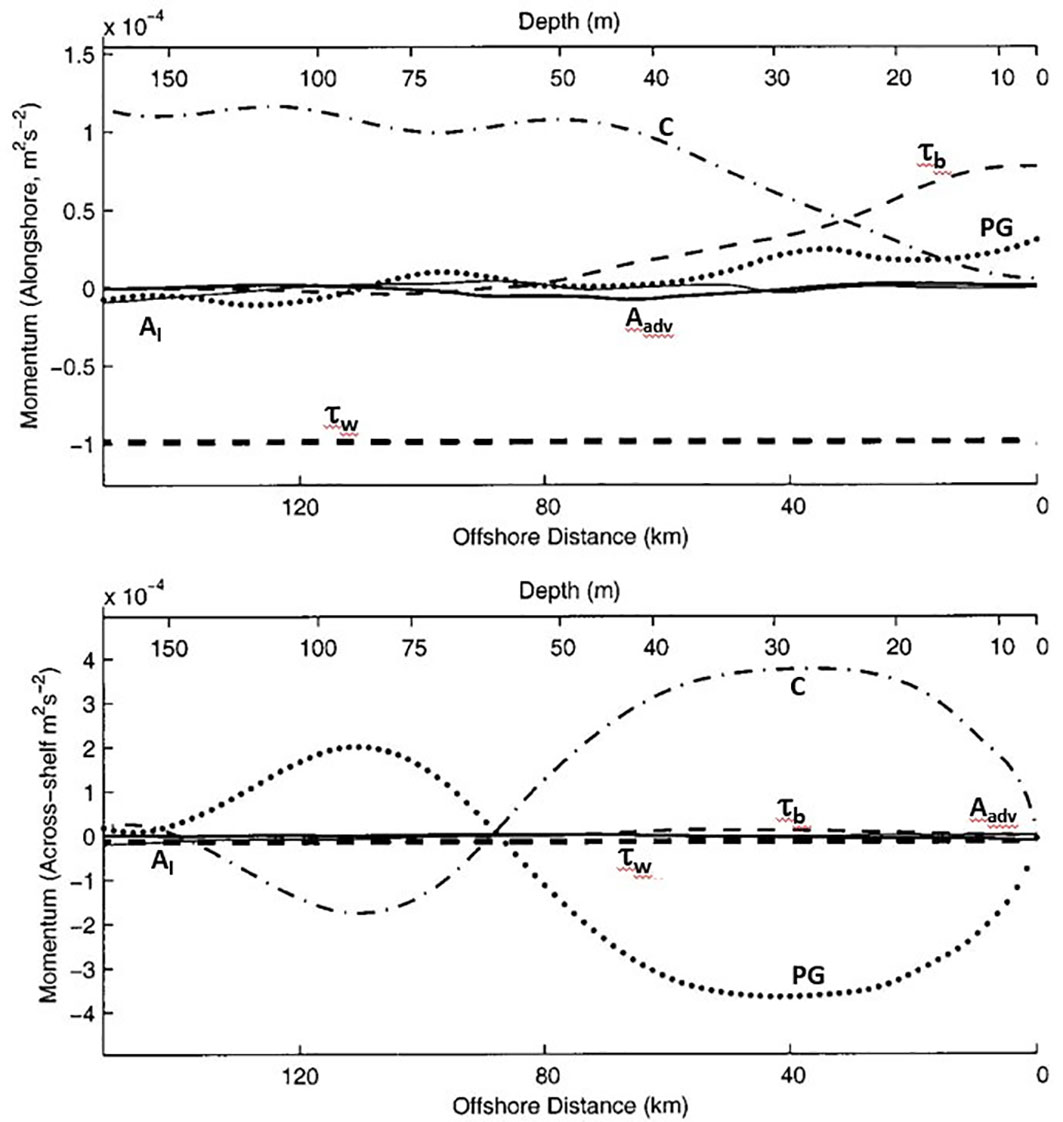
Figure 3 Terms in the vertically integrated momentum balance at quasi-steady state for an initial value problem in which the WFS is forced from rest by an upwelling favorable wind stress in an application of the Princeton Ocean Model (from Li and Weisberg, 1999b). The top panel is for the along-shelf direction and the bottom panel is for the across-shelf direction. The dotted line is the pressure gradient term (PG), the dot-dashed line is the Coriolis term (C), the plain-dashed line is the bottom stress (τb), and the bold-dashed line is the surface stress (τw). The bold-solid and the plain solid lines are the advective (Aadv) and local (Al) acceleration terms, respectively.
The onshore or offshore wind cases are also illuminating. Given realistic bottom bathymetry, onshore or offshore winds generate a nearshore pressure gradient force necessary to balance the wind stress in shallow water because the flow is directed downwind there, versus orthogonal to the wind farther offshore (as originally shown by Ekman, 1905); hence, coastal sea level is set up or down. This Li and Weisberg (1999a); Li and Weisberg (1999b) finding for the WFS was followed by subsequent studies such as Tilburg (2003) who performed a series of two-dimensional model simulations showing that across-shelf winds can result in across-shelf velocities in the upper few meters of the water column that are similar in magnitude to those induced by the along-shelf winds, Liu and Weisberg (2005a) who diagnosed in-situ observations to assess the role of across-shelf winds in the inner-shelf momentum balance and Fewings et al. (2008) who further considered the effects of waves to demonstrate an asymmetry in the inner-shelf responses to across-shelf wind forcing.
Stratification provides further nuance. Using the same model configuration [as in (Li and Weisberg 1999a; Li and Weisberg 1999b)], but with realistic stratification and time dependent wind forcing, Weisberg et al. (2001) provided detailed comparisons between observed and modeled sea level and velocity, along with dynamical analyses, for the month of April 1998. The sea level comparisons were at St. Petersburg, FL, and velocity comparisons were at the 20 m and 50 m isobaths offshore from Sarasota, FL. The velocity components were sampled across the entire water column at 1 m intervals using moored ADCPs. A twin experiment performed with constant density enabled comparisons between simulations with and without stratification. April 1998 experienced a succession of three upwelling and downwelling favorable wind events, and the simulation with stratification agreed reasonably well with the sea level and velocity observations. Simulated sea level tracked nearly identically with observations for the stratified experiment and deviated somewhat for the constant density experiment. The velocity observations, when compared with the simulations, exhibited larger disparities between the stratified and constant density cases. Therefore, the inclusion of stratification was found to be quite important.
With stratification, both the observations and the model simulations showed reversals of the across-shelf and the along-shelf velocity components at the 20 m isobath with each reversal in wind forcing. For upwelling favorable winds, the observed near-bottom flows were directed onshore while the observed near-surface flows were directed offshore, and conversely for downwelling favorable winds. Interestingly, whereas the wind magnitudes were similar for these wind reversals, the observed upwelling responses were disproportionately larger and extended farther offshore than the observed downwelling responses. These observed asymmetric behaviors were also found in the simulations with stratification, but not in the constant density simulations. Thus, stratification caused an asymmetry in the upwelling/downwelling responses.
Explanations may be provided using either force or vorticity balance arguments. From a force balance perspective, the sea level response to downwelling favorable winds results in an offshore-directed pressure gradient force that drives an offshore-directed flow in the bottom Ekman layer. Isopycnals bending into the bottom result in an opposing buoyancy force. In contrast, the sea level response to upwelling favorable winds results in an onshore-directed pressure gradient force that drives an onshore-directed flow in the bottom Ekman layer. However, and opposite to the downwelling case, isopycnals bending into the bottom (across the bottom Ekman layer, as occurs by turbulence mixing and a zero normal heat flux constraint at the sediment/water interface) provide a buoyancy force that adds constructively to the surface slope induced pressure gradient force, thereby enhancing the upslope flow. The result is that the across-shelf flows within the bottom Ekman layer for upwelling winds are enhanced over that for downwelling winds. Simulation examples of the isopycnal slopes and their effect on the force balances are provided in Weisberg et al. (2001).
An equally compelling argument follows from the streamwise (along-shelf) component of vorticity equation (derived by cross differentiating and combining the across-shelf and the vertical momentum equations):
where the three terms on the left hand side of equation (1) are the tilting of planetary vorticity filaments by the vertical shear of the along-shelf jet, the buoyancy torque by the sloping isopycnals and the dissipation of relative vorticity by the vertical shear of the across-shelf flow, and the terms on the right hand side are the rate of change of relative vorticity, plus any residual (from horizontal friction or non-linearity). How these terms balance during peak downwelling and upwelling responses are illustrated in Figure 4. With isopycnals tending to slope into the bottom across the bottom Ekman layer for either upwelling (shown in Figures 5, 10) or downwelling, we see that the associated buoyancy torque adds constructively in this layer with the planetary vorticity vector tilting term for upwelling, whereas it adds destructively for downwelling (e.g., see Figure 4 along the sloping bottom between the surface and around 40m depth). Thus, the dissipation within the bottom Ekman layer must be larger under upwelling than under downwelling, which requires an expanded, more energetic bottom Ekman layer under upwelling than under downwelling (as evident by more closely packed isolines in Figure 4 under upwelling) and hence the observed and simulated asymmetries.
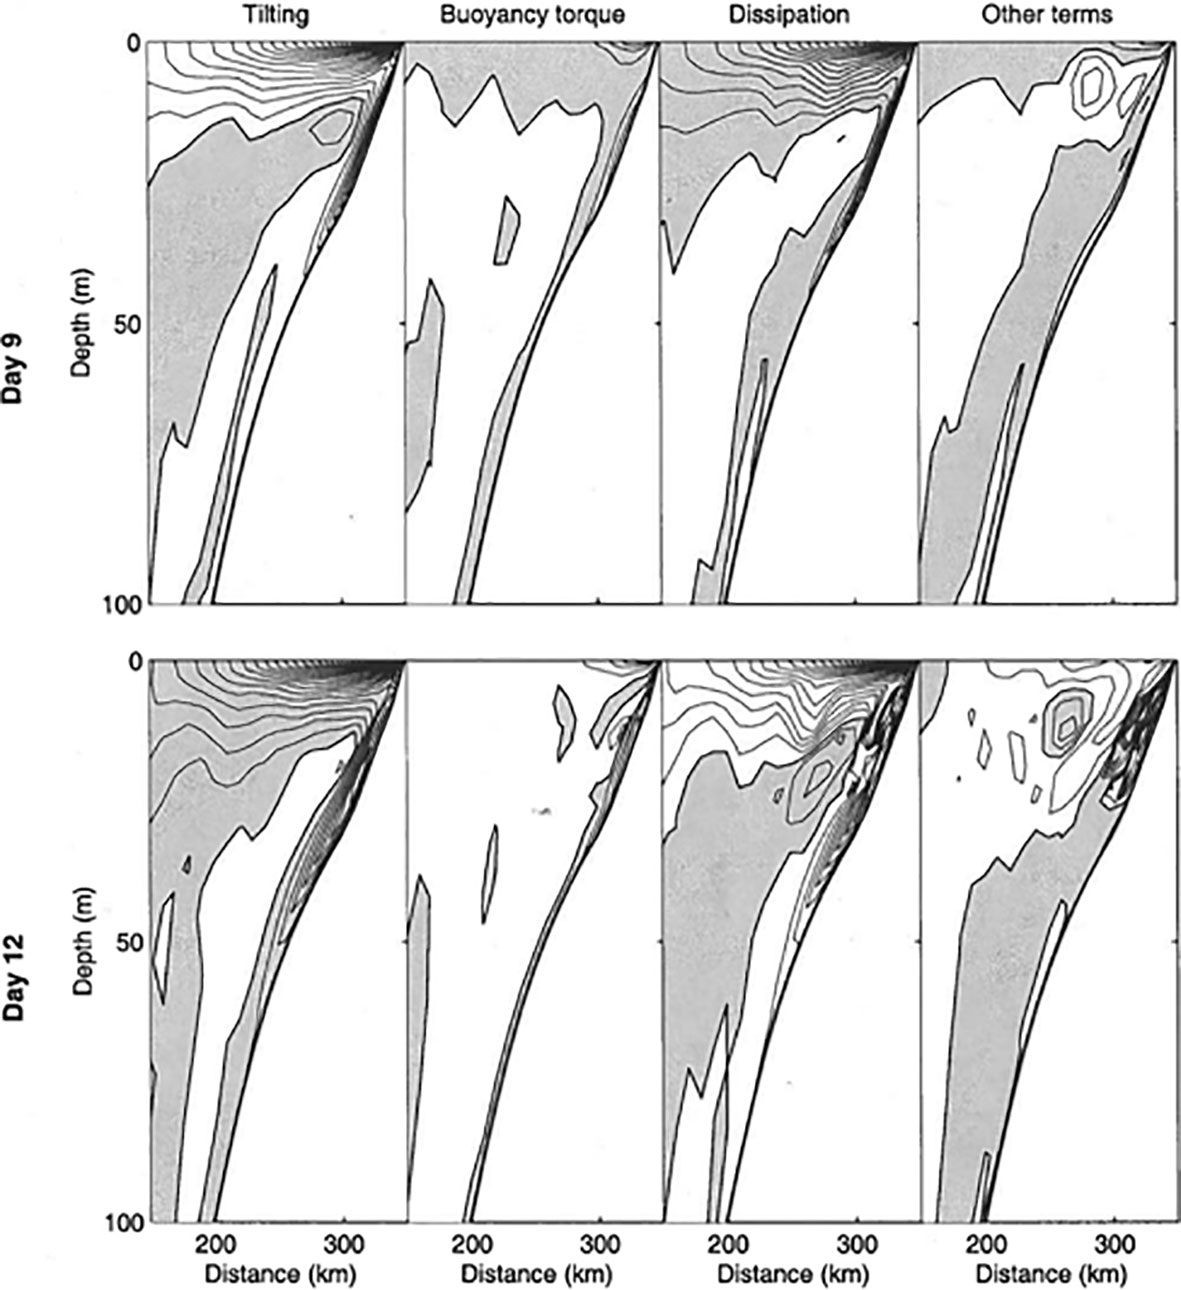
Figure 4 Streamwise vorticity equation terms as functions of depth and offshore distance sampled at times of peak downwelling (upper panels) and upwelling (lower panels) in response to variable wind stress forcing from a Princeton Ocean Model simulation with realistic geometry, stratification and wind forcing (from Weisberg et al., 2001). The contour interval is 10-7 s-2, clear regions are positive, shaded regions are negative, and the sloping bottom is the line that runs from the top right (the shoreline) to the bottom left of each panel. Note that the Tilting and Buoyancy torque terms have opposite sign for downwelling in the bottom Ekman layer, whereas they have the same sign for upwelling. Consequently, the bottom Ekman layer is thicker and more intensified (more contours) to provide more dissipation during upwelling than during downwelling.
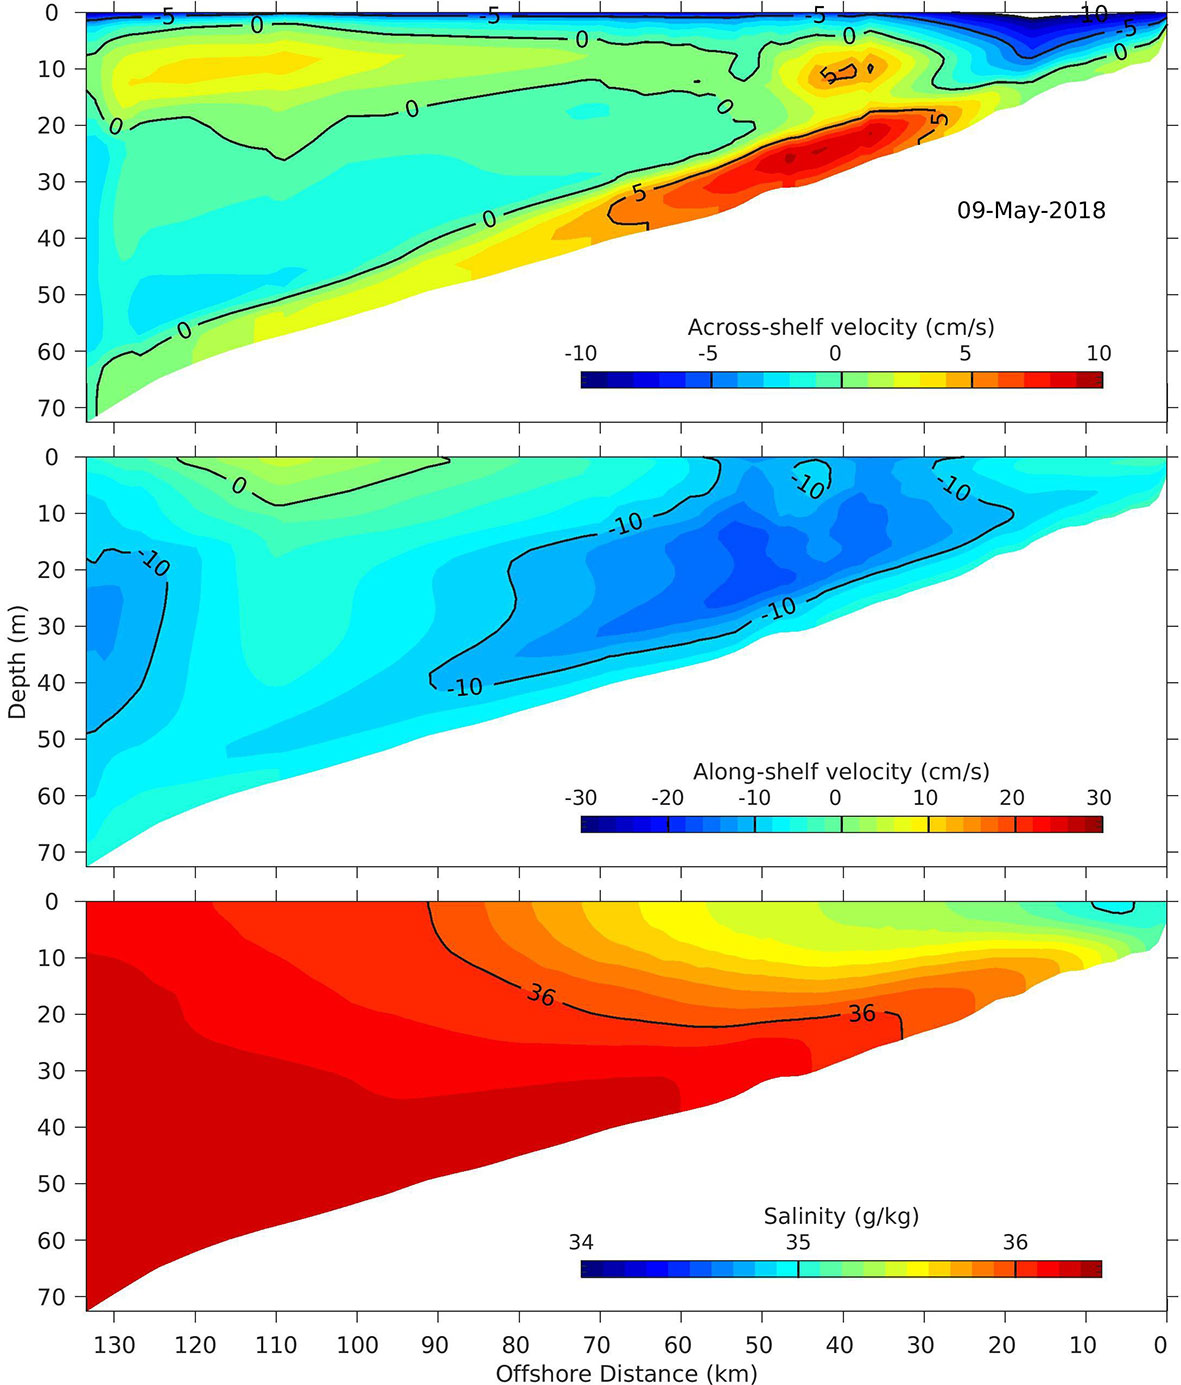
Figure 5 Across-shelf sections sampled offshore from Sarasota, FL on May 9, 2018 from a West Florida Coastal Ocean Model simulation. From top to bottom are the across-shelf component of velocity, the along-shelf component of velocity and salinity, with contour intervals and units provided by the color bars in each panel.
Interestingly, this finding in observations and supported through model simulations is opposite to the expectation from the Lentz and Trowbridge (1991) observations and Trowbridge and Lentz (1991) analyses, wherein it was argued that by moving denser fluid upslope during upwelling, a more stable bottom boundary layer would suppress, versus enhance the flow, and conversely. We note, however, that the motivating observations of Lentz and Trowbridge (1991) are from a different dynamical regime, i.e., from an outer-shelf (90 m water depth), versus an inner-shelf location. Thus, the Ekman-geostrophic spin up process, whereby the evolving surface slope plays an important role in the preceding discussion would not have applied there. So, both finding are sensible, but for different reasons.
This seeming discrepancy provides segue for providing two different dynamical, albeit similar, definitions of the inner-shelf. Recall the Mitchum and Clarke (1986a) and Lentz (1994) definition of the inner-shelf as the region of overlapping surface and bottom Ekman layers. For the WFS, Weisberg et al. (2000) and Weisberg et al. (2001) showed that the Ekman layers do not have to overlap; they merely have to interact (through divergence). It is the divergence that tilts the sea surface to drive the inner-shelf geostrophic flow that, in turn, activates the bottom Ekman layer, and under stratified conditions, the surface and bottom Ekman layers may be separated from one another. This finding is evident in several of the other detailed dynamical analyses provided in Weisberg et al. (2001). It also appears in more recent simulations using the West Florida Coastal Ocean Model (WFCOM) introduced by Zheng and Weisberg (2012). Shown in Figure 5 are across-shelf sections (sampled offshore from Sarasota, FL.) of the across-shelf component of velocity (top panel), the along-shelf component of velocity (middle panel) and salinity (bottom panel) for May, 9, 2018. Evident in the bottom panel is the upwelling of high salinity water with isolines bending into the bottom within the bottom Ekman layer. Evident in the top panel are an onshore flow within the bottom Ekman layer, an offshore flow within the surface Ekman layer and a general separation in-between. Evident in the middle panel is the (primarily geostrophic) inner-shelf jet centered in this case on about the 32 m isobath, all consistent with the prior discussions of Figures 3, 4. Thus, one definition of the inner-shelf is the region of interacting Ekman layers giving rise to a sea surface slope and an associated alongshore jet. With distinct surface and bottom Ekman layers separated by a largely geostrophic interior, instead of necessarily overlapping, these Ekman layers may interact through divergence (i.e., they may be connected via the vertical velocity component).
A second definition follows from the spatial distribution of terms comprising the vertically integrated vorticity balance. Using the formalism of Ezer and Mellor (1994), with non-linear and horizontal friction terms omitted, this balance may be expressed as:
where Mx and My are the volume transports per unit area in the along-shelf and across-shelf directions, β is the planetary vorticity gradient, Pb is the bottom pressure, H is the water depth and the τ’s are the component surface wind (0) and bottom (b) stresses. Equation 2 states that when vertically integrated, the local rate of change of relative vorticity, plus the advection of planetary vorticity, are balanced by the bottom pressure torque and the differences between the surface wind stress and the bottom stress torques. By calculating these terms throughout the model domain, Weisberg et al. (2001) showed that the inner-shelf is the region where bottom pressure torque (in essence, vortex stretching by across-isobath flow) is balanced primarily by bottom stress torque, whereas the outer-shelf is the region where bottom pressure torque is balanced primarily by the rate of change of relative vorticity. This latter definition also explains why the inner-shelf tends to have a relatively orderly response to wind forcing with a well-defined coastal jet, whereas the outer-shelf tends to be more chaotic and eddy-like. One reason why the WFS is such an interesting study region is that the shelf is wide enough to distinguish between these inner-shelf and outer-shelf regions.
Further descriptions on the WFS inner-shelf responses to wind forcing over a three-year duration from an array of moored ADCPs are provided by Liu and Weisberg (2005a); Liu and Weisberg (2005b). Using a Self-Organizing Map, an unsupervised learning, neural network analysis technique, Figure 6 (from Liu and Weisberg, 2005a) shows how the surface, mid-water column and near-bottom velocity vectors organized over the October 1998 to September 2001 duration when 11 moorings were simultaneously deployed across the inner-shelf. By low-pass filtering to remove tides and inertial oscillations, the primarily synoptic weather induced fluctuations show upwelling and downwelling responses, each with a systematic left hand turning of the velocity vectors from surface to bottom as the surface and bottom Ekman layers interact with each other and with the geostrophic interior flow. Also observed are the upwelling flow patterns being larger in magnitude than the downwelling ones (the aforementioned and explained asymmetry), and with the inner-shelf jet (particularly for upwelling) having largest speeds at about the 25m to 30m isobaths.
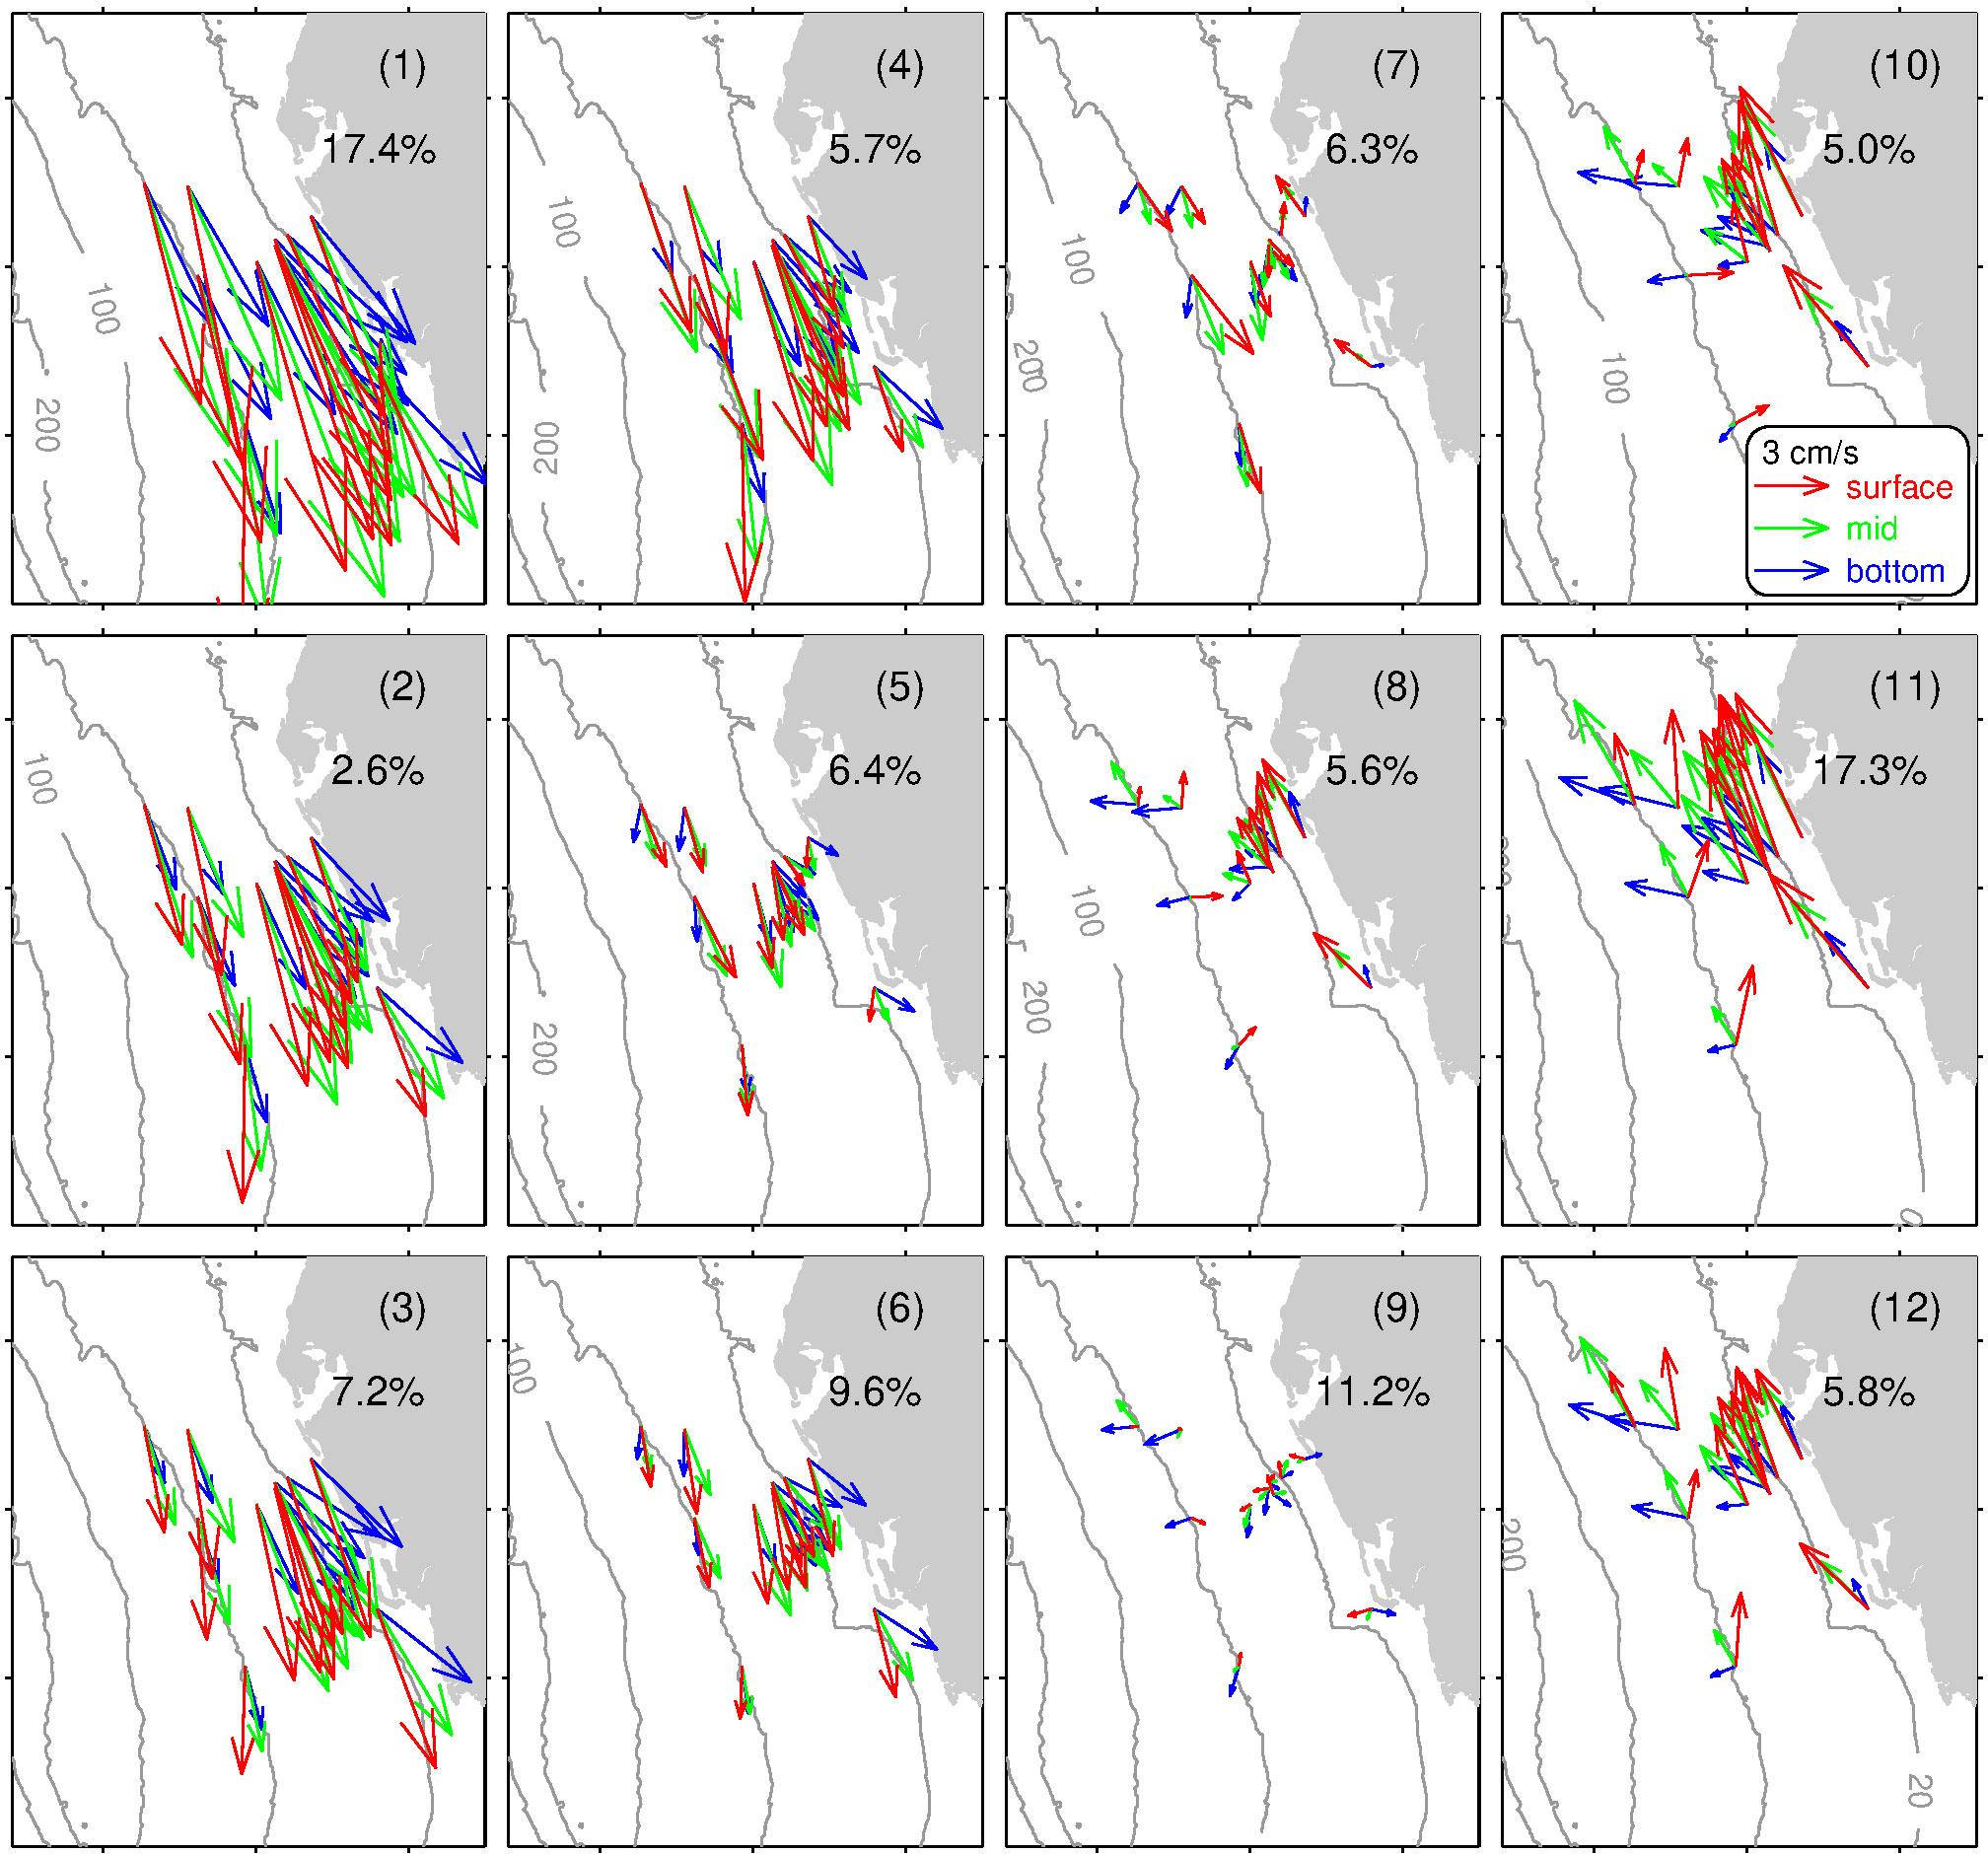
Figure 6 A 3x4 Self Organizing Map array of velocity vector patterns spanning the inner-shelf. The input data set consisted of approximately three years of hourly 2-day low pass filtered velocity vectors sampled from near-surface (red), mid-water column (green) and near-bottom (blue) depths observed by ADCPs on a total of 11 moorings (from Liu and Weisberg, 2005a). The percentages provided in each pattern represents the percent of occurrence for each pattern. Note the systematic turning of the velocity vectors from near-surface to near-bottom, the asymmetry between upwelling and downwelling patterns, and, with the inner three isobaths (gray line) being 20 m, 50 m and 100 m depths, the largest vectors being located between the 20 m to 50 m isobaths and within this range, a little farther offshore for upwelling than for downwelling.
Analyses regarding how coastal sea level variations may be related to the inner-shelf dynamics, plus contributions from farther offshore, using the same October 1998 to September 2001 data set as above, are provided by Liu and Weisberg (2007). One important finding is that to fully account for coastal sea level variations at synoptic weather scales, one needs to include both the inner-shelf barotropic and baroclinic current responses to along-shelf wind forcing as well as the frictional affects of the across-shelf winds because all of these may contribute similarly. Inner-shelf dynamics are also pertinent to both the long-term mean circulation and the seasonal variations found for the WFS (Weisberg et al., 2009b; Liu and Weisberg, 2012).
2.2 Deep-Ocean Forcing
The outer-shelf is forced primarily by the adjacent deeper ocean. Whether or not deep-ocean forcing along the shelf slope can project onto the shelf is governed in part by the process of geostrophic adjustment. The relevant parameter is the square of the ratio between the baroclinic Rossby radius of deformation evaluated at the shelf break and the shelf width. Studies by Janowitz and Pietrafesa (1980); Clarke and Brink (1985); Chapman and Brink (1987), and Kelly and Chapman (1988) address this topic. When this squared ratio (the Burger number) is small, the pressure gradient adjusts baroclinically in the vicinity of the shelf break such that flows imposed on the shelf tend to be weak and barotropic. Similarly, flows locally forced on the shelf tend not to penetrate onto the shelf slope. These studies conclude (for small Burger number) that deep-ocean forcing should be relatively ineffective at generating shelf currents and that shelf forcing should be similarly ineffective at generating deep-ocean currents. Barotropic tides at higher frequency provide an exception, as does deep-ocean forcing when the Burger number is large. The west coast of the United States provides an example of the latter situation, where large eddies generated by shelf slope currents may affect water properties over most of the continental shelf.
Despite the WFS generally having small Burger number, there are locations where deep-ocean forcing may be controlling of shelf water properties. This may occur over the Panhandle coast and similarly near the Dry Tortugas where the Burger number at either of these locations is of order one, owing to the shelf width being similar to the baroclinc Rossby radius of deformation (Figure 1). The Dry Tortugas takes on added importance because of the tendency for pressure perturbations to propagate along-isobath with shallow water to the right (in the northern hemisphere). Gill (1982) provides a geophysical fluid dynamical exposition, along with a lucid construct for why such topographic wave propagation is directionally-dependent. Thus, when the Gulf of Mexico Loop Current impacts the west Florida escarpment in the vicinity of the Dry Tortugas (the western-most islet of the Florida Keys chain), its pressure perturbation, by impacting all isobaths as shallow as 25 m, can establish a pressure gradient force that extends from the shelf break to the shoreline and that propagates northward over the entire WFS, even to the Florida Panhandle. Mitchum and Clarke (1986b) had this in mind when they added a sea level perturbation at Key West into their analytical model/data comparisons, Csanady (1978) provided the basis for how such perturbation could impact a shelf in the presence of frictional damping, and Hetland et al. (1999) expanded on these ideas for the WFS. Focusing on a jet formed along the edge of the WFS, these authors also demonstrated (via numerical model simulations) that if the Loop Current pressure perturbation contacted shallow isobaths near the Dry Tortugas, then the bulk of the shelf could be set in motion. Confirmation had to await new observations.
Here we provide two contrasting cases of deep-ocean forcing for the WFS, one for which the Loop Current did not result in a protracted state of upwelling, the other for which it did. The first case occurred in June 2000 when the Loop Current contacted the west Florida escarpment, but at a location to the north of the Dry Tortugas. As described by He and Weisberg (2003), shipboard hydrographic sections from June 6, 2000 and June 28, 2000, that extended across the WFS to the upper shelf slope, provided temperature and salinity data from which relative geostrophic velocity sections were computed. These, plus velocity data by moored ADCPs, provided a means by which barotropic and baroclinc components could be distinguished and also by which the flow field across the entire WFS could be described. These observations yielded a weak barotropic flow over the shelf and a stronger Loop Current related baroclinic flow limited to only a few tens of km landward from the shelf break, consistent with the aforementioned theory.
To demonstrate the near independence between the wind-driven, inner-shelf flows and the Loop Current-driven, outer-shelf flows, He and Weisberg (2003), using the POM, with an open boundary arcing from just west of the Mississippi River delta to the Florida Keys, imposed a sea level distribution along the open boundary to support a Loop Current inflow and outflow with a resulting contact at the west Florida escarpment, as observed. Results from constant density simulations with the Loop Current alone and with the Loop Current, together with either upwelling or downwelling favorable winds, are provided in Figure 7. These three cases showed the near independence between the shelf-wide responses to local wind and Loop Current forcing, and velocity vectors from nine moorings (with ADCPs) spanning the WFS further provided a general veracity check on the model simulation findings.
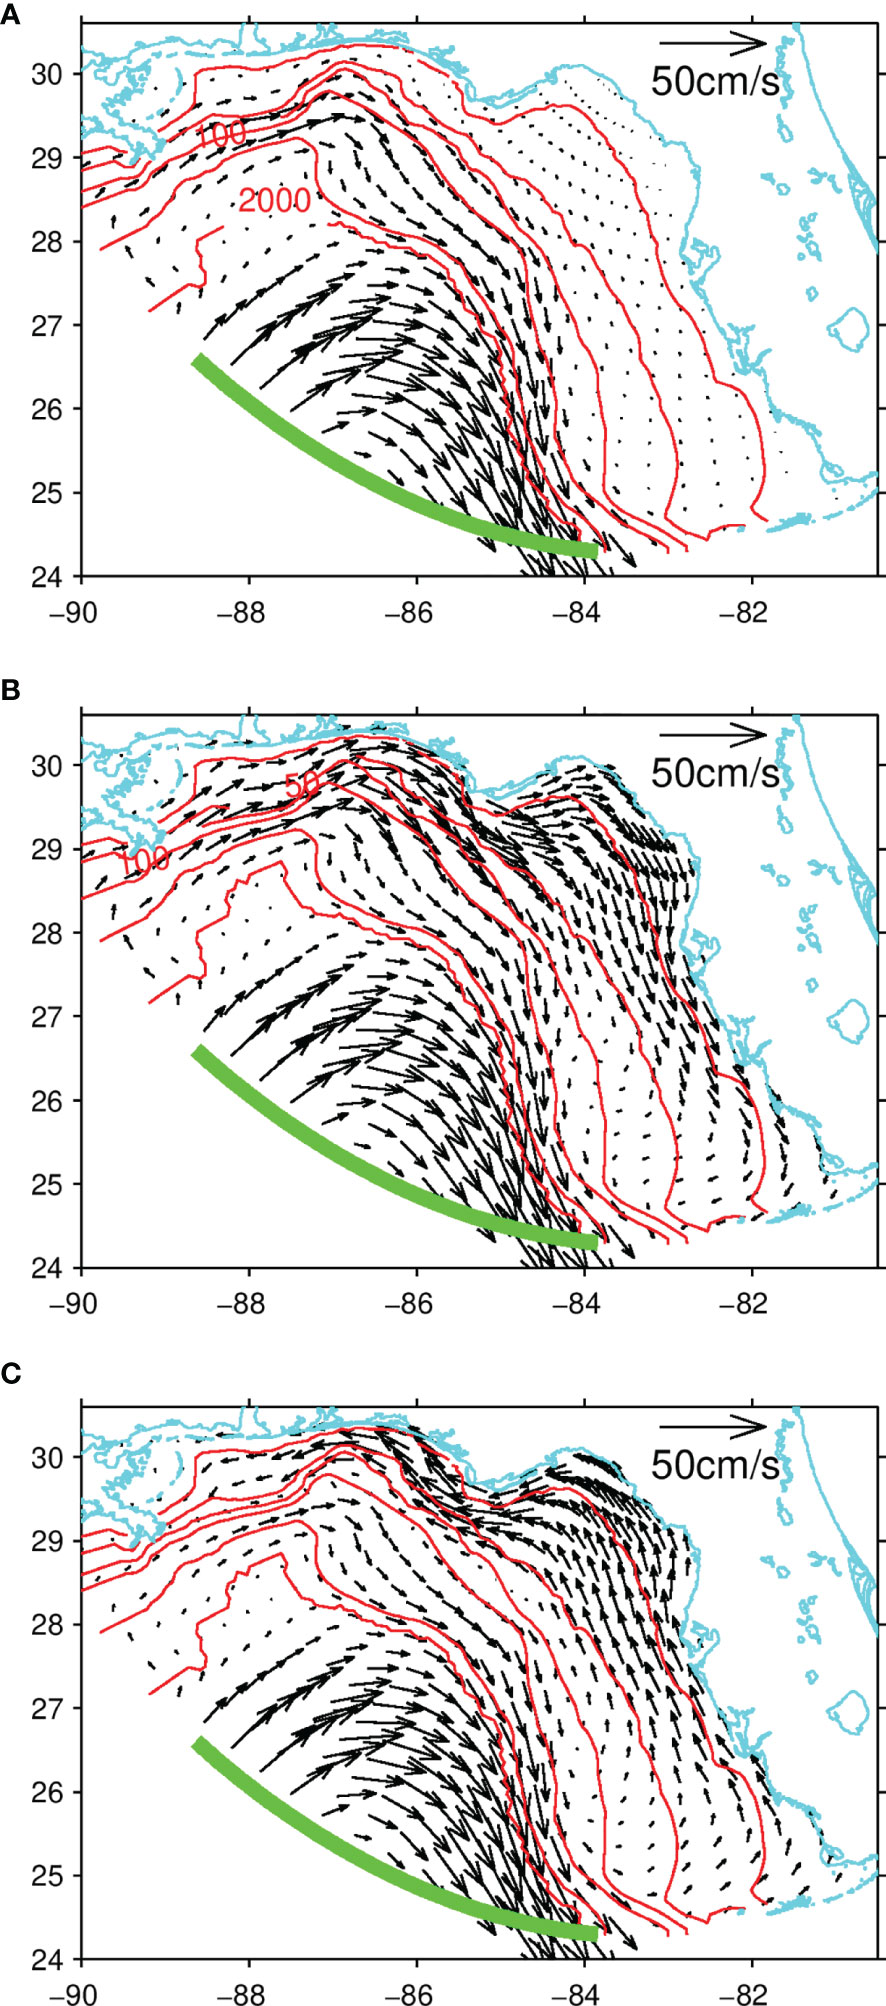
Figure 7 Simulated WFS responses to Loop Current forcing alone (A); Loop Current, plus upwelling favorable wind forcing (B); and Loop Current, plus downwelling favorable wind forcing (C). The green line denotes the region of Loop Current inflow and outflow (from He and Weisberg, 2003). The vectors are depth averaged currents, and the (red) depth contours are the 20 m, 50 m, 100 m, 200 m, 1000 m and 2000 m isobaths.
The second case harkens back to 1998 when the Loop Current did exhibit a prolonged contact with west Florida escarpment near the Dry Tortugas, for which the results on the circulation and ecology are documented by the companion papers of Weisberg and He (2003) and Walsh et al. (2003), respectively. Given the He and Weisberg (2003) modeling technique as a precursor for estimating the Loop Current forcing, Weisberg and He (2003) made application to the anomalous conditions observed on the WFS in 1998. Two simulations were performed, one without and another with Loop Current contact. Snapshots of vertically (and daily) averaged velocity vectors for May 31, 1998 are shown in Figure 8. The left and right hand panels superimpose the velocity vectors on sea surface temperature and sea surface salinity, respectively. The top and bottom panels provide the cases with and without Loop Current forcing, respectively, with the local wind forcing being the same for each of these cases. It is noted that the winds in spring 1998 were also anomalously westerly so for the local forcing only case, we see an along-shelf transport along the Panhandle coast (even without the Loop Current) following the isobaths as they turn southward and continuing along the outer-shelf. Without Loop Current forcing at this time, the inner-shelf along Florida’s west coast had relatively little current flow and even exhibited vectors pointing in the direction opposite to the outer-shelf flow direction. The addition of Loop Current forcing (bottom panels) changed the flow field markedly. The Loop Current forcing addition, by imposing a pressure gradient field with a relatively high along the shelf slope and low along the near-shore, energized the entire inner-shelf with a transport to the south that exited the WFS around the Dry Tortugas. Available velocity observations (again by moored ADCPs) demonstrated the general veracity of these model findings, and together, these observations and model simulations provided a confirmation of the Hetland et al. (1999) model-derived hypothesis. With the Loop Current forcing beginning in March, the observations and model simulations showed the Loop Current effects building toward the end of April with the entire WFS affected by May (Weisberg et al., 2004). Using a data assimilative model, Fan et al. (2004) then showed that such an upwelling circulation could also be obtained by assimilating surface drifter observations.
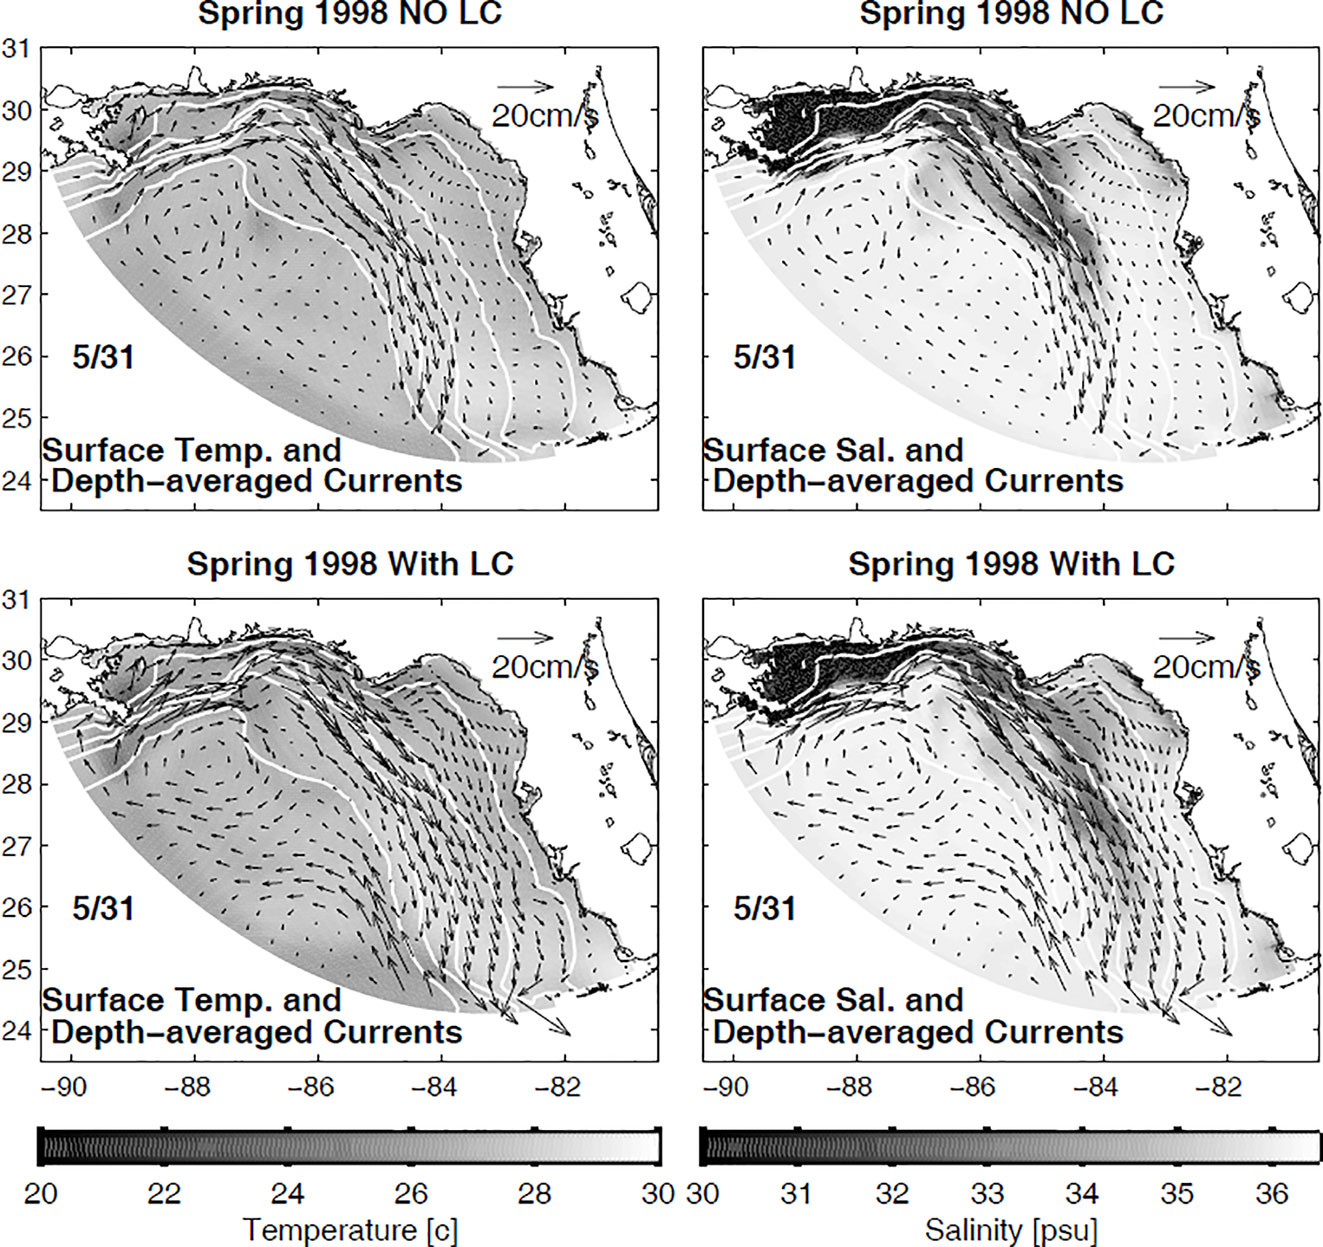
Figure 8 Simulated WFS responses to local forcing alone (top panels) and local plus, Loop Current forcing (bottom panels) as sampled on May 31, 1998, a time when the Loop Current was in contact with west Florida escarpment near the Dry Tortugas. Shown are depth averaged currents superimposed on either surface temperature (left panels) or surface salinity (right panels). Note the full WFS responses with the inclusion of the Loop Current forcing (from Weisberg and He, 2003).
How this impacted water properties and phytoplankton ecology was advanced by Walsh et al. (2003). Water properties were sampled by a Minerals Management Service Northeastern Gulf of Mexico (NEGOM) Program (Nowlin et al., 1998; Jochens and Nowlin, 1999; Nowlin et al., 2000) and by a National Oceanic and Atmosphere Administration, Ecology of Harmful Algal Blooms (ECOHAB) regional field study. Observed in spring through fall of 1998 were increased nutrient levels (by virtue of upwelling of deeper ocean water across the shelf break) that tended to support the growth of diatoms, versus K. brevis dinoflagellates; hence, the occurrence of a WFS red tide in 1998 was only nominal.
Nutrients upwelled from below the euphotic zone tend to be inorganic and conservatively advected. Thus, relative to nutrients sampled within the euphotic zone, these inorganic nutrients tend to correlate well with temperature and salinity. Weisberg and He (2003) provide such descriptions for phosphate, silicate and nitrate+nitrite using data from both the NEGOM program and from the western north Atlantic, WOCE A22 hydrographic section. Both of these data sources tend to give similar results for waters of potential temperature less than about 18°C, with such cooler waters showing steady increases in these nutrient levels with decreasing temperature down to the level of the Antarctic Intermediate Water. Thus, waters with potential temperatures of 18°C, or less, when upwelled onto the WFS, will tend to add nutrients to what may otherwise be an oligotrophic regime.
The year of 2010 provided another example of protracted upwelling by the Loop Current impacting the west Florida escarpment near the Dry Tortugas. This occurred from mid-May through December, documented observationally and with numerical circulation model simulations (e.g., Liu et al., 2011b; Weisberg et al., 2014a; Liu et al., 2016b). Consistent again with Hetland et al. (1999), the pressure perturbation by the Loop Current resulted in a pressure gradient with a relatively high along the upper slope/outer-shelf and low along the nearshore that propagated northward to set up an along-shelf (south-southeastward) geostrophic flow over the entire WFS. Left hand turning across the bottom Ekman layer resulted in an upwelling flow. Given the potential for such upwelling to alter the WFS nutrient state, Weisberg et al. (2016a) addressed the origin and pathways for deeper ocean water upwelled onto the WFS. The period of study was spring through summer of 2010, and the model used was the West Florida Coastal Ocean Model (WFCOM). WFCOM, introduced by Zheng and Weisberg (2012) and modified by Weisberg et al. (2014b), consists of the Finite Volume Community Model [FVCOM, e.g., Chen et al. (2003)] nested in the HYbrid Coordinate Model [HYCOM, e.g., Chassignet et al. (2009)]. Isopycnal particle tracking experiments were performed over three different 45-day intervals. Being that the Loop Current impact did not begin until mid-May, 2010, the first of these spanned April 1 through May 15, 2010, a period of time when the flow field was influenced by local, versus deep-ocean forcing. The second of these spanned May 1 through June 15, 2010, a period of time when persistent, deep-ocean forced upwelling added to local forcing for a portion of the time. The third experiment spanned June 1 through July 15, 2010, a period of time when persistent upwelling was always a factor. For each of these three experiments, particles were initiated near the bottom (in the lowest sigma (vertical) coordinate layer) along the 75 m, 100 m, 150 m, 200 m, 250 m and 300 m isobaths (i.e., isobaths between the shelf break and the upper portion of the shelf slope) from just west of Tampa Bay to the Mississippi River delta. The particles were then tracked three-dimensionally along isopycnals for 45 days. As expected, without protracted Loop Current-induced upwelling, the particles showed little directional preference. Once upwelling was in place, the translations were rectified shoreward, and when upwelling persisted for the entire integration, many of the particles were transported all of the way to the shoreline. Examples for particles initialized along the 100 m isobath are given in Figure 9. While not shown, many of the particles initialized along the 150 m isobath also translated to the shoreline, whereas fewer particles did so from the 200 m isobath. From the 250 m and the 300 m isobaths, the only particles to translate to the shoreline were those along the Florida Panhandle coast where the shelf is much narrower. The conclusions are that under persistent upwelling conditions, fluid (and material properties contained therein) may readily upwell across the shelf break and be transported over the entirety of the WFS from the upper region of the continental shelf slope (from depths between about 75 m to 200 m). With the potential temperatures of upper shelf water generally being about 15°C at 200 m depth, the observed temperature-nutrient relationships show that the WFS may be bathed in waters with elevated nutrient content under protracted Loop Current-induced upwelling conditions.
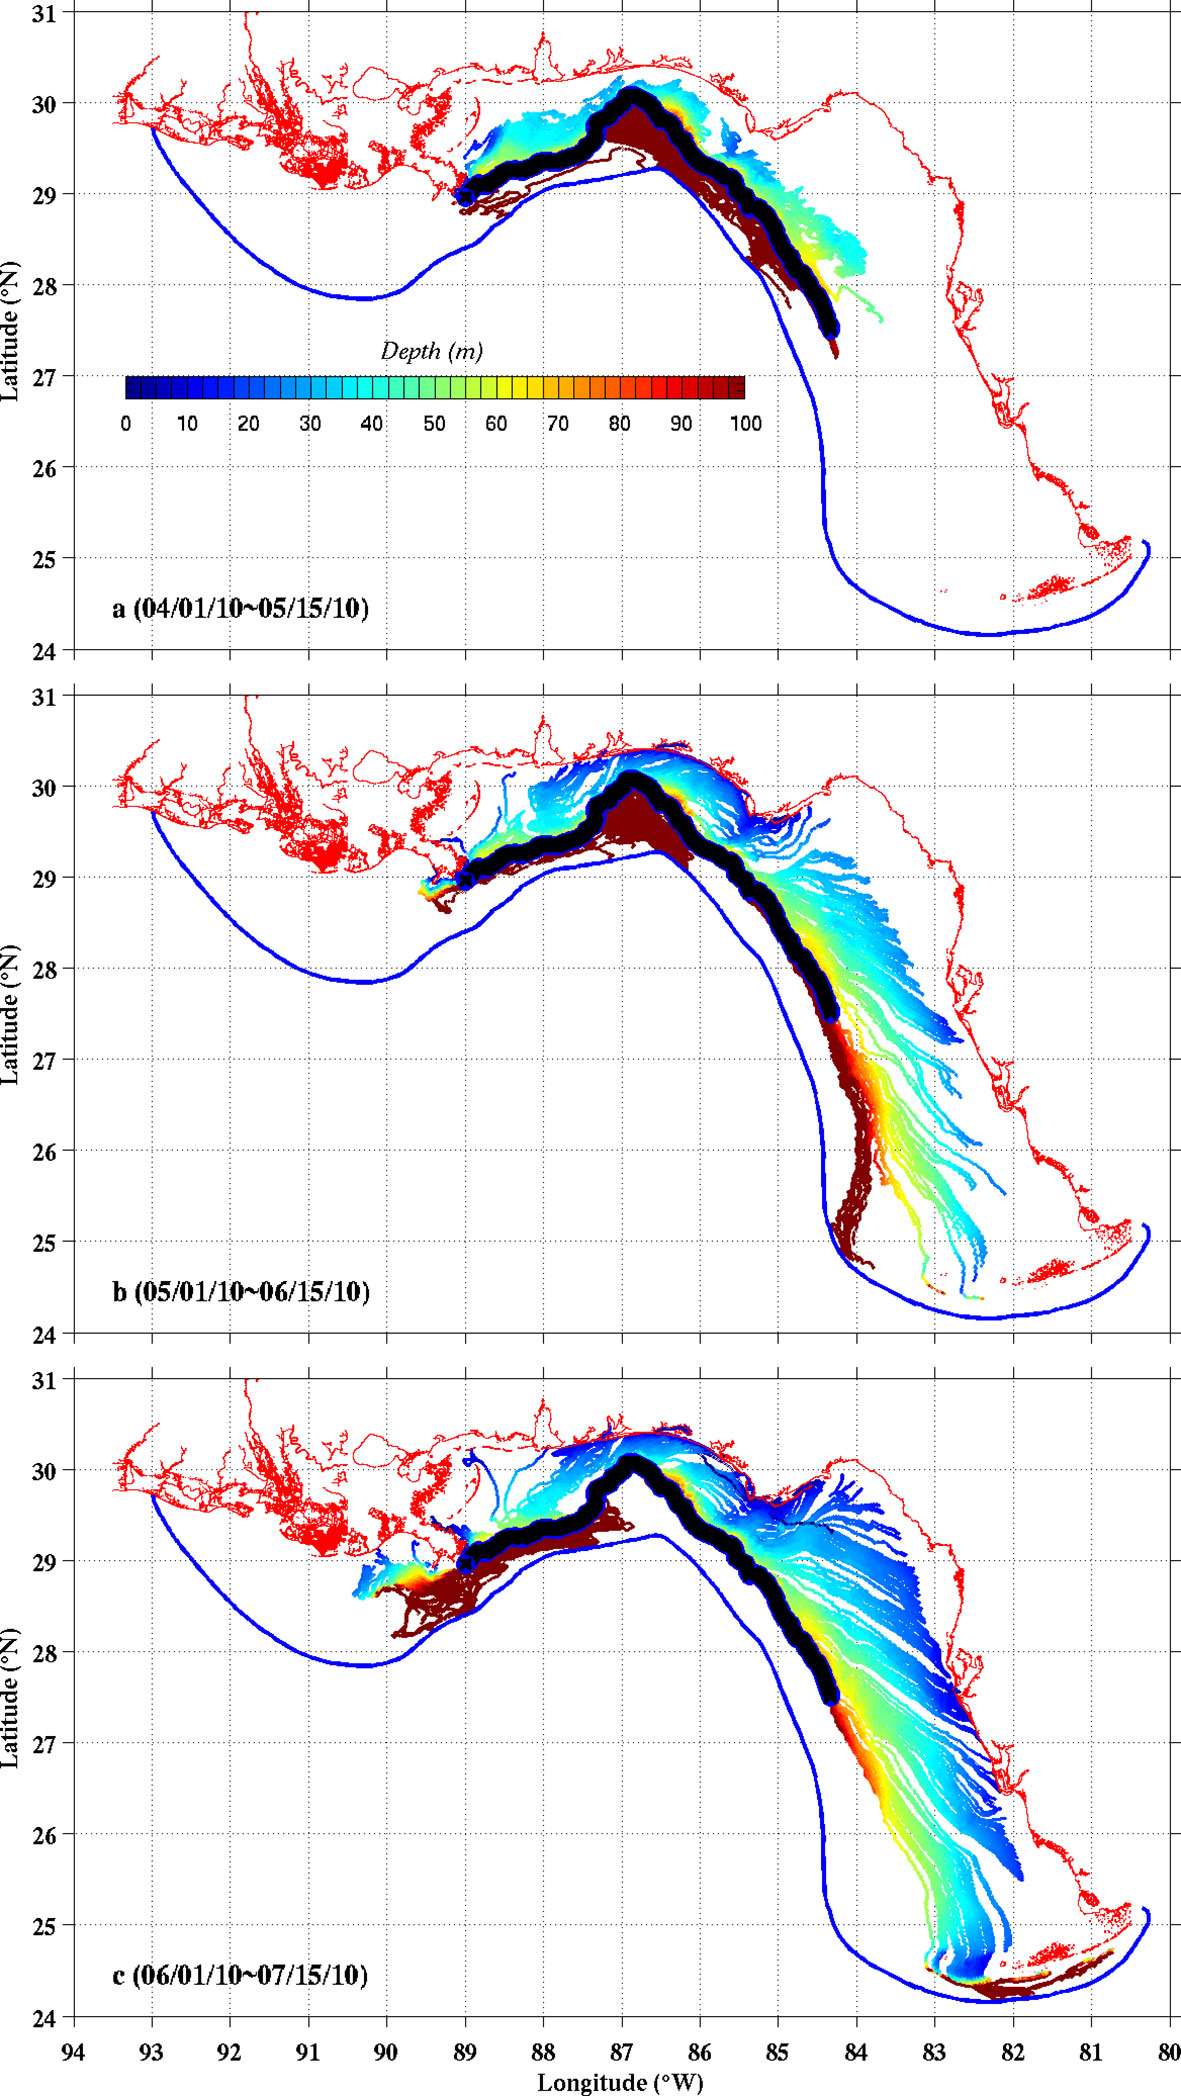
Figure 9 WFCOM-simulated isopycnal water parcel trajectories, originating from the lowest model sigma layer and distributed at 1 km intervals (black dots) along the 100 m isobath. From top to bottom these span the 45-day intervals in 2010 of: (A) April 1 to May 15 (with no persistent upwelling), (B) May 1 to June 15 (with persistent upwelling occurring over the second half of the interval) and (C) June 1, to July 15 (with persistent upwelling throughout the interval), and the color-coding denotes particle depth (from Weisberg et al., 2016b).
More recenty, Pan et al. (2017) and Kourafalou et al. (2018) demonstrated how these concepts apply to water properties observed and modeled along Pulley Ridge, a relatively deep reef track to the northwest of the Dry Tortugas.
Such Loop Current impacts upon the WFS are interannual occurrences, with about 10 of these observed by satellite altimetry from 1993 through the present time (Nickerson et al., 2022), the last sustained one being in 2018. In contrast with Figure 5, an upwelling situation under stratified conditions without significant Loop Current influence, Figure 10 shows a similar across shelf section for September 29, 2018 with Loop Current influence. The salinity panel shows the upwelling of relatively high salinity water, with isohalines bending into the bottom across the bottom Ekman layer. The across-shelf velocity component panel shows onshore directed flow in the bottom Ekman layer, but a much lesser offshore directed flow at the surface because the winds were not the primary factor. The along-shelf velocity component shows the inner-shelf jet clearly separated from a region of similar sign farther offshore at the shelf break that is attributable to a mesoscale eddy observed in satellite imagery. This further demonstrates the role of deep-ocean forcing on WFS circulation when the Loop Current impacts the shelf slope near the Dry Tortugas.
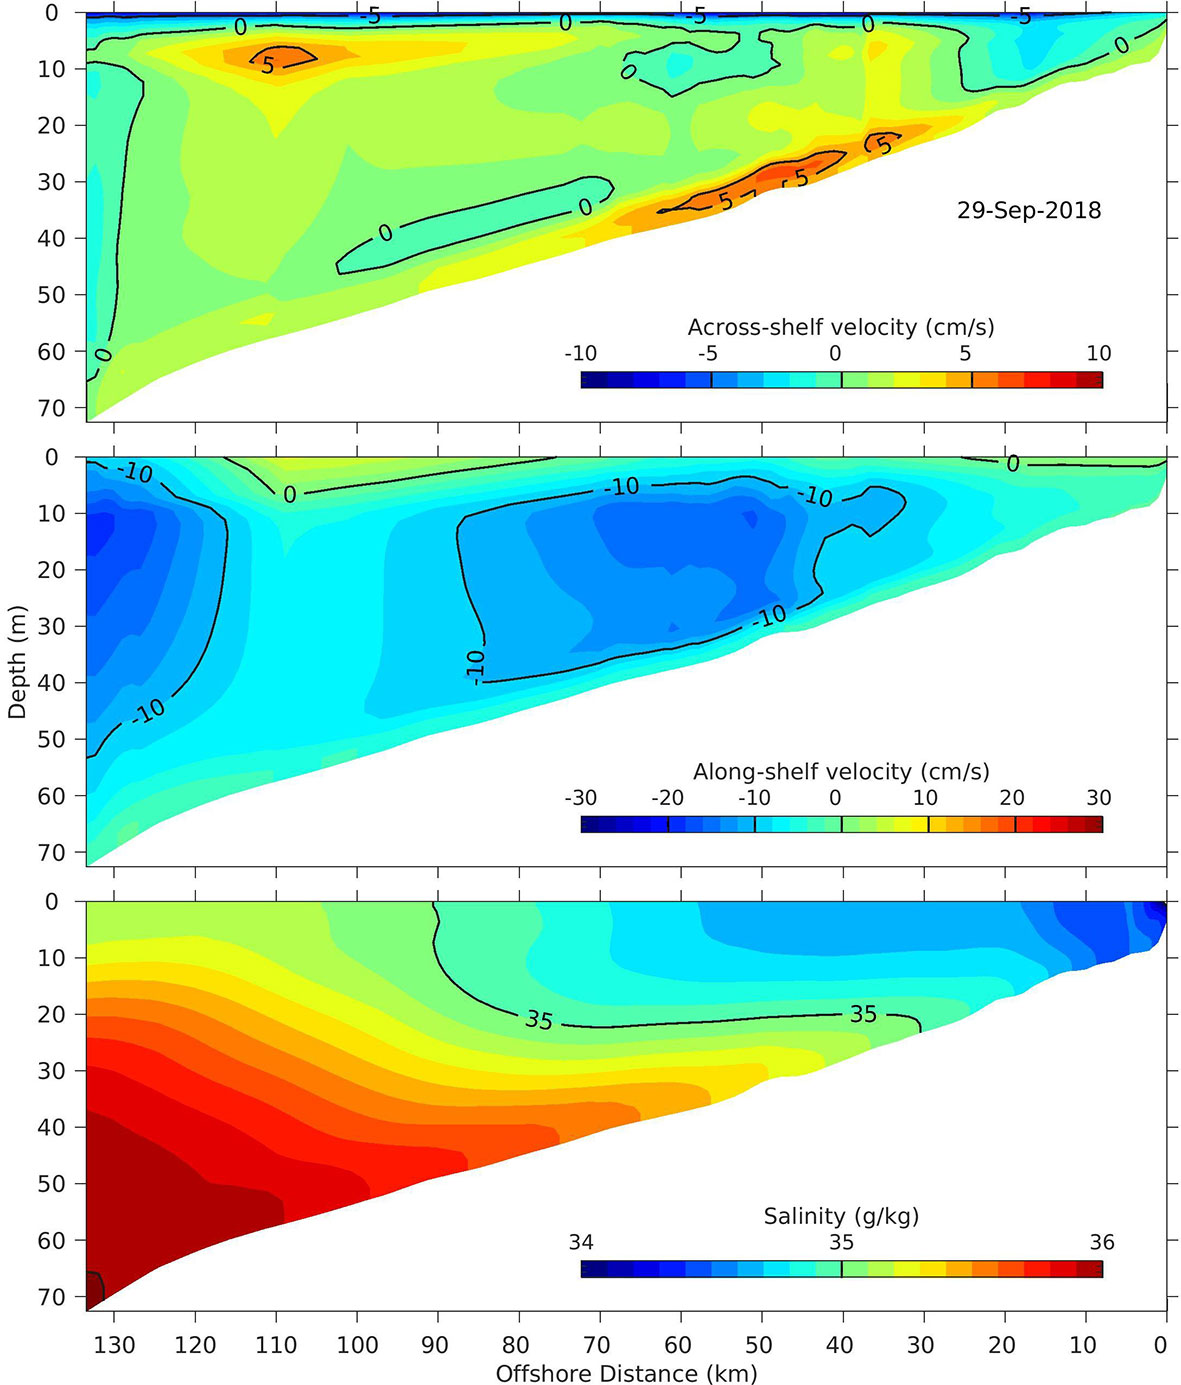
Figure 10 Across-shelf sections sampled offshore from Sarasota, FL on September 29, 2018 from a West Florida Coastal Ocean Model simulation. From top to bottom are the across-shelf component of velocity, the along-shelf component of velocity and salinity, with contour intervals and units provided by the color bars in each panel.
3 Applications
3.1 Karenia Brevis Red Tide
Already alluded to in section 2.2, by altering the nutrient state of the WFS, deep-ocean forcing may strongly influence the occurrence of K. brevis red tide on the WFS. With sufficient velocity and hydrographic observations for establishing model simulation veracity, Weisberg et al. (2014a) demonstrated why there was no red tide on the WFS in 2010 due to the protracted Loop Current-induced upwelling. Using similar reasoning, Weisberg et al. (2016b) was then able to explain why 2012 experienced a pronounced red tide, whereas the subsequent one in 2013 was just nominal, again by virtue of Loop Current forcing effects. This latter paper also convincingly showed (via glider transects and satellite color imagery) the offshore origin for the K. brevis red tides found along the west Florida coast in a typical year, confirming the original supposition on offshore generation by Steidinger (1975) and Steidinger and Haddad (1981) and a previous case study by Weisberg et al. (2009a).
These findings motivated the Liu et al. (2016a) to examine major red tide occurrences along Florida’s west coast with respect to Loop Current behaviors, as evidenced in satellite altimetry records that began in 1993. The offshore origin hypothesis has its basis in Figure 1. Without deep-ocean forcing bringing a suite of new inorganic nutrients to the mid-shelf region, especially silicate, it is difficult for diatoms to outcompete dinoflagellates if phosphate and nitrogen compounds become available. Phosphate is generally not limiting (e.g., Lenes et al., 2008), and nitrogen compounds may be fixed by the cyanobacterium, Trichodesmium that may abound when the WFS is enriched with iron from Saharan dust transported in spring months by strengthening easterly winds (e.g., Lenes et al., 2001; Walsh et al., 2006; Lenes et al., 2008; Lenes and Heil, 2010; Heil et al., 2014). Thus, if a monospecific K. brevis bloom is able to form offshore in spring through summer months, to later be transported landward within the bottom Ekman layer by an upwelling circulation, either wind-driven, or by a combination of local wind and Loop Current forcing, then an intensifying K. brevis bloom may appear along the shoreline in fall, which is the typical onset time. Case studies showing this are documented for the WFS by Weisberg et al. (2009a; 2016b) and for the Florida Panhandle coast by McCulloch et al. (2013), and additional idealized modeling work for the Florida Panhandle coast is given by Janowitz et al. (2008).
Bloom intensification (major blooms have cell concentrations exceeding 106 cells per liter) may be accounted for in three different ways. The first is physical; cells originating over a deep water column will concentrate when advected to a shallow water column. Being that the shoreward advection occurs within the bottom Ekman layer, an evolving bloom is not visually detectable until the water column is shallow enough for the bloom to mix or migrate up to the surface, as was also evidenced in Weisberg et al. (2016b). The second is also physical; owing to lower nearshore salinities, cells may further concentrate by convergence along fronts (e.g., Janowitz and Kamykowski, 2006; Kamykowski et al., 2013). The third is bio-chemical; nearshore waters have higher nutrient concentrations, and these are further elevated by decaying fish that are killed by the K. brevis toxins (e.g., Walsh et al., 2009). This latter effect is what makes major red tide blooms so insidious; by killing fish, K. brevis induces its own nutrient supply.
Based on such bloom development concepts, if a mid-WFS origin is dependent upon oligotrophic conditions, and if these conditions are modified by prolonged Loop Current contacts with the west Florida escarpment near the Dry Tortugas, then some correspondence between Loop Current behavior and major red tide occurrences would be expected. This motivated the Liu et al. (2016a) study in which the Self Organizing Map technique, was used to project snapshots of daily sea surface height and surface geostrophic currents (estimated from the satellite altimetry data) onto a discrete set of (20) patterns with an associated Best Matching Unit time series showing the temporal evolution of these patterns for the 23 year period, 1993 through 2015. Within this pattern evolution were instances when the Loop Current was in contact with the west Florida escarpment near the Dry Tortugas, the WFS “pressure point”, as named by these authors. Upon comparing the Best Matching Unit time series with a weekly averaged, west Florida coast K. brevis cell count time series, a correspondence between pressure point contact and major red tide occurrences (or lack of) was found. This led to a qualitative scheme for hindcasting and forecasting. From a binary random variable perspective (i.e., did a major bloom occur, or not), this Occam’s razor approach, while necessarily crude, did provide encouraging results. In hindcast, the success rate for the occurrence of no major K. brevis bloom in a given year (for the period 1993-2015) was 100% (6 out of 6 years), and for a major K. brevis bloom it was 76% (13 out of 17 years). Thus, Loop Current forcing (i.e., deep-ocean forcing) at the pressure point does impact the occurrence of major red tides on the WFS, which helps to explain why Florida red tides tend to have such large inter-annual variability.
Of course, there are exceptions to any simplistic scheme. The following year, 2016, was one for which a major red tide was not predicted, whereas one did occur. While pure speculation in the absence of any conclusive evidence, the 2016 red tide bloom onset was nearshore shortly after heavy rainfalls caused municipal sewage systems to be overwhelmed, resulting in large releases of partially treated effluent. Thus, whether or not human influence may be an exacerbating factor remains an open question, but one that must be tempered by the fact that K. brevis red tides have been a west Florida occurrence for as long as anecdotal records exist (e.g., https://myfwc.com/media/21885/bloom-historic-database.pdf).
Another interesting case occurred in 2018. The prior year (2017) red tide, which did adhere to the above scheme, persisted into 2018, but was limited in extent to the southern half of the WFS. The month of September 2018 then saw a major escalation in red tide extent and intensity, especially from Venice, FL to the Tampa Bay region and subsequently to both the Florida Panhandle and east coasts. Described by Weisberg et al. (2019), the Loop Current behavior for both 2017 and 2018 was conducive for major red tide initiation. The Loop Current, which had been situated far into the Gulf of Mexico, shed a Loop Current Ring in July 2018 and then retreated back to its more direct, inflow-outflow regime, making contact with the WFS pressure point and remaining in such contact through the end of the year. Thus, while the pressure point contact came too late to suppress offshore bloom generation, its timing ensured the transport of offshore-generated K. brevis cells to the nearshore. Water property observations by a glider deployment, optical measurements by satellite and WFCOM model simulations with particle tracking explained the K. brevis cell count distributions, as were first observed along the WFS shoreline and then simultaneously along the Panhandle and east coasts, all of which could be traced back to a mid-WFS origination zone roughly between the 30 m to 40 m isobaths.
3.2 Fish Recruitment
As an important recreational and commercial fish species in the low-latitude continental shelf waters of the Western Atlantic, gag (Mycteroperca microlepis) are known to spawn offshore and to settle near shore within seagrass meadows and other structured, post-settlement habitats (Keener et al., 1988; Levin and Hay, 2003; Casey et al., 2007. For the WFS, Fitzhugh et al. (2005) describe gag as belonging to a single population (see also Jue, 2006) that spawns from late winter to early spring at hard-bottom habitats between about the 40 m isobath and the shelf break. Early stage larvae have been collected from surface waters near the shelf break (Marancik et al., 2012), and juveniles are abundant enough within shallow, nearshore waters to be routinely surveyed (Casey et al., 2007; Switzer et al., 2012). Otoliths indicate that the time between spawning and settlement varies from roughly 30–50 days, and juvenile densities (juveniles caught per area sampled) tend to be the highest along the coast from the Tampa Bay to Charlotte Harbor estuaries, as compared with locations farther north and south, although there is substantial inter-annual and geographic variability in juvenile density (Fitzhugh et al., 2005; Switzer et al., 2012).
It was speculated that larval movement from spawning to settlement occurred in surface waters (e.g., Heppell et al., 2006; Adamski et al., 2013). However, Fitzhugh et al. (2005) found that the temporal and geographic trends in the mean fertilization and settlement dates of juvenile gag did not agree with seasonal changes in wind-driven surface currents. Thus, the conundrum of how gag larvae and juveniles get from spawning to settlement remained an issue.
This topic was addressed by Weisberg et al. (2014b) using both observations and WFCOM model simulations. Gag observations consisted of pre-settlement juveniles collected in the surf zone at Mullet Key (near the mouth of Tampa Bay) from April through June, 2007, with abundance peaking sharply on May 22nd and 23rd. The juvenile samples were co-located with drift algae of offshore, hard-bottom origin (e.g., Hanisak, 2001). Simultaneous WFS circulation observations consisted of full water column velocity records from moored ADCPs located on the 50 m isobath offshore from Tampa Bay, on the 20 m isobath offshore from Sarasota, Florida (just south from Tampa Bay) and on the 75 m isobath to the west-northwest of the Dry Tortugas (i.e., near the WFS pressure point).
During 2007, the Loop Current contacted the pressure point from about the end of March through the middle of May. A mooring near the pressure point clearly showed the response throughout this contact time, which closely matched the WFCOM simulation. Similarly, the velocity vectors observed and modeled at the other two mooring locations were in reasonably good agreements. Such veracity testing justified the use of the model simulation to explore potential larvae transport routes. Based on the aforementioned spawning locations, spawning to settlement durations and the date of peak juvenile capture, these authors performed 45-day particle trajectory experiments, with particles initialized on the 40 m, 60 m, 80 m and 100 m isobaths between latitudes of 280 N to 29.50 N, with start times beginning on April 1 and at successive 2-day intervals thereafter. Two sets of experiments were performed, the first to test a surface transport hypothesis, the second to test a near bottom transport hypothesis, and results were shown for the April 7, April 9, April 11, April 13 and April 15 start times.
The surface transport hypothesis was rejected because none of the particles, regardless of their initial isobath locations, gained proximity to the nearshore. Instead, the surface trajectories tended southward over the outer-shelf. In contrast, particles initialized near the bottom tracked toward the nearshore, as expected for a bottom Ekman layer flow under upwelling conditions. As an example, results for the 40 m isobath initializations for four different start times are shown in Figure 11. Some of these trajectories even ended up at Mullet Key. More broadly, we see why the region from Tampa Bay to Charlotte Harbor tends to be such a prolific region for gag. Of secondary importance is the region around Apalachicola Bay, also recognized as a prolific area for gag. On this basis, and along with the co-location of the observed juveniles with algae of hard bottom origin and other geochemical analyses, the bottom transport hypothesis was accepted.
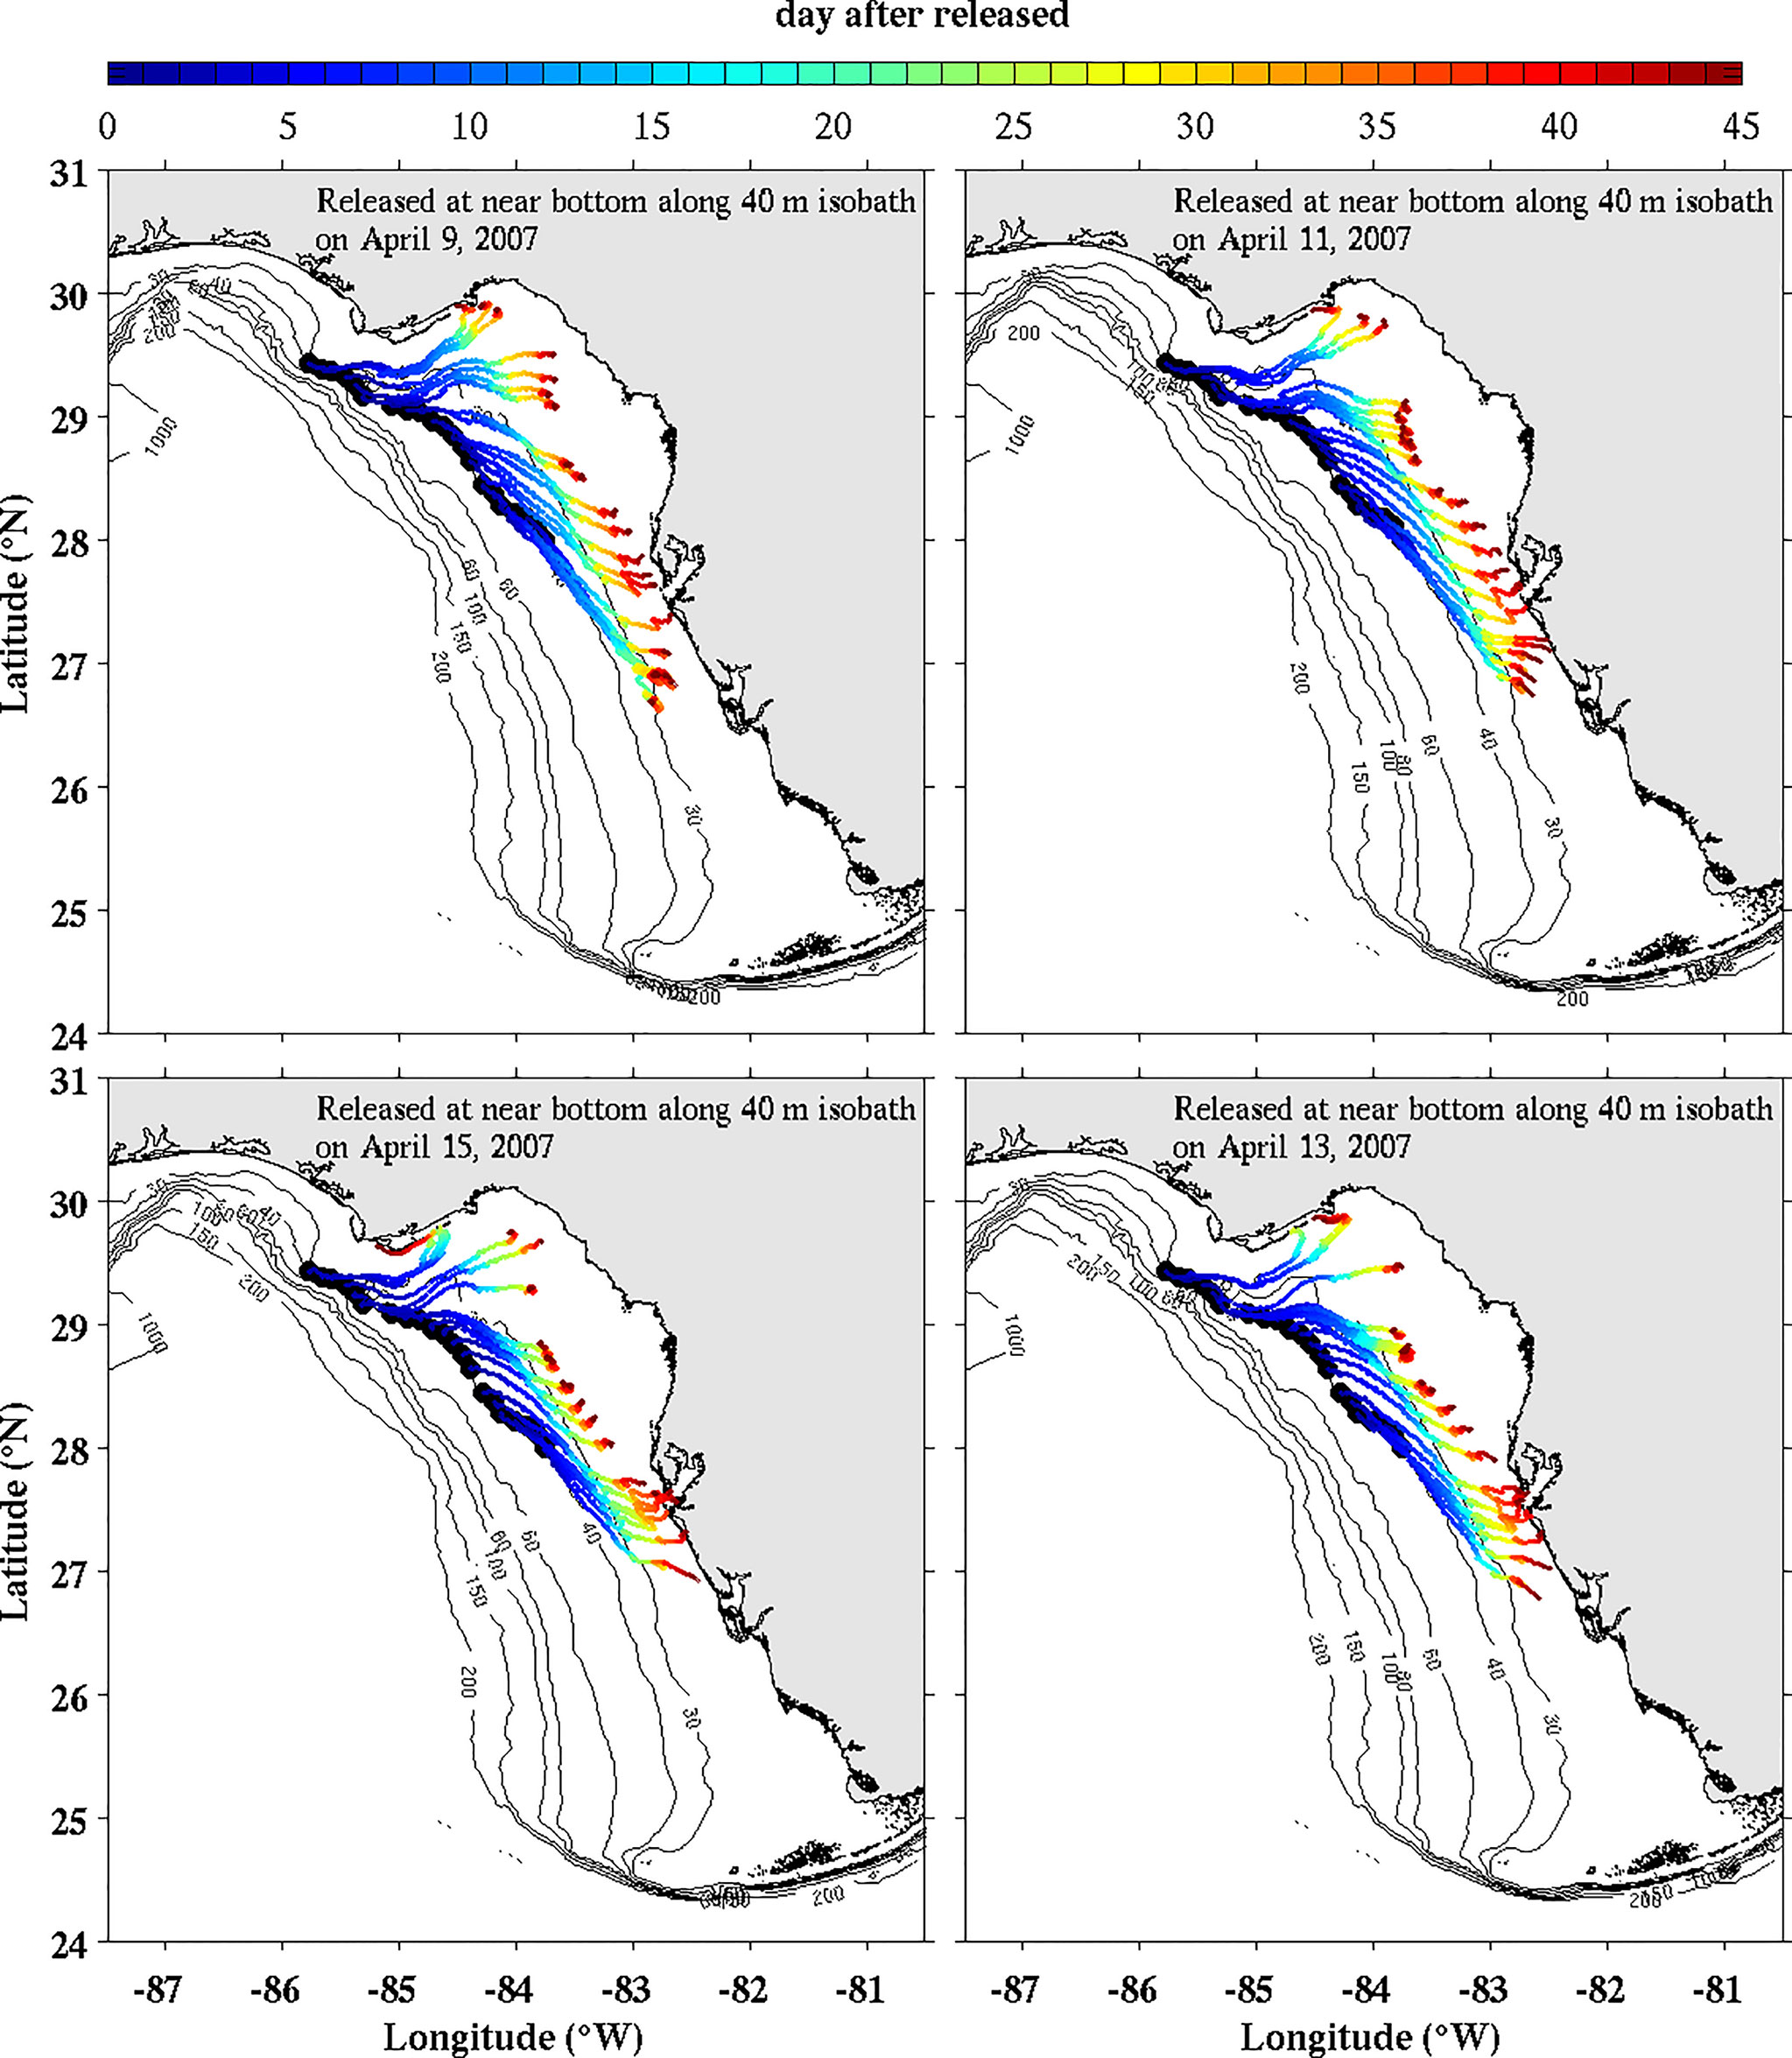
Figure 11 WFCOM-simulated near-bottom particle trajectories for particles initialized on the 40 m isobath. Clockwise from the upper left hand panel are particles initialized on April 9, April 11, April 13 and April 15, 2007. Color-coding denotes particle age from initialization at day zero to 45 days (from Weisberg et al., 2014b).
Just as is the case for K. brevis red tide, gag recruitment also appears related to the WFS circulation and the importance of deep-ocean forcing via Loop Current contact with the WFS pressure point. When this occurs in phase with spawning, and lasts long enough to facilitate transport form the spawning to settlement, then the expectation is for a very prolific gag year class.
3.3 Harmful Substance Tracking (e.g., The Deepwater Horizon Spill)
Not to belabor a point, but 2010, the year of the Deepwater Horizon oil spill was also a year when the Loop Current had prolonged contact with the WFS pressure point. We already discussed how this negated a red tide during that year, but how might this pressure point contact also have affected the transport of hydrocarbons? Here we will consider two applications, the first of these addressing the question of subsurface hydrocarbon transport to the WFS, the second addressing the surface transport to the shoreline. Deep-ocean forcing on the continental shelf and slope is the common element in these.
Subsequent to the Deepwater Horizon oil spill that occurred from April 20 to July 15, 2010 (e.g., Liu et al., 2011a), anecdotal reports of fish lesions and other abnormalities began to emerge for the northern Gulf of Mexico. This prompted a study by Murawski et al. (2014) to investigate such occurrences, not only in the direct vicinity of where surface oil was documented, but also over the entire WFS where no surface oil had been evident. With bottom dwelling reef fish samples taken throughout the WFS from 2011 to 2012, these authors found ample evidence for fish lesions and further analyses of hydrocarbon compounds found in fish liver samples, when compared with Deepwater Horizon oil, further suggested that such hydrocarbons did make their way to the WFS.
Motivated by such findings, and in view of the Loop Current induced upwelling circulation that existed over the course of the oil spill, Weisberg et al. (2016c) applied the WFCOM to examine the possibility that Deep Water Horizon hydrocarbons were transported to the WFS sight unseen beneath the surface. Their approach consisted of an initial value problem, wherein a tracer, of normalized concentration, was uniformly distributed over the water column offshore from Panama City, FL. (in the northeastern sector of the Florida Panhandle coast) on June 19, 2010 in accordance with MODIS satellite ocean color observations and then allowed to evolve as a passive tracer whose concentration reduced over time by advection and turbulence mixing. Figure 12 shows the near bottom tracer concentrations for July 15, July 30, August 15, and August 30, 2010. With the initial tracer value being 1.0, and with the tracer concentration color bar provided on a log10 scale, the green region corresponds to 0.40, the dark blue and mid-range magenta regions correspond to 0.12 and 0.05, respectively, and the gray region shows the lowest value retained and the extent of the WFCOM domain used in this experiment. Thus, even if the initial subsurface hydrocarbon concentrations were low, such values, reduced only by an order of magnitude, would have permeated most of the WFS’s inner shelf, even as far south as the Dry Tortugas, providing a possible explanation for the Murawski et al. (2014) observations.
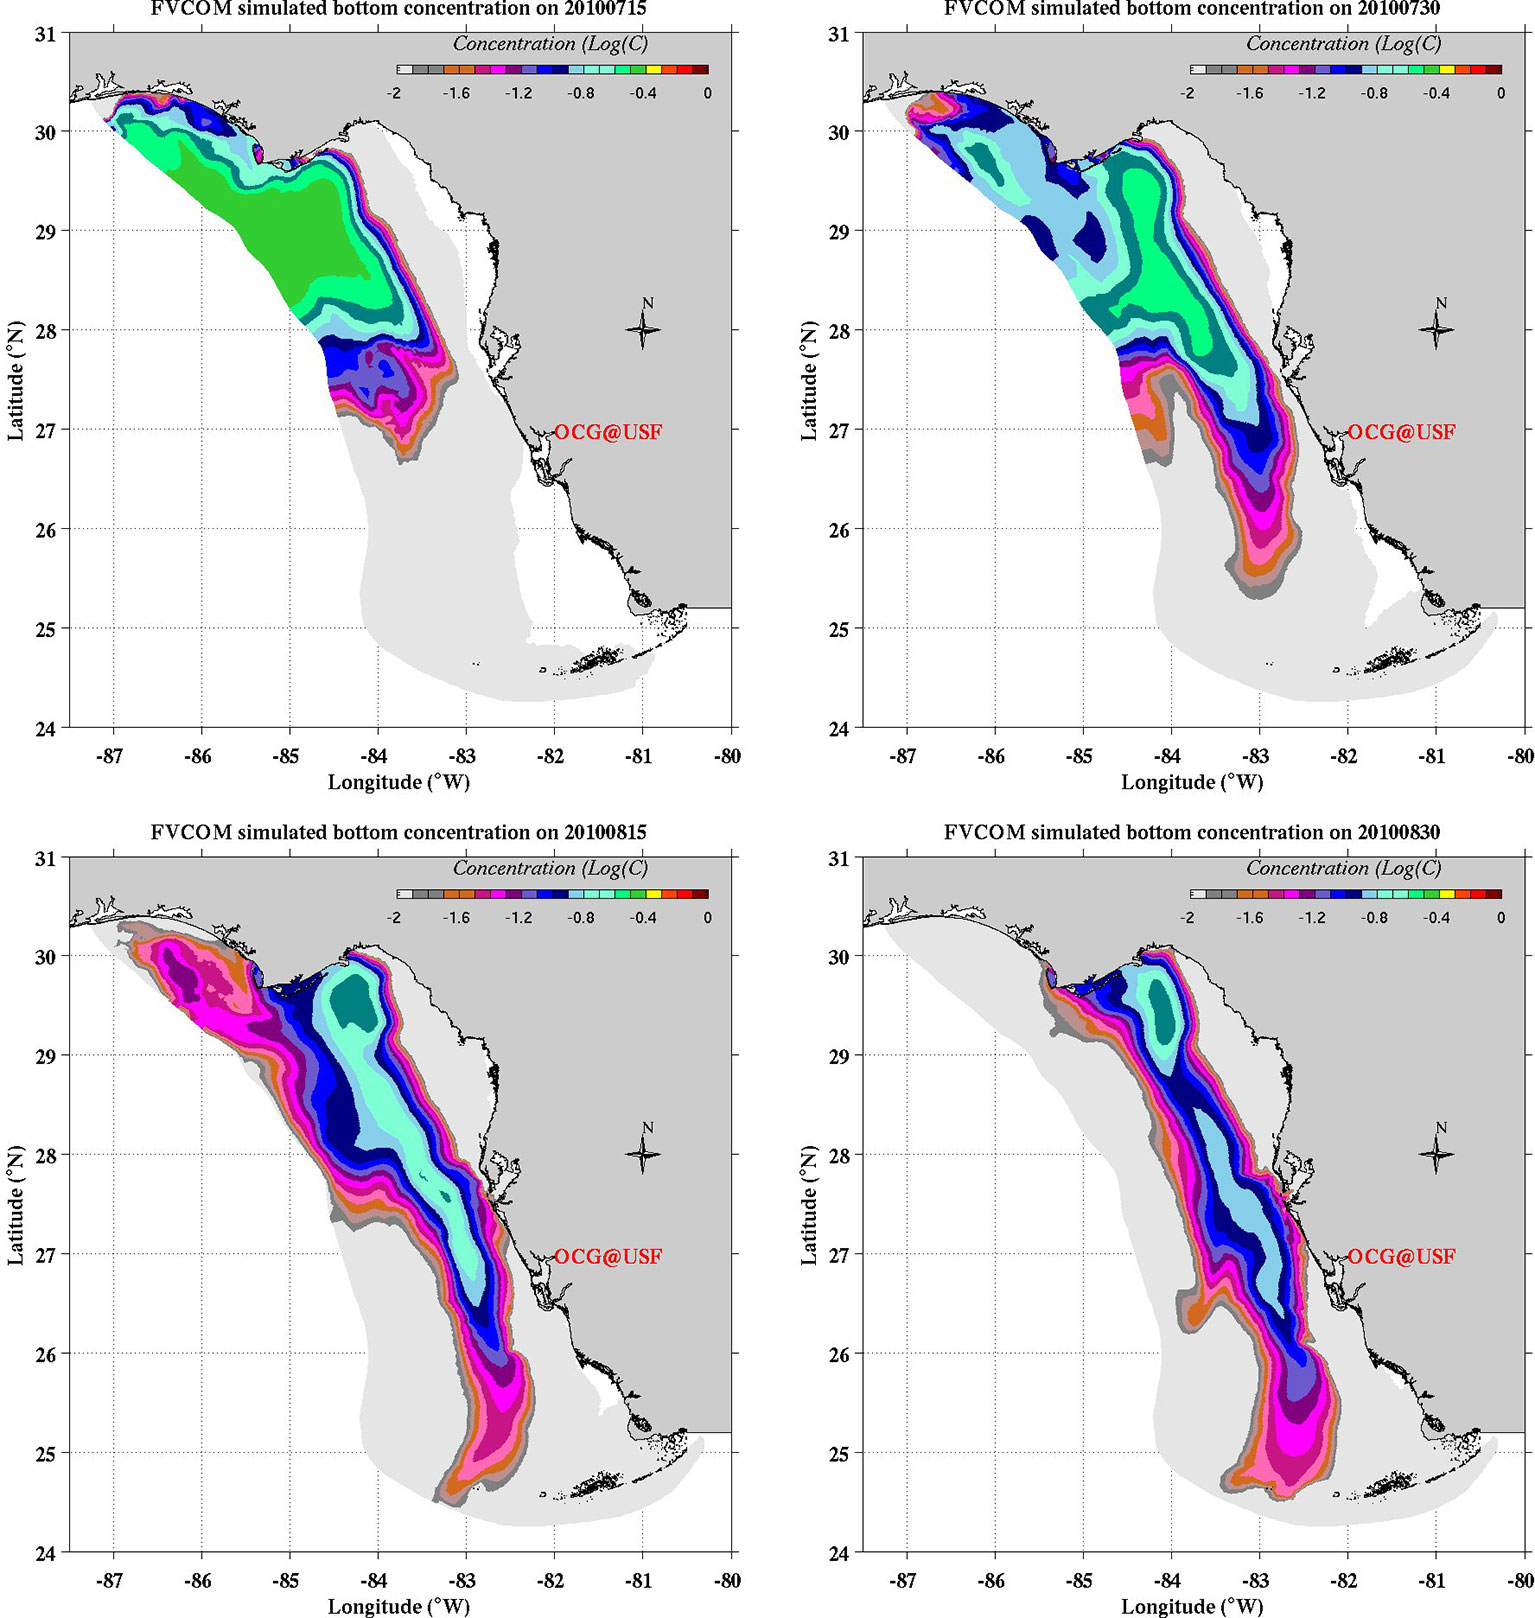
Figure 12 WFCOM-simulated normalized near-bottom tracer concentration sampled on July 15, 2010; July 30, 2010; August 15, 2010; and August 30, 2010. With the initial value being 1.0, and the tracer concentration color bar provided on a log10 scale, the green region on the upper two panels corresponds to 0.40, and the dark blue and mid-range magenta regions on all panels correspond to 0.12 and 0.05, respectively. The gray region represents the lowest tracer concentration value plotted, and its location on the left-hand side demarks the offshore extent of the WFCOM domain used in this simulation (adapted from Weisberg et al., 2016c).
How Deepwater Horizon oil arrived on the northern Gulf of Mexico beaches also entailed a combination of deep-ocean and local forcing, further modified by wave effects via Stokes drift. Overviews on the fate of the Deepwater Horizon hydrocarbons are provided by Özgökmen et al. (2016) and Passow and Hetland (2016). Using WFCOM (a version that extended to west of the Mississippi River), Weisberg et al. (2017) considered surface particle trajectories (with particles initially distributed where surface oil was observed on May 24, 2010 and then further added at the well-head location with time through July 15, 2010) and tracked either with or without Stokes drift. Being that the well-head was outside of the WFCOM domain, a scheme was developed wherein HYCOM fields were used for particle tracking outside of the WFCOM domain that transitioned smoothly with WFCOM field tracking once the particles entered the WFCOM domain. Experiments were performed by nesting WFCOM in either the Gulf of Mexico HYCOM or the Global HYCOM, and the most realistic results were found when using Stokes drift and the Global HYCOM. These are shown in Figure 13, which provides the distribution of beached particles and their ages (days since initialized on May 24, 2010, or released at the well-head) on June 27, 2010 for the Global HYCOM/WFCOM case, either without (top panel), or with (bottom panel) Stokes drift. The number of beached particles, relative to the total number of particles released, and the percent of particles beached are provided in the upper right. An order of magnitude more particles were beached with the inclusion of Stokes drift than without, and their distribution along the northern gulf beaches closely matched the reported observations of tar balls and oil (http://gomex.erma.noaa.gov).
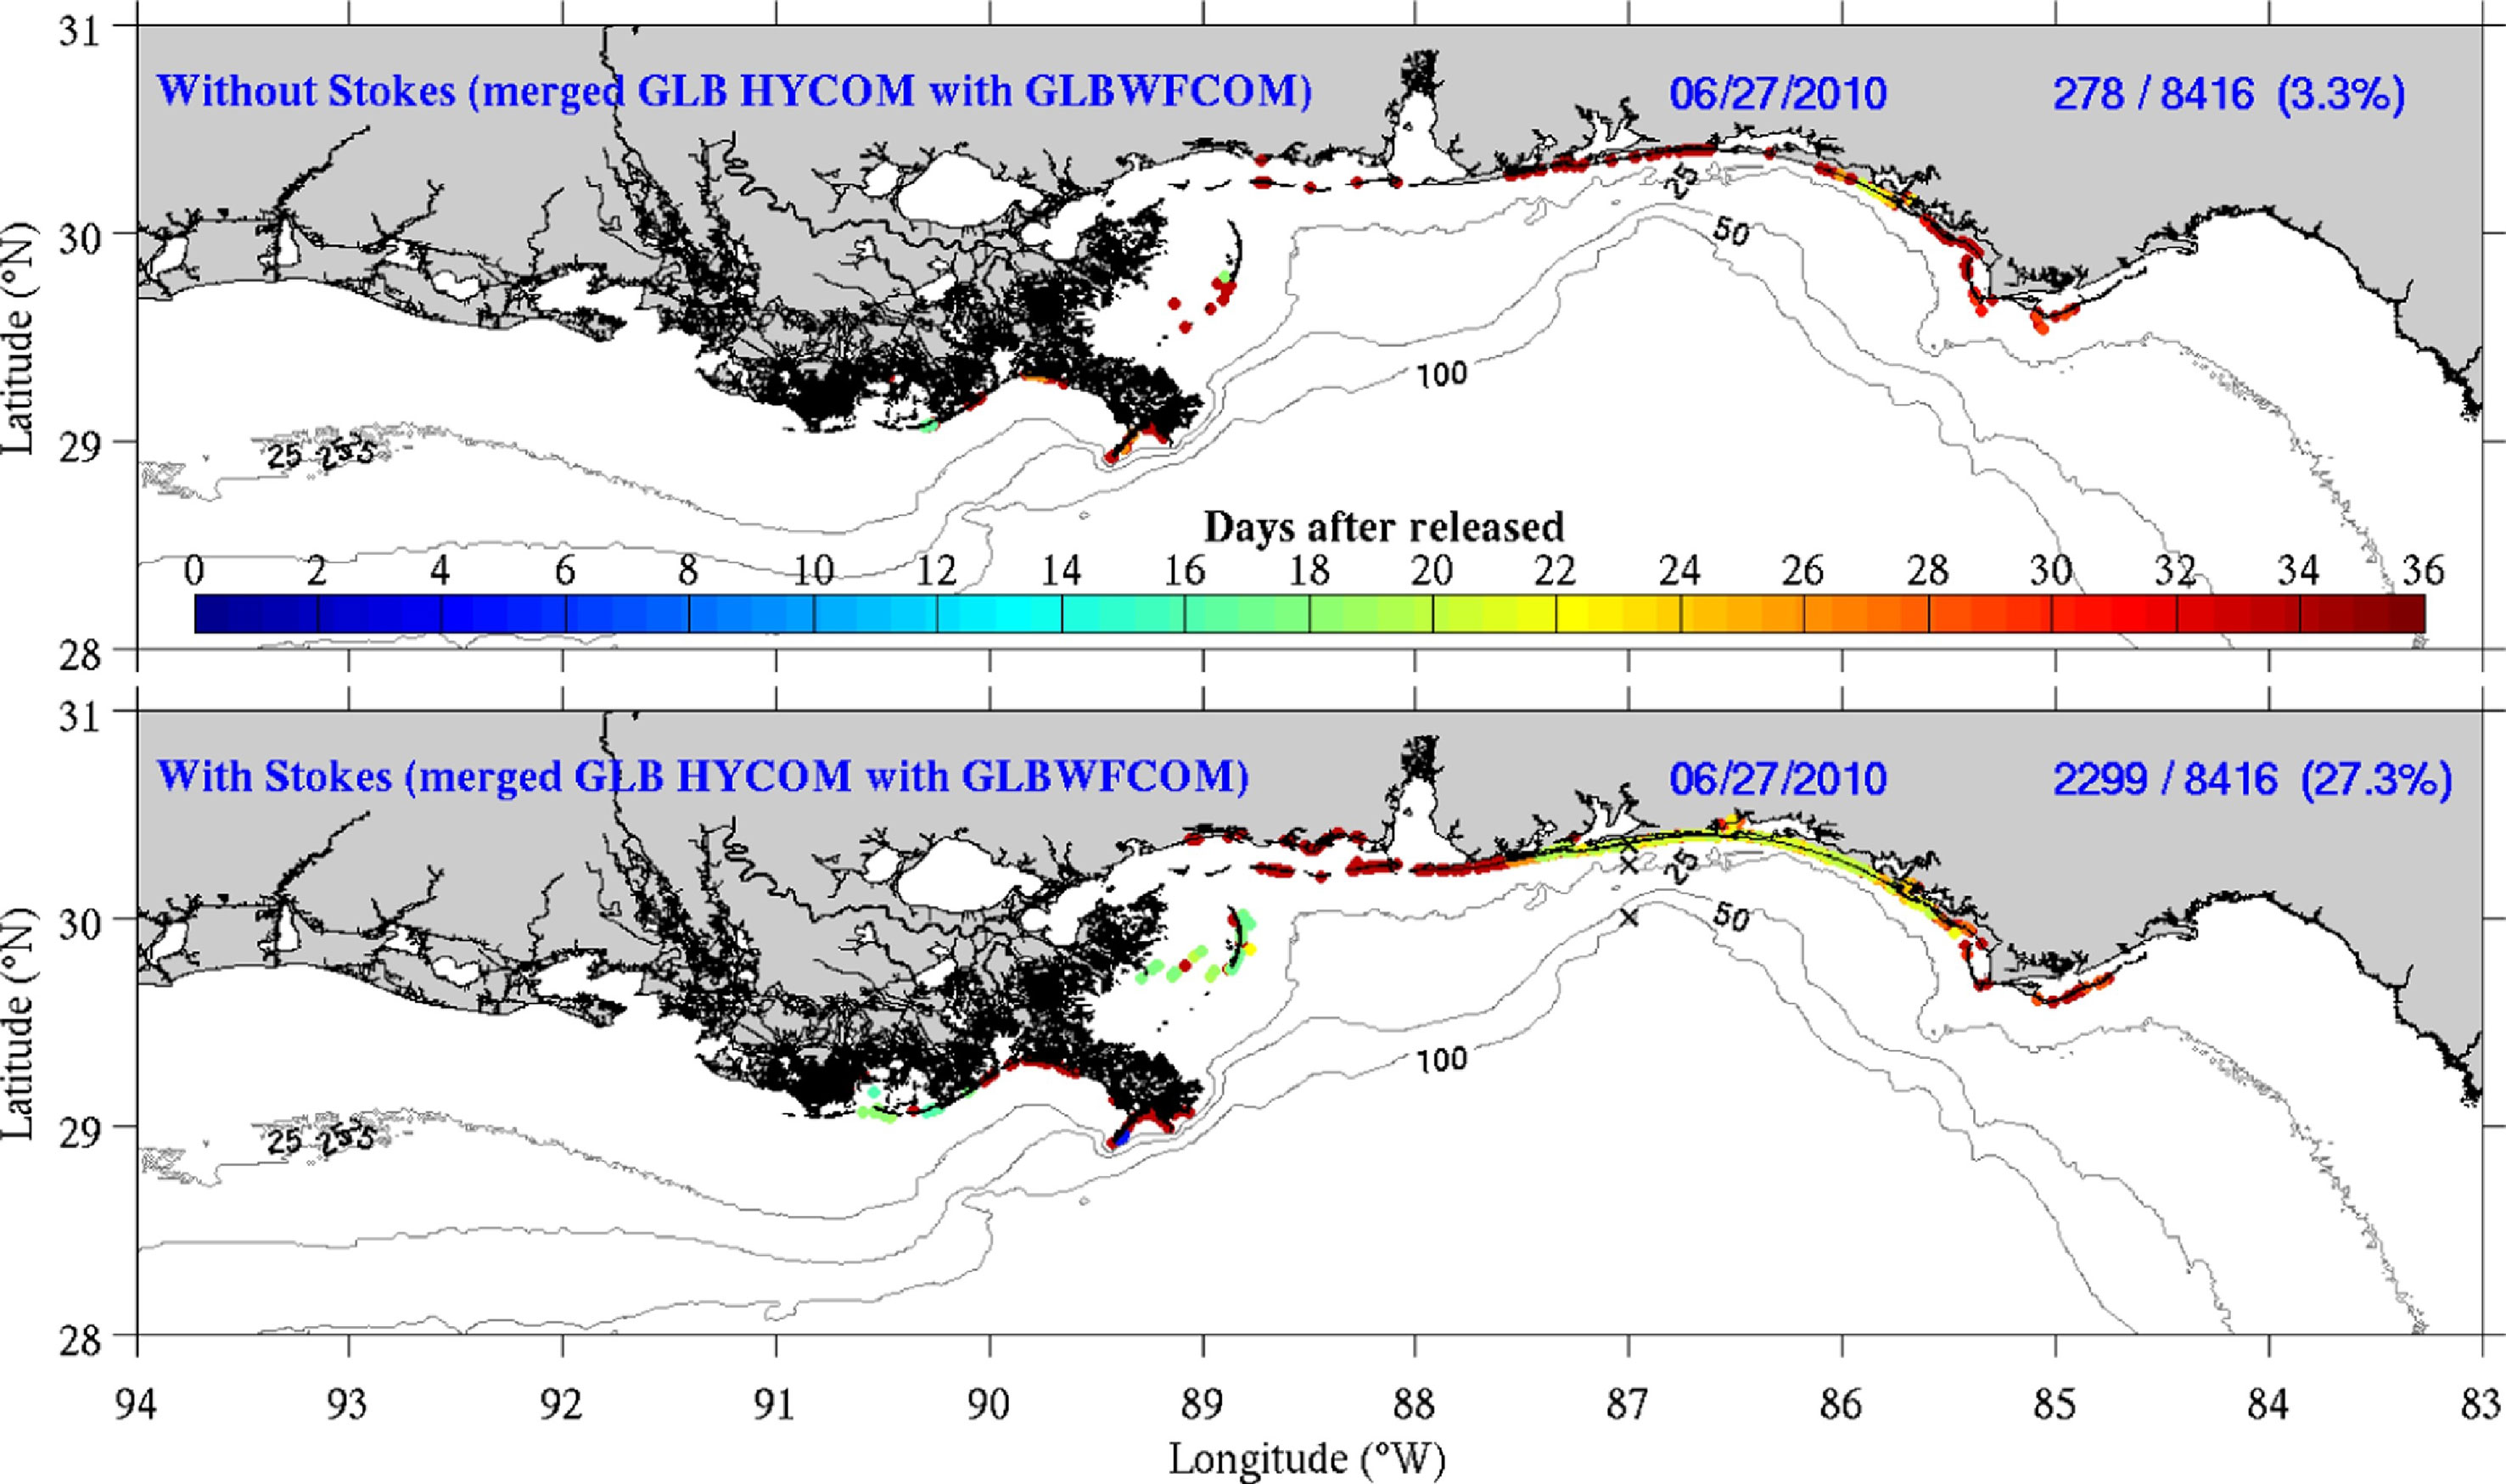
Figure 13 Distribution of beached surface particles and their (color-coded) ages on June 27, 2010 for the case of the Global HYCOM merged with the WFCOM nested in the Global HYCOM, either without (top panel) or with (bottom panel) Stokes drift added. Bathymetric contours are in m. The number of beached particles, relative to the total number (8416) of particles released, and the percent of particles beached are provided in the upper right (from Weisberg et al., 2017).
These authors concluded that the circulation was responsible for transporting the Deepwater Horizon oil to the vicinity of the shoreline, and that the waves, via Stokes drift, were responsible for the actual beaching of the oil. The explanation for the nearshore importance of the Stokes drift is that unlike the currents whose magnitude decreases toward, and whose direction tends to being parallel to, the shoreline, the Stokes drift, which occurs in the direction of wave propagation, may be normal to the shoreline. Thus, suitable models are required to get both the circulation and the waves correct. The HYCOM and merged HYCOM with WFCOM results further showed the importance of both horizontal and vertical resolution. Without horizontal resolution high enough to include an accurate coastline, complete with barrier islands, inlets and estuaries, it is not possible to replicate the observed beaching of oil. Without vertical resolution high enough to approximate how the surface Ekman layer combines with the geostrophic interior, it is necessary to include a wind factor to account for the surface oil not following the wind direction. For the DWH incident, earlier papers by Dietrich et al. (2012) and Le Henaff et al. (2012) provide examples wherein wind factors were applied. The ocean engineering and marine pollution literature also provides examples of both wind factors and Stokes drift inclusion, such as the works by Abascal et al. (2009a); Abascal et al. (2009b), and a study by Curcic et al. (2016) found that the addition of Stokes drift improved the tracking of surface drifters deployed in the northeast Gulf of Mexico during Hurricane Isaac in 2012.
With sufficiently high resolution, both horizontally and vertically, as achievable through downscaling, plus the addition of Stokes drift, it is possible to avoid the use of a wind factor. Downscaling, however, does not negate the necessity for the most accurate deep-ocean circulation, and in this Weisberg et al. (2017) case, the Global HYCOM actually provided better results than the Gulf of Mexico HYCOM. Similarly, observations sufficient for data assimilation and assessing the veracity of the model simulations (deep-ocean and coastal) are necessary.
4 Summary and Conclusions
The coastal ocean, the region where society meets the sea, is driven by a combination of local and deep-ocean forcing. While all governed by the same physics, the responses of different coastal ocean regions to these two forcing agents is highly dependent upon shelf width and other geometrical considerations. Relative to narrow shelves, whose water properties may readily be influenced by both land drainage and the adjacent deep ocean, wide shelves tend to have mid-shelf regions that tend to be insolated from these effects and hence oligotrophic under general conditions. Here we examined the literature discussing the responses of the WFS to both local and deep-ocean forcing. Along with its width, that enables a separation between inner-shelf and outer-shelf regions, the partial closure of the WFS in the south by the Florida Keys chain, whose westernmost islet, the Dry Tortugas, is in close proximity to the Gulf of Mexico Loop Current, results in situations when protracted Loop Current interaction there can set the entire WFS in an upwelling motion. Such occurrence can alter the nutrient state of the WFS resulting in important ecological consequences.
Thus, we examined the physics of the WFS responses to both local wind and Loop Current forcing. For the case of local forcing only, and using a combination of velocity observations and numerical model simulations (shown to be in general agreement with the observations), we defined the inner-shelf in two ways. The first defines the inner-shelf as the region of interacting surface and bottom Ekman layers, where the linkage between these layers is by divergence. Surface convergence/divergence is what causes a sea surface slope, thereby establishing a geostrophic interior flow, which activates the bottom Ekman layer and its divergence/convergence. How these connect determines the offshore extent of the surface slope and hence of the inner-shelf, the dynamical balances of which are evident from the model simulations. The second definition follows from an analysis of the vertically integrated vorticity balance. Two regions emerge, one being the inner-shelf, where bottom pressure torque tends to be balanced by bottom friction torque and the other being the outer-shelf, where bottom pressure torque tends to be balanced by the rate of change of relative vorticity. The WFS is sufficiently wide to discern these two inner-shelf and outer-shelf regions. Such distinctly different balance tendencies explains why the inner-shelf responses appear to be relatively ordered with a well-defined coastal jet at some distance offshore, whereas the outer-shelf responses appear to be more chaotic and eddy-like.
Stratification adds nuance. Both observed and modeled is an asymmetry between the responses to upwelling and downwelling favorable winds, with the upwelling responses being disproportionately larger than the downwelling responses. Explanations are provided through discussion of the across-shelf force balance and through an analysis of the stream-wise vorticity equation. For both upwelling and downwelling responses, isopycnals tend to bend into the sloping bottom across the bottom Ekman layer. As a result, and first from a force balance perspective, the gradient buoyancy force adds constructive with the surface slope-induced pressure gradient force under upwelling, and conversely under downwelling. Next, from a vorticity perspective, the buoyancy torque adds constructively with the tilting of planetary vorticity under upwelling, whereas it tends to add destructive under downwelling. Consequently, there must be larger frictional dissipation within the bottom Ekman layer under upwelling than under downwelling; hence the response asymmetry. Additional momentum balance analyses show that the surface and bottom Ekman layers under stratified conditions may be separate from one another, even in relatively shallow, inner-shelf waters (the analysis shown in Figure 4 is at the 20 m isobath).
The effects of deep-ocean forcing by Loop Current interaction with the west Florida escarpment depend upon where the interaction occurs. North from the Dry Tortugas, referred to as the pressure point, such effects are observed and modeled to be limited to within a baroclinic Rossby radius of deformation from the shelf break, about 30 km for the WFS, in essence the outer-shelf. At the pressure point, such effects are observed and modeled to extend over the entire WFS and even as far north as the Florida Panhandle coast. If such a Loop Current interaction with the pressure point is of protracted duration, then the nutrient state of the WFS may be altered by an infusion of inorganic nutrients upwelled across the shelf break from the upper slope region and advected shoreward, all within the bottom Ekman layer.
Protracted pressure point contact by the Loop Current is shown to have observable ecological consequences, and examples provided include impacts on harmful algae blooms, fisheries recruitment and the advection of harmful substances that, in turn, have their own ecological impacts. These applications help to explain why the WFS exhibits large inter-annual variations in both water properties and biota.
In conclusion, by virtue of its width and geometry relative to geophysical fluid dynamics principles, the WFS provides an excellent natural laboratory for studying continental shelf responses to both local and deep-ocean forcing and their ecological consequences. Much remains to be learned about shelf ecology, why organisms organize spatially and temporally as they do, how to better forecast major red tide blooms, reef fish year class abundance and other matters of societal concern. Achieving such goals requires an increased recognition on the importance of the shelf circulation on shelf ecology, sustaining arrays of interdisciplinary observations and exercising appropriate models.
Data Availability Statement
All of the information presented herein are available in cited refereed professional publications. Historical data from the COMPS program are stored on Research Workspace. Data may be accessed either from the COMPS web page (http://comps.marine.usf.edu:81/?mode=data), or directly from Research Workspace (https://www.researchworkspace.com/project/2692672/folder/2692680/manually-recovered). Time intervals of available data for individual moorings may be found in a table on the COMPS data Page (http://comps.marine.usf.edu:81/?mode=data). Model simulation outputs for WFCOM are available from our THREDDS server (http://ocgbackup.marine.usf.edu:8080/thredds/models.html) and are also shared daily with NOAA GOODS (https://gnome.orr.noaa.gov/goods). WFCOM simulations from January 2015 through the present time may be accessed at (http://ocgbackup.marine.usf.edu:8080/thredds/catalog/WFS_WFCOM_EXT_NF_model/catalog.html), and archives of hourly values from prior times may be obtained from the authors upon request.
Author Contributions
RW and YL collaborate on all presently ongoing research, although some of the topics discussed herein preceded such collaboration. RW wrote the first draft of the manuscript with substantive inputs from YL. Both authors contributed to the article and approved the submitted version.
Funding
This research, spanning several decades, was previously funded by a variety of sources. Present support includes grants from NOAA-IOOS (through SECOORA), NA16NOS0120028, NOAA-ECOHAB (through Mote Marine Laboratory), NA19NOS4780183, NOAA Office of Coast Survey (through COMIT), NA20NOS4000227, the Florida Wildlife Commission-FWRI, PO # B609CF and Agreement # 20035, and NASEM UGOS1, NAS Grant # 2000009918. The NSF XSEDE Program, Contract #: OCE130015, also provides computer time, and some personnel support is through the USF College of Marine Science.
Author Disclaimer
All claims expressed in this article are solely those of the authors and do not necessarily represent those of their affiliated organizations, or those of the publisher, the editors and the reviewers. Any product that may be evaluated in this article, or claim that may be made by its manufacturer, is not guaranteed or endorsed by the publisher.
Conflict of Interest
The authors declare that the research was conducted in the absence of any commercial or financial relationships that could be construed as a potential conflict of interest.
Publisher’s Note
All claims expressed in this article are solely those of the authors and do not necessarily represent those of their affiliated organizations, or those of the publisher, the editors and the reviewers. Any product that may be evaluated in this article, or claim that may be made by its manufacturer, is not guaranteed or endorsed by the publisher.
Acknowledgments
The authors are indebted to various former PhD students whose dissertation work led to some of the findings cited herein. Moored velocity observations by the CMS-USF Ocean Circulation Lab had their origin in 1993 and subsequently expanded to a nearly continuous operation in 1998. Initial successes are owing to Mr. R. Cole the lead seagoing technician at that time followed over the past decade by Mr. J. Law who presently leads that sea-going effort, assisted with engineering expertise by Mr. R. Russell. Data management and computer support are owing to Mr. J. Donovan. We are also indebted to the various community modeling teams who over the years have facilitated the use of expertly developed codes; specifically, the POM, ROMS and FVCOM teams, and most notably Dr. C. Chen, the developer of FVCOM. The entire HYCOM group is also acknowledged. It is only through the sharing of such community models and model simulations that nested model codes such as WFCOM can be run by a broader group of scientists.
References
Abascal A. J., Castanedo S., Medina R., Losada I. J., Alvarez-Fanjul E. (2009a). Application of HF radar currents to oil spill modeling. Mar. Pollut. Bull. 58, 238–248. doi: 10.1016/j.marpolbul.2008.09.020
Abascal A. J., Castanedo S., Mendez F. J., Medina R., Losada I. L. (2009b). Calibration of a Lagrangian transport model using drifting buoys deployed during the Prestige oil spill. J. Coast. Res. 25 (2009), 80–90. doi: 10.2112/07-0849.1
Adamski K. M., Buckel J. A., Martin G. B., Ahrenholz D. W., Hare J. A. (2013). Fertilization dates, pelagic larval durations, and growth in Gag (Mycteroperca Microlepis) from North Carolina, USA. Bull. Mar. Sci. 88, 971–986. doi: 10.5343/bms.2012.1003
Blumberg A. F., Mellor G. L. (1987). “A description of a three-Dimensional coastal ocean circulation model,” in Three-Dimensional Coastal Ocean Models, vol. Vol. 4 . Ed. Heaps N. (Washington, D.C: AGU), 208–233.
Brink K. H. (1998a). Wind-Driven Currents Over the Continental Shelf, in The Sea Vol. 10. Eds. Brink K. H., Robinson A. R. (N.Y: Wiley), 3–20.
Brink K. H. (1998b). Deep-Sea Forcing and Exchange Processes, in The Sea Vol. 10. Eds. Brink K. H., Robinson A. R. (N.Y: Wiley), 21–62.
Casey J. P., Poulakis G. R., Stevens P. W. (2007). Habitat use by juvenile Gag, Mycteroperca Microlepis (Pisces: Serranidae), in subtropical Charlotte Harbor, Florida (USA). Gulf. Caribb. Res. 19, 1–9. doi: 10.18785/gcr.1901.01
Chapman D. C., Brink K. H. (1987). Shelf and slope circulation induced by fluctuating offshore forcing. J. Geophys. Res. 92, 11741–11759. doi: 10.1029/JC092iC11p11741
Chassignet E. P., Hurlburt H. E., Metzger E. J., Smedstad O. M., Cummings J., Halliwell G. R., et al. (2009). U.S. GODAE: Global ocean prediction with the HYbrid Coordinate Ocean Model (HYCOM). Oceanography 22, 48–59. doi: 10.5670/oceanog.2009.39
Chen C. S., Liu H., Beardsley R. C. (2003). An unstructured, finite-volume, three- dimensional, primitive equation ocean model: Application to coastal ocean and estuaries. J. Atmos. Oceanic Technol. 20, 159–186. doi: 10.1175/1520-0426(2003)020<0159:AUGFVT>2.0.CO;2
Clarke A. J., Brink K. H. (1985). The response of stratified, frictional flow of shelf and slope waters to fluctuating large-scale, low frequency wind forcing. J. Phys. Oceanogr. 15, 439–453. doi: 10.1175/1520-0485(1985)015<0439:TROSFF>2.0.CO;2
Clarke A. J., Van Gorder S. (1986). A method for estimating wind-driven frictional, time-dependent, stratified shelf and slope water flow. J. Phys. Oceanogr. 16, 1013–1028. doi: 10.1175/1520-0485(1986)016<1013:AMFEWD>2.0.CO;2
Cooper C. (1987). A numerical modeling study of low-frequency circulation on the West Florida Shelf. Coast. Engin. 11, 29–56. doi: 10.1016/0378-3839(87)90038-X
Cragg J., Mitchum G. T., Sturges W. (1983). Wind-induced sea surface slopes on the West Florida Shelf. J. Phys. Oceanogr. 13, 2201–2212. doi: 10.1175/1520-0485(1983)013<2201:WISSSO>2.0.CO;2
Csanady G. T. (1978). The arrested topographic wave. J. Phys. Oceanogr. 8, 47–62. doi: 10.1175/1520-0485(1978)008<0047:TATW>2.0.CO;2
Curcic M., Chen S. S., Ozgokmen T. M. (2016). Hurricane-induced ocean waves and stokes drift and their impacts on surface transport and dispersion in the Gulf of Mexico. Geophys. Res. Lett. 43, 2773–2781. doi: 10.1002/2015GL067619
Dietrich J. C., Trahana C. J., Howard M. T., Fleming J. G., Weaver R. J., Tanakae D. S., et al. (2012). Surface trajectories of oil transport along the northern coastline of the Gulf of Mexico. Cont. Shelf. Res. 41, 17–47. doi: 10.1016/j.csr.2012.03.015
Dixon L. K., Kirkpatrick G. J., Hall E. R., Nissanka A. (2014). Nitrogen, phosphorus and silica on the West Florida Shelf: Patterns and relationships with Karenia spp. occurrence. Harmf. Algae. 38, 8–19. doi: 10.1016/j.hal.2014.07.001
Dowgiallo M. J. (Ed.) (1994). “Coastal oceanographic effects of the summer 1993 Mississippi River flooding,” in Special NOAA Report. (Silver Spring:Maryland, USA). 77pp.
Ekman V. W. (1905). On the influence of the Earth’s rotation on ocean-currents. Arkiv. Matem. Astr. Fysik. 2, 1–53.
Ezer T., Mellor G.L (1994). Diagnostic and prognostic calculations of the North Atlantic circulation and sea level using a sigma coordinate ocean model. J. Geophys. Research 99(C7), 14159–171. doi: 10.1029/94JC00859
Fan S., Oey L.-Y., Hamilton P. (2004). Assimilation of drifter and satellite data in a model of the northwestern Gulf of Mexico. Cont. Shelf. Res. 24, 1001–1013. doi: 10.1016/j.csr.2004.02.013
Fewings M., Lentz S. J., Fredericks J. (2008). Observations of cross-shelf flow driven by cross-shelf winds on the inner continental shelf. J. Phys. Oceanogr. 38, 2358–2378. doi: 10.1175/2008JPO3990.1
Fitzhugh G. R., Koenig C. C., Coleman F. C., Grimes C. B., Sturges W. (2005). Spatial and temporal patterns in fertilization and settlement of young Gag (Mycteroperca Microlepis) Along the West Florida Shelf. Bull. Mar. Sci. 77, 377–396.
Gilbes F., Tomas C., Walsh J. J., Muller-Karger F. E. (1996). An episodic chlorophyll plume on the West Florida Shelf. Cont. Shelf. Res. 16, 1201–1224. doi: 10.1016/0278-4343(95)00065-8
Gill A. E., Schumann E. H. (1974). The generation of long shelf waves by wind. J. Phys. Oceanogr. 4, 83–90. doi: 10.1175/1520-0485(1974)004<0083:TGOLSW>2.0.CO;2
Hanisak M. D. (2001). Macroalgal blooms in Florida's coastal waters: Codium Isthmocladum (Abstract). J. Phycol. 37, 21.
Heil C. A., Dixon L. K., Hall E., Garrett M., Lenes J. M., O’Neil J. M., et al. (2014). Blooms of Karenia brevis (Davis) G. Hansen & O. Moestrup on the West Florida Shelf: Nutrient sources and potential management strategies based on a multi-year regional study. Harmful Algae 38, 127–140. doi: 10.1016/j.hal.2014.07.016
Heil C. A., Vargo G. A., Spence D. A., Neely M. B., Merkt R., Lester K. M., et al. (2001). “Nutrient stoichiometry of a Gymnodinium Breve bloom: What limits blooms in oligotrophic environments?,” in Harmful Algal blooms 2000. Eds. Hallegraeff G. M., Blackburn S. I., Bolch C. J., Lewis R. J. (Paris: UNESCO), 165–168.
Heppell S. S., Heppell S. A., Coleman F. C., Koenig C. C. (2006). Models to compare management options for a protogynous fish. Ecol. Appl. 16, 238–249. doi: 10.1890/04-1113
Hetland R. D., Hsueh Y., Leben R. R., Niiler P. P. (1999). A Loop Current-induced jet along the edge of the West Florida Shelf. Geophys. Res. Lett. 26, 2239–2242. doi: 10.1029/1999GL900463
He R., Weisberg R. H. (2002). West Florida Shelf circulation and temperature budget for the 1999 spring transition. Cont. Shelf. Res. 22, 719–748. doi: 10.1016/S0278-4343(01)00085-1
He R., Weisberg R. H. (2003). A Loop Current intrusion case study on the West Florida Shelf. J. Phys. Oceanogr. 33, 465–477. doi: 10.1175/1520-0485(2003)033<0465:ALCICS>2.0.CO;2
Hill A. E. (1998). Buoyant Effects in Coastal and Shelf Seas, in The Sea Vol. 10. Eds. Brink K. H., Robinson A. R. (N.Y: Wiley), 21–62.
Hsueh Y., Marmarino G. O., Vansant L. L. (1982). Numerical model studies of the winter storm response of the West Florida Shelf. J. Phys. Oceanogr. 12, 1037–1050. doi: 10.1175/1520-0485(1982)012<1037:NMSOTW>2.0.CO;2
Janowitz G. S., Kamykowski D. (2006). Modeled Karenia brevis accumulation in the vicinity of a coastal nutrient front. Mar. Ecol. Prog. Ser. 314, 49–59. doi: 10.3354/meps314049
Janowitz G. S., Kamykowski D., Liu G. (2008). A three-dimensional wind and behaviorally driven population dynamics model for Karenia brevis. Cont. Shelf. Res. 28 (1), 177–188. doi: 10.1016/j.csr.2007.04.016
Janowitz G. S., Pietrafesa L. J. (1980). A model and observations of time-dependent upwelling over the midshelf and slope. J. Phys. Oceanogr. 10, 1574–1583. doi: 10.1175/1520-0485(1980)010<1574:AMAOOT>2.0.CO;2
Jochens A. E., Nowlin W. D. (1999). “Northeastern Gulf of Mexico Chemical Hydrography and Hydrography Study,” in Annual Report: Year 2, OCS Study MMS 99-0054(New Orleans, La:Department of Interior, United States), 1–123.
Jue N. K. (2006). Exploring the structure of genetic variation and the influences of demography on effective population size in the Gag grouper Mycteroperca Microlepis (Goode & Bean). Jour. Fish. Biol. 69, 217–224. doi: 10.1111/j.1095-8649.2006.01273.x
Kamykowski D., Grabowski K. M., Morrison J. M., McCulloch A. A., Nyadjro E. S., Thomas C. A., et al. (2013). Cold front induced changes on the Florida Panhandle shelf during October 2008. Cont. Shelf. Res. 54, 52–66. doi: 10.1016/j.csr.2012.12.006
Keener P., Johnson G. D., Stender B. W., Brothers E. B., Beatty H. R. (1988). Ingress of postlarval Gag, Mycteroperca Microlepis (Pisces, Serranidae), through a South-Carolina barrier-island Inlet. Bull. Mar. Sci. 42, 376–396.
Kelly K. A., Chapman D. C. (1988). The response of stratified shelf and slope waters to steady offshore forcing. J. Phys. Oceanogr. 18, 906–925. doi: 10.1175/1520-0485(1988)018<0906:TROSSA>2.0.CO;2
Kourafalou V. H., Androulidakis Y. S., Kang H., Smith R. H., Valle-Levinson A. (2018). Physical connectivity between Pulley Ridge and Dry Tortugas coral reefs under the influence of the Loop Current/Florida Current system. Prog. Oceanogr. 165, 75–99. doi: 10.1016/j.pocean.2018.05.004
Le Henaff M., Kourafalou V. H., Paris C. B., Helgers J., Aman Z. M., Hogan P. J., et al. (2012). Surface evolution of the Deepwater Horizon oil spill patch: combined effects of circulation and wind-induced drift. Environ. Sci. Technol. 46, 7267–7273. doi: 10.1021/es301570w
Lenes J. M., Darrow B. P., Cattrall C., Heil C. A., Vargo G. A., Callahan M., et al. (2001). Iron fertilization and Trichodesmium response on the West Florida Shelf. Limnol. Oceanogr. 46, 1261–1277. doi: 10.4319/lo.2001.46.6.1261
Lenes J. M., Darrow B. A., Walsh J. J., Prospero M., He R., Weisberg R. H., et al. (2008). Saharan dust and phosphatic fidelity: A three-dimensional biogeochemical model of Trichodesmium as a nutrient source for red tides on the West Florida Shelf. Cont. Shelf. Res. 28, 1091–1115. doi: 10.1016/j.csr.2008.02.009
Lenes J. M., Heil C. A. (2010). A historical analysis of the potential nutrient supply from the N2 fixing marine cyanobacterium Trichodesmium spp. To Karenia brevis in the eastern Gulf of Mexico. J. Plankt. Res. 32, 1421–1431. doi: 10.1093/plankt/fbq061
Lentz S. (1994). Current dynamics over the northern California inner shelf. J. Phys. Oceanogr. 24, 2461–2478. doi: 10.1175/1520-0485(1994)024<2461:CDOTNC>2.0.CO;2
Lentz S. (1995). Sensitivity of the inner shelf circulation to the form of the eddy viscosity profile. J. Phys. Oceanogr. 25, 19–28. doi: 10.1175/1520-0485(1995)025<0019:SOTISC>2.0.CO;2
Lentz S. J., Trowbridge J. H. (1991). The bottom boundary layer over the northern California shelf. J. Phys. Oceanogr. 21, 1186–1202. doi: 10.1175/1520-0485(1991)021<1186:TBBLOT>2.0.CO;2
Levin P. S., Hay M. E. (2003). Selection of estuarine habitats by juvenile Gags in experimental mesocosms. Trans. Amer. Fish. Soc 132, 76–83. doi: 10.1577/1548-8659(2003)132<0076:SOEHBJ>2.0.CO;2
Liu Y., MacFadyen A., Ji Z.-G., Weisberg R. H. (Eds.) (2011a). “Monitoring and Modeling the Deepwater Horizon Oil Spill: A Record-Breaking Enterprise” Geophys. Monogr. Ser. vol. 195 (Washington, D.C., USA: AGU/geopress), 271 PP. doi: 10.1029/GM195
Liu Y., Weisberg R. H. (2005a). Patterns of ocean current variability on the West Florida Shelf using the Self-Organizing Map. J. Geophys. Res. 110, C06003. doi: 10.1029/2004JC002786
Liu Y., Weisberg R. H. (2005b). Momentum balance diagnoses for the West Florida Shelf. Cont. Shelf. Res. 25, 2054–2074. doi: 10.1016/j.csr.2005.03.004
Liu Y., Weisberg R. H. (2007). Ocean currents and sea surface heights estimated across the West Florida Shelf. J. Phys. Oceanogr. 37, 1697–1713. doi: 10.1175/JPO3083.1
Liu Y., Weisberg R. H. (2012). Seasonal variability on the West Florida Shelf. Progr. Oceanogr. 104, 80–98. doi: 10.1016/j.pocean.2012.06.001
Liu Y., Weisberg R. H., Hu C., Kovach C., Riethmüller R. (2011b). “Evolution of the Loop Current system during the Deepwater Horizon oil spill event as Observed With Drifters and Satellites,” in Monitoring and Modeling the Deepwater Horizon Oil Spill: A Record-Breaking Enterprise, Geophys. Monogr. Ser, vol. 195 (Washington, D.C., USA: AGU/geopress), 91–101. doi: 10.1029/2011GM001127
Liu Y., Weisberg R. H., Lenes J. M., Zheng L., Hubbard K., Walsh J. J. (2016a). Offshore forcing on the West Florida Shelf “Pressure Point” and its upwelling influence on harmful algal blooms. J. Geophys. Res 121, 5501–5515. doi: 10.1002/2016JC011938
Liu Y., Weisberg R. H., Vignudelli S., Mitchum G. T. (2016b). Patterns of the Loop Current system and regions of sea surface height variability in the eastern Gulf of Mexico revealed by the Self-Organizing Maps. J. Geophys. Res. Ocean. 121, 2347–2366. doi: 10.1002/2015JC011493
Li Z., Weisberg R. H. (1999a). West Florida Shelf response to upwelling favorable wind forcing, Part 1: Kinematics. J. Geophys. Res. 104, 13,507–13,527. doi: 10.1029/1999JC900073
Li Z., Weisberg R. H. (1999b). West Florida Shelf response to upwelling favorable wind forcing, Part 2: Dynamics. J. Geophys. Res. 104, 23427–23442. doi: 10.1029/1999JC900205
Lopez M., Clarke A. J. (1989). The wind-driven shelf and slope water flow in terms of a local and a remote response. J. Phys. Oceanogr. 19, 1091–1101. doi: 10.1175/1520-0485(1989)019<1091:TWDSAS>2.0.CO;2
Marancik K. E., Richardson D. E., Lyczkowski-Shultz J., Cowen R. K., Konieczna M. (2012). Spatial and temporal distribution of grouper larvae (Serranidae: Epinephelinae: Epinephelini) in the Gulf of Mexico and Straits of Florida. Fish. Bull. 110, 1–20.
Marmorino G. O. (1982). Wind-forced sea level variability along the West Florida Shelf. J. Phys. Oceanogr. 12, 389–404. doi: 10.1175/1520-0485(1982)012<0389:WFSLVA>2.0.CO;2
Marmorino G. O. (1983). Variability of current, temperature, and bottom pressure across the west Florida continental shelf, winter 1981-1982. J. Geophys. Res. 88, 4439–4457. doi: 10.1029/JC088iC07p04439
McCulloch A. A., Kamykowski D., Morrison J. M., Thomas C. J., Pridgen K. G. (2013). A physical and biological context for Karenia brevis seed populations on the northwest Florida shelf during July 2009. Cont. Shelf. Res. 63, 94–111. doi: 10.1016/j.csr.2013.05.001
Mellor G. L., Yamada T. (1982). Development of a turbulence closure model for geophysical fluid problems. Rev. Geophys. Spac. Phys. 20, 851–875. doi: 10.1029/RG020i004p00851
Mitchum G. T., Clarke A. J. (1986a). The frictional nearshore response to forcing by synoptic scale winds. J. Phys. Oceanogr. 16, 934–946. doi: 10.1175/1520-0485(1986)016<0934:TFNRTF>2.0.CO;2
Mitchum G. T., Clarke A. J. (1986b). Evaluation of frictional wind-forced long waves theory on the West Florida Shelf. J. Phys. Oceanogr. 16, 1029–1037. doi: 10.1175/1520-0485(1986)016<1029:EOFWFL>2.0.CO;2
Mitchum G. T., Sturges W. (1982). Wind-driven currents on the West Florida Shelf. J. Phys. Oceanogr. 12, 1310–1317. doi: 10.1175/1520-0485(1982)012<1310:WDCOTW>2.0.CO;2
Morey S. L., Martin P. J., O’Brien J. J., Walcraft A. A., Zavala-Hidalgo J. (2003). Export pathways for river discharged fresh water in the northern Gulf of Mexico. J. Geophys. Res. 108, C10, 3303. doi: 10.1029/2002JC001674
Murawski S. A., Hogarth W. T., Peebles E. B., Barbeiri L. (2014). Prevalence of external skin lesions and polycyclic aromatic hydrocarbon concentrations in Gulf of Mexico fishes, post-Deepwater Horizon. Trans. Am. Fish. Soc 143 (4), 1084–1097. doi: 10.1080/00028487.2014.911205
Nickerson A., Weisberg R. H., Liu Y. (2022). On the evolution of the Gulf of Mexico Loop Current through its penetrative, ring shedding and retracted states. Adv. Spac. Res 69(11), 4058–4077. doi: 10.1016/j.asr.2022.03.039
Niiler P. P. (1976). Observations of low-frequency currents on the west Florida continental shelf. Mem. Soc R. Sci. Liege. X. 6, 331–358.
Nowlin W. D., Jochens A. E., Howard M. K., DiMarco S. F. (1998). “Nearshore bottom properties over the northeast shelves of the Gulf of Mexico as observed during early May 1998,” in TAMU Oceanography Technical Report No. 98-3-T, vol. 77843. (College station TX: Dept. of Oceanography, Texas A&M university), 60pp.
Nowlin W. D., Jochens A. E., Howard M. K., DiMarco S. F., Schroeder W. W. (2000). Hydrographic properties and inferred circulation over the northeast shelves of the Gulf of Mexico During Spring to Midsummer of 1998. Gulf. Mex. Sci. 18, 40–54. doi: 10.18785/goms.1801.05
O’Neil J. M., Heil C. A. (Eds.) (2014). “Nutrient dynamics of Karenia brevis red tide blooms in the Eastern Gulf of Mexico,” in Harmful Algae, vol. 38 (New York, USA:Elsevier B.V.) 1–140 (special issue).
Ortner P. B., Lee T. N., Milne P. J., Zika R. G., Clarke M. E., Podesta G. P., et al. (1995). Mississippi River flood waters that reached the Gulf Stream. J. Geophys. Res. 100, 13595–13601. doi: 10.1029/95JC01039
Özgökmen T. M., Chassignet E. P., Dawson C. N., Dukhovskoy D., Jacobs G., Ledwell J., et al. (2016). Over what area did the oil and gas spread during the 2010 Deepwater Horizon oil spill? Oceanography 29, 96–107. doi: 10.5670/oceanog.2016.74
Pan C., Jiang M., Dalgleish F. R., Reed J. K. (2017). Modeling the impacts of the Loop Current on circulation and water properties over the Pulley Ridge region on the southwest Florida shelf. Ocean. Modell. 112, 48–64. doi: 10.1016/j.ocemod.2017.02.009
Passow U., Hetland R. D. (2016). What happened to all of the oil? Oceanography 29, 88–95. doi: 10.5670/oceanog.2016.73
Steidinger K. A. (1975). Implications of dinoflagellate life cycles on initiation of Gymnodinium brevis red tides. Environ. Letts. 9, 129–139. doi: 10.1080/00139307509435842
Steidinger K. A., Haddad K. (1981). Biologic and Hydrographic aspects of red tides. Bioscience 31 (11), 814–819. doi: 10.2307/1308678
Switzer T. S., MacDonald T. C., McMichael R. H. Jr., Keenan S. F. (2012). Recruitment of juvenile gags in the eastern Gulf of Mexico and factors contributing to observed spatial and temporal patterns of estuarine occupancy. Trans. Amer. Fish. Soc 141, 707–719. doi: 10.1080/00028487.2012.675913
Tilburg C. E. (2003). Across-shelf transport on a continental shelf: Do across-shelf winds matter? J. Phys. Oceanogr. 33, 2675–2688. doi: 10.1175/1520-0485(2003)033<2675:ATOACS>2.0.CO;2
Toner M., Kirwan A. D., Poje C., Kantha L. H., Muller-Karger F. E., Jones C. K. P. T. (2003). Chlorophyll dispersal by eddy-eddy interactions in the Gulf of Mexico. J. Geophys. Res. 108 (C4), 3105. doi: 10.1029/2002JC001499
Trowbridge J. H., Lentz S. J. (1991). Asymmetric behavior of an oceanic boundary layer above a sloping bottom. J. Phys. Oceanogr. 21, 1171–1185. doi: 10.1175/1520-0485(1991)021<1171:ABOAOB>2.0.CO;2
Vargo G. A., Heil C. A., Fanning K. A., Dixon L. K., Neely M. B., Lester K. (2008). Nutrient availability in support of Karenia brevis blooms on the central West Florida Shelf: What keeps Karenia blooming? Cont. Shelf. Res. 28 (1), 73–98. doi: 10.1016/j.csr.2007.04.008
Walsh J. J., Jolliff J., Darrow B. P., Lenes J. M., Milroy S. P., Remsen D., et al. (2006). Red tides in the Gulf of Mexico: where, when, and why. J. Geophys. Res. 111 (C11003). doi: 10.1029/2004JC002813
Walsh J. J., Weisberg R. H., Dieterle D. A., He R., Darrow D. P., Jolliff J. K., et al. (2003). The phytoplankton response to intrusion of slope water on the West Florida Shelf: Models and observations. J. Geophys. Res. 108 C6, 15. doi: 10.1029/2002JC001406
Walsh J. J., Weisberg R. H., Lenes J. M., Chen F. R., Dieterle D. A., Zheng L., et al. (2009). Isotopic evidence for dead fish maintenance of Florida red tides, with implications for coastal fisheries over both source regions of the West Florida Shelf and Within Downstream Waters of the South Atlantic Bight. Progr. Oceanogr. 80, 51–73. doi: 10.1016/j.pocean.2008.12.005
Weatherly G. L., Thistle D. (1997). On the wintertime currents in the Florida Big Bend region. Cont. Shelf. Res. 17, 1297–1319. doi: 10.1016/S0278-4343(97)00018-6
Weisberg R. H., Barth A., Alvera-Azcárate A., Zheng L. (2009a). A coordinated coastal ocean observing and modeling system for the West Florida shelf. Harmf. Algae. 8, 585–598. doi: 10.1016/j.hal.2008.11.003
Weisberg R. H., Black B., Li Z. (2000). An upwelling case study on Florida’s west coast. J. Geophys. Res. 105, 11459–11469. doi: 10.1029/2000JC900006
Weisberg R. H., He R. (2003). Local and deep ocean forcing contributions to anomalous water Properties on the West Florida Shelf. J. Geophys. Res. 108, C6, 15. doi: 10.1029/2002JC001407
Weisberg R. H., He R., Kirkpatrick G., Muller-Karger F., Walsh J. J. (2004). Coastal ocean circulation influences on remotely sensed optical properties: A West Florida Shelf case study. Oceanogr. (spec. iss. Coast. Ocean. Optic. Dynam.) 17, 68–75. doi: 10.5670/oceanog.2004.49
Weisberg R. H., He R., Liu Y., Virmani J. I. (2005). “West Florida Shelf circulation on synoptic, seasonal, and inter-snnual time scales, In: Circulation in the gulf of Mexico observations and models, Geophys Monogr. Ser, vol. 161 . Eds. Sturges W., Lugo-Fernandez A. (Washington D.C: AGU), 325–347.
Weisberg R. H., Li Z., Muller-Karger F. E. (2001). West Florida Shelf response to local wind forcing: April 1998. J. Geophys. Res. 106 (C12), 31,239–31,262. doi: 10.1029/2000JC000529
Weisberg R. H., Liu Y., Lembke C., Hu C., Hubbard K., Garrett M. (2019). The coastal ocean circulation influence on the 2018 West Florida Shelf K. brevis red tide bloom. J. Geophys. Res. Ocean. 124, 2501–2512. doi: 10.1029/2018JC014887
Weisberg R. H., Liu Y., Mayer D. A. (2009b). West Florida Shelf mean circulation observed with long-term moorings. Geophys. Res. Lett. 36, L19610. doi: 10.1029/2009GL040028
Weisberg R. H., Zheng L., Liu Y. (2016a). West Florida Shelf upwelling: origins and pathways. J. Geophys. Res. - Ocean. 121, 5672–5681. doi: 10.1002/2015JC011384
Weisberg R. H., Zheng L., Liu Y. (2017). On the movement of Deepwater Horizon oil to northern Gulf beaches. Ocean. Modell. 111, 81–97. doi: 10.1016/j.ocemod.2017.02.002
Weisberg R. H., Zheng L., Liu Y., Corcoran A., Lembke C., Hu C., et al. (2016b). Karenia brevis blooms on the West Florida Shelf: A comparative study of the robust 2012 Bloom and the nearly null 2013 event. Cont. Shelf. Res. 120, 106–121. doi: 10.1016/j.csr.2016.03.011
Weisberg R. H., Zheng L., Liu Y., Lembke C., Lenes J. M., Walsh J. J. (2014a). Why a red tide was not observed on the west Florida continental shelf in 2010. Harmf. Algae. 38, 119–126. doi: 10.1016/j.hal.2014.04.010
Weisberg R. H., Zheng L., Liu Y., Murawski S., Hu C., Paul J. (2016c). Did Deepwater Horizonhydrocarbons transit to the west Florida continental shelf? Deep-Sea. Res. Part II. 129, 259–272. doi: 10.1016/j.dsr2.2014.02.002
Weisberg R. H., Zheng L., Peebles E. (2014b). Gag grouper larvae pathways on the West Florida Shelf. Cont. Shelf. Res. 88, 11–23. doi: 10.1016/j.csr.2014.06.003
Keywords: inner-shelf, outer-shelf, local forcing, deep-ocean forcing, ecological impacts, coastal upwelling, West Florida shelf
Citation: Weisberg RH and Liu Y (2022) Local And Deep-Ocean Forcing Effects on the West Florida Continental Shelf Circulation and Ecology. Front. Mar. Sci. 9:863227. doi: 10.3389/fmars.2022.863227
Received: 26 January 2022; Accepted: 29 April 2022;
Published: 17 June 2022.
Edited by:
William Savidge, University of Georgia, United StatesReviewed by:
Veronica Ruiz Xomchuk, Florida Atlantic University, United StatesJeffrey W. Book, United States Naval Research Laboratory, United States
Copyright © 2022 Weisberg and Liu. This is an open-access article distributed under the terms of the Creative Commons Attribution License (CC BY). The use, distribution or reproduction in other forums is permitted, provided the original author(s) and the copyright owner(s) are credited and that the original publication in this journal is cited, in accordance with accepted academic practice. No use, distribution or reproduction is permitted which does not comply with these terms.
*Correspondence: Robert H. Weisberg, d2Vpc2JlcmdAdXNmLmVkdQ==