 Chengwei Liang
 Yufei Zhang1
 Xiaowen Zhang
 Dong Xu
 Naihao Ye
- 1College of Marine Science and Biological Engineering, Qingdao University of Science and Technology, Qingdao, China
- 2Yellow Sea Fisheries Research Institute, Chinese Academy of Fishery Sciences, Qingdao, China,
- 3Laboratory for Marine Fisheries and Aquaculture, Qingdao National Laboratory for Marine Science and Technology, Qingdao, China
The rise of dissolution of anthropogenic CO2 into the ocean alters marine carbonate chemistry and then results in ocean acidification (OA). It has been observed that OA induced different effects on different microalgae. In this study, we explored the physiological and biochemical changes in Nannochloropsis oceanica in response to increased atmospheric carbon dioxide and tested the effect of ocean acidification (OA) on the food web through animal feeding experiments at a laboratory scale. We found that the levels of C, N, C/N, Fv/Fm, and photosynthetic carbon fixation rate of algae cells were increased under high carbon dioxide concentration. Under short-term acidification, soluble carbohydrate, protein, and proportion of unsaturated fatty acids in cells were significantly increased. Under long-term acidification, the proportion of polyunsaturated fatty acids (PUFAs) (~33.83%) increased compared with that in control (~30.89%), but total protein decreased significantly compared with the control. Transcriptome and metabonomics analysis showed that the differential expression of genes in some metabolic pathways was not significant in short-term acidification, but most genes in the Calvin cycle were significantly downregulated. Under long-term acidification, the Calvin cycle, fatty acid biosynthesis, TAG synthesis, and nitrogen assimilation pathways were significantly downregulated, but the fatty acid β-oxidation pathway was significantly upregulated. Metabolome results showed that under long-term acidification, the levels of some amino acids increased significantly, while carbohydrates decreased, and the proportion of PUFAs increased. The rotifer Brachionus plicatilis grew slowly when fed on N. oceanica grown under short and long-term acidification conditions, and fatty acid profile analysis indicated that eicosapentaenoic acid (EPA) levels increased significantly under long-term acidification in both N. oceanica (~9.48%) and its consumer B. Plicatilis (~27.67%). It can be seen that N. oceanica formed a specific adaptation mechanism to OA by regulating carbon and nitrogen metabolism, and at the same time caused changes of cellular metabolic components. Although PUFAs were increased, they still had adverse effects on downstream consumers.
1 Introduction
Anthropogenic emissions of carbon dioxide (CO2) have steadily increased the global partial pressure of CO2 (pCO2) from 280 ppm in pre-industrial times to around 400 ppm at present, with the level predicted to reach 1,000 ppm by 2100 (IPCC, 2013). The accelerated rise of CO2 concentration in the atmosphere also accelerates the absorption of CO2 by the ocean, which leads to a decrease of the pH value in seawater and the formation of ocean acidification (OA) (Caldeira and Wickett, 2003; Hopkins et al., 2020). The pH of the surface ocean has dropped by ~0.1 since pre-industrial times and will drop by ~0.4 by the end of this century (Gattuso et al., 2015), which may directly or indirectly affect marine life (Hurd et al., 2018). Marine microalgae are a key link in the marine ecosystem because they are responsible for more than 50% of global primary carbon production (Field et al., 1998; Falkowski, 2012). During OA, changes in the carbon chemistry of the water trigger regulatory changes at the physiological, biochemical, and molecular levels, as well as in the evolution, of microalgae (Jin et al., 2013; Li et al., 2014; Jin et al., 2015). The effects of OA on microalgae may be diverse: positive, negative, and even neutral (Gao and Campbell, 2014). For example, elevated pCO2 reflects the light-dependent downregulation of carbon-concentrating mechanisms in Phaeodactylum tricornutum, thus energy saved from carbon-concentrating downregulation is used to enhance the growth of diatoms (Li et al., 2014). P. tricornutum grown for about 80 generations at 1,000 ppm CO2 had an increased growth rate compared with that growth at 390 ppm (Li et al., 2014). At elevated CO2 concentrations, the growth and photosynthesis of Skeletonema costatum, Chaetoceros debilis, and Fragilariopsis kerguelensis are inhibited (Chen and Gao, 2004a; Chen and Gao 2004b; Trimborn et al., 2017). Long-term conditioning to elevated pCO2 influences the fatty and amino acid compositions of the diatom Cylindrotheca fusiformis (Bermúdez et al., 2015). Previous studies have shown that increased CO2 concentration could significantly promote the utilization efficiency of inorganic carbon in Nannochloropsis cells and may increase the eicosapentaenoic acid (EPA) levels in algae cells (Hu and Gao, 2003). The biomass and lipid content of Nannochloropsis oculate increase as CO2 concentration increases (Chiu et al., 2009; Razzak et al., 2015). Our previous studies have also shown that elevated pCO2 could increase the growth and photosynthetic efficiency of microalgae and change the contents of total protein and soluble carbohydrates, as well as the compositions of fatty acid and amino acids (Liang et al., 2020a; Liang et al., 2020b; Liang et al., 2020c).
Studies have shown that most of the genes involved in glycolysis, the TCA cycle, and oxidative phosphorylation in polar chlorophyte Coccomyxa subellipsoidea C169 were significantly upregulated under elevated pCO2 concentrations. In addition, the significant downregulation of fatty acid degradation genes and the upregulation of fatty acid synthesis genes may be one of the causes of fat accumulation (Peng et al., 2016). The physiological responses of the psychrophilic sea ice diatom Nitzschia lecointei to long-term adaptation (194 d, ~60 asexual generations) in high pCO2 levels were different in growth rate and total fatty acid content from the short-term physiological responses to increased pCO2 (Torstensson et al., 2015).
Because some metabolites such as essential fatty acids (FAs) play an important role in growth, development, and in the reproductive success in heterotrophs (Müler-Navarra et al., 2004; Glencross, 2009). However, they cannot be synthesized de novo by heterotrophic organisms and have to be acquired through the diet. Rossoll et al. (2012) showed that elevated pCO2 affected the FA composition of the diatom that constrained the growth performance of copepods as consumers. In addition, OA-induced effects on metabolic of primary producers may influence the nutrient transfer efficiency (Cripps et al., 2016). However, the consequences of OA in food web interactions remain poorly understood, because OA-induced effects on the food quality of primary producers is different among different phytoplankton species and natural fluctuations in pCO2 (Jin et al., 2020).
N. oceanica is a unicellular alga of the class Eustigmatophyceae found in the marine environment. Based on its rapid growth, oil productivities and high contents of proteins, N. oceanica is widely used as a feed and dietary supplement for aquaculture. Previous studies on the acidification of N. oceanica only focused on the accumulation of lipid (Chiu et al., 2009; Razzak et al., 2015; Ma et al., 2016), but ignored the physiological and biochemical responses of N. oceanica to the increased dissolved inorganic carbon, as well as the changes in the main metabolic pathways under acidification conditions, and the impacts on consumers. In this study, the physiological and biochemical response of N. oceanica to a short-term (7 days) acidification and its adaptive evolution to long-term (1,460 days) acidification were studied on a laboratory scale, and the impact of the changes on the food chain during the process of OA was analyzed. Our study will provide more evidence on the effect of OA on the microalga N. oceanica and associated food webs.
2 Materials and Methods
2.1 N. Oceanica Strains and Culture Conditions
The N. oceanica IMET1 strain was maintained at the Yellow Sea Fisheries Research Institute, Microalgae Culture Centre, Chinese Academy of Fishery Sciences. N. oceanica was semi-continuously cultured at ambient (400 ppm CO2, pHNBS 8.16, LC) and the near-future elevated pCO2 concentration predicted for the end of this century (1,000 ppm CO2, pHNBS 7.86, HC) gradients for 1,460 days (about 1,368 generations) in f/2 medium (Guillard & Ryther, 1962), respectively. We used the indoor air as a control, which might be slightly higher than a CO2 concentration of 400 ppm. The cultures were diluted with fresh sterilized f/2 medium every 6 days to maintain a cell concentration below 1.0 × 10⁶ cells mL−1 and to maintain a steady carbonate system. Chemical carbonate system parameters were measured by 848 Titrino plus automatic titrator (Metrohm, Riverview, FL, USA) and calculated using the CO2 SYS Package in the MS Excel based on pH, temperature, CO2 concentration, salinity, and total alkalinity (Table 1) (Pierrot et al., 2006). The preservation conditions were cultured in 100 mL conical flasks containing 75 mL f/2 medium in a CO2 plant growth chamber (GXZ, Ruihua, Wuhan, China), in which the CO2 concentration was continuously monitored and maintained at 400 ± 20 ppm or 1000 ± 40 ppm, at 100 μmol photons·m−2·s−1, in 20 ± 0.1°C and a 12 h light/12 h dark photoperiod cycle.
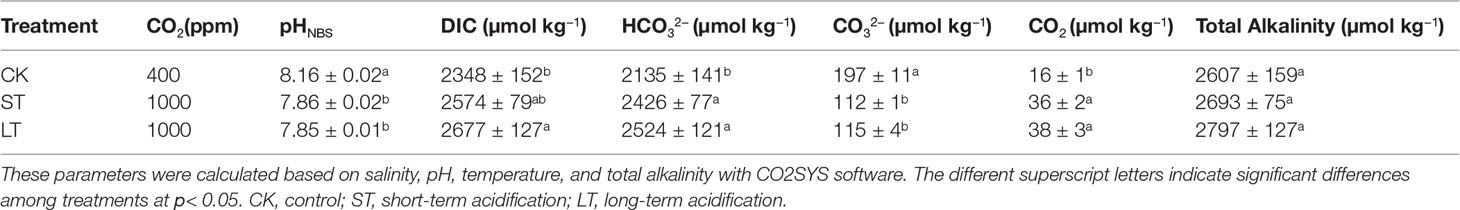
Table 1 Parameters of the seawater carbonate system under CK, ST and LT treatments.
2.2 Experimental Treatments
In this assay, the algal cells grown at 400 ppm and 1,000 ppm were cultured to logarithmic phase and the initial optical density (OD, 680 nm) (Das et al., 2011) of two algal solutions were diluted to 0.02 by using an ultraviolet spectrophotometer (UV-2000, UNICO, Suzhou, China). For the control (CK), algal cells were cultured in 400 ppm CO2 with bubbling of LC; for short-term acidification (ST), algal cells were cultured at 400 ppm CO2 and transferred to 1,000 ppm CO2 for continuous bubbling of HC; for long-term acidification (LT), algal cells in 1,000 ppm CO2 were inoculated and cultured with bubbling of HC. The initial cell concentrations of the three treatments were (2.15 ± 0.02) × 105 cells mL−1 (CK), (2.12 ± 0.05) × 105 cells mL−1 (ST), and (2.24 ± 0.10) × 105 cells mL−1 (LT). The conditions of aeration were processed according to the method described by (Zhang et al., 2021). Algal cells were harvested by centrifugation (5804R, Eppendorf, Hamburg, Germany) at 6,000× g for 5 min at specific times and washed twice with distilled water to remove the effects of impurities and salts (Rocha et al., 2003). For each of the three cultures for each treatment three sample replicates were taken, with the culture conditions the same as before.
2.3 Measurement of Cell Growth and Carbon Biofixation Rate
Algal cell density was measured by using a combination of spectrophotometry and hemocytometry every other day. For each of the three cultures for each treatment three sample replicates were taken. Each sample was diluted to an OD680 value between 0.1 to 1.0 if the OD of the algal solution was greater than 1.0. For the measurement of cell dry weight (g L−1), each 50 mL sample was centrifuged at 6,000 × g for 5 min to remove the supernatant and then washed twice with distilled water to remove excess salts. Then it was transferred to a dried and weighed tin foil square box, dried in the oven at 60°C for 24 h, and the change in cell dry weight was determined.
We measured the OD680 value, cell concentration, and dry weight of every sample according to the methods described by Tang et al. (2011) and Das et al. (2011). Linear regression was used to obtain the relationship between cell dry weight and OD (Figure S1), and the relationship between cell concentration and OD (Figure S2).
Specific growth rate μ (d−1) was calculated as follows:
where Cf and Co were the final and initial cell concentrations (cells mL−1), respectively, and Δt was the cultivation time in days (Liang et al., 2020c).Biomass productivity P (g L−1 d−1) was calculated from the following equation:
where X1 and X0 were the biomass concentration (g L−1) on days t1 and t0, respectively (Morais and Costa, 2007).
The carbon dioxide biofixation rate RCO2 (g L−1 d−1) was calculated using the following equation:
where CC was the carbon content of microalgal cells (%, w/w), MCO2 was the relative molecular mass of carbon dioxide, MC was the relative molecular mass of carbon, and P was the biomass productivity (g L−1 d−1) (Morais and Costa, 2007; Tang et al., 2011).
2.4 Measurement of Chlorophyll Fluorescence
The maximum quantum yield of photosystem (PS) II (Fv/Fm) was measured by Maxi-Imaging-PAM (Walz, Effeltrich, Germany). The algal solutions and parameter settings before measurement of chlorophyll fluorescence referred to Zhang et al. (2021). The maximum quantum yield (Fv/Fm) was calculated from the following equation:
where Fv was the variable fluorescence calculated from Fv = Fm - Fo, Fm was the maximum fluorescence yield produced by a saturated light pulse in the chlorophyll fluorescence induction curve, and Fo was the minimal fluorescence of microalgae after dark adaptation (Genty et al., 1989).
2.5 Determination of Carbon and Nitrogen Content
To draw a calibration curve, 40, 50, 60, 70, and 80 mg glutamic acid were weighed in a stainless-steel crucible, and the total carbon and total nitrogen of the samples were measured by using an element analyzer (Vario Max CN, Elementar, Langenselbold, Germany). Subsequently, a suitable amount of algal powder (50.0~50.1 mg) was weighed in a stainless-steel crucible and the total carbon and total nitrogen of the sample were determined by the element analyzer. The carrier gas pressure was He: 0.38 MPa, O2: 0.25 MPa. The temperatures of the combustion tube, secondary combustion tube, and reduction tube were 900°C, 900°C, and 830°C, respectively.
2.6 Determination of Total Soluble Carbohydrate and Protein Content
The total soluble carbohydrate was determined from 0.1 g dry algal powder in distilled water at 95~100°C for 10 min using anthrone colorimetry (Liu et al., 1973). Total soluble protein content was measured by the bicinchoninic acid assay (BCA) using 0.1 g dry algal powder (Smith et al., 1985). The above biochemical compositions were determined by assay kits (Jiancheng, Nanjing, China).
2.7 Determination of Fatty Acid Composition
Methanol containing 2% H2SO4 (5 mL) was added in 10 mL flasks containing approximately 5~10 mg dry algal powder and incubated for 1 h at 70°C. Then 2 mL of hexane and 0.75 mL of distilled water were added after the flasks cooled to room temperature and mixed for 30 s on a vortex mixer. Extraction of fatty acid methyl esters (FAMEs) referred to a previous study by Liu et al. (2015). FAMEs analyses were carried out by using an Agilent 7890 gas chromatography (GC) instrument equipped with a flame-ionization detector and a DB-23 capillary column (Agilent Technologies, Santa Clara, CA, USA, 30 m × 0.32 mm × 0.25 μm). The injector temperature was 270°C with a split ratio of 10:1. The temperature-rise program was as described previously (Meng et al., 2015).
2.8 Determination of Algal Cell Surface pH
The pH of the algal cell surface was determined by using an algal solution in logarithmic phase. The treatment of the algal solution, fluorophore loading, and fluorescence ratio-pH calibration curve were based on a study described previously (Golda-VanEeckhoutte et al., 2018). Algal cells were harvested during the mid-logarithmic phase and concentrated by centrifugation at 12,000 g for 3 min, washed twice with PBS buffer solution, and resuspended in sterile PBS buffer. The washed algal cells were loaded with fluorophore by adding 3 μL of 1 mM 5-(and-6)-carboxy seminaphtharhodafluor (SNARF)-1 dissolved in anhydrous dimethyl sulfoxide (DMSO; ≥ 99.9%), together with 3 μL of 5% solution of the Pluronic F-127 dissolved in DSMO. The fluorophores were loaded into the cells by passive diffusion during an incubation period of 30~40 min. For the blank treatment, the procedure of fluorophore loading was the same as before (including adding Pluronic F-127) but avoiding the addition of the SNARF fluorescent probes. After incubation, the algal cells were centrifuged at 12,000× g for 3 min, washed twice as described above, and resuspended in PBS buffer for the measurement of fluorescence emission. Fluorescence emission was measured at two wavelengths: 585 nm (F1) and 630 nm (F2). The 520 nm was set as the optimal excitation wavelength for the fluorescence detection of SNARF in all subsequent measurements by spectrofluorometry (F-4600, Hitachi, Tokyo, Japan). The pH was calculated by using a calibration curve of the quotient (defined as R) of F1 divided by F2 at different PBS buffer pH levels in triplicate samples as follows:
To establish the calibration curve, the fluorescently labeled cells were killed by adding 7.25 μL 6.7 mM nigericin dissolved in absolute ethanol and incubated for 10 min. Subsequently, PBS buffers with different pH gradients (5.88, 6.26, 6.57, 6.86, 7.16, 7.47, and 8.01) were added and resuspended.
2.9 RNA Extraction and Illumina Sequencing
After cultivation for 7 days, CK, ST, and LT cells were centrifuged at 12,000 g for 5 min in 4°C, respectively. The samples were frozen in liquid nitrogen and then stored at -80°C immediately. Total RNAs were extracted and purified from frozen N. oceanica cells with an RNA extraction kit (Omega, Norcross,GA, USA) according to the manufacturer’s protocol. RNA purity was checked by using a NanoPhotometer Spectrophotometer (Implen, CA, USA). RNA concentration was measured by using a Qubit 3.0 Fluorometer (Life Technologies, CA, USA). RNA integrity was assessed by using a Bioanalyzer 2100 system RNA Nano 6000 Assay Kit (Agilent Technologies, CA, USA). RNA purification, library construction, and RNA-seq were performed by the Annoroad Gene Technology Co., Ltd. (Beijing, China).
Briefly, a library for each sample was generated from 3 μg of RNA and then sequenced using Illumina NovaSeq 6000. To obtain the high-quality data used in the analysis, raw reads were first subjected to preliminary processing by using custom Perl scripts to remove reads that contained adapter sequences, poly-N sequences (greater than 5%), low quality reads, and reads with lengths of less than 30 bp. The filtered clean reads were mapped to an N. oceanica reference genome (https://genome.jgi.doe.gov/portal/, JGI Project Id: 1143084) using HISAT2 v2.1.0 (Kim et al., 2015). The read counts of each gene in each sample were counted by HTSeq v0.6.0, and fragments per kilobase million mapped reads (FPKM) were used for gene expression level quantification (Trapnell et al., 2010). DESeq2 was used to estimate the expression level of each gene per sample by using linear regression and then the p value was calculated with the Wald test (Wang et al., 2010). Finally, the p value was corrected by the Benjamini and Hochberg method to obtain the q value. Genes with q< 0.05 and |log2(Fold Change)| > 1.0 were identified as differentially expressed genes (DEGs).
2.10 Function Enrichment Analysis
The Gene Ontology (GO, http://geneontology.org/) enrichment of DEGs was implemented by the hypergeometric test, in which the p value was calculated and adjusted as a q value, and data background was genes in the whole genome. GO terms with q< 0.05 were considered to be significantly enriched. GO enrichment analysis could exhibit the biological functions of the DEGs. Kyoto Encyclopedia of Genes and Genomes (KEGG, http://www.kegg.jp/) was a database resource containing a collection of manually drawn pathway maps representing our knowledge on the molecular interaction and reaction networks. The KEGG enrichment of DEGs was implemented by the hypergeometric test, in which the p value was adjusted by multiple comparisons as the q value. KEGG terms with q< 0.05 were considered to be significantly enriched.
2.11 Metabolite Extraction
Each sample was ground with liquid nitrogen, 100 mg was weighed and then added to 200 μL pre-cooled water and 800 μL pre-cooled methanol/acetonitrile (1:1, v/v). It was mixed thoroughly, sonicated in an ice bath for 60 min, and then incubated at -20°C for 1 h to precipitate proteins. After centrifugation at 16,000 × g for 20 min at 4°C, the supernatant was collected and then evaporated in a high-speed vacuum concentration centrifuge. For mass spectrometry detection, 100 μL of acetonitrile/water solution (1:1, v/v) was added to the sample for redissolution, it was centrifuged at 14,000 × g for 15 min in 4°C, and the supernatant was removed for analysis.
2.12 LC-MS/MS Analysis
Metabolite profiling was conducted using an LC-MS/MS ultra-performance liquid chromatography (UPLC) system (Agilent 1290 Infinity LC; MS/MS, Triple-TOF 5600+, AB SCIEX). Chromatographic separation was performed on an ACQUITY UPLC BEH Amide column (2.1 mm × 100 mm × 1.7 μm; Waters) using mobile phase A (water + 25 mM ammonium acetate + 25 mM ammonia) and mobile phase B (acetonitrile). The gradient elution procedure was as follows: 0–0.5 min, 95% B; 0.5–7 min, B changed linearly from 95% to 65%; 7–9 min, B changed linearly from 65% to 40%; 9–10 min, B maintained at 40%; 10–11.1 min, B changed linearly from 40% to 95%; 11.1–16 min, B maintained at 95%. The column temperature was set to 25°C and the flow rate was maintained at 0.3 mL min−1. QC samples were inserted into the sample queue to monitor and evaluate the stability of the system and the reliability of the experimental data.
Mass data acquisition was performed in electrospray ionization (ESI) positive and negative mode using the following parameters: ion source gas1 (Gas1) of 60 psi; ion source gas2 (Gas2) of 60 psi; curtain gas (CUR) of 30 psi; source temperature of 600°C; ion spray voltage floating of ± 5.5 kV; TOF MS scan m/z range: 60–1200 Da, product ion scan m/z range: 25–1,200 Da, TOF MS scan accumulation time 0.15 s/spectra, product ion scan accumulation time 0.03 s/spectra; information-dependent acquisition (IDA) was used for secondary mass spectrometry and adopted high sensitivity mode; declustering potential of ± 60 V; collision energy of 30 eV. IDA settings were as follows: exclude isotopes within 4 Da, candidate ions to monitor per cycle: 6.
2.13 Identification of Significantly Different Metabolites
The original data were formatted, and the XCMS program in MSDIAL software was used for peak alignment, retention time correction, and extraction peak area. The structures of metabolites were identified by using accurate mass number matching (< 25 ppm) and secondary spectrum matching methods to search public databases such as HMDB, MassBank, and a self-built metabolite standard library. For the extracted data, the ion peaks with missing values of more than 50% were deleted, the positive and negative ion peaks were integrated, and the software SIMCA-P 14.1 (Umetrics, Umea, Sweden) was used for pattern recognition. After these data were preprocessed by Pareto scaling, multidimensional statistical analysis was carried out, including unsupervised principal component analysis (PCA), partial least squares-discriminant analysis (PLS-DA), and orthogonal projections for latent structures-discriminant analysis (OPLS-DA). Differential metabolites were filtered according to |log2(fold change)| > 1 and p value< 0.05. Metabolites with the variable importance for the projection (VIP) > 1 and p value< 0.05 were identified as significantly different metabolites (SDMs). Metabolites were identified by the Shanghai Bioprofile Technology Co., Ltd. (Shanghai, China).
2.14 Feeding Experiments
The rotifer Brachionus plicatilis was provided by Institute of Oceanology, Chinese Academy of Sciences. For the RC, rotifers were fed with CK in a plant growth chamber (400 ppm). For the RS and RL, rotifers were fed with ST and LT in a plant growth chamber (1,000 ppm), respectively. These culture parameters were the same as the previous algal culture conditions. The initial inoculation concentration of rotifers was 8 rot mL−1 and was cultured in a 1 L glass beaker. On the 0, 2, 4, 5, and 6 days, the same concentration of the algal solution was fed to keep the bait concentration at 2.5 × 10⁹ cells L−1, and the concentration of rotifers was measured by a hemocytometer. On day 7, the rotifers were collected with a 200-mesh (74 μm) filter and washed twice with distilled water to remove algal fragments and salts. Then, the rotifers were dried in an oven at 60°C for 24 h. The dried rotifers were ground with liquid nitrogen to obtain a powder and stored at -80°C. The fatty acid composition of rotifers was measured as described previously. For each of the three cultures for each treatment three sample replicates were taken.
2.15 Statistical Analysis
One-way analysis of variance (ANOVA) with the least significant difference post hoc test and the t-test were used to analyze the significant differences among different treatments. The Spearman’s method was used to analyze the correlation coefficients among replicated treatments, and the correlation coefficients among SDMs were calculated based on the Pearson’s method (Hauke and Kossowski, 2011). R (3.5.3), and Adobe Illustrator CS6 was used to draw and modify graphics. Significant differences were assumed to be p< 0.05.
3 Results
3.1 Cell Growth, Photosynthesis, and Carbon Dioxide Biofixation Rate in Response to Elevated pCO2
The cell growth of N. oceanica was affected significantly under elevated pCO2, as shown in Figure 1. Under the three conditions, cells all entered the logarithmic growth phase from the 2nd day and reached the highest cell concentration (CK, 5.03 × 10⁷ cells mL−1; ST, 5.88 × 10⁷ cells mL−1; LT, 6.64 × 10⁷ cells mL−1) around the 8th day to enter the stationary phase. According to equation (1), we calculated the growth rate of N. oceanica based on the cell density on the 2nd day and the 8th day: CK, 0.67275 ± 0.01725 d−1; ST, 0.71645 ± 0.01075 d−1(p =0.015); LT, 0.7169 ± 0.0188 d−1 (p =0.012). The results showed the growth of cells under ST and LT increased significantly compared with CK. ST and LT increased the Fv/Fm significantly (p< 0.05), whereas the CK had the lowest Fv/Fm value (Figure 2A). Moreover, high CO2 conditions significantly increased the CO2 biofixation rate compared with ambient conditions (Figure 2B). Briefly, consistent with other studies, we found that OA could enhance photosynthesis and CO2 biofixation, promoting the growth of N. oceanica.
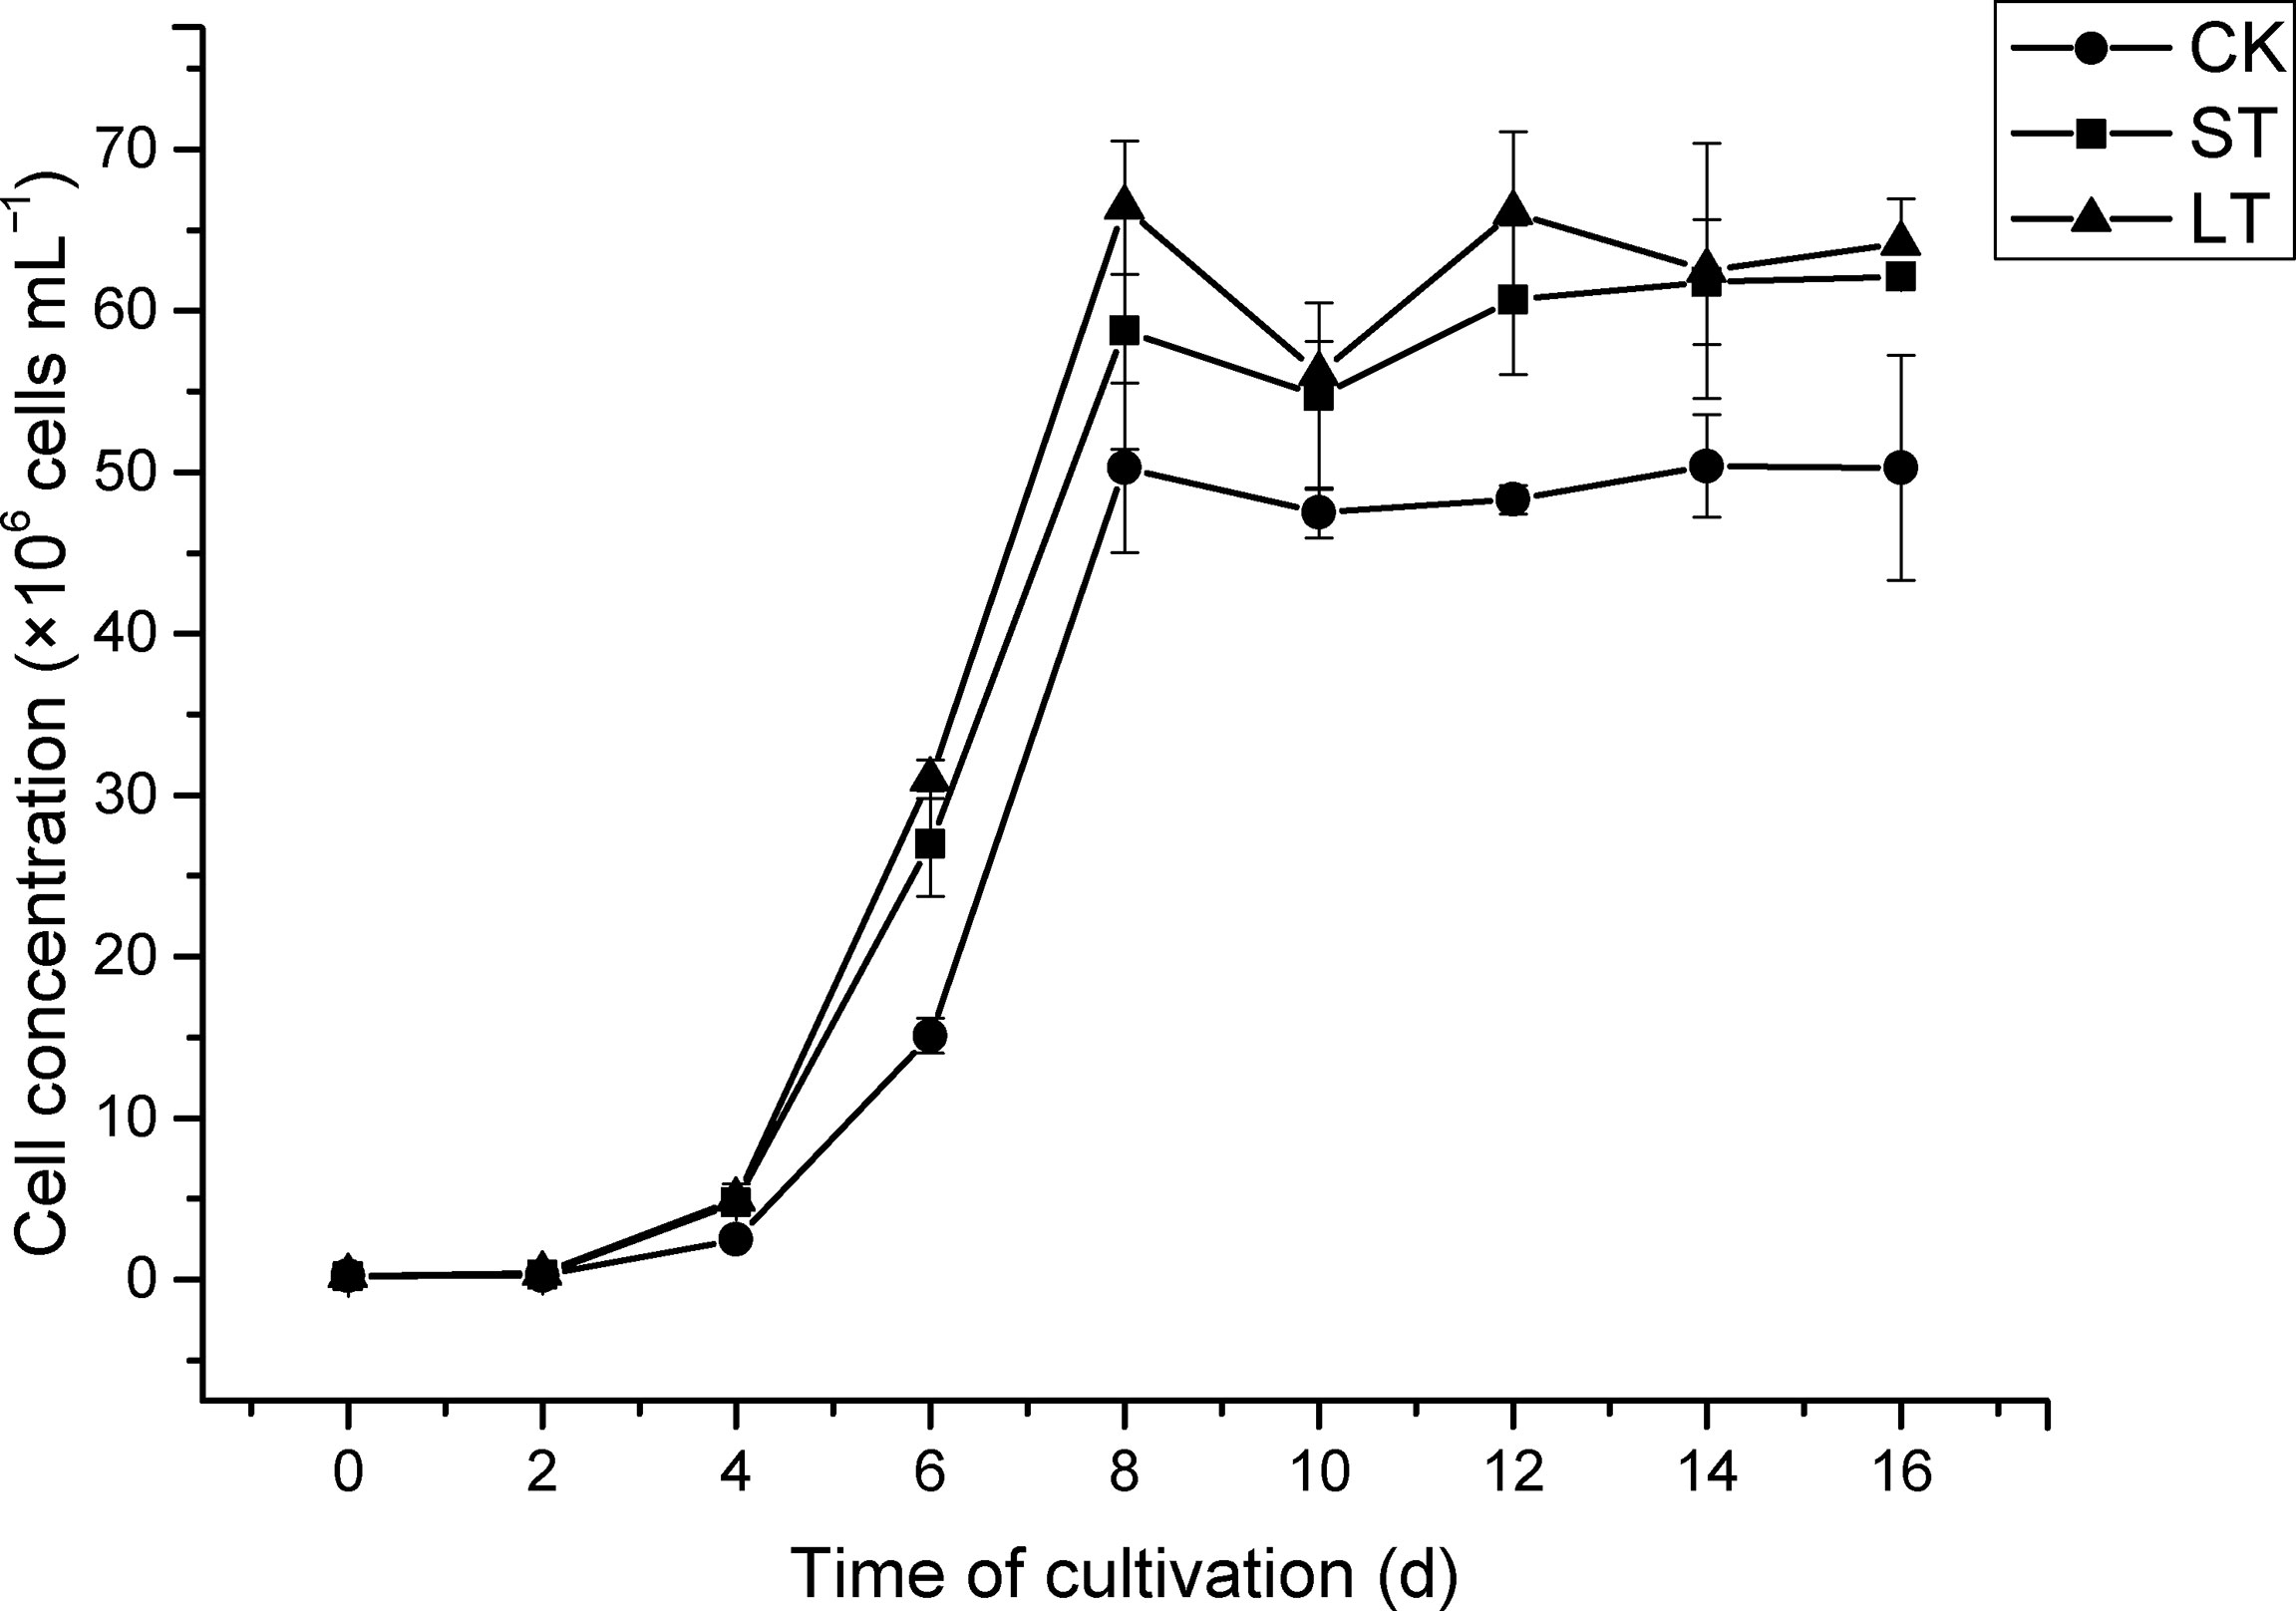
Figure 1 The growth curve of N. oceanica cultivated at different cultivated conditions. The error bars represent the standard deviation (SD), n = 3.
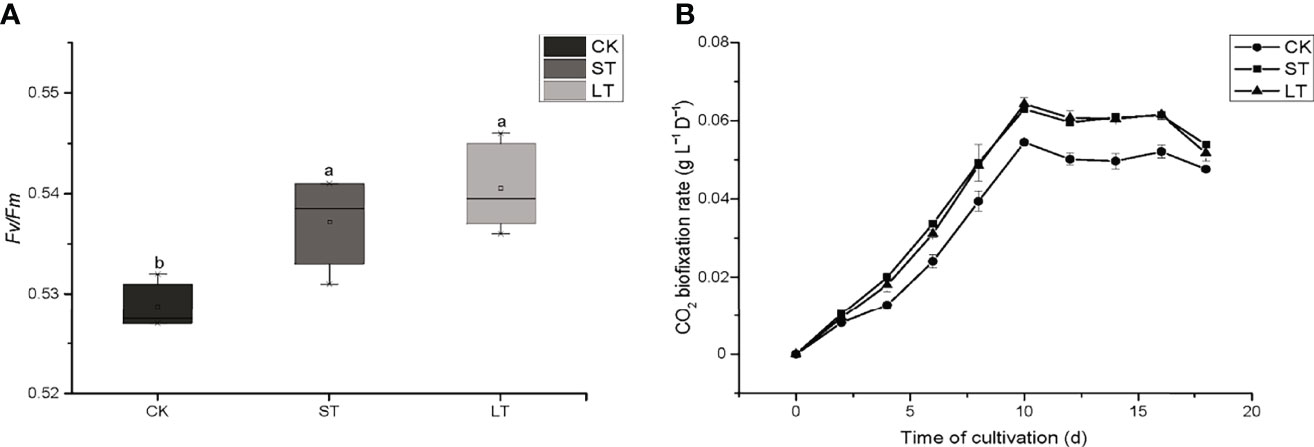
Figure 2 The Fv/Fm (A) and CO2 biofixation rate (B) of N. oceanica when subjected to different treatment conditions. The error bars represent the standard deviation (SD), n = 3. Different letters represent significant differences at p< 0.05. CK, control; ST, short-term acidification; LT, long-term acidification.
3.2 Biochemical Composition in Response to Elevated pCO2
As shown in Table 2, the cells of ST and LT both significantly increased contents of total carbon and total nitrogen as well as the ratio of C/N when compared with CK. This indicated that high CO2 concentration enhanced the contents of carbon and nitrogen to maintain rapid cell growth. The long-term elevated pCO2 adaptation significantly decreased the total protein content, while the short-term elevated pCO2 acclimation significantly increased the total soluble carbohydrate content when compared with the ambient conditions (Table 2).
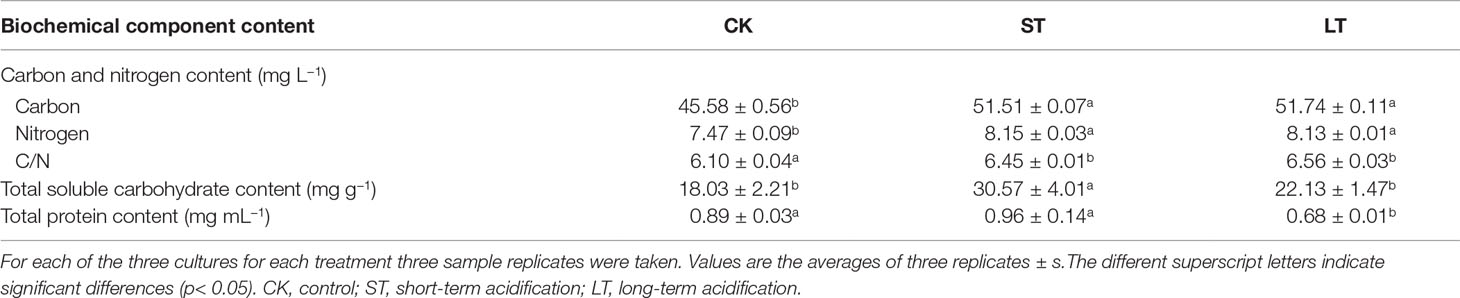
Table 2 Biochemical components of N. oceanica when subjected to different treatments.
The fatty acid profiles of N. oceanica grown under CK, ST, and LT conditions were detected by GC-MS. The proportion of unsaturated fatty acids (USFAs) were CK: 62.75 ± 3.17%; ST: 66.27 ± 0.87%; LT: 65.17 ± 0.50%, which were all above 60% (Table 3). This result is line in with previous study that N. oceanica was a type of microalga that is rich in USFAs (Sharma & Schenk, 2015), and was important to nutrient transfer in the marine food chain. Under the three conditions, the major fatty acid components of N. oceanica were C16 and C20 (> 87.86%). C14:0, C16:1n7, and C20:5n3 were significantly increased under elevated pCO2 conditions, whereas C16:0 and C18:1n9 were significantly reduced (Table 3). Intriguingly, high CO2 conditions significantly decreased the proportion of saturated fatty acids (SFAs) but increased the proportion of unsaturated fatty acids (Table 3).
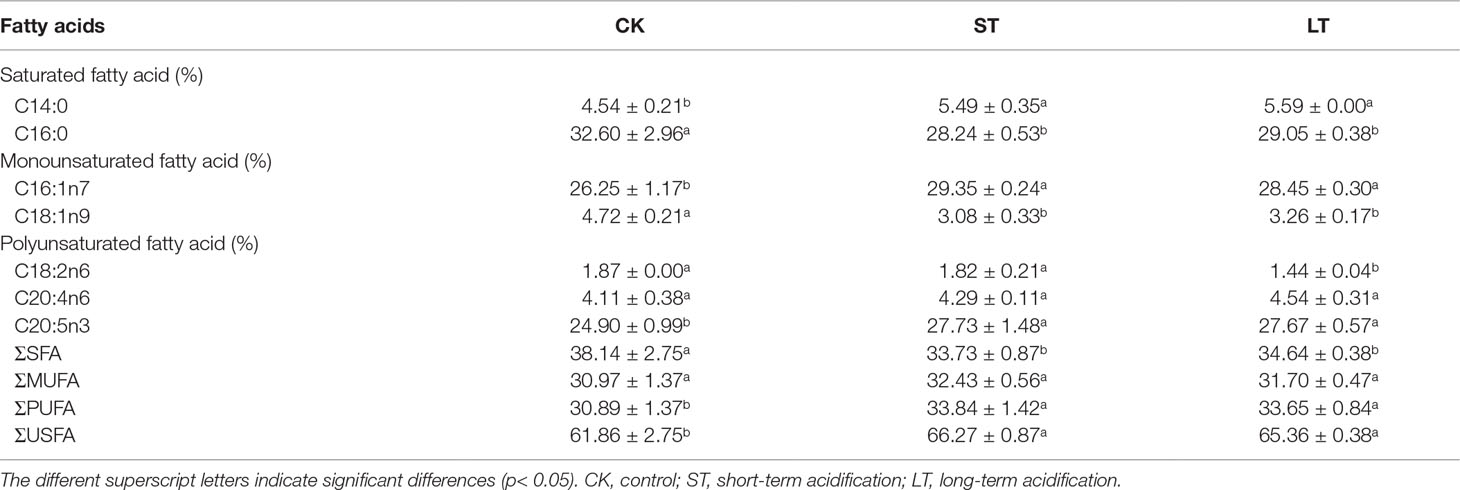
Table 3 Fatty acid composition (%) of N. oceanica when subjected to different treatments.
3.3 Algal Cell Surface pH in Response to Elevated pCO2
According to the pH calibration curve using the fluorescence ratio (Figure S3), the cell surface pH of the three conditions were CK, 8.14 ± 0.01; ST, 7.83 ± 0.16; and LT, 7.84 ± 0.44. It was speculated that the carbonate system and pH of seawater were changed by OA. To adapt to changes in the environment, the surface pH of algal cells also changed, leading to significant changes in physiology and biochemistry.
3.4 Construction and Functional Analysis of the Transcriptome Library in Response to Elevated pCO2
About 43.24~48.21 million raw reads were obtained in N. oceanica through the Illumina NovaSeq 6000 sequencing platform (Table 4). Subsequently, raw reads were filtered with the Trimmomatic ver. 0.32 (Bolger et al., 2014), resulting in over 41.12 million clean reads. In all nine N. oceanica libraries, more than 91.33% of the sequence quality scores were higher than Q30 (Figure S4), indicating that the libraries had high quality clean reads. Therefore, more than 36.27 million clean reads were compared to the reference genome, and the rate of matching ranged from 85.72 to 87.34% (Table 4). From FPKM calculations of the three types of libraries, 9332, 9356, and 9338 genes were obtained in CK, ST, and LT, respectively (Table 4).
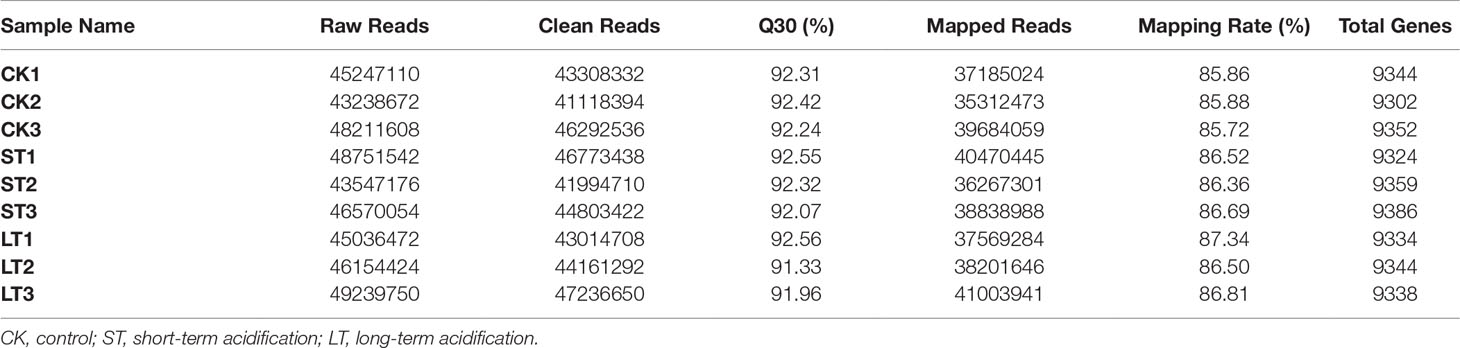
Table 4 Summary statistics of the transcriptome of N. oceanica when subjected to different treatments.
3.5 Analysis of Gene Expression Patterns in Response to Elevated pCO2
With the filter criteria of |log2(fold change)| > 1 and q< 0.05, 1692 DEGs were identified in LT when compared to the CK, of which 868 and 824 genes were upregulated and downregulated, respectively (Figure 3A). Likewise, 495 DEGs were identified in ST compared to the CK, of which 363 and 132 genes were upregulated and downregulated, respectively (Figure 3A). As shown in the volcano plots (Figure S5), the fold-change of upregulated and downregulated DEGs were the same in LT vs. CK, but the fold-change of upregulated DEGs were more than that of downregulated DEGs in ST vs. CK. In the relationships between different DEG groups displayed as a Venn diagram, there were 357 overlapping DEGs between LT vs. CK and ST vs. CK, 670 overlapping DEGs between LT vs. CK and LT vs. ST, and 141 overlapping DEGs between LT vs. ST and ST vs. CK, and the three groups of overlapping DEGs were 93 (Figure 3B). To compare the transcriptomes of the different conditions, a heat map was generated to show the transcript abundance of all DEGs. Hierarchical clustering analysis of DEGs showed that the expression patterns of the LT were highly distinct from those under normal conditions, whereas the expression patterns of the ST were similar to normal (Figure 3C). This result indicated that long-term elevated pCO2 adaptation had a dramatic effect on gene expression, but short-term elevated pCO2 acclimation was not particularly obvious.
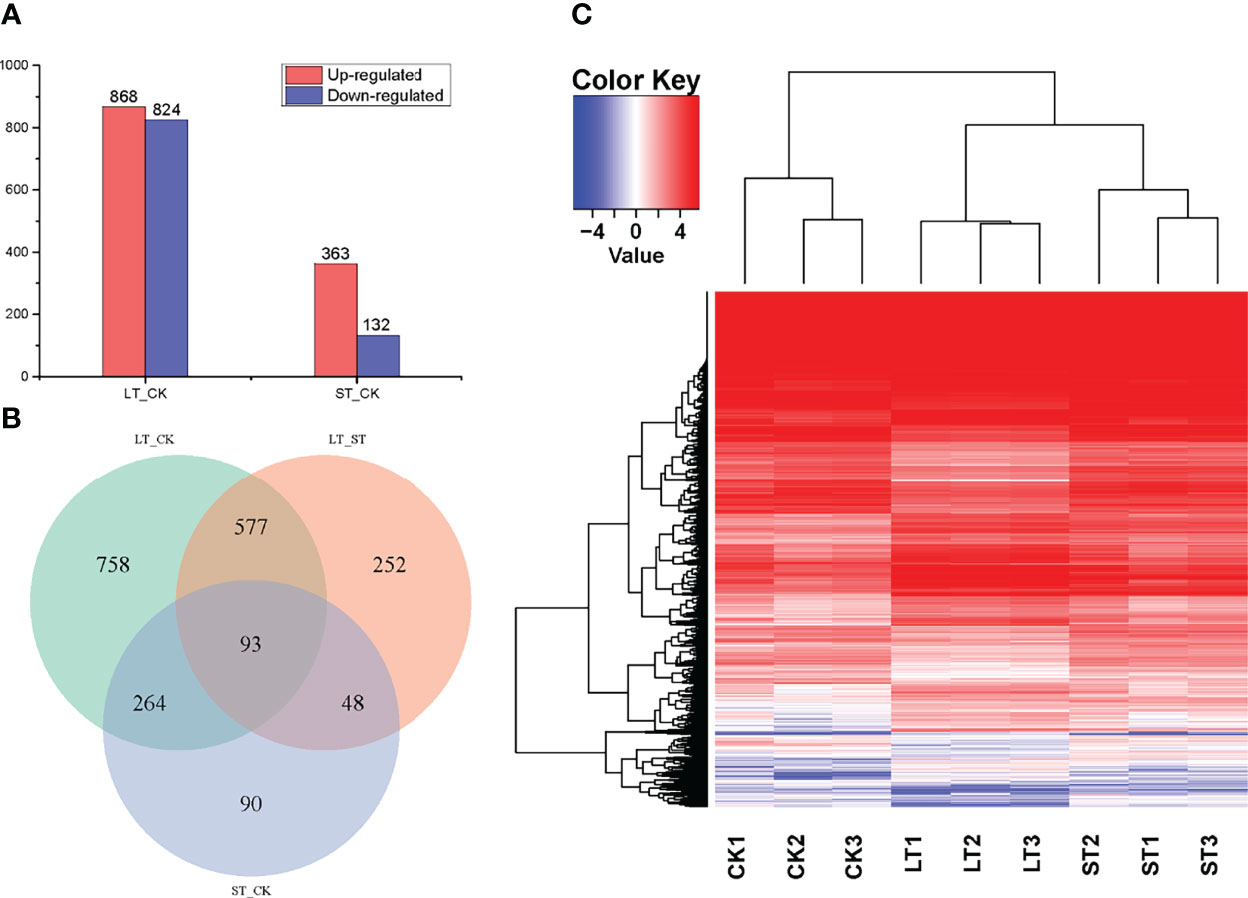
Figure 3 Statistics and analysis of differentially expressed genes (DEGs) among the different treatments. (A) The number of DEGs between the different treatments. (B) Venn diagram shows the overlapping DEGs among of LT vs. CK, LT vs. ST, and ST vs. CK. (C) Heat map analysis of the DEGs among the different treatments; red represents upregulated, and blue represents downregulated. CK, control; ST, short-term acidification; LT, long-term acidification.
3.6 Functional Analysis of Differential Expressed Genes in Response to Elevated pCO2
As shown in Figure 4, GO analysis was conducted for the DEGs of LT vs. CK and ST vs. CK, and all DEGs were classified into cellular components, biological processes, and molecular function. GO analysis of these DEGs showed enrichment of six major cellular components, including membrane, macromolecular complex, organelle, organelle part, membrane part, and cell part. In biological processes, DEGs were enriched in metabolic process, cellular process, response to stimulus, localization, biological regulation, and cellular component organization or biogenesis. In molecular function, most of the DEGs were enriched in three categories including catalytic activity, transporter activity, and binding (Figure 4). KEGG pathway enrichment analysis revealed that these DEGs were mainly enriched in C- and N-related metabolic pathways (Figure 5). In the bubble chart of KEGG enrichment, DEGs were enriched in glycolysis/gluconeogenesis, fatty acid metabolism, fatty acid biosynthesis, carbon metabolism, carbon fixation in photosynthesis organisms, and biosynthesis of amino acid in the LT vs. CK (Figure 5A), and enriched in carbon metabolism, carbon fixation in photosynthetic organisms, and biosynthesis of amino acid in the ST vs. CK (Figure 5B). It could be hypothesized that these metabolic pathways were involved in the response of N. oceanica to OA and promoted its growth.
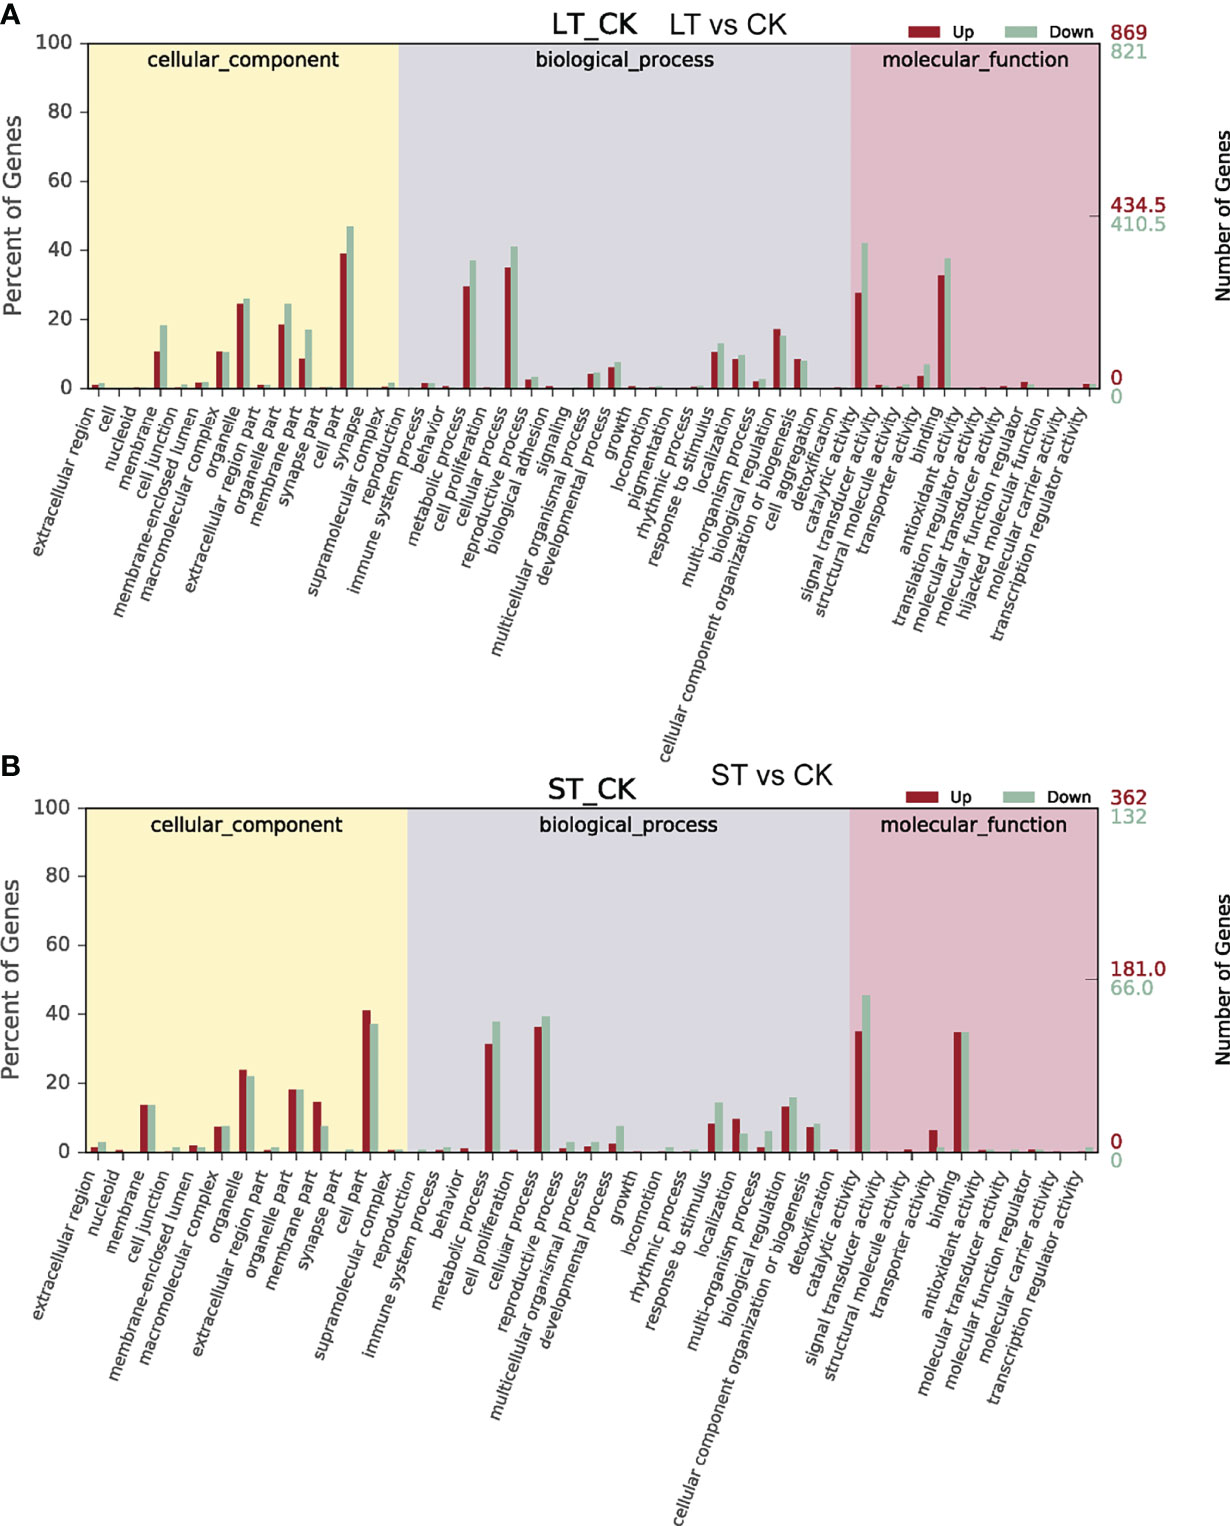
Figure 4 Gene Ontology (GO) functional classification of differentially expressed genes (DEGs). (A) GO functional classification of DEGs in the LT vs CK. (B) GO functional classification of DEGs in the ST vs CK. CK, control; ST, short-term acidification; LT, long-term acidification.
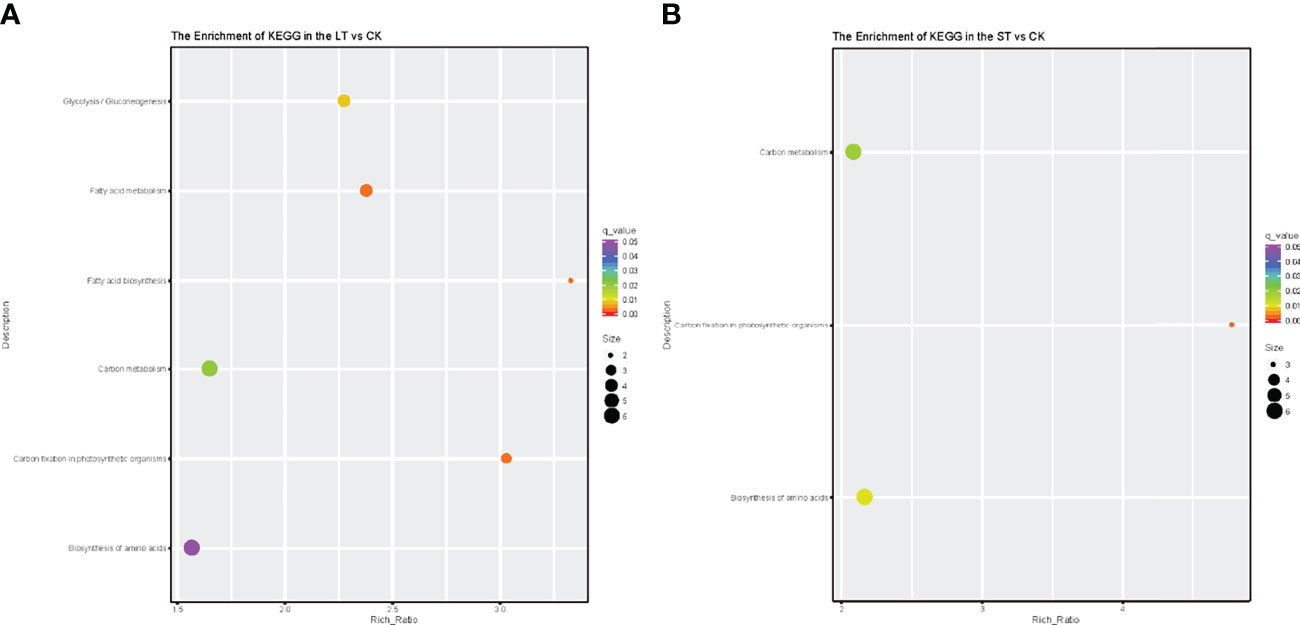
Figure 5 Kyoto Encyclopedia of Genes and Genomes pathway enrichment of differentially expressed genes (DEGs) in the LT vs. CK (A) and ST vs. CK (B). Number of DEGs was represented by the size of the circle. CK, control; ST, short-term acidification; LT, long-term acidification.
3.7 Metabolomic Analysis in Response to Elevated pCO2
As shown in Figure 6A, in the unsupervised PCA analysis, the R2X value of PCA was 0.366, indicating that there were significant differences between the LT, ST, and CK groups. PLS-DA analysis showed that R2 and Q2 values were both close to 1.0, indicating that the model was very stable and effective (Figure 6B). In addition, OPLS-DA (modified PLS-DA) was used to clarify the metabolic patterns among different groups. To assist the screening of marker metabolites, VIP was calculated to measure the impact intensity and explanatory ability of each metabolite expression pattern on the classification discrimination of each group of samples (VIP > 1.0). In the LT vs. ST vs. CK, the parameters of the OPLS-DA model were R2X = 0.395, R2Y = 0.994, and Q2 = 0.754, the above data showed that the model was reliable and stable (Figure 6C). After 200 permutations, the R2 and Q2 intercepts of LT vs. ST vs. CK were 0.936 and −0.237. The intercept values of Q2 in both groups were less than 0.05, indicating a low risk of overfitting and the reliability of the model (Figure 6D).

Figure 6 Derived principal component analysis (PCA) score plot, partial least squares-discriminant analysis (PLS-DA) score plot, orthogonal projections for latent structures (OPLS-DA) score plot, and permutation test plot of OPLS-DA from the UPLC-Q-TOF-MS metabolite profiles. (A) PCA score plot of metabolite profiles from the LT, ST, and CK. (B) PLS-DA score plot in the LT vs. ST vs. CK. (C) OPLS-DA score plot in the LT vs. ST vs. CK. (D) Permutation test plot of OPLS-DA in the LT vs ST vs. CK. CK control; ST, short-term acidification; LT, long-term acidification.
With the filter criteria of |log2(fold change)| > 1 and p< 0.05, the differential metabolites were presented by the volcano plots, and it was found that the metabolites of N. oceanica under OA conditions were significantly different from those under normal culture conditions. In the LT vs CK, upregulated and downregulated metabolites accounted for a half, while in the ST vs. CK, most of the metabolites were downregulated (Figure S6). The SDMs were used to mine the VIP obtained from the OPLS-DA model with biological significance. In the LT vs. CK and ST vs. CK, 321 and 303 SDMs were identified, and the hierarchical clustering analysis of these SDMs showed that the metabolic patterns of LT, ST, and CK were highly different (Figures S7, S8). Subsequently, Pearson’s correlation was used to obtain the correlation coefficients between different groups of SDMs and display them in a matrix heatmap (Figures S9, S10). In addition, 14 out of 321 SDMs in the LT vs. CK and 9 out of 303 SDMs in the ST vs. CK were selected to analyze the changes in C- and N-related metabolic pathways combined with transcriptome, physiological, and biochemical data (Table 5).
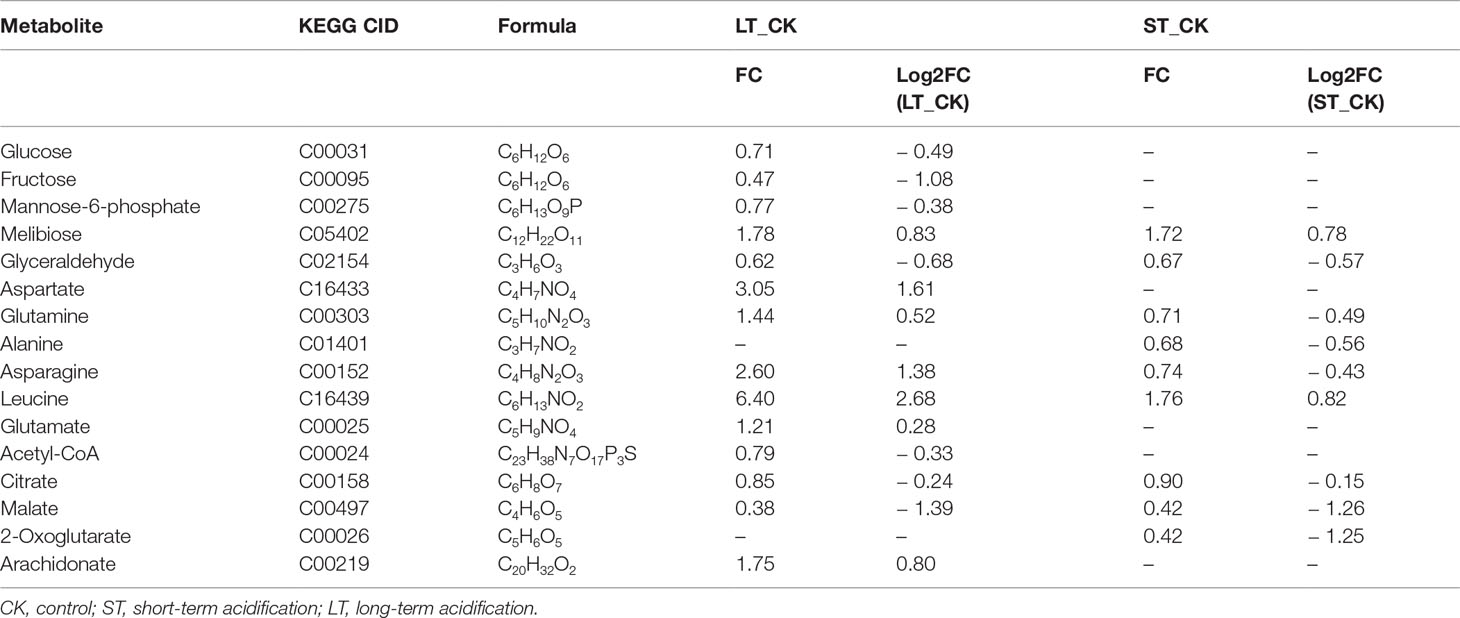
Table 5 Significantly different metabolites related to C and N metabolism.
3.8 Changes of Growth and Fatty Acid Profiles in B. Plicatilis
After feeding with N. oceanica under different acidification conditions, the growth curves of rotifers were measured as shown in Figure 7. The B. plicatilis in the RC group fed CK grew the fastest and remained in a stage of rapid growth, while the rotifers in the RS and RL groups fed ST and LT grew slowly.
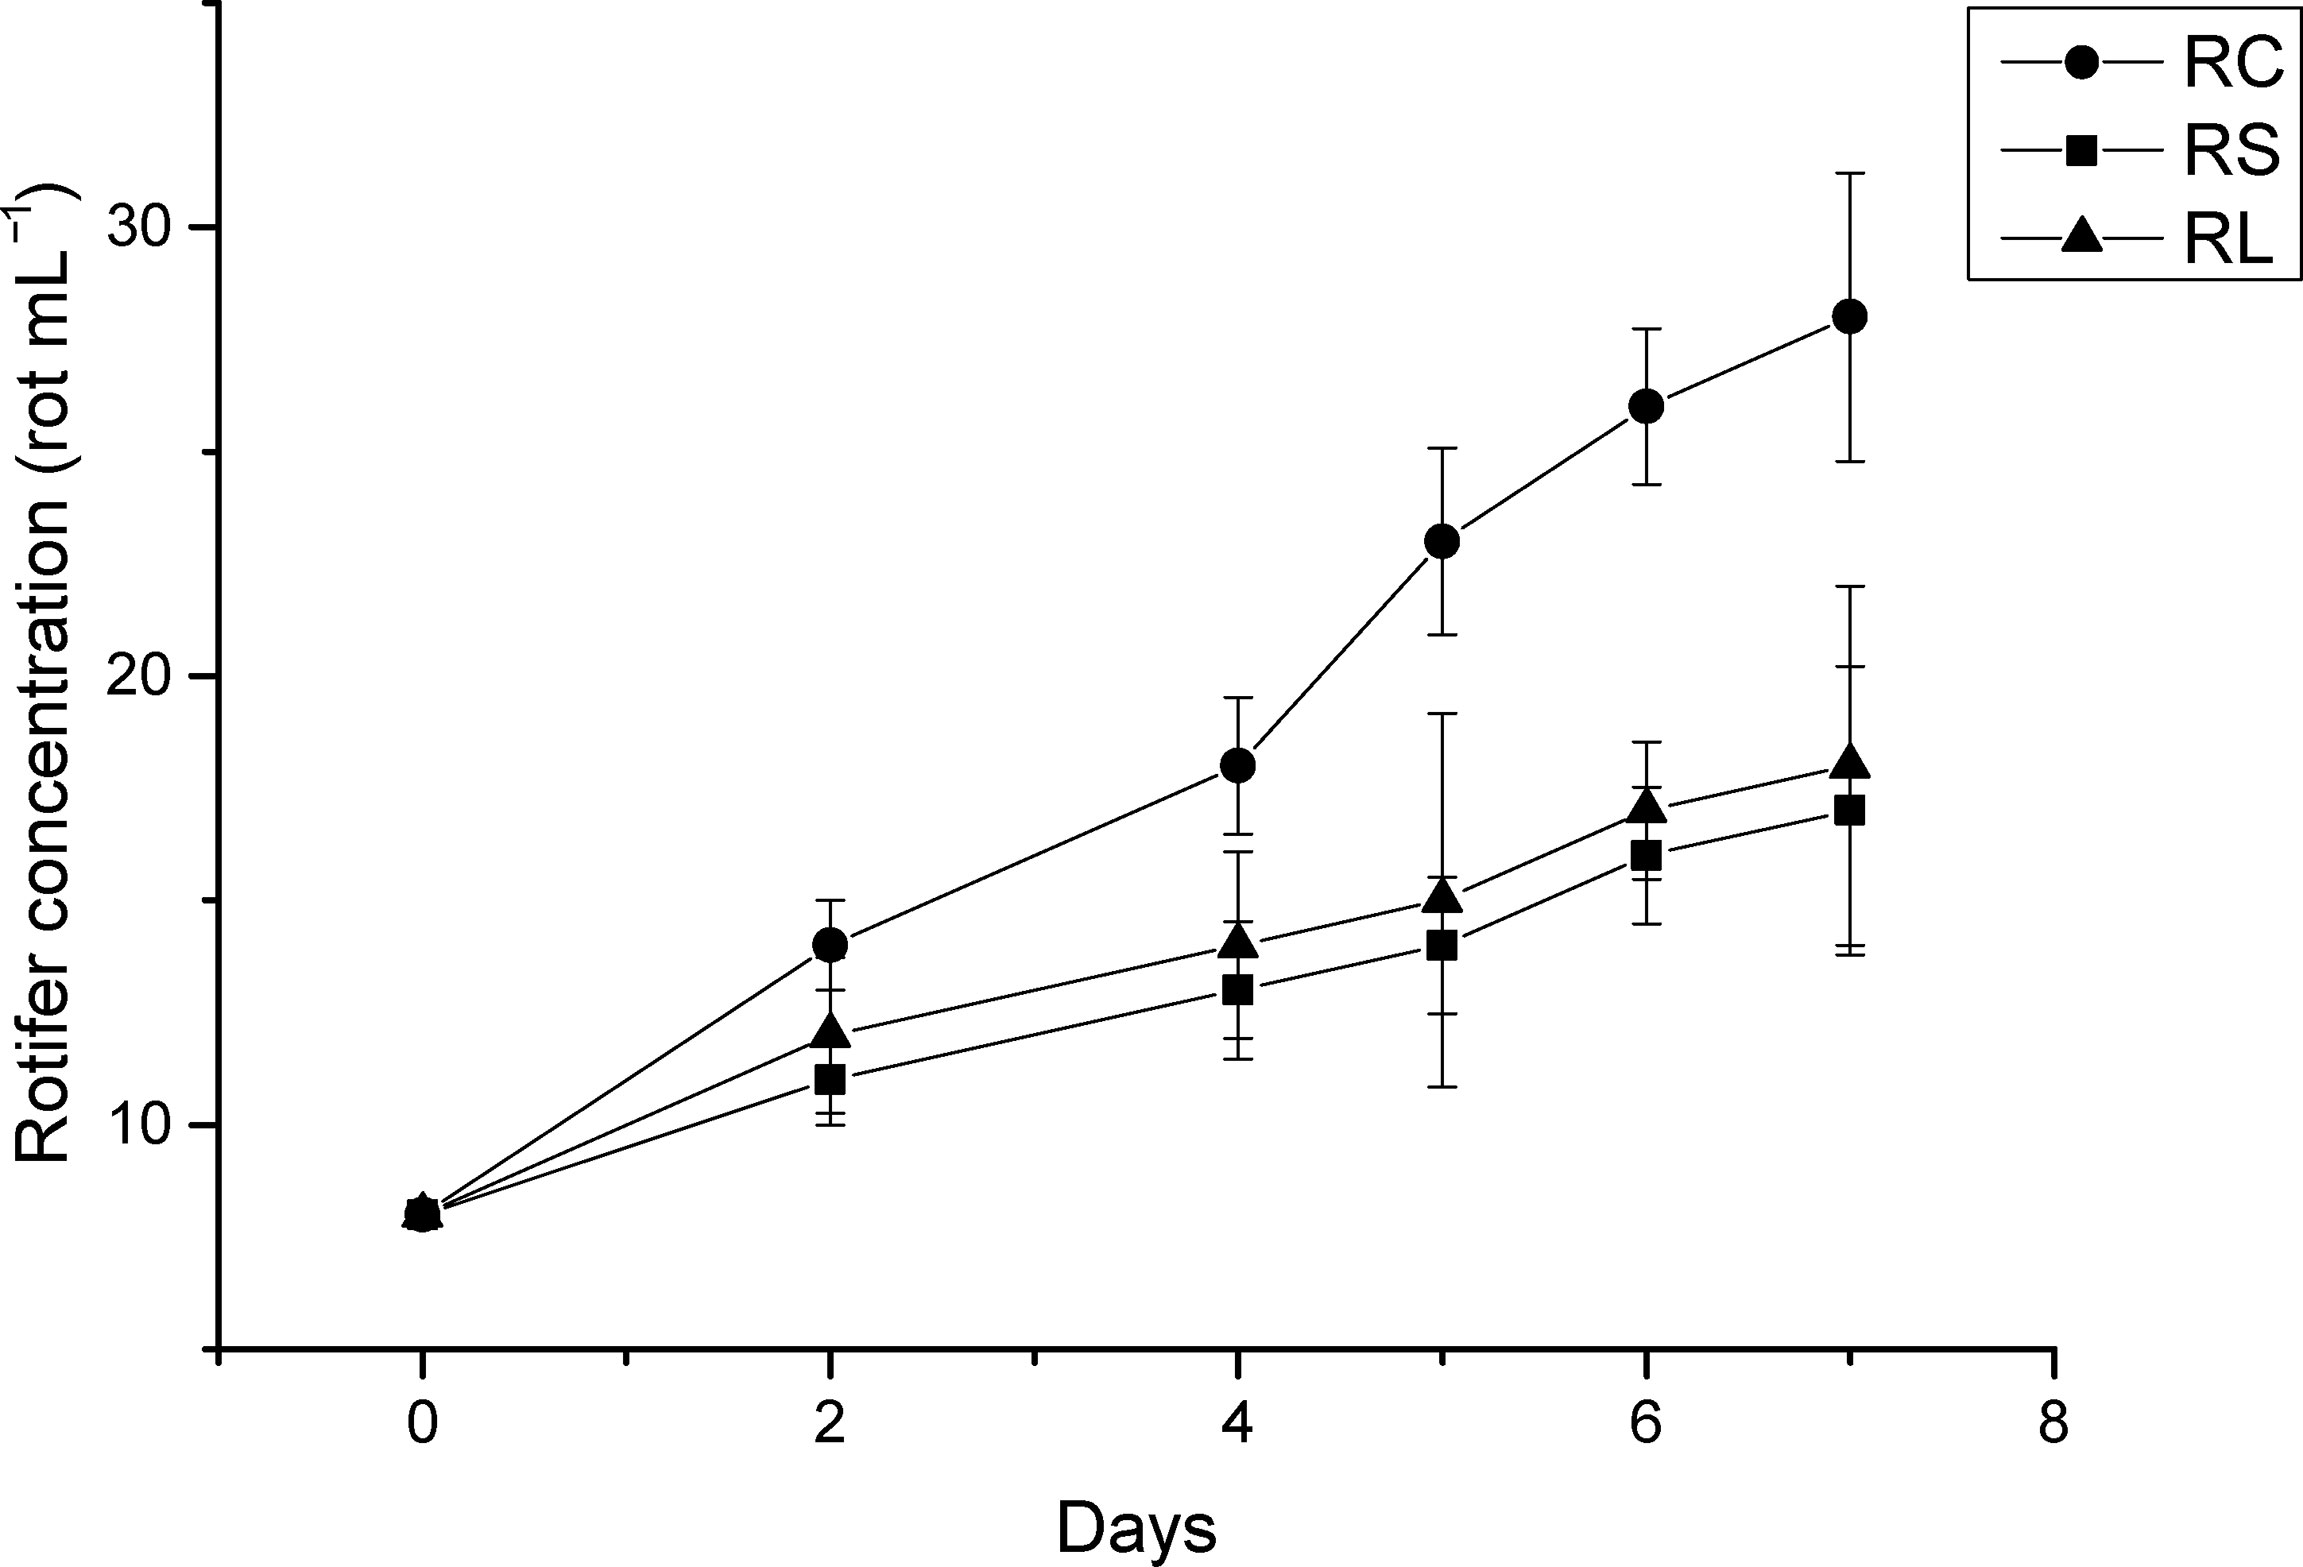
Figure 7 The growth curve of rotifer B. plicatilis under different treatment treatments. RC, rotifer fed with CK; RS, rotifer fed with ST; RL, rotifer fed with LT.
Fatty acid profiles of B. plicatilis fed on algae powder grown with normal and high CO2 concentration were analyzed by GC-MS, and three biological replicates were set for each condition. As shown in Table 6, the MUFA content of rotifers under different feeding conditions accounted for the largest proportion, RC: 47.32 ± 0.81%; RS: 49.62 ± 0.37%; RL: 48.89 ± 0.06%; The MUFAs of rotifers were significantly increased (p< 0.05) after they were fed powder from algae grown under acidified conditions. The EPA content of RS was increased and that of RL was significantly increased (p< 0.05), which was the same as that of N. oceanica under ST and LT conditions. However, the levels of arachidonic acid (C20:4N6, ARA) and C18:2N6 were significantly decreased in RS and RL, and at the same time, the levels of PUFAs in RS were significantly decreased. The insignificant change of PUFAs in RL might be caused by the large increase in EPA levels. The contents of C14:0 and C16:1N7 of rotifers were significantly increased (p< 0.05) by feeding algae powder grown with high CO2 concentration, which was consistent with the change of N. oceanica under acidification. In particular, the content of C16:0 in rotifers was the same as that in N. oceanica, and both LT and RL significantly reduced the proportion of C16:0 in SFAs. The variation in the trends of major fatty acids in N. oceanica and B. plicatilis were consistent (Figure 8), indicating that the changes of fatty acids in N. oceanica were transferred to rotifers after acidification.
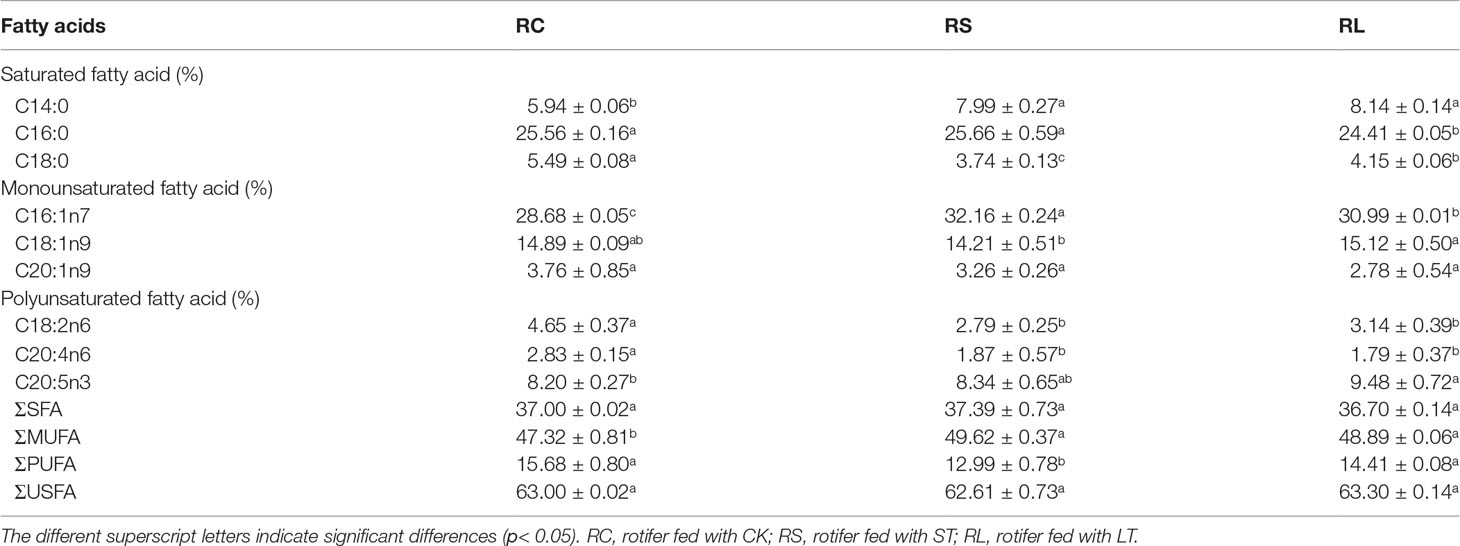
Table 6 Fatty acid composition (%) of B. plicatilis under different treatments (RC, RS and RL).
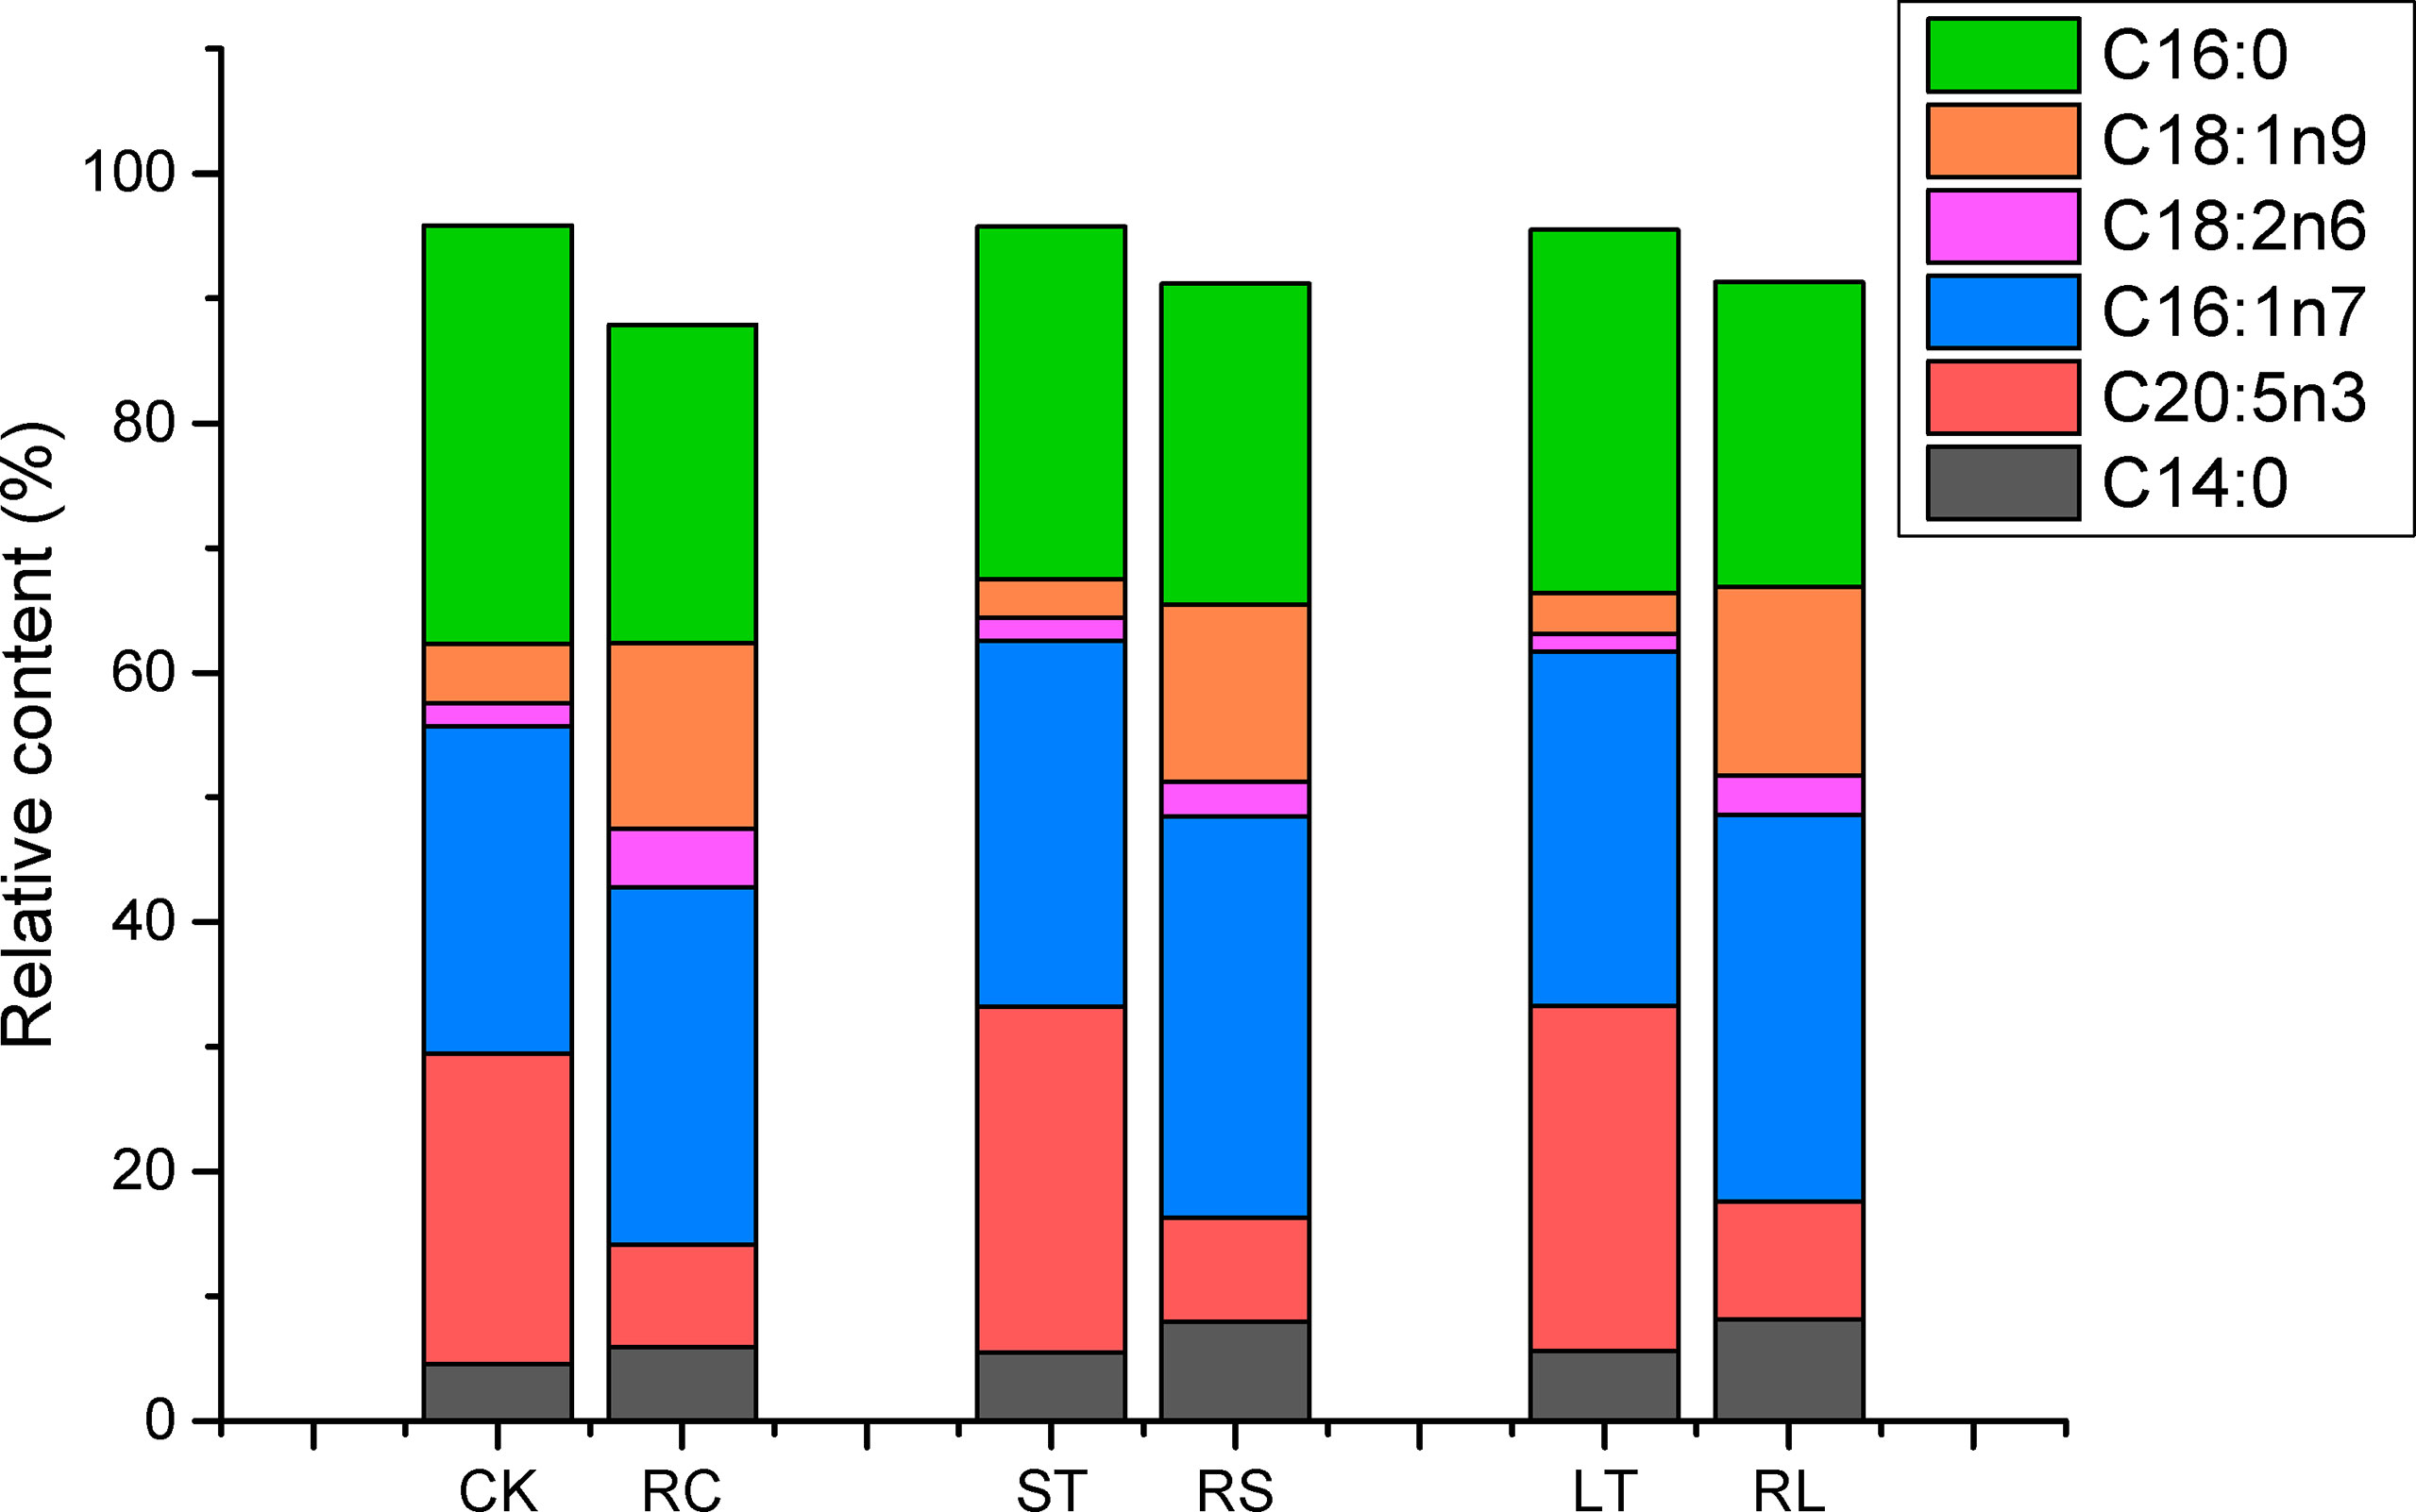
Figure 8 Changes of main fatty acid profiles of N. oceanica (CK, ST and LT) and rotifer (B) plicatilis (RC, RS and RL) under different treatment treatments. CK, control; ST, short-term acidification; LT, long-term acidification. RC, rotifer fed with CK; RS, rotifer fed with ST; RL, rotifer fed with LT.
4 Discussion
In this study, the physiological and biochemical responses and regulation of N. oceanica to elevated pCO2 were explored. By comparing transcriptome and metabonomics data, the changes of main metabolic pathways in N. oceanica under acidification were analyzed, and the molecular regulatory mechanism was explained. At the same time, the possible ecological effects were evaluated through animal feeding experiments, and the impact of changes in N. oceanica on the food chain during OA was analyzed.
4.1 Photosynthesis and Calvin Cycle
Similar to C3 higher plants, microalgae can absorb external inorganic carbon sources through the photosynthetic carbon fixation pathway, which can be converted into organic compounds to maintain cell energy metabolism (Spalding, 1989). In the photosynthetic pathway, only two DEGs were found under LT cells, namely photosystem II oxygen-enhancing protein 3 (psbQ) and ferredoxin-NADP+ reductase (FNR), both of which were significantly downregulated, while no DEG was found in ST cells (Table 7; Figure 9A). Similarly, the expression of most light-capturing central protein genes in photosystems I and II was significantly inhibited after long-term acidification in Chlamydomonas reinhardtii (Zhang et al., 2021). Under short-term acidification, the photosynthesis-related light-trapping protein gene expression of microalgae Coccomyxa subellipsoidea C-169 was significantly downregulated (Peng et al., 2014).
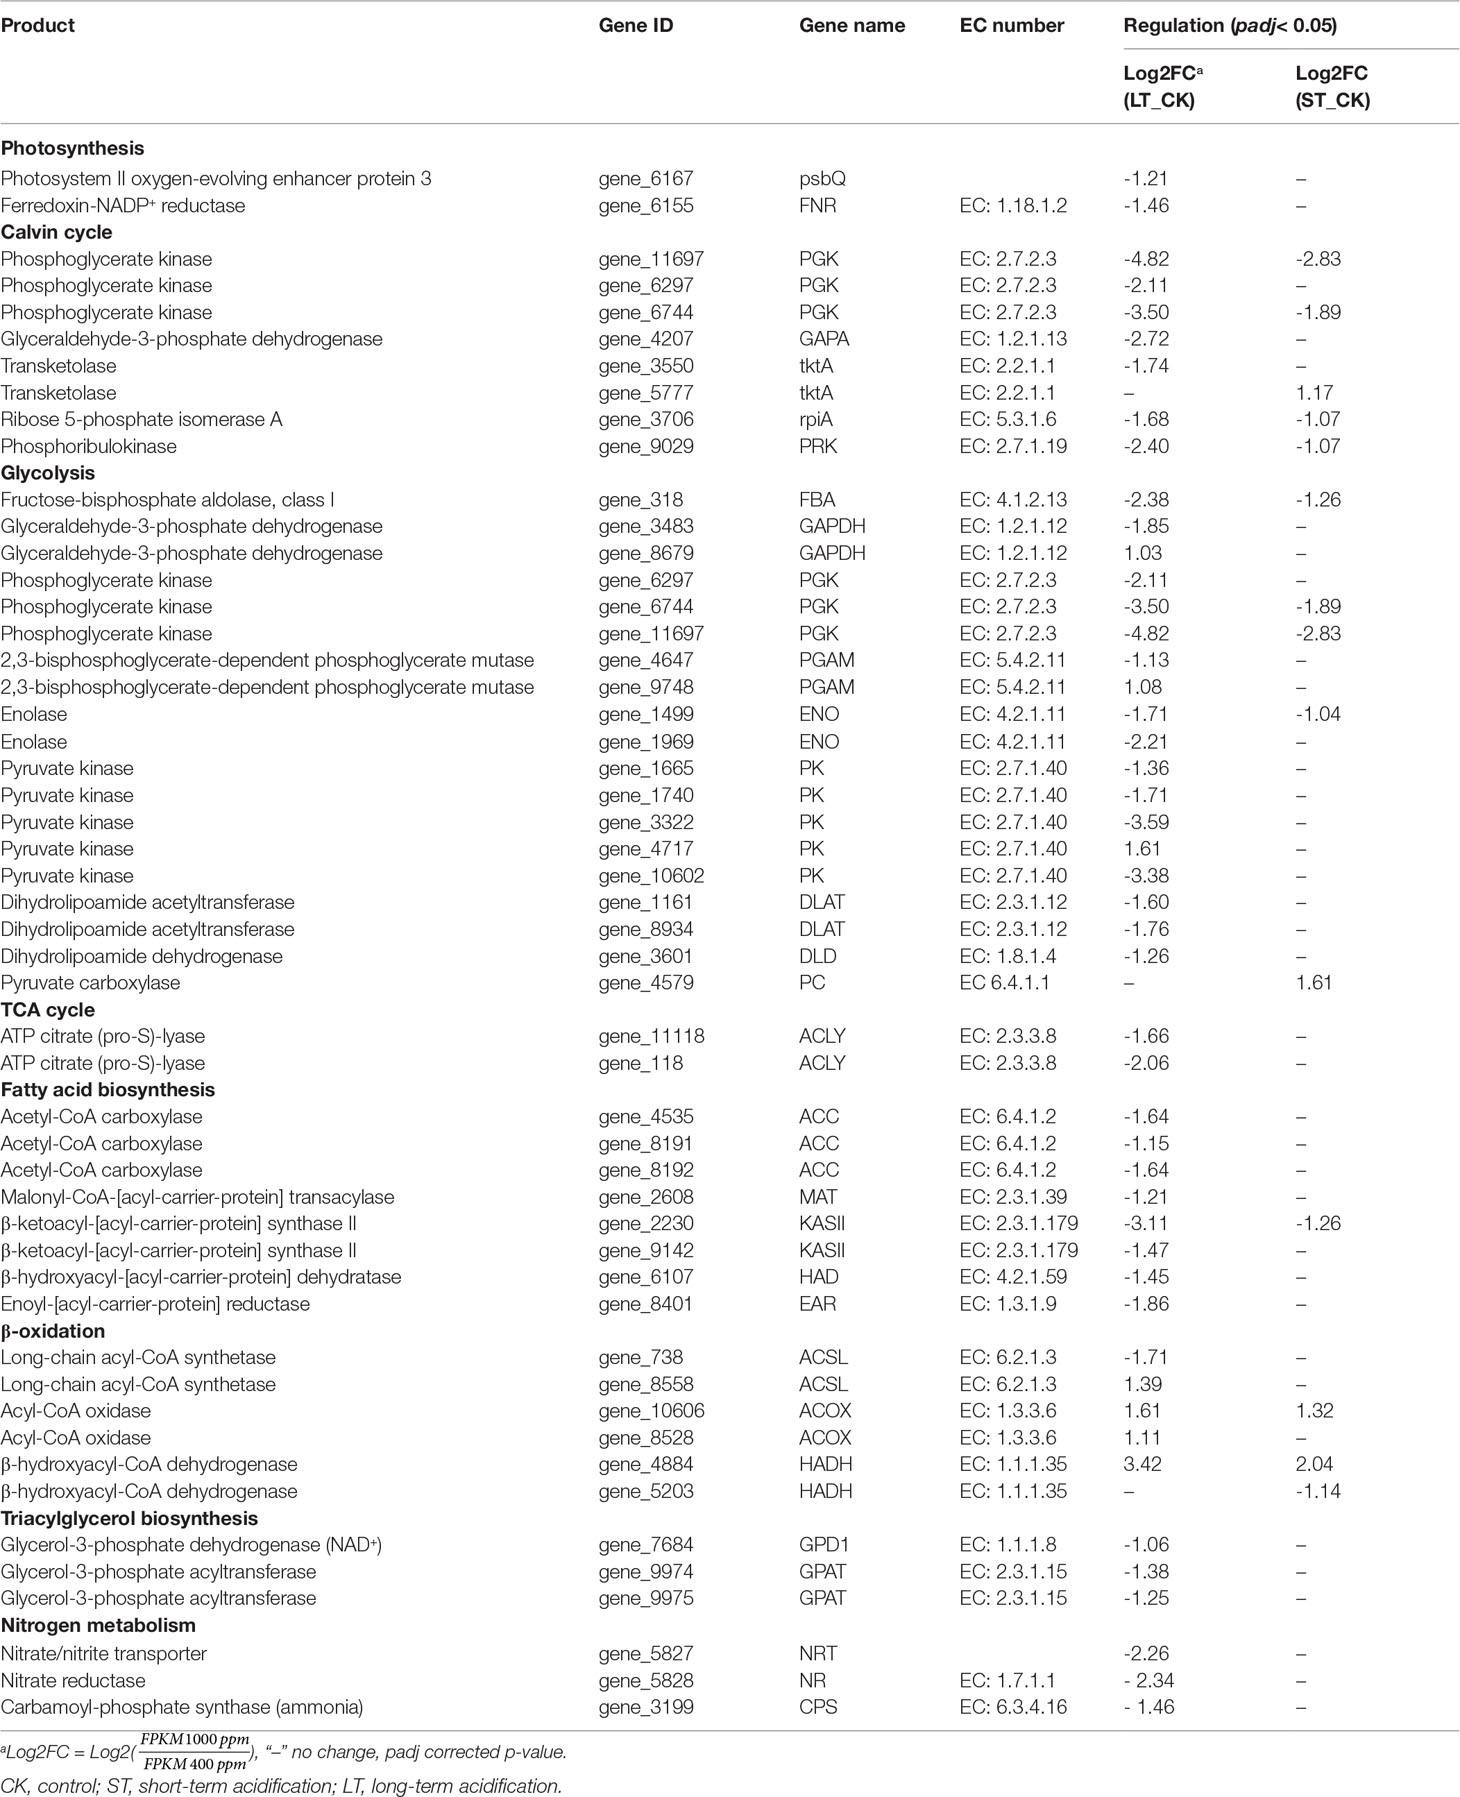
Table 7 Differentially expressed genes related to C and N metabolism.
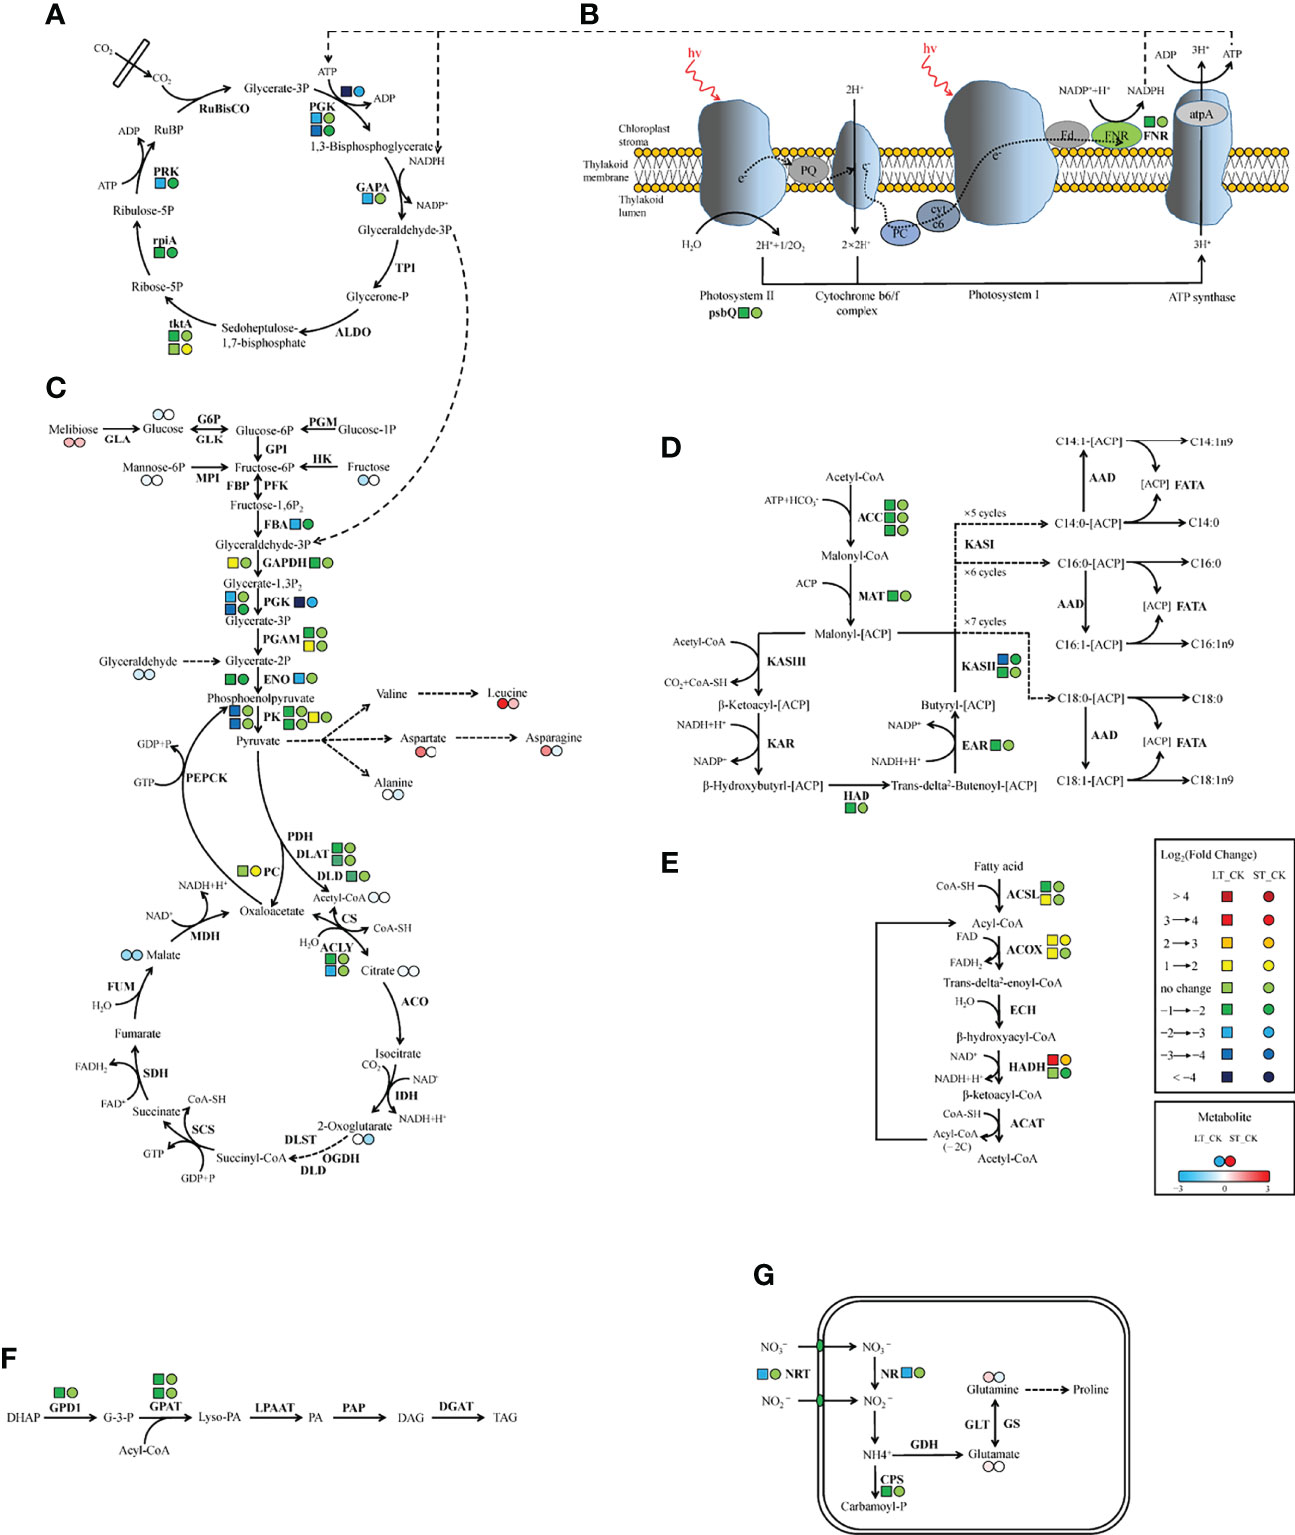
Figure 9 Schematic representation of genes and metabolites changes in C and N metabolic pathways in N. oceanica under ocean acidification. (A) Calvin cycle. (B) Photosynthesis. (C) Glycolysis/gluconeogenesis and TCA cycle. (D) Fatty acid biosynthesis. (E) β-oxidation. (F) Triacylglycerol biosynthesis. (G) Nitrogen metabolism. Key enzymes and metabolites were included in the map. Next to the enzyme, left tetragon represents LT vs. CK; right circle represents ST vs. CK. Two adjacent circles next to the metabolite, left circle representsLT vs. CK and right circle represents ST vs. CK (red in upregulated, blue in downregulated). CK, control; ST, short-term acidification; LT, long-term acidification. RuBisCO, ribulose bisphosphate carboxylase; PGK, phosphoglycerate kinase; GAPA, glyceraldehyde-3-phosphate dehydrogenase; TPI, triosephosphate isomerase; ALDO, fructose-bisphosphate aldolase; tktA, transketolase; rpiA, ribose 5-phosphate isomerase A; PRK, phosphoribulokinase; psbQ, photosystem II oxygen-evolving enhancer protein 3; FNR, ferrdoxin-NADP+ reductase; PGM, phosphoglucomutase; GLA, galactosidase; G6P, glucose-6-phosphatase; GLK, glucokinase; GPI, glucose-6-phosphate isomerase; HK, hexokinase; MPI, mannose-6-phosphate isomerase; FBP, fructose-1,6-bisphosphatase; PFK, phosphofructokinase; FBA, fructose-bisphosphate aldolase; GAPDH, glyceraldehyde-3-phosphate dehydrogenase; PGAM, 2,3-bisphosphoglycerate-dependent phosphoglycerate mutase; ENO, enolase; PK, pyruvate kinase; PDH, pyruvate dehydrogenase; DLAT, dihydrolipoamide acetyltransferase; DLD, dihydrolipoamide dehydrogenase; PC, pyruvate carboxylase; PEPCK, phosphoenolpyruvate carboxykinase; CS, citrate synthase; ACLY, ATP citrate lyase; ACO, aconitate hydratase; IDH, isocitrate dehydrogenase; OGDH, 2-oxoglutarate dehydrogenase; DLST, dihydrolipoamide succinyltransferase; SCS, succinyl-CoA synthetase; SDH, succinate dehydrogenase; FUM, fumarate hydratase; MDH, malate dehydrogenase; ACC, acetyl-CoA carboxylase; MAT, malonyl-CoA-[acyl-carrier-protein] transacylase; KAS, β-ketoacyl-[acyl-carrier-protein] synthase; KAR, β-ketoacyl-[acyl-carrier protein] reductase; HAD, β-hydroxyacyl-[acyl-carrier-protein] dehydratase; EAR, enoyl-[acyl-carrier-protein] reductase; AAD, acyl-[acyl-carrier-protein] desaturase; FATA, fatty acyl-[acyl-carrier-protein] thioesterase A; ACSL, long-chain acyl-CoA synthetase; ACOX, acyl-CoA oxidase; ECH, enoyl-CoA hydratase; HADH, β-hydroxyacyl-CoA dehydrogenase; ACAT, acetyl-CoA C-acetyltransferase; DHAP, dihydroxyacetone phosphate; GPD1, glycerol-3-phosphate dehydrogenase (NAD+); G-3-P, glycerol-3-phosphate; GPAT, glycerol-3-phosphate acyltransferase; PA, phosphatidic acid; Lyso-PA, lysophosphatidic acid; LPAAT, Lyso-PA acyltransferase; PAP, PA phosphatase; DAG, diacyglycerol; DGAT, DAG acyltransferase; TAG, triacylglycerol; NRT, nitrate/nitrite transporter; NR, nitrate reductase; Fd-NiR, ferredoxin-dependent nitrite reductases; CPS, carbamoylphosphate synthase; GDH, glutamate dehydrogenase; GS, glutamine synthetase; GLT, glutamate synthase.
Most genes involved in the Calvin cycle in LT and ST were also significantly downregulated, and the transketolase (tktA, Gene_5777) was the only gene significantly upregulated, by 2.25 times, under ST conditions (Table 7; Figure 9B). RuBisCO is a key enzyme in the initial phase of CO2 fixation in the Calvin cycle, but no significant changes were observed under acidification conditions. In LT cells, three homologous genes of phosphoglycerate kinase (PGK), glyceraldehyde-3-phosphate dehydrogenase (GAPA), ribose 5-phosphate isomerase (rpiA), and tktA were significantly downregulated, as well as the transcript encoding ribulose-phosphate kinase (PRK) (Table 7). The study showed similar results that the RuBisCO of microalgae Coccomyxa subbellipsoidea C-169 did not change significantly during a short period of growth under high CO2 concentrations (Peng et al., 2014). PGK and GAPA, the key enzymes in the Calvin cycle, can generate glyceraldehyde 3-phosphate through the consumption of photosynthesis NADPH and ATP catalytic glyceric acid-3-phosphate. Although we found that the carbon biofixation rate increased during acidification (Figure 2), the transcriptome data suggested that the carbon biofixation pathway decreased. We guessed that the carbon fixation pathway was not always up-regulated, perhaps in the initial stage, but with the increase of carbon biofixation, the product inhibition effect was produced and the carbon biofixation pathway was down-regulated. The specific mechanism was worthy of future study.
Carbon is fixed through the Calvin cycle to form various carbon skeletons and other derivatives, such as carbohydrates, fatty acids, and amino acids. Although physiological and biochemical data showed that the total protein content of LT cells significantly decreased, the protein content of ST cells slightly increased but the carbohydrate content significantly increased (Table 2). According to metabonomics data, amino acid content significantly increased and most carbohydrates significantly decreased under LT conditions, whereas the levels of most amino acids significantly decreased under ST conditions (Table 5). We speculated that the downregulated PGK and GAPA significantly reduced the accumulation of carbohydrates in algal cells under LT, which promoted a large amount of carbon source to flow to the synthesis of amino acids, and the consumption of carbohydrates promoted the rapid growth of algal cells under long-term acidification. However, under ST, due to the significant upregulation of tktA, the carbohydrate content was increased, and the increased CO2 concentration promoted the photosynthetic carbon fixation pathway of N. oceanica, which in turn promoted the absorption of a large number of inorganic carbon sources that were then converted into carbohydrates as common energy materials for storage. This difference between LT and ST may be due to the adaptation of algal cells to different acidification time scales.
4.2 Glycolysis and TCA Cycle
Glycolysis/gluconeogenesis and the TCA cycle are important energy metabolic pathways in organisms. In particular, the TCA cycle is a central hub for the metabolism of sugars, lipids, and amino acids. Several key enzymes involved in glycolysis were significantly downregulated in LT. Including fructose diphosphate aldolase (FBA), phosphoglyceraldehyde dehydrogenase (GAPDH), PGK, phosphoglycerate mutase (PGAM), enolase (ENO), pyruvate kinase (PK), dihydrothioctyl transacetylase (DLAT), and dihydrothioctyl dehydrogenase (DLD) were significantly downregulated. However, the transcript of a homologous gene encoding PGAM (Gene_9748) and PK enzymes (Gene_4717) was significantly upregulated, and no significant changes were found in the gluconeogenesis pathway (Table 7; Figure 9C). In ST, two homologous genes PGK and ENO were significantly downregulated, while the pyruvate carboxylase (PC) gene was significantly upregulated by 3.05-fold in the gluconeogenesis pathway. Contrary to our findings, most of the glycolysis genes of Chlorella sorokiniana were significantly upregulated after short-term culture with a high concentration of CO2 (Sun et al., 2016). Similarly, when Haematococcus pluvialis was grown at 15% CO2 concentration, the expression of the transcription gene encoding PK was upregulated 3.5 times. In the metabolome results, the contents of glucose, fructose, and mannose-6-phosphate, the precursor metabolites of glycolysis, in LT decreased significantly, but the content of melibiose increased, and the content of glyceraldehyde, the intermediate metabolite of glycolysis, decreased significantly (Table 5). We hypothesized that PGAM (Gene_9748) and PK (Gene_4717), which were significantly upregulated, promoted glycolysis of LT, thus generating a large amount of energy to maintain rapid growth. During short-term acidification, significantly upregulated PC enzymes enhanced gluconeogenesis and thus promoted carbohydrate accumulation, which is consistent with the physiologically higher carbohydrate content finding in ST (Table 2).
The TCA cycle is a common metabolic pathway of aerobic organisms, in which intermetabolites are closely related to the synthesis and metabolism of amino acids (Li et al., 2014). Under LT conditions, most of the genes remained unchanged except for ATP-citrate lyase (ACLY) which was significantly downregulated. Citric acid and malic acid, intermediate metabolites of the TCA cycle, were also significantly decreased, while aspartic acid, asparagine, glutamine, leucine, and glutamate levels were significantly increased. In ST, the levels of citric acid, malic acid, and ketoglutaric acid were significantly decreased, while the levels of glutamine, asparagine, and alanine were significantly decreased but those of leucine were increased (Table 5). The significant reduction of TCA cycling-related metabolites in LT suggested that a large amount of carbon flow was directed to amino acid synthesis, whereas ST enhanced gluconeogenesis, resulting in carbon flow to carbohydrates and reduced amino acid content.
4.3 Lipid Metabolism
Biosynthesis of fatty acids in algal chloroplasts consists of a set of dissociated type II fatty acid synthases (FAS) adding two carbon units to the elongated fatty acid carbon chain in an iterative path (Ryall et al., 2003). Acetyl-CoA carboxylase (ACC) catalyzes the first step of de novo biosynthesis of fatty acids, using bicarbonate, ATP, acetyl-CoA, and biotin cofactors to produce malonyl-CoA, the cornerstone of fatty acid biosynthesis (Waite and Wakil, 1962; Alberts and Vagelos, 1968; Salie and Thelen, 2016). Under LT conditions, the expression of three ACC homologous genes was significantly downregulated. Transcripts encoding malonylmonoacyl-coenzyme A-ACP transferase (MAT), β-ketoalioyl-ACP synthase II (KASII), β-hydroxyl-ACP dehydrase (HAD), and enyl-ACp reductase (EAR) were significantly downregulated, while no significant changes were found in genes under ST (Table 7; Figure 9D). Contrary to our findings, the expression of several ACC genes in H. pluvialis growing at 15% CO2 concentration was significantly upregulated (FC: 2.95–3.08 fold). As a precursor of de novo synthesis of fatty acids, acetyl-CoA content decreased by 21% under LT (Table 5), leading to the significant downregulation of genes related to fatty acid synthesis. In long-term acidification studies, 2020c; Liang et al. (2020b) found that there was no significant change in the expression of genes related to fatty acid synthesis in Chlorella variabilis, whereas ACC was significantly downregulated in C. muelleri, with species differences. In the fatty acid β-oxidation pathway, we found that acidification significantly upregulated gene expression of related enzymes (Table 7, Figure 9E), indicating that the acidified micrococcus could grow faster due to the energy supply of β-oxidation. According to the metabolome results, the level of polyunsaturated fatty acid arachidonic acid (ARA) was significantly increased by 1.75 times under LT conditions (Table 3). According to the results of the fatty acid profile, SFAs of N. oceanica under acidification significantly decreased while PUFA content significantly increased and EPA relative content of N. oceanica was significantly increased (p< 0.05), indicating that acidification promoted the proportion of unsaturated fatty acids in algae cells (Table 3). Similar to our research results, 2016; Fan et al. (2015), Fan et al. (2016) found that algae cells exposed to a low carbon environment generally increased the content of SFAs, whereas algae cells exposed to a high carbon environment promoted the generation of PUFAs. While our result is inconsistent with that in Chaetoceros muelleri and Cylindrotheca fusiformis (Bermúdez et al., 2015; Liang et al., 2020c). The effects of high pCO2 on algal fatty acid contents, particularly on PUFA, were more diverse and species-specific, and the PUFA level may decline or increase in different microalga (Tsuzuki et al., 1990; Riebesell et al., 2000; Fiorini et al., 2010; Torstensson et al., 2013). In this study, the alga may also increase EPA levels to maintain membrane fluidity under elevated pCO2.
However, under short-term acidification, most studies showed that the lipid accumulation of microalgae could be promoted (Wang et al., 2014; Patil and Kaliwal, 2016; Sabia et al., 2018). In Chlorella vulgaris, short-term acidification leads to the intracellular accumulation of acetyl-CoA and lipids (Jose and Suraishkumar, 2016). On the contrary, when Chlorella sorokiniana grew with elevated CO2, most genes related to fatty acid synthesis were significantly downregulated, but lipid accumulation increased. Sun et al. (2016) speculated that the increase in substrate supply rather than the key enzymes of fatty acid biosynthesis play a more important role in the synthesis of triglycerides (TAG). In the pathway of triglyceride synthesis, GPD1 and two GPAT homologous genes were significantly downregulated under LT (Table 7; Figure 9F), indicating that the long-term acidification of N. oceanica may limit the accumulation of TAG by reducing the de novo synthesis of fatty acids, while the gene expression under ST conditions was not significant, and the related molecular regulation mechanism was difficult to explain, requiring further study by other methods.
4.4 Nitrogen Metabolism
Nitrogen is an essential nutrient for all living organisms and is required for the biosynthesis of large molecules such as proteins, nucleic acids, and chlorophyll. For N. oceanica, it is important to maintain the intracellular carbon and nitrogen balance. Although the level of total nitrogen increased with the increased the total carbon contens, the expression of related genes in the nitrogen assimilation pathway was significantly downregulated (NRT, NR, CPS) in LT cells, but in ST they were not significantly downregulated. Similar to our findings, Zhang et al. (2021) found that in Chlamydomonas reinhardtii, NRT and CPS gene expression was also significantly downregulated during long-term acidification. However, in Synechococcus elongates, elevated CO2 promotes the upregulated expression of genes related to nitrogen assimilation, thus maintaining the C and N homeostasis of algal cells (Mehta et al., 2019). In the study by Liang et al., genes for nitrogen absorption and assimilation were found to be upregulated in C.muelleri (Liang et al., 2020c).Therefore, it could be hypothesized that the accumulation of a large number of nitrogen-containing compounds (glutamine, and glutamate) resulted in feedback inhibition of long-term acidified cells (Table 5), which significantly down-regulated the expression of genes related to nitrogen metabolism and enabled N. oceanica to maintain a relatively stable C/N balance for algal growth (Figure 9G). Some specific amino acid concentrations like Argpartate and Leucine increased since the total protein content decreased in LT cells. It is speculated that under LT, algae cells are possible to use decomposable proteins for energy supply, so as to maintain the rapid growth of algae cells in the long-term high carbon and low pH environment. The related molecular regulation mechanism needs to be further studied.
4.5 Growth and Effects of Fatty Acid Profiles in B. Plicatilis
Due to high protein content, polyunsaturated fatty acid content, and short growth cycle, B. plicatilis is the open bait of fish and crustaceans in the ocean. Therefore, it is an indispensable class of zooplankton in the marine ecosystem. It feeds on marine microalgae under natural conditions, so it also contains more polyunsaturated fatty acid EPA (Fu et al., 2016). Studies have shown that low pH seawater could induce oxidative stress and DNA damage, and reduce the growth rate, fertility, and longevity of parent ichthys, but the effect on offspring is not obvious (Lee et al., 2020). We speculated that the acidified environment may inhibit the feeding of rotifers and slow down the growth and development of the rotifer population under acidified culture conditions. Our results confirmed this theory. In addition, the total fatty acid profiles of microalgae changed when the CO2 concentration was elevated compared with the 400 ppm CO2, which may transfer at the trophic level. It was found that the growth and reproduction of the water flea Acartia tonsa were affected when the copepods were fed with acidified algae (Rossoll et al., 2012). Similarly, Meyers et al. (2019) also found that OA could affect the nutritional quality of planktonic microalgae and their reproduction after feeding copepods. Compared with the main fatty acid spectrum data of rotifers and N. oceanica (Figure 9), the variation trends were roughly the same, indicating that changes in nutrient quality generated by OA on N. oceanica could be transferred to rotifers through nutrient level transfer. Although PUFAs were increased in LT cells, they still had adverse effects on downstream consumers. More studies are therefore needed to understand the complex food chain effects induced by OA.
Data Availability Statement
The datasets presented in this study can be found in online repositories. The names of the repository/repositories and accession number(s) can be found below: https://www.ncbi.nlm.nih.gov/, PRJNA719462.
Author Contributions
CL and NY designed the project. CL, YZ, ZG, YR, and DX performed the research. YZ, CL, DX and XZ analyzed the data. YZ and CL wrote the first draft. All authors contributed to interpreting the data and writing the manuscript. The manuscript was approved by all authors for publications. This work is the original works of the authors, and the manuscript was not previously submitted to this journal. All authors contributed to the article and approved the submitted version.
Funding
This research was supported by Special Funds of Shandong Province for Pilot National Laboratory for Marine Science and Technology (Qingdao) (2021QNLM050103-1), the National Natural Science Foundation of China (grants 31770393 and 41976110), the Taishan Scholars Funding of Shandong Province, and the Young Taishan Scholars Program (tsqn202103136).
Conflict of Interest
The authors declare that the research was conducted in the absence of any commercial or financial relationships that could be construed as a potential conflict of interest.
Publisher’s Note
All claims expressed in this article are solely those of the authors and do not necessarily represent those of their affiliated organizations, or those of the publisher, the editors and the reviewers. Any product that may be evaluated in this article, or claim that may be made by its manufacturer, is not guaranteed or endorsed by the publisher.
Acknowledgments
We acknowledge Dr. Qingchun Zhang who provided B. plicatilis for this study.
Supplementary Material
The Supplementary Material for this article can be found online at: https://www.frontiersin.org/articles/10.3389/fmars.2022.863262/full#supplementary-material
References
Alberts A. W., Vagelos P. R. (1968). Acetyl CoA Carboxylase. I. Requirement for Two Protein Fractions. Proc. Natl. Acad. Sci. U. S. A. 59, 561–568. doi: 10.1073/pnas.59.2.561
Bermúdez R., Feng Y., Roleda M. Y., Tatters A. O., Hutchins D. A, Larsen T., et al.(2015). Long-Term Conditioning to Elevated pCO2 and Warming Influences the Fatty and Amino Acid Composition of the Diatom Cylindrotheca Fusiformis. PloS One 10, e0123945. doi: 10.1371/ journal.pone.0123945
Caldeira K., Wickett M. E. (2003). Anthropogenic Carbon and Ocean pH. Nature 425, 365. doi: 10.1038/425365a
Chen X. A., Gao K. S. (2004a). Photosynthetic Utilization of Inorganic Carbon and its Regulation in the Marine Diatom Skeletonema Costatum. Funct. Plant Biol. 31, 1027–1033. doi: 10.1071/FP04076
Chen X. W., Gao K. S. (2004b). Characterization of Diurnal Photosynthetic Rhythms in the Marine Diatom Skeletonema Costatum Grown in Synchronous Culture Under Ambient and Elevated CO2. Funct. Plant Biol. 31, 399–404. doi: 10.1071/FP03240
Chiu S. Y., Kao C. Y., Tsai M. T., Ong S. C., Chen C. H., Lin C. S. (2009). Lipid Accumulation and CO2Utilization of Nannochloropsis Oculata in Response to CO2 Aeration. Bioresour. Technol. 100, 833–838. doi: 10.1016/j.biortech.2008.06.061
Cripps G., Flynn K. J., Lindeque P. K. (2016). Ocean Acidification Affects the Phyto-Zoo Plankton Trophic Transfer Efficiency. PloS One 11, e0151739. doi: 10.1371/journal.pone.0151739
Das P., Lei W., Aziz S. S., Obbard J. P. (2011). Enhanced Algae Growth in Both Phototrophic and Mixotrophic Culture Under Blue Light. Bioresour. Technol. 102, 3883–3887. doi: 10.1016/j.biortech.2010.11.102
Fan J., Xu H., Luo Y., Wan M., Huang J., Wang W. (2015). Impacts of CO2 Concentration on Growth, Lipid Accumulation, and Carbon-Concentrating-Mechanism-Related Gene Expression in Oleaginous Chlorella. Appl. Microbiol. Biotechnol. 99, 2451–2462. doi: 10.1007/s00253-015-6397-4
Fan J., Xu H., Li Y. (2016). Transcriptome-Based Global Analysis of Gene Expression in Response to Carbon Dioxide Deprivation in the Green Algae Chlorella Pyrenoidosa. Algal Res. 16, 12–19. doi: 10.1016/j.algal.2016.02.032
Field C. B., Behrenfeld M. J., Randerson J. T., Falkowski P. (1998). Primary Production of the Biosphere: Integrating Terrestrial and Oceanic Components. Science 281, 237–240. doi: 10.1126/science.281.5374.237
Fiorini S., Gattuso J. P., van Rijswijk P., Middelburg J. (2010). Coccolithophores Lipid and Carbon Isotope Composition and Their Variability Related to Changes in Seawater Carbonate Chemistry. J. Exp. Mar. Bio. Ecol. 394, 74–85. doi: 10.1016/j.jembe.2010.07.020
Fu R., Zhang X., Xu Z., Qiu H., Jiang X. (2016). The Effect of Amino Acids, Fatty Acid Composition of Different Bait on Brachionus Plicatilis. Funct. Plant Biol. 41, 449–459. Journal of Zhejiang Ocean University (Natural Science) 35, 372-377.
Gao K., Campbell D. A. (2014). Photophysiological Responses of Marine Diatoms to Elevated CO2 and Decreased pH: a Review. Funct. Plant Biol. 41, 449–459. doi: 10.1071/FP13247
Gattuso J. P., Magnan A., Bille R., Cheung W. W., Howes E. L., Joos F., et al. (2015). Contrasting Futures for Ocean and Society From Different Anthropogenic CO2 Emissions Scenarios. Science 349 (6243), aac4722. doi: 10.1126/science.aac4722
Genty B., Briantais J. M., Baker N. R. (1989). The Relationship Between the Quantum Yield of Photosynthetic Electron Transport and Quenching of Chlorophyll Fluorescence. Biochim. Biophys. Acta-Gen. Subj. 990, 87–92. doi: 10.1016/S0304-4165(89)80016-9
Glencross B. (2009). Exploring the Nutritional Demand for Essential Fatty Acids by Aquaculture Species. Rev. Aquac. 1, 71–124. doi: 10.1111/j.1753-5131.2009.01006.x
Golda-VanEeckhoutte R. L., Roof L. T., Needoba J. A., Peterson T. D. (2018). Determination of Intracellular pH in Phytoplankton Using the Fluorescent Probe, SNARF, With Detection by Fluorescence Spectroscopy. J. Microbiol. Methods 152, 109–118. doi: 10.1016/j.mimet.2018.07.023
Hauke J., Kossowski T. (2011). Comparison of Values of Pearson’s and Spearman’s Correlation Coefficients on the Same Sets of Data. Quaest. Geogr. 30, 87–93. doi: 10.2478/v10117-011-0021-1
Hopkins F. E., Suntharalingam P., Gehlen M., Andrews O., Archer S. D., Bopp L., et al. (2020). The Impacts of Ocean Acidification on Marine Trace Gases and the Implications for Atmospheric Chemistry and Climate. Proc. Mathematical. Physical Eng. Sci. 476 (2237), 20190769. doi: 10.1098/rspa.2019.0769
Hu H., Gao K. (2003). Optimization of Growth and Fatty Acid Composition of a Unicellular Marine Picoplankton, Nannochloropsis Sp., With Enriched Carbon Sources. Biotechnol. Lett. 25, 421–425. doi: 10.1023/A:1022489108980
Hurd C. L., Lenton A., Tilbrook B., Boyd P. W. (2018). Current Understanding and Challenges for Oceans in a Higer-CO2 World. Nat. Clim. Change 8, 686–694. doi: 10.1038/s41558-018-0211-0
IPCC. (2013) Climate Change 2013: The Physical Science Basis. Working Group I Contribution to the Fifth Assessment Report of the Intergovernmental Panel on Climate Change.Cambridge University Press.
Jin P., Gao K., Beardall J. (2013). Evolutionary Responses of a Coccolithophorid Gephyrocapsa Oceanica to Ocean Acidification. Evolution 67, 1869–1878. doi: 10.1111/evo.12112
Jin P., Hutchins D. A., Gao K. (2020). The Impacts on Ocean Acidification on Marine Food Quality and its Potential Food Chain Consequences. Fron. Mari. Sci. 7, 543979. doi: 10.3389/fmars.2020.543979
Jin P., Wang T., Liu N., Dupont S., Beardall J., Boyd P. W., (2015). Ocean Acidification Increases the Accumulation of Toxic Phenolic Compounds Across Trophic Levels. Nat. Commun. 6, 8714. doi: 10.1038/ncomms9714
Jose S., Suraishkumar G. K. (2016). High Carbon (CO2) Supply Leads to Elevated Intracellular Acetyl CoA Levels and Increased Lipid Accumulation in Chlorella Vulgaris. Algal Res. 19, 307–315. doi: 10.1016/j.algal.2016.08.011
Lee Y. H., Kang H. M., Kim M. S., Lee J. S., Wang M., Hagiwara A., (2020). Multigenerational Mitigating Effects of Ocean Acidification on In Vivo Endpoints, Antioxidant Defense, DNA Damage Response, and Epigenetic Modification in an Asexual Monogonont Rotifer. Environ. Sci. Technol. 54, 7858–7869. doi: 10.1021/acs.est.0c01438
Liang C., Wang L., Zhang Y., Zhang J., Zhang X., Ye N. (2020a). The Effects of Elevated CO2 Concentrations on Changes in Fatty Acids and Amino Acids of Three Species of Microalgae. Phycologia 59, 208–217. doi: 10.1080/00318884.2020.1732714
Liang C., Yang X., Wang L., Fan X., Zhang X., Xu D., (2020b). Different Physiological and Molecular Responses of the Green Algae Chlorella Variabilis to Long-Term and Short-Term Elevated CO2. J. Appl. Phycol. 32, 951–966. doi: 10.1007/s10811-019-01943-1
Liang C., Zhang Y., Wang L., Shi L., Xu D., Zhang X., (2020c). Features of Metabolic Regulation Revealed by Transcriptomic Adaptions Driven by Long-Term Elevated pCO2 in Chaetoceros Muelleri. Phycol. Res. 68, 236–248. doi: 10.1111/pre.12423
Liu J., Liu Y., Wang H., Xue S. (2015). Direct Transesterification of Fresh Microalgal Cells. Bioresour. Technol. 176, 284–287. doi: 10.1016/j.biortech.2014.10.094
Liu D., Wong P., Dutka B. J. (1973). Determination of Carbohydrate in Lake Sediment by a Modified Phenol-Sulfuric Acid Method. Water Res. 7, 741–746. doi: 10.1016/0043-1354(73)90090-0
Li Y., Xu J., Gao K. (2014). Light-Modulated Responses of Growth and Photosynthetic Performance to Ocean Acidification in the Model Diatom Phaeodactylum Tricornutum. PloS One 9, e96173. doi: 10.1371/journal.pone.0096173
Ma X. N., Chen T. P., Yang B., Liu J.,, Chen F. (2016). Lipid Production FromNannochloropsis.Mar. Drugs 14, 61. doi: 10.3390/md14040061
Mehta K., Jaiswal D., Nayak M., Prasannan C. B., Wangikar P. P., Srivastava S. (2019). Elevated Carbon Dioxide Levels Lead to Proteome-Wide Alterations for Optimal Growth of a Fast-Growing Cyanobacterium, Synechococcus Elongatus PCC 11801. Sci. Rep. 9, 6257. doi: 10.1038/s41598-019-42576-1
Meng Y., Jiang J., Wang H., Cao X., Xue S., Yang Q., et al. (2015). The Characteristics of TAG and EPA Accumulation in Nannochloropsis Oceanica IMET1 Under Different Nitrogen Supply Regimes. Bioresour. Technol. 179, 483–489. doi: 10.1016/j.biortech.2014.12.012
Meyers M. T., Cochlan W. P., Carpenter E. J., Kimmerer W. J. (2019). Effect of Ocean Acidification on the Nutritional Quality of Marine Phytoplankton for Copepod Reproduction. PloS One 14, e0217047. doi: 10.1371/journal.pone.0217047
Morais M., Costa J. A. V. (2007). Biofixation of Carbon Dioxide by Spirulina Sp. And Scenedesmus Obliquus Cultivated in a Three-Stage Serial Tubular Photobioreactor. J. Biotechnol. 129, 439–445. doi: 10.1016/j.jbiotec.2007.01.009
Müler-Navarra D. C., Brett M. T., Park S., Chandra S., Ballantyne A. P., Zorita E., et al. (2004). Unsaturated Fatty Acid Content in Seston and Tropho-Dynamic Coupling in Lakes. Nature 427, 69–72. doi: 10.1038/nature02210
Patil L., Kaliwal B. (2016). Effect of CO2 Concentration on Growth and Biochemical Composition of Newly Isolated Indigenous Microalga Scenedesmus Bajacalifornicus BBKLP-07. Appl. Biochem. Biotechnol. 182, 335–348. doi: 10.1007/s12010-016-2330-2
Peng H., Wei D., Chen G., Chen F. (2016). Transcriptome Analysis Reveals Global Regulation in Response to CO2 Supplementation in Oleaginous Microalga Coccomyxa Subellipsoidea C-169. Biotechnol. Biofuels 9, 151. doi: 10.1186/s13068-016-0571-5
Pierrot D., Lewis E., Wallace D. W. R. (2006). MS Excel Program Developed for CO2 System Calculations (Oak Ridge, Tennessee: Carbon Dioxide Information Analysis Center, Oak Ridge National Laboratory Vol.3 US Department of Energy).
Razzak S. A., Ilyas M., Ali S. A. M., Hossain M. M. (2015). Effects of CO2 Concentration and pH on Mixotrophic Growth of Nannochloropsis Oculata. Appl. Biochem. Biotechnol. 176, 1290–1302. doi: 10.1007/s12010-015-1646-7
Riebesell U., Revill A., Holdsworth D., Volkman J. (2000). The Effects of Varying CO2 Concentration on Lipid Composition and Carbon Isotope Fractionation in Emiliania Huxleyi. Geochim. Cosmochim. Acta 64, 4179–4192. doi: 10.1016/S0016-7037(00)00474-9
Rocha J. M. S., Garcia J. E. C., Henriques M. H. F. (2003). Growth Aspects of the Marine Microalga Nannochloropsis Gaditana. Biomol. Eng. 20, 237–242. doi: 10.1016/S1389-0344(03)00061-3
Rossoll D., Bermudez R., Hauss H., Schulz K. G., Riebesell U., Sommer U., et al. (2012). Ocean Acidification-Induced Food Quality Deterioration Constrains Trophic Transfer. PloS One 7, e34737. doi: 10.1371/journal.pone.0034737
Ryall K., Harper J. T., Keeling P. J. (2003). Plastid-Derived Type II Fatty Acid Biosynthetic Enzymes in Chromists. Gene 313, 139–148. doi: 10.1016/S0378-1119(03)00671-1
Sabia A., Clavero E., Pancaldi S., Rovira J. S. (2018). Effect of Different CO2 Concentrations on Biomass, Pigment Content, and Lipid Production of the Marine Diatom Thalassiosira Pseudonana. Appl. Microbiol. Biotechnol. 102, 1945–1954. doi: 10.1007/s00253-017-8728-0
Salie M. J., Thelen J. J. (2016). Regulation and Structure of the Heteromeric Acetyl-CoA Carboxylase. Biochim. Biophys. Acta Mol. Cell Biol. Lipids 1861, 1207–1213. doi: 10.1016/j.bbalip.2016.04.004
Smith P. K., Krohn R. I., Hermanson G. T., Mallia A. K., Gartner F. H., Provenzano M. D., et al. (1985). Measurement of Protein Using Bicinchoninic Acid. Anal. Biochem. 150, 76–85. doi: 10.1016/0003-2697(85)90442-7
Spalding M. H. (1989). Photosynthesis and Photorespiration in Freshwater Green Algae. Aquat. Bot. 34, 181–209. doi: 10.1016/0304-3770(89)90056-9
Sun Z., Chen Y. F., Du J. (2016). Elevated CO2 Improves Lipid Accumulation by Increasing Carbon Metabolism in Chlorella Sorokiniana.Plant Biotechnol. J. 14, 557–566. doi: 10.1111/pbi.12398
Tang D., Han W., Li P., Miao X.,, Zhong J., (2011). CO2 Biofixation and Fatty Acid Composition of Scenedesmus Obliquus and Chlorella Pyrenoidosa in Response to Different CO2 Levels. Bioresour. Technol. 102, 3071–3076. doi: 10.1016/j.biortech.2010.10.047
Torstensson A., Hedblom M., Andersson J., Andersson M. X., Wulff A. (2013). Synergism Between Elevated pCO2 and Temperature on the Antarctic Sea Ice Diatom Nitzschia Lecointei.Biogeosciences 10, 6391–6401. doi: 10.5194/bg-10-6391-2013
Torstensson A., Hedblom M., Mattsdotter, Bjork M., Chierici M., Wulff A., , (2015). Long-Term Acclimation to Elevated pCO2 Alters Carbon Metabolism and Reduces Growth in the Antarctic Diatom Nitzschia Lecointei. Proc. R. Soc B-Biol. Sci. 282, 20151513. doi: 10.1098/rspb.2015.1513
Trapnell C., Williams B. A., Pertea G., Mortazavi A., Kwan G., van Baren M. J., et al. (2010). Transcript Assembly and Quantification by RNA-Seq Reveals Unannotated Transcripts and Isoform Switching During Cell Differentiation. Nat. Biotechnol. 28, 511–515. doi: 10.1038/nbt.1621
Trimborn S., Thoms S., Brenneis T., Heiden J. P., Beszteri S., Bischof K. (2017). Two Southern Ocean Diatoms Are More Sensitive to Ocean Acidification and Changes in Irradiance Than the Prymnesiophyte Phaeocystis Antarctica. Physiol. Plant 160, 155–170. doi: 10.1111/ppl.12539
Tsuzuki M., Ohnuma E., Sato N., Takaku T., Kawaguchi A. (1990). Effects of CO2 Concentration During Growth on Fatty Acid Composition in Microalgae. Plant Physiol. 93, 851–856. doi: 10.1104/pp.93.3.851
Waite M., Wakil S. J. (1962). Studies on the Mechanism of Fatty Acid Synthesis. XII. Acetyl Coenzyme A Carboxylase. J. Biol. Chem. 237, 2750–2757. doi: 10.1016/S0021-9258(18)60223-6
Wang L., Feng Z., Wang X., Wang X., Zhang X. (2010). DEGseq: An R Package for Identifying Differentially Expressed Genes From RNA-Seq Data. Bioinformatics 26, 136–138. doi: 10.1093/bioinformatics/btp612
Wang X. W., Liang J. R., Luo C. S., Chen C. P., Gao Y. H. (2014). Biomass, Total Lipid Production, and Fatty Acid Composition of the Marine Diatom Chaetoceros Muelleri in Response to Different CO2 Levels. Bioresour. Technol. 161, 124–130. doi: 10.1016/j.biortech.2014.03.012
Keywords: Nannochloropsis oceanica, elevated pCO2, long-term acidification, metabolomics, transcriptomics, Brachionus plicatilis
Citation: Liang C, Zhang Y, Gu Z, Ren Y, Zhang X, Xu D and Ye N (2022) Elevated pCO2 Induced Physiological, Molecular and Metabolic Changes in Nannochloropsis Oceanica and Its Effects on Trophic Transfer. Front. Mar. Sci. 9:863262. doi: 10.3389/fmars.2022.863262
Received: 27 January 2022; Accepted: 16 June 2022;
Published: 22 July 2022.
Edited by:
Mi Sun Yun, Tianjin University of Science and Technology, ChinaReviewed by:
Yandu Lu, Hainan University, ChinaCarole Anne Llewellyn, Swansea University, United Kingdom
Rishiram Ramanan, Central University of Kerala, India
Copyright © 2022 Liang, Zhang, Gu, Ren, Zhang, Xu and Ye. This is an open-access article distributed under the terms of the Creative Commons Attribution License (CC BY). The use, distribution or reproduction in other forums is permitted, provided the original author(s) and the copyright owner(s) are credited and that the original publication in this journal is cited, in accordance with accepted academic practice. No use, distribution or reproduction is permitted which does not comply with these terms.
*Correspondence: Naihao Ye, WWVuaEB5c2ZyaS5hYy5jbg==