 Yaoyao Wang1,2
 Rong Bi1,2*
 Jing Zhang1,2,3
 Jiawei Gao1,2
 Shigenobu Takeda4
 Yoshiko Kondo4
 Fajin Chen5
 Gui’e Jin1,2
 Julian P. Sachs1,6
 Meixun Zhao1,2*
- 1Frontiers Science Center for Deep Ocean Multispheres and Earth System, and Key Laboratory of Marine Chemistry Theory and Technology, Ministry of Education, Ocean University of China, Qingdao, China
- 2Laboratory for Marine Ecology and Environmental Science, Qingdao National Laboratory for Marine Science and Technology, Qingdao, China
- 3Faculty of Science, University of Toyama, Toyama, Japan
- 4Graduate School of Fisheries and Environmental Sciences, Nagasaki University, Nagasaki, Japan
- 5College of Ocean and Meteorology, Guangdong Ocean University, Zhanjiang, China
- 6School of Oceanography, University of Washington, Seattle, WA, United States
The Northwest Pacific Ocean (NWPO) is a significant sink for atmospheric CO2 but a paucity of large-scale phytoplankton surveys in the upper and lower euphotic zone results in uncertainties in estimates of the efficiency of the biological carbon pump there. Here, we report the spatial distribution of lipid biomarkers from diatoms (brassicasterol/epi-brassicasterol), dinoflagellates (dinosterol), and haptophytes (C37 alkenones) as proxies of phytoplankton biomass and community structure in suspended particles from the surface and deep chlorophyll maximum (DCM) layers across low- and mid-latitude regions of the NWPO. Our observations suggest that these lipid biomarkers can be used as indicators of the vertical distributions of phytoplankton biomass, which was comparable between the surface and DCM layers. Water masses with different nutrient concentrations strongly controlled the variations of lipid biomarkers, showing high biomass and the dominance of diatoms in the eutrophic Oyashio region, whereas low biomass and high proportions of dinoflagellates and haptophytes occurred in the oligotrophic Kuroshio region. Diatoms predominated in the DCM, likely enhancing carbon sequestration in the deep ocean and in sediments. Our results quantitatively demonstrate the horizontal and vertical variations of phytoplankton biomass and community structure, leading to an improved understanding of ecosystem function and biogeochemical cycles in this important region of the NWPO.
Introduction
The Northwest Pacific Ocean (NWPO) is a key region of the global carbon cycle, where the highly effective biological carbon pump leads to intense biological drawdown of CO2 from surface waters (Takahashi et al., 2002; Honda, 2003; Chierici et al., 2006; Takahashi et al., 2009). The western boundary currents in the NWPO include the southward-flowing cold, low salinity and nutrient‐rich Oyashio current, and the northward-flowing warm, high salinity and nutrient‐deficient Kuroshio current, that converge in the Kuroshio-Oyashio mixed water region east of Japan (Figure 1; Kawai, 1972; Qiu, 2001; Yasuda, 2003). Moreover, a branch of the Kuroshio current intrudes into the East China Sea (ECS) and mixes with continental shelf water, forming the Tsushima Warm Current which enters the Japan Sea/East Sea (Lie and Cho, 1994; Qiu, 2001). These currents vary spatially and temporally and transport large quantities of heat and salt that impact the hydrography, climate, nutrient supply, and ecosystems of the NWPO (Sakurai, 2007; Hu et al., 2015; Schlundt et al., 2017).
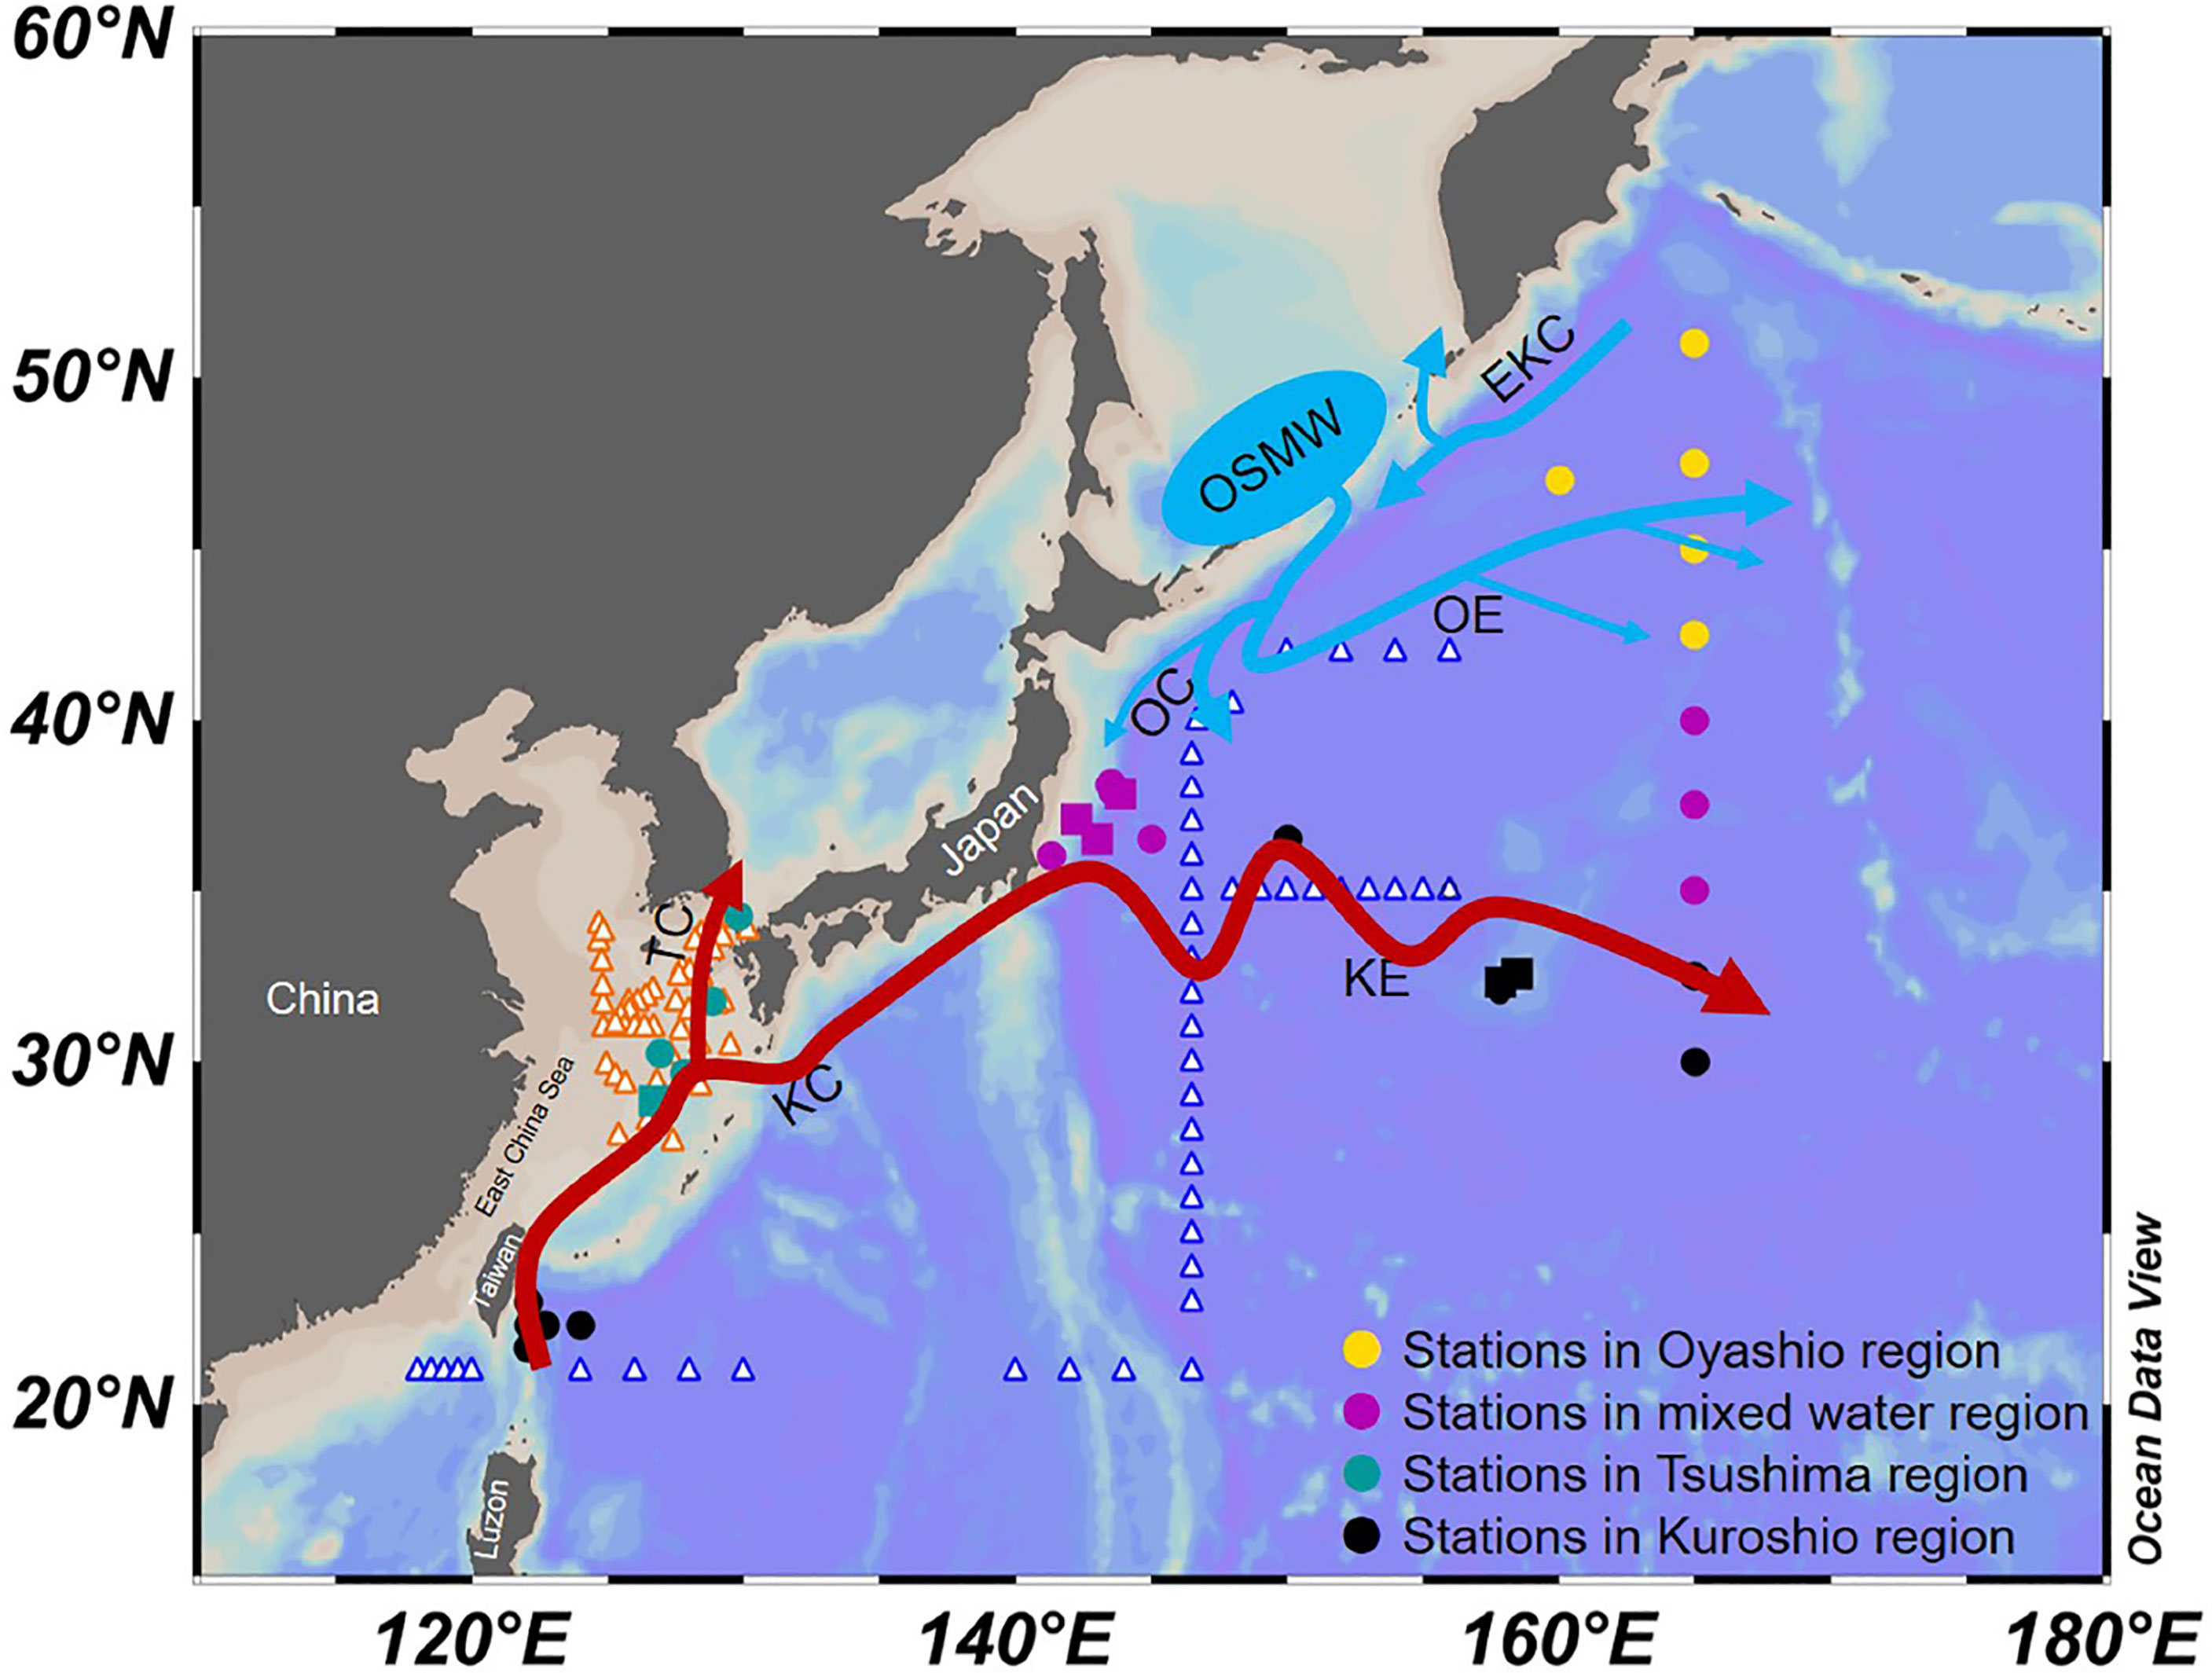
Figure 1 Oceanographic setting of the Northwest Pacific region and sampling locations in this and previous studies. Stations from this study are indicated by solid symbols (solid square: sampled only at surface; solid circle: sampled at both surface and DCM), and those from previous studies discussed are indicated by unfilled triangles [ are from Bi et al. (2018);
  are from Lin et al. (2020)]. KC, Kuroshio Current; KE, Kuroshio Extension; TC, Tsushima Current; OC, Oyashio Current; OE, Oyashio Extension; OSMW, Okhotsk Sea Mode Water; EKC, East Kamchatka Current. The current map is adapted from Yang et al. (2018) and Qiu (2001).
Phytoplankton production and community structure in the NWPO have been extensively studied on regional scales, highlighting nutrient availability as the most important environmental driver in different water masses. For example, the generation and spatial extent of spring blooms in the Oyashio region are related to the transport and pathway of the nutrient-rich coastal Oyashio water and its modified waters (Okamoto et al., 2010; Kuroda et al., 2019). In the Kuroshio Extension (KE), dissolved inorganic nitrogen and phosphorus (DIN and DIP) are the major factors controlling phytoplankton community structure in the northern and southern sections of this area, respectively, resulting in a decrease in diatoms and an increase in dinoflagellates and cyanobacteria from the eutrophic Oyashio region to the oligotrophic KE (Wang et al., 2021). Similarly, nutrient composition (i.e., N:P ratios) in the shelf mixed water and Kuroshio water also strongly regulate the phytoplankton community structure of the ECS (Guo et al., 2014; Liu et al., 2016). On the basin scale, previous studies using remote sensing have shown regional, seasonal, and interannual evolution of chlorophyll a (Chl a) in the NWPO (Yoder and Kennelly, 2003; Messié and Radenac, 2006; Hou et al., 2014); however, relatively few studies have examined phytoplankton community structure, principally through DNA metabarcoding, pigments, and microscopy (Suzuki et al., 1997; Endo et al., 2018; Endo and Suzuki, 2019; Lin et al., 2020). The relative scarcity of direct observations over large parts of the NWPO hinders our understanding of the spatial distributions of phytoplankton biomass and community structure, and by extension, their impact on the region’s biogeochemistry and carbon cycling.
Lipid biomarkers are source-specific, chemically stable, sensitive to environmental changes, and they have been widely utilized as proxies for phytoplankton productivity and community structure changes in both paleoenvironments and the modern ocean (Schubert et al., 1998; Zhao et al., 2006; Hernandez et al., 2008; Tolosa et al., 2008). In the NWPO, previous studies have focused on shelf-marginal sea and marginal sea-open ocean interactions by measuring lipid biomarkers in suspended particles (Li et al., 2014; Dong et al., 2015; Wu et al., 2016; Bi et al., 2018; Ko et al., 2018). These studies have shown that lipid biomarkers can be used to reconstruct Holocene phytoplankton productivity and community structure changes in the ECS and the Yellow Sea (Wu et al., 2016). They have also demonstrated the control of water masses on the spatiotemporal variations of phytoplankton in the Northeastern ECS and the Western Tsushima Strait (Bi et al., 2018; Figure 1). In the Southeast Pacific, the distribution of lipid biomarkers in suspended particles at different depths demonstrated that vertical distribution patterns differed between lipid biomarkers and Chl a, resulting in the biomarker/Chl a ratio decreasing with depth (Tolosa et al., 2008). However, over a large area of the NWPO there is insufficient data from direct field observations to characterize horizontal and vertical distributions of phytoplankton biomass and community that Chl a alone cannot reveal (Cullen, 1982).
In this study, we report lipid biomarker concentrations in suspended particulate samples collected from surface water and at the depth of the deep chlorophyll maximum (DCM) from more than 28 stations in the NWPO during summer. The concentrations of brassicasterol/epi-brassicasterol, dinosterol, and C37 alkenones are used as proxies for the biomass of diatoms, dinoflagellates, and haptophytes, respectively, with their sum (ΣPB) representing the total phytoplankton biomass (Schubert et al., 1998; Wu et al., 2016; Bi et al., 2018). While abundant in number, cyanobacteria were excluded from our study due to their lower biomass as compared to that of eukaryotic phytoplankton we are quantifying (Wang et al., 2021). We also measured temperature, salinity, Chl a and major nutrients (DIN [nitrite and nitrate], DIP, and silicate [Si]) to elucidate the mechanisms controlling phytoplankton biomass and community structure in the study area. Our aims are to determine (i) the horizontal and vertical variations of phytoplankton biomass and community structure as discerned from lipid biomarkers, and (ii) the influences of different oceanographic characteristics on distribution patterns of phytoplankton over a large region in the NWPO and the implications for the marine carbon cycle.
Materials and Methods
Study Area and Sample Information
The study area covers latitudes between 21–51°N and longitudes between 122–165°E in the NWPO, spanning the Kuroshio and KE (hereafter Kuroshio) and Oyashio and Oyashio Extension (hereafter Oyashio) regions (Figure 1; Qiu, 2001). The Kuroshio flows northward from the Luzon Island, along the east coast of Taiwan and the shelf break of the East China, to east of Japan (Nitani, 1972) and was defined in this study by temperatures higher than 14°C at 200-m depth (Kawai, 1972). The Tsushima Warm Current, as a branch of the Kuroshio, mixes with lower salinity continental shelf water and flows northward through the Tsushima Strait into the Japan Sea/East Sea (Uda, 1934; Nitani, 1972; Lie and Cho, 1994). The Oyashio Current, originating from the East Kamchatka Current and mixing with Okhotsk Sea Mode water, flows southwestward over the continental slope to the Hokkaido coast and then returns northeastward (Qiu, 2001). The cold, low-salinity Oyashio water is defined here as having a salinity below 33.7 PSU at 100-m depth (Kawai, 1972). The region between the KE and Oyashio Extension, where waters of the Oyashio, the Kuroshio, and Tsugaru Currents meet and mix is characterized by steep temperature and salinity gradients (Kawai, 1972; Talley et al., 1995).
Samples were collected during four summer cruises (16 July to 4 August 2011, 19–28 July 2017, 8–18 July 2019, and 20 July to 9 August 2019; Supplementary Figure S1). A total of 34 stations were sampled at the surface layer (depth: 0–5 m; water volume: 77–715 L), and 28 of those were also sampled at the depth of the DCM (depth: 22–136 m; water volume: 30–120 L; Figure 1). The nutrient sampling depths were close to those of the particulate samples.
Sample Analysis
Suspended particles for lipid biomarker analyses were obtained by filtration on pre-combusted glass microfiber filters (Whatman GF/F filters) that were subsequently stored at –20°C. The quantification of lipid biomarkers followed published methods (Wang et al., 2019). Briefly, freeze-dried samples were extracted with a solvent mixture (dichloromethane/MeOH 3:1, v/v) after adding a C19 n-alkanol standard, and then saponified with 6% KOH in MeOH. The polar fraction was isolated using silica gel column chromatography and eluting with dichloromethane/methanol (95:5, v/v), followed by derivatization with N,O-bis(trimethylsilyl)-trifluoroacetamide (BSTFA). Sterols and C37 alkenones were analyzed with an Agilent 7890N gas chromatograph (GC) equipped with a flame ionization detector (FID), using an HP-1 capillary column (50 m × 0.32 mm × 0.17 μm). Quantification of lipid biomarkers was conducted by GC-FID comparing peak areas with that of the C19 n-alkanol internal standard with a precision of 10%.
Salinity, temperature and Chl a fluorescence were measured in situ with a CTD instrument (SBE-911plus, Sea Bird Electronics Inc., USA). At 27 of the 34 stations, Chl a was also extracted using 90% acetone (four stations) and N, N-dimethylformamide (DMF) (23 stations), respectively, and the concentration of Chl a was measured using a fluorometer (Lorenzen, 1967; Suzuki and Ishimaru, 1990; Welschmeyer, 1994). A high correlation between CTD-based fluorescence and solvent-extracted Chl a indicated that the difference between the two methods was not significant at the suspended particle sampling depths (Supplementary Figure S2A). CTD-based fluorescence was therefore used in this study to determine Chl a spatial distributions, and for the correlation analyses between Chl a and lipid biomarkers.
For nutrients (nitrate, nitrite, phosphate and silicate), samples collected during the cruise of 20 July to 9 August 2019 were filtered through cellulose acetate membranes (pore size: 0.45 μm) and samples collected during other cruises were unfiltered. Nutrient concentrations were measured with a SWAAT auto-analyzer (BLTEC Japan) for samples from the cruise during 16 July to 4 August 2011, an AACS-IV auto-analyzer (BLTEC Japan) for the 19–28 July 2017 cruise, a QuAAtro39 auto-analyzer (BLTEC Japan) for the 8–18 July 2019 cruise, and a San++ continuous flow analyzer (Skalar, Netherlands) for the 20 July to 9 August 2019 cruise. Standard colorimetric analysis protocols were applied for the four auto-analyzers, i.e., nitrate + nitrite by a Cu-Cd reduction and an azo dye formation method, nitrite by an azo dye formation method, phosphate by a molybdenum blue method, and silicate by a molybdenum blue method. Data were calibrated against certified reference materials for nutrients (National Center of Ocean Standards and Metrology for the cruise of 20 July to 9 August 2019, and KANSO TECHNOS for other cruises) to minimize the difference in measuring precision between the four auto-analyzers.
The vertical stratification index (VSI) was estimated to quantify the degree of vertical stratification of the water column (Mena et al., 2019; Chen et al., 2021): VSI = Σ [σ0(m+1) – σ0(m)], where “σ0” is the potential density anomaly, and m is the depth in meters ranging from 5 to 200 m. A larger VSI indicates stronger stratification. In our study, the VSI ranged from 1.3 to 5.1, with higher values in the Tsushima region and lower ones in the Oyashio and mixed water regions (Supplementary Figure S2B).
Data Analysis
Spearman’s rank correlation analyses were applied to test the relationship between ΣPB and Chl a, between lipid biomarker concentrations (and their proportions) and environmental parameters (temperature, salinity and nutrients), and between VSI and environmental parameters. Wilcoxon signed-rank tests were used to evaluate the differences in lipid biomarker concentrations (and their proportions) between the surface and DCM layers. All statistical analyses were conducted using IBM SPSS Statistics 26, with a significance level set at p < 0.05.
Results
Hydrological Data and Nutrients
A DCM layer occurred at all stations and varied widely in depth (22 to 136 m), showing an overall shoaling from south to north (Supplementary Figures S3N–Q). Owing to this wide depth range of the DCM, we show our data graphically at the surface and DCM layers rather than at depth layers in the main text (Figures 2–4) but provide those data in depth space in the Supplementary Material (Supplementary Figures S3 and S6).
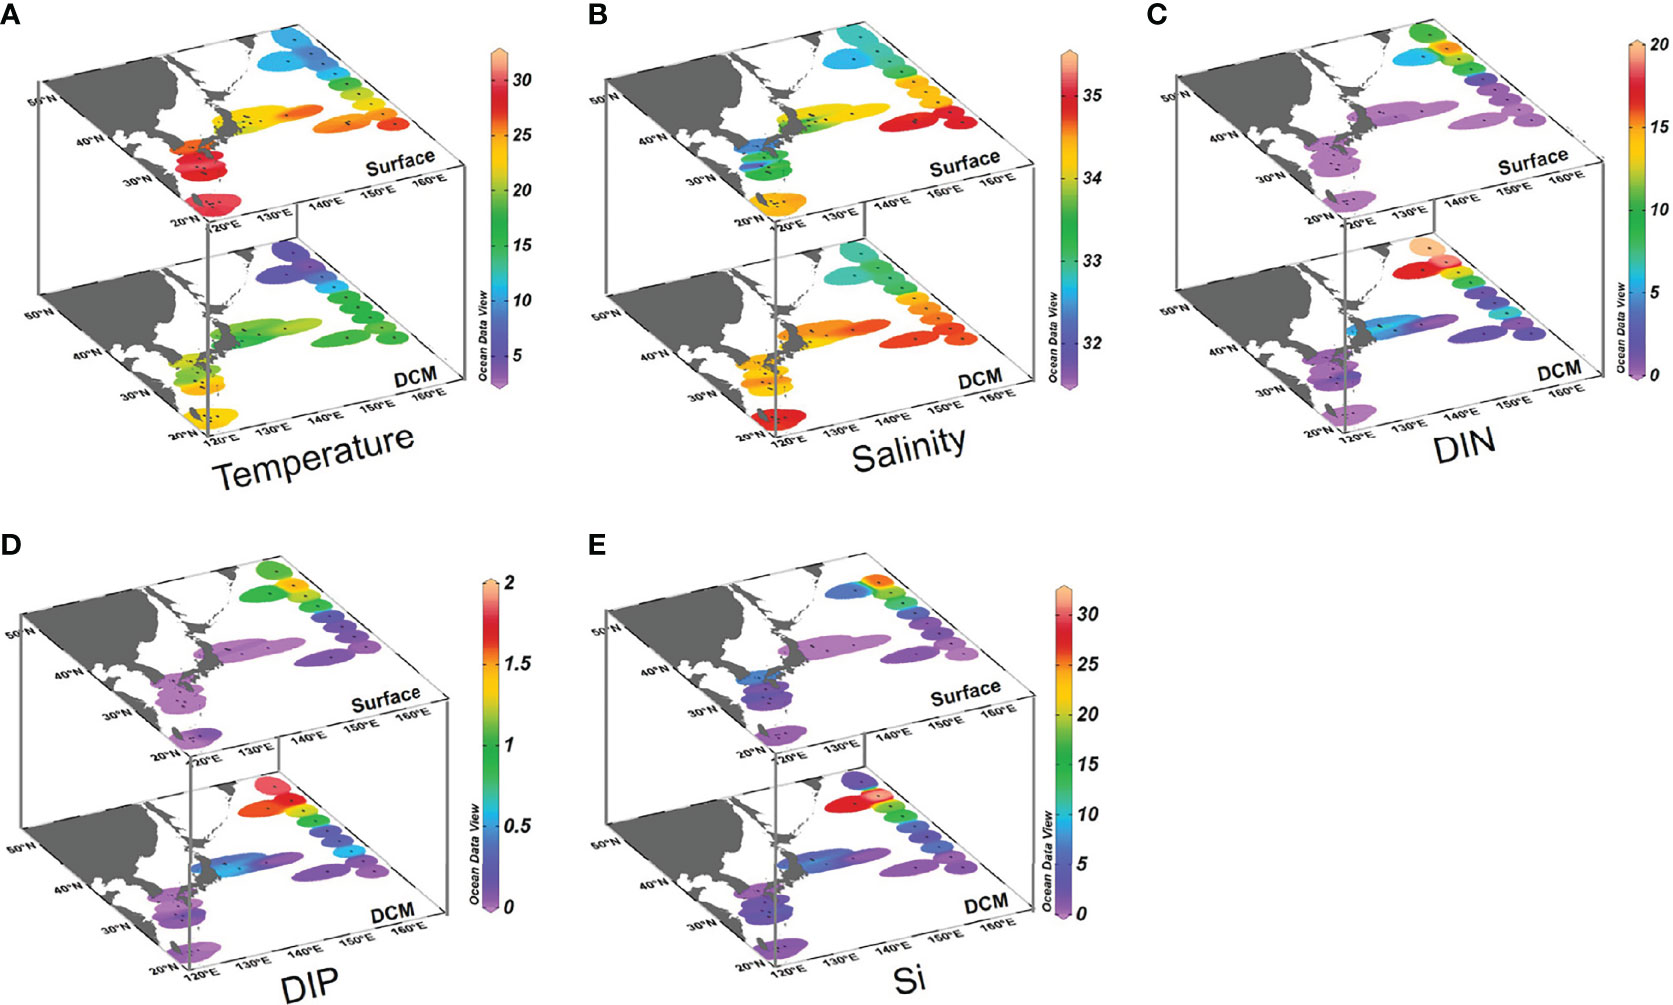
Figure 2 Distributions of temperature, salinity and nutrients in Northwest Pacific Ocean surface and DCM waters during summer: (A) temperature (°C), (B) salinity (PSU), (C) dissolved inorganic nitrogen (DIN; μmol L−1), (D) dissolved inorganic phosphorus (DIP; μmol L−1), and (E) dissolved silicate (Si; μmol L−1). Note the difference in color scales.
The temperature ranged from 8.8 to 30.4°C in surface waters, and 4.4 to 25.2°C in DCM waters (Figure 2A and Supplementary Table S1). The salinity ranged from 31.8 to 35.0 PSU in surface waters and 32.9 to 34.9 PSU in DCM waters (Figure 2B). The density revealed well stratified water columns (Supplementary Figures S3J–M). Temperature and salinity decreased from south to north at both surface and DCM layers, showing significant spatial differences associated with the different water masses (Figures 2A, B). Four distinct regions were identified according to the distributions of salinity and temperature (Figure 1 and Supplementary Figure S3). In the Oyashio region, water masses were constrained by salinity < 33.7 PSU and temperature < 7°C at 100-m depth, while in the Kuroshio region water masses were constrained by salinity > 34.7 PSU and temperature > 14°C at 200-m depth (Supplementary Figures S3B–I). In the mixed water region, temperature and salinity were markedly lower than those in the Kuroshio region and higher than those in the Oyashio region. Temperature in the Tsushima region was similar to that of the KE, but the salinity was clearly lower in the former region. The depth of the DCM varied between the four areas, ranging from 25 to 60 m (35 m on average) in the Oyashio region, 22 to 70 m (40 m on average) in the mixed water region, 36 to 72 m (56 m on average) in the Tsushima region, and 75 to 136 m (105 m on average) in the Kuroshio region (Supplementary Figures S3N–Q).
The concentrations of DIN, DIP and Si were low in all surface water samples, ranging from 0 to 15.42 μmol L−1, 0 to 1.48 μmol L−1, and 0.1 to 25.7 μmol L−1, respectively (Figures 2C–E and Supplementary Table S1). Nutrient concentrations in DCM waters were higher than in surface waters, ranging from 0 to 19.93 μmol L−1 for DIN, 0 to 1.85 μmol L−1 for DIP, and 0.6 to 31.4 μmol L−1 for Si, respectively. Nutrient concentrations displayed similar spatial patterns between the surface and DCM layers, showing higher values in the Oyashio region.
Lipid Biomarker and Chl a Concentrations
Brassicasterol/epi-brassicasterol concentrations ranged from 8.3 to 218 ng L−1 in surface waters and 19 to 194 ng L−1 in DCM waters over the entire study area, being highest in the Oyashio region (Figure 3A and Supplementary Table S1). The concentration of dinosterol ranged from 1.0 to 41 ng L−1 in surface waters and 0.9 to 26 ng L−1 in DCM waters, differing in its spatial distribution relative to brassicasterol/epi-brassicasterol in both surface and DCM waters, and highest in the Tsushima region (Figure 3B). The concentrations of C37 alkenones ranged from 0 to 52 ng L−1 in surface waters and 0 to 20 ng L−1 in DCM waters, with high values in the mixed water region (Figure 3C). Overall, brassicasterol/epi-brassicasterol concentrations were similar in surface and DCM waters, while dinosterol and C37 alkenone concentrations tended to be higher in surface waters than in DCM waters. ΣPB concentrations were similar between surface (9.3–226 ng L−1) and DCM (20–209 ng L−1) waters, resembling the spatial pattern of brassicasterol/epi-brassicasterol (Figures 3A, D). Unlike ΣPB, Chl a in DCM waters (0.09–1.97 μg L−1) was five times higher than in surface waters (0.01–0.71 μg L−1; Figure 3E).
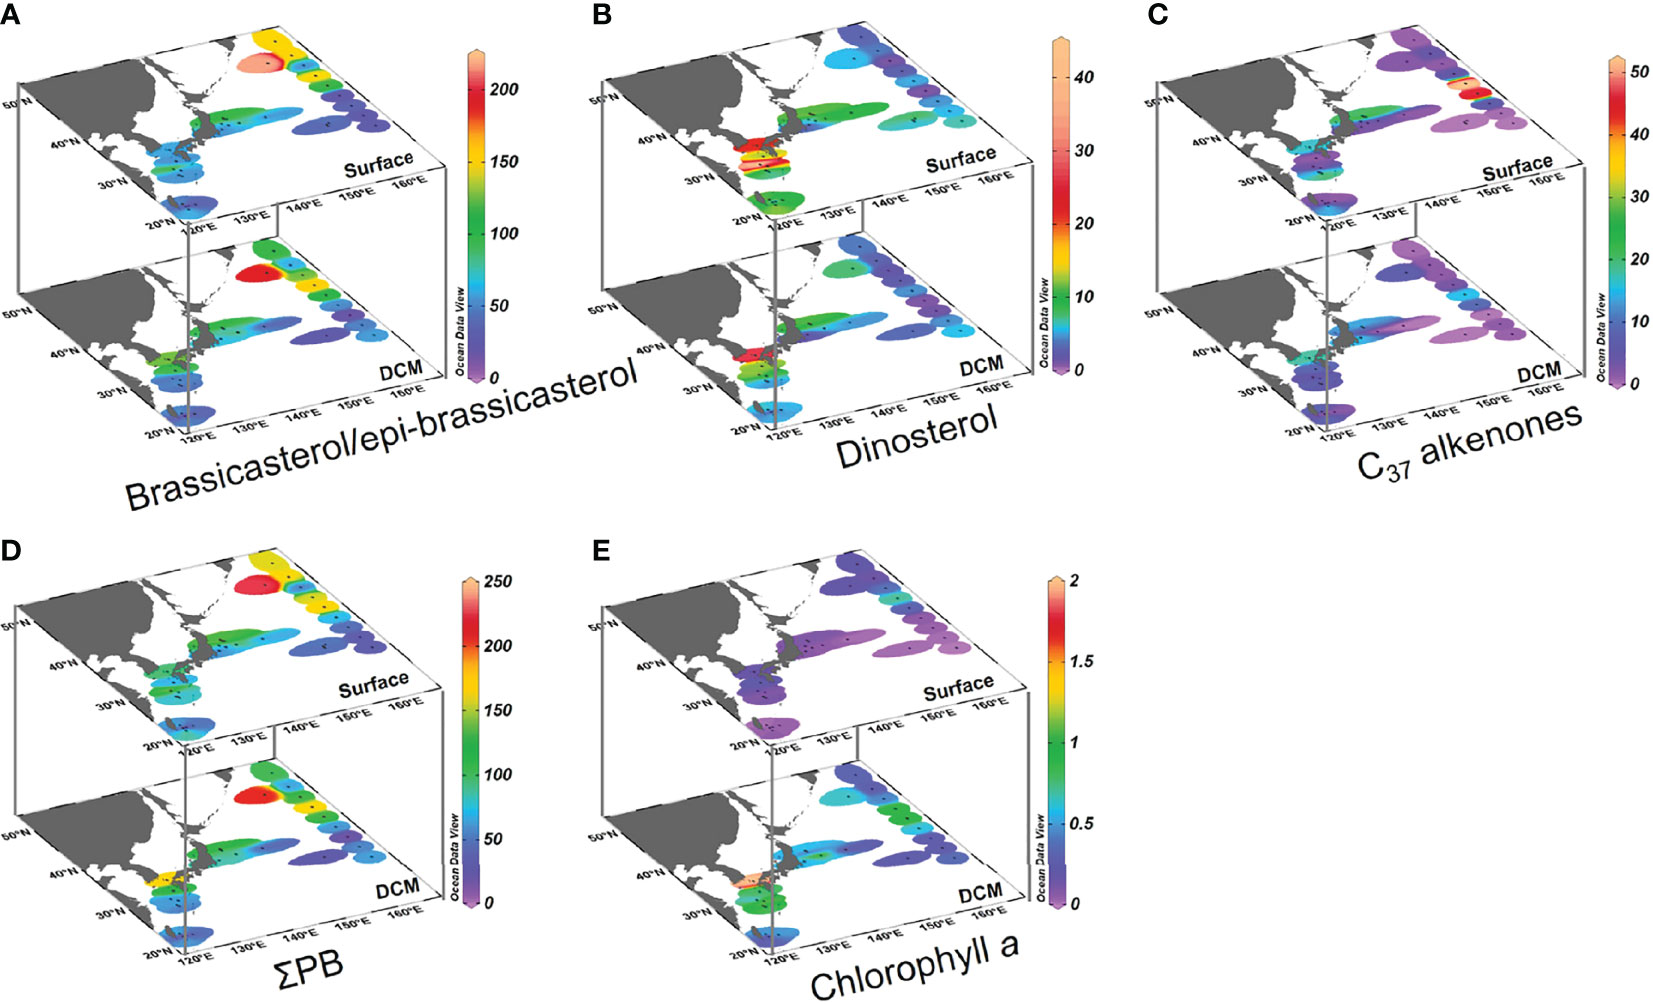
Figure 3 Distributions of lipid biomarkers and chlorophyll a in surface and DCM waters of the Northwest Pacific Ocean in summer: (A) brassicasterol/epi-brassicasterol (ng L−1ng L−1), (B) dinosterol (ng L−1), (C) C37 alkenones (ng L−1), (D) the sum of brassicasterol/epi-brassicasterol, dinosterol, and C37 alkenones (ΣPB; ng L−1), and (E) chlorophyll a (μg L−1). Note the difference in color scales.
Lipid Biomarker Proportion (% of ΣPB)
The ratios of brassicasterol/epi-brassicasterol to ΣPB (B/ΣPB) ranged from 35% to 97% in surface waters and 73% to 97% in DCM waters, with high-values in the Oyashio region (> 90%; Figures 4A, 5 and Supplementary Table S1). In contrast, the ratios of dinosterol to ΣPB (D/ΣPB) were relatively high outside the Oyashio region in both surface (1–29%) and DCM (1–20%) waters, especially in the Tsushima region (Figures 4B, 5). The ratios of C37 alkenones to ΣPB (A/ΣPB) ranged from 0 to 64% in surface waters and 0 to 19% in DCM waters, with high values in the mixed water region (Figures 4C, 5). B/ΣPB tended to be higher in DCM relative to surface waters, while D/ΣPB and A/ΣPB tended to be higher in surface waters relative to DCM waters (Figure 5).
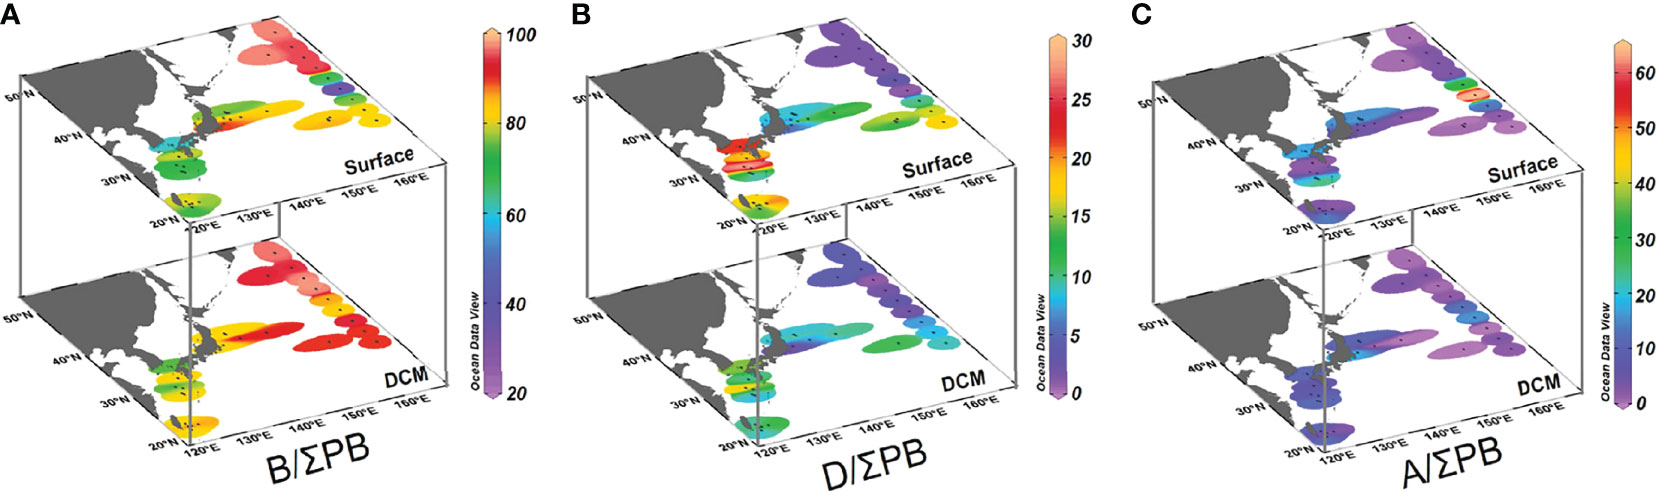
Figure 4 Distributions of individual lipid biomarker proportions (% of the sum of the three lipid biomarkers [ΣPB]) in surface and DCM waters of the Northwest Pacific Ocean in summer: (A) (brassicasterol/epi-brassicasterol)/ ΣPB, (B) dinosterol/ΣPB, and (C) C37 alkenones/ΣPB. Note the difference in color scales.
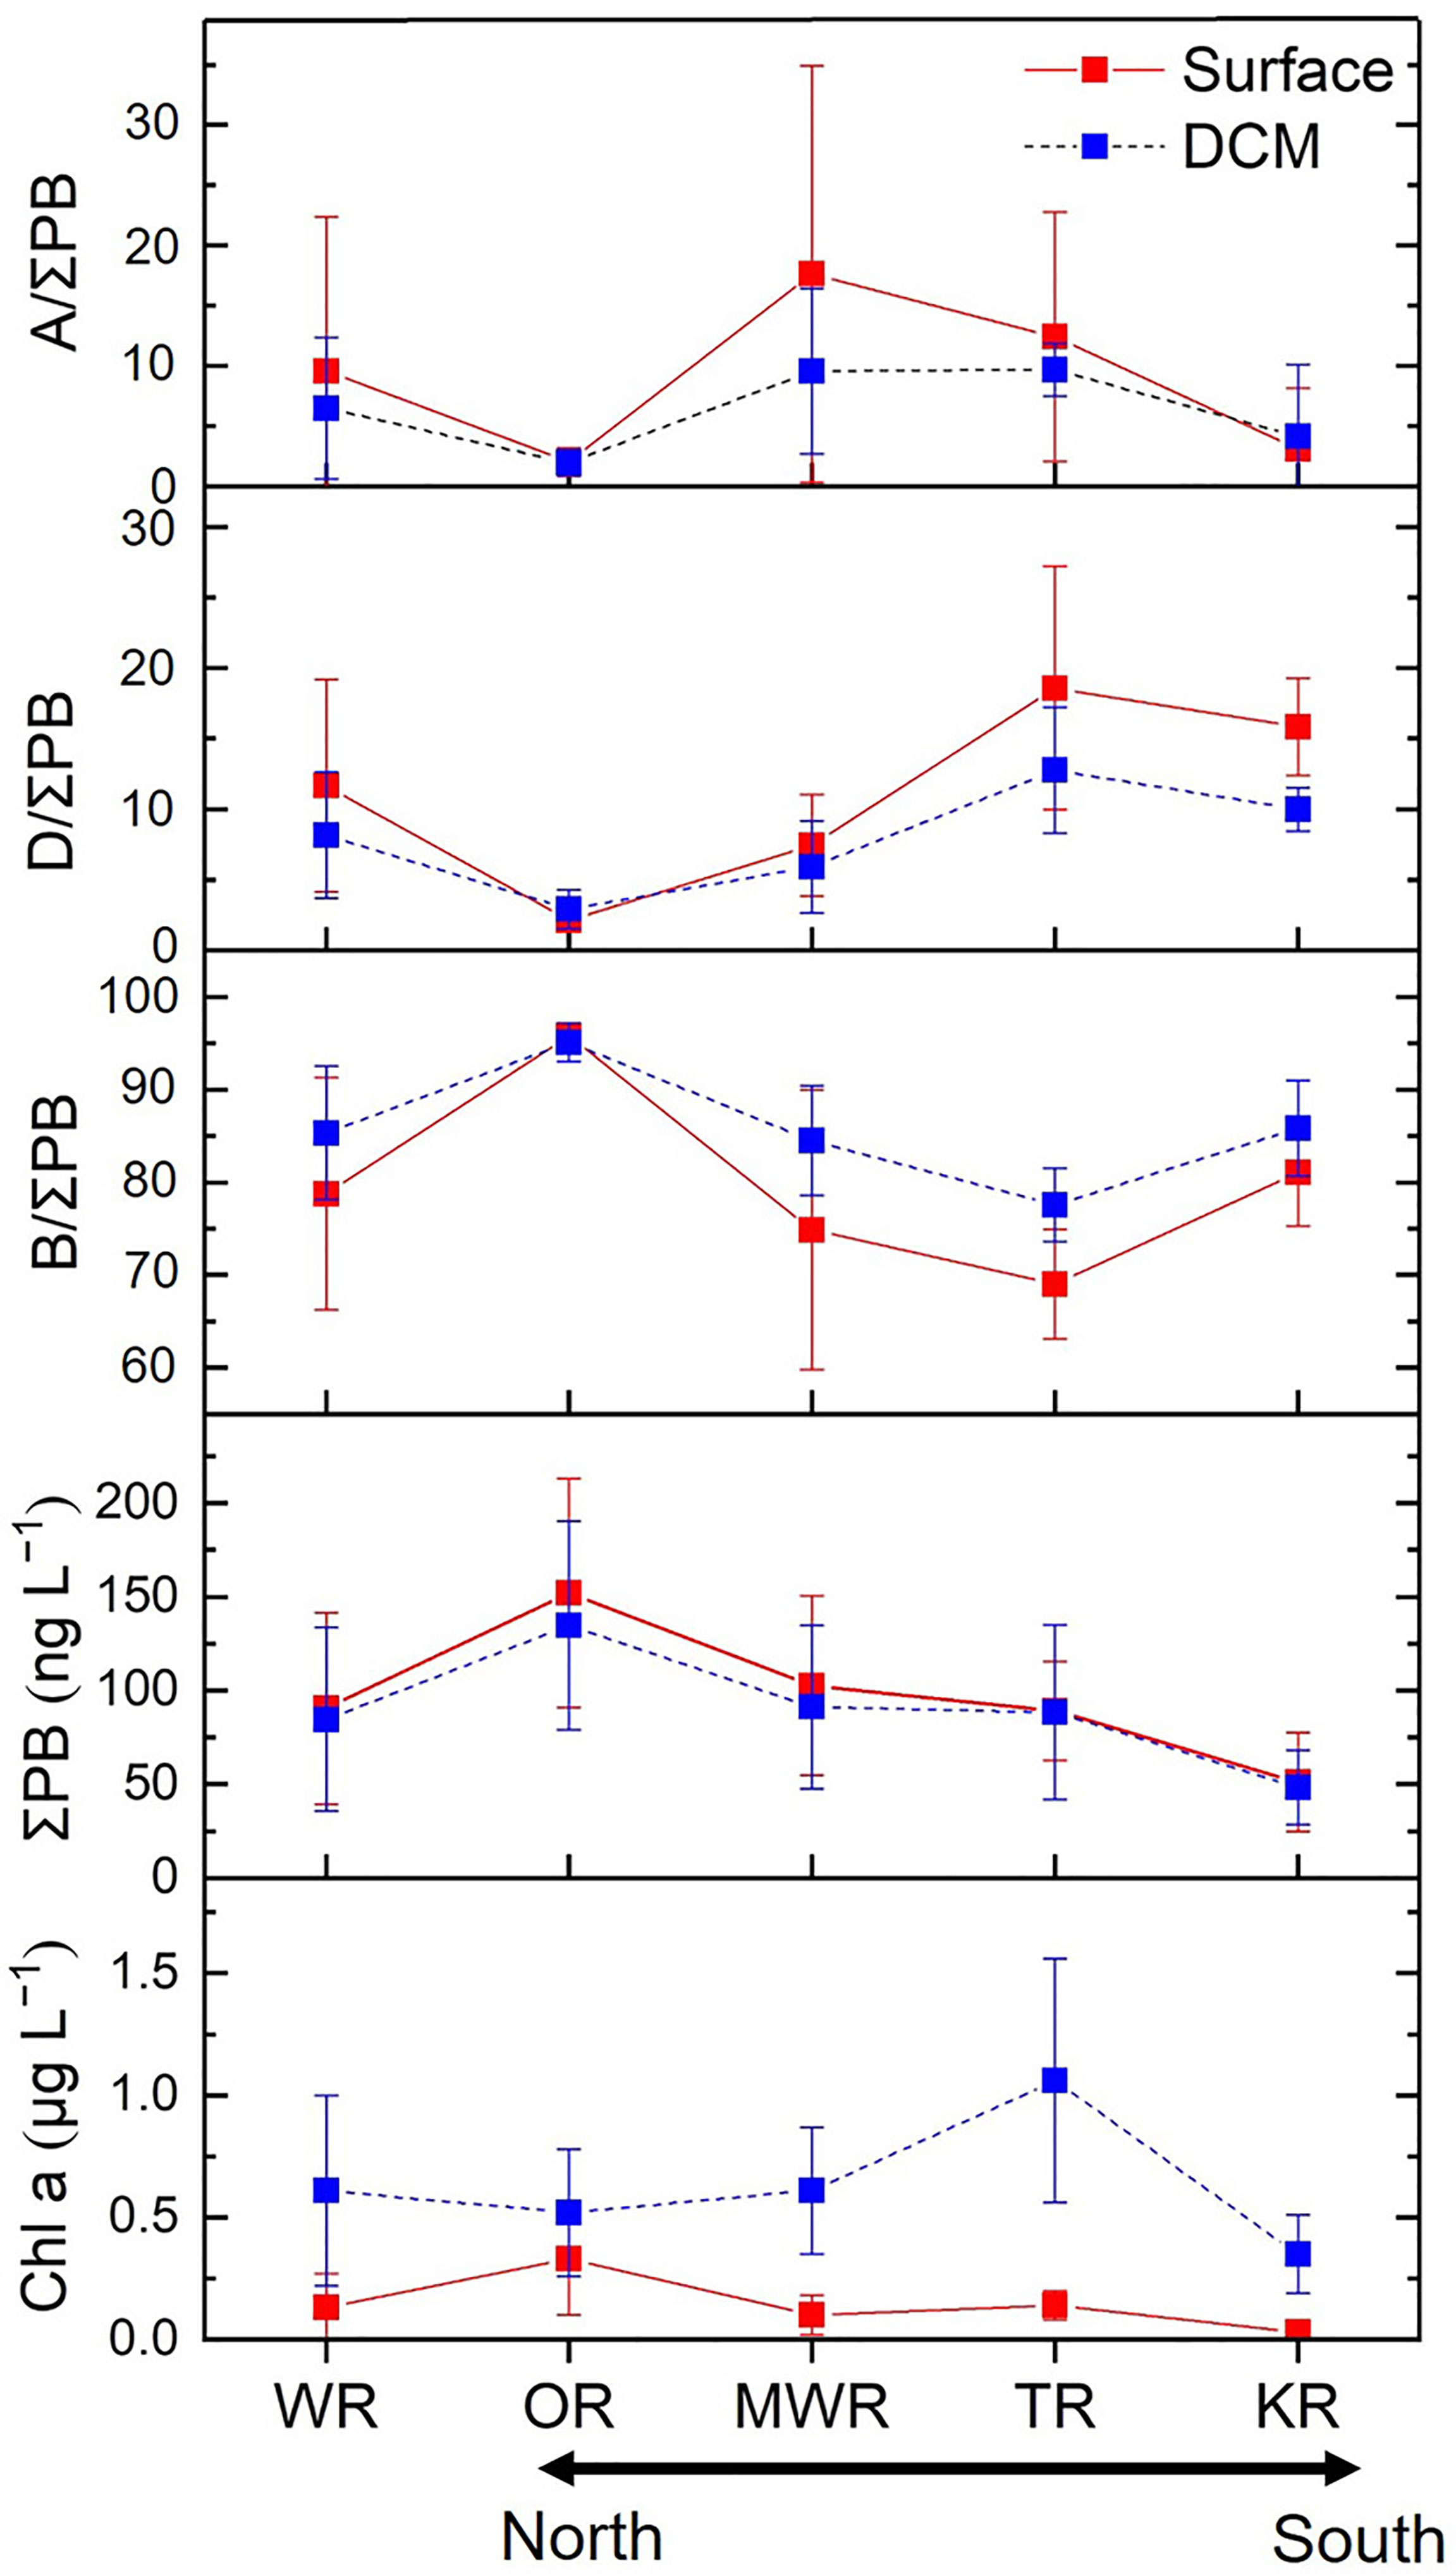
Figure 5 Mean values (± SD) of individual lipid biomarker proportions (%), ΣPB concentrations (the sum of the three lipid biomarkers; ng L−1) and chlorophyll a concentrations (μg L−1) in surface and DCM waters of the four regions and the whole study area (WR). OR, Oyashio Region; MWR, Mixed Water Region; TR, Tsushima Region; KR, Kuroshio Region.
Correlation Analyses and Wilcoxon Signed-Rank Tests
ΣPB and Chl a had highly significant positive correlations in both surface (Spearman’s correlation coefficient r = 0.708; p < 0.001) and DCM (r = 0.611; p = 0.001) waters over the whole study area. These two parameters also correlated positively across the surface and DCM layers (r = 0.336; p = 0.009).
Across the two water layers, the concentrations of ΣPB correlated positively with DIN and Si (p ≤ 0.042; Table 1), but negatively with temperature and salinity (p ≤ 0.024). The concentrations of brassicasterol/epi-brassicasterol and B/ΣPB correlated positively with nutrients (DIN, DIP and Si; p ≤ 0.044) and negatively with temperature (p ≤ 0.002), opposite to the correlations for dinosterol and D/ΣPB, which correlated negatively with nutrients (DIN and DIP; p < 0.001) and positively with temperature (p < 0.001). Non-significant correlations were found between the concentrations of C37 alkenones (and A/ΣPB) and nutrients. VSI had a positive correlation with temperature (p < 0.001) and negative correlations with nutrients (DIN, DIP and Si; p < 0.05) in both surface and DCM layers. Between the two water layers, the dinosterol concentrations and D/ΣPB were significantly higher in surface waters than in DCM waters (Wilcoxon signed rank test: p ≤ 0.006; n = 28), opposite to B/ΣPB, which was significantly higher in DCM waters than in surface waters (p ≤ 0.001; n = 28). Non-significant differences between surface and DCM waters were observed for the concentrations of ΣPB, brassicasterol/epi-brassicasterol, C37 alkenones, as well as A/ΣPB (p > 0.05; n = 28).
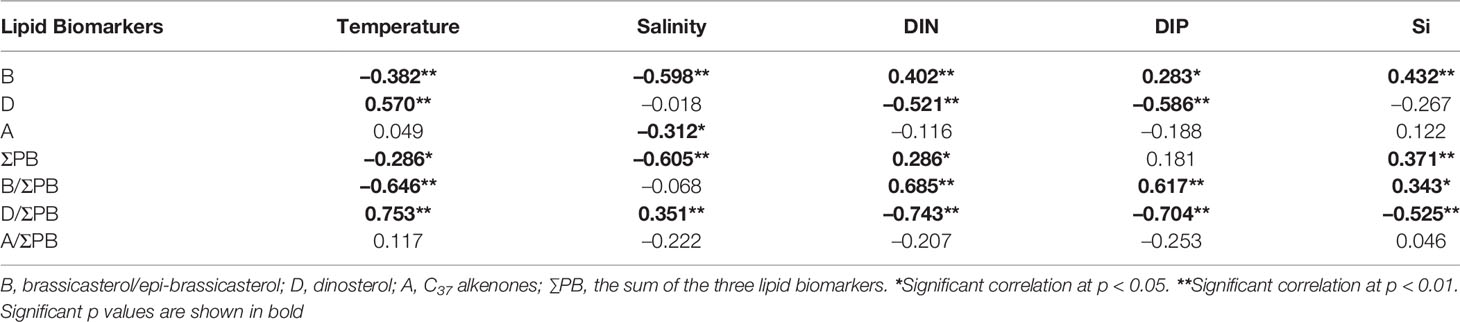
Table 1 Spearman’s correlation coefficients between lipid biomarkers and temperature, salinity, and nutrients across the surface and DCM layers.
Discussion
Spatial Distribution Patterns of Lipid Biomarkers in the NWPO
Lipid biomarkers in the NWPO were characterized by distinct horizontal and vertical distribution patterns. Surface and DCM waters of the Oyashio region were characterized by high concentrations of ΣPB and high concentrations and relative proportions of brassicasterol/epi-brassicasterol, while the Tsushima and Kuroshio regions had the highest concentrations and relative proportions of dinosterol (Figures 3–5). The mixed water region was characterized by highest concentrations and relative proportions of C37 alkenones (Figures 3C, 4C, 5). Similarly, published enumerations of phytoplankton (cell size > 5 or 10 μm) and pigment analyses showed that the maximum phytoplankton abundance and biomass occurred in the Oyashio region where diatoms predominated, while the proportion of dinoflagellates increased significantly in the oligotrophic Kuroshio region (Suzuki et al., 1997; Lin et al., 2020; Wang et al., 2021; Figure 1). Coccolithophore blooms (revealed by high reflectance in satellite imagery) were observed between 35°N and 50°N (Takahashi et al., 1995), and electron microscopic studies verified coccolithophore abundances were high south of 41°N in the Western Pacific (Hattori et al., 2004), overlapping with our mixed water region (35–40°N) that had high proportions of C37 alkenones. In addition, we observed highly significant positive correlations and similar distributions between ΣPB and Chl a in both surface (r = 0.708; p < 0.001) and DCM (r = 0.611; p = 0.001) waters. However, the correlation was weaker between the two layers (r = 0.336; p = 0.009). The weaker correlation may be attributed to different vertical distributions between Chl a and lipid biomarkers.
Vertically, the distribution patterns of lipid biomarker concentrations were broadly comparable between the surface and DCM layers, e.g., non-significant differences for ΣPB between the two layers (Wilcoxon signed rank test: p > 0.05). However, we observed strong vertical variations in the concentrations of Chl a, with the mean value in DCM waters (mean value: 0.61 μg L−1) being five times higher than that in surface waters (mean value: 0.13 μg L−1; Figures 3E, 5 and Supplementary Table S1). Consequently, the ratio of ΣPB to Chl a was lower at the DCM than in the surface (Supplementary Figure S4). Similar finding was reported in the South Pacific Gyre, where the ratio of lipid biomarkers (the sum of C28△5,24(28) sterol, dinosterol and total alkenones) to Chl a decreased with depth (calculated based on the data in Tolosa et al. (2008)). It is well known that the depth of Deep Biomass Maximum (DBM) often differs from the depth of the DCM since the two are generated by different mechanisms: the DBM occurs where phytoplankton growth rate is balanced by losses (e.g., respiration and grazing) and the divergence in sinking velocity, and the DCM is primarily determined by photoacclimation (Steele, 1964; Cullen, 1982; Fennel and Boss, 2003; Cullen, 2015). Thus, phytoplankton carbon to Chl a ratios generally decrease with depth as phytoplankton become acclimated to low irradiance and nutrient-replete conditions. The occurrences, drivers and characteristics of the DCM and DBM have been shown to have strong latitudinal and reginal patterns in the global ocean, with three distribution patterns identified in the NWPO (Cornec et al., 2021). The Shallow Maxima Zone is characterized by low occurrence of shallow DCMs and DBMs with high Chl a. The Deep photoAcclimation Zone is characterized by the weakest and deepest DCMs with the highest yearly occurrence. And the Deep Biomass Zone is characterized by the highest proportion of DBM profiles (Cornec et al., 2021). In our study, the ratio of ΣPB to Chl a varied between different regions at both the surface and DCM layers (Supplementary Figure S4). In particular, we observed a substantially higher ΣPB to Chl a ratio in the DCM within the Oyashio region compared to other regions (Supplementary Figure S4). This result is consistent with the findings of Cornec et al. (2021) suggesting that high phytoplankton biomasses occur within the DCM (Shallow Maxima Zone: sporadic and event-driven DCM) in high-latitude regions of the NWPO.
In summary, we observed overall comparable concentrations of total lipid biomarkers between the surface and DCM layers; and the vertical decrease of ΣPB to Chl a ratio is consistent with previous work on lipid biomarkers in other oceanic regions such as the South Pacific Gyre (Tolosa et al., 2008). Our results further support the use of lipid biomarkers as a proxy for the vertical distributions of phytoplankton biomass, and the biomarker/Chl a ratio change with depth has important implications for ecological and biogeochemical studies. For example, a low availability of dietary sterols has been observed to constrain zooplankton growth and reproduction (Martin-Creuzburg and Elert, 2009; Peltomaa et al., 2017), and thus dietary sterol deficiency may potentially reduce carbon transfer efficiency in food webs and subsequently lower the production of high trophic levels. Therefore, our results on sterols and alkenones will provide an important basis for investigations on food web dynamics and the biological carbon pump in the NWPO.
Controlling Mechanisms of Phytoplankton Biomass and Community Structure as Revealed by Lipid Biomarkers
As mentioned above, lipid biomarker results clearly reveal the spatial distribution of phytoplankton biomass and community structure in the NWPO in summer. Furthermore, significant correlations between lipid biomarkers and hydrological (and nutrient) parameters (Table 1) show that the concentrations and distributions of lipid biomarkers were strongly associated with the chemical and physical characteristics of different water masses, throughout the Kuroshio-Oyashio region (Supplementary Figure S5). Thus, our results provide the biomarker data and environmental parameters to evaluate the mechanisms controlling phytoplankton biomass and community structure in this oceanographically diverse region.
Phytoplankton Biomass
In the Oyashio region, blooms are an annual spring-time phenomenon, and primary production and phytoplankton abundance in summer are higher than other regions in the western subarctic Pacific Ocean (Saito et al., 2002; Liu et al., 2004; Hayakawa et al., 2008). Indeed, nutrient concentrations in the Oyashio region were the highest in the region, with the concentrations of DIN (5.78–19.93 μmol L−1; at the surface and DCM layers), DIP (0.86–1.85 μmol L−1) and Si (2.5–31.4 μmol L−1) well above the threshold for limiting phytoplankton growth (DIN = 1.0 μmol L−1, DIP = 0.1 μmol L−1, Si = 2 μmol L−1, respectively; Fisher et al., 1992). Thus, the high ΣPB in the Oyashio region in summer (Figures 3D, 5 and Supplementary Table S1) reflected sufficient nutrient supply for phytoplankton growth in this area. Within the Oyashio region, a notable phenomenon was observed at station TR16 (47°N and 160°E) near the Kuril island chain (Supplementary Figure S1), characterized by high surface concentrations of ΣPB (Figure 3D). A plausible explanation is an abundance of iron (as reviewed by Nishioka et al. (2021)). Dissolved Fe originating from the Sea of Okhotsk is transported into the NWPO through intermediate water (Nishioka et al., 2013). The ratio of dissolved Fe to DIN (nitrate plus nitrite) in the intermediate water decreases east of 155°E in the subarctic Pacific, and the Kuril island chain is a hot spot for nutrient being upwelled from intermediate to surface waters (Nishioka et al., 2020). High availability of both dissolved Fe and macronutrients may therefore be responsible for the high phytoplankton biomass (as ΣPB) west of the Oyashio region.
Conversely in the region directly influenced by the Kuroshio Current, nutrient concentrations are quite low throughout the year, resulting in low phytoplankton biomass (Guo, 1991; Longhurst, 2007). Similar results were observed in our study, with low DIN (0.01–1.98 μmol L−1; at the surface and DCM layers) and DIP (0–0.14 μmol L−1) concentrations, and the lowest ΣPB of the study area found in the Kuroshio region during summer (Figures 2C, D, 3D, 5) reflecting low productivity. ΣPB concentrations in the Tsushima region were about twice that in the Kuroshio region at the surface and DCM layers (Figures 3D, 5), but surface salinity was markedly low (≤ 34 PSU; Figure 2B). This is likely a result of the mixing of Kuroshio water with eutrophic shelf waters (containing nutrients from the Changjiang Dilute Water) enhancing nutrient availability and phytoplankton biomass in the Tsushima region in summer, consistent with previous findings from physical-biogeochemical models (Liu et al., 2010), pigments (Gong et al., 2003; Kim et al., 2009; Wang et al., 2014) and lipid biomarkers (Bi et al., 2018).
Similarly, higher ΣPB concentrations at the surface and DCM layers in the mixed water region (Figures 3D, 5) indicated higher phytoplankton abundance and biomass than south of the KE, likely a result of the KE merging with the eutrophic Oyashio water from the north. This feature was also revealed by phytoplankton enumerations and Chl a (Wang et al., 2021). We found that nutrient concentrations strongly increased from the surface to the DCM layers in the mixed water region, with a more muted difference in most of the rest of the study area (Supplementary Table S1). A clear indication of nutrient upwelling at 35°N along the d section supports this conclusion (Supplementary Figure S6). The interaction between the KE and Oyashio can stimulate the formation of eddies and fronts (Yasuda, 2003; Itoh and Yasuda, 2010), potentially affecting biological production through vertical mixing of nutrients from the subsurface to the euphotic zone (Kimura et al., 2000; Uchiyama et al., 2017). Our results thus provide biomarker evidence that the interactions between Oyashio water and Kuroshio water accompanied by the upward transport of nutrients were the primary mechanism fueling higher phytoplankton biomass in the mixed water region.
It should be noted that we observed a negative effect of temperature on phytoplankton biomass (i.e., ΣPB; Table 1). Although temperature plays an important role in phytoplankton metabolic rates and subsequently photosynthesis and primary productivity (Davison, 1991; Gillooly et al., 2001; Yvon-Durocher et al., 2010), temperature may indirectly affect nutrient availability through physical mixing (Lewandowska et al., 2014). Indeed, we observed that VSI had a positive correlation with temperature (p < 0.001) and negative correlations with nutrients (DIN, DIP and Si; p < 0.05), implying that temperature-induced stratification hindered the vertical supply of nutrients to the surface. The cruises in our study were conducted in summer in mid- and low-latitude areas making temperature an unlikely direct factor controlling phytoplankton production; but in colder seasons, particularly in high-latitude regions where low temperatures might limit phytoplankton growth, there could be positive effects of increasing temperature on phytoplankton production (Feng et al., 2021).
Phytoplankton Community Structure
As a proxy for the diatom contribution to the community of primary eukaryotic phytoplankton groups in the NWPO (diatoms, dinoflagellates, haptophytes), the B/ΣPB ratio was positively correlated with nutrients and negatively correlated with temperature over the entire study area (Table 1). It was the highest in the productive and nutrient-rich Oyashio region (> 90%; Figure 4A), consistent with previous findings of high diatom abundances during summer based on cell counts (Lin et al., 2020). Diatoms are known to outcompete other phytoplankton groups in eutrophic settings with low temperature and high turbulence due to their high maximum carbon-specific nutrient uptake rates and abundant storage vacuoles (Margalef, 1978; Litchman and Klausmeier, 2008; Edwards et al., 2012; Bi et al., 2021).
Conversely, dinoflagellate abundances inferred from the dinosterol (D) to ΣPB ratio were negatively correlated with nutrients and positively correlated with temperature over the whole study area (Table 1). The highest D/ΣPB ratio (29%) occurred in surface waters of the Tsushima region, which were slightly higher than in the Kuroshio region (Figures 4B, 5). In the mixed water region, the D/ΣPB ratio was 4–9% lower than in the Kuroshio region at the surface and DCM layers (Figure 5). This is consistent with the observation that dinoflagellates tend to prevail in stratified waters where phosphorous concentrations are low (Margalef, 1978; Lin et al., 2016; Xiao et al., 2018), due to their vertical migration capabilities, and ability to utilize dissolved organic phosphorus and nitrogen (Stoecker, 1999; Huang et al., 2005; Lin et al., 2016). Indeed, P deficiency was more extreme in the Tsushima region in summer where DIP was below the detection limit at most stations due to mixing of Kuroshio water with shelf water (high N:P ratios up to 195 mol mol−1; Figure 2D and Supplementary Table S1; Wang et al., 2003). P deficiency was less extreme in the mixed water region where Kuroshio water mixes with Oyashio water and/or upward subsurface water with high P concentration (Figure 2D and Supplementary Figure S6H). As a result, the proportion of dinoflagellates, as revealed by D/ΣPB, was highest in the Tsushima region and relatively low in the mixed water region.
The proportion of C37 alkenones relative to the three phytoplankton lipids (A/ΣPB) indicates that haptophyte abundances were proportionally high in the Tsushima and mixed water regions (Figures 4C, 5), consistent with haptophytes being more adaptive to oligotrophic conditions compared to the diatoms (Baumann et al., 2005; Winder and Sommer, 2012). Non-significant correlations between A/ΣPB and nutrients (Table 1) are potentially attributed to the weaker competitiveness of haptophytes compared to flagellates in oligotrophic environments, as the mobility makes lower frequency of nutrient limitation on flagellates (Sommer, 1989). In addition, the mixed water region characterized by the occurrence of cold-core rings and fronts may also potentially explain the increase of haptophytes (Yasuda, 2003; Itoh and Yasuda, 2010). The most common haptophytes in this region are Emiliania huxleyi and Gephyrocapsa oceanica (Hattori et al., 2004; Hagino et al., 2005), which occur in abundance near other oceanic fronts such as those in the South Atlantic Ocean (Eynaud et al., 1999), the Northern Indian Ocean and the Red Sea (Kleijne et al., 1989), and the Benguela Current region south of Africa (Mitchell-Innes and Winter, 1987). The high proportion of haptophytes in the mixed water region in our study may therefore be attributed to mixing processes associated with nutrient mitigation, frontal systems where eutrophic Oyashio water mixes with Kuroshio water.
Our lipid biomarker results suggest that the phytoplankton community structure remained broadly similar between the surface and DCM layers in the Oyashio region, while clear differences occurred in the other three regions where higher B/ΣPB at the DCM layers and higher D/ΣPB and A/ΣPB at the surface layers occurred (Figure 5). It is hypothesized that ample nutrients in the euphotic zone promoted phytoplankton growth in the eutrophic Oyashio region where productivity was likely to be limited by light, and the DCM was shallow (Supplementary Figure S3Q). Similar results have been found in the ECS, where the summer phytoplankton community varied little with depth (B/ΣPB: 81% at the surface layers and 83% at the DCM layers; Wang et al., 2019). In the oligotrophic Kuroshio, Tsushima and mixed water regions, strong vertical stratification (Supplementary Figure S2B) and consequent nutrient limitation in surface waters was accompanied by a deep DCM layer (Supplementary Figures S3J–Q) where diatoms were abundant owing to more efficient response to increased nutrient concentrations (Revelante and Gilmartin, 1995). Since diatoms are among the largest phytoplankton their prevalence in the DCM is likely to increase the efficiency of the biological pump, leading to greater sequestration of carbon in the mesopelagic ocean and in sediments, even in the oligotrophic Kuroshio region (Gomi et al., 2010; Tripathy et al., 2015; Tréguer et al., 2018). Further work in combination with in situ light availability (i.e., photosynthetically active radiation (PAR)) would help to better constrain the mechanisms of phytoplankton variations in surface and DCM layers.
In summary, our results show that spatial distribution patterns and correlations with hydrographic conditions and nutrients were clearly different between brassicasterol/epi-brassicasterol, dinosterol and C37 alkenones, implying niche differentiations between diatoms, dinoflagellates, and haptophytes in the NWPO. The characteristics of dominant phytoplankton groups have important effects on sinking rates and carbon fluxes to the mesopelagic ocean. A phytoplankton community dominated by dinoflagellates is more likely to be decomposed in the water column, while a diatom-dominated community is more efficient at transferring carbon into the ocean interior and to sediments (Passow, 1991; Guo et al., 2016). Our lipid biomarker analysis provides strong support for the predominance of diatoms and high phytoplankton biomass in the Oyashio region that contribute to among the highest biological utilization rates of surface water CO2 and strongest carbon sinks in the world’s oceans (Takahashi et al., 2002; Isada et al., 2009; Fassbender et al., 2017).
Conclusions
This study illustrates for the first time the spatial distributions of lipid biomarkers and their likely controlling mechanisms in a large area of the NWPO in summer. Overall, the concentrations of total lipid biomarkers were comparable between the surface and DCM layers. Importantly, the ΣPB to Chl a ratio at the surface layers was higher than the DCM layers, which is consistent with previous findings and indicates that lipid biomarkers can be applied as a proxy for the vertical distribution patterns of phytoplankton biomass in the NWPO.
Water masses with different nutrient concentrations strongly controlled the variations of lipid biomarkers in our study area. In the eutrophic Oyashio region, sufficient nutrients led to high biomass and the dominance of diatoms, indicating a biological hot spot of this area for global carbon cycling. In contract, phytoplankton biomass was very low in the oligotrophic Kuroshio region, where the proportions of haptophytes and dinoflagellates markedly increased. The interplay between the Kuroshio and eutrophic Oyashio water enhanced nutrient availability and consequently stimulated high biomass and the proportion of haptophytes. Dinoflagellates tended to prevail in Tsushima region, owing to the increased N:P ratios accompanied by the mixing of Kuroshio with shelf water. Furthermore, sufficient nutrients and low light determined similar phytoplankton communities between the surface and the shallow DCM layers in the Oyashio region, while nutrient deficiency with a deep DCM caused clearly different phytoplankton communities between the two layers outside the Oyashio region, i.e., higher diatom proportions at the DCM layers but higher dinoflagellate and haptophyte proportions at the surface. It highlights the utility of vertical profiles of lipid biomarkers in ecological and biogeochemical studies, especially in hot spots of carbon cycling such as the NWPO. Our study further highlights the potential of lipid biomarker profiles (sterols and alkenones) to elucidate ecosystem functioning and carbon sequestration in the NWPO and elsewhere since these analyses are less cumbersome and potentially more quantitative than cell counts, flow cytometry, and other phytoplankton enumeration techniques. If continued global warming shifts the Pacific polar front northward, it would likely result in decreased phytoplankton productivity and a diminished carbon sink in the Oyahsio region.
Data Availability Statement
The original contributions presented in the study are included in the article/Supplementary Material. Further inquiries can be directed to the corresponding authors.
Author Contributions
RB and MZ designed the study. YW performed the experiments, with assistance from GJ. JZ, ST, YK and FC provided nutrient data. YW organized and analyzed the database, wrote the manuscript and prepared the tables and figures. RB, JZ, JG, JS and MZ provided comments on data analysis and revised the manuscript. All authors contributed to the article and approved the submitted version.
Funding
The study was supported by the National Natural Science Foundation of China (No. 41876118 and 41630966), the Fundamental Research Funds for the Central Universities (No. 202072001), the Global Climate Changes and Air-sea Interaction Program (GASI-02-PAC-ST-Wwin), and JSPS KAKENHI Grant (No. 16K12586 and 18H03361).
Conflict of Interest
The authors declare that the research was conducted in the absence of any commercial or financial relationships that could be construed as a potential conflict of interest.
Publisher’s Note
All claims expressed in this article are solely those of the authors and do not necessarily represent those of their affiliated organizations, or those of the publisher, the editors and the reviewers. Any product that may be evaluated in this article, or claim that may be made by its manufacturer, is not guaranteed or endorsed by the publisher.
Acknowledgments
We thank Li Li, Yang Ding and Hailong Zhang for technical assistance. We thank Shuqin Tao, Jiangyi-ao Zhang, and Chenglong Su for sampling help. We thank Siteng Zhu for data application of CTD and nutrients. We also thank the captains, crew members and scientists on cruise KH-11-7 by R/V Hakuho-maru, cruise NN464 by T/S Nagasaki-maru, cruise NS33 by T/S Nagasaki-maru, and 2019 summer cruise of CPIES by R/V Haida for help with the observations and samplings. We thank two reviewers for constructive comments. This is MCTL (Key Laboratory of Marine Chemistry Theory and Technology) contribution #278.
Supplementary Material
The Supplementary Material for this article can be found online at: https://www.frontiersin.org/articles/10.3389/fmars.2022.865142/full#supplementary-material
References
Baumann K.-H., Andruleit H., Böckel B., Geisen M., Kinkel H. (2005). The Significance of Extant Coccolithophores as Indicators of Ocean Water Masses, Surface Water Temperature, and Palaeoproductivity: A Review. PalZ 79, 93–112. doi: 10.1007/BF03021756
Bi R., Cao Z., Ismar-Rebitz S. M. H., Sommer U., Zhang H., Ding Y., et al. (2021). Responses of Marine Diatom-Dinoflagellate Competition to Multiple Environmental Drivers: Abundance, Elemental, and Biochemical Aspects. Front. Microbiol. 12, 731786. doi: 10.3389/fmicb.2021.731786
Bi R., Chen X., Zhang J., Ishizaka J., Zhuang Y., Jin H., et al. (2018). Water Mass Control on Phytoplankton Spatiotemporal Variations in the Northeastern East China Sea and the Western Tsushima Strait Revealed by Lipid Biomarkers. J. Geophys. Res.: Biogeo. 123, 1318–1332. doi: 10.1002/2017JG004340
Chen Z., Sun J., Gu T., Zhang G., Wei Y. (2021). Nutrient Ratios Driven by Vertical Stratification Regulate Phytoplankton Community Structure in the Oligotrophic Western Pacific Ocean. Ocean Sci. 17, 1775–1789. doi: 10.5194/os-17-1775-2021
Chierici M., Fransson A., Nojiri Y. (2006). Biogeochemical Processes as Drivers of Surface fCO2 in Contrasting Provinces in the Subarctic North Pacific Ocean. Global Biogeochem. Cycles 20, GB1009. doi: 10.1029/2004GB002356
Cornec M., Claustre H., Mignot A., Guidi L., Lacour L., Poteau A., et al. (2021). Deep Chlorophyll Maxima in the Global Ocean: Occurrences, Drivers and Characteristics. Global Biogeochem. Cycles 35, e2020GB006759. doi: 10.1029/2020GB006759
Cullen J. J. (1982). The Deep Chlorophyll Maximum: Comparing Vertical Profiles of Chlorophyll a. Can. J. Fish. Aquat. Sci. 39, 791–803. doi: 10.1139/f82-108
Cullen J. J. (2015). Subsurface Chlorophyll Maximum Layers: Enduring Enigma or Mystery Solved? Ann. Rev. Mar. Sci 7, 207–239. doi: 10.1146/annurev-marine-010213-135111
Davison I. R. (1991). Environmental Effects on Algal Photosynthesis: Temperature. J. Phycol. 27, 2–8. doi: 10.1111/j.0022-3646.1991.00002.x
Dong L., Li L., Li Q., Liu J., Chen Y., He J., et al. (2015). Basin-Wide Distribution of Phytoplankton Lipids in the South China Sea During Intermonsoon Seasons: Influence by Nutrient and Physical Dynamics. Deep Sea Res. Part II Top. Stud. Oceanogr. 122, 52–63. doi: 10.1016/j.dsr2.2015.07.005
Edwards K. F., Thomas M. K., Klausmeier C. A., Litchman E. (2012). Allometric Scaling and Taxonomic Variation in Nutrient Utilization Traits and Maximum Growth Rate of Phytoplankton. Limnol. Oceanogr. 57, 554–566. doi: 10.4319/lo.2012.57.2.0554
Endo H., Ogata H., Suzuki K. (2018). Contrasting Biogeography and Diversity Patterns Between Diatoms and Haptophytes in the Central Pacific Ocean. Sci. Rep. 8, 10916. doi: 10.1038/s41598-018-29039-9
Endo H., Suzuki K. (2019). “Spatial Variations in Community Structure of Haptophytes Across the Kuroshio Front in the Tokara Strait,” in Kuroshio Current. Eds. Nagai T., Saito H., Suzuki K., Takahashi M. (Washington, DC: JohnWiley & Sons), 207–221. doi: 10.1002/9781119428428.ch13
Eynaud F., Giraudeau J., Pichon J.-J., Pudsey C. (1999). Sea-Surface Distribution of Coccolithophores, Diatoms, Silicoflagellates and Dinoflagellates in the South Atlantic Ocean During the Late Austral Summer 1995. Deep Sea Res. Part I Oceanogr. Res. Pap. 46, 451–482. doi: 10.1016/S0967-0637(98)00079-X
Fassbender A. J., Sabine C. L., Cronin M. F., Sutton A. J. (2017). Mixed-Layer Carbon Cycling at the Kuroshio Extension Observatory. Global Biogeochem. Cycles 31, 272–288. doi: 10.1002/2016gb005547
Feng J., Stige L. C., Hessen D. O., Zuo Z., Zhu L., Stenseth N. C. (2021). A Threshold Sea-Surface Temperature at 14°C for Phytoplankton Nonlinear Responses to Ocean Warming. Global Biogeochem. Cycles 35, e2020GB006808. doi: 10.1029/2020GB006808
Fennel K., Boss E. (2003). Subsurface Maxima of Phytoplankton and Chlorophyll: Steady-State Solutions From a Simple Model. Limnol. Oceanogr. 48, 1521–1534. doi: 10.4319/lo.2003.48.4.1521
Fisher T. R., Peele E. R., Ammerman J. W., Harding L. W. (1992). Nutrient Limitation of Phytoplankton in Chesapeake Bay. Mar. Ecol. Prog. Ser. 82, 51–63. doi: 10.3354/meps082051
Gillooly J. F., Brown J. H., West G. B., Savage V. M., Charnov E. L. (2001). Effects of Size and Temperature on Metabolic Rate. Science 293, 2248–2251. doi: 10.1126/science.1061967
Gomi Y., Fukuchi M., Taniguchi A. (2010). Diatom Assemblages at Subsurface Chlorophyll Maximum Layer in the Eastern Indian Sector of the Southern Ocean in Summer. J. Plankton Res. 32, 1039–1050. doi: 10.1093/plankt/fbq031
Gong G.-C., Wen Y.-H., Wang B.-W., Liu G.-J. (2003). Seasonal Variation of Chlorophyll a Concentration, Primary Production and Environmental Conditions in the Subtropical East China Sea. Deep Sea Res. Part II Top. Stud. Oceanogr. 50, 1219–1236. doi: 10.1016/S0967-0645(03)00019-5
Guo Y. J. (1991). The Kuroshio, Part II. Primary Production and Phytoplankton. Oceanogr. Mar. Bio. Ann. Rev. 29, 155–189.
Guo S., Feng Y., Wang L., Dai M., Liu Z., Bai Y., et al. (2014). Seasonal Variation in the Phytoplankton Community of a Continental-Shelf Sea: The East China Sea. Mar. Ecol. Prog. Ser. 516, 103–126. doi: 10.3354/meps10952
Guo S., Sun J., Zhao Q., Feng Y., Huang D., Liu S. (2016). Sinking Rates of Phytoplankton in the Changjiang (Yangtze River) Estuary: A Comparative Study Between Prorocentrum Dentatum and Skeletonema Dorhnii Bloom. J. Mar. Syst. 154, 5–14. doi: 10.1016/j.jmarsys.2015.07.003
Hagino K., Okada H., Matsuoka H. (2005). Coccolithophore Assemblages and Morphotypes of Emiliania Huxleyi in the Boundary Zone Between the Cold Oyashio and Warm Kuroshio Currents Off the Coast of Japan. Mar. Micropaleontol. 55, 19–47. doi: 10.1016/j.marmicro.2005.02.002
Hattori H., Koike M., Tachikawa K., Saito H., Nagasawa K. (2004). Spatial Variability of Living Coccolithophore Distribution in the Western Subarctic Pacific and Western Bering Sea. J. Oceanogr. 60, 505–515. doi: 10.1023/B:JOCE.0000038063.81738.ab
Hayakawa M., Suzuki K., Saito H., Takahashi K., Ito S.-i. (2008). Differences in Cell Viabilities of Phytoplankton Between Spring and Late Summer in the Northwest Pacific Ocean. J. Exp. Mar. Biol. Ecol. 360, 63–70. doi: 10.1016/j.jembe.2008.03.008
Hernandez M. T., Mills R. A., Pancost R. D. (2008). Algal Biomarkers in Surface Waters Around the Crozet Plateau. Org. Geochem. 39, 1051–1057. doi: 10.1016/j.orggeochem.2008.04.015
Honda M. C. (2003). Biological Pump in Northwestern North Pacific. J. Oceanogr. 59, 671–684. doi: 10.1023/B:JOCE.0000009596.57705.0c
Hou X., Dong Q., Xue C., Song W., Qin L., Fan X. (2014). Seasonal Evolution of the Interannual Variability of Chlorophyll-a Concentration and its Forcing Factors in the Northwestern Pacific From 1998 to 2010. Int. J. Remote Sens. 35, 4138–4155. doi: 10.1080/01431161.2014.916445
Huang B., Ou L., Hong H., Luo H., Wang D. (2005). Bioavailability of Dissolved Organic Phosphorus Compounds to Typical Harmful Dinoflagellate Prorocentrum Donghaiense Lu. Mar. Pollut. Bull. 51, 838–844. doi: 10.1016/j.marpolbul.2005.02.035
Hu D., Wu L., Cai W., Gupta A. S., Ganachaud A., Qiu B., et al. (2015). Pacific Western Boundary Currents and Their Roles in Climate. Nature 522, 299–308. doi: 10.1038/nature14504
Isada T., Kuwata A., Saito H., Ono T., Ishii M., Yoshikawa-Inoue H., et al. (2009). Photosynthetic Features and Primary Productivity of Phytoplankton in the Oyashio and Kuroshio–Oyashio Transition Regions of the Northwest Pacific. J. Plankton Res. 31, 1009–1025. doi: 10.1093/plankt/fbp050
Itoh S., Yasuda I. (2010). Characteristics of Mesoscale Eddies in the Kuroshio–Oyashio Extension Region Detected From the Distribution of the Sea Surface Height Anomaly. J. Phys. Oceanogr. 40, 1018–1034. doi: 10.1175/2009jpo4265.1
Kawai H. (1972). “Hydrography of the Kuroshio Extension”, in Kuroshio, Its Physical Aspects. Eds. Stommel H., Yoshida K. (Tokyo: University of Tokyo Press), 235–352.
Kim D., Choi S. H., Kim K. H., Shim J., Yoo S., Kim C. H. (2009). Spatial and Temporal Variations in Nutrient and Chlorophyll-a Concentrations in the Northern East China Sea Surrounding Cheju Island. Cont. Shelf Res. 29, 1426–1436. doi: 10.1016/j.csr.2009.03.012
Kimura S., Nakata H., Okazaki Y. (2000). Biological Production in Meso-Scale Eddies Caused by Frontal Disturbances of the Kuroshio Extension. ICES J. Mar. Sci. 57, 133–142. doi: 10.1006/jmsc.1999.0564
Kleijne A., Kroon D., Zevenboom W. (1989). Phytoplankton and Foraminiferal Frequencies in Northern Indian Ocean and Red Sea Surface Waters. Neth. J. Sea Res. 24, 531–539. doi: 10.1016/0077-7579(89)90131-2
Ko T. -W., Lee K., Bae S., Lee S. (2018). Spatial and Temporal Distribution of C37 Alkenones in Suspended Materials in the Northern East China Sea. Paleogeogr. Paleoclimatol. Paleoecol. 493, 102–110. doi: 10.1016/j.palaeo.2018.01.004
Kuroda H., Toya Y., Watanabe T., Nishioka J., Hasegawa D., Taniuchi Y., et al. (2019). Influence of Coastal Oyashio Water on Massive Spring Diatom Blooms in the Oyashio Area of the North Pacific Ocean. Prog. Oceanogr. 175, 328–344. doi: 10.1016/j.pocean.2019.05.004
Lewandowska A. M., Boyce D. G., Hofmann M., Matthiessen B., Sommer U., Worm B. (2014). Effects of Sea Surface Warming on Marine Plankton. Ecol. Lett. 17, 614–623. doi: 10.1111/ele.12265
Lie H. J., Cho C. H. (1994). On the Origin of the Tsushima Warm Current. J. Geophys. Res.: Oceans 99, 25081–25091. doi: 10.1029/94JC02425
Li L., Liu J., He J., Wang H. (2014). Factors Affecting the Abundance and Community Structure of the Phytoplankton in Northern South China Sea in the Summer of 2008: A Biomarker Study. Chin. Sci. Bull. 59, 981–991. doi: 10.1007/s11434-013-0106-4
Lin G., Chen Y., Huang J., Wang Y., Ye Y., Yang Q. (2020). Regional Disparities of Phytoplankton in Relation to Different Water Masses in the Northwest Pacific Ocean During the Spring and Summer of 2017. Acta Oceanol. Sin 39, 107–118. doi: 10.1007/s13131-019-1511-6
Lin S., Litaker R. W., Sunda W. G. (2016). Phosphorus Physiological Ecology and Molecular Mechanisms in Marine Phytoplankton. J. Phycol. 52, 10–36. doi: 10.1111/jpy.12365
Litchman E., Klausmeier C. A. (2008). Trait-Based Community Ecology of Phytoplankton. Annu. Rev. Ecol. Evol. Syst. 39, 615–639. doi: 10.1146/annurev.ecolsys.39.110707.173549
Liu K.-K., Chao S.-Y., Lee H.-J., Gong G.-C., Teng Y.-C. (2010). Seasonal Variation of Primary Productivity in the East China Sea: A Numerical Study Based on Coupled Physical-Biogeochemical Model. Deep-Sea Res. Part II-Top. Stud. Oceanogr. 57, 1762–1782. doi: 10.1016/j.dsr2.2010.04.003
Liu H., Suzuki K., Saito H. (2004). Community Structure and Dynamics of Phytoplankton in the Western Subarctic Pacific Ocean: A Synthesis. J. Oceanogr. 60, 119–137. doi: 10.1023/B:JOCE.0000038322.79644.36
Liu X., Xiao W., Landry M. R., Chiang K.-P., Wang L., Huang B. (2016). Responses of Phytoplankton Communities to Environmental Variability in the East China Sea. Ecosystems 19, 832–849. doi: 10.1007/s10021-016-9970-5
Longhurst A. R. (2007). “Chapter 11 - The Pacific Ocean,” in Ecological Geography of the Sea, 2nd ed. Ed. Longhurst A. R. (Burlington: Academic Press), 327–441. doi: 10.1016/B978-012455521-1/50012-7
Lorenzen C. J. (1967). Determination of Chlorophyll and Pheopigments:Spectrophotometric Equations. Limnol. Oceanogr. 12, 343–346. doi: 10.4319/lo.1967.12.2.0343
Margalef R. (1978). Life-Forms of Phytoplankton as Survival Alternatives in an Unstable Environment. Oceanol. Acta 1, 493–509.
Martin-Creuzburg D., Elert E.V. (2009). “Ecological Significance of Sterols in Aquatic Food Webs,” in Lipids in Aquatic Ecosystems. Eds. Kainz M., Brett M. T., Arts M. T. (New York, NY: Springer New York), 43–64. doi: 10.1007/978-0-387-89366-2_3
Mena C., Reglero P., Hidalgo M., Sintes E., Santiago R., Martín M., et al. (2019). Phytoplankton Community Structure is Driven by Stratification in the Oligotrophic Mediterranean Sea. Front. Microbiol. 10, 1698. doi: 10.3389/fmicb.2019.01698
Messié M., Radenac M.-H. (2006). Seasonal Variability of the Surface Chlorophyll in the Western Tropical Pacific from SeaWiFS Data. Deep-Sea Res. Part I-Oceanogr. Res. Pap. 53, 1581–1600. doi: 10.1016/j.dsr.2006.06.007
Mitchell-Innes B. A., Winter A. (1987). Coccolithophores: A Major Phytoplankton Component in Mature Upwelled Waters Off the Cape Peninsula, South Africa in March, 1983. Mar. Biol. 95, 25–30. doi: 10.1007/BF00447481
Nishioka J., Nakatsuka T., Watanabe Y. W., Yasuda I., Kuma K., Ogawa H., et al. (2013). Intensive Mixing Along an Island Chain Controls Oceanic Biogeochemical Cycles. Global Biogeochem. Cycles 27, 920–929. doi: 10.1002/gbc.20088
Nishioka J., Obata H., Hirawake T., Kondo Y., Yamashita Y., Misumi K., et al. (2021). A Review: Iron and Nutrient Supply in the Subarctic Pacific and its Impact on Phytoplankton Production. J. Oceanogr. 77, 561–587. doi: 10.1007/s10872-021-00606-5
Nishioka J., Obata H., Ogawa H., Ono K., Yamashita Y., Lee K., et al. (2020). Subpolar Marginal Seas Fuel the North Pacific Through the Intermediate Water at the Termination of the Global Ocean Circulation. Proc. Natl. Acad. Sci. U. S. A. 117, 202000658. doi: 10.1073/pnas.2000658117
Nitani H. (1972). “Beginning of the Kuroshio,” in Kuroshio, Physical Aspect of the Japan Current. Eds. Stommel H., Yoshida K. (Tokyo, Japan: University of Tokyo Press), 129–163.
Okamoto S., Hirawake T., Saitoh S.-I. (2010). Interannual Variability in the Magnitude and Timing of the Spring Bloom in the Oyashio Region. Deep Sea Res. Part II Top. Stud. Oceanogr. 57, 1608–1617. doi: 10.1016/j.dsr2.2010.03.005
Passow U. (1991). Species-Specific Sedimentation and Sinking Velocities of Diatoms. Mar. Biol. 108, 449–455. doi: 10.1007/BF01313655
Peltomaa E. T., Aalto S. L., Vuorio K. M., Taipale S. J. (2017). The Importance of Phytoplankton Biomolecule Availability for Secondary Production. Front. Ecol. Evol. 5, 128. doi: 10.3389/fevo.2017.00128
Qiu B. (2001). “Kuroshio and Oyashio Currents,” in Encyclopedia of Ocean Sciences. Ed. Steele J. H. (Oxford: Academic Press), 1413–1425. doi: 10.1006/rwos.2001.0350
Revelante N., Gilmartin M. (1995). The Relative Increase of Larger Phytoplankton in a Subsurface Chlorophyll Maximum of the Northern Adriatic Sea. J. Plankton Res. 17, 1535–1562. doi: 10.1093/plankt/17.7.1535
Saito H., Tsuda A., Kasai H. (2002). Nutrient and Plankton Dynamics in the Oyashio Region of the Western Subarctic Pacific Ocean. Deep Sea Res. Part II Top. Stud. Oceanogr. 49, 5463–5486. doi: 10.1016/S0967-0645(02)00204-7
Sakurai Y. (2007). An Overview of the Oyashio Ecosystem. Deep-Sea Res. Part II-Top. Stud. Oceanogr. 54, 2526–2542. doi: 10.1016/j.dsr2.2007.02.007
Schlundt C., Tegtmeier S., Lennartz S., Bracher A., Cheah W., Krüger K., et al. (2017). Oxygenated Volatile Organic Carbon in the Western Pacific Convective Centre: Ocean Cycling, Air-Sea Gas Exchange and Atmospheric Transport. Atmos. Chem. Phys. 17, 10837–10854. doi: 10.5194/acp-17-10837-2017
Schubert C. J., Villanueva J., Calvert S. E., Cowie G. L., von Rad U., Schulz H., et al. (1998). Stable Phytoplankton Community Structure in the Arabian Sea Over the Past 200,000 Years. Nature 394, 563–566. doi: 10.1038/29047
Sommer U. (1989). “The Role of Competition for Resources in Phytoplankton Succession,” in Plankton Ecology. Ed. Sommer U. (Berlin: Springer), 57–106. doi: 10.1007/978-3-642-74890-5_3
Stoecker D. K. (1999). Mixotrophy Among Dinoflagellates1. J. Eukaryot. Microbiol. 46 (4), 397–401. doi: 10.1111/j.1550-7408.1999.tb04619.x
Suzuki K., Handa N., Kiyosawa H., Ishizaka J. (1997). Temporal and Spatial Distribution of Phytoplankton Pigments in the Central Pacific Ocean Along 175°E During the Boreal Summers of 1992 and 1993. J. Oceanogr. 53, 383–396.
Suzuki R., Ishimaru T. (1990). An Improved Method for the Determination of Phytoplankton Chlorophyll Using N,N-Dimethylformamide. J. Oceanogr. Soc Japan 46, 191–194. doi: 10.1007/BF02125580
Takahashi W., Hiwatari T., Fukushima H., Toratani M., Akano T. (1995). High-Reflectance Waters of Possible Coccolithophore Blooms in NW Pacific–Analysis of 1979-86 Nimbus-7/CZCS Data Set– (in Japanese With English Abstract). Umi Kenkyu 4, 477–486.
Takahashi T., Sutherland S. C., Sweeney C., Poisson A., Metzl N., Tilbrook B., et al. (2002). Global Sea–Air CO2 Flux Based on Climatological Surface Ocean pCO2, and Seasonal Biological and Temperature Effects. Deep Sea Res. Part II Top. Stud. Oceanogr. 49, 1601–1622. doi: 10.1016/S0967-0645(02)00003-6
Takahashi T., Sutherland S. C., Wanninkhof R., Sweeney C., Feely R. A., Chipman D. W., et al. (2009). Climatological Mean and Decadal Change in Surface Ocean Pco2, and Net Sea-Air CO2 Flux Over the Global Oceans. Deep Sea Res. Part II Top. Stud. Oceanogr. 56, 554–577. doi: 10.1016/j.dsr2.2008.12.009
Talley L. D., Nagata Y., Fujimura M., Iwao T., Kono T., Inagake D., et al. (1995). North Pacific Intermediate Water in the Kuroshio/Oyashio Mixed Water Region. J. Phys. Oceanogr. 25, 475–501. doi: 10.1175/1520-0485(1995)025<0475:npiwit>2.0.co;2
Tolosa I., Miquel J. C., Gasser B., Raimbault P., Goyet C., Claustre H. (2008). Distribution of Lipid Biomarkers and Carbon Isotope Fractionation in Contrasting Trophic Environments of the South East Pacific. Biogeosciences 5, 949–968. doi: 10.5194/bg-5-949-2008
Tréguer P., Bowler C., Moriceau B., Dutkiewicz S., Gehlen M., Aumont O., et al. (2018). Influence of Diatom Diversity on the Ocean Biological Carbon Pump. Nat. Geosci. 11, 27–37. doi: 10.1038/s41561-017-0028-x
Tripathy S. C., Pavithran S., Sabu P., Pillai H. U. K., Dessai D. R. G., Anilkumar N. (2015). Deep Chlorophyll Maximum and Primary Productivity in Indian Ocean Sector of the Southern Ocean: Case Study in the Subtropical and Polar Front During Austral Summer 2011. Deep Sea Res. Part II Top. Stud. Oceanogr. 118, 240–249. doi: 10.1016/j.dsr2.2015.01.004
Uchiyama Y., Suzue Y., Yamazaki H. (2017). Eddy-Driven Nutrient Transport and Associated Upper-Ocean Primary Production Along the Kuroshio. J. Geophys. Res.: Oceans 122, 5046–5062. doi: 10.1002/2017jc012847
Uda M. (1934). The Results of Simultaneous Oceanographic Investigations in the Japan Sea and its Adjacent Waters in May and June 1932 (in Japanese). J. Imperial Fishery Exp. Stations 5, 57–190.
Wang S. Q., Ishizaka J., Yamaguchi H., Tripathy S. C., Hayashi M., Xu Y. J., et al. (2014). Influence of the Changjiang River on the Light Absorption Properties of Phytoplankton From the East China Sea. Biogeosciences 11, 1759–1773. doi: 10.5194/bg-11-1759-2014
Wang Y., Kang J., Sun X., Huang J., Lin Y., Xiang P. (2021). Spatial Patterns of Phytoplankton Community and Biomass Along the Kuroshio Extension and Adjacent Waters in Late Spring. Mar. Biol. 168, 1–17. doi: 10.1007/s00227-021-03846-7
Wang Y., Li D.-W., Sachs J. P., Hu J., Cao Y., Li L., et al. (2019). Vertical Distribution of Isoprenoid GDGTs in Suspended Particles From the East China Sea Shelf and Implications for Sedimentary TEX86H Records. Org. Geochem. 136, 103895. doi: 10.1016/j.orggeochem.2019.07.004
Wang B., Wang X.-L., Zhan R. (2003). Nutrient Conditions in the Yellow Sea and the East China Sea. Estuar. Coast. Shelf Sci. 58, 127–136. doi: 10.1016/S0272-7714(03)00067-2
Welschmeyer N. A. (1994). Fluorometric Analysis of Chlorophyll a in the Presence of Chlorophyll b and Phaeopigments. Limnol. Oceanogr. 39, 1985–1992. doi: 10.4319/lo.1994.39.8.1985
Winder M., Sommer U. (2012). Phytoplankton Response to a Changing Climate. Hydrobiologia 698, 5–16. doi: 10.1007/s10750-012-1149-2
Wu P., Bi R., Duan S., Jin H., Chen J., Hao Q., et al. (2016). Spatiotemporal Variations of Phytoplankton in the East China Sea and the Yellow Sea Revealed by Lipid Biomarkers. J. Geophys. Res.: Biogeo. 121, 109–125. doi: 10.1002/2015jg003167
Xiao W., Liu X., Irwin A. J., Laws E. A., Wang L., Chen B., et al. (2018). Warming and Eutrophication Combine to Restructure Diatoms and Dinoflagellates. Water Res. 128, 206–216. doi: 10.1016/j.watres.2017.10.051
Yang S.-C., Zhang J., Sohrin Y., Ho T.-Y. (2018). Cadmium Cycling in the Water Column of the Kuroshio-Oyashio Extension Region: Insights From Dissolved and Particulate Isotopic Composition. Geochim. Cosmochim. Acta 233, 66–80. doi: 10.1016/j.gca.2018.05.001
Yasuda I. (2003). Hydrographic Structure and Variability in the Kuroshio-Oyashio Transition Area. J. Oceanogr. 59, 389–402. doi: 10.1023/A:1025580313836
Yoder J. A., Kennelly M. A. (2003). Seasonal and ENSO Variability in Global Ocean Phytoplankton Chlorophyll Derived From 4 Years of SeaWiFS Measurements. Global Biogeochem. Cycles 17, 14. doi: 10.1029/2002gb001942
Yvon-Durocher G., Allen A. P., Montoya J. M., Trimmer M., Woodward G. (2010). “The Temperature Dependence of the Carbon Cycle in Aquatic Ecosystems,” in Adv. Ecol. Res. Ed. Woodward G. (Cambridge, MA: Academic Press), 267–313. doi: 10.1016/B978-0-12-385005-8.00007-1
Keywords: lipid biomarkers, phytoplankton, deep chlorophyll maximum, nutrients, Kuroshio current, Oyashio current
Citation: Wang Y, Bi R, Zhang J, Gao J, Takeda S, Kondo Y, Chen F, Jin G, Sachs JP and Zhao M (2022) Phytoplankton Distributions in the Kuroshio-Oyashio Region of the Northwest Pacific Ocean: Implications for Marine Ecology and Carbon Cycle. Front. Mar. Sci. 9:865142. doi: 10.3389/fmars.2022.865142
Received: 29 January 2022; Accepted: 06 April 2022;
Published: 06 May 2022.
Edited by:
Hongbin Liu, Hong Kong University of Science and Technology, Hong Kong SAR, ChinaReviewed by:
Ricardo Maria Letelier, Oregon State University, United StatesSarat Chandra Tripathy, National Centre for Polar and Ocean Research (NCPOR), India
Copyright © 2022 Wang, Bi, Zhang, Gao, Takeda, Kondo, Chen, Jin, Sachs and Zhao. This is an open-access article distributed under the terms of the Creative Commons Attribution License (CC BY). The use, distribution or reproduction in other forums is permitted, provided the original author(s) and the copyright owner(s) are credited and that the original publication in this journal is cited, in accordance with accepted academic practice. No use, distribution or reproduction is permitted which does not comply with these terms.
*Correspondence: Rong Bi, cm9uZ2JpQG91Yy5lZHUuY24=; Meixun Zhao, bWF4emhhb0BvdWMuZWR1LmNu