 Alvise Finotello
 Andrea D’Alpaos
 Marco Marani2,4
 Enrico Bertuzzo
- 1Department of Environmental Sciences, Informatics, and Statistics, Ca’ Foscari University of Venice, Venice, Italy
- 2Center for Lagoon Hydrodynamics and Morphodynamics, University of Padova, Padova, Italy
- 3Department of Geosciences, University of Padova, Padova, Italy
- 4Department of Civil, Environmental, and Architectural Engineering, University of Padova, Padova, Italy
We present a new bidimensional, spatially-explicit ecological model describing the dynamics of halophytic vegetation in tidal saline wetlands. Existing vegetation models employ relatively simple deterministic or stochastic mechanisms, and are driven by local environmental conditions. In the proposed model, in contrast, vegetation dynamics depend not only on the marsh local habitat, but also on spatially-explicit mechanisms of dispersal and competition among multiple interacting species. The role of habitat quality, here determined by the local elevation relative to the mean sea level as a proxy for environmental conditions, is mathematically modeled by a logistic function that represents the fundamental (theoretical) niche of each halophytic species. Hence, the model does not artificially impose any constraints to the ability of a species to colonize elevated areas where it is usually not observed: such limitations naturally arise through competition with fitter species across marsh topographic gradients. We qualitatively test our model against field data based on a suitable assemblage of focus species, and perform a sensitivity analysis aimed at determining how dynamic equilibria in vegetation distributions are affected by changes in model input parameters. Results indicate that the model is robust and can predict realistic vegetation distributions and species-richness patterns. More importantly, the model is also able to effectively reproduce the outcomes of classical ecological experiments, wherein a species is transplanted to an area outside its realized niche. A direct comparison shows that previous models not accounting for dispersal and interspecific competitions are unable to reproduce such dynamics. Our model can be easily integrated into virtually any existing morphodynamic model, thereby strengthening our ability to simulate the coupled biotic and abiotic evolution of salt marshes under changing climate forcings.
1 Introduction
Salt marshes are widespread morphological features in coastal and estuarine tidal landscapes, and are ecologically and economically important as they significantly contribute to coastal primary production, support high biodiversity, and provide a broad range of valuable ecosystem services (Costanza et al., 1997; Barbier et al., 2011; D'Alpaos and D'Alpaos 2021). In particular, salt marshes are highly efficient in sequestering and storing large amounts of blue carbon (Chmura et al., 2003; Kirwan and Mudd, 2012; Yousefi Lalimi et al., 2018), filtering nutrients and pollutants (Nelson and Zavaleta, 2012; Ratliff et al., 2015), and dissipating wave energy thereby mitigating shoreline erosion and providing nature-based protection against storms (Temmerman et al., 2013; Möller et al., 2014). However, the sustainability of saltmarsh ecosystems is severely threatened by climate-change-induced sea-level rise and increasing anthropogenic pressures, such as land reclamation as well as both human-induced subsidence and sediment starvation (Kirwan and Megonigal, 2013; FitzGerald and Hughes, 2019). As a result, large areas of salt marshes are being lost around the world every year at increasingly alarming rates (Day et al., 2000; Valiela et al., 2009; Mcowen et al., 2017; Tommasini et al., 2019).
The ability of tidal marshes to counteract rising relative sea levels depends on complex, dynamic feedbacks between physical and biological processes acting at different spatial and temporal scales (Morris et al., 2002; Mudd et al., 2004; D’Alpaos et al., 2007; Marani et al., 2010). While salt-marsh evolution in the horizontal direction depends on the balance between wave-induced lateral erosion (Marani et al., 2011; Leonardi et al., 2016) and marsh progradation, for which the availability of external sediment supply is key (Goodwin and Mudd, 2020; Yang et al., 2020a; Roner et al., 2021; Willemsen et al., 2021), the equilibrium of tidal marshes in the vertical direction results from the interplay between organic and inorganic deposition, erosion, changes in relative sea level, and variations of atmospheric CO2 concentration (Marani et al., 2007; D’Alpaos, 2011; Ratliff et al., 2015; Morris et al., 2016). Overall though, salt-marsh evolution, both in time and space, is intimately related to the dynamics of halophytic (i.e., salt-tolerant) plant communities colonizing the marsh platform.
The encroachment of pioneer halophytes capable of thriving in highly hypoxic and hypersaline soils facilitates sediment accumulation, ameliorate physical stresses, and promote further marsh growth thanks to the ability of these critical foundation species (sensu Dayton, 1975) to eco-engineer their habitats (Ranwell, 1972; Jones et al., 1994; Bruno, 2000; Bruno and Kennedy, 2000; Crain and Bertness, 2006; Morris, 2007; Vandenbruwaene et al., 2011; Da Lio et al., 2013; Marani et al., 2013; Lõhmus et al., 2020; van Regteren et al., 2020). Once foundation species are established, a network of emergent vegetation organized into recurrent zonation patterns develops along the gradients of elevation and salinity that characterize tidal wetlands (Pennings and Callaway, 1992; Belluco et al., 2006; Marani et al., 2006) (Figures 1A, B). Vegetation biomass actively contributes to marsh vertical accretion by reducing bottom shear stresses and the associated erosion processes (Ford et al., 2016), as well as by enhancing sediment deposition through both direct captures of suspended sediments and deposition of organic matter (Temmerman et al., 2005; Nyman et al., 2006; D’Alpaos et al., 2007). Moreover, vegetation allows tidal wetlands to sequester and store large amounts of organic carbon, sustaining the highest rate of carbon sequestration per unit area of all ecosystems, thanks to the fact that storage occurs predominantly in belowground biomass and soil is typically in anaerobic conditions (McLeod et al., 2011; Roner et al., 2016; Rogers et al., 2019; Wang et al., 2019; Ouyang and Lee, 2020). Finally, halophytes also exert critical control on soil aeration (Marani et al., 2006; Boaga et al., 2014), which in turn fuels vegetation zonation and the related biogeomorphic interactions typically observed in tidal marshes (Morris et al., 2002; Silvestri et al., 2005; Marani et al., 2006; Yang et al., 2020b).
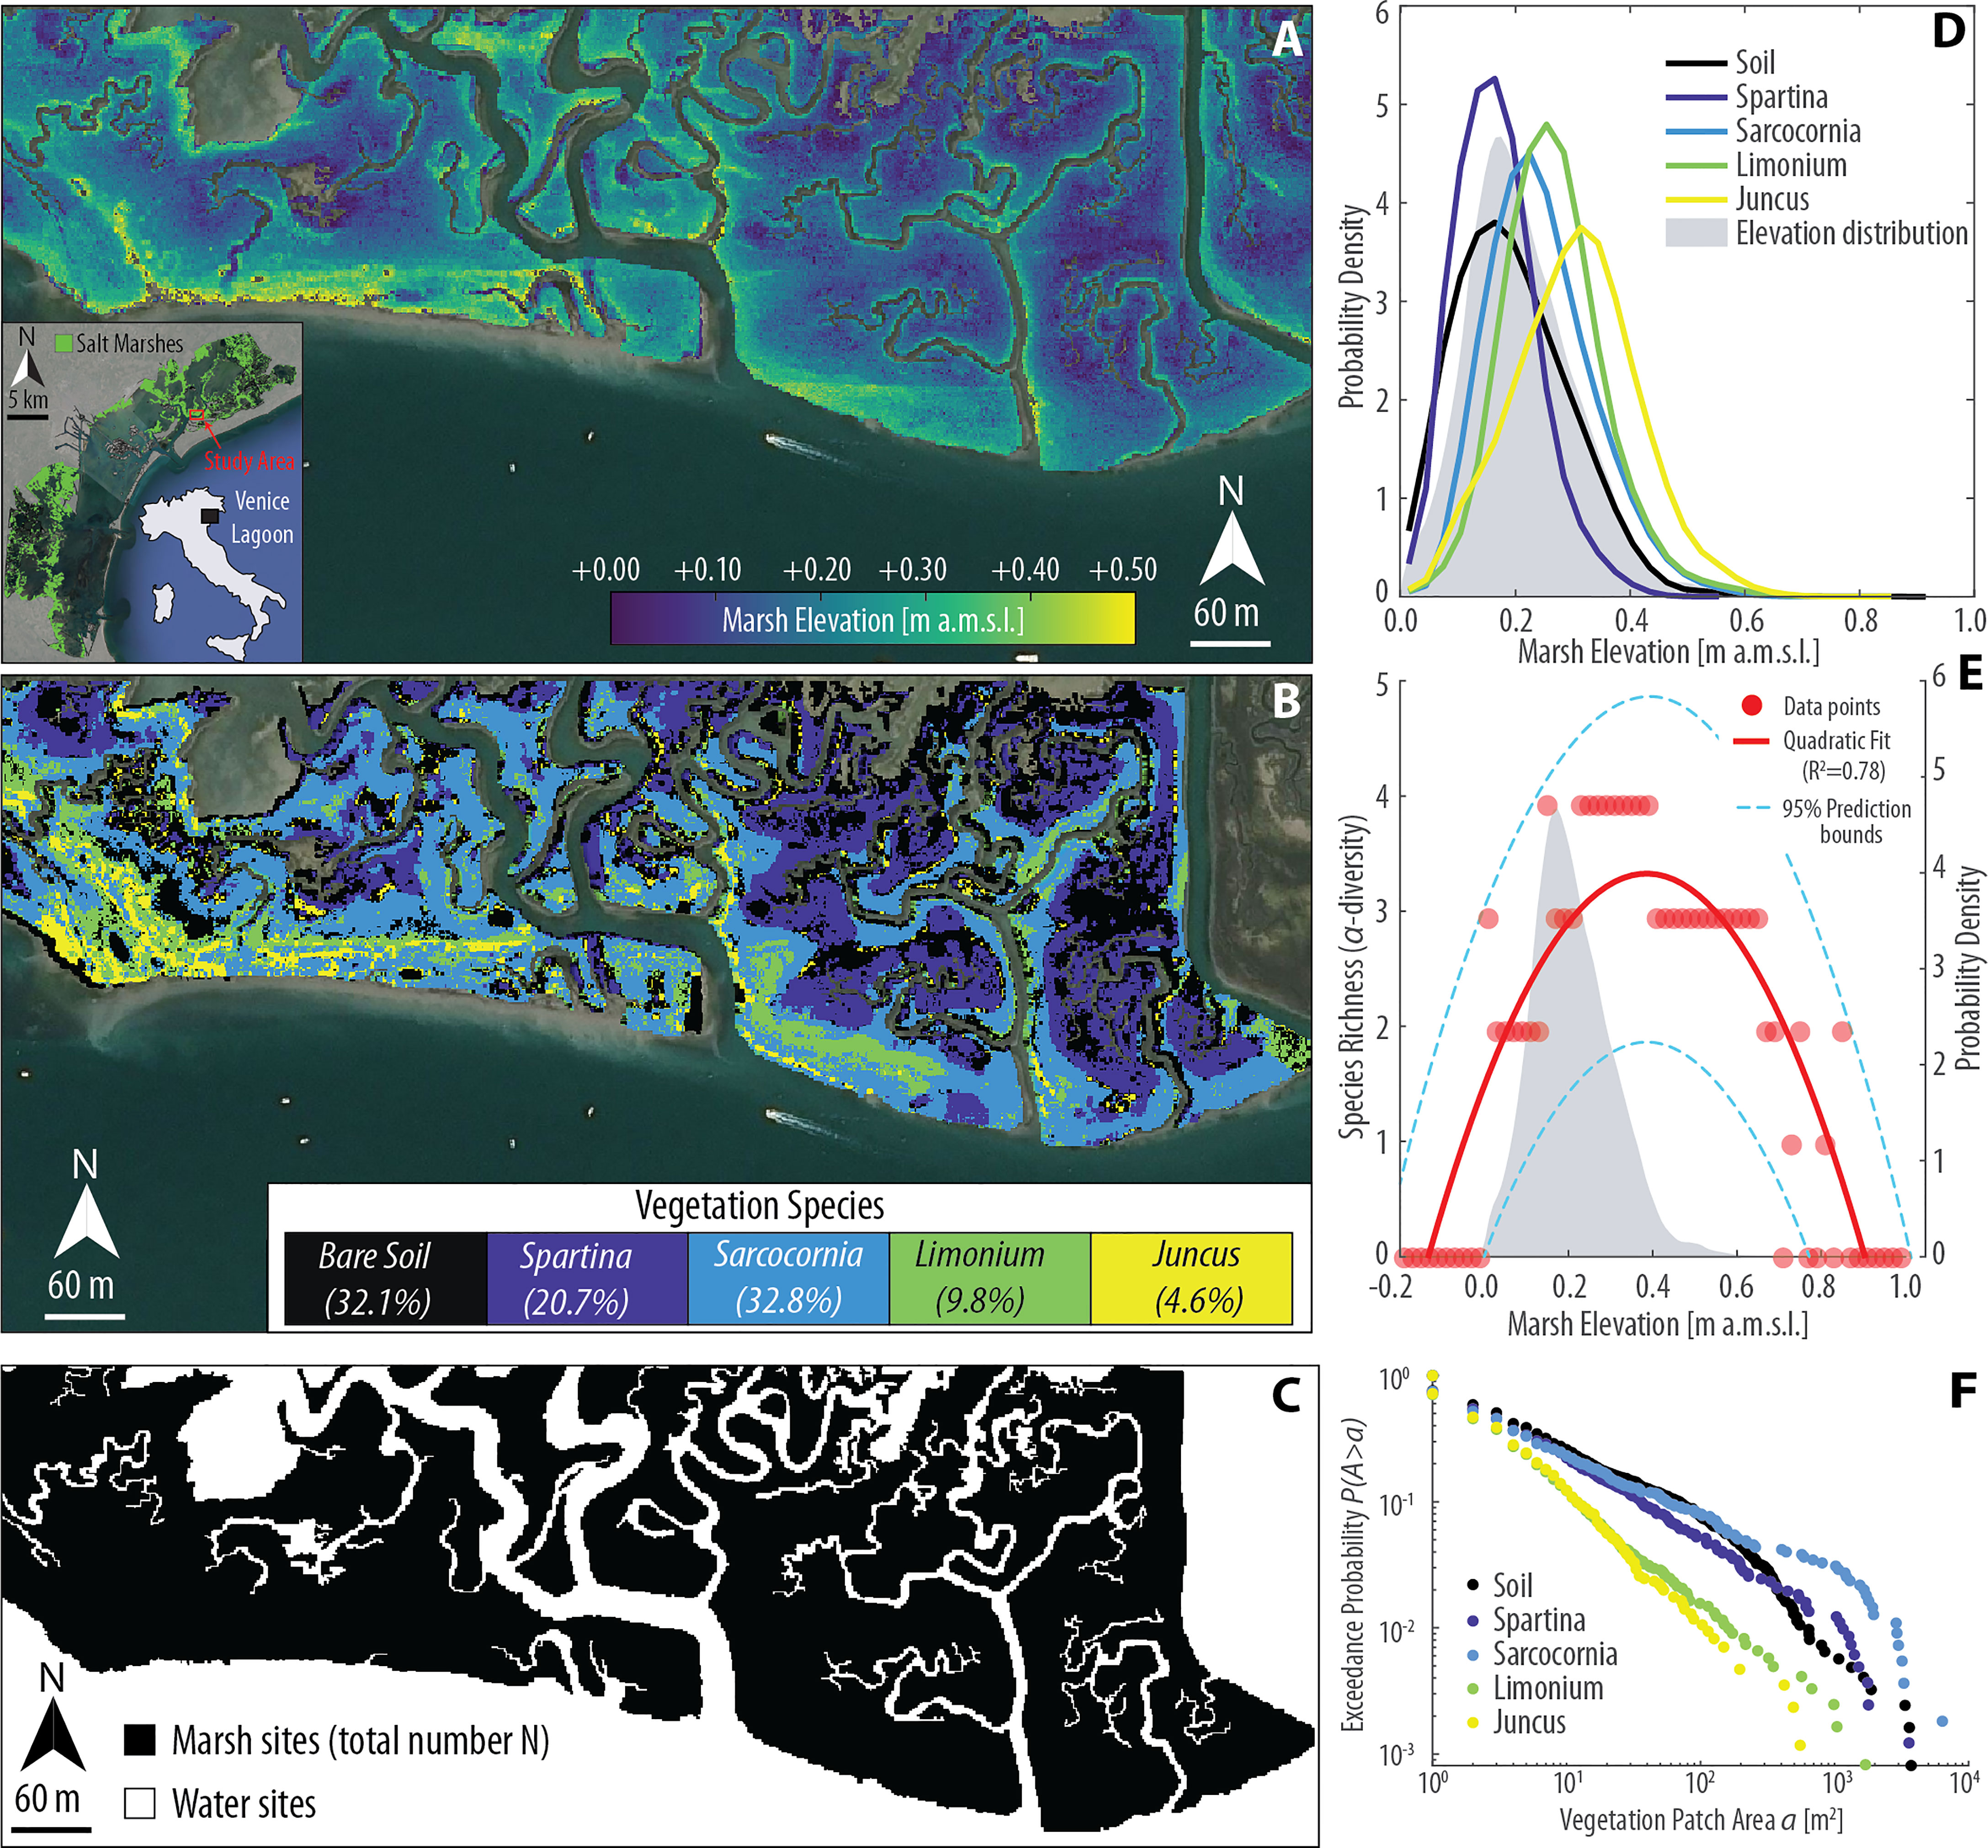
Figure 1 Topographic gradients and vegetation zonation in the San Felice salt marsh (Venice Lagoon, Italy). (A) Lidar-derived digital elevation model (DEM, spatial resolution 1 m; mean elevation 0.21 ± 0.09 m above datum) superimposed to an aerial image of the study area (Aerial Imagery ©CNES/Airbus). Lidar data were collected on February 9, 2003. The reader is referred to Wang et al. (2009) for further details regarding data acquisition. (B) Classification map of vegetation species in the study area. The classification was carried out utilizing a Compact Airborne Spectral Imager (CASI) image, acquired on 29th September 2002 with a spatial resolution of 1.3 m from a flight altitude of 840 m (Belluco et al., 2006; Wang et al., 2007). Dominant vegetation species within each pixel were obtained based on relative fractional abundance estimated through the Random Forest soft classification method (see Yang et al., 2020b for further details), and upsampled using a bicubic interpolation method to meet the resolution of the Lidar data. The percent vegetation cover for each vegetation class is also reported in the legend. (C) Binary representation of the computational domain employed in the numerical simulations presented in this study. (D) Realized ecological niches observed in the study area based on DEM and vegetation data shown in panels (A, B), respectively. Continuous lines represent the probability density estimates of each species (including bare soils) across marsh elevations, whereas the gray area denotes the probability density estimates of marsh elevation derived from DEM data. (E) Local species richness (i.e., α-diversity) as a function of marsh elevation. Red dots represent point data derived from the DEM and vegetation map shown in panels (A, B), respectively. Red line denotes the best quadratic fit to point data, with dashed blue lines showing 95% prediction bounds. The gray area denotes the probability density estimates of marsh elevation derived from DEM data. (F) Empirical probability distributions of spatially-continuous vegetation patch areas, for different species including bare soil, are shown based on the exceedance probability for a given vegetation patch size. The analysis is based on vegetation data shown in panel (B). Empirical probability distributions of patch area are derived by computing A for every vegetation patch and plotting the probability obtained by counting the relative proportion of patches of the same species whose total area exceeds a current value a, here expressed in square meters.
Despite the importance of vegetation dynamics in controlling physical and biological processes that ultimately determine whether salt marshes will aggrade, persist, or drown in the face of climate changes, modeling these dynamics remains a major challenge both at the theoretical and practical level (e.g., Best et al., 2018; Brückner et al., 2019). This is mostly due to the fact that some key drivers of vegetation dynamics are not properly accounted for in common modeling practices.
Biotic interactions in numerical models are typically conceptualized based on the empirical observation that physical processes and stresses – such as salt-marsh vertical accretion rates, salinity, flooding frequency and duration (i.e., hydroperiod), and nutrient availability – exert a key role in regulating the realized distributions (i.e., observed niches) of marsh halophytes (Redfield, 1972; Snow and Vince, 1984; Kuhn and Zedler, 1997; Levine et al., 1998; Pennings and Bertness, 2001; Morris, 2007; Xin et al., 2013; Xin et al., 2017; Boyd et al., 2017; Schulte Ostermann et al., 2021). Realized niches typically display a maximum potential for presence and growth at an optimum intertidal elevation (Redfield, 1972; Silvestri et al., 2005), with different species confined to narrow elevation bands (Marani et al., 2004; Morris et al., 2005; Mudd et al., 2009) (Figure 1D). Consequently, local species diversity (i.e., α-diversity) also exhibits hump-shaped patterns, with intermediate elevations hosting the largest number of species (De Leeuw et al., 1992; Crain and Bertness, 2006) (Figure 1E). However, due to biotic interactions, the realized niche could be quite different from the theoretical one, the latter being the distribution a species would attain in the absence of interspecific competition. Indeed, field experiments involving transplantation of halophytes across marsh topographic gradients, outside their realized niches, indicate ever-increasing performances of each species as elevation increases from the lower to the upper marsh (Bertness and Ellison, 1987; Pennings and Bertness, 2001), in contrast with hump-shaped realized niches. Such a lack of correspondence between the physiological stress tolerance of marsh plants across topographic gradients and their realized distributions suggests that the latter may not necessarily resemble the fundamental (theoretical) niches, and urges a deeper understanding of ecological dynamics controlling species distribution. Indeed, this difference calls for factors other than environmental conditions to concur in creating the observed zonation patterns in salt marsh communities (Pennings and Bertness, 2001; Pennings and He, 2021).
Many experimental studies have demonstrated that there exists an inherent tradeoff between competitive ability and stress tolerance (sensu Grime, 1977), such that competitively superior plants occupy the more elevated, least stressful zones of the salt marsh and displace competitively inferior plants to the lower, more stressful portions of the intertidal frame (Snow and Vince, 1984; Bertness and Ellison, 1987; Bertness, 1991a; Bertness, 1991b; Pennings and Callaway, 1992; Levine et al., 1998; Ungar, 1998; Emery et al., 2001; Pennings et al., 2005; Morris, 2006). As a result, every halophytic species would be fully capable of persisting at elevations higher than where it normally occurs if competitors were absent, whereas species would die out if transplanted to elevations lower than the optimal realized niche. (Bertness and Ellison, 1987; Bertness, 1991a; Bertness, 1991b; Pennings and Bertness, 2001; Pennings et al., 2005). According to this paradigm, which is consistent with results from non-saline wetlands (Grace and Wetzel, 1981; Keddy, 1989), marsh halophytes could potentially colonize supratidal freshwater environments, where they are however outcompeted by glycophytes that are more fitted to hyposaline conditions. In view of the above, it is generally hypothesized that the lower limit of each species is determined by abiotic factors mostly related to marsh elevation and local climate (e.g., salinity, hydroperiod, redox potential, nutrient availability, soil moisture and chemistry, local microtopography, hydrodynamic stresses), while the upper limit is set by biotic factors (e.g., competition-facilitation and tradeoffs thereof, physiological adjustment, seedling recruitment, emergence and growth strategy, herbivory predation), among which interspecific competition is key (Lee and Kim, 2018; Sarika and Zikos, 2020; Pennings and He, 2021).
Despite competitive displacement and physiological tolerance to stressors having long been recognized as the most decisive factors in generating salt-marsh vegetation zonation (e.g., Pennings and Callaway, 1992), most of the existing ecomorphodynamic models of salt marshes employ oversimplifications that do not allow these processes to be effectively reproduced.
First, fundamental species niches are typically approximated by the realized ones. Therefore, although field studies suggest performances of individual species to increase steadily with elevation in the absence of competition, habitat quality and vegetation performances are typically assumed to peak at an optimum marsh elevation, and to decrease as elevation moves away from such optimum (Morris et al., 2002; Morris, 2006; Morris, 2007; D’Alpaos et al., 2007; Kirwan and Murray, 2007; Kirwan and Guntenspergen, 2010; Fagherazzi et al., 2012; Da Lio et al., 2013; Marani et al., 2013; Kirwan et al., 2016; Geng et al., 2021; Kalra et al., 2021; Sgarabotto et al., 2021).
Second, competition in numerical models of marsh vegetation dynamics, with few exceptions (e.g., Marani et al., 2006), does not occur by direct species interaction. Rather, the successful colonizer is chosen based on local habitat quality in a deterministic (i.e., “fittest-takes-it-all”) or stochastic manner (i.e., proportionally to the local habitat quality of all species) (Morris et al., 2002; Morris, 2006; D’Alpaos et al., 2012; Da Lio et al., 2013; Marani et al., 2013). Therefore, competition occurs indirectly by virtue of changes in local marsh elevation, assuming specific competitive abilities to operate most efficiently within the optimal habitat quality range of each species.
Finally, it is often overlooked that biological dispersal and competition in tidal marshes are density-dependent processes, i.e., they are a function of local population size, as well as habitat quality and size (Bertness and Ellison, 1987; Ellison, 1987; Bouma et al., 2009; Balke et al., 2017; Lõhmus et al., 2020; Bertassello et al., 2021).
Altogether, these shortcomings are likely to limit the ability of current ecomorphodynamic models to predict the response of marsh ecosystems to changing externals forcings (e.g., Zhang et al., 2020). To bridge this gap, proper modelling treatments of biotic interactions are required, which assume fundamental niches consistent with field observations and account for spatially-explicit mechanisms of interspecific competition and dispersal. Improving our ability to model the drivers and outcomes of halophytic-species zonation is paramount to enhance projections of salt-marsh evolution (Kirwan and Temmerman, 2009; Kirwan et al., 2016; Schuerch et al., 2018), with direct practical implications for salt-marsh conservation and restoration worldwide (Broome et al., 1988; Day et al., 2007; Palaima, 2012). In particular, a model capable of reproducing vegetation dynamics observed in the field would allow for cost-effective community-level studies, helping us to clarify whether our understandings of marsh systems derived from small-scale experiments can be upscaled to explain marsh community dynamics at larger spatial scales.
Here we present a new bidimensional, spatially-explicit, species-interaction model aimed at simulating the dynamics of halophytic vegetation in tidal saline wetlands based on vegetation habitat quality, competition, and dispersal. We test the model’s ability to reproduce patterns of vegetation zonation and species richness observed in nature. To demonstrate model robustness, we perform a sensitivity analysis and illustrate how changes in the key model parameters affect results. Moreover, we run exploratory numerical simulations aimed at assessing model performances in replicating results of ecological experiments involving the transplant of species outside their realized ecological niches. Even though the model can be easily extended to investigate morphological shifts from tidal flats to salt marshes driven by the colonization of pioneers species, here we do not focus on initial vegetation establishment (e.g., Balke et al., 2017; Brückner et al., 2019; Lõhmus et al., 2020) because our interest is in the medium to long-term outcomes of vegetation dynamics in mature marshes. Nonetheless, a discussion on how the initial vegetation distribution affects model results will be provided later in the text. Finally, we discuss the potential for integrating our model into a morphodynamic model to simulate the coupled evolution of vegetation and salt-marsh platforms under changing external forcings.
2 Material and Methods
2.1 Model
The model considers a system of I vegetation species, distributed in an equally-spaced 2D lattice with a uniform spatial resolution dx, wherein each site (i.e., cell) j is characterized by a given elevation (zj) relative to the mean sea level. The elevation zj determines the habitat quality of species i at site j via a habitat quality function (sensu Rybicki and Hanski, 2013), which is here modeled through a logistic function (Figure 2A):
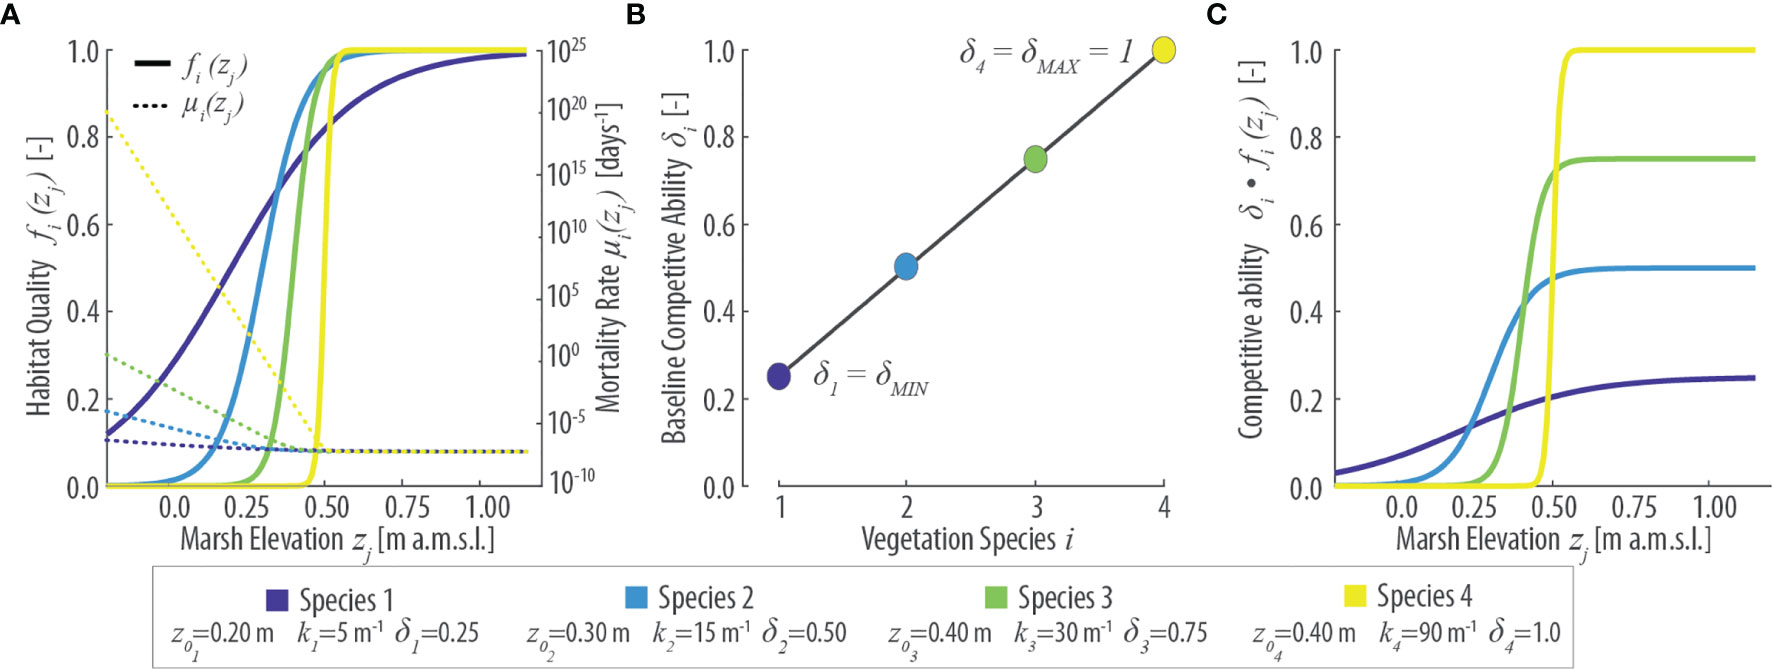
Figure 2 Parametrization of vegetation features in the numerical model based on 4 virtual species. (A) Patterns of specific habitat quality function fi(zj) (continuous lines, left y-axis) and mortality rate µi(zj) (dotted lines, right y-axis) as a function of local marsh elevation (zj). (B) Baseline specific competitive ability (δi) for different vegetation species i. (C) Specific competitive ability [δi fi(zj)] as a function of local marsh elevation (zj). Values of the parameters z0i, ki, and δi for each species are reported in the lower inset.
where z0 corresponds to the logistic sigmoid point, k is the logistic rate, and the maximum habitat quality is set equal to 1 for all species. Habitat quality determines the fitness (performance) of the species in the respective grid cell as described further below. The habitat quality function can be viewed as the dimension of a species’ fundamental niche (sensu Hutchinson, 1957), that is, the space theoretically occupied by a species in the absence of competitors based on physical and biotic predictors alone. The realized niche is expected to be reduced in size as a result of interspecific competition (Bertness, 1991a; Ungar, 1998). The use of a monotonically increasing logistic function for habitat quality is justified by the empirical observation that halophytes are capable of living at elevations higher than where they are normally found if competitors are absent, whereas vegetation lower limit is set by plant tolerance to physical stresses (Pennings and He, 2021). Although these physical stresses are, in most cases, not fully identified, most of them (e.g., flooding frequency and duration, salinity, oxygen sufficiency, temperature) depend to some degree on the local hydroperiod, which is in turn primarily determined by the elevation of the marsh surface (Morris et al., 2002). Therefore, physical stresses in our habitat quality function are synthesized by means of the local marsh elevation (zj), implicitly assuming that physical stresses decrease as marsh elevation increases, and that such gradient is consistent across the whole marsh. The latter condition does not necessarily hold in marshes that are not regularly flooded (Costa et al., 2003; Pennings et al., 2005) as we will discuss later in the text (see Section 4).
Each cell of the system can be occupied by a single individual of a generic species i. We explicitly model the process of death and colonization by offsprings of existing individuals via dispersal. Different species are characterized by different baseline competitive abilities δi (Figure 2B) that affect the probability of colonization when offsprings of different species are competing. As discussed in the introduction section, we introduce a tradeoff between competitive ability and stress tolerance so that species with lower stress tolerance (higher z0) have an inherent higher competitive ability and vice versa (Figures 2B, C). Therefore, habitat quality modulates specific mortality and fertility rates, as well as their effective competitive ability.
Ecological interactions among species are simulated as follows. At each time step, the individual occupying a given site j dies according to the local mortality rate of the species i it belongs to. Such a mortality rate µi(zj) is assumed to be inversely proportional to the specific habitat quality:
where µ0i is the baseline mortality rate of species i. The mortality rate is minimum where the species have the maximum habitat quality and increases for lower habitat quality at lower elevations (Figure 2A). We model the occurrence of a death event as a Poisson process. Thus, the waiting time until the next death event occurs follows an exponential probability distribution characterized by a rate µi. Therefore, within a time step Δt, each individual dies with probability .
The cleared site can be recolonized by the offspring of any individual in the system. Colonization by an offspring of species i occurs at a rate Cij. Such a rate is proportional to the fertility rate characterizing the ith species, weighted through a dispersal kernel function (Bullock et al., 2017) that depends on the euclidean distance d between the site j and any given site n colonized by the species i. Since K is typically inversely proportional to , we will hereinafter assume K to be exponential:
where Di denotes a characteristic dispersal length and dx is the domain spatial resolution. The choice of an exponential dispersal kernel to model vegetation colonization is justified by empirical observations suggesting that i) in mature marshes, marsh perennials colonize available bare spaces mostly vegetatively rather than by seedling; and, ii) species dispersal takes place at a relatively local scale (Bertness and Ellison, 1987; Ellison, 1987; Bullock et al., 2006; Chang et al., 2007; Lõhmus et al., 2020). The total colonization rate Cij exerted by the species i on the site j can thus be expressed as follows:
where N is the total number of sites (i.e., cells) within the domain, wi,n is a binary occupation function that is equal to 1 when the site n is colonized by species i, and φi is the baseline fertility rate of species i corresponding to the maximum habitat quality fi=1. Notably, Cij depends on the habitat quality that the ith potential colonizer has both on all the sites that it currently colonizes (as it affects the ith species fertility: ) and on the site j to be colonized (as it affects the ith species competitive ability at site j: δi fi(zj), see Figure 2C). Colonization can also be allowed by offsprings of individuals not currently present within the system. This additional competitor is accounted for by adding a term to Cij at each time step, being ϕout the input of offsprings from outside the system, in this way potentially allowing for immigration of species not currently present in the system. To account also for this possible process, Cij eventually reads:
The site j is colonized with a probability , where is the total colonization rate at site j by any species i:
If the colonization event occurs, the colonizing species is randomly selected with a probability proportional to Cij; otherwise, the site is left unvegetated.
The colonization rate Cij can be seen as the bidimensional convolution between the field and the Kernel K(d) (Rybicki and Hanski, 2013; see Figures 3A–C):
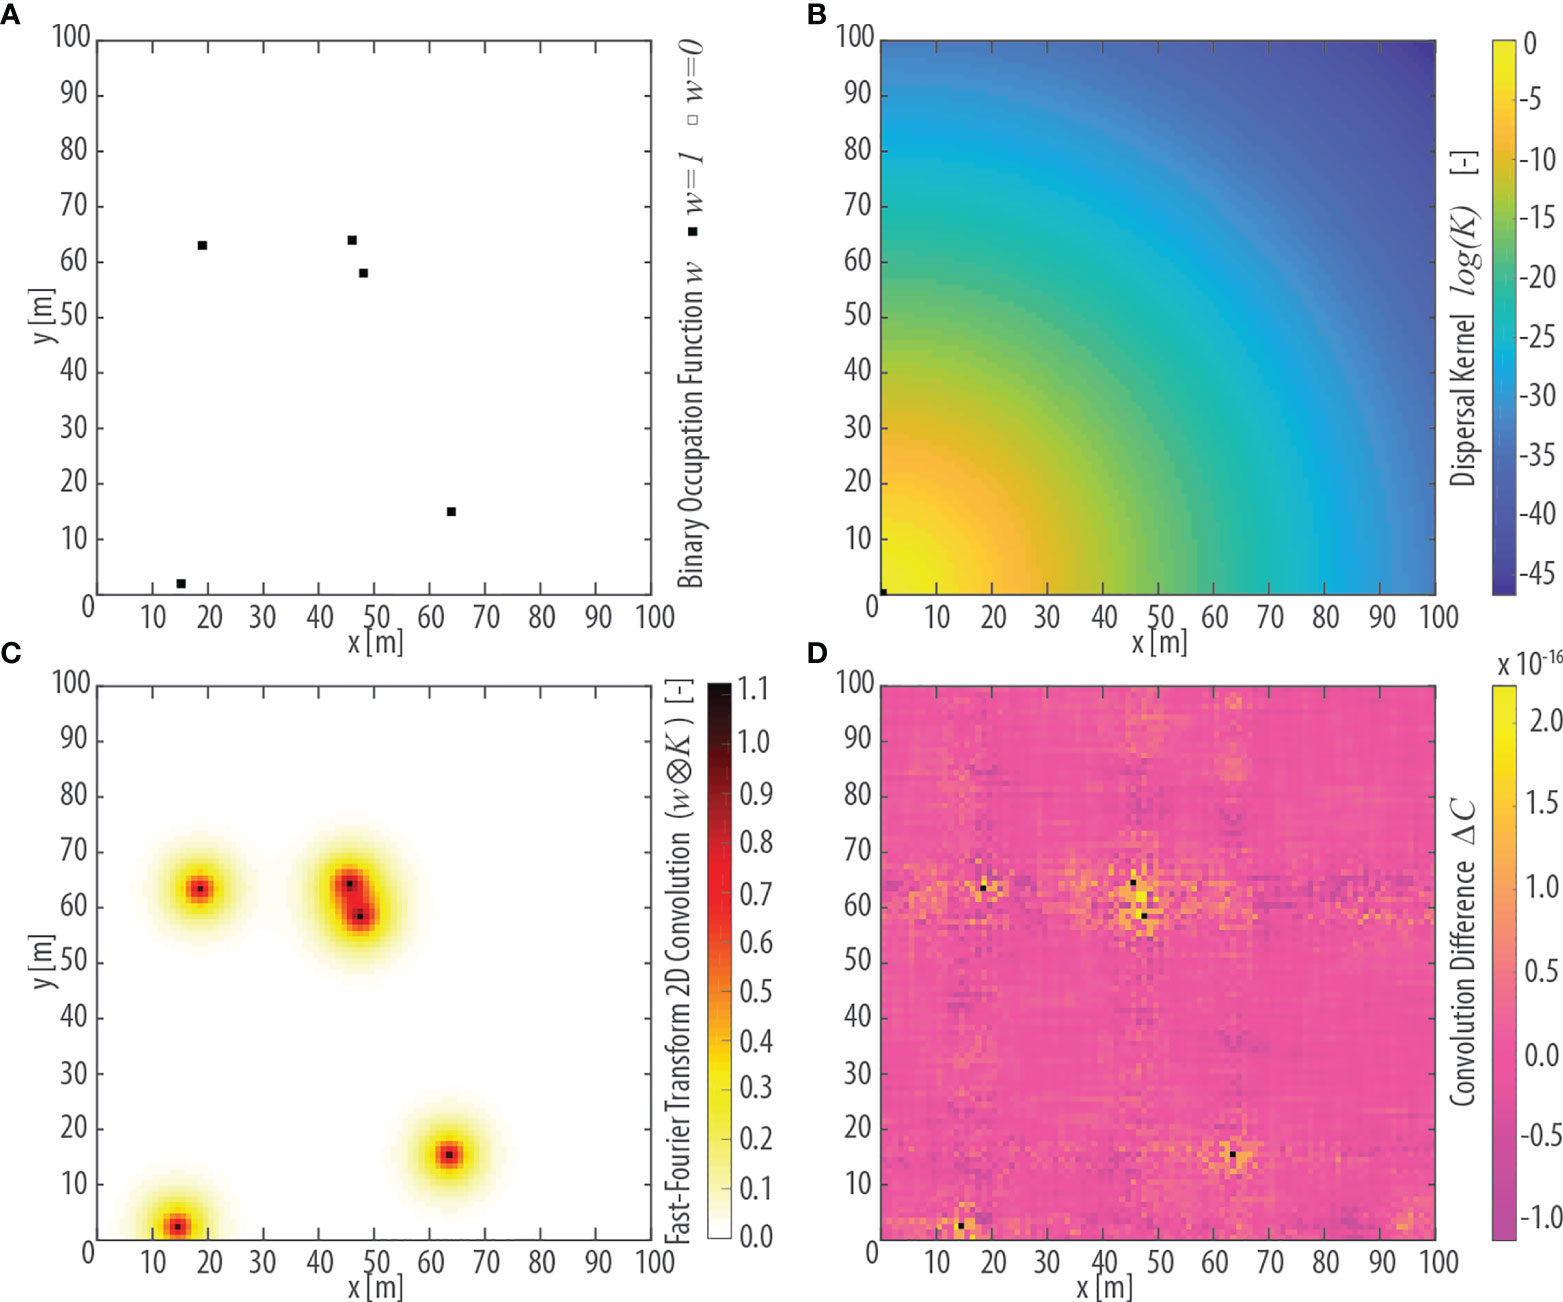
Figure 3 Conceptualization of vegetation dispersal illustrated in a square, 100m-wide, idealized lattice domain. (A) The n=5 pixels colonized by a given focus species i are represented by a binary occupation function wi,n.(B) Value of the dispersal kernel κ as a function of the euclidean distance d of each pixel from the pixel in the lower-left corner within the idealized lattice. The characteristic dispersal length for κ is assumed equal to D=3 m. (C) Results of the 2D convolution wi,n ⊗ κ(d) between the occupancy field wi,n and the dispersal kernel κ(d) shown in panel (A, B), respectively, computed using the Fast-Fourier Transform (FFT) algorithm. (D) Absolute difference ΔC in the value of the 2D convolution wi,n ⊗ κ(d) computed explicitly and using the FFT algorithm. Black dots denote pixels occupied by the focus species [see panel (A)] in which ΔC =0.
where denotes the bidimensional convolution. Taking advantage of the properties of the Fourier bidimensional transforms, one can write (Rybicki and Hanski, 2013):
and eventually:
being F and F-1, respectively, the Fourier Transform and its inverse. Figure 3C illustrates the calculation of a bidimensional convolution between wi,n (Figure 3A) and K(dn,j) (Figure 3B) on a synthetic square domain computed through the discrete Fast Fourier Transform (FFT) algorithm. Figure 3D shows the absolute difference between the explicit bidimensional convolution and the calculation carried out using the discrete FFT. The observed differences, which can be ascribed to approximation errors due to the use of the FFT algorithm, are in the order of 10-16 and can thus be neglected.
2.2 Numerical Simulations
We test our model against field data from the San Felice salt marsh (Venice Lagoon, Itay), for which combined elevation and vegetation data are available at a spatial resolution of 1 m (Figures 1A, B). Both the marsh domain and elevation were set equal to those observed in the field (Figures 1A, C), and elevation was held constant over the whole simulation duration. In this way, biotic interactions can emerge more clearly as no eco-morphodynamic feedbacks are allowed.
2.2.1 Sensitivity Analysis
To explore model performances and their sensitivity to input parameters, simulations of 50-year duration were carried out to allow time for convergence to a dynamic steady state in terms of vegetation distributions. In order to filter out oscillations due to demographic stochasticity, each simulation was repeated 20 times, and aggregated results of repeated simulations were finally analyzed. A constant timestep equal to 1 solar month was used in all simulations.
We considered a total of 4 virtual species (i.e., a suitable assemblage of focus species), equal in number to those observed in the field and characterized by different fundamental niches (e.g., Figure 2A). Besides being equal in number to the species observed in the San Felice salt marsh (Figures 1B, D), the virtual species we adopted are generally characterized by habitat quality functions aimed to mimic, at least qualitatively, features of vegetation species found in the field (Figure 1D). Specifically, progressively larger values of the sigmoid point (z0) in the habitat quality function are generally adopted as the ordinal number of the virtual species increases, from i=1 to i=4. In this way, we implicitly assume higher ordinal species to be generally less adapted to lower marsh elevations (Figure 2). Therefore, a direct qualitative correspondence can be drawn between virtual and field species, with Species 1, 2, 3, and 4 ideally representing Spartina, Sarcocornia, Limonium, and Juncus, respectively (Figures 1B, D).
Though potentially feasible, we did not attempt to calibrate the parameters of the fundamental niches based on the realized vegetation distributions. Rather, parameter values of fundamental niches were chosen to represent hypothetical species with plausible habitat-quality distributions that span topographic ranges along the intertidal gradient observed in the study case (D’Alpaos, 2011; Da Lio et al., 2013; Marani et al., 2013). This is because the present-day zonation of vegetation species in the salt marsh does not necessarily reflect ecological succession till now (Roozen and Westhoff, 1985), and the high frequency of environmental disturbances in tidal marshes often causes vegetation to be in a transient, non-equilibrium state (De Leeuw et al., 1992). Hence, realized distributions might not reflect dynamic-equilibrium conditions. Besides, although the general mechanisms driving vegetation zonation in tidal marshes may be universal, the importance of different physical factors is likely to vary geographically (Pennings et al., 2005). Therefore, realized niches for any given species can differ regionally as a function of local tidal range, salinity, and climate, as well as community assemblage (Silvestri et al., 2005). As such, the use of virtual species allows us to test our model and generalize our results beyond the study case analyzed here.
Our reference simulation (REF) employs an exponential dispersal kernel with a species-independent characteristic dispersal length D=1 m. At the beginning of the simulation, vegetation species and bare-soil patches are randomly distributed across the computational domain. The habitat quality function of all species is characterized by a constant rate k=90 m-1, with logistic sigmoid points set equal to ={0.05, 0.10, 0.15, 0.20} m for species i={1,2,3,4} respectively. We assume species-independent baseline mortality rate µ0=5·10-3 [days-1] and fertility rate φ=1/0.01 [days-1], while the import fertility rate is defined as ϕout = φ/100.
Finally, since different species are characterized by different interspecific competitive abilities, a baseline competitiveness coefficient δi is assigned to each species (Figure 2B). Though this coefficient can theoretically vary without limitations, in reality, we observe that more generalist and invasive species, typically restricted to lower marsh elevations, have comparably lower competitive ability than species occupying the higher portion of the intertidal range. Therefore, we hypothesized here that δi decreases linearly between δ=δMAX=1 and δ=δMIN≤δMAX, where δMAX and δMIN represent the competitive ability of the species displaying the highest and lowest z0 scores, respectively (Figure 2B). In our reference simulation, we set δMIN=δMAX=1, such that species have elevation-dependent habitat quality and otherwise neutral traits.
To demonstrate model robustness, we perform a sensitivity analysis and illustrate how changes in the key input parameters affect modelling results. Individual parameters are varied one at a time in order to study their effects on vegetation dynamics separately. In detail, we investigate the effects of different:
- w_cos_hair01_a.ddsinitial vegetation distribution (IVD series), assuming a marsh completely devoid of plant life (IDV1) and a vegetation distribution equal to that observed in the field (IDV2, see Figure 1B);
- habitat quality function (HQF series), considering four sets of values equally spaced by 5 cm and spanning elevation ranges both lower (={-5,0,5,10} cm for HQF1; ={0,5,10,15} cm for HQF2) and higher (={10,15,20,25} cm for HQF3; ={15,20,25,30} cm for HQF4) than in the REF scenario. In addition, we also considered different sets of logistic rates ki, the latter being assumed to either increase (ki={5,30,60,90} m-1 for HQF5; ki={30,50,70,90} m-1 for HQF6) or decrease (ki={90,70,50,30} m-1 for HQF5; ki={90,60,30,5} m-1 for HQF6) as increases;
- interspecific competitive ability (ICA series), assuming progressively lower values of δMIN, corresponding to a progressively larger difference in interspecific competitive ability (δMIN=0.75 for ICA1; δMIN=0.50 for ICA2; δMIN=0.25 for ICA3; δMIN=0.01 for ICA4);
- base mortality rate (BMR series), considering values of µ0 both larger (µ0=5·10-1 and 5·10-2 days-1 for BMR1 and BMR2, respectively) and lower (µ0=5·10-4 and 5·10-5 days-1 for BMR3 and BMR4, respectively) compared to the REF scenario, while maintaining the hypothesis of equal µ0 for all the virtual species;
- fertility rate (VFR series), with φ values lower (φ=100 and 101 days-1 for VFR1 and VFR2, respectively) and larger (φ=103 and 104 days-1 for VFR3 and VFR4, respectively) than the REF scenario;
- dispersal kernel size (DKS series), considering different characteristic dispersal length D equal to 0.10 m (DKS1), 0.50 m (DKS2), 1.50 m (DKS3), and 10 m (DKS4), while maintaining the hypothesis of equal D for all the virtual species;
The parameter values for all the simulations are reported in Table 1. Results have been analyzed in terms of changes in the percent vegetation cover through time, as well as realized vegetation niches and probability distributions of continuous patch areas occupied by each species (see Figure 1F) at the end of the simulation. Moreover, we have also analyzed the patterns of species richness (i.e., α-diversity) as a function of marsh elevation by counting the number of species observed at given elevation intervals (see Figure 1E).
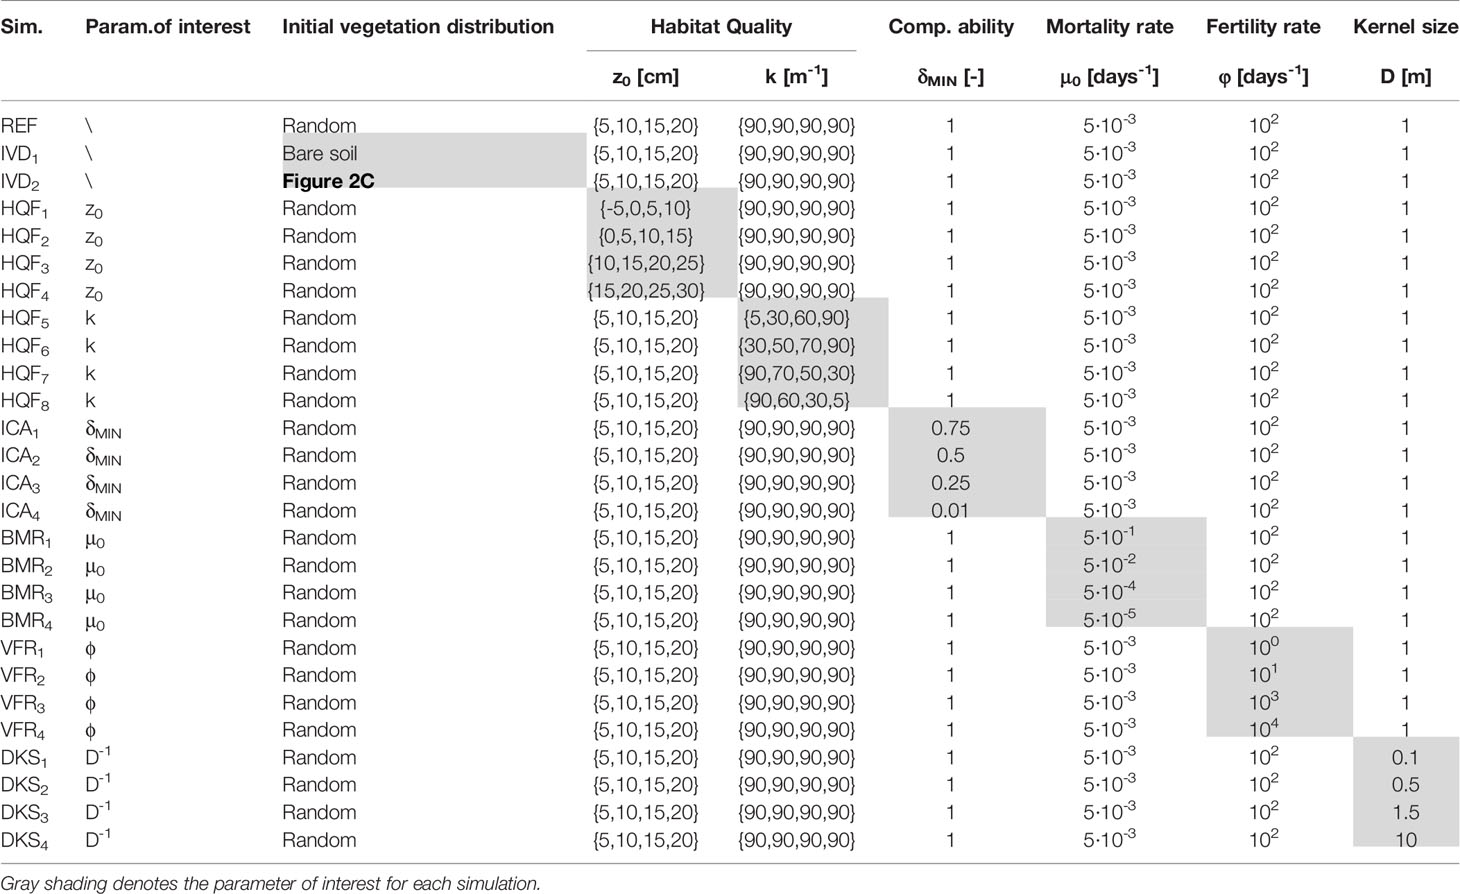
Table 1 Simulation parameters for the different scenarios investigated in the sensitivity analysis.
2.2.2 Transplant Experiment
To test the ability of our model to reproduce not only realistic patterns of vegetation zonation and species diversity at equilibrium but also dynamic evolution of marsh vegetation, we performed numerical simulations aimed to reproduce the outcomes of classical ecological experiments wherein a species is transplanted to an area outside its optimal (realized) niche.
After running the model for 50 years, in this way allowing for vegetation to reach a dynamic equilibrium condition, we simulated the transplant of marsh species outside their realized niches. To do so, we manually imposed species composition within a 20-by-20 m transplant plot. In the first series of simulations (TECOMP), we did not remove established neighbor vegetation around the transplant plot, thereby allowing for interspecific competition. In contrast, in the second series of simulations (TESOIL), we created around the transplant plot a 5-meter-wide buffer layer of bare soil in which vegetation was systematically removed at each calculation timestep, in this way eradicating potential competitors. In simulations TE1COMP and TE1SOIL, we transplanted Species 4, naturally occurring at high elevations, to a low-lying marsh area (average elevation of the transplant plot =14.19 ± 2.44 m), whereas in TE2COMP and TE2SOIL we moved Species 1, naturally occurring at low elevations, into a highly-elevated marsh plot (=27.18 ± 5.19 cm). Simulation parameters for the transplant experiments were those of the ICA1 series, in which the interspecific competitive ability increases linearly with from δMIN=0.75 for Species 1 (=0.05 m) to δMAX=1 for Species 4 (=0.20 m). Individual simulations were repeated 20 times to filter out oscillations due to demographic stochasticity, and results were analyzed based on the evolution of percent vegetation cover through time within the transplant plot, monitoring monthly changes over a 10-year timespan.
In addition to this, we also compared results of the TECOMP and TESOIL simulations with those obtained using a stochastic modelling approach that has been widely employed in previous studies (e.g., Morris et al., 2002; Morris, 2006; Da Lio et al., 2013; Marani et al., 2013; D’Alpaos and Marani, 2016). In such a stochastic model, vegetation habitat quality does not monotonically increase with marsh elevation, and mechanisms of dispersal and interspecific competitions are not explicitly accounted for. Specifically, habitat quality and interspecific competitive ability are jointly described by way of a simple analytical expression:
where =1 defines the elevation at which both habitat quality and competitive ability are highest, whereas λi is a specific scale parameter expressing the rate at which the habitat quality tends to zero as elevation departs from the optimal range, with larger (smaller) values of λi corresponding to more (less) “specialized” vegetation species. Similarly to our model, the mortality rate of species i at site j, characterized by an elevation zj, is inversely proportional to local habitat quality [days-1]. In contrast to our model, however, when vegetation dies at zj, the successful colonizer is chosen stochastically, proportionally to the local habitat quality of all species at site j. Using this stochastic model, we replicated the TECOMP and TESOIL simulations in terms of both transplant strategies and locations. A value of λ = 5 equal for all species was used in the simulations, whereas was assumed equal to {0.15 0.23 0.25 0.30} m for species i={1,2,3,4}, respectively. These values of approximately correspond to the elevations at which logistic habitat quality functions of individual species reach their maximum values in the ICA1 scenario, which was considered in the transplant simulations carried out using our own model. Similarly to the other transplant experiments, in the TE3COMP and TE3SOIL simulations, we transplanted Species 4 (=0.30 m) to a low-lying marsh area, whereas in TE4COMP and TE4SOIL we moved Species 1 (=0.15 m) to upper marsh portions.
3 Results and Discussion
3.1 Sensitivity Analysis
We qualitatively compared our modelling results with field data in terms of realized vegetation distributions (see Figure 1D) and α-diversity (see Figure 1E), as well as probability distributions of continuous patch areas occupied by each species (see Figure 1F) for different sets of model parameters. Moreover, we also monitored the evolution of percent vegetation cover over the whole simulation horizon.
Results obtained from the REF simulation show that dynamic equilibrium in vegetation spatial distribution is attained after a time τe equal to 20 to 30 years from the beginning of the simulation (see Figure 4H), suggesting the selected simulation duration to be adequate. Similarly to field data, plots of the modelled realized vegetation niches and α-diversity display hump-shaped patterns (Figure 4M), while empirical probability distributions of vegetation patch size, plotted as cumulative probability of exceedance to avoid binning issues, clearly show a power-law character, jointly with the finite-size scaling effect induced by the cutoff dictated by specific maximum patch area (e.g., Giometto et al., 2013; Rinaldo et al., 2014) (Figure 4R). This altogether indicates that a relatively simple model such as that employed in the REF scenario, where species have elevation-dependent habitat quality functions and otherwise neutral traits, suffice in reproducing realistic patterns of species niches, diversity, and zonation (see Figures 1D–F for comparison).
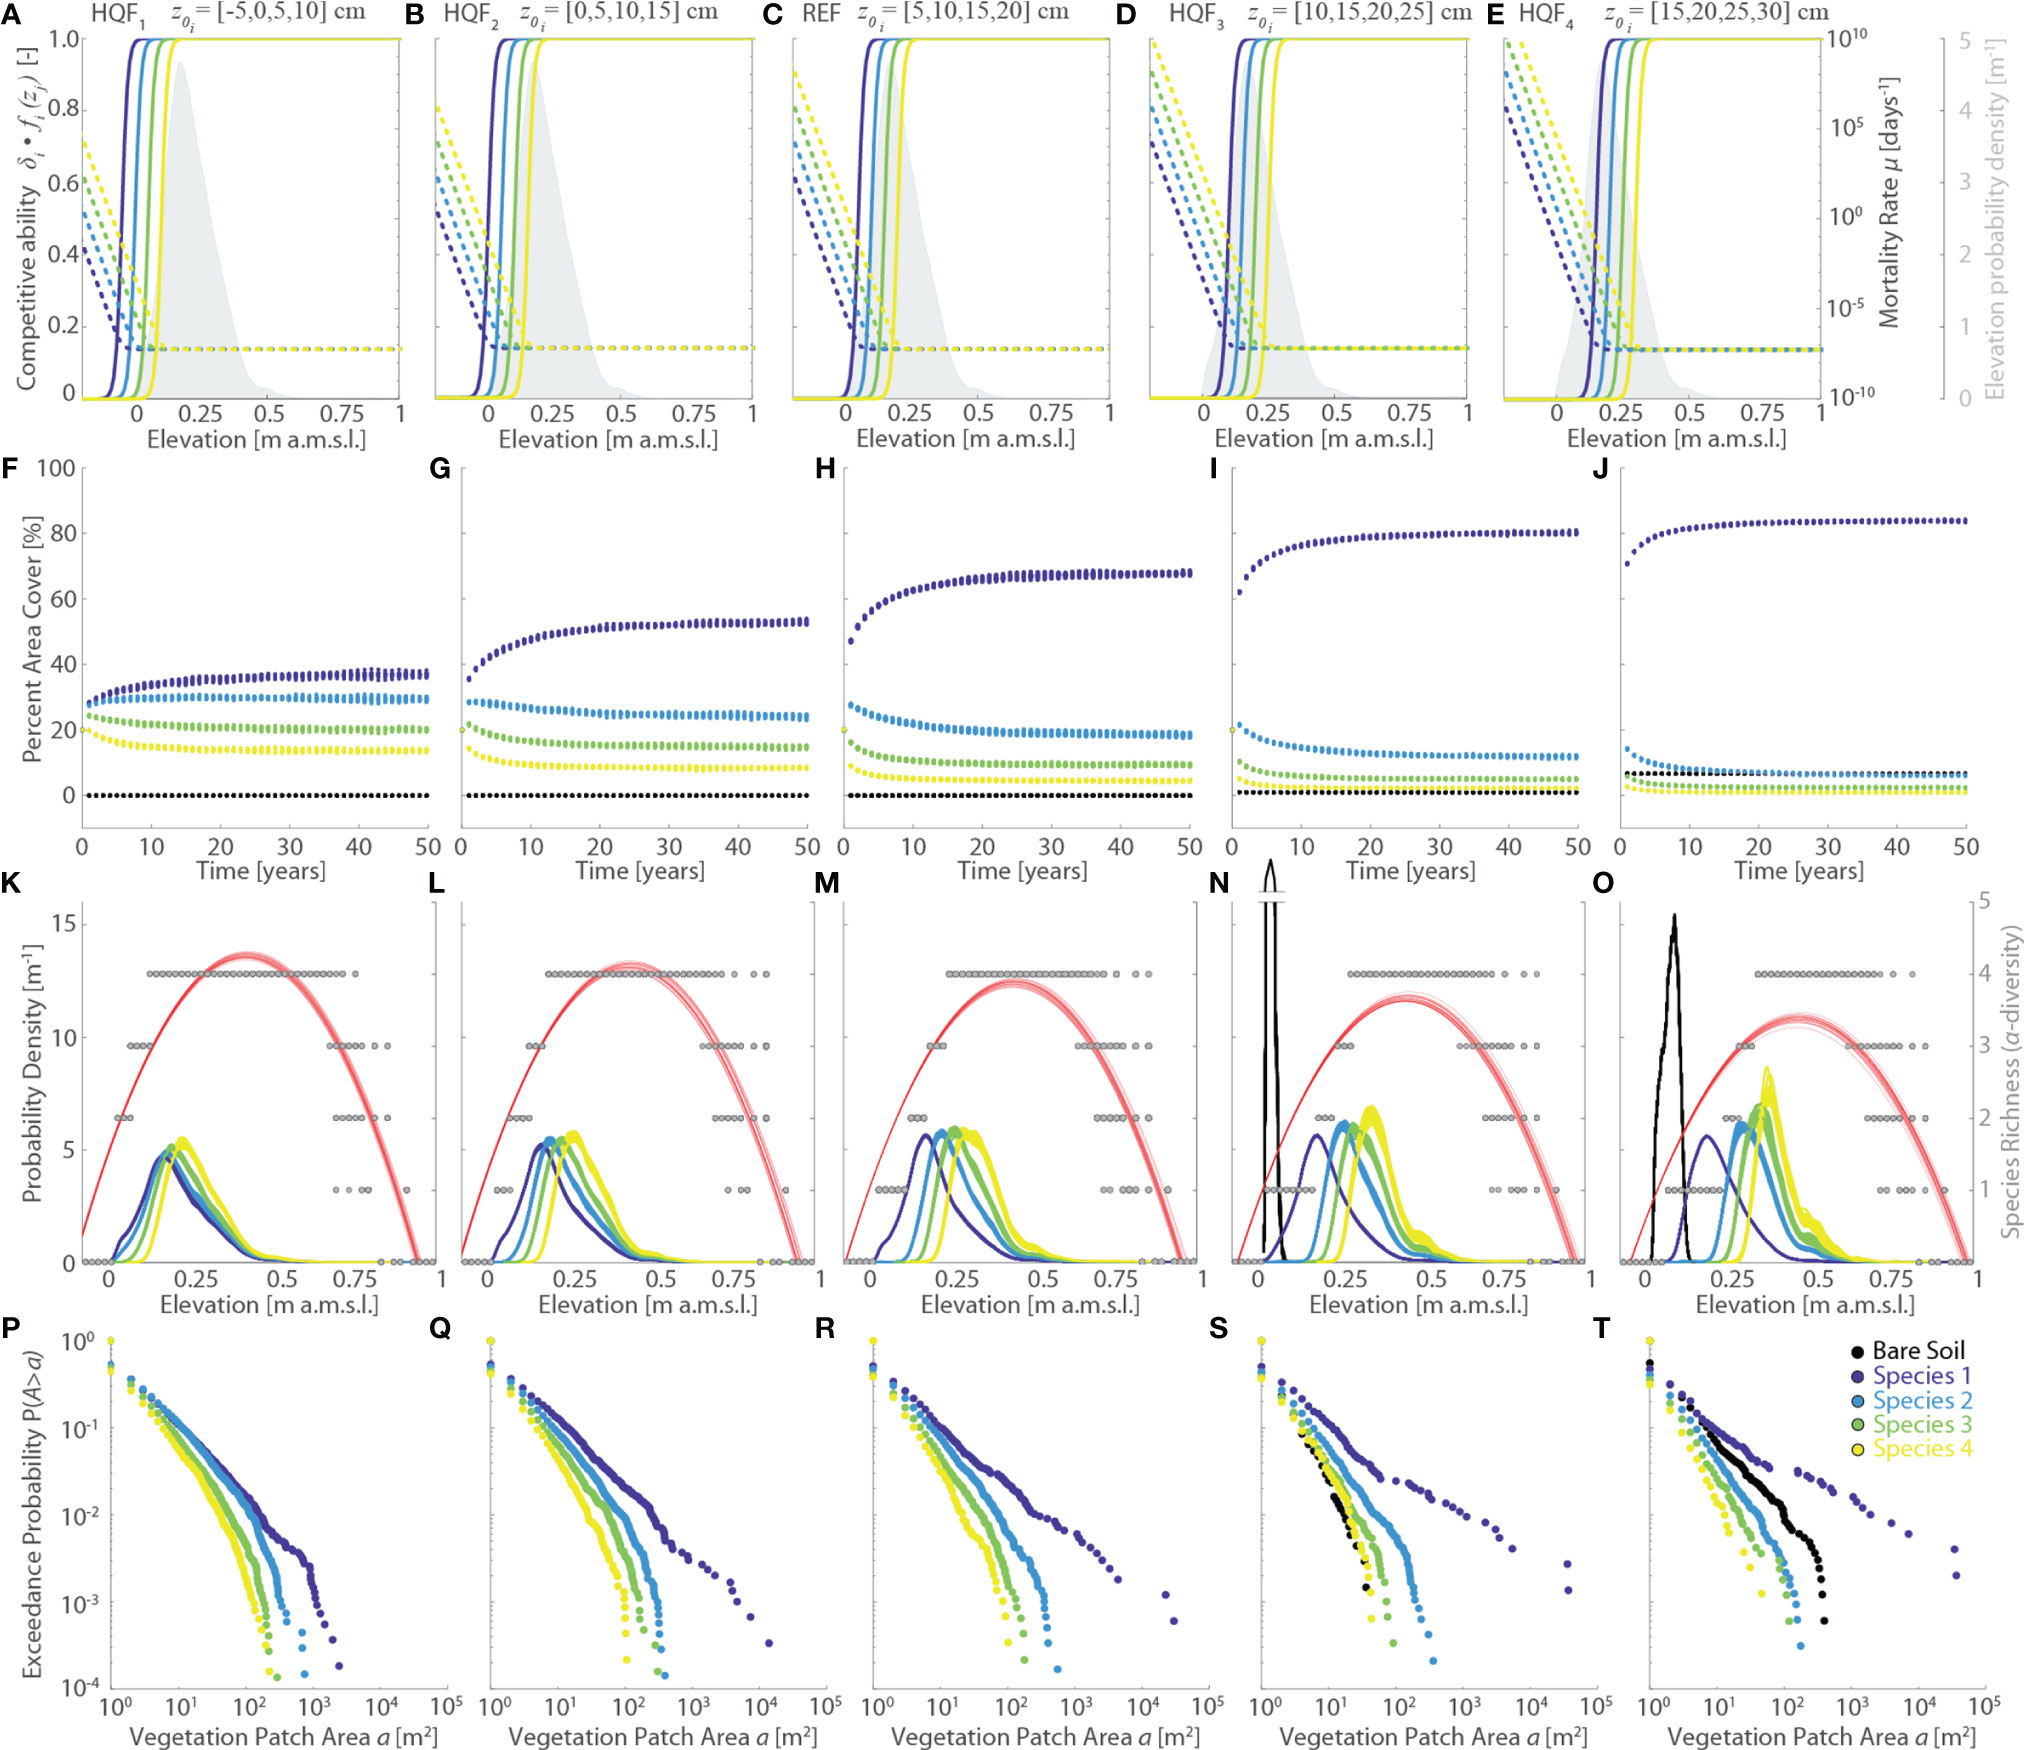
Figure 4 Effects of changes in the vegetation habitat quality functions (HQF series, varying logistic sigmoid point z0). Results of the reference simulation (REF, z0={5,10,15,20} cm) are shown in the central column. The first and second columns report respectively the results of the HQF1 (z0={-5,0,5,10} cm) and HQF2 (z0={0,5,10,15} cm) simulations, whereas the fourth and fifth columns show the results of the HQF4 (z0={10,15,20,25} cm) and HQF5 (z0={15,20,25,30} cm) simulations, respectively. Each panel displays data derived from all the 20 numerical simulations performed for each scenario. Different colors denote different vegetation species, including bare soil, according to the legend shown in the lower-right panel. (A–E) Patterns of specific competitive ability δi fi(zj) (continuous lines, left y-axis) and mortality rate µi(zj) (dotted lines, right y-axis) as a function of local marsh elevation (zj). The gray area denotes the probability density estimates of marsh elevation within the computational domain. (F–J) Changes of percent vegetation cover over the whole simulation horizon. (K–O) Realized vegetation niches (left y-axis) and local species richness (i.e., α-diversity, right y-axis) as a function of marsh elevation at the end of the simulation horizon. Gray dots represent α-diversity point data with red lines showing the best quadratic fit to point data. (P–T) Empirical probability distributions of spatially-continuous vegetation patch areas are shown based on the exceedance probability for a given vegetation patch size.
Initial vegetation distributions different from the REF scenario have limited effects on the model results at equilibrium. Specifically, results by all means similar to the REF simulation are obtained for the IDV1 scenario (Supplementary Figure 1), whereas only slight differences are observed between the REF and IDV2 scenarios, the latter being characterized by a longer τe (Supplementary Figure 1). Clearly, the similarity of results obtained for the IVD1, IVD2, and REF scenarios depends on the prescribed marsh elevations (Figure 1A), and above all on the fact that such elevations remain constant during the entire simulation. Since vegetation is not allowed to eco-engineer marsh topography through, e.g., organic matter deposition and sediment particle capture (D’Alpaos et al., 2007; Marani et al., 2013; Brückner et al., 2019), thereby ameliorating specific local habitat quality, the system is ineluctably destined to reach similar dynamic equilibrium conditions under fixed vegetation habitat quality functions, regardless of the prescribed initial vegetation distribution.
In contrast, changes in the parameters characterizing specific habitat quality functions have non-negligible effects. Progressively larger values of the logistic sigmoid point (HQF1 to HQF4 simulations, Figure 4) enhance species mortality within the observed marsh elevation range, in this way shortening the time τe required to reach dynamic equilibrium conditions from about 35 years for HQF1 to less than 20 years in the HQF5 scenario (Figures 4A–E). Moreover, larger promote the expansion of Species 1 - which occupies more than 80% of the marsh surface at the end of the HQF5 run compared to 65% and 40% in the REF and HQF1 scenarios, respectively – as well as of bare soil, which accounts for about 8% of the marsh area in the HQF5 simulation while being virtually absent in the HQF1, HQF2, and REF scenarios (Figures 4F–I, L). Not only do Species 1 and bare soil become more widespread for larger , but also the average as well as the maximum size of the continuous patches they occupy increase, pointing to a more pronounced zonation for these two vegetation classes (Figures 4P–T). Expansion of Species 1 and bare soil occurs at the expenses of Species 2, 3, and 4, for which both the percent area cover (Figures 4F–I, L) and the average size of continuous patch areas (Figures 4P–T) decrease as increases. Finally, increasing values of produce a progressively more marked differentiation of the realized vegetation distributions, which nonetheless still display realistic hump-shaped patterns, much as the vegetation α-diversity (Figures 4K–O).
Variations in the logistic rate ki (HQF5 to HQF8 simulations series, Figure 5) significantly affect habitat quality functions and, as a consequence, both specific competitive ability δi fi(zj) and mortality rates µi (Figures 5A–E). However, the most marked changes in δi fi(zj) occur at elevations zj which are not commonly found within the studied marsh. Thus, the net effect of changing ki on the simulation results is generally not significant, both in terms of final vegetation distributions (Figures 5K–T) and vegetation evolution through time (Figures 5F–J). The only exception is represented by the HQF5 scenario, in which the low value of k1 reduces the competitive ability of Species 1 at levels lower than any other species across most of the marsh elevation distribution (Figure 5A). This leads to a more widespread presence and a more marked zonation of both Species 2 and 3 (Figures 5A, P) relative to all the other scenarios, including the REF simulation. Although all other simulations seem to suggest otherwise, the HQF5 run clearly demonstrates ki to be a key parameters for the model results. Therefore, rather than pointing to a reduced sensitivity of the model to changes in the logistic rates ki, our analyses suggest that simulation results depend not only on the specific parameters of habitat quality functions, and ratios thereof, but also on the elevation distributions of the computational domain.
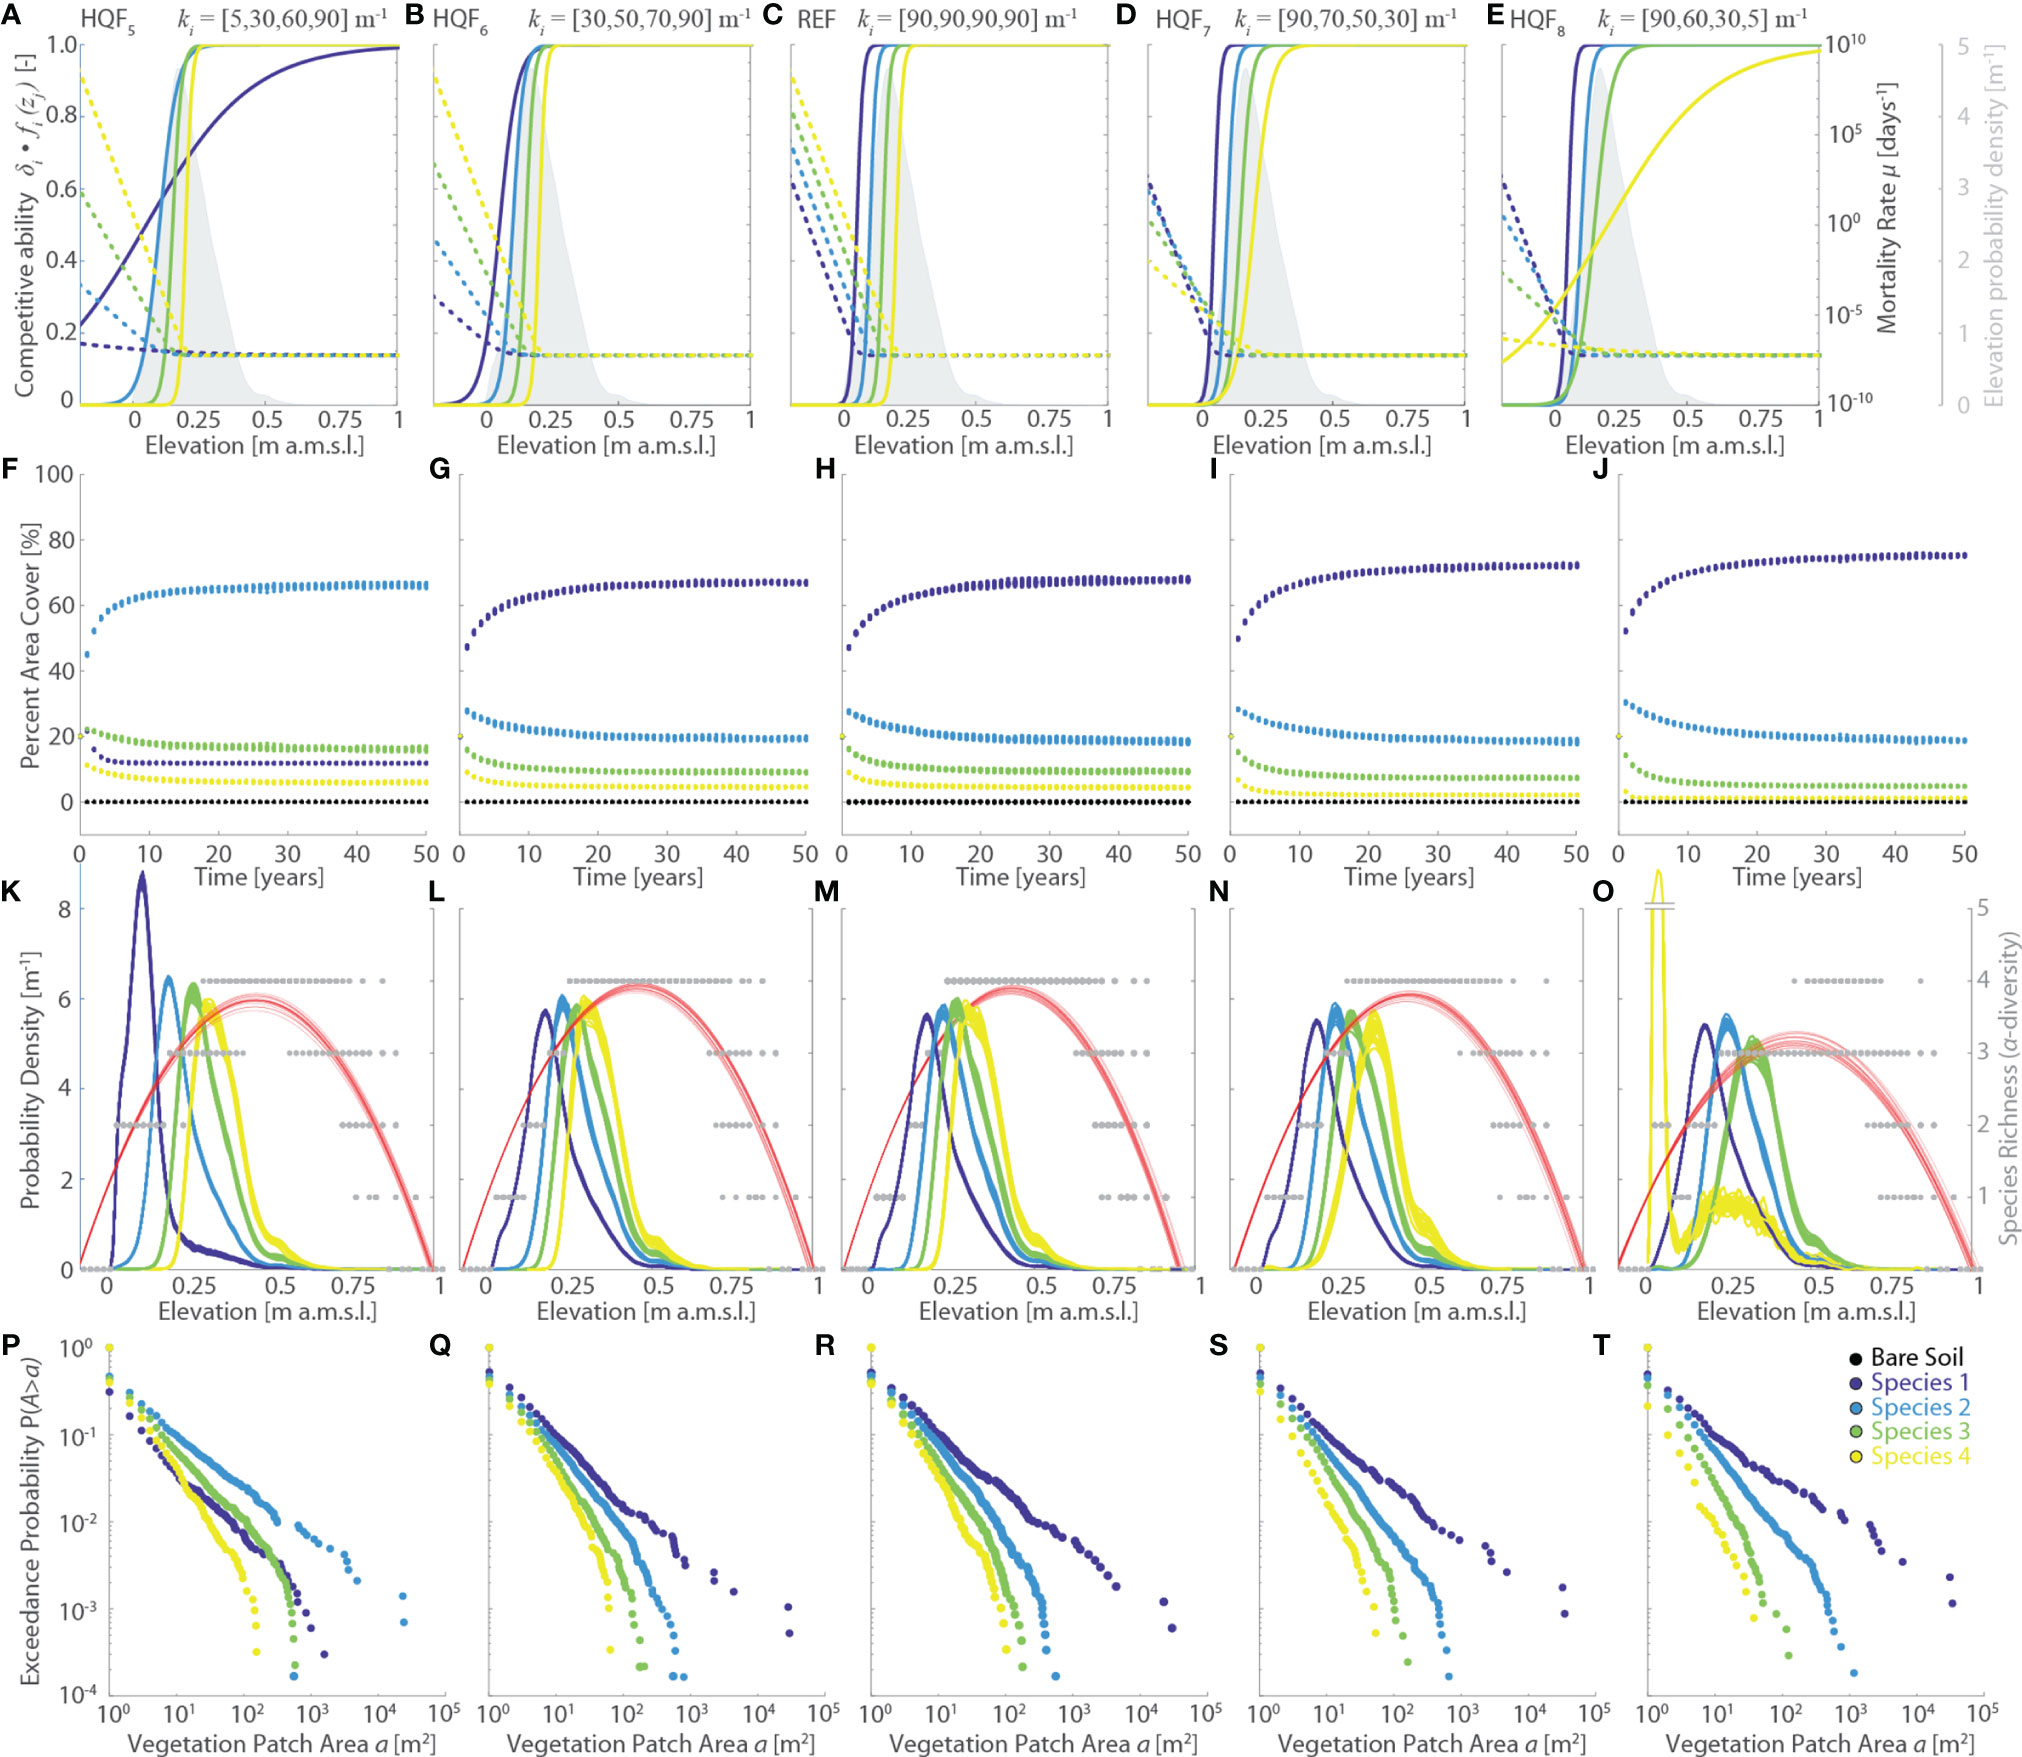
Figure 5 Effects of changes in the vegetation habitat quality functions (HQF series, varying logistic rate ki). Results of the reference simulation (REF, ki={90,90,90,90} m-1) are shown in the central column. The first and second columns report respectively the results of the HQF5 (ki={5,30,60,90} m-1) and HQF6 (ki={30,50,70,90} m-1) simulations, whereas the fourth and fifth columns show the results of the HQF7 (ki = {90,70,50,30} m-1) and HQF8 (ki={90,60,30,5} m-1) simulations, respectively. Each panel displays data derived from all the 20 numerical simulations performed for each scenario. Different colors denote different vegetation species, including bare soil, according to the legend shown in the lower-right panel. (A–E) Patterns of specific competitive ability δi fi(zj) (continuous lines, left y-axis) and mortality rate µi(zj) (dotted lines, right y-axis) as a function of local marsh elevation (zj). The gray area denotes the probability density estimates of marsh elevation within the computational domain. (F–J) Changes of percent vegetation cover over the whole simulation horizon. (K–O) Realized vegetation niches (left y-axis) and local species richness (i.e., α-diversity, right y-axis) as a function of marsh elevation at the end of the simulation horizon. Gray dots represent α-diversity point data with red lines showing the best quadratic fit to point data. (P–T) Empirical probability distributions of spatially-continuous vegetation patch areas are shown based on the exceedance probability for a given vegetation patch size.
The latter argument is further supported by the analyses of the ICA simulation series, in which we investigate the effect of changing interspecific competitive ability δi (Figure 6). By changing the baseline competitive ability of Species 1 (δ1=δMIN) relative to Species 4 (δ4= δMAX=1), and adjusting δi of all other species proportionally to the specific values of based on δMAX-δMIN, we produced significant changes in the specific competitive abilities δfi(zj) for zj values that are widespread across our study site, without altering specific mortality (Figures 6A–E). These modifications have profound effects on the modelled vegetation distributions, as well as on the evolution of vegetation cover through time. In detail, progressively lower values of δMIN, corresponding to progressively larger differences in competitive ability relative to the REF scenario, lead to a progressive reduction in the area covered by Species 1 accompanied by an increase in the marsh areas occupied by all the other species (Figures 6F–I, L). Notably, Species 2 becomes dominant in the ICA3 and ICA4 scenarios despite ranking second-last in terms of maximum competitive ability. This is once again dictated by the distribution of topographic elevations characterizing our study marsh, which leads to Species 2 having the largest competitive ability for all elevations equal or lower than the average marsh elevation (Figures 6D, E). This favors the colonization of large portions of the marsh platform by a more generalist, less competitive species, which is in line with vegetation distributions typically observed in the field (Belluco et al., 2006; Wang et al., 2007; Bang et al., 2018; Yang et al., 2020b) (Figure 1F). Changes in the relative interspecific competitive ability also produce differences in the time τe required to reach dynamic equilibrium. Even though no clear trends emerge from our data, we highlight that τe is consistently shorter (<15 years) than in the REF simulation for all the analyzed ICA scenarios (Figures 6F–I, L). Analysis of patch size distribution suggests that vegetation zonation becomes more pronounced as the relative abundance of a given species increases, with the dominant species in terms of area cover typically displaying larger patches both in terms of average and maximum area size, in accordance with field data (see Figure 1F). Consistently with all the previous simulations, as well as with field data, realized vegetation niches and α-diversity plots exhibit hump-shaped patterns. Finally, we observe that larger differences in interspecific competitive abilities result in more differentiated vegetation realized niches, especially in terms of distribution peak magnitudes (Figures 6K–O).
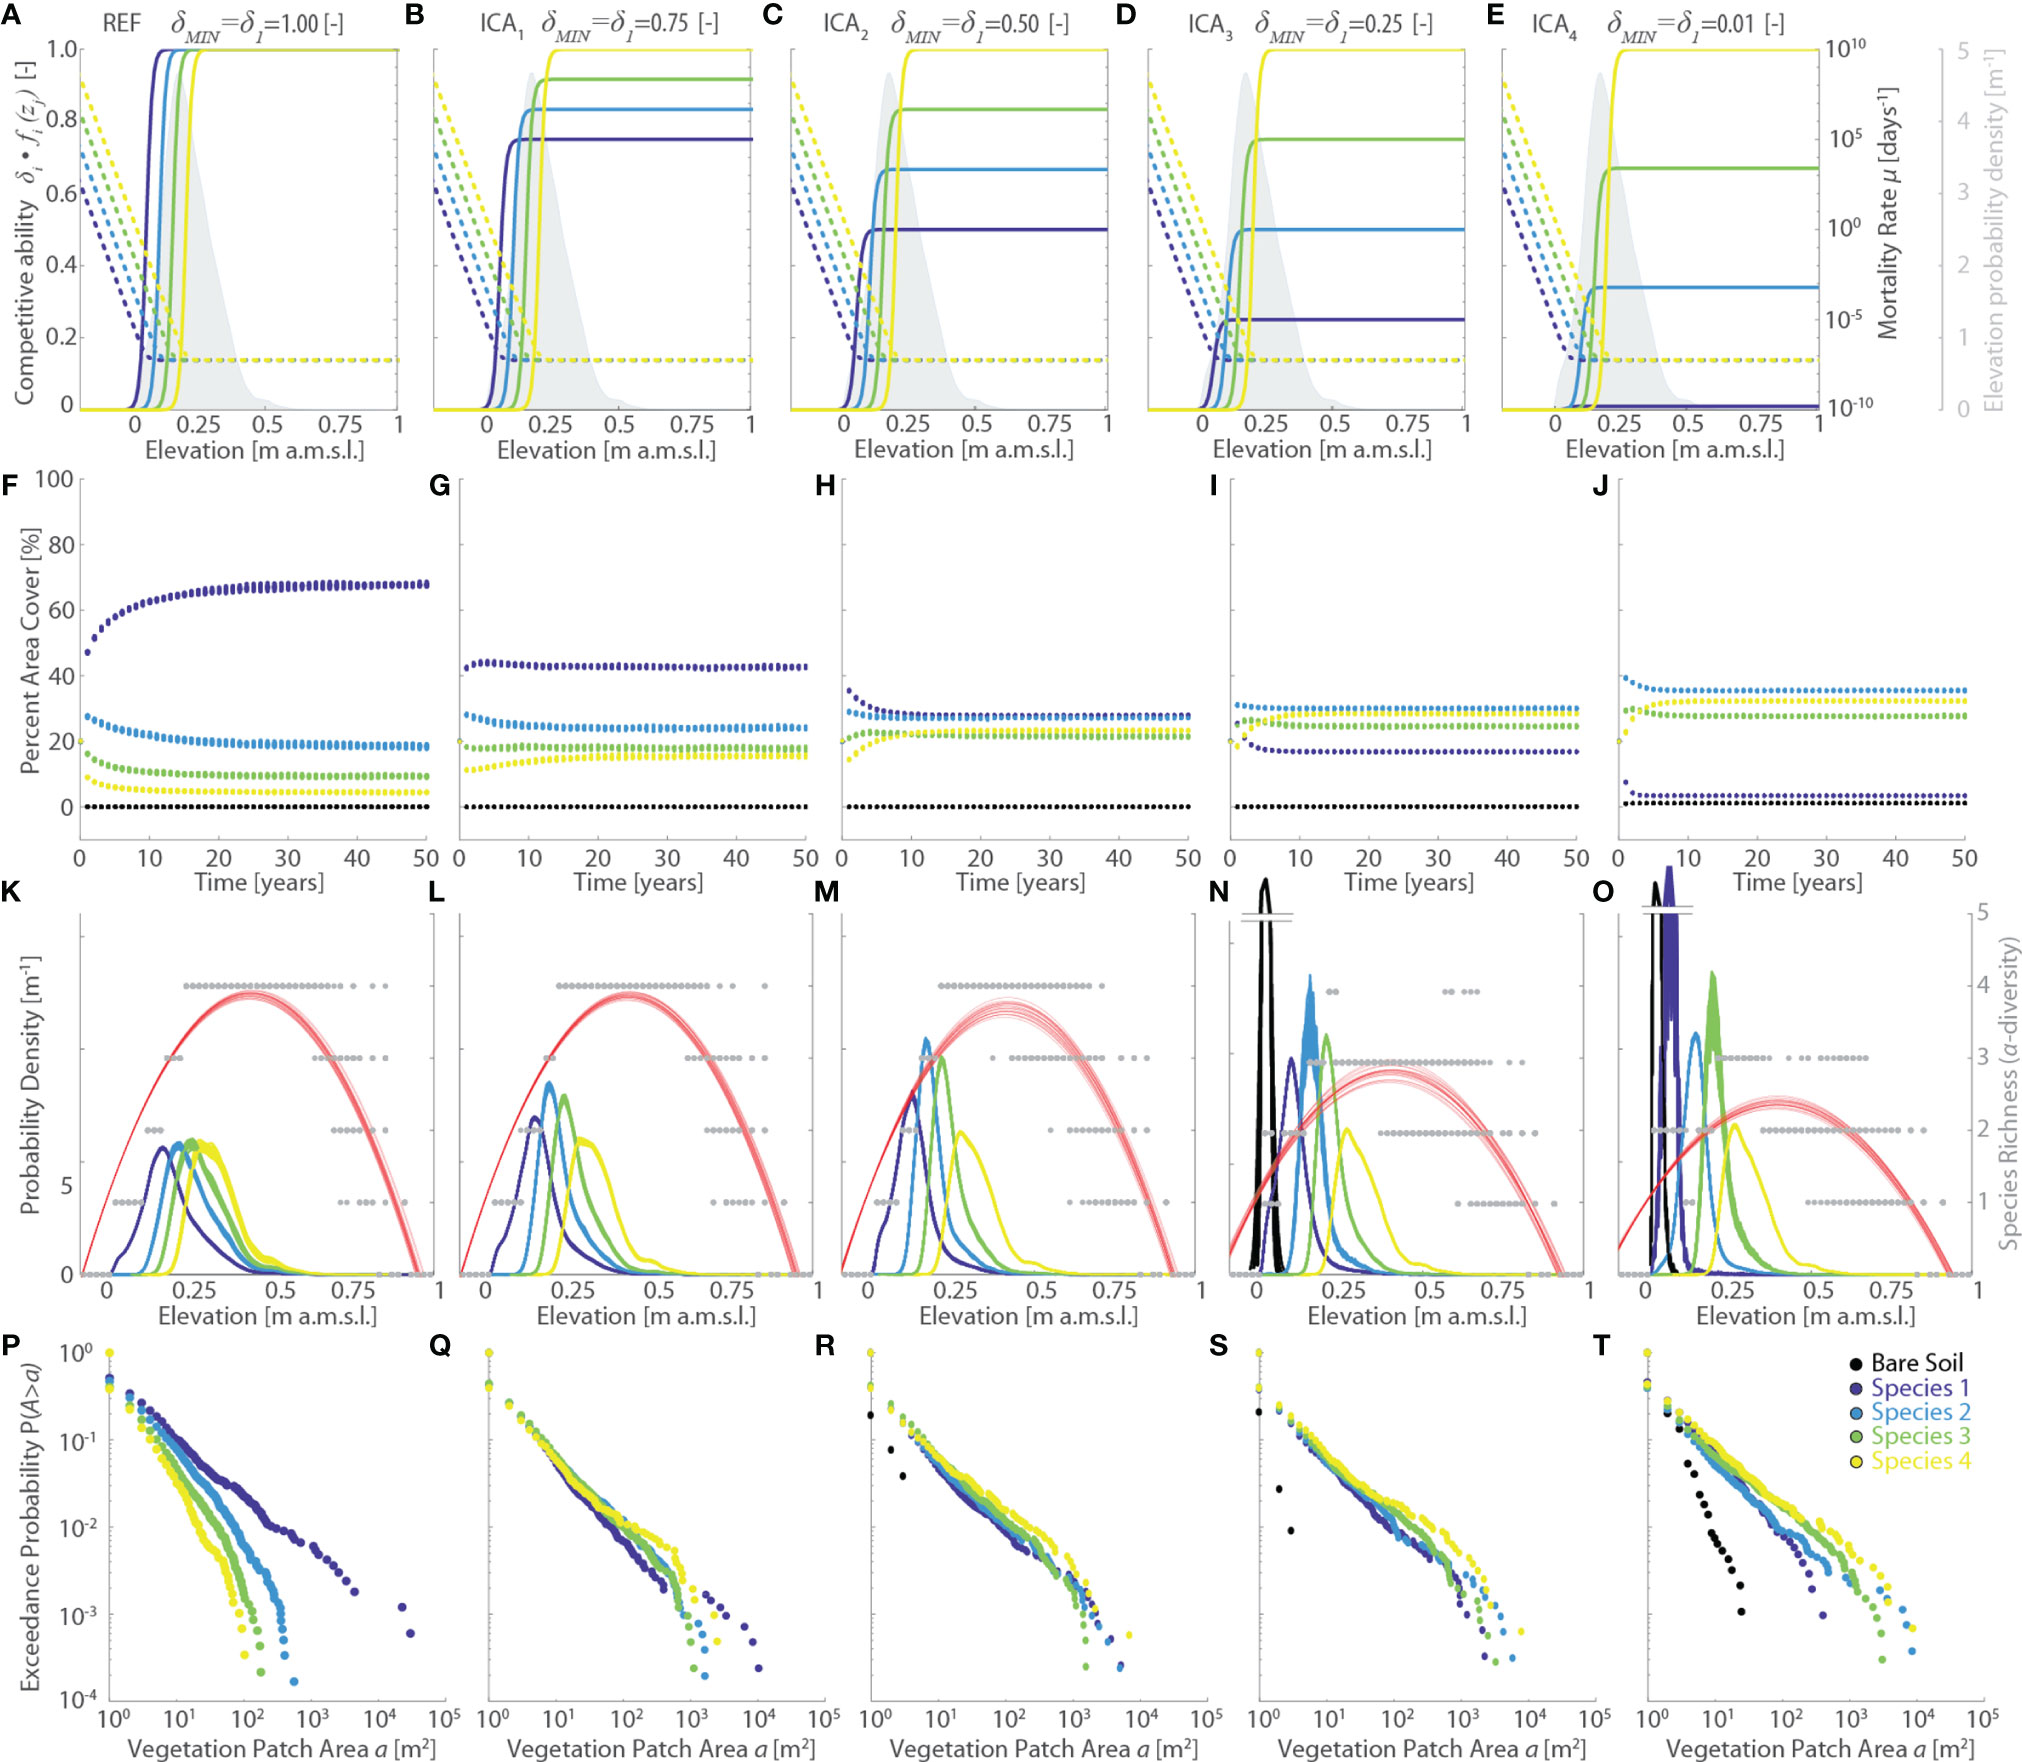
Figure 6 Effects of changes in the vegetation interspecific competitive ability (ICA series, varying δ1=δMIN). Results of the reference simulation (REF, δMIN = 1) are shown in the first column. Columns from second to fourth show results of the ICA1 (δMIN = 0.75), ICA2 (δMIN=0.50), ICA3 (δMIN=0.25), and ICA4 (δMIN=0.01) simulations, respectively. Each panel displays data derived from all the 20 numerical simulations performed for each scenario. Different colors denote different vegetation species, including bare soil, according to the legend shown in the lower-right panel. (A–E) Patterns of specific competitive ability δi fi(zj) (continuous lines, left y-axis) and mortality rate µi(zj) (dotted lines, right y-axis) as a function of local marsh elevation (zj).The gray area denotes the probability density estimates of marsh elevation within the computational domain. (F–J) Changes of percent vegetation cover over the whole simulation horizon. (K–O) Realized vegetation niches (left y-axis) and local species richness (i.e., α-diversity, right y-axis) as a function of marsh elevation at the end of the simulation horizon. Gray dots represent α-diversity point data with red lines showing the best quadratic fit to point data. (P–T) Empirical probability distributions of spatially-continuous vegetation patch areas are shown based on the exceedance probability for a given vegetation patch size.
Changes in vegetation base mortality rate µ0 appear to mostly affect the time required to reach dynamic equilibrium (τe), with smaller µ0 leading to longer τe (Supplementary Figure 2). However, if enough time is allowed for the system to reach equilibrium, no significant differences among distinct simulations are observed in terms of percent vegetation cover, realized vegetation distribution and α-diversity, and characteristic vegetation patch sizes (Suppementary Figure 2). Although our observations suggest µ0 to have reduced effects on the final vegetation distributions, provided that times longer than τe are ensured, we should stress how vegetation mortality represents a key parameter to model the long-term marsh ecomorphodynamic evolution under changing climate forcings, since µ0 dictates the characteristic timescale required by the marsh to respond to external perturbations (e.g., Brückner et al., 2019).
Changes in vegetation fertility rate φ have limited effects on the numerical simulation results (Supplementary Figure 3), the only appreciable difference being the appearance, for fertility rates one or two orders of magnitude lower than in the REF scenario, of patches of bare soil, which are however small in size and cover an extremely small portion of the computational domain (Supplementary Figure 3, VFR1 and VFR2 scenarios). Clearly, this is due to the fact that changes in fertility rate only affect the magnitude of specific colonization rate Cij while leaving the relative (i.e, interspecific) ratios (Ci,j/Ci+1,j) of these rates unaltered. Such a reduced sensitivity of the model to changing φ points to a much stronger control of both marsh-elevation distribution and habitat quality functions in determining patterns of vegetation zonation in mature marshes. Notwithstanding the importance of fertility in determining the initial encroachment of pioneer species in emerging salt marshes, field experiments indeed suggest that the availability of marsh area located at elevations potentially suitable for vegetation establishment and growth is a key driver for marsh ecological dynamics (e.g., Davy et al., 2011; Lõhmus et al., 2020; van Regteren et al., 2020).
Finally, changes in the size of the dispersal kernel, which were investigated by varying the characteristic dispersal length D (DKS series, Figure 7), generally have non-negligible effects on the observed vegetation distributions. Specifically, effects on realized vegetation distributions appear to be significant for values of D one order of magnitude different from the REF scenario (i.e., DKS1 and DKS4 simulations, Figures 7K, O). Increased dispersal abilities (i.e., larger values of D) result in progressively larger portions of the domain being colonized by Species 1, while the area occupied by all the other species decreases (Figures 7F–I, J). Nonetheless, larger D tend to produce a more pronounced clusterization of vegetation within continuous patches (Figures 7P–T), even though both the maximum and average patch size are mediated by the proportion of marsh area occupied by each species. Thus, the characteristic patch size of Species 2,3, and 4 is reduced in the DKS4 scenario as a result of the dominance of Species 1. The latter, which occupies more than 80% of the computational domain (Figure 7J), shows a significant increase in both maximum and average patch size relative to all other simulations (Figure 7T), thus supporting the hypothesis that enhanced dispersal abilities generally lead to more pronounced vegetation clustering.
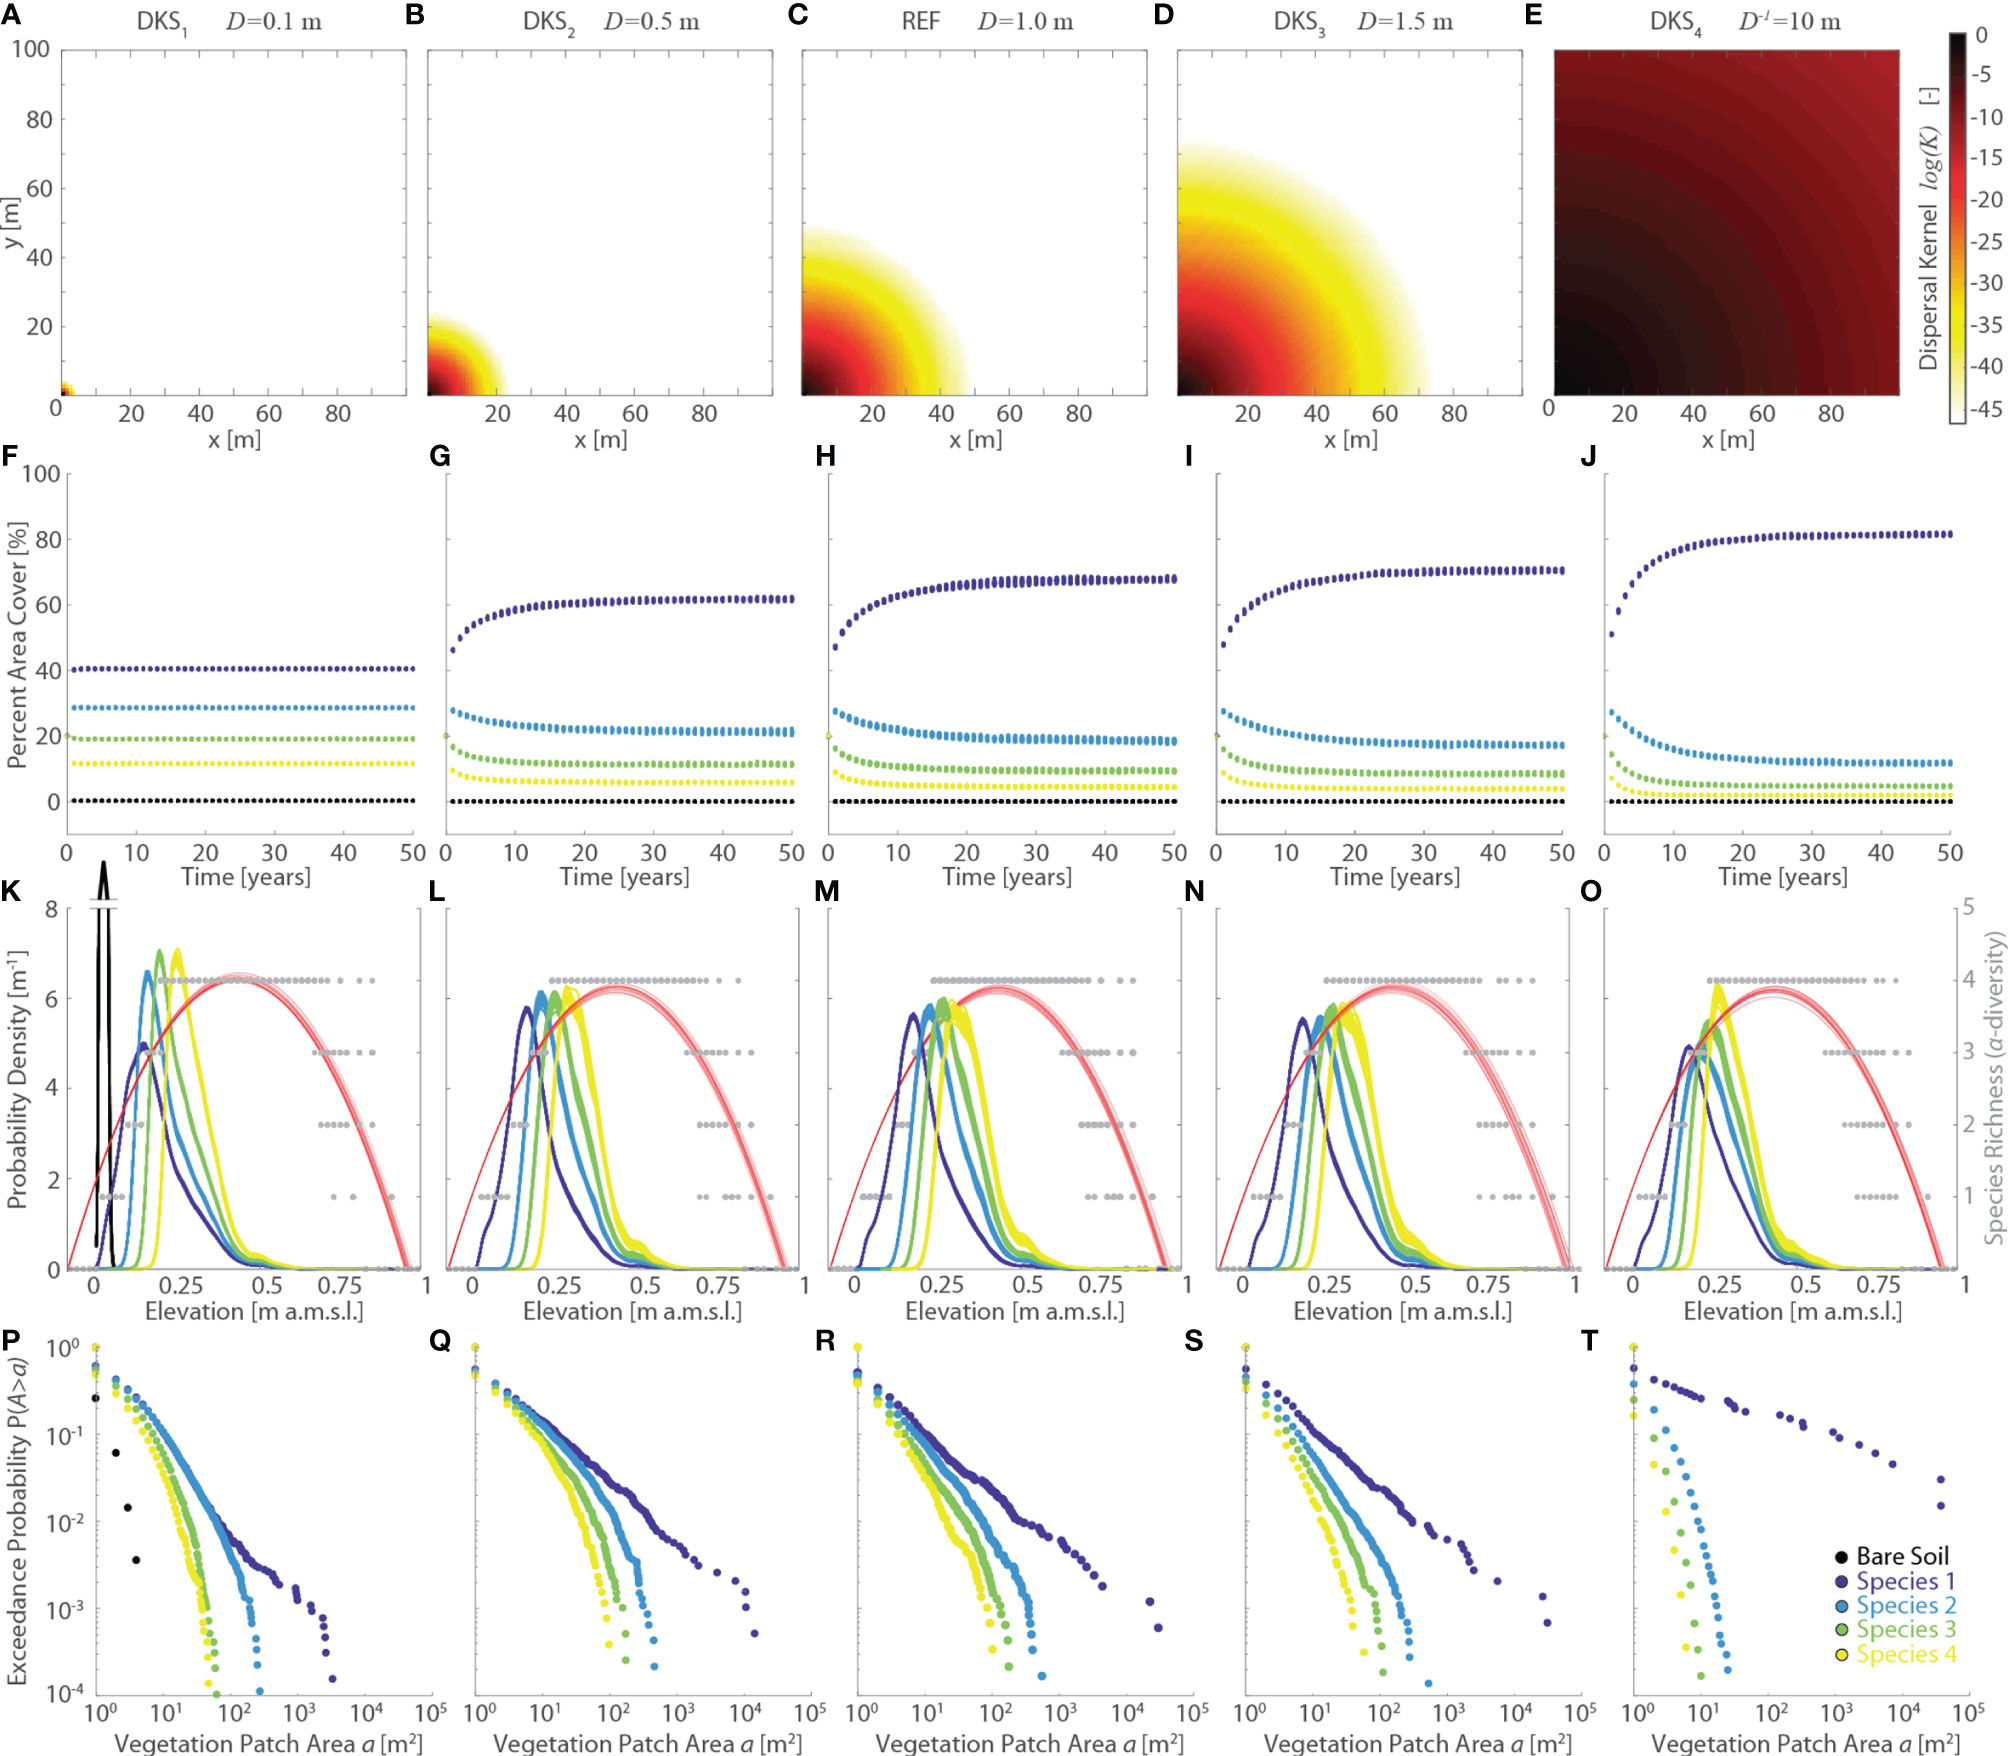
Figure 7 Effects of changes in dispersal kernel size (DKS series, characteristic dispersal length D is assumed to be species-independent). Results of the reference simulation (REF, D = 1 m) are shown in the central column. The first and second columns report respectively the results of the DKS1 (D=0.1 m) and DKS2 (D = 0.5 m) simulations, whereas the fourth and fifth columns show the results of the DKS3 (D = 1.5 m) and DKS4 (D=10 m) simulations, respectively. Each panel displays data derived from all the 20 numerical simulations performed for each scenario. Different colors denote different vegetation species, including bare soil, according to the legend shown in the lower-right panel. (A–E) Representation of the dispersal kernel illustrated in a square, 100m wide, idealized lattice domain. Log-values of the dispersal kernel κ are shown as a function of the euclidean distance d of each pixel from the pixel in the lower-left corner within the idealized lattice. (F–J, M) Changes of percent vegetation cover over the whole simulation horizon. (K–O) Realized vegetation niches (left y-axis) and local species richness (i.e., α-diversity, right y-axis) as a function of marsh elevation at the end of the simulation horizon. Gray dots represent α-diversity point data with red lines showing the best quadratic fit to point data. (P–T) Empirical probability distributions of spatially-continuous vegetation patch areas are shown based on the exceedance probability for a given vegetation patch size.
It is difficult to relate our modelling results to field vegetation dynamics, since knowledge about dispersal abilities of salt-marsh species is limited and dispersal by water especially understudied (Bakker et al., 1985; Wolters et al., 2008; Bullock et al., 2017; Lõhmus et al., 2020). This is mostly because measurements of vegetation dispersal in the field, though much needed, are time-consuming and therefore scarce, despite significant recent advances derived from genetic approaches (see Shao et al., 2021, and references therein). In spite of this, however, care should be given in interpreting numerical results obtained by imposing values of D equal to, or lower than, the resolution of the computational domain. Indeed, numerical errors in the computation of the dispersal kernel become larger as D approaches the pixel size. Our analyses show that for a domain resolution equal to 1 m, numerical errors lower than 1% are obtained for D>1.5 m. Even though errors remain lower than 5% for D>0.9 m, they increase exponentially as D decreases further, reaching values as high as 27% for D =0.5 m (DKS2 scenario).
Results of the sensitivity analysis are summarized in Figure 8, which shows, for each species and for all the investigated scenarios, the average percent cover at the end of numerical simulations plotted against the power-law exponent (β) of the exceedance probability of vegetation patch. The exponent β, computed by performing linear regression on log-transformed data, is used here as a proxy for the characteristic size of continuous vegetation patch, with larger β values denoting more pronounced zonation of vegetation species (see Figure 8).
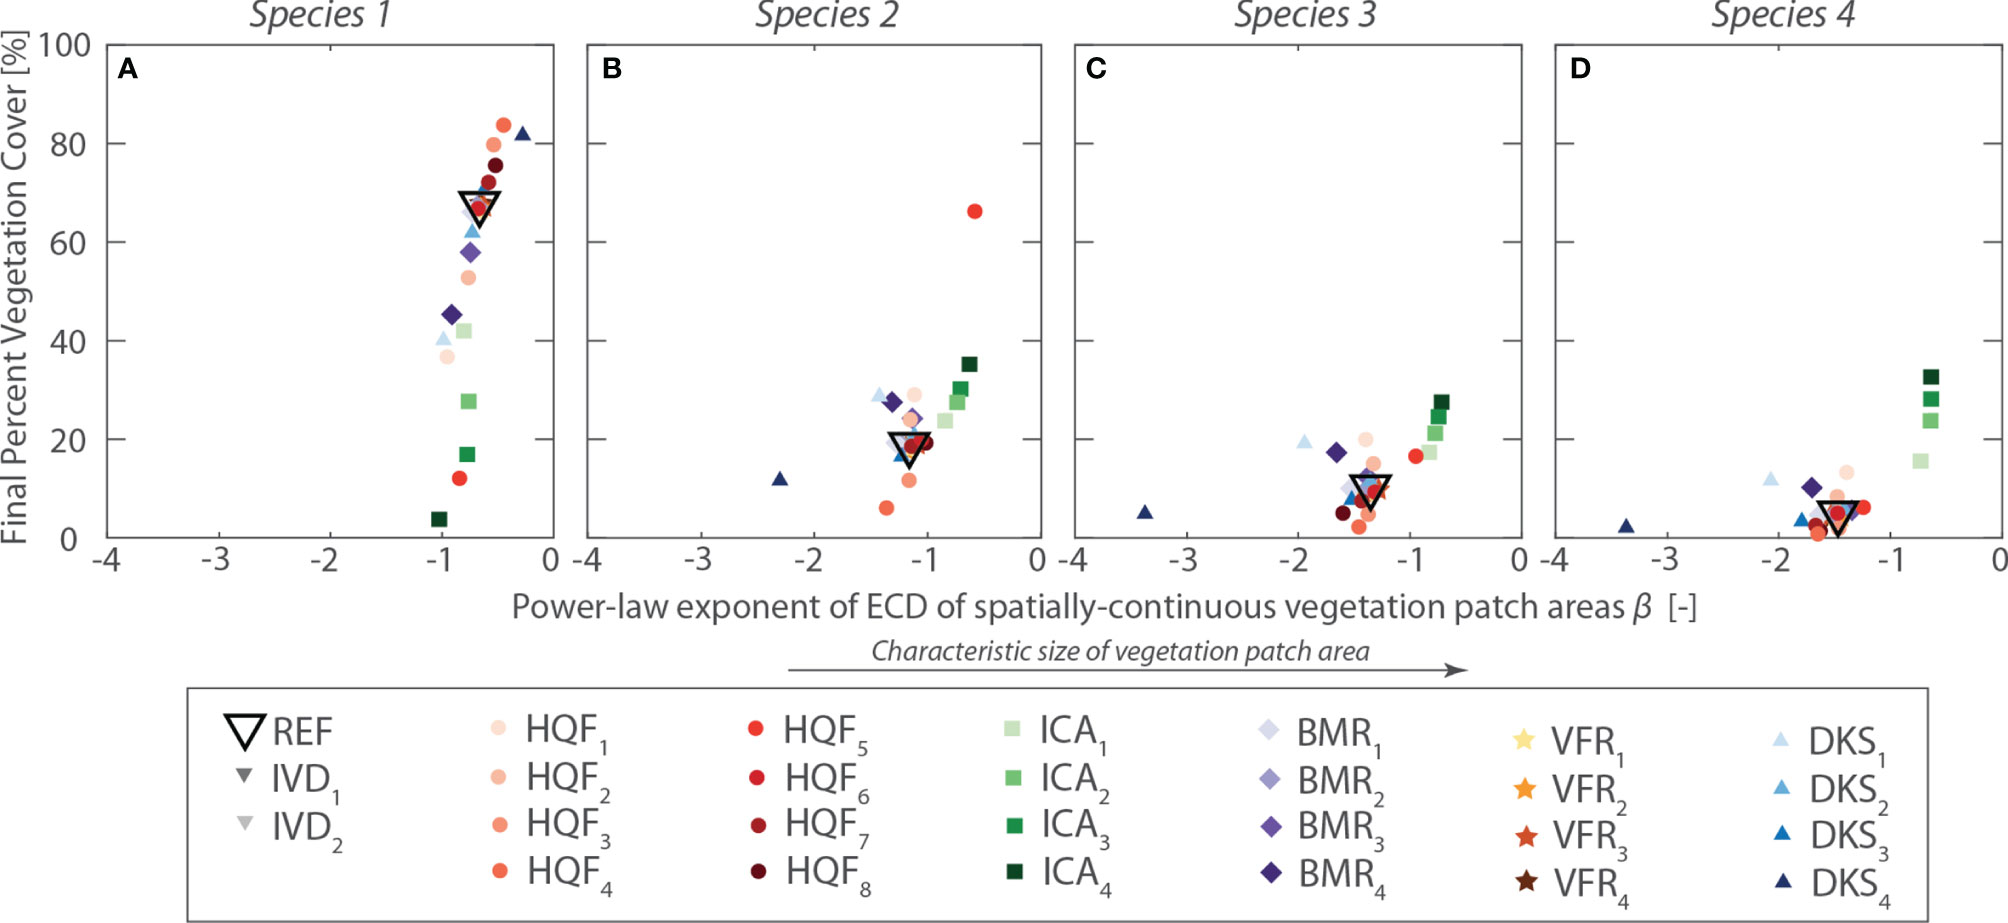
Figure 8 Summary of sensitivity analysis. For each scenario explored in the sensitivity analysis, the average percent cover at the end of the numerical simulation is plotted against the power-law exponent (β) of the exceedance probability of vegetation patch. Panel (A–D) show the results for virtual Species 1 to 4, respectively. Different symbols denote different simulation series, whereas different colors are used to differentiate between different scenarios within each simulation series, as indicated in the lower inset.
Overall, sensitivity analysis demonstrates that model outcomes vary smoothly as parameter values are changed, and that the model can reproduce realistic patterns of vegetation zonation across the marsh topographic gradients. Even a relatively simple model, in which species have elevation-dependent fitness and otherwise neutral traits, suffices in reproducing patterns of zonation qualitatively similar to those typically observed from field data. Since the model assumes theoretical niches described by habitat quality functions monotonically increasing with marsh elevation, our results provide proof of concepts that the upper limit of realized vegetation distributions in tidal marshes is set by spatially explicit mechanisms of interspecific competition and dispersal. Therefore, realized marsh vegetation distributions exhibiting enhanced productivity within a narrow elevation range (e.g., Silvestri and Marani, 2004; Morris et al., 2005) do not necessarily resemble the fundamental niches of individual marsh halophytes. This notion has important implications for the interpretation of observed vegetation patterns, as well as of vegetation-environmental stress relations.
Although realistic vegetation distributions are obtained for a wide range of model parameters, results are especially sensitive to changes in the parameters describing habitat quality and competitive abilities of individual species (HQF and ICA series, Figure 8), as well as the characteristic length of species dispersal (DKS series, Figure 8). In particular, larger differences in competitive abilities among species and larger dispersal lengths promote more pronounced vegetation zonation, with direct implications for relative species abundance. In contrast, changes in vegetation baseline mortality (BMR series) and fertility rate (VFR series) appear to only affect the speed at which vegetation reaches dynamic equilibrium conditions, with limited influence on the final vegetation distribution (Figure 8). These findings suggest that the proposed model can indeed be used to infer the underlying theoretical niches, based on the observed realized patterns.
3.2 Transplant Experiment
While sensitivity analysis demonstrates model ability to reproduce realistic vegetation distributions at equilibrium, results of transplant experiments clarify whether the model can predict vegetation dynamics in agreement with field observations.
Transplantation of Species 4 to lower marsh elevations proves unsuccessful regardless of whether interspecific competition is limited (TE1SOIL) or not (TE1COMP) (Figures 9A, B). The transplanted species dies almost instantaneously, and vegetation cover within the transplant plot returns to the pre-transplant condition, i.e. dominated by Species 1 and 2. Interestingly though, suppression of competition by manual removal of neighboring vegetation around the transplant plot (TE1SOIL scenario, Figure 9B) reduces the speed at which vegetation recovers to pre-transplant conditions compared to the scenario in which competition is not limited (TE1COMP, Figure 9A). This is dictated by the reduced colonization pressure exerted by neighbor vegetation when competition is limited, thus making vegetation dynamics within the transplant plot less dependent on vegetation distribution in neighboring sites. Our results agree qualitatively with the outcomes of field experiments, in which high-marsh species exhibit stunted growth and rapid mortality when transplanted to lower tidal elevations, irrespective of the fact that biotic competition is allowed or not (Bertness and Ellison, 1987; Bertness, 1991a; Bertness, 1991b). However, similar results can be obtained using the stochastic model (TE3COMP and TE3SOIL scenarios, Figures 9E, F), with the only difference that the results are not influenced in any way by limitations of competing neighbors. This is because interspecific competition is not treated in a spatially explicit way, as it only occurs as a function of the local marsh elevation. Therefore, in the stochastic model, vegetation distribution outside of the transplant plot does not influence the vegetation distribution inside of it.
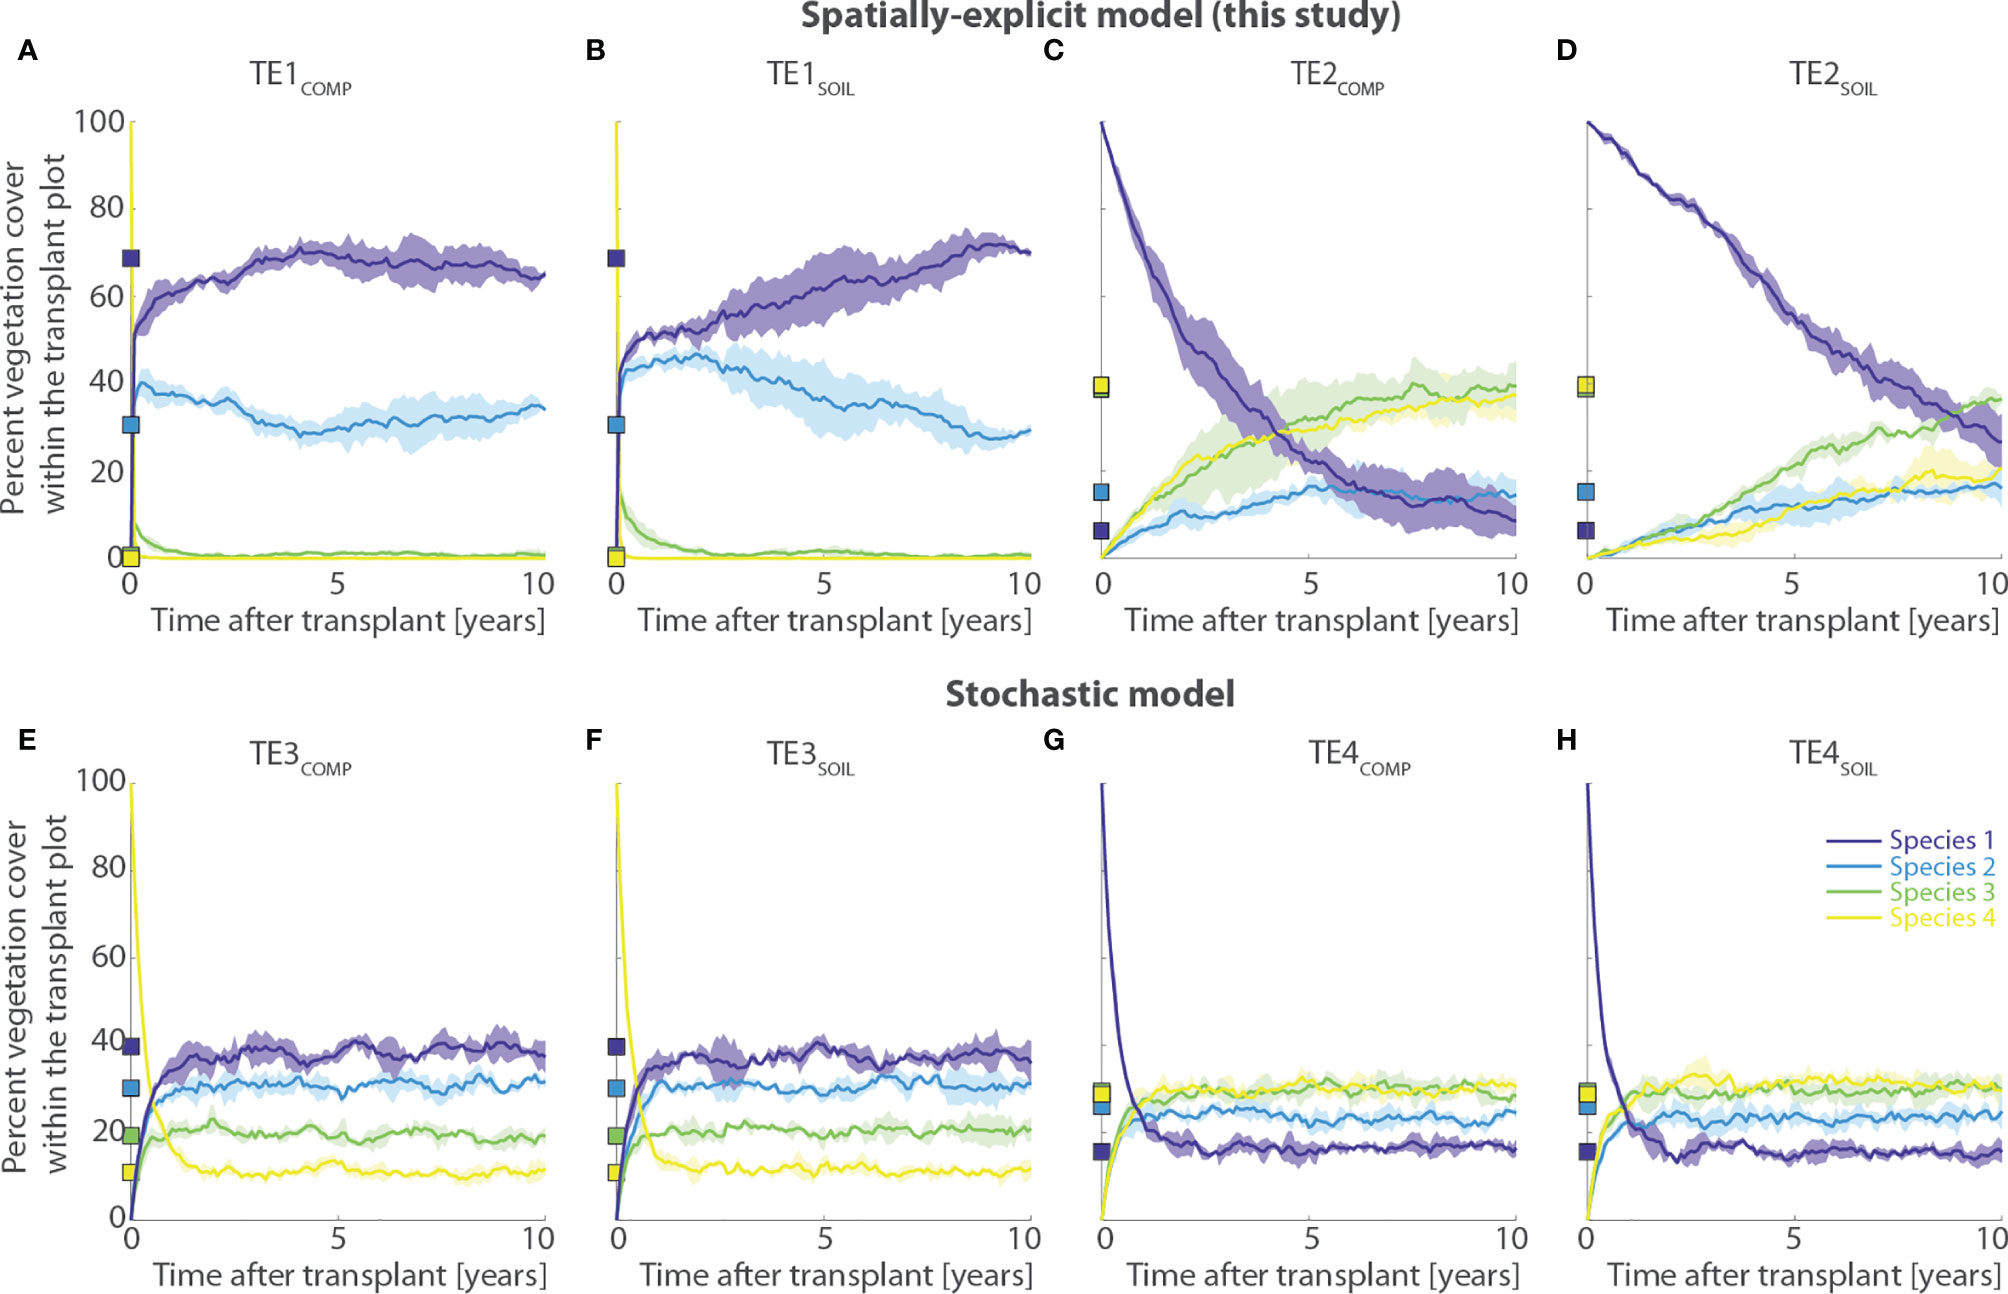
Figure 9 Results of transplant experiments of marsh halophytes outside their realized ecological niches (TE simulation series). Each panel shows changes in percent vegetation cover through time within a 20-by-20 m transplant plot. The first row displays results obtained using the numerical model proposed in the present study, whereas the second row reports results derived from a stochastic model that does not account for spatially- and density-dependent mechanisms of species competition and dispersal (see Section 2.2.2). Names of numerical simulations are reported above each panel. The subscript “COMP” denote simulations in which biotic competition from neighbor sites was allowed within the transplant plot, whereas the subscript “SOIL” indicates simulations in which competition was artificially impeded by systematically removing vegetation within a 5-meter-wide buffer layer around the transplant plot. (A, B) Transplant of Species 4 from upper to lower marsh portions using the spatially-explicit model; (C, D) Transplant of Species 1 from lower to upper marsh portions using the spatially-explicit model; (E, F) Transplant of Species 4 from upper to lower marsh portions using the stochastic model; (G, H) Transplant of Species 1 from lower to upper marsh portions using the stochastic model. Each simulation was repeated 20 times to filter out oscillations due to demographic stochasticity. Continuous lines represent average values of aggregated simulation results, with shaded areas denoting standard deviations. Squares on the y-axis show the percent vegetation cover prior to the transplant. Different colors denote different vegetation species according to the legend shown in panel (H). Percent cover of bare soil is deliberately not reported as it never accounted for more than 1% of the total transplant plot area.
If, on the one hand, these results suggest that our model does not necessarily perform better than previous, and perhaps less sophisticated, numerical frameworks in this case, on the other hand, the results obtained by transplanting Species 1 to upper marsh sites demonstrate otherwise. Being characterized by high habitat quality at high marsh elevations, Species 1 thrives on short timescales within the transplant plot, although in the long term the pre-transplant dynamic equilibrium is eventually reestablished over timescales that clearly depend on the level of interspecific competition, as well as on vegetation mortality and fertility. Specifically, when competition around the transplant plot is allowed, Species 1 is quickly outcompeted by Species 3 and 4, which are characterized by better competitive ability at higher marsh elevations (TE2COMP, Figure 9C). Although it takes nearly 8 years to return to values of percent vegetation cover similar to the pre-experiment conditions, Species 1 undergoes a relatively fast decay, as it ceases to be the dominant species within the transplant plot in less than 4 years (Figure 9C). Conversely, if competition is artificially limited (TE2SOIL, Figure 9D), performances decrease much more slowly, and Species 1 dominates the transplant plot 9 years after the transplant (Figure 9D). After that, Species 3 becomes dominant, but Species 1 still occupies about 25% of the plot area compared to less than 5% in the pre-transplant conditions. These results, which are in qualitative agreement with ecological manipulation field experiments, are not matched by the stochastic model (Figures 9G, H). In the latter, for the TE4SOIL and TE4COMP scenarios, the performances of Species 1 decrease rapidly and percent vegetation cover returns to the pre-transplant conditions in less than 2 years, regardless of whether competition from neighbor species is removed or not (Figures 9G, H).
One should appreciate that the observed slow, yet steady decline in Species 1 coverage in the TE2SOIL scenario does not contrast with experimental results suggesting that performances of low-marsh species do not decline significantly through time (e.g., Bertness and Ellison, 1987; Bertness, 1991a; Bertness, 1991b). Indeed, the duration of most field experiments does not exceed 2 years, and the rate of performance decay can vary according to both the elevation distribution within the transplant plot and, more importantly, the values of model parameters adopted in the simulations. The latter should be calibrated based on field data obtained for specific study cases of interest, which is beyond the scope of the present work.
Ultimately, replication of vegetation transplant experiments demonstrates that spatially explicit treatments of biotic interactions make our model comparatively better suited than traditional stochastic models to reproduce spatial dynamics of halophytes in tidal marshes.
4 Model Limitations and Future Developments
Limitations in the proposed modelling framework need to be recalled.
First, most of the underlying assumptions are derived from the study of perennial halophytes in mature salt marshes. Hence, care should be given when utilizing this model for the study of initial plant establishment in juvenile marsh communities (Hu et al., 2015; Balke et al., 2017; Lõhmus et al., 2020). If, on the one hand, our model synthetizes mechanisms of species dispersal, which are recognized as the main drivers for vegetation evolution in well-developed marsh ecotones (Bertness and Ellison, 1987; Ellison, 1987; Chang et al., 2007; Lõhmus et al., 2020), on the other hand, it does not necessarily properly reproduce the initial establishment of pioneer annual halophytes. This is because the process of initial vegetation encroachment on a bare tidal flat depends on a number of factors, including specific seedling strategies, windows of opportunity for rooting, presence of microbenthic species that stabilize soil and facilitate vegetation establishment, and many physical environmental stresses such as waves, rainfalls, and tidal currents that critically mediate habitat quality, especially when vegetation is sparse (Craft, 2000; Temmerman et al., 2007; Friess et al., 2012; Hu et al., 2015; Brückner et al., 2019; van Regteren et al., 2020). Thus, the relative importance of dispersal vs. establishment mechanisms in emerging marshes needs additional effort to be properly described in the model. This shortcoming is also in part due to the lack of field data that would allow one to disentangle dispersal and establishment functions (e.g., Lõhmus et al., 2020). The collection of field data is however challenging due to the many factors involved. Besides, measuring dispersal is notoriously difficult and resource-consuming (Bullock et al., 2006).
Second, our model assumes physical stresses to be inversely proportional to the local marsh elevation. In marshes that are irregularly flooded, however, this paradigm may not apply because there may not be a consistent gradient in physical stresses across the marsh (Costa et al., 2003; Pennings et al., 2005). While the general mechanisms producing zonation patterns of vegetation in coastal salt marshes may be universal (Grime, 1977; Grace and Wetzel, 1981; Keddy, 1989; Pennings and Bertness, 2001), the importance of particular physical stresses is likely to vary geographically (Pennings et al., 2005). Particularly, salinity stress probably plays a much more important role in mediating plant zonation patterns at lower latitudes, as testified by the presence, in low-latitude marshes, of unvegetated salt pans that occur where soil salinities exceed levels that plants can tolerate (Pennings and Bertness, 1999; Pennings and Bertness, 2001; Pennings and He, 2021). In contrast, unvegetated areas in mid- and high-latitude marshes typically result from disturbance or waterlogging, rather than from high salinities (Pennings and Bertness, 2001; Mariotti et al., 2020). (Pennings and Bertness, 2001). Hence, ecological interactions are likely to vary with latitude due to different temperatures and evapotranspiration dynamics, and specific habitat quality functions need to be adapted accordingly. Therefore, fundamental vegetation niches are site-specific and need to be calibrated as such.
Third, in addition to salinity, many other abiotic and biotic factors can potentially modify habitat quality and should therefore be considered (Pennings and Bertness, 2001; Pennings and He, 2021). Biotic factors are mostly related to the feeding and grazing activities of domestic and wild fauna. Feeding on plant rhizomes by for example geese, sheep, nutria, and wild boar, as well as burrowing by crabs, can heavily disturb the upper layer of marsh soil, limit marsh vertical accretion, and reduce large areas of vegetation to bare mud (Wiegert and Freeman, 1990; Ungar, 1998; Perillo and Iribarne, 2003; Wolters et al., 2005; Xin et al., 2009). Abiotic factors include the burial of vegetation by rafts of floating wrack, fires, ice disturbance in high-latitude marshes, and hydrodynamic stresses due to tidal currents and wind waves. Waves in particular can actively modify sediment transport processes and the morphodynamics of exposed marsh margins (Wang et al., 2017; Evans et al., 2019; Finotello et al., 2020; Tognin et al., 2021). This can create potential hotspots for biodiversity (Elsey-Quirk et al., 2019) and determine changes in vegetation distribution according to the ability of individual species to tolerate such stresses, which in turn depends on the specific vegetation traits (Leonard and Croft, 2006; Van Wesenbeeck et al., 2008; Schoutens et al., 2020; D’Alpaos et al., 2021; Schulte Ostermann et al., 2021). On the one hand, some of the abiotic factors, especially the hydrodynamic ones, could be included rather easily in the model, for example by weighting the habitat quality based on stresses calculated from hydrodynamic models or, alternatively, as a function of the distance of each site from marsh edges exposed to the action of waves and currents (see for example Gourgue et al., 2021a; Kalra et al., 2021). On the other hand, however, most of the biotic factors affecting vegetation dynamics are difficult to conceptualize, as they depend on the community ecology of marsh fauna (Gaskins et al., 2020; Burdick et al., 2021; Pennings and He, 2021).
Another important environmental factor we have not so far considered is the level of nutrients, which is also related to climate changes and anthropogenic pressures on salt marshes (Ratliff et al., 2015; Newton et al., 2020; Hughes et al., 2021). Since salt marshes are nitrogen-poor, yet very productive environments, they are potentially much sensitive to changes in nutrient availability (Valiela and Teal, 1974; Pennings et al., 2002; Muench and Elsey-Quirk, 2019; Carmona et al., 2021; Giblin et al., 2021) In fact, eutrophication may have marked effects on marsh plant community structure by shifting the competitive balance among plants and consequently altering the zonation and species composition of plant communities (Levine et al., 1998). Field experiments demonstrated that there exists a nutrient-dependent competitive hierarchy, with competitive outcomes being typically reversed when nutrients were abundant as better stress tolerators become dominant competitors (Emery et al., 2001). This is because competition for resources occurs primarily belowground under normal marsh conditions, but shifts to aboveground at enhanced high nutrient levels. Clearly, such dynamics cannot be currently predicted by our model of plant competition and dispersal, and should therefore be considered in the future.
Finally, our model does not explicitly account for facilitation mechanisms among plant species wherein neighbors can potentially buffer one another from physical stresses and mutually ameliorate their habitat quality (Bertness, 1991a; Bertness and Shumway, 1993; Castellanos et al., 1994; Bruno et al., 2017). The outcome of competition can be more complex than described in our model when facilitative mechanisms operate, potentially modifying the species’ realized distributions dynamically (Bertness and Ewanchuk, 2002). Conceptualization of these mechanisms would require spatially explicit quantification of physical stresses, the latter being critical in mediating facilitative interactions. Nonetheless, many ecologists have suggested that while facilitation is common in secondary succession under harsh physical conditions, competition dominates vegetation dynamics under benign physical conditions, for which our model can therefore be considered reliable (see Pennings and He, 2021).
Despite the above-mentioned limitations, the model proposed in this study marks a significant step forward in the way salt-marsh ecological dynamics are modelled compared to earlier studies. In particular, spatially explicit treatments of vegetation dynamics can contribute to better understanding the effects of biotic processes that cannot be captured by 0D and 1D models, such as vegetation migration due to geomorphological displacement (Morris et al., 2002; Morris, 2006).
Our model can be coupled with virtually any hydro-morphodynamic model to simulate the intertwined evolution of marsh halophytes and topographic gradients under varying rates of relative sea-level rise and sediment supply. If the models employ different types of grids or spatial resolutions, the coupling can also be performed using subgrid schemes together with appropriate multiscale coupling techniques (e.g., Gourgue et al., 2021a; Gourgue et al., 2021b; Kalra et al., 2021). The evolution of marsh topography at each site will be obtained by a combined geomorphological balance between erosion and sedimentation, computed by the morphodynamic model, and organic production by halophytic vegetation, calculated by the vegetation model. The latter depends on biomass production, which can be expressed proportionally to habitat quality. Vegetation biomass can also influence abiotic morphodynamic processes by increasing the critical shear stress for erosion and promoting the capture of suspended sediments (D’Alpaos et al., 2007). Because biotic processes are typically slower than geomorphological ones, separate integration time scales can be adopted; for example, an hourly scale for geomorphological processes and a monthly or annual scale for ecological interaction processes. The model can be forced through a sequence of tides until it reaches a pseudo-stationary state where sedimentation and erosion and associated mean sea rise balance each other out.
Such an ecomorphodynamic model would improve our ability to model salt-marsh evolution numerically and allow for cost-effective ecological community-level studies, providing useful insights on the ecomorphodynamics of marsh landscapes that are of interest to the whole community of coastal scientists and managers.
5 Conclusions
We presented an innovative numerical model aimed to simulate the dynamics of salt-marsh vegetation. Different from previous models, we accounted for spatially explicit mechanisms of interspecific competition and dispersal and assumed species performances to monotonically increase with marsh elevation in accordance with field observations.
We demonstrated that the model is capable of reproducing patterns of vegetation zonation and ecological dynamics by all means similar to those observed from field data and experiments. Numerical simulations aimed to simulate the transplant of vegetation species outside their optimum (realized) niches showed that our model can successfully reproduce the outcomes of classic field ecological experiments. Since a comparison proved that different models fail in reproducing such dynamics, this result has to be interpreted as a direct consequence of both the unique habitat quality functions and the novel spatial treatments of vegetation competition and dispersal we adopted. Besides, our numerical results support the idea that realized vegetation distributions in which a given species exhibits large productivity within a narrow elevation range do not reflect species fundamental niches. Rather, they arise directly from mechanisms of interspecific competition and dispersal.
Sensitivity analyses suggest that the model is especially sensitive to changes in specific habitat quality functions and competitive ability, even though the relative importance of each model parameter is critically mediated by the distribution of marsh topographic gradients relative to the competitive ability of the considered virtual species assemblage. Therefore, although both the conceptualization and results of our model are consistent with general paradigms about zonation and dynamics of marsh plants, we suggest that the nature of ecological interactions is likely to vary geographically because of variations in the physical environment, and these variations must be taken into account in order to successfully apply our model to study marsh evolution across different geographical scales and vegetation communities.
Our model can be easily coupled with any hydro-morphodynamic model to simulate the intertwined, dynamic evolution of salt marsh vegetation and topography under changing external forcings. Moreover, by using the model in an inverse fashion, one could also infer the underlying theoretical niches based on a comparison between the modelled and observed vegetation distributions.
Data Availability Statement
The Matlab source code of the model presented in this study is freely available at https://doi.org/10.5281/zenodo.6285870, together with the elevation and vegetation data utilized in the simulations.
Author Contributions
AF: designed research, developed model, performed and analyzed simulations, prepared figure, and wrote manuscript. EB: designed research, developed model, revised manuscript. AD’A: designed research, revised manuscript. MM: designed research, revised manuscript. All authors contributed to the article and approved the submitted version.
Funding
Scientific activity performed in the “Venezia2021” Research Programme, coordinated by CO.RI.LA, with the contribution of the Provveditorato for the Public Works of Veneto, Trentino Alto Adige and Friuli Venezia Giulia, Research Line 3.2 [AD’A (PI); EB (PI); and AF], that is gratefully acknowledged.
Conflict of Interest
The authors declare that the research was conducted in the absence of any commercial or financial relationships that could be construed as a potential conflict of interest.
Publisher’s Note
All claims expressed in this article are solely those of the authors and do not necessarily represent those of their affiliated organizations, or those of the publisher, the editors and the reviewers. Any product that may be evaluated in this article, or claim that may be made by its manufacturer, is not guaranteed or endorsed by the publisher.
Acknowledgments
The authors acknowledge constructive comments and suggestions by two reviewers and steering from the Guest Editor, which greatly helped to improve an early version of the manuscript. AF is grateful to Dr. Jim van Belzen for discussions regarding field experiments of marsh vegetation transplant and the related scientific literature, as well as to Dr. Zicheng Yang for providing the Lidar and vegetation data shown in Figure 1.
Supplementary Material
The Supplementary Material for this article can be found online at: https://www.frontiersin.org/articles/10.3389/fmars.2022.866570/full#supplementary-material
References
Bakker J. P., Dijkstra M., Russchen P. T. (1985). Dispersal, Germination and Early Establishment of Halophytes and Glycophytes on a Grazed and Abandoned Salt-Marsh Gradient. New Phytol. 101, 291–308. doi: 10.1111/j.1469-8137.1985.tb02836.x
Balke T., Lõhmus K., Hillebrand H., Zielinski O., Haynert K., Meier D., et al. (2017). Experimental Salt Marsh Islands: A Model System for Novel Metacommunity Experiments. Estuar. Coast. Shelf Sci. 198, 288–298. doi: 10.1016/j.ecss.2017.09.021
Bang J. H., Bae M. J., Lee E. J. (2018). Plant Distribution Along an Elevational Gradient in a Macrotidal Salt Marsh on the West Coast of Korea. Aquat. Bot. 147, 52–60. doi: 10.1016/j.aquabot.2018.03.005
Barbier E. B., Hacker S. D., Kennedy C., Koch E. W., Stier A. C. (2011). And Silliman, B The Value of Estuarine and Coastal Ecosystem Services. R. Ecol. Monogr. 81, 169–93. doi: 10.1890/10-1510.1
Belluco E., Camuffo M., Ferrari S., Modenese L., Silvestri S., Marani A., et al. (2006). Mapping Salt-Marsh Vegetation by Multispectral and Hyperspectral Remote Sensing. Remote Sens. Environ. 105, 54–67. doi: 10.1016/j.rse.2006.06.006
Bertassello L. E., Bertuzzo E., Botter G., Jawitz J. W., Aubeneau A. F., Hoverman J. T., et al. (2021). Dynamic Spatio-Temporal Patterns of Metapopulation Occupancy in Patchy Habitats. R. Soc Open Sci. 8, 201309. doi: 10.1098/rsos.201309
Bertness M. D. (1991a). Interspecific Interactions Among High Marsh Perennials in a New England Salt Marsh. Ecology 72, 125–137. doi: 10.2307/1938908
Bertness M. D. (1991b). Zonation of Spartina Patens and Spartina Alterniflora in New England Salt Marsh Author (s): Mark D. Bertness Published by: Wiley on Behalf of the Ecological Society of America Stable URL: Https://Www.Jstor.Org/Stable/1938909 REFERENCES Linked Referen. Ecol. Soc 72, 138–148. doi: 10.2307/1938909
Bertness M. D., Ellison A. M. (1987). Determinants of Pattern in a New England Salt Marsh Plant Community. Ecol. Monogr. 57, 129–147. doi: 10.2307/1942621
Bertness M. D., Ewanchuk P. J. (2002). Latitudinal and Climate-Driven Variation in the Strength and Nature of Biological Interactions in New England Salt Marshes. Oecologia 132, 392–401. doi: 10.1007/s00442-002-0972-y
Bertness M. D., Shumway S. W. (1993). Competition and Facilitation in Marsh Plants. Am. Nat. 142, 718–724. doi: 10.1086/285567
Best Ü.S.N., Wegen M., Van Der, Dijkstra J., Willemsen P. W. J. M., Borsje B. W. (2018). Do Salt Marshes Survive Sea Level Rise? Modelling Wave Action, Morphodynamics and Vegetation Dynamics. Environ. Model. Software 109, 152–166. doi: 10.1016/j.envsoft.2018.08.004
Boaga J., D’Alpaos A., Cassiani G., Marani M., Putti M. (2014). Plant-Soil Interactions in Salt Marsh Environments: Experimental Evidence From Electrical Resistivity Tomography in the Venice Lagoon. Geophys. Res. Lett. 41, 6160–6166. doi: 10.1002/2014GL060983
Bouma T. J., Friedrichs M., Van Wesenbeeck B. K., Temmerman S., Graf G., Herman P. M. J. (2009). Density-Dependent Linkage of Scale-Dependent Feedbacks: A Flume Study on the Intertidal Macrophyte Spartina Anglica. Oikos 118, 260–268. doi: 10.1111/j.1600-0706.2008.16892.x
Boyd B. M., Sommerfield C. K., Elsey-Quirk T. (2017). Hydrogeomorphic Influences on Salt Marsh Sediment Accumulation and Accretion in Two Estuaries of the U.S. Mid-Atlantic Coast. Mar. Geol. 383, 132–145. doi: 10.1016/j.margeo.2016.11.008
Broome S. W., Seneca E. D., Woodhouse W. W. (1988). Tidal Salt Marsh Restoration. Aquat. Bot 32, 1–22. doi: 10.1016/0304-3770(88)90085-X
Brückner M. Z. M., Schwarz C., van Dijk W. M., van Oorschot M., Douma H., Kleinhans M. G. (2019). Salt Marsh Establishment and Eco-Engineering Effects in Dynamic Estuaries Determined by Species Growth and Mortality. J. Geophys. Res. Earth Surf. 124, 2962–2986. doi: 10.1029/2019JF005092
Bruno J. F. (2000). Facilitation of Cobble Beach Plant Communities Through Habitat Modification By Spartina Alterniflora. Ecology 81, 1179–1192. doi: 10.1890/0012-9658(2000)081[1179:focbpc]2.0.co;2
Bruno J. F., Kennedy C. W. (2000). Patch-Size Dependent Habitat Modification and Facilitation on New England Cobble Beaches by Spartina Alterniflora. Oecologia 122, 98–108. doi: 10.1007/PL00008841
Bruno J. F., Rand T. A., Emery N. C., Bertness M. D. (2017). Facilitative and Competitive Interaction Components Among New England Salt Marsh Plants. PeerJ 2017, 1–15. doi: 10.7717/peerj.4049
Bullock J. M., Mallada González L., Tamme R., Götzenberger L., White S. M., Pärtel M., et al. (2017). A Synthesis of Empirical Plant Dispersal Kernels. J. Ecol. 105, 6–19. doi: 10.1111/1365-2745.12666
Bullock J. M., Shea K., Skarpaas O. (2006). Measuring Plant Dispersal: An Introduction to Field Methods and Experimental Design. Plant Ecol. 186, 217–234. doi: 10.1007/s11258-006-9124-5
Burdick D. M., Moore G. E., Boyer K. E. (2021). “Impacts of Exotic and Native Species Invading Tidal Marshes,” in Salt Marshes: Function, Dynamics, and Stresses. Eds. FitzGerald D. M., Hughes Z. J. (Cambridge: Cambridge University Press), 367–387. doi: 10.1017/9781316888933.017
Carmona R., Muñoz R., Niell F. X. (2021). Differential Nutrient Uptake by Saltmarsh Plants Is Modified by Increasing Salinity. Front. Plant Sci. 12. doi: 10.3389/fpls.2021.709453
Castellanos E. M., Figueroa M. E., Davy A. J. (1994). Nucleation and Facilitation in Saltmarsh Succession: Interactions Between Spartina Maritima and Arthrocnemum Perenne Author 82, 239–248. doi: 10.2307/2261292
Chang A. E. R., Veeneklaas R. M., Bakker J. P. (2007). Seed Dynamics Linked to Variability in Movement of Tidal Water Stable. J. Veg. Sci. 18, 253–262. doi: 10.1111/j.1654-1103.2007.tb02536.x
Chmura G. L., Anisfeld S. C., Cahoon D. R., Lynch J. C. (2003). Global Carbon Sequestration in Tidal, Saline Wetland Soils. Global Biogeochem. Cycles. 17, 21–22. doi: 10.1029/2002gb001917
Costa C. S. B., Marangoni J. C., Azevedo A. M. G. (2003). Plant Zonation in Irregularly Flooded Salt Marshes: Relative Importance of Stress Tolerance and Biological Interactions. J. Ecol. 91, 951–965. doi: 10.1046/j.1365-2745.2003.00821.x
Costanza R., d’Arge R., de Groot R., Farber S. C., Grasso M., Hannon B., et al. (1997). The Value of the World’s Ecosystem Services and Natural Capital. Nature 387, 253–260. doi: 10.1038/387253a0
Craft C. (2000). Co-Development of Wetland Soils and Benthic Invertebrate Communities Following Salt Marsh Creation. Wetl. Ecol. Manage. 8, 197–207. doi: 10.1023/A:1008448620605
Crain C. M., Bertness M. D. (2006). Ecosystem Engineering Across Environmental Gradients: Implications for Conservation and Management. Bioscience 56, 211–218. doi: 10.1641/0006-3568(2006)056[0211:EEAEGI]2.0.CO;2
Da Lio C., D’Alpaos A., Marani M. (2013). The Secret Gardener: Vegetation and the Emergence of Biogeomorphic Patterns in Tidal Environments. Philos. Trans. A. Math. Phys. Eng. Sci. 371, 20120367. doi: 10.1098/rsta.2012.0367
D’Alpaos A. (2011). The Mutual Influence of Biotic and Abiotic Components on the Long-Term Ecomorphodynamic Evolution of Salt-Marsh Ecosystems. Geomorphology 126, 269–278. doi: 10.1016/j.geomorph.2010.04.027
D’Alpaos A., Da Lio C., Marani M. (2012). Biogeomorphology of Tidal Landforms: Physical and Biological Processes Shaping the Tidal Landscape. Ecohydrology. 5, 550–562. doi: 10.1002/eco.279
D’Alpaos C., D’Alpaos A. (2021). The Valuation of Ecosystem Services in the Venice Lagoon: A Multicriteria Approach. Sustainability 13 (17), 9485. doi: 10.3390/su13179485
D’Alpaos A., Finotello A., Goodwin G. C. H., Mudd S. M. (2021). “Salt Marsh Hydrodynamics,” in Salt Marshes: Function, Dynamics, and Stresses. Eds. FitzGerald D., Hughes Z. (Cambridge: Cambridge University Press), 53–81. doi: 10.1017/9781316888933.005
D’Alpaos A., Lanzoni S., Marani M., Rinaldo A. (2007). Landscape Evolution in Tidal Embayments: Modeling the Interplay of Erosion, Sedimentation, and Vegetation Dynamics. J. Geophys. Res. Earth Surf. 112, 1–17. doi: 10.1029/2006JF000537
D’Alpaos A., Marani M. (2016). Reading the Signatures of Biologic-Geomorphic Feedbacks in Salt-Marsh Landscapes. Adv. Water Resour. 93, 265–275. doi: 10.1016/j.advwatres.2015.09.004
Davy A. J., Brown M. J. H., Mossman H. L., Grant A. (2011). Colonization of a Newly Developing Salt Marsh: Disentangling Independent Effects of Elevation and Redox Potential on Halophytes. J. Ecol. 99, 1350–1357. doi: 10.1111/j.1365-2745.2011.01870.x
Day J. W., Boesch D. F., Clairain E. J., Kemp G. P., Laska S. D., Mitsch W. J., et al. (2007). Restoration of the Mississippi Delta: Lessons From Hurricanes Katrina and Rita. Science 315, 1679–1684. doi: 10.1126/science.1137030
Day J. W., Britsch L. D., Hawes S. R., Shaffer G. P., Reed D. J., Cahoon D. R. (2000). Pattern and Process of Land Loss in the Mississippi Delta: A Spatial and Temporal Analysis of Wetland Habitat Change. Estuaries. 23, 425–438. doi: 10.2307/1353136
Dayton P. K. (1975). Experimental Evaluation of Ecological Dominance in a Rocky Intertidal Algal Community. Ecol. Monogr. 45, 137–159. doi: 10.2307/1942404
De Leeuw J., Apon L. P., Herman P. M. J., de Munck W., Beeftink W. G. (1992). Vegetation Response to Experimental and Natural Disturbance in Two Salt-Marsh Plant Communities in the Southwest Netherlands. Netherlands J. Sea Res. 30, 279–288. doi: 10.1016/0077-7579(92)90066-N
Ellison A. M. (1987). Effects of Competition, Disturbance, and Herbivory on Salicornia Europaea. Ecology 68, 576–586. doi: 10.2307/1938463
Elsey-Quirk T., Mariotti G., Valentine K., Raper K. (2019). Retreating Marsh Shoreline Creates Hotspots of High-Marsh Plant Diversity. Sci. Rep. 9, 1–9. doi: 10.1038/s41598-019-42119-8
Emery N. C., Ewanchuk P. J., Bertness M. D. (2001). Competition and Salt-Marsh Plant Zonation: Stress Tolerators may be Dominant Competitors. Ecology 82, 2471–2485. doi: 10.1890/0012-9658(2001)082[2471:CASMPZ]2.0.CO;2
Evans B. R., Möller I., Spencer T., Smith G. (2019). Dynamics of Salt Marsh Margins are Related to Their Three-Dimensional Functional Form. Earth Surf. Process. Landforms. 44, 1816–1827. doi: 10.1002/esp.4614
Fagherazzi S., Kirwan M. L., Mudd S. M., Guntenspergen G. R., Temmerman S., D’Alpaos A., et al. (2012). Numerical Models of Salt Marsh Evolution: Ecological, Geomorphic, and Climatic Factors. Rev. Geophys. 50, 1–28. doi: 10.1029/2011RG000359
Finotello A., Marani M., Carniello L., Pivato M., Roner M., Tommasini L., et al. (2020). Control of Wind-Wave Power on Morphological Shape of Salt Marsh Margins. Water Sci. Eng. 13, 45–56. doi: 10.1016/j.wse.2020.03.006
FitzGerald D. M., Hughes Z. (2019). Marsh Processes and Their Response to Climate Change and Sea-Level Rise. Annu. Rev. Earth Planet. Sci. 47, 481–517. doi: 10.1146/annurev-earth-082517-010255
Ford H., Garbutt A., Ladd C., Malarkey J., Skov M. W. (2016). Soil Stabilization Linked to Plant Diversity and Environmental Context in Coastal Wetlands. J. Veg. Sci. 27, 259–268. doi: 10.1111/jvs.12367
Friess D. A., Krauss K. W., Horstman E. M., Balke T., Bouma T. J., Galli D., et al. (2012). Are All Intertidal Wetlands Naturally Created Equal? Bottlenecks, Thresholds and Knowledge Gaps to Mangrove and Saltmarsh Ecosystems. Biol. Rev. 87, 346–366. doi: 10.1111/j.1469-185X.2011.00198.x
Gaskins L. C., Paxton A. B., Silliman B. R. (2020). Megafauna in Salt Marshes. Front. Mar. Sci. 7. doi: 10.3389/fmars.2020.561476
Geng L., D’Alpaos A., Sgarabotto A., Gong Z., Lanzoni S. (2021). Intertwined Eco-Morphodynamic Evolution of Salt Marshes and Emerging Tidal Channel Networks. Water Resour. Res. 57, 1–25. doi: 10.1029/2021WR030840
Giblin A. E., Fulweiler R. W., Hopkinson C. S. (2021). “The Role of Marshes in Coastal Nutrient Dynamics and Loss,” in Salt Marshes: Function, Dynamics, and Stresses. Eds. FitzGerald D. M., Hughes Z. J. (Cambridge: Cambridge University Press), 113–154. doi: 10.1017/9781316888933.007
Giometto A., Altermatt F., Carrara F., Maritan A., Rinaldo A. (2013). Scaling Body Size Fluctuations. Proc. Natl. Acad. Sci. U. S. A. 110, 4646–4650. doi: 10.1073/pnas.1301552110
Goodwin G. C. H., Mudd S. M. (2020). Detecting the Morphology of Prograding and Retreating Marsh Margins-Example of a Mega-Tidal Bay. Remote Sens. 12, 13. doi: 10.3390/RS12010013
Gourgue O., van Belzen J., Schwarz C., Bouma T. J., van de Koppel J., Temmerman S. (2021a). A Convolution Method to Assess Subgrid-Scale Interactions Between Flow and Patchy Vegetation in Biogeomorphic Models. J. Adv. Model. Earth Syst. 13, 1–25. doi: 10.1029/2020MS002116
Gourgue O., van Belzen J., Schwarz C., Vandenbruwaene W., Vanlede J., Belliard J.-P., et al. (2021b). Biogeomorphic Modeling to Assess Resilience of Tidal Marsh Restoration to Sea Level Rise and Sediment Supply. Earth Surf. Dyn. Discuss., 1–38. doi: 10.5194/esurf-2021-66
Grace J. B., Wetzel R. G. (1981). Habitat Partitioning and Competitive Displacement in Cattails (Typha): Experimental Field Studies. Am. Nat. 118, 463–474. doi: 10.1086/283841
Grime J. P. (1977). Evidence for the Existence of Three Primary Strategies in Plants and Its Relevance to Ecological and Evolutionary Theory. Am. Nat. 111, 1169–1194. doi: 10.1086/283244
Hughes Z. J., FitzGerald D. M., Wilson C. A. (2021). “Impacts of Climate Change and Sea Level Rise,” in Salt Marshes: Function, Dynamics, and Stresses. Eds. FitzGerald D. M., Hughes Z. J. (Cambridge: Cambridge University Press), 476–481. doi: 10.1017/9781316888933.021
Hutchinson E. G. (1957). Concluding Remarks. Cold Spring Harb. Symp. Quant. Biol. 22, 415–442. doi: 10.1201/9781315366746
Hu Z., van Belzen J., van der Wal D., Balke T., Wang Z. B., Stive M., et al. (2015). Windows of Opportunity for Salt Marsh Vegetation Establishment on Bare Tidal Flats: {The} Importance of Temporal and Spatial Variability in Hydrodynamic Forcing. J. Geophys. Res. Biogeosci. 120, 1450–1469. doi: 10.1002/2014JG002870
Jones C. G., Lawton J. H., Shachak M. (1994). Organisms as Ecosystem Engineers. Oikos 69, 373–386. doi: 10.2307/3545850
Kalra T. S., Ganju N. K., Aretxabaleta A. L., Carr J. A., Defne Z., Moriarty J. M. (2021). Modeling Marsh Dynamics Using a 3-D Coupled Wave-Flow-Sediment Model. Front. Mar. Sci. 8. doi: 10.3389/fmars.2021.740921
Keddy P. A. (1989). Effects of Competition From Shrubs on Herbaceous Wetland Plants: A 4-Year Field Experiment. Can. J. Bot. 67, 708–716. doi: 10.1139/b89-094
Kirwan M. L., Guntenspergen G. R. (2010). Influence of Tidal Range on the Stability of Coastal Marshland. J. Geophys. Res. 115, 1–11. doi: 10.1029/2009JF001400
Kirwan M. L., Megonigal J. P. (2013). Tidal Wetland Stability in the Face of Human Impacts and Sea-Level Rise. Nature 504, 53–60. doi: 10.1038/nature12856
Kirwan M. L., Mudd S. M. (2012). Response of Salt-Marsh Carbon Accumulation to Climate Change. Nat. Publishing Group 489, 550–553. doi: 10.1038/nature11440
Kirwan M. L., Murray A. B. (2007). A Coupled Geomorphic and Ecological Model of Tidal Marsh Evolution. Proc. Natl. Acad. Sci. U. S. A. 104, 6118–6122. doi: 10.1073/pnas.0700958104
Kirwan M. L., Temmerman S. (2009). Coastal Marsh Response to Historical and Future Sea-Level Acceleration. Quat. Sci. Rev. 28, 1801–1808. doi: 10.1016/j.quascirev.2009.02.022
Kirwan M. L., Temmerman S., Skeehan E. E., Guntenspergen G. R., Fagherazzi S. (2016). Overestimation of Marsh Vulnerability to Sea Level Rise. Nat. Clim. Change 6, 253–260. doi: 10.1038/nclimate2909
Kuhn N. L., Zedler J. B. (1997). Differential Effects of Salinity and Soil Saturation on Native and Exotic Plants of a Coastal Salt Marsh. Estuaries 20, 391–403. doi: 10.2307/1352352
Lee J. S., Kim J. W. (2018). Dynamics of Zonal Halophyte Communities in Salt Marshes in the World. J. Mar. Isl. Cult. 7, 84–106. doi: 10.21463/jmic.2018.07.1.06
Leonard L. A., Croft A. L. (2006). The Effect of Standing Biomass on Flow Velocity and Turbulence in Spartina Alterniflora Canopies. Estuar. Coast. Shelf Sci. 69, 325–336. doi: 10.1016/j.ecss.2006.05.004
Leonardi N., Ganju N. K., Fagherazzi S. (2016). A Linear Relationship Between Wave Power and Erosion Determines Salt-Marsh Resilience to Violent Storms and Hurricanes. Proc. Natl. Acad. Sci. 113, 64–68. doi: 10.1073/pnas.1510095112
Levine J. M., Brewer J. S., Bertness M. D. (1998). Nutrients, Competition and Plant Zonation in a New England Salt Marsh. J. Ecol. 86, 285–292. doi: 10.1046/j.1365-2745.1998.00253.x
Lõhmus K., Balke T., Kleyer M. (2020). Spatial and Temporal Patterns of Initial Plant Establishment in Salt Marsh Communities. J. Veg. Sci. 31, 1124–1134. doi: 10.1111/jvs.12915
Marani M., Da Lio C., D’Alpaos A., D’Alpaos A. (2013). Vegetation Engineers Marsh Morphology Through Multiple Competing Stable States. Proc. Natl. Acad. Sci. 110, 3259–3263. doi: 10.1073/pnas.1218327110
Marani M., D’Alpaos A., Lanzoni S., Carniello L., Rinaldo A. (2007). Biologically-Controlled Multiple Equilibria of Tidal Landforms and the Fate of the Venice Lagoon. Geophys. Res. Lett. 34, 1–5. doi: 10.1029/2007GL030178
Marani M., D’Alpaos A., Lanzoni S., Carniello L., Rinaldo A. (2010). The Importance of Being Coupled: Stable States and Catastrophic Shifts in Tidal Biomorphodynamics. J. Geophys. Res. Earth Surf. 115, F04004. doi: 10.1029/2009JF001600
Marani M., D’Alpaos A., Lanzoni S., Santalucia M. (2011). Understanding and Predicting Wave Erosion of Marsh Edges. Geophys. Res. Lett. 38, 1–5. doi: 10.1029/2011GL048995
Marani M., Lanzoni S., Silvestri S., Rinaldo A. (2004). Tidal Landforms, Patterns of Halophytic Vegetation and the Fate of the Lagoon of Venice. J. Mar. Syst. 51, 191–210. doi: 10.1016/j.jmarsys.2004.05.012
Marani M., Silvestri S., Belluco E., Ursino N., Comerlati A., Tosatto O., et al. (2006). Spatial Organization and Ecohydrological Interactions in Oxygen-Limited Vegetation Ecosystems. Water Resour. Res 42, W06D06. doi: 10.1029/2005WR004582
Mariotti G., Spivak A. C., Luk S. Y., Ceccherini G., Tyrrell M., Gonneea M. E. (2020). Modeling the Spatial Dynamics of Marsh Ponds in New England Salt Marshes. Geomorphology 365, 107262. doi: 10.1016/j.geomorph.2020.107262
McLeod E., Chmura G. L., Bouillon S., Salm R., Björk M., Duarte C. M., et al. (2011). A Blueprint for Blue Carbon: Toward an Improved Understanding of the Role of Vegetated Coastal Habitats in Sequestering CO2. Front. Ecol. Environ. 9, 552–560. doi: 10.1890/110004
Mcowen C. J., Weatherdon L. V., Van Bochove J. W., Sullivan E., Blyth S., Zockler C., et al. (2017). A Global Map of Saltmarshes. Biodivers. Data J. 5, e11764. doi: 10.3897/BDJ.5.e11764
Möller I., Kudella M., Rupprecht F., Spencer T., Paul M., Van Wesenbeeck B. K., et al. (2014). Wave Attenuation Over Coastal Salt Marshes Under Storm Surge Conditions. Nat. Geosci. 7, 727–731. doi: 10.1038/NGEO2251
Morris J. T. (2006). Competition Among Marsh Macrophytes by Means of Geomorphological Displacement in the Intertidal Zone. Estuar. Coast. Shelf Sci. 69, 395–402. doi: 10.1016/j.ecss.2006.05.025
Morris J. T. (2007). Ecological Engineering in Intertidial Saltmarshes. Hydrobiologia 577, 161–168. doi: 10.1007/s10750-006-0425-4
Morris J. T., Barber D. C., Callaway J. C., Chambers R., Hagen S. C., Hopkinson C. S., et al. (2016). Contributions of Organic and Inorganic Matter to Sediment Volume and Accretion in Tidal Wetlands at Steady State. Earth’s Futur. 4, 110–121. doi: 10.1002/2015EF000334
Morris J. T., Porter D., Neet M., Noble P. A., Schmidt L., Lapine L. A., et al. (2005). Integrating LIDAR Elevation Data, Multi-Spectral Imagery and Neural Network Modelling for Marsh Characterization. Int. J. Remote Sens. 26, 5221–5234. doi: 10.1080/01431160500219018
Morris J. T., Sundareshwar P. V. V. V., Nietch C. T., Kjerfve B. B., Cahoon D. R. (2002). Responses of Coastal Wetlands to Rising Sea Leve. Ecology 83, 2869–2877. doi: 10.1890/0012-9658(2002)083[2869:ROCWTR]2.0.CO;2
Mudd S. M., Fagherazzi S., Morris J. T., Furbish D. J. (2004). “Flow, Sedimentation, and Biomass Production on a Vegetated Salt Marsh in South Carolina: Toward a Predictive Model of Marsh Morphologic and Ecologic Evolution,” in The Ecogeomorphology of Tidal Marshes, Coastal and Estuarine Studies N.59. Eds. Fagherazzi S., Marani M., Blum L. K. (Washington, D.C: American Geophysical Union), 165–188. doi: 10.1029/CE059p0165
Mudd S. M., Howell S. M., Morris J. T. (2009). Impact of Dynamic Feedbacks Between Sedimentation, Sea-Level Rise, and Biomass Production on Near-Surface Marsh Stratigraphy and Carbon Accumulation. Estuar. Coast. Shelf Sci. 82, 377–389. doi: 10.1016/j.ecss.2009.01.028
Muench A., Elsey-Quirk T. (2019). Competitive Reversal Between Plant Species is Driven by Species-Specific Tolerance to Flooding Stress and Nutrient Acquisition During Early Marsh Succession. J. Appl. Ecol. 56, 2236–2247. doi: 10.1111/1365-2664.13458
Nelson J. L., Zavaleta E. S. (2012). Salt Marsh as a Coastal Filter for the Oceans: Changes in Function With Experimental Increases in Nitrogen Loading and Sea-Level Rise. PloS One 7(8), e38558. doi: 10.1371/journal.pone.0038558
Newton A., Icely J., Cristina S., Perillo G. M. E., Turner R. E., Ashan D., et al. (2020). Anthropogenic, Direct Pressures on Coastal Wetlands. Front. Ecol. Evol. 8. doi: 10.3389/fevo.2020.00144
Nyman J. A., Walters R. J., Delaune R. D., Patrick W. H. (2006). Marsh Vertical Accretion via Vegetative Growth. Estuar. Coast. Shelf Sci 69, 370–380. doi: 10.1016/j.ecss.2006.05.041
Ouyang X., Lee S. Y. (2020). Improved Estimates on Global Carbon Stock and Carbon Pools in Tidal Wetlands. Nat. Commun. 11, 1–7. doi: 10.1038/s41467-019-14120-2
Palaima A. (2012). Ecology, Conservation, and Restoration of Tidal Marshes: The San Francisco Estuary. 1st ed. Ed. Palaima A. (Berkeley, CA (US):University of California Press). Available at: http://www.jstor.org/stable/10.1525/j.ctt1ppw94.
Pennings S. C., Bertness M. D. (1999). Using Latitudinal Variation to Examine Effects of Climate on Coastal Salt Marsh Pattern and Process. Curr. Top. Wetl. Biogeochem 3, 100–111.
Pennings S. C., Bertness M. D. (2001). “Salt Marsh Communities,” in Marine Community Ecology. Eds. Bertness M. D., Gaines S. D., Hay M. (Sunderland, Massachusetts: Sinauer Associates), 289–316.
Pennings S. C., Callaway R. M. (1992). Salt Marsh Plant Zonation: The Relative Importance of Competition and Physical Factors. Ecology 73, 681–690. doi: 10.2307/1940774
Pennings S. C., Grant M. B., Bertness M. D. (2005). Plant Zonation in Low-Latitude Salt Marshes: Disentangling the Roles of Flooding, Salinity and Competition. J. Ecol. 93, 159–167. doi: 10.1111/j.1365-2745.2004.00959.x
Pennings S. C., He Q. (2021). “Community Ecology of Salt Marshes,” in Salt Marshes: Function, Dynamics, and Stresses. Eds. FitzGerald D. M., Hughes Z. J. (Cambridge: Cambridge University Press), 82–112. doi: 10.1017/9781316888933.006
Pennings S. C., Stanton L. E., Brewer J. S. (2002). Nutrient Effects on the Composition of Salt Marsh Plant Communities Along the Southern Atlantic and Gulf Coasts of the United States. Estuaries 25, 1164–1173. doi: 10.1007/BF02692213
Perillo G. M. E. E., Iribarne O. O. (2003). New Mechanisms Studied for Creek Formation in Tidal Flats: From Crabs to Tidal Channels. Eos (Washington. DC). 84, 1–3. doi: 10.1029/2003EO010001
Ratliff K. M., Braswell A. E., Marani M. (2015). Spatial Response of Coastal Marshes to Increased Atmospheric CO 2. Proc. Natl. Acad. Sci. 112, 201516286. doi: 10.1073/pnas.1516286112
Redfield A. C. (1972). Development of a New England Salt Marsh. Ecol. Monogr. 42, 201–237. doi: 10.2307/1942263
Rinaldo A., Rigon R., Banavar J. R., Maritan A., Rodriguez-Iturbe I. (2014). Evolution and Selection of River Networks: Statics, Dynamics, and Complexity. Proc. Natl. Acad. Sci. U. S. A. 111, 2417–2424. doi: 10.1073/pnas.1322700111
Rogers K., Kelleway J. J., Saintilan N., Megonigal J. P., Adams J. B., Holmquist J. R., et al. (2019). Wetland Carbon Storage Controlled by Millennial-Scale Variation in Relative Sea-Level Rise. Nature 567, 91–95. doi: 10.1038/s41586-019-0951-7
Roner M., D’Alpaos A., Ghinassi M., Marani M., Silvestri S., Franceschinis E., et al. (2016). Spatial Variation of Salt-Marsh Organic and Inorganic Deposition and Organic Carbon Accumulation: Inferences From the Venice Lagoon, Italy. Adv. Water Resour. 93-B, 276–287. doi: 10.1016/j.advwatres.2015.11.011
Roner M., Ghinassi M., Finotello A., Bertini A., Combourieu-nebout N., Donnici S., et al. (2021). Detecting the Delayed Signatures of Changing Sediment Supply in Salt-Marsh Landscapes: The Case of the Venice Lagoon (Italy). Front. Mar. Sci. 8. doi: 10.3389/fmars.2021.742603
Roozen A. J. M., Westhoff V. (1985). A Study on Long-Term Salt-Marsh Succession Using Permanent Plots. Vegetatio 61, 23–32. doi: 10.1007/BF00039807
Rybicki J., Hanski I. (2013). Species-Area Relationships and Extinctions Caused by Habitat Loss and Fragmentation. Ecol. Lett. 16, 27–38. doi: 10.1111/ele.12065
Sarika M., Zikos A. (2020). “Coastal Salt Marshes,” in Handbook of Halophytes: From Molecules to Ecosystems Towards Biosaline Agriculture. Ed. Grigore M.-N. (Cham: Springer International Publishing), 1–39. doi: 10.1007/978-3-030-17854-3_7-1
Schoutens K., Heuner M., Fuchs E., Minden V., Schulte-ostermann T., Belliard J., et al. (2020). Nature-Based Shoreline Protection by Tidal Marsh Plants Depends on Trade-Offs Between Avoidance and Attenuation of Hydrodynamic Forces. Estuar. Coast. Shelf Sci. 236, 106645. doi: 10.1016/j.ecss.2020.106645
Schuerch M., Spencer T., Temmerman S., Kirwan M. L., Wolff C., Lincke D., et al. (2018). Future Response of Global Coastal Wetlands to Sea-Level Rise. Nature 561, 231–234. doi: 10.1038/s41586-018-0476-5
Schulte Ostermann T., Heuner M., Fuchs E., Temmerman S., Schoutens K., Bouma T. J., et al. (2021). Unraveling Plant Strategies in Tidal Marshes by Investigating Plant Traits and Environmental Conditions. J. Veg. Sci. 32, e13038. doi: 10.1111/jvs.13038
Sgarabotto A., D’Alpaos A., Lanzoni S. (2021). Effects of Vegetation, Sediment Supply and Sea Level Rise on the Morphodynamic Evolution of Tidal Channels. Water Resour. Res. 57, e2020WR028577. doi: 10.1029/2020WR028577
Shao D., Liu K., Mossman H. L., Adams M. P., Wang H., Li D., et al. (2021). A Prioritization Metric and Modelling Framework for Fragmented Saltmarsh Patches Restoration. Ecol. Indic. 128, 107833. doi: 10.1016/j.ecolind.2021.107833
Silvestri S., Defina A., Marani M. (2005). Tidal Regime, Salinity and Salt Marsh Plant Zonation. Estuar. Coast. Shelf Sci. 62, 119–130. doi: 10.1016/j.ecss.2004.08.010
Silvestri S., Marani M. (2005). (2004). Salt-Marsh Vegetation and Morphology: Basic Physiology, Modelling and Remote Sensing Observations. In The Ecogeomorphology of Tidal Marshes (eds Fagherazzi S., Marani M., Blum L. K.), chapter 2. American Geophysical Union, special series on "Coastal and Estuarine Studies" n.59, Washington, DC. p. 5–25 doi: 10.1029/CE059p0005
Snow A. A., Vince S. W. (1984). Plant Zonation in an Alaskan Salt Marsh: II. An Experimental Study of the Role of Edaphic Conditions. J. Ecol. 72, 669. doi: 10.2307/2260075
Temmerman S., Bouma T. J., Govers G., Wang Z. B., De Vries M. B., Herman P. M. J., et al. (2005). Impact of Vegetation on Flow Routing and Sedimentation Patterns: Three-Dimensional Modeling for a Tidal Marsh. J. Geophys. Res. Earth Surf. 110, 1–18. doi: 10.1029/2005JF000301
Temmerman S., Bouma T. J., Van de Koppel J., van der Wal D., De Vries M. B., Herman P. M. J. (2007). Vegetation Causes Channel Erosion in a Tidal Landscape. Geology 35, 631–634. doi: 10.1130/G23502A.1
Temmerman S., Meire P., Bouma T. J., Herman P. M. J., Ysebaert T., de Vriend H. J. (2013). Ecosystem-Based Coastal Defence in the Face of Global Change. Nature 504, 79–83. doi: 10.1038/nature12859
Tognin D., D’Alpaos A., Marani M., Carniello L. (2021). Marsh Resilience to Sea-Level Rise Reduced by Storm-Surge Barriers in the Venice Lagoon. Nat. Geosci 14, 906–911. doi: 10.1038/s41561-021-00853-7
Tommasini L., Carniello L., Ghinassi M., Roner M., D’Alpaos A. (2019). Changes in the Wind-Wave Field and Related Salt-Marsh Lateral Erosion: Inferences From the Evolution of the Venice Lagoon in the Last Four Centuries. Earth Surf. Process. Landforms 44, 1633–1646. doi: 10.1002/esp.4599
Ungar I. A. (1998). Are Biotic Factors Significant in Influencing the Distribution of Halophytes in Saline Habitats? Bot. Rev. 64, 176–199. doi: 10.1007/BF02856582
Valiela I., Kinney E., Culberston J., Peacock E., Smith S. (2009). “Global Losses of Mangroves and Salt Marshes,” in Global Loss of Coastal Habitats: Rates, Causes and Consequences, vol. 184. Ed. Duarte C. M. (Bilbao:Fondacion BBVA).
Valiela I., Teal J. M. (1974). Nutrient Limitation in Salt Marsh Vegetation,” in Ecology of halophytes, eds. Reimold R. J., Queen W. H. (New York, NY: Academic Press), 547–563.
Vandenbruwaene W., Temmerman S., Bouma T. J., Klaassen P. C., De Vries M. B., Callaghan D. P., et al. (2011). Flow Interaction With Dynamic Vegetation Patches: Implications for Biogeomorphic Evolution of a Tidal Landscape. J. Geophys. Res. Earth Surf. 116, 1–13. doi: 10.1029/2010JF001788
van Regteren M., Amptmeijer D., de Groot A. V., Baptist M. J., Elschot K. (2020). Where Does the Salt Marsh Start? Field-Based Evidence for the Lack of a Transitional Area Between a Gradually Sloping Intertidal Flat and Salt Marsh. Estuar. Coast. Shelf Sci. 243, 106909. doi: 10.1016/j.ecss.2020.106909
Van Wesenbeeck B. K., Van De Koppel J., Herman P. M. J. J., Bouma T. J. (2008). Does Scale-Dependent Feedback Explain Spatial Complexity in Salt-Marsh Ecosystems? Oikos 117, 152–159. doi: 10.1111/j.2007.0030-1299.16245.x
Wang F., Lu X., Sanders C. J., Tang J. (2019). Tidal Wetland Resilience to Sea Level Rise Increases Their Carbon Sequestration Capacity in United States. Nat. Commun. 10, 1–11. doi: 10.1038/s41467-019-13294-z
Wang C., Menenti M., Stoll M. P., Belluco E., Marani M. (2007). Mapping Mixed Vegetation Communities in Salt Marshes Using Airborne Spectral Data. Remote Sens. Environ. 107, 559–570. doi: 10.1016/j.rse.2006.10.007
Wang C., Menenti M., Stoll M., Feola A., Belluco E., Marani M. (2009). Separation of Ground and Low Vegetation Signatures in LiDAR Measurements of Salt-Marsh Environments. IEEE Trans. Geosci. Remote Sens. 47, 2014–2023. doi: 10.1109/TGRS.2008.2010490
Wang H., van der Wal D., Li X., van Belzen J., Herman P. M. J., Hu Z., et al. (2017). Zooming in and Out: Scale Dependence of Extrinsic and Intrinsic Factors Affecting Salt Marsh Erosion. J. Geophys. Res. Earth Surf. 122, 1455–1470. doi: 10.1002/2016JF004193
Wiegert R. G., Freeman B. J. (1990). Tidal Salt Marshes of the Southeast Atlantic Coast: A Community Profile. Biol. Rep. - US Fish Wildl. Serv. doi: 10.2172/5032823
Willemsen P. W. J. M., Smits B. P., Borsje B. W., Herman P. M. J., Dijkstra J. T., Bouma T. J., et al. (2021). Modelling Decadal Salt Marsh Development: Variability of the Salt Marsh Edge Under Influence of Waves and Sediment Availability. Water Resour. Res. 58, e2020WR028962. doi: 10.1029/2020WR028962
Wolters M., Garbutt A., Bakker J. P. (2005). Salt-Marsh Restoration: Evaluating the Success of De-Embankments in North-West Europe. Biol. Conserv. 123, 249–268. doi: 10.1016/j.biocon.2004.11.013
Wolters M., Garbutt A., Bekker R. M., Bakker J. P., Carey P. D. (2008). Restoration of Salt-Marsh Vegetation in Relation to Site Suitability, Species Pool and Dispersal Traits. J. Appl. Ecol. 45, 904–912. doi: 10.1111/j.1365-2664.2008.01453.x
Xin P., Jin G., Li L., Barry D. A. (2009). Effects of Crab Burrows on Pore Water Flows in Salt Marshes. Adv. Water Resour. 32, 439–449. doi: 10.1016/j.advwatres.2008.12.008
Xin P., Li L., Barry D. A. (2013). Tidal Influence on Soil Conditions in an Intertidal Creek-Marsh System. Water Resour. Res. 49, 137–150. doi: 10.1029/2012WR012290
Xin P., Zhou T., Lu C., Shen C., Zhang C., D’Alpaos A., et al. (2017). Combined Effects of Tides, Evaporation and Rainfall on the Soil Conditions in an Intertidal Creek-Marsh System. Adv. Water Resour. 103, 1–15. doi: 10.1016/j.advwatres.2017.02.014
Yang Z., D’Alpaos A., Marani M., Silvestri S. (2020b). Assessing the Fractional Abundance of Highly Mixed Salt-Marsh Vegetation Using Random Forest Soft Classification. Remote Sens. 12, 3224. doi: 10.3390/rs12193224
Yang S. L., Luo X., Temmerman S., Kirwan M. L., Bouma T., Xu K., et al. (2020a). Role of Delta-Front Erosion in Sustaining Salt Marshes Under Sea-Level Rise and Fluvial Sediment Decline. Limnol. Oceanogr. 65, 1990–2009. doi: 10.1002/lno.11432
Yousefi Lalimi F., Silvestri S., D’Alpaos A., Roner M., Marani M. (2018). The Spatial Variability of Organic Matter and Decomposition Processes at the Marsh Scale. J. Geophys. Res. Biogeosci. 123, 3713–3727. doi: 10.1029/2017JG004211
Zhang Y., Rowland J. C., Xu C., Wolfram P. J., Svyatsky D., Moulton J. D., et al. (2020). Understanding the Eco-Geomorphologic Feedback of Coastal Marsh Under Sea Level Rise: Vegetation Dynamic Representations, Processes Interaction, and Parametric Sensitivity. J. Geophys. Res. Earth Surf. 125, e2020JF005729. doi: 10.1029/2020JF005729
Keywords: salt marshes, ecology, vegetation, competition, zonation, α-diversity, numerical modelling, ecomorphodynamics
Citation: Finotello A, D’Alpaos A, Marani M and Bertuzzo E (2022) A Minimalist Model of Salt-Marsh Vegetation Dynamics Driven by Species Competition and Dispersal. Front. Mar. Sci. 9:866570. doi: 10.3389/fmars.2022.866570
Received: 31 January 2022; Accepted: 03 March 2022;
Published: 05 April 2022.
Edited by:
Zeng Zhou, Hohai University, ChinaReviewed by:
Ian Townend, University of Southampton, United KingdomDongdong Shao, Beijing Normal University, China
Copyright © 2022 Finotello, D’Alpaos, Marani and Bertuzzo. This is an open-access article distributed under the terms of the Creative Commons Attribution License (CC BY). The use, distribution or reproduction in other forums is permitted, provided the original author(s) and the copyright owner(s) are credited and that the original publication in this journal is cited, in accordance with accepted academic practice. No use, distribution or reproduction is permitted which does not comply with these terms.
*Correspondence: Alvise Finotello, YWx2aXNlLmZpbm90ZWxsb0B1bml2ZS5pdA==; Enrico Bertuzzo, ZW5yaWNvLmJlcnR1enpvQHVuaXZlLml0