 Conrad W. Speed1*
 Mark G. Meekan1,2
 Matthew J. Birt1
 Miles J. G. Parsons1,2,3
 Dianne McLean1
 Brett M. Taylor1
 Luke Thomas1
 Robert McCauley3Jayson M. Semmens4
 Stephen J. Newman5
- 1Australian Institute of Marine Science (AIMS), Indian Ocean Marine Research Centre, Level 3, The University of Western Australia, Fairway, Crawley, WA, Australia
- 2University of Western Australia (UWA) Oceans Institute, University of Western Australia, Perth, WA, Australia
- 3Centre for Marine Science and Technology, Curtin University, Bentley, WA, Australia
- 4Institute for Marine and Antarctic Studies, University of Tasmania, Battery Point, TAS, Australia
- 5Western Australian Fisheries and Marine Research Laboratories, Department of Primary Industries and Regional Development, Government of Western Australia, North Beach, WA, Australia
Predatory fishes are a major component of many tropical fisheries, although little is known about their diet and trophic structure, which can hinder effective management. We used stable isotopes δ15N and δ13C in conjunction with dietary prey items of five fishes (Lutjanus sebae, Lethrinus punctulatus, Epinephelus areolatus, Epinephelus multinotatus, and Plectropomus maculatus) to describe the diet and trophic structure across this assemblage. A total of 153 isotope and 87 stomach content samples were collected at two locations that were ≈30 km apart, over two sampling trips, separated by three months. There was clear separation of species’ mean δ15N and δ13C values in isotopic space; the highest mean δ15N was exhibited by E. multinotatus (13.50 ± 0.11 SE) and the lowest was L. punctulatus (11.05 ± 0.13). These two species had the lowest overlap of isotopic niche space, whereas the highest overlap occurred between L. sebae and P. maculatus. δ15N increased with fish body size for all species. However, body size was not significantly related to δ13C values for any species. There was a notable shift in both δ15N and δ13C between sampling trips, with δ13C being more depleted in the second trip. There was also a difference in δ13C between locations for all species, suggesting localised foraging. A multiple tissue comparison for L. sebae indicated positive relationships for both δ15N and δ13C between dorsal fin and muscle tissue. Mean δ15N values were the same for both fin (12.1 ± 0.10 SE) and muscle tissue (12.1 ± 0.09 SE), although δ13C was more enriched in fin (-15.6 ± 0.14 SE) compared to muscle tissue (-17.3 ± 0.11 SE). The most common dietary items across species were teleosts and crustaceans, which was consistent with isotope data indicating a reliance on a demersal food web (δ13C values ranging from -18 to -15‰). The results from our study indicate a dynamic spatio-temporal trophic structure and diet for commercially important demersal species and highlight the benefits of a multi-facetted sampling approach.
Introduction
Large predators influence food web structure through consumptive and non-consumptive effects (Estes et al., 2011). However, the nature and strength of predator-prey interactions depends on a variety of factors, such as habitat type and structure, prey abundance and diversity, as well as selectivity by predators (e.g. Paine, 1992; Hixon and Beets, 1993). In the marine environment, there are a range of factors governing success of predation events that include removal or destruction of habitat through natural disturbance events (Syms and Jones, 2000), fishing pressure that selectively removes large predators first (Pauly et al., 1998), and the perceived threat of predation, leading to modification of prey behaviours (Lester et al., 2020). Fish predator-prey interactions are largely governed by size and gape, with most species being limited by the size of prey they can swallow, which can be > 50% of their own body size (Scharf et al., 1997). The diet of larger species of shark, for example, is less restricted than large teleosts as they are equipped with serrated dentition that facilitates the removal of parts of animals larger than themselves and they also generally have wider gapes than their teleost competitors (e.g. Lucifora et al., 2006; Braccini, 2008). The role of predation by piscivores on reef environments represents a top-down driver of fish community structure (Graham et al., 2003; Boaden and Kingsford, 2015; Hixon, 2015), which may indirectly influence the benthic environment (Madin et al., 2019). However, the importance and strength of top-down effects has been debated due to the complexities of ecosystem dynamics and poorly understood exploitation histories (Ruppert et al., 2013; Rizzari et al., 2015; Casey et al., 2017).
Establishing baselines of the trophic structure or establishing natural (i.e. in the absence of human impacts) trophic links of predatory marine fish communities is complicated due to these species being among the first to be harvested by commercial, recreational, and subsistence fisheries (Jennings and Polunin, 1997; Pauly et al., 1998; Pinheiro and Joyeux, 2015; Frisch et al., 2016), due to their high value and catchability. Furthermore, much of the work to date has focussed on describing predatory fish community structure in shallow waters around reefs (e.g. Frisch et al., 2014; Boaden and Kingsford, 2015; Bierwagen et al., 2019; Speed et al., 2019), although recent studies have also included mesophotic depths (> 50 m) (e.g. Lindfield et al., 2016; Asher et al., 2017).
Specific information on the diet of predatory fishes targeted by commercial fishing and their prey is often based on stomach content studies and in many instances limited to localised areas of a fishery (e.g. Salini et al., 1994; Overholtz et al., 2000). Even though the diet of most target species can be classified broadly as carnivorous, there is known intraspecific plasticity in feeding among regions (Farmer and Wilson, 2011), which complicates management at both the species and community level. Having a sound understanding of diet and trophic linkages is critical to developing ecosystem models and assessing how they respond to fishing pressure (Bascompte et al., 2005; Farmer and Wilson, 2011). Long-term studies that document ontogenetic or seasonal shifts in diet or dietary sources are rare (although see Holt et al., 2019). However, this level of information is essential to understand potential impacts that may occur across the lifecycle of a species, which is currently lacking for many seascapes (Abrantes et al., 2015). Therefore, our current understanding of the feeding ecology of large predatory fish species is limited to a restricted range of species in certain areas, which ultimately hinders effective management and conservation efforts (Farmer and Wilson, 2011).
The most common method of obtaining dietary information for fishes (and thus trophic role) is through examination of stomach contents and or intestinal tracts (Hyslop, 1980). Estimates of contributions or relative importance of dietary items using this approach range from counts of the number and percentage of prey items identified, to the gravimetric and volumetric calculation per prey item (See reviews by Hyslop, 1980; Baker et al., 2014; Amundsen and Sánchez‐Hernández, 2019). This method is usually lethal and only provides an immediate snapshot of the most recently consumed items (Takahashi et al., 2020). Furthermore, identification of partially digested items can be problematic (Baker et al., 2014), and in many cases (>30% of the time) piscivore stomachs are empty due to a variety of reasons, such as intermittent feeding and stomach eversion due to swim bladder expansion during capture (See review by Vignon and Dierking, 2011; Vinson and Angradi, 2011).
Alternative methods for assessing dietary information and trophic role of fishes include molecular approaches such as analysis of stable isotopes of the consumer tissue (Post, 2002), fatty acid profiles (e.g. Bierwagen et al., 2019) and more recently, DNA identification of prey items obtained from stomach content metabarcoding (e.g. Casey et al., 2019; Takahashi et al., 2020). Of these, the analysis of stable isotopes is the most common approach used in dietary and trophic relationship studies. Stable isotope ratios of nitrogen N15:N14 ‘δ15N’ and carbon C13:C12 ‘δ13C’ in consumer tissues are often used in ecological studies to infer dietary niche, with δ15N enrichment providing an indication of an organism’s trophic level (Perkins et al., 2014). In comparison, δ13C can provide geographic and trophic information on nutrient residence because of the predictable variation in δ13C values with latitude and among different primary production types (e.g., coastal, benthic, and planktonic) (Bird et al., 2018). Stable isotopes can be used to estimate trophic positions and body length relationships (Speed et al., 2012; Frisch et al., 2014), establish spatial foraging patterns and migrations (Ménard et al., 2007; Ferreira et al., 2017), monitor dietary shifts between seasons, life stages, or life styles (e.g. benthic vs pelagic) (Nakamura and Sato, 2014; Park et al., 2020), and can be modelled to estimate prey source contributions (Frisch et al., 2014). White muscle is the most commonly used tissue for analysis of assimilated isotopic source material (usually δ13C and δ15N), which provides a resolution or turnover rate (‘isotopic half-life’) of several months for large predatory fish (e.g. Nelson et al., 2011). More recently, fish fin tissue has been trialled as a non-lethal method, with generally a good correlation between isotope ratios and muscle tissue, although turnover rates can vary compared to muscle tissue (Sanderson et al., 2009; Willis et al., 2013; Galván et al., 2015; Matley et al., 2016). While the assessment of assimilated stable isotopes in predators can provide a range of inferred information, they lack the fine taxonomic resolution that can be achieved with stomach content analysis or use of DNA. Some of the limitations of direct sampling of fish stomachs or indirect molecular techniques, such as stable isotope analysis, can be avoided by using these approaches together in the same study (Matley et al., 2018; Nielsen et al., 2018). This has the potential to offer greater insights compared to the use of any of these methods independently and can resolve trophic interactions at scales necessary for ecosystem-based management (Levin and Lubchenco, 2008).
Here, we used stomach and gastrointestinal tract content in conjunction with stable isotope analyses to describe the trophic structure of predatory fishes of high importance to commercial fisheries in north-western Australia. An important aspect of our study was the ability to sample a community of commercially important predatory fishes in a large (77km x 40 km) fishery management zone on a tropical shelf that had been protected from commercial fishing for more than a decade. This allowed us to examine the trophic roles of these species in an environment where the impacts of removal by fisheries on trophic structure was minimised. We focused on five common species of snapper (Lutjanidae), emperors (Lethrinidae), and grouper (Epinephelidae) that together constitute >25% of the North Coast Demersal Resource, with an annual value of $12 million AUD (Newman et al., 2018b). Our study examined the following questions: a) How is the predatory fish community structure reflected in terms of stable isotopes δ15N and δ13C, and is there evidence of niche overlap among species?; b) How do isotope signatures vary between sampling periods – is there a seasonal shift?; c) Is there evidence of an increase in δ15N with the body length of fish, implying that larger individuals feed higher in the food web?; d) Does fin tissue act as a suitable non-lethal proxy for muscle tissue for a key fishery target, the red emperor (Lutjanus sebae)?; and e) Is the isotopic composition of fish reflected in their diet obtained from stomach and gastrointestinal tract content analysis?
Methods
Study Area
Samples were collected in the Area 3 Management Zone of the Pilbara Fish Trawl Fishery, located approximately 90 km north of Point Samson, off the Pilbara coast in Western Australia (Figure 1). The area encompasses ≈2,500 km2 of sloping seabed from 50 m water depth in the south to 80 m in the north, an area that has been a Targeted Fishery Closure (TFC) since 1998 and, due to the distance from shore, experiences negligible recreational fishing (Langlois et al., 2021; Meekan et al., 2021). Area 3 is situated within the middle of the fishery to maximise spillover potential to the areas surrounding it (Langlois et al., 2021). Results from a previous study indicated that the seabed was largely a homogenous environment of sand covering a hard substrate (possibly limestone), which was interspersed with small patches of < 2% sessile benthic invertebrates (predominantly sponges, and soft corals) (Meekan et al., 2021). Fish samples were collected from sites within two focal locations in Area 3, in depths between 57 and 65 m. Individual collection sites were chosen based on multibeam echosounder surveys conducted to characterise the local seafloor that indicated suitable benthic habitat for demersal fish (Mccauley et al., 2021; Meekan et al., 2021). The two locations were separated by approximately 30 km.
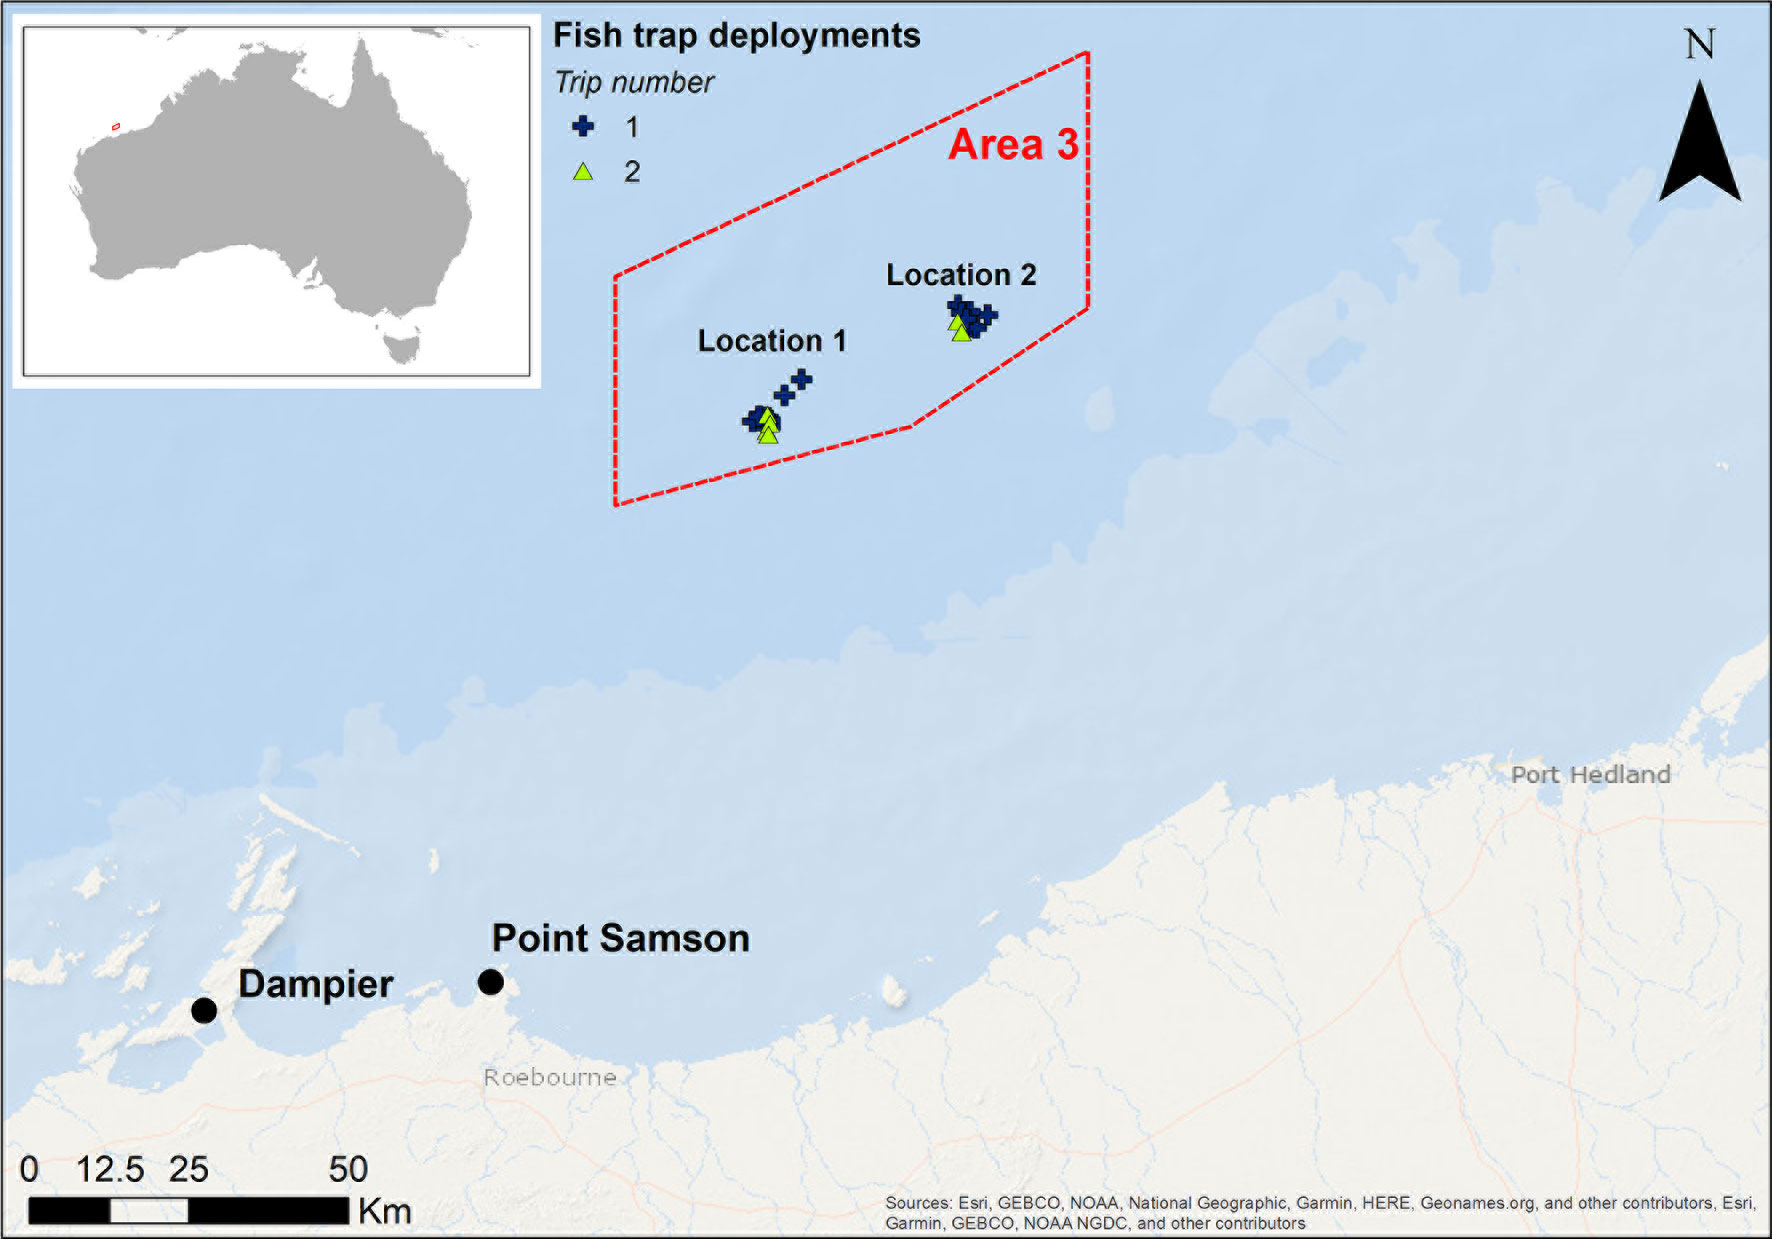
Figure 1 Map of study area showing sampling locations in the Area 3 Management Zone (red box) of the Pilbara Fish Trawl Fishery, which has been a Targeted Fishery Closure since 1998. Sampling was undertaken across two trips in May/June and August/September 2018. This map was created using ArcGIS® software by Esri.
Target Species
The species of interest comprised: Lutjanus sebae (red emperor), Lethrinus punctulatus (bluespotted emperor), Epinephelus areolatus (yellowspotted rockcod grouper), Epinephelus multinotatus (rankin cod), and Plectropomus maculatus (bar-cheek coral trout). These species are known to occur across a variety of habitats, including coral and rocky reefs, rubble, seagrass beds (L. punctulatus), and deep offshore areas (E. multinotatus), down to maximum depths of between 100 and 200 m (Rome and Newman, 2010). The maximum size these fish grow to ranges from small size classes 40-50 cm (L. punctulatus and E. areolatus) up to medium to large size classes 90-100 cm (P. maculatus, L. sebae, and E. multinotatus) (Rome and Newman, 2010). None of these species have had detailed studies of dietary information to date, although the larger of the species (E. multinotatus and P. maculatus) are thought to be predominantly piscivorous, whereas the smaller to medium sizes (L. sebae, E. areolatus and L. punctulatus) appear to have mixed diets, including teleosts and various invertebrates (Salini et al., 1994; Farmer and Wilson, 2011; Matley et al., 2018). Three of these species (L. punctulatus, L. sebae, and E. multinotatus) are indicator species for monitoring and assessment of the North Coast Demersal Scalefish Resource (Newman et al., 2018b). There was a large focus on L. sebae in our study, given its broad distribution across the region and high-value to both commercial and recreational fishers (Newman et al., 2018a).
Collection Methods
All field work was done from the Australian Institute of Marine Science research vessel RV Solander, which is 35 m steel hull ship, purpose-built for marine science activities. Fish traps were chosen over other capture techniques such as hook and line, as they provided the advantage that catches could be size selective, non-target specimens could be released alive and shark depredation events minimised. Traps were made from steel mesh (50 mm width) and were rectangular with rounded corners measuring 600 mm in height, 1500 mm in length and 1200 mm in width (Newman et al., 2012). The vertical entrance to the trap was 600 × 200 mm in width, tapering to 600 × 100 mm internally (Newman et al., 2012). Australian sardines (Sardinops spp.) were used to bait traps. Traps were soaked for less than three hours, and deployments were staggered during daylight hours with two traps deployed at a time and a gap of two hours prior to the next trap deployment. On recovery, traps were raised slowly over a 20- to 30-minute period to allow for swim bladder gas reabsorption and were carefully lowered on deck via the stern A-frame to minimize scale damage. Fish were transported from traps to a holding tank for visual inspection. Samples were collected over two trips in May/June (end of Austral autumn/beginning of Austral winter) and August/September 2018 (end of Austral winter/beginning of Austral spring) using industry standard fish traps described above (Newman et al., 2011; Harvey et al., 2012).
Each fish was measured and photographed, and a dorsal fin ray removed and stored in a liquid nitrogen shipper (MVE CryoShipper) until they were subsequently transferred to a -80°C freezer and stored until processing could be done on land.
Species of interest were euthanized by placement into a concentrated solution of Aqui-S anaesthetic and then snap-frozen to -20°C for subsequent sampling of stomach content and analyses of stable isotopes from fish dorsal muscle tissue. Stomach contents were only retained on the second sampling trip for all species apart from L. sebae, which had stomach samples collected on both trips.
Stable Isotope Analysis
Less than 1 g of white dorsal muscle tissue was removed from a subsample (20 individuals) of whole L. sebae caught in the first sampling trip (May/June 2018), to compare with δ13C and δ15N samples obtained from the dorsal fin rays of the corresponding individuals. Skin was not included with the sample. Once removed, they were stored in a -80°C freezer along with the fin clips. Both fin (included dorsal fin spine and membrane) and muscle tissue samples were analysed for δ15N and δ13C with a continuous flow system, which consisted of a Delta V Plus mass spectrometer connected with a Thermo Flush 1112 via Conflo IV (Thermo-Finnigan/Germany). All δ13C values are given in per mil [‰, VPDB] according to delta notation, whereas δ15N values are given in per mil [‰, Air] according to delta notation (Skrzypek, 2013). Multi-point normalisation was used in order to reduce raw values to the international scale (Skrzypek, 2013) and was based on standards provided by IAEA: δ13C - NBS22, USGS24, IAEA600, USGS40, IAEA603; and for δ15N - N1, N2, USGS40, USGS32 and laboratory standards. Values of international standards for carbon (δ13C) were based on Coplen et al. (2006). Stable isotope lab analyses were undertaken at the West Australian Biogeochemistry Centre. The external error of analyses was calculated as one standard deviation of the mean values and was determined to be 0.10 ‰ for δ15N and δ13C.
Stomach and Gastrointestinal Tract Content Analysis
Fish stomachs and gastrointestinal tracts (GIT) were thawed for several hours prior to analysis in the lab. Each sample was placed in a tray and examined using a Leica dissecting microscope (https://www.leica-microsystems.com/) with a ProSciTech digital camera mounted to the eyepiece. Stomach and GIT content were examined, and results combined, although any bait from traps found in stomachs was recorded and removed from any analyses. All items were photographed under the microscope as a permanent record. Each item was counted and categorised into the lowest taxonomic level possible. Frequency of occurrence (%F) or ‘presence-absence method’ was used, which is the number of stomachs containing particular prey items as a percentage of all stomachs sampled (Hyslop, 1980). This method was used because it has been found to provide a robust and interpretable measure of diet composition (Baker et al., 2014; Amundsen and Sánchez‐Hernández, 2019). All items from the stomach and GIT were examined and grouped into one of four broad categories of food items: Crustacea, Teleostei, Mollusca, Other. Other included a range of spines, bones, and hard objects that potentially were parts of species of Radiolaria, Foraminifera, or Echinoidea. Unidentifiable, soft, amorphic organic material (AOM) was also noted. In addition to examination of contents from the stomach and GIT, the presence of bait used in traps was noted if present in the stomach, as well as whether stomachs were empty. A vacuity index was calculated as the number of empty stomachs/total number of the stomachs examined) × 100.
Statistical Analyses
Excessive lipid content in tissues relative to proteins and carbohydrates can bias stable isotope analyses and is recommended to be normalised for aquatic animals when the C:N ratio is > 3.5 (Post et al., 2007). Therefore, where our C:N ratio of a fish was > 3.5 we applied a normalisation of δ13C using the method of Post et al. (2007): δ13C —3.32 + 0.99 × C:N ratio (See also Abrantes et al., 2012; Frisch et al., 2014). Using the adjusted δ13C values, the stable isotopes δ13C and δ15N were plotted against one another to position each fish species in relative isotopic space. This was repeated for means calculated for each sampling trip, as trips were three months apart and isotopes in fins would have likely undergone turnover during this time period, with previous studies finding half-lives of δ13C and δ15N in fin tissue to range between 9 and 37 days for a range of species (Suzuki et al., 2005; German and Miles, 2010; Heady and Moore, 2013; Matley et al., 2016). We applied linear models to test whether there were any significant differences between isotopes collected between sampling trips and locations.
The isotopic niche occupied by each species was calculated using the total area of convex hulls that encompassed all individuals (Vaudo and Heithaus, 2011; Frisch et al., 2014). The area and percentage of overlap niche region (NR) was calculated through Monte Carlo bootstrapping 10,000 samples from the normal distribution for each fish. The mean value of the trophic niche and trophic niche overlap was calculated from the bootstrapped 10,000 samples for each species. The isotopic niche overlap of each species was calculated using the overlap function in the nicheROVER package in R (Swanson et al., 2015; R-Core Team, 2021). Isotopic niche space size was estimated by calculating the posterior distribution of niche size per species using the niche.size function in the nicheROVER package (Swanson et al., 2015).
The relationships between δ13C and δ15N with the fork length of each fish species was determined to assess whether there was any evidence of ontogenetic shifts in diet. This analysis was undertaken using a linear regression. The relationship between stable isotopes δ13C and δ15N taken from dorsal muscle tissue and fin samples was also used to assess differences in enrichment using linear regression.
To determine whether there had been any inadvertent sampling bias of fish body length between the first and second trip, we calculated Kernel Density Estimates (KDE) based on length frequency distributions for each species. These KDEs per trip were then compared to one another using a Kolmogorov–Smirnov (KS) test, which compared the size and shape of length-frequency distributions (trip 1 vs trip 2) (Langlois et al., 2012).
Results
Predatory Fish Community Structure of δ13C and δ15N Isotopes
In total, we analysed 153 fin clip samples across five species of predatory fishes for δ13C and δ15N composition (Table 1), with an additional 20 muscle tissue samples analysed for corresponding individuals of L. sebae. The species with the highest mean δ15N was E. multinotatus (13.50 ± 0.11 SE) and the species with the lowest was L. punctulatus (11.05 ± 0.13) (Figure 2A). The greatest range in δ15N was observed in L. punctulatus (3.1‰) and the lowest was in E. areolatus (1.1‰). The results from a linear model indicated that there was a significant effect of sampling trip on δ15N (P = <0.10) (Figure 2B), although the effect of location was non-significant (P = 0.14) (Supplementary Figure 1).
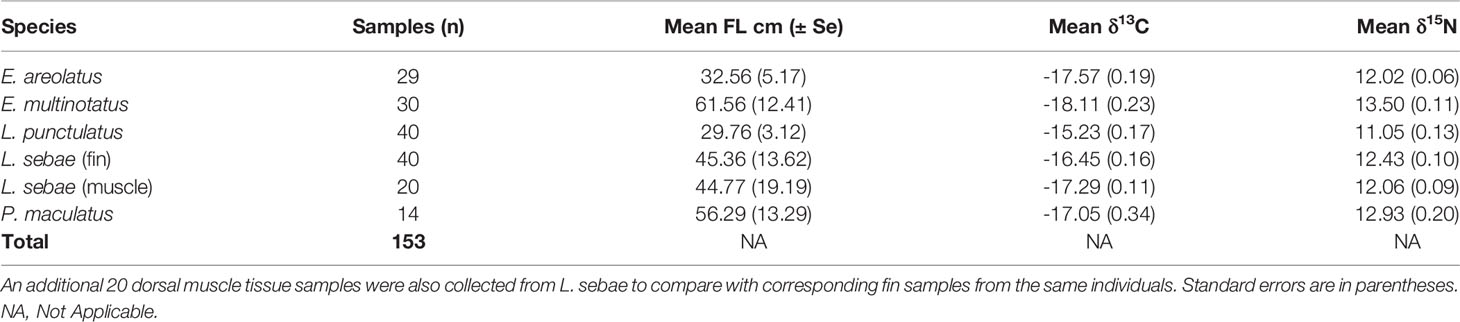
Table 1 Summary of fin clip samples of predatory fishes used for stable isotope analyses.
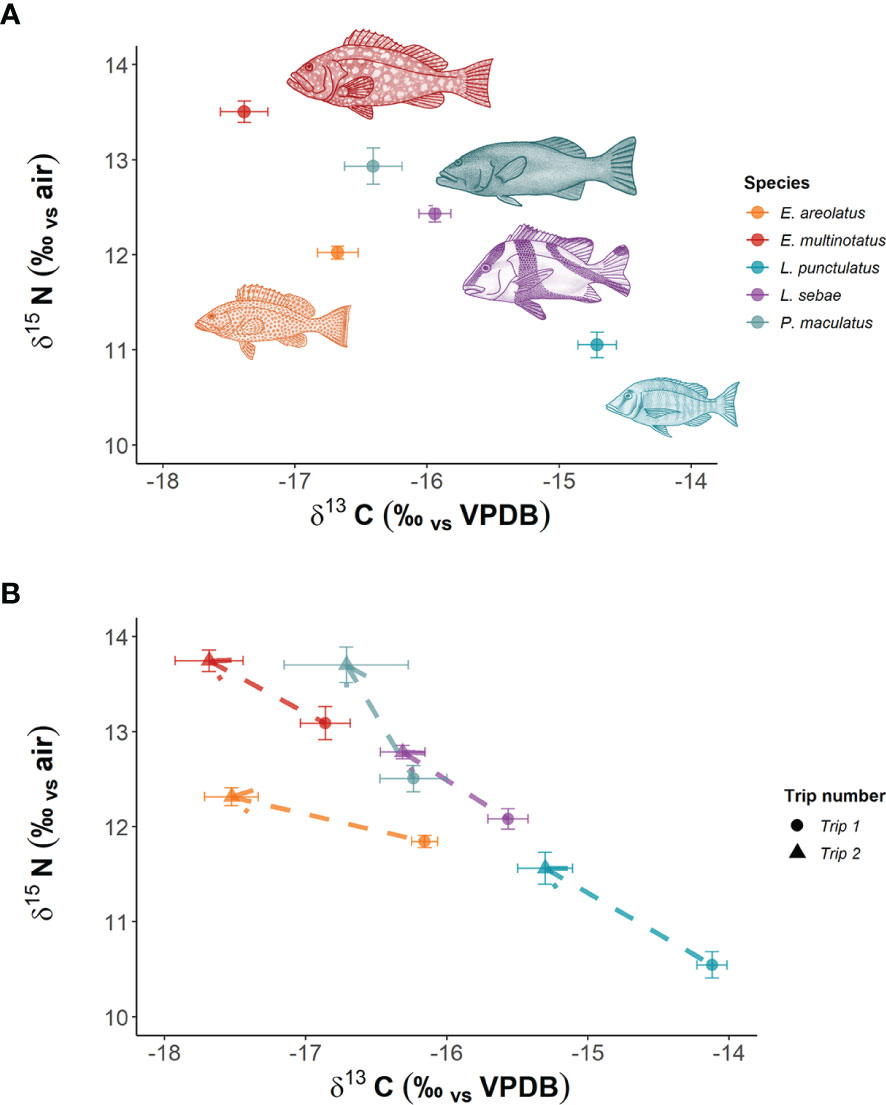
Figure 2 Mean isotopic signatures of predatory fish species in NW Australia. Panel (A) shows overall mean values for both trips combined, while Panel (B) shows means per trip. Dashed lines with arrows indicate direction of trend between trips.
Patterns in δ13C were opposite to those of δ15N, with highest mean δ13C in L. punctulatus (-14.71 ± 0.14) and the lowest in E. multinotatus (-17.38 ± 0.17). δ13C ranged between 3.04 and 4.77‰ across species. The effect of sampling trip on δ13C was significant (P = <0.001) (Figure 2B), as was the effect of location (P = 0.001) (Supp. Figure 1).
There was considerable overlap of isotopic niches across all species observed, with E. areolatus having the most restricted isotopic niche space (Figure 3). The greatest level of overlap of 95% niche region size occurred between L. sebae and P. maculatus 89.41% (Table 2 and Supplementary Figure 2), whereas the lowest occurred between E. multinotatus and L. punctulatus 10.58%, followed by E. multinotatus and E. areolatus 11.69%. Isotopic niche size estimates were similar for E. multinotatus (10.86 ± 2.05 Se), L. punctulatus (10.00 ± 1.60 Se), and P. maculatus (9.44 ± 2.60 Se) (Supplementary Figure 3). Estimates of isotopic niche size were however considerably smaller for L. sebae (6.64 ± 1.05 Se) and E. areolatus (4.95 ± 0.93 Se).
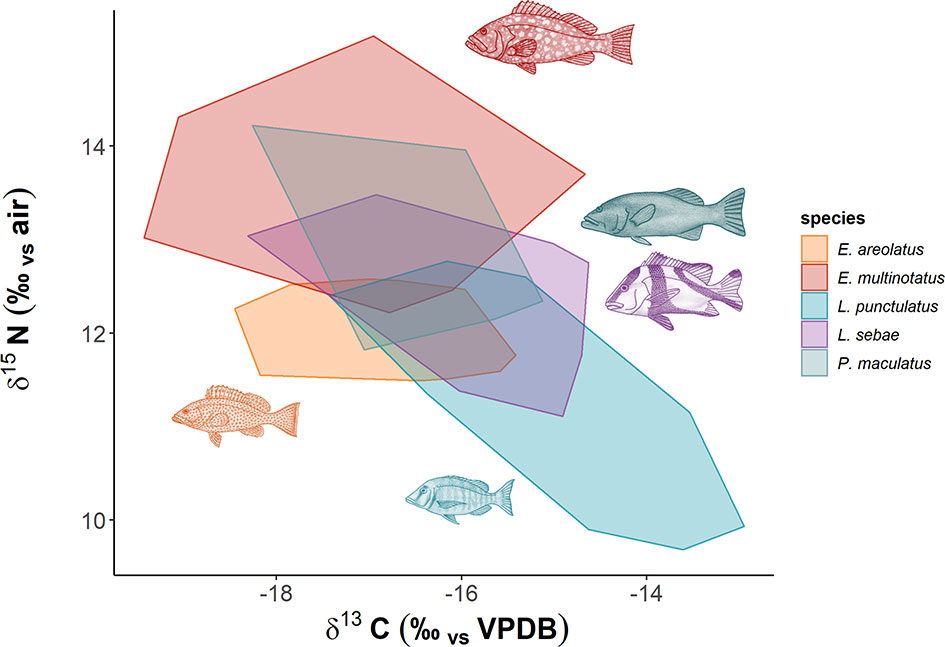
Figure 3 Isotopic niche space of predatory fish species. Each minimum convex polygon encompasses all δ13C and δ15N values of individuals for each species.
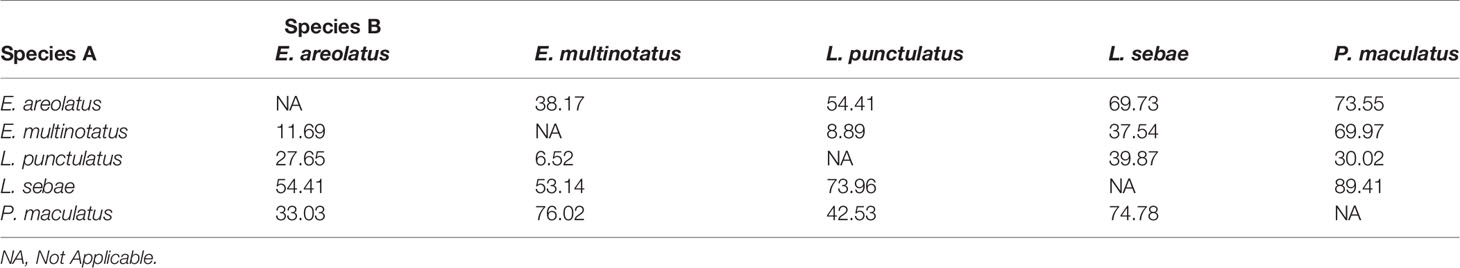
Table 2 Mean probabilistic niche overlap metrics (%) for 95% niche region size for predatory fish.
Kernel densities of species body lengths of all species did not differ between sampling trips (Figure 4). There was a positive relationship with δ15N (p =<0.001, R2 = 0.64) and body length for each species of fish, with the strongest relationships for L. sebae and P. maculatus at R2values of 0.37 and 0.32, respectively (Figure 5). No significant relationship between δ13C and body length was observed for individual species (Supplementary Figure 4).
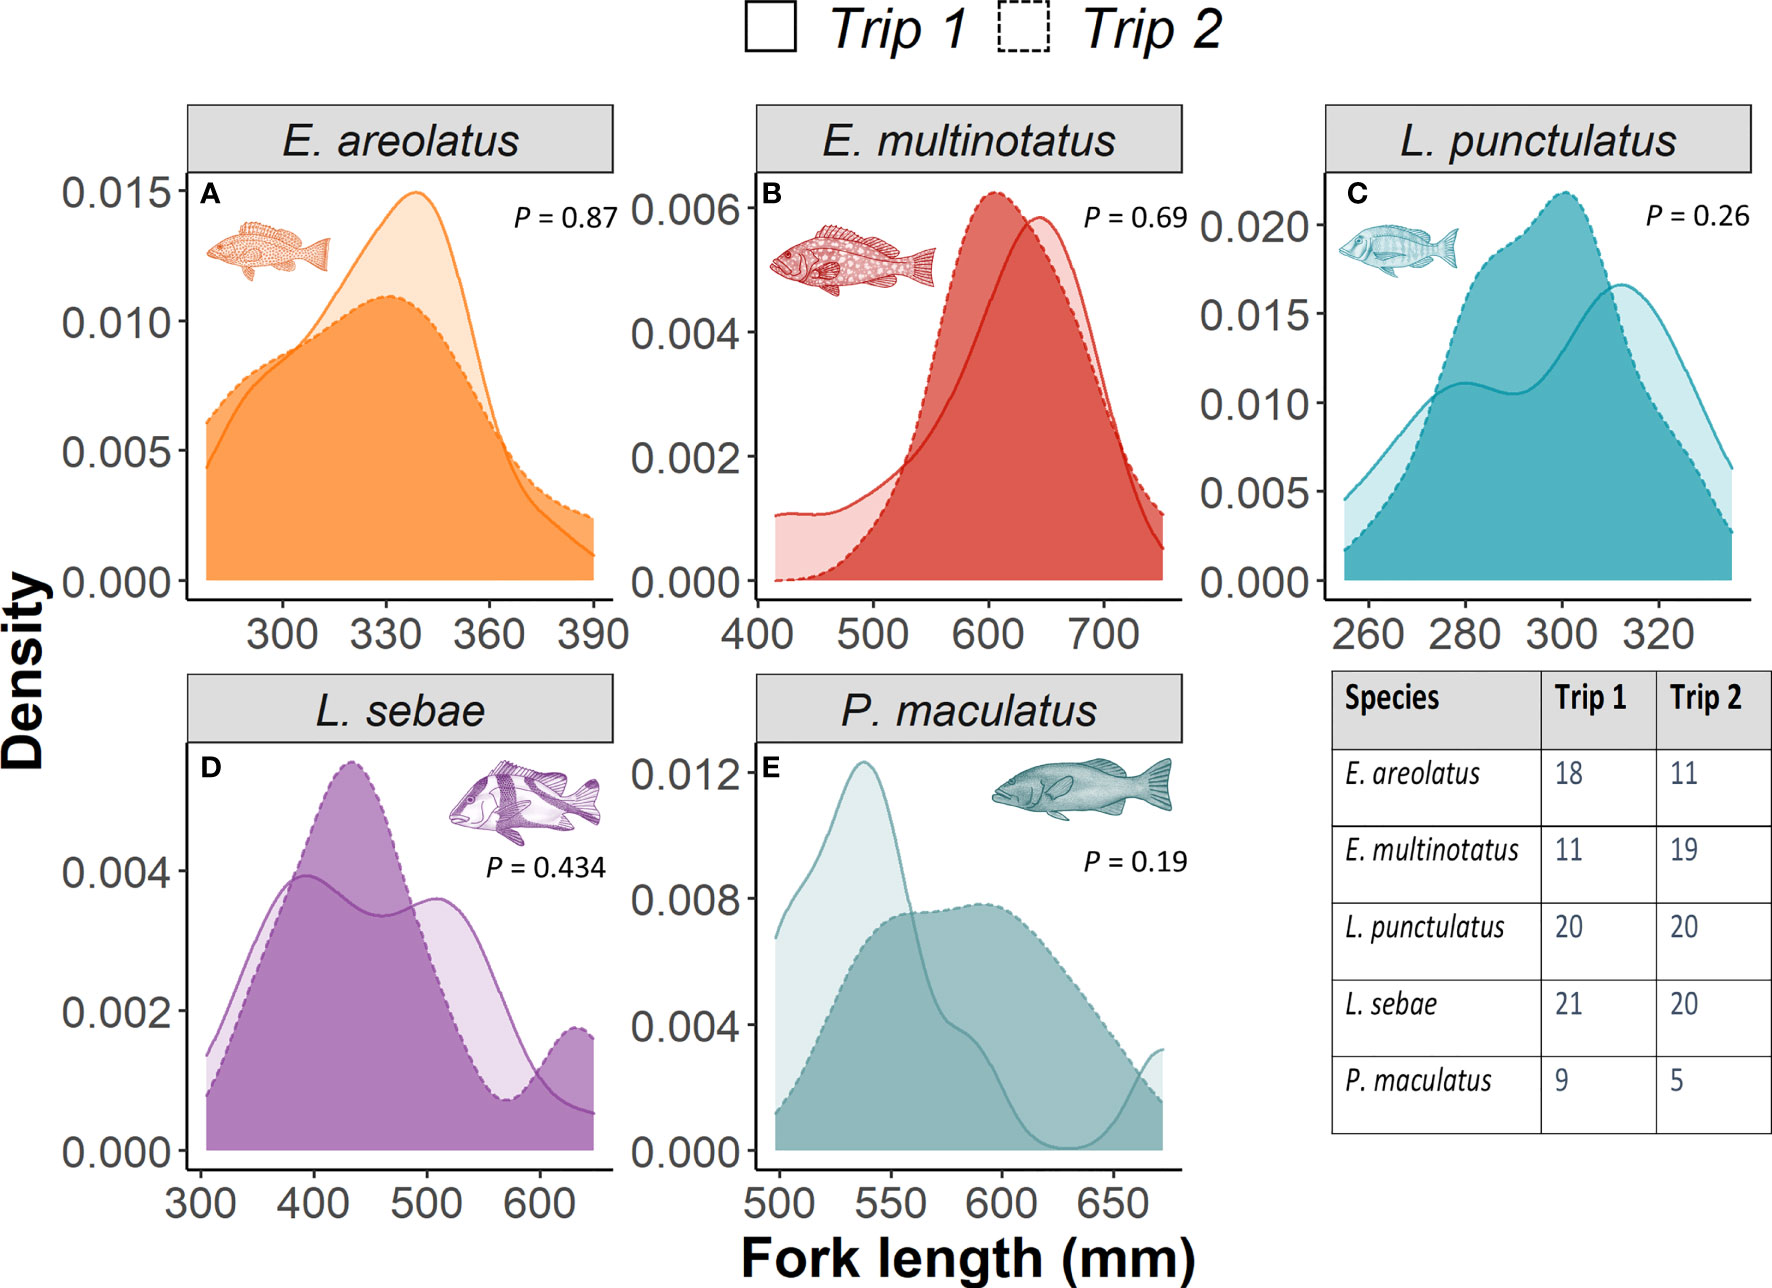
Figure 4 A comparison of kernel density distributions for fork length of each fish species between trips. P values represent KS test result for significance. The table inset provides number of individuals measured for each trip.
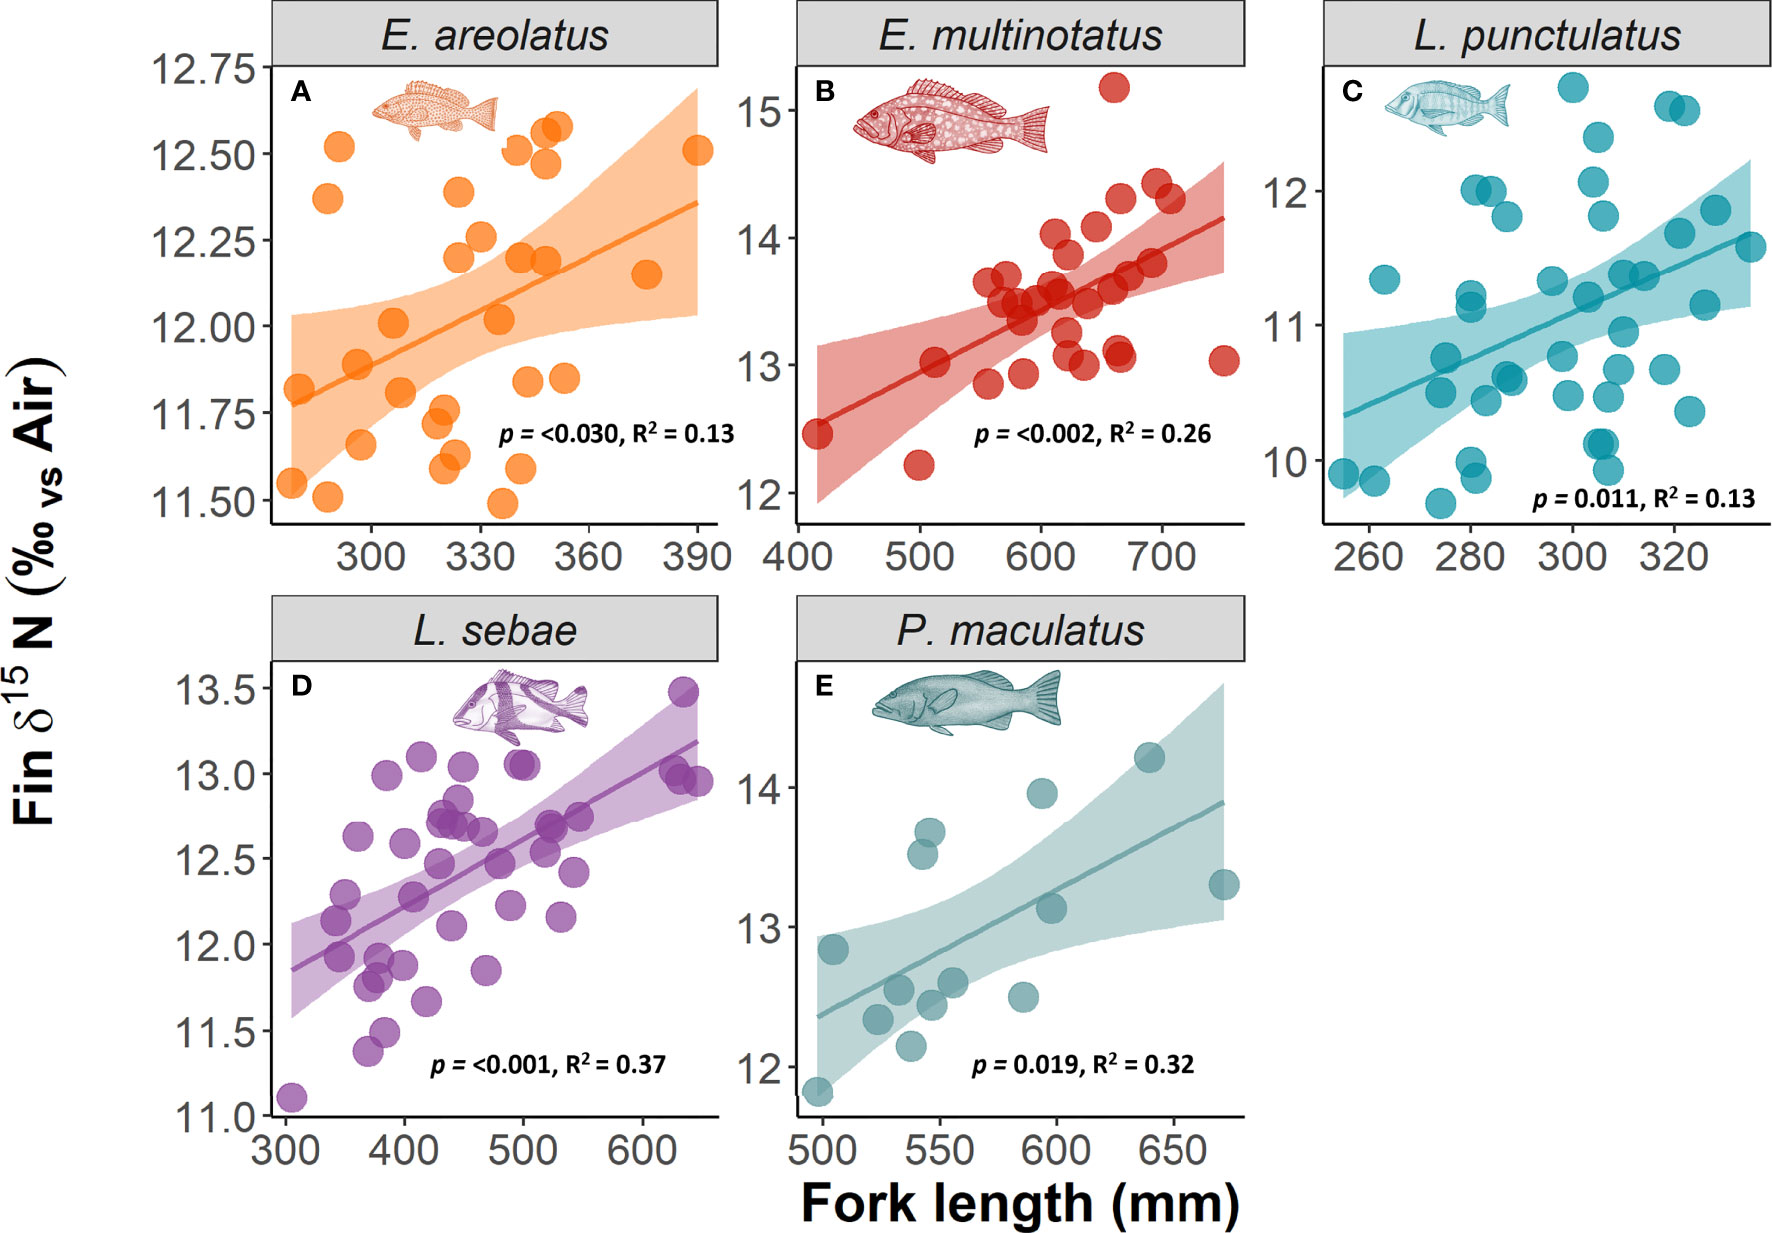
Figure 5 The relationship between δ15N and body length of fish. Significant relationships in bold text.
The comparison of δ13C and δ15N obtained from multiple tissue samples (dorsal fin and dorsal muscle) for L. sebae indicated significant positive relationships for both δ15N (P = <0.001, R2 = 0.7) and δ13C (P = 0.03, R2 = 0.18) (Figure 6). Mean isotopes for δ15N were the same in both fin and muscle tissue (12.1 ± 0.10 SE and 12.1 ± 0.09 SE respectively). However, mean δ13C was higher in fin tissue compared to muscle tissue (-15.6 ± 0.14 SE and -17.3 ± 0.11 SE respectively), (Paired t = 13.087, df = 19, p = <0.001). Only δ15N significantly increased (p = <0.001) with fish body length for both fin and muscle tissue (fin R2 = 0.73 muscle R2 = 0.76) (Supplementary Figure 5).
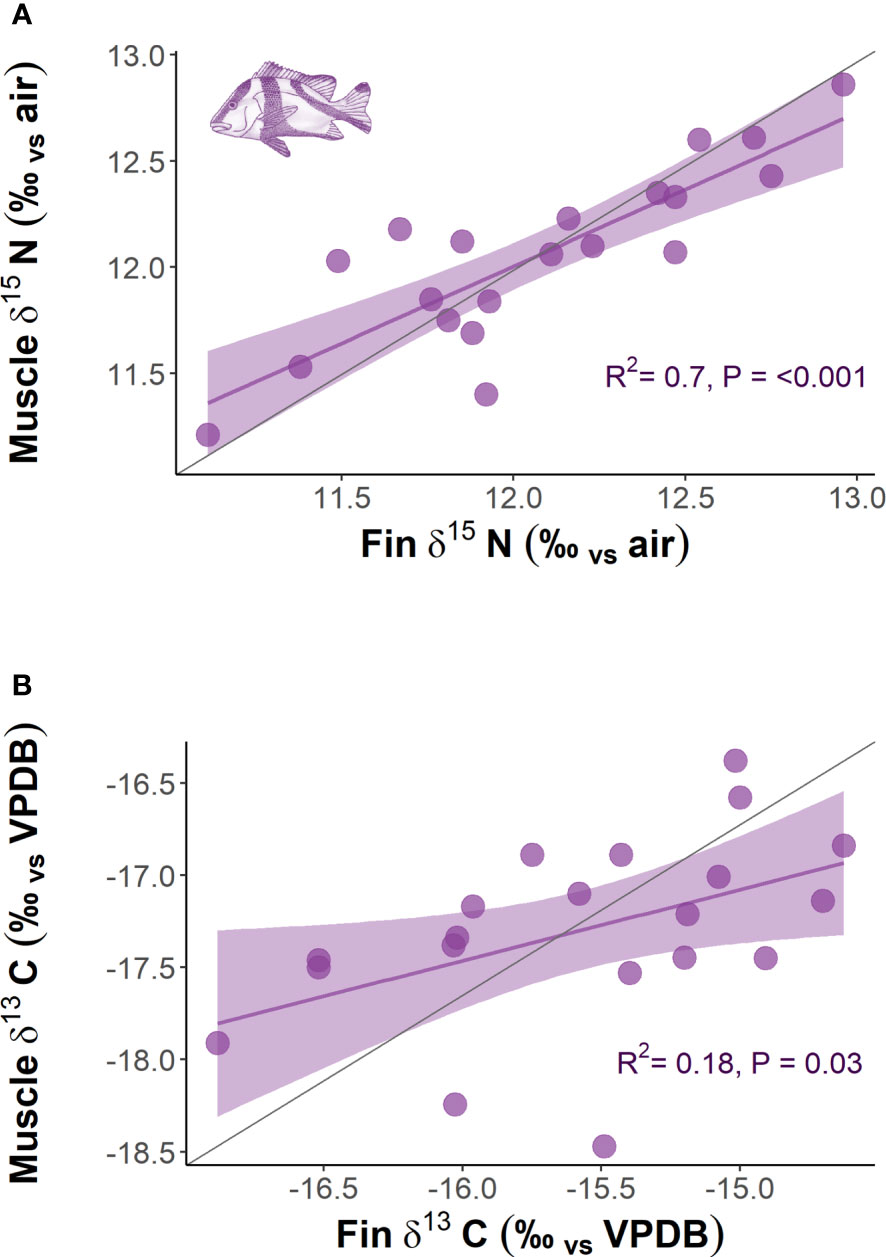
Figure 6 The relationship between (A) δ15N of dorsal muscle with fin tissue and (B) δ13C of dorsal muscle with fin tissue for L. sebae. The grey line represents the 1:1 slope.
Dietary Information From Gastrointestinal Tract Contents
Of the stomachs extracted, approximately 60% were empty and 26% contained fish remains consistent with the bait used in traps (Table 3). The analysis of items identified from the gastrointestinal tract (GIT) highlighted the most dominant prey item for each of the five species was unidentified fish remains (e.g., scales, fish bones and spines) with (F%) ranging from 9.1 – 60 (Table 3). The larger species (E. multinotatus and P. maculatus) had high proportions of amorphic organic matter (AOM) in either the stomach or GIT (52% and 60% respectively).
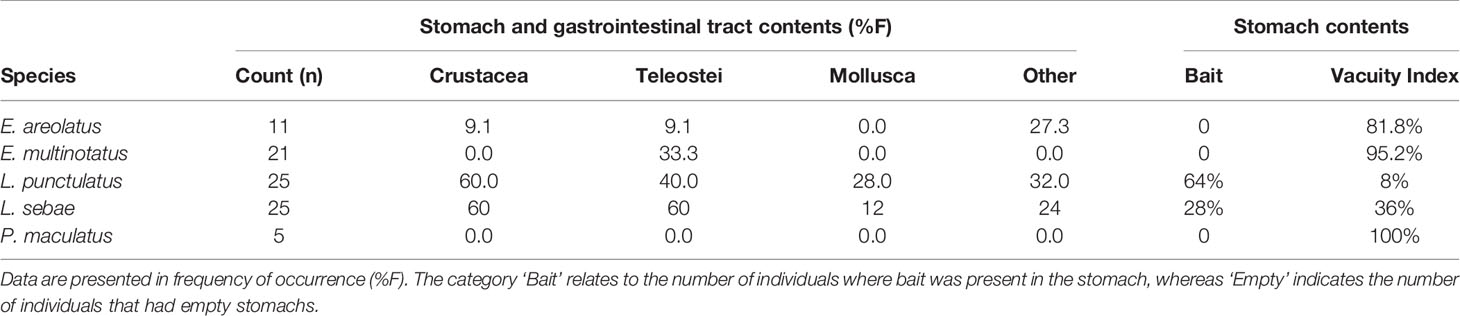
Table 3 Summary of stomach and gastrointestinal tract contents of predatory fishes.
Discussion
There was evidence of separation of the five predatory species in isotopic space, suggesting differences in dietary sources and trophic structure, which was partially confirmed by items present in the stomach and GIT for some species. The range of δ15N‰ between the smallest species in our study (L. punctulatus) and the largest (E. multinotatus) was within the range of trophic discrimination factors (TDF) that indicate likely predation within this group of predators (e.g. Wyatt et al., 2010; Matley et al., 2016; Canseco et al., 2021). Indeed, E. multinotatus was observed to predate on both L. punctulatus and E. areolatus while in the traps during this study (pers. obs.). It is possible however, that other factors not explored in our study may have influenced TDFs of these predatory fish species, such as water temperature, tissue types, growth rates, and prey type (Canseco et al., 2021).
The low values of δ13C (-18 to -15‰) for all species were indicative of a food chain driven by benthic productivity (France, 1995), as has been observed for mesophotic fish communities in the East/Japan Sea (e.g. Park et al., 2020). Similarly, studies that have assessed δ13C values of primary producers, consumers, and particulate organic matter in shallow coastal areas of North-Western Australia provide reference ranges for planktonic sources between -24 to -19‰ and benthic producers predominantly ranging between -16 and -7‰ (Vergès et al., 2011; Vanderklift et al., 2016). A reliance on benthic production has also been previously observed for large predatory fish species (reef sharks) in shallower, coastal waters of North-western Australia (e.g., Speed et al., 2012). Similarly, studies focussing on emperors and groupers from other regions such as the Seychelles also found comparable δ13C values for E. multinotatus and L. sebae to our study (Sardenne et al., 2017) and one study of P. maculatus on the Great Barrier Reef estimated that 89% of its δ13C was derived from benthic production (Frisch et al., 2014).
Both δ13C and δ15N differed for each species between sampling periods, suggesting that there were seasonal differences or potentially a dietary shift over the three-month period between sample collection. Unfortunately, only limited numbers of stomachs were collected in the first trip (primarily L. sebae), so a comparison of GIT contents between sampling periods was not possible for most species. However, Lutjanus sebae caught at Location 1 during the first trip when δ15N was lower, had a predominance of crustacean prey items in guts, whereas teleosts were a much greater part of the diet in the second trip, when δ15N in diets was higher. This may indicate a shift in diet between seasons for this species or the changes in availability of prey. Alternatively, there might also be strong seasonal differences in the source of primary productivity in these food webs, as occurs in other fisheries (Abrantes et al., 2015). Indeed, seasonal enhancement of chlorophyll a concentrations at Ningaloo Reef in North-western Australia have been shown to be driven by an acceleration of the Leeuwin Current (Rousseaux et al., 2012), and fluxes in particulate organic matter composition across a reef have been observed through wind-driven upwelling (Wyatt et al., 2013). Unfortunately, a detailed assessment of productivity was beyond the scope of the current project. Seasonal differences in stable isotope ratios can also be related to a range of other variables, such as changes in light, temperature, salinity, fluctuations in food availability, or variation in feeding due to the life stage of consumer, sex, or physiology (Hyndes et al., 2013). Given the restricted range of length distributions of the species we sampled (adult fishes), life stage is unlikely to have been a major factor contributing to the observed differences in our study. Furthermore, a considerable change in growth rate between sampling periods (separated by three months) for adult fish was deemed unlikely to have been a major influencing factor on stable isotope values of these species. Indeed, a controlled feeding trial of medium to large sized coral groupers (Plectropomus leopardus) found that most 15N incorporation was driven by metabolism, rather than growth (Matley et al., 2016).
The δ13C ‰ for most species also varied between locations, which suggests that these demersal species are limited in their foraging range (Supplementary Figure 1). Restricted movement of L. sebae was confirmed in a concurrent telemetry study, which showed no dispersal of tagged individuals between the two study locations over a six-month period (Meekan et al., 2021). Other telemetry studies of tropical demersal fishes have also found limited movement, home ranges, and activity spaces of tagged individuals (e.g. Zeller, 1997; Taylor and Mills, 2013; Currey et al., 2014). Despite this tendency for restricted and repeated fidelity to small areas, longer migrations have also been observed, possibly due to reproduction, as is the case for Lethrinus nebulosus (e.g. Babcock et al., 2017a). The individuals in our study were primarily adults, however, juveniles of L. punctulatus (< 20 cm TL) are known to spend their early life in inshore macroalgal habitat before migrating offshore (Babcock et al., 2017b), where presumably they also undergo changes in diet. This species had the highest enrichment of δ13C, which may be a residual signature from inshore feeding, although there was no evidence of smaller individuals having higher δ13C values than larger individuals (Supplementary Figure 4) as might be expected if this was a result of ontogenetic changes in habitats. High overlap of both δ13C and δ15N between locations for L. punctulatus suggests that they may have a less specialised, and less location-specific diet compared to the other species, which was also reflected in their stomach and GIT content (i.e., all groups of prey were represented).
Isotopic niche overlap was high (>89%) between L. sebae and P. maculatus, suggesting they are targeting prey within similar trophic levels (Supplementary Figure 2). Unfortunately, we were unable to confirm this finding due to P. maculatus having mostly empty stomach and GIT contents. However, L. sebae did have a high proportion of teleosts in the gut samples (60%), confirming their reliance on other species of fish as a source of nutrients, as has been observed previously (Salini et al., 1994). Similarly, diet studies on coral reefs have also confirmed that P. maculatus are primarily piscivorous (Kingsford, 1992; St John, 1999) and tend to feed on benthic and midwater prey, compared to other species within the genus Plectropomus, which feed on planktonic prey (Matley et al., 2018). The largest (E. multinotatus) and smallest (L. punctulatus) species observed in our study had minimal niche overlap (≈9%), which was unsurprising given the difference in body size (Max TL 100 cm and 38.4 cm respectively) (Bray and Gomon, 2021; Newman et al., 2021), although there is currently little information available for the diet of either of these species (Farmer and Wilson, 2011). Dietary information from stomach and GIT content analysis was limited for E. multinotatus, with 20 of 21 gut samples being empty. This is likely due to a lifestyle of infrequent feeding, which is thought to be common in large piscivores (Vinson and Angradi, 2011), but may be a consequence of stomach eversion due to barotrauma when fish are raised from depth. Indeed, both stomach vacuity (being empty due to infrequent feeding) and regurgitation have been reported in coral reef grouper and snapper by other studies (Vignon and Dierking, 2011).
It is important to note here that while we observed minimal overlap in isotopic niche space for some species, this may not necessarily equate directly to trophic niche differences. Indeed, trophic niche can be considered synonymous to isotopic niche only when it is primarily driven by consumer-resource interactions (Yeakel et al., 2016), which may indeed be the case with our study, although without spatially and temporally relevant environmental measurements that may affect assimilated isotope values, it is difficult to assess. Isotopic niche extent has been shown to be dependent on sampling scale (Reddin et al., 2018), with fine-scale sampling having lower environmental heterogeneity. Given the limited spatial and temporal scale of sampling in our study, environmental heterogeneity is unlikely to have had a major influence on isotope values, which provides some confidence in comparisons of isotopic and trophic niche spaces.
Frequency distributions of body length were consistent across both sampling periods for all species, although there was a slight, albeit non-significant difference for P. maculatus, likely as a result of a low sample size. The size range for all species primarily included mature individuals, which are targeted by the commercial trap and line fishery in the region. Therefore, any differences in isotopic signatures observed between trips was unlikely to be a result of differing distributions or life history stage between trips. Body length was found to have a positive relationship with δ15N, which likely reflects increased size (e.g. St John, 1999) or trophic level (e.g. Costa, 2009; Dalponti et al., 2018) of prey items consumed. Despite a positive relationship between fin and muscle tissue for both δ13C and δ15N in L. sebae, there was no evidence of a difference in the enrichment of δ15N between the different tissue types for this species. However, this was not true for δ13C, which was significantly more enriched in fin tissue compared to muscle tissue, a pattern that has also been observed in other species of finfish (e.g. Willis et al., 2013) and sharks (e.g. Matich et al., 2010), although see Jardine et al. (2011). The closely matching values of δ15N for both tissues in L. sebae provides some evidence that using this isotope from fin tissue clips is a good proxy for muscle tissue. This may not be the case with other species, and any tissue corrections should be tested on a species-specific basis (Willis et al., 2013).
The most common identifiable prey items based on stomach and GIT analyses were fish parts (scales and bones) followed by crustacean parts (limbs, claws, carapaces), as has also been previously identified for a species of snapper in north-west Australia, the saddle tail snapper (Lutjanus malabaricus) (Takahashi et al., 2020). We found that a high proportion of stomachs were empty, or contained the bait used in our fish traps. For this reason, the GIT contents were usually more informative than the stomach contents, although the drawback with this approach is that by the time prey items had progressed through the stomach, only hard components remained intact. The contents from GIT are therefore biased towards hard materials, particularly those found in fish bones and scales (e.g., collagen), and crustacean exoskeletons (e.g., chitin), and other calcium carbonate structures (e.g., mollusc shells). Several individuals, particularly from the larger species (E. multinotatus and P. maculatus), had amorphic organic matter (AOM) present in their GIT, which may have been partially digested fish remains. Future studies could adopt the use of DNA metabarcoding to help provide further resolution to identify the remains of this prey (e.g. Casey et al., 2019; Takahashi et al., 2020). Furthermore, we also advocate the collection of gut and molecular samples across all species and trips in future work, as this would provide enough data to support the potential diet shift, we observed for L. sebae. Additionally, collection of isotope samples from primary producers would provide Nbase, which would allow the calculation of trophic positions of predatory fish, enable mixing models to estimate the source of dietary carbon and nitrogen, and also give an indication of seasonal fluxes that could be used to help better interpret findings.
The coarse level of dietary information obtained in our study, along with community trophic structure inferred from stable isotopes are required to help form a complete picture of food-webs, which are often lacking for many important fishery species and are needed for the development of ecosystem based models to assist management (Abrantes et al., 2015). Of particular importance to modelling, is the understanding of trophic pathways and associated implications for the removal of predators from an ecosystem (Farmer and Wilson, 2011), such as the group of species of commercially important fish that were the focus of the current project. For example, some of the smaller to mid-sized fish in our study such as L. punctulatus and L. sebae had large percentages of crustaceans in their diet, while trophic discrimination factors of δ15N among these predators with some of the larger sized species such as E. multinotatus suggested predation within this guild. Diet varies among and within species targeted by fishers and the impact of fishing on prey and predator communities will depend on the species and quantity of fish removed (Farmer and Wilson, 2011). Therefore, our findings will be of importance to current approaches to fishery management that rely on protection via static closures and bag and size limits of fish.
Conclusion
Our multi-facetted approach to defining trophic structure of a demersal predatory fish community identified differences in the isotopic niches occupied, although there was of overlap in diet for some of these species (e.g., L. sebae and L. punctulatus). The low values of δ13C in fish indicated a benthic driven food-web, which fluctuated through time, either due to environmental or biological drivers. Location-specific δ13C signatures in all species were indicative of animals with a restricted foraging range, which is consistent with our understanding of the limited movement patterns in demersal predatory fishes. A positive relationship with δ15N and body length was also consistent across species and provided evidence of inter-guild predation between the larger (E. multinotatus and P. maculatus) and smaller species (e.g., L. punctulatus and E. areolatus). Similarities of δ15N between muscle and fin tissue for L. sebae provided strong evidence for the use of fins as a non-lethal technique for sampling isotopes, although we were unable to compare multiple tissues for all species. Examination of both stomach and GIT contents for each species was informative for some species and partially confirmed patterns observed using stable isotopes, although the high proportion of empty stomachs limited comparisons. Our study highlights the complex spatial and temporal trophodynamics among predatory fish communities in a demersal shelf ecosystem and provides information that could contribute to ecosystem-based models to assist in the management of this commercially important guild.
Data Availability Statement
The raw data supporting the conclusions of this article will be made available by the authors, without undue reservation.
Ethics Statement
The animal study was reviewed and approved by The University of Western Australia Animal Ethics Committee.
Author Contributions
CS, MM, MB, MP, and BT collected data used in the manuscript. All authors assisted in conceptualising the idea for the manuscript. CS, MM, MB, MP, DM, BT, LT, JS, and SN made substantial contributions to drafting the manuscript, searching the literature, and interpreting results. All authors participated in drafting the final version of the manuscript and gave final approval of the version submitted and any revised versions.
Funding
The data for this study were collected as part of the Australian Institute of Marine Science’s Northwest Shoals to Shore Research Program, supported by Santos as part of their commitment to better understanding Western Australia’s marine environment.
Conflict of Interest
The authors declare that the research was conducted in the absence of any commercial or financial relationships that could be construed as a potential conflict of interest.
Publisher’s Note
All claims expressed in this article are solely those of the authors and do not necessarily represent those of their affiliated organizations, or those of the publisher, the editors and the reviewers. Any product that may be evaluated in this article, or claim that may be made by its manufacturer, is not guaranteed or endorsed by the publisher.
Acknowledgments
We thank P. Farrell, L. Currey-Randall, A. Schlaff, B. Vaughan, J. Baker, G. Mitsopoulos and the crew of the RV Solander for assistance with field work. We thank S. Arklie for assistance with the fish tissue sample organisation. Fish were collected using DPIRD Exemption No. 3114 and approval by the University of Western Australia Animal Ethics Committee (RA/3/100/1591). In accordance with DPIRD permit requirements, all by-catch not being retained for further analysis was returned to the ocean at the capture location. Isotope processing and analysis were undertaken by D. Ford at West Australian Biogeochemistry Centre, University of Western Australia. We thank Peter Farrell and Michaela Dommisse for project management. AIMS acknowledges the Ngarluma, Yindjibarndi and Kariyarra People as Traditional Owners of Country adjacent to the areas where the work was undertaken. We recognise these People’s ongoing spiritual and physical connection to Country and pay our respects to their Aboriginal Elders past, present and emerging.
Supplementary Material
The Supplementary Material for this article can be found online at: https://www.frontiersin.org/articles/10.3389/fmars.2022.871611/full#supplementary-material
References
Abrantes K. G., Barnett A., Baker R., Sheaves M. (2015). Habitat-Specific Food Webs and Trophic Interactions Supporting Coastal-Dependent Fishery Species: An Australian Case Study. Rev. Fish. Biol. Fish. 25, 337–363. doi: 10.1007/s11160-015-9385-y
Abrantes K. G., Semmens J. M., Lyle J. M., Nichols P. D. (2012). Normalisation Models for Accounting for Fat Content in Stable Isotope Measurements in Salmonid Muscle Tissue. Mar. Biol. 159, 57–64. doi: 10.1007/s00227-011-1789-1
Amundsen P. A., Sánchez-Hernández J. (2019). Feeding Studies Take Guts–Critical Review and Recommendations of Methods for Stomach Contents Analysis in Fish. J. Fish. Biol. 95, 1364–1373. doi: 10.1111/jfb.14151
Asher J., Williams I. D., Harvey E. S. (2017). An Assessment of Mobile Predator Populations Along Shallow and Mesophotic Depth Gradients in the Hawaiian Archipelago. Sci. Rep. 7, 3905. doi: 10.1038/s41598-017-03568-1
Babcock R. C., Donovan A., Collin S., Ochieng-Erftemeijer C. (2017b). Pilbara Marine Conservation Partnership – Final Report (Brisbane: CSIRO).
Babcock R., Pillans R., Rochester W. (2017a). Environmental and Individual Effects on the Behaviour and Spawning Movements of Lethrinus Nebulosus on a Coral Reef. Mar. Freshw. Res. 68, 1422–1437. doi: 10.1071/MF16194
Baker R., Buckland A., Sheaves M. (2014). Fish Gut Content Analysis: Robust Measures of Diet Composition. Fish. 15, 170–177. doi: 10.1111/faf.12026
Bascompte J., Melian C. J., Sala E. (2005). Interaction Strength Combinations and the Overfishing of a Marine Food Web. Proc. Natl. Acad. Sci. United States America 102, 5443–5447. doi: 10.1073/pnas.0501562102
Bierwagen S. L., Pethybridge H., Heupel M. R., Chin A., Simpfendorfer C. A. (2019). Trophic Niches Determined From Fatty Acid Profiles of Sympatric Coral Reef Mesopredators. Mar. Ecol. Prog. Ser. 632, 159–174. doi: 10.3354/meps13150
Bird C. S., Veríssimo A., Magozzi S., Abrantes K. G., Aguilar A., Al-Reasi H., et al. (2018). A Global Perspective on the Trophic Geography of Sharks. Nat. Ecol. Evol. 2, 299–305. doi: 10.1038/s41559-017-0432-z
Boaden A., Kingsford M. J. (2015). Predators Drive Community Structure in Coral Reef Fish Assemblages. Ecosphere 6, 1–33. doi: 10.1890/ES14-00292.1
Braccini J. M. (2008). Feeding Ecology of Two High-Order Predators From South-Eastern Australia: The Coastal Broadnose and the Deepwater Sharpnose Sevengill Sharks. Mar. Ecol. Prog. Ser. 371, 273–284. doi: 10.3354/meps07684
(2021) Fishes of Australia (Museums Victoria and OzFishNet). Available at: https://fishesofaustralia.net.au/home/species/4416 (Accessed 08 Nov 2021).
Canseco J., Niklitschek E., Harrod C. (2021). Variability in δ13c and δ15n Trophic Discrimination Factors for Teleost Fishes: A Meta-Analysis of Temperature and Dietary Effects. Rev. Fish. Biol. Fish. 1-17:313–329. doi: 10.1007/s11160-021-09689-1
Casey J. M., Baird A. H., Brandl S. J., Hoogenboom M. O., Rizzari J. R., Frisch A. J., et al. (2017). A Test of Trophic Cascade Theory: Fish and Benthic Assemblages Across a Predator Density Gradient on Coral Reefs. Oecologia 183, 161–175. doi: 10.1007/s00442-016-3753-8
Casey J. M., Meyer C. P., Morat F., Brandl S. J., Planes S., Parravicini V. (2019). Reconstructing Hyperdiverse Food Webs: Gut Content Metabarcoding as a Tool to Disentangle Trophic Interactions on Coral Reefs. Methods Ecol. Evol. 10, 1157–1170. doi: 10.1111/2041-210X.13206
Coplen T. B., Brand W. A., Gehre M., Gröning M., Meijer H. A., Toman B., et al. (2006). New Guidelines for δ 13C Measurements. Anal. Chem. 78, 2439–2441. doi: 10.1021/ac052027c
Costa G. C. (2009). Predator Size, Prey Size, and Dietary Niche Breadth Relationships in Marine Predators. Ecology 90, 2014–2019. doi: 10.1890/08-1150.1
Currey L. M., Heupel M. R., Simpfendorfer C. A., Williams A. J. (2014). Sedentary or Mobile? Variability in Space and Depth Use of an Exploited Coral Reef Fish. Mar. Biol. 161, 2155–2166. doi: 10.1007/s00227-014-2497-4
Dalponti G., Guariento R. D., Caliman A. (2018). Hunting High or Low: Body Size Drives Trophic Position Among and Within Marine Predators. Mar. Ecol. Prog. Ser. 597, 39–46. doi: 10.3354/meps12584
Estes J. A., Terborgh J., Brashares J. S., Power M. E., Berger J., Bond W. J., et al. (2011). Trophic Downgrading of Planet Earth. science 333, 301–306. doi: 10.1126/science.1205106
Farmer B. M., Wilson S. K. (2011). Diet of Finfish Targeted by Fishers in North West Australia and the Implications for Trophic Cascades. Environ. Biol. Fishes 91, 71–85. doi: 10.1007/s10641-010-9761-3
Ferreira L. C., Thums M., Heithaus M. R., Barnett A., Abrantes K. G., Holmes B. J., et al. (2017). The Trophic Role of a Large Marine Predator, the Tiger Shark Galeocerdo Cuvier. Sci. Rep. 7, 7641. doi: 10.1038/s41598-017-07751-2
France R. L. (1995). C-13 Enrichment in Benthic Compared to Planktonic Algae - Foodweb Implications. Mar. Ecol-Prog. Ser. 124, 307–312. doi: 10.3354/meps124307
Frisch A. J., Ireland M., Baker R. (2014). Trophic Ecology of Large Predatory Reef Fishes: Energy Pathways, Trophic Level, and Implications for Fisheries in a Changing Climate. Mar. Biol. 161, 61–73. doi: 10.1007/s00227-013-2315-4
Frisch A. J., Ireland M., Rizzari J. R., Lönnstedt O. M., Magnenat K. A., Mirbach C. E., et al. (2016). Reassessing the Trophic Role of Reef Sharks as Apex Predators on Coral Reefs. Coral Reefs 35, 459–472. doi: 10.1007/s00338-016-1415-2
Galván D. E., Funes M., Liberoff A. L., Botto F., Iribarne O. O. (2015). Important Sources of Variation to be Considered When Using Fin Clips as a Surrogate for Muscle in Trophic Studies Using Stable Isotopes. Mar. Freshw. Res. 66, 730–738. doi: 10.1071/MF13346
German D. P., Miles R. D. (2010). Stable Carbon and Nitrogen Incorporation in Blood and Fin Tissue of the Catfish Pterygoplichthys Disjunctivus (Siluriformes, Loricariidae). Environ. Biol. Fishes 89, 117–133. doi: 10.1007/s10641-010-9703-0
Graham N., Evans R., Russ G. (2003). The Effects of Marine Reserve Protection on the Trophic Relationships of Reef Fishes on the Great Barrier Reef. Environ. Conserv. 30, 200–208. doi: 10.1017/S0376892903000195
Harvey E. S., Newman S. J., Mclean D. L., Cappo M., Meeuwig J. J., Skepper C. L. (2012). Comparison of the Relative Efficiencies of Stereo-BRUVs and Traps for Sampling Tropical Continental Shelf Demersal Fishes. Fish. Res. 125, 108–120. doi: 10.1016/j.fishres.2012.01.026
Heady W. N., Moore J. W. (2013). Tissue Turnover and Stable Isotope Clocks to Quantify Resource Shifts in Anadromous Rainbow Trout. Oecologia 172, 21–34. doi: 10.1007/s00442-012-2483-9
Hixon M. A. (2015). Predation: Piscivory and the Ecology of Coral-Reef Fishes. Ecol. Fishes Coral Reefs (University Printing House, Cambridge CB2 8BS, United Kingdom: Cambridge University Press), 41–53. doi: 10.1017/CBO9781316105412.007
Hixon M. A., Beets J. P. (1993). Predation, Prey Refuges, and the Structure of Coral-Reef Fish Assemblages. Ecol. Monogr. 63, 77–101. doi: 10.2307/2937124
Holt R. E., Bogstad B., Durant J. M., Dolgov A. V., Ottersen G. (2019). Barents Sea Cod (Gadus Morhua) Diet Composition: Long-Term Interannual, Seasonal, and Ontogenetic Patterns. ICES J. Mar. Sci. 76, 1641–1652. doi: 10.1093/icesjms/fsz082
Hyndes G. A., Hanson C. E., Vanderklift M. A. (2013). The Magnitude of Spatial and Temporal Variation in δ15n and δ13c Differs Between Taxonomic Groups: Implications for Food Web Studies. Estuar. Coast. Shelf Sci. 119, 176–187. doi: 10.1016/j.ecss.2012.12.015
Hyslop E. (1980). Stomach Contents Analysis—a Review of Methods and Their Application. J. Fish. Biol. 17, 411–429. doi: 10.1111/j.1095-8649.1980.tb02775.x
Jardine T. D., Hunt R. J., Pusey B. J., Bunn S. E. (2011). A non-Lethal Sampling Method for Stable Carbon and Nitrogen Isotope Studies of Tropical Fishes. Mar. Freshw. Res. 62, 83–90. doi: 10.1071/MF10211
Jennings S., Polunin N. (1997). Impacts of Predator Depletion by Fishing on the Biomass and Diversity of Non-Target Reef Fish Communities. Coral reefs 16, 71–82. doi: 10.1007/s003380050061
Kingsford M. (1992). Spatial and Temporal Variation in Predation on Reef Fishes by Coral Trout (Plectropomus Leopardus, Serranidae). Coral reefs 11, 193–198. doi: 10.1007/BF00301993
Langlois T. J., Fitzpatrick B. R., Fairclough D. V., Wakefield C. B., Hesp S. A., Mclean D. L., et al. (2012). Similarities Between Line Fishing and Baited Stereo-Video Estimations of Length-Frequency: Novel Application of Kernel Density Estimates. PloS One 7, e45973. doi: 10.1371/journal.pone.0045973
Langlois T. J., Wakefield C. B., Harvey E. S., Boddington D. K., Newman S. J. (2021). Does the Benthic Biota or Fish Assemblage Within a Large Targeted Fisheries Closure Differ to Surrounding Areas After 12 Years of Protection in Tropical Northwestern Australia? Mar. Environ. Res. 170, 105403. doi: 10.1016/j.marenvres.2021.105403
Lester E. K., Langlois T. J., Simpson S. D., Mccormick M. I., Meekan M. G. (2020). The Hemisphere of Fear: The Presence of Sharks Influences the Three Dimensional Behaviour of Large Mesopredators in a Coral Reef Ecosystem. Oikos 129, 731–739. doi: 10.1111/oik.06844
Levin S. A., Lubchenco J. (2008). Resilience, Robustness, and Marine Ecosystem-Based Management. Bioscience 58, 27–32. doi: 10.1641/B580107
Lindfield S. J., Harvey E. S., Halford A. R., Mcilwain J. L. (2016). Mesophotic Depths as Refuge Areas for Fishery-Targeted Species on Coral Reefs. Coral Reefs 35, 125–137. doi: 10.1007/s00338-015-1386-8
Lucifora L. O., García V. B., Menni R. C., Escalante A. H. (2006). Food Habits, Selectivity, and Foraging Modes of the School Shark Galeorhinus Galeus. Mar. Ecol. Prog. Ser. 315, 259–270. doi: 10.3354/meps315259
Madin E. M., Precoda K., Harborne A. R., Atwood T. B., Roelfsema C. M., Luiz O. J. (2019). Multi-Trophic Species Interactions Shape Seascape-Scale Coral Reef Vegetation Patterns. Front. Ecol. Evol. 7. doi: 10.3389/fevo.2019.00102
Matich P., Heithaus M. R., Layman C. A. (2010). Size-Based Variation in Intertissue Comparisons of Stable Carbon and Nitrogen Isotopic Signatures of Bull Sharks (Carcharhinus Leucas) and Tiger Sharks (Galeocerdo Cuvier). Can. J. Fish. Aquat. Sci. 67, 877–885. doi: 10.1139/F10-037
Matley J., Fisk A. T., Tobin A. J., Heupel M. R., Simpfendorfer C. A. (2016). Diet-Tissue Discrimination Factors and Turnover of Carbon and Nitrogen Stable Isotopes in Tissues of an Adult Predatory Coral Reef Fish, Plectropomus Leopardus. Rapid Commun. Mass Spectrom. 30, 29–44. doi: 10.1002/rcm.7406
Matley J. K., Maes G. E., Devloo-Delva F., Huerlimann R., Chua G., Tobin A. J., et al. (2018). Integrating Complementary Methods to Improve Diet Analysis in Fishery-Targeted Species. Ecol. Evol. 8, 9503–9515. doi: 10.1002/ece3.4456
Mccauley R. D., Meekan M. G., Parsons M. J. G. (2021). Acoustic Pressure, Particle Motion, and Induced Ground Motion Signals From a Commercial Seismic Survey Array and Potential Implications for Environmental Monitoring. J. Mar. Sci. Eng. 9:571. doi: 10.3390/jmse9060571
Meekan M. G., Speed C. W., Fisher R., Birt M. J., Currey-Randall L. M., Semmens J. M, et al. (2021). A Large-Scale Experiment Finds No Evidence That a Seismic Survey Impacts a Demersal Fish Fauna. PNAS. 108, 1–9. doi: 10.1073/pnas.2100869118
Ménard F., Lorrain A., Potier M., Marsac F. (2007). Isotopic Evidence of Distinct Feeding Ecologies and Movement Patterns in Two Migratory Predators (Yellowfin Tuna and Swordfish) of the Western Indian Ocean. Mar. Biol. 153, 141–152. doi: 10.1007/s00227-007-0789-7
Nakamura I., Sato K. (2014). Ontogenetic Shift in Foraging Habit of Ocean Sunfish Mola Mola From Dietary and Behavioral Studies. Mar. Biol. 161, 1263–1273. doi: 10.1007/s00227-014-2416-8
Nelson J., Chanton J., Coleman F., Koenig C. (2011). Patterns of Stable Carbon Isotope Turnover in Gag, Mycteroperca Microlepis, an Economically Important Marine Piscivore Determined With a Non-Lethal Surgical Biopsy Procedure. Environ. Biol. Fishes 90, 243–252. doi: 10.1007/s10641-010-9736-4
Newman S. J., Brown J. I., Fairclough D. V., Wise B. S., Bellchambers L. M., Molony B. W., et al. (2018a). A Risk Assessment and Prioritisation Approach to the Selection of Indicator Species for the Assessment of Multi-Species, Multi-Gear, Multi-Sector Fishery Resources. Mar. Policy 88, 11–22. doi: 10.1016/j.marpol.2017.10.028
Newman S. J., Harvey E. S., Rome B. M., Mclean D. L., Skepper C. L. (2012). Relative Efficiency of Fishing Gears and Investigation of Resource Availability in Tropical Demersal Scalefish Fisheries. Fish. Res. Rep. (Western Australia) 231:1–72.
Newman S. J., Skepper C. L., Mitsopoulos G. E., Wakefield C. B., Meeuwig J. J., Harvey E. S. (2011). Assessment of the Potential Impacts of Trap Usage and Ghost Fishing on the Northern Demersal Scalefish Fishery. Rev. Fish. Sci. 19, 74–84. doi: 10.1080/10641262.2010.543961
Newman S. J., Trinnie G., Saunders T., Wakefield C. B. (2021) Bluespotted Emperor, (2020) Lethrinus Punctulatus - Status of Australian Fish Stocks (Western Australia: Department of Primary Industries and Regional Development). Available at: https://fish.gov.au/report/362-Bluespotted-Emperor-2020 (Accessed 08/11/2021 2021).
Newman S. J., Wakefield C. B., Skepper C. L., Boddington D., Smith E. P. (2018b). “North Coast Demersal Resource Status Report 2018,” in Status Reports of the Fisheries and Aquatic Resources of Western Australia 2017/18: State of the Fisheries. Eds. Gaughan D. J., Santoro K. (Perth, Western Australia: Department of Primary Industries and Regional Development).
Nielsen J. M., Clare E. L., Hayden B., Brett M. T., Kratina P. (2018). Diet Tracing in Ecology: Method Comparison and Selection. Methods Ecol. Evol. 9, 278–291. doi: 10.1111/2041-210X.12869
Overholtz W., Link J., Suslowicz L. (2000). Consumption of Important Pelagic Fish and Squid by Predatory Fish in the Northeastern USA Shelf Ecosystem With Some Fishery Comparisons. ICES J. Mar. Sci. 57, 1147–1159. doi: 10.1006/jmsc.2000.0802
Paine R. T. (1992). Food-Web Analysis Through Field Measurement of Per Capita Interaction Strength. Nature 355, 73–75. doi: 10.1038/355073a0
Park T. H., Lee C.-I., Kang C.-K., Kwak J. H., Lee S. H., Park H. J. (2020). Seasonal Variation in Food Web Structure and Fish Community Composition in the East/Japan Sea. Estuaries Coasts 43, 615–629. doi: 10.1007/s12237-019-00530-4
Pauly D., Christensen J., Dalsgaard R., Froese R., Torres J. F. (1998). Fishing Down Marine Foodwebs. Science 282, 860. doi: 10.1126/science.279.5352.860
Perkins M. J., Mcdonald R. A., Van Veen F. F., Kelly S. D., Rees G., Bearhop S. (2014). Application of Nitrogen and Carbon Stable Isotopes (δ15n and δ13c) to Quantify Food Chain Length and Trophic Structure. PloS One 9, e93281. doi: 10.1371/journal.pone.0093281
Pinheiro H. T., Joyeux J.-C. (2015). The Role of Recreational Fishermen in the Removal of Target Reef Fishes. Ocean Coast. Manage. 112, 12–17. doi: 10.1016/j.ocecoaman.2015.04.015
Post D. M. (2002). Using Stable Isotopes to Estimate Trophic Positions: Models, Methods and Assumptions. Ecology 83, 703–718. doi: 10.1890/0012-9658(2002)083[0703:USITET]2.0.CO;2
Post D. M., Layman C. A., Arrington D. A., Takimoto G., Quattrochi J., Montana C. G. (2007). Getting to the Fat of the Matter: Models, Methods and Assumptions for Dealing With Lipids in Stable Isotope Analyses. Oecologia 152, 179–189. doi: 10.1007/s00442-006-0630-x
R-Core Team (2021). A Language and Environment for Statistical Computing (Vienna, Austria: R Foundation for Statistical Computing).
Reddin C. J., Bothwell J. H., O'connor N. E., Harrod C. (2018). The Effects of Spatial Scale and Isoscape on Consumer Isotopic Niche Width. Funct. Ecol. 32, 904–915. doi: 10.1111/1365-2435.13026
Rizzari J. R., Bergseth B. J., Frisch A. J. (2015). Impact of Conservation Areas on Trophic Interactions Between Apex Predators and Herbivores on Coral Reefs. Conserv. Biol. 29, 418–429. doi: 10.1111/cobi.12385
Rome B. M., Newman S. J. (2010). North Coast Fish Identification Guide (Perth, Western Australia: Department of Fisheries).
Rousseaux C. S., Lowe R., Feng M., Waite A. M., Thompson P. A. (2012). The Role of the Leeuwin Current and Mixed Layer Depth on the Autumn Phytoplankton Bloom Off Ningaloo Reef, Western Australia. Cont. Shelf Res. 32, 22–35. doi: 10.1016/j.csr.2011.10.010
Ruppert J. L., Travers M. J., Smith L. L., Fortin M.-J., Meekan M. G. (2013). Caught in the Middle: Combined Impacts of Shark Removal and Coral Loss on the Fish Communities of Coral Reefs. PloS One 8:1–9. doi: 10.1371/journal.pone.0074648
Salini J., Blaber S., Brewer D. (1994). Diets of Trawled Predatory Fish of the Gulf of Carpentaria, Australia, With Particular Reference to Predation on Prawns. Mar. Freshw. Res. 45, 397–411. doi: 10.1071/MF9940397
Sanderson B. L., Tran C. D., Coe H. J., Pelekis V., Steel E. A., Reichert W. L. (2009). Nonlethal Sampling of Fish Caudal Fins Yields Valuable Stable Isotope Data for Threatened and Endangered Fishes. Trans. Am. Fish. Soc. 138, 1166–1177. doi: 10.1577/T08-086.1
Sardenne F., Hollanda S., Lawrence S., Albert-Arrisol R., Degroote M., Bodin N. (2017). Trophic Structures in Tropical Marine Ecosystems: A Comparative Investigation Using Three Different Ecological Tracers. Ecol. Indic. 81, 315–324. doi: 10.1016/j.ecolind.2017.06.001
Scharf F. S., Buckel J. A., Juanes F., Conover D. O. (1997). Estimating Piscine Prey Size From Partial Remains: Testing for Shifts in Foraging Mode by Juvenile Bluefish. Environ. Biol. Fishes 49, 377–388. doi: 10.1023/A:1007318918434
Skrzypek G. (2013). Normalization Procedures and Reference Material Selection in Stable HCNOS Isotope Analyses: An Overview. Anal. bioanal. Chem. 405, 2815–2823. doi: 10.1007/s00216-012-6517-2
Speed C., Meekan M., Field I., Mcmahon C., Abrantes K., Bradshaw C. J. A. (2012). Trophic Ecology of Reef Sharks Determined Using Stable Isotopes and Telemetry. Coral Reefs 2, 1–11. doi: 10.1007/s00338-011-0850-3
Speed C. W., Rees M. J., Cure K., Vaughan B., Meekan M. G. (2019). Protection From Illegal Fishing and Shark Recovery Restructures Mesopredatory Fish Communities on a Coral Reef. Ecol. Evol. 9, 10553–10566. doi: 10.1002/ece3.5575
St John J. (1999). Ontogenetic Changes in the Diet of the Coral Reef Grouper Plectropomus Leopardus (Serranidae): Patterns in Taxa, Size and Habitat of Prey. Mar. Ecol. Prog. Ser. 180, 233–246. doi: 10.3354/meps180233
Suzuki K. W., Kasai A., Nakayama K., Tanaka M. (2005). Differential Isotopic Enrichment and Half-Life Among Tissues in Japanese Temperate Bass (Lateolabrax Japonicus) Juveniles: Implications for Analyzing Migration. Can. J. Fish. Aquat. Sci. 62, 671–678. doi: 10.1139/f04-231
Swanson H. K., Lysy M., Power M., Stasko A. D., Johnson J. D., Reist J. D. (2015). A New Probabilistic Method for Quantifying N-Dimensional Ecological Niches and Niche Overlap. Ecology 96, 318–324. doi: 10.1890/14-0235.1
Syms C., Jones G. P. (2000). Disturbance, Habitat Structure, and the Dynamics of a Coral-Reef Fish Community. Ecology 81, 2714–2729. doi: 10.1890/0012-9658(2000)081[2714:DHSATD]2.0.CO;2
Takahashi M., Dibattista J. D., Jarman S., Newman S. J., Wakefield C. B., Harvey E. S., et al. (2020). Partitioning of Diet Between Species and Life History Stages of Sympatric and Cryptic Snappers (Lutjanidae) Based on DNA Metabarcoding. Sci. Rep. 10, 1–13. doi: 10.1038/s41598-020-60779-9
Taylor B., Mills J. (2013). Movement and Spawning Migration Patterns Suggest Small Marine Reserves can Offer Adequate Protection for Exploited Emperorfishes. Coral reefs 32, 1077–1087. doi: 10.1007/s00338-013-1065-6
Vanderklift M., Bearham D., Haywood M., Lozano-Montes H., Mccallum R., Mclaughlin J., et al. (2016). “Natural Dynamics: Understanding Natural Dynamics of Seagrasses in North-Western Australia,” in WAMSI Dredging Science Node Report Perth (Perth, Western Australia: Western Australian Marine Science Institution).
Vaudo J. J., Heithaus M. R. (2011). Dietary Niche Overlap in a Nearshore Elasmobranch Mesopredator Community. Mar. Ecol-Prog. Ser. 425, 247–260. doi: 10.3354/meps08988
Vergès A., Hyndes G., Vanderklift M. (2011). Trophic Effects Through Herbivory at Ningaloo Reef (Perth, Western Australia: Western Australian Marine Science Institution).
Vignon M., Dierking J. (2011). Prey Regurgitation and Stomach Vacuity Among Groupers and Snappers. Environ. Biol. fishes 90, 361–366. doi: 10.1007/s10641-010-9746-2
Vinson M., Angradi T. (2011). Stomach Emptiness in Fishes: Sources of Variation and Study Design Implications. Rev. Fish. Sci. 19, 63–73. doi: 10.1080/10641262.2010.536856
Willis T. J., Sweeting C. J., Bury S. J., Handley S. J., Brown J. C., Freeman D. J., et al. (2013). Matching and Mismatching Stable Isotope (δ 13 C and δ 15 N) Ratios in Fin and Muscle Tissue Among Fish Species: A Critical Review. Mar. Biol. 160, 1633–1644. doi: 10.1007/s00227-013-2216-6
Wyatt A. S., Lowe R. J., Humphries S., Waite A. M. (2013). Particulate Nutrient Fluxes Over a Fringing Coral Reef: Source-Sink Dynamics Inferred From Carbon to Nitrogen Ratios and Stable Isotopes. Limnol. Oceanogr. 58, 409–427. doi: 10.4319/lo.2013.58.1.0409
Wyatt A. S. J., Waite A. M., Humphries S. (2010). Variability in Isotope Discrimination Factors in Coral Reef Fishes: Implications for Diet and Food Web Reconstruction. PloS One 5, 10. doi: 10.1371/journal.pone.0013682
Yeakel J. D., Bhat U., Elliott Smith E. A., Newsome S. D. (2016). Exploring the Isotopic Niche: Isotopic Variance, Physiological Incorporation, and the Temporal Dynamics of Foraging. Front. Ecol. Evol. 4. doi: 10.3389/fevo.2016.00001
Keywords: stable isotopes, niche overlap, mesopredators, gastrointestinal tract analysis, red emperor, niche space
Citation: Speed CW, Meekan MG, Birt MJ, Parsons MJG, McLean D, Taylor BM, Thomas L, McCauley R, Semmens JM and Newman SJ (2022) Trophic Structure and Diet of Predatory Teleost Fishes in a Tropical Demersal Shelf Ecosystem. Front. Mar. Sci. 9:871611. doi: 10.3389/fmars.2022.871611
Received: 08 February 2022; Accepted: 18 May 2022;
Published: 30 June 2022.
Edited by:
Trevor Willis, Stazione Zoologica Anton Dohrn Napoli, ItalyReviewed by:
Alex S.J. Wyatt, Hong Kong University of Science and Technology, Hong Kong SAR, ChinaEric Diaz Delgado, Anton Dohrn Zoological Station, Italy
Copyright © 2022 Speed, Meekan, Birt, Parsons, McLean, Taylor, Thomas, McCauley, Semmens and Newman. This is an open-access article distributed under the terms of the Creative Commons Attribution License (CC BY). The use, distribution or reproduction in other forums is permitted, provided the original author(s) and the copyright owner(s) are credited and that the original publication in this journal is cited, in accordance with accepted academic practice. No use, distribution or reproduction is permitted which does not comply with these terms.
*Correspondence: Conrad W. Speed, Yy5zcGVlZEBhaW1zLmdvdi5hdQ==