 Catarina P. P. Martins*
 Angelina L. ArnoldKatharina Kömpf
 Patrick Schubert
 Maren Ziegler
 Thomas Wilke
 Jessica Reichert
- Department of Animal Ecology and Systematics, Justus Liebig University Giessen, Giessen, Germany
Ocean acidification (OA) poses a major threat to calcifying organisms such as reef-building corals, typically leading to reduced calcification rates. Mechanisms to compensate the effects of OA on coral growth may, however, involve processes other than calcification. Yet, the physiological patterns mediating coral growth under OA are not fully understood, despite an extensive body of literature characterizing physiological changes in corals under OA. Therefore, we conducted a three-month laboratory experiment with six scleractinian coral species (Acropora humilis, Acropora millepora, Pocillopora damicornis, Pocillopora verrucosa, Porites cylindrica, and Porites lutea) to assess physiological parameters that potentially characterize growth (calcification, volume, and surface area), maintenance (tissue biomass, and lipid and protein content), and cellular stress (apoptotic activity) response under ambient (pH 7.9) and low pH (pH 7.7). We identified genus- and species-specific physiological parameters potentially mediating the observed growth responses to low pH. We found no significant changes in calcification but species showed decreasing growth in volume and surface area, which occurred alongside changes in maintenance and cellular stress parameters that differed between genera and species. Acropora spp. showed elevated cellular stress and Pocillopora spp. showed changes in maintenance-associated parameters, while both genera largely maintained growth under low pH. Conversely, Porites spp. experienced the largest decreases in volume growth but showed no major changes in parameters related to maintenance or cellular stress. Our findings indicate that growth- and calcification-related responses alone may not fully reflect coral susceptibility to OA. They may also contribute to a better understanding of the complex physiological processes leading to differential growth changes of reef-building corals in response to low pH conditions.
1 Introduction
Ocean acidification (OA)—a process characterized by decreased pH and altered carbonate chemistry—is considered one of the main future threats to coral reefs (Anthony, 2016), with potentially large impacts on reef diversity and functioning (Gaylord et al., 2015; Sunday et al., 2017). In scleractinian corals, the main framework builders of tropical coral reef ecosystems, OA generally reduces calcification rates (Chan and Connolly, 2013; Kroeker et al., 2013). Calcification is the process of calcium carbonate deposition (Al-Horani, 2015), which underlies skeletal growth and occurs through the combination of extension and densification phases of skeletal elements (Cuif and Dauphin, 2005). These two phases can be affected differently by OA, leading to coral skeletons with lower density (Mollica et al., 2018) and higher porosity through changes in the internal architecture of the skeleton (Tambutté et al., 2015). The magnitude of OA-induced decreases in calcification differs among (Kornder et al., 2018) and within coral species (e.g., Kavousi et al., 2016; Enochs et al., 2018). Maintaining calcification during OA is generally seen as indication of low susceptibility (Comeau et al., 2013). This is partially linked to the ability of species to mediate OA-induced shifts in the carbonate chemistry of the calcifying fluid (Schoepf et al., 2017; Comeau et al., 2019). Some coral species, however, maintain calcification rates under OA despite low control over homeostasis of the calcifying fluid (Comeau et al., 2017).
In addition to calcification (reflecting skeletal growth), coral growth is also characterized by increases in different colony dimensions (e.g., volume growth, surface area growth, linear extension; Buddemeier and Kinzie, 1976). Linear extension, measured as the rate of branch extension, is a common length-based method (Pratchett et al., 2015) but it differs from surface area growth, which considers the entire growth surface and growth in any direction (Buddemeier and Kinzie, 1976). This distinction is also reflected under OA, where effects on linear extension are generally null (e.g., Tambutté et al., 2015) while surface area growth generally decreases (Horwitz et al., 2017). This is currently associated to a higher calcifying fluid pH in branch tips than in lateral growth regions (Holcomb et al., 2014). Similarly, calcification may not always relate directly to changes in coral volume due to variation in skeletal density and porosity (Buddemeier et al., 1974). However, mechanisms to compensate the effects of OA on growth in volume and surface area may differ among species and involve processes other than calcification. The respective physiological changes, however, are not always consistent. For example, coral energy reserves may remain unchanged or increase during OA (Strahl et al., 2016; Wall et al., 2017). Therefore, the physiological patterns mediating coral growth under OA and leading to different growth responses are not fully understood, despite an extensive body of literature characterizing physiological changes in corals under OA. Additionally, OA studies characterizing coral growth in colony surface area and volume are few, despite the advantage of providing ecologically relevant information of realized growth and occupied space (Edmunds, 2007; Pratchett et al., 2015) that could inform coral demography projections (Edmunds et al., 2014; Kayal et al., 2019) and modeling of OA impacts across large spatio-temporal scales (Evensen et al., 2021).
Therefore, the goal of this study was to unravel the physiological patterns in coral metabolism that underlie changes in coral growth response to OA. For this, we conducted a three-month experiment in which corals were exposed to a low and ambient pH scenario and assessed growth parameters (calcification, volume, and surface area) alongside maintenance (tissue biomass, and lipid and protein content) and cellular stress (apoptotic activity) parameters of six scleractinian coral species. We studied Acropora humilis (Dana, 1846), Acropora millepora (Ehrenberg, 1834), Pocillopora damicornis (Linnaeus, 1758), Pocillopora verrucosa (Ellis and Solander, 1786), Porites cylindrica Dana, 1846, and Porites lutea Milne Edwards and Haime, 1851, which are common reef-builders and represent major coral families. Specifically, we tested (i) which physiological changes underlie the growth response of corals to OA and (ii) whether the observed patterns in physiological responses are consistent across the tested genera and species. This comprehensive approach will help to disentangle physiological trade-offs of coral species under low pH conditions and better understand coral susceptibility to OA.
2 Materials and Methods
2.1 Experimental Design and Study Species
The physiological responses of Indo-Pacific corals to low pH were studied in a controlled three-month laboratory experiment. The experiment was conducted from 31 October 2014 to 12 January 2015. Six coral species, A. humilis, A. millepora, P. damicornis, P. verrucosa, P. cylindrica, and P. lutea, were exposed to ambient and low pH. Coral colonies were imported from Indonesia in 2014 (Supplementary Table S1) and were acclimated to laboratory conditions for 5–6 months prior to the experiment. Corals were maintained at the ‘Ocean2100’ long-term coral experimental facility at Justus Liebig University Giessen, Germany, under laboratory conditions (in accordance with the institutional animals’ care guidelines, long-term rearing: 10:14 light:dark photoperiod, light intensity (PAR) 200 µmol photons m-2 s-1, and temperature 26 ± 0.5°C). Three colonies per species were cut into six fragments of 3–5 cm height each using a small angle grinder (Dremel Multitool 3000-15, The Netherlands). Fragments were attached to self-made concrete bases with two-component glue (CoraFix SuperFast, Grotech, Germany). Coral fragments were arranged randomly in six tanks (3 fragments per species per tank, 9 fragments per species per treatment) and acclimated to experimental tank conditions one week prior to the start of the experiment. One coral fragment of A. humilis from the ambient pH treatment and one from the low pH treatment, three coral fragments of A. millepora from the ambient pH treatment, and one entire colony of P. lutea from both treatments died during the course of the experiment and were excluded from the analyses.
2.2 Tank Setup and Treatment Conditions
The experiment was conducted in six 45 L tanks (Supplementary Figure S1). The experimental tanks were part of a 4000 L closed recirculating system and were maintained with a water exchange rate of 60 L h-1 (corresponding to a 100% tank volume turnover every 45 min). Tanks were cleaned twice per week to minimize biofilm growth. Temperature was maintained at 26°C through a feedback-controlled heater (Titanium heater, Schego, Germany; 300 W), and water flow was generated with a propeller pump (Resun S-700, Resun, China) at a flow rate of 700 L h-1. Light was set to 10:14 h light:dark photoperiod at 135–142 µmol m-2 s-1 with a simulated midday high-light period at 270–395 µmol m-2 s-1 of four hours (80 W Aquablue Special and Blue Plus, ATI, Germany). The corals were fed indirectly via the connected water system, which was provided with frozen food daily (i.e., copepods, Mysis sp.). Water parameters (salinity: 33, nitrate: < 10–50 mg L-1, phosphate: < 0.05–0.5 mg L-1, calcium: 400–420 mg L-1, magnesium: 1250–1350 mg L-1) were monitored twice a week in the system and maintained constant through dosing of MgCl2, CaCl2, and NaCl-free salt. Alkalinity was maintained by an in-house constructed calcium reactor (pH 6.2–6.4, coral rubble) and dosing of NaHCO3. For this, alkalinity was measured in the recirculating system once a week in the morning with a titration-based alkalinity test (precision 0.5 dKH, Tropic Marin, Germany). pH was constantly monitored (Profilux 3, GHL, Germany) with pH electrodes in each tank (GHL, Germany), which were calibrated using NBS buffers. Values of pHNBS were converted to total scale (pHT) using equations from Millero (2013) and Takahashi (1982). pH values are expressed in total scale throughout the text.
Coral fragments were exposed to ambient and low pH (Table 1; Supplementary Figure S2; Supplementary Table S2). Low pH conditions were generated via pH-controlled bubbling of CO2 to three tanks (low pH), while three other tanks were not bubbled with CO2 (ambient pH). The pH in the low pH treatment tanks was reduced by ~0.2 pH units (~350 µatm pCO2 higher) to simulate ‘near-future’ conditions under moderately high CO2 emissions predicted by the IPCC (RCP6.0; IPCCCore Writing Team, 2014). This resulted in a diel pH range of 0.2 pH units. The seawater of the ambient pH treatment tanks was not manipulated with CO2 to mimic baseline conditions in the main system and represent conditions already experienced by some reefs (~500 µatm pCO2; Ziegler et al., 2021), resulting in a diel pH range of 0.6 pH units (similar to that of some reefs; Ohde and Van Woesik, 1999; Shaw et al., 2012). Statistical analyses of seawater chemistry showed that target pH levels were successfully maintained during the three-month experiment (Supplementary Text and Supplementary Table S3).
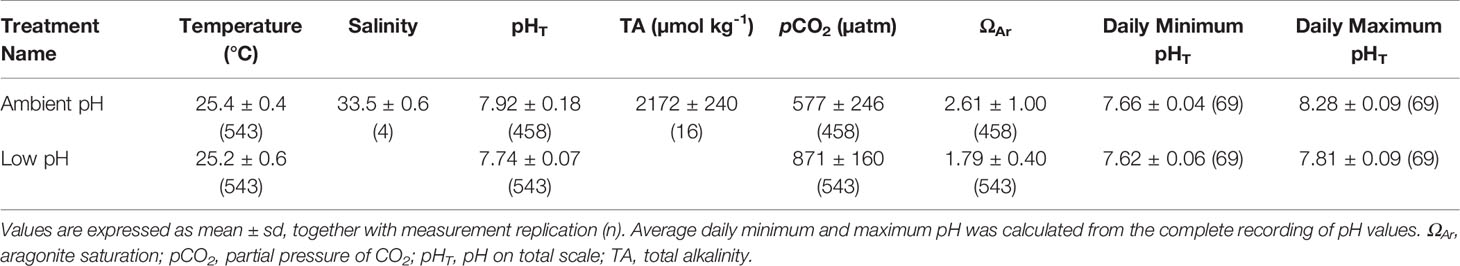
Table 1 Seawater chemistry in the two experimental treatments.
The CO2 was pumped individually into the tanks of the low pH treatment, which was activated when pH increased 0.1 pH units above the target pH level of 7.7. Solenoid valves controlled the release of CO2 into a diffuser, which was connected to a driving pump (Resun 700, China). The CO2 diffuser broke down the gas into smaller bubbles before it was delivered into the seawater to facilitate CO2 diffusion. To maintain equal water flow in all tanks, diffusers were also included within ambient pH tanks, without adding CO2 to the water. Alkalinity values were converted to values in meq L-1 with two significant digits and then to µmol H+ kg seawater-1 to calculate carbonate chemistry using CO2SYS (v25; Pelletier et al., 2007). Values of pCO2 and ΩAr were calculated from days with alkalinity measurements using measured pHNBS and temperature values of a whole day, with carbonic acid dissociation constants from Mehrbach et al. (1973) refit by Dickson and Millero (1987). This approach is suitable for biological OA experiments with treatments that have differences larger than 100 µatm pCO2 (Watson et al., 2017) and allowed us to account for the diel oscillation of pH in the tanks. Alkalinity values were assumed to be representative of the alkalinity of the whole day it was measured on. No temperature or pH values were recorded during one of the alkalinity measurement days therefore carbonate chemistry was calculated for a total of 15 days throughout the experiment. A summary of the complete recording of temperature and pH values in each tank is provided in Supplementary Table S4.
2.3 Determination of Calcification Rates
Calcification rates were calculated as the difference in buoyant weight (Spencer Davies, 1989) of all coral fragments, measured at the beginning (t0) and at the end (t1) of the experiment. For this, corals were weighed in a separate 12 L tank placed under a balance (Kern KB 360-3N, Kern & Sohn, Germany; precision: 0.001 g). The change in buoyant weight was converted to dry weight using an aragonite density of 2.93 g cm-3 (Spencer Davies, 1989). Calcification rates were standardized to surface area of the coral fragments at t0 and to time (month).
2.4 Determination of Growth Rates in Volume and Surface Area
Growth rates in volume and surface area were determined using 3D scanning (Artec Spider 3D with Artec Studio 9, Artec 3D, Luxembourg). The size of coral fragments was documented at t0 and at t1, according to previous studies (Reichert et al., 2016). Briefly, corals were placed on a rotating plate and scans were captured in air within 60–90 seconds. 3D models were calculated performing fine serial registration, global registration (minimal distance: 10, iterations: 100, based on geometry), and sharp fusion (resolution 0.2, fill holes by radius, max. hole radius: 5). Artefact objects were removed (small objects filter). To determine volume increases, meshes of the same individuals from all time points were aligned and trimmed horizontally. All meshes were exported as Wavefront “.obj” files to MeshLab Visual Computing Lab-ISTI-CNR (v1.3.4, BETA, 2014; Cignoni et al., 2008) and volume and surface area were calculated using the “compute geometric measures” tool. Since coral growth is size-dependent (Dornelas et al., 2017), growth rates were normalized by initial surface area of coral fragments. Additionally, growth rates were standardized to time (month).
2.5 Sample Preparation
At the end of the experiment, all fragments were snap-frozen in liquid nitrogen and stored at -80°C. Biochemical parameters were measured for each coral fragment. For this, the concrete base and glue were carefully removed and the coral fragment was crushed with mortar and pestle while constantly being cooled down with liquid nitrogen. The coral powder was split for analysis of ash-free dry weight, total lipid content, protein content, and apoptotic activity.
2.6 Biochemical Analyses
2.6.1 Dry Weight and Ash-Free Dry Weight
Dry weight (DW) was determined by drying 60 mg pre-weighed coral samples for 24 h at 60°C. Subsequently, ash-free dry weight (AFDW) was determined by burning the remaining sample for 24 h at 550°C in a muffle furnace (Heraeus Typ M 110, Heraeus Instruments, Germany; 1100°C nominal temperature). Samples were weighed on a Kern ABS 220-4N Precision Balance (KERN & SOHN, Germany; precision: 0.0001 g) and AFDW was standardized to DW following Conlan et al. (2017) to characterize tissue biomass.
2.6.2 Total Lipid Content
Total lipid content was determined using a dichloromethane:methanol (MeOH) extraction, according to Folch et al. (1957) following modifications of Conlan et al. (2014). 2.5 mL of MeOH (2:1) were added to 0.5 g of coral sample in a scintillation vial. Then, samples were sonicated for 5 min (Sonorex Super 10P, Bandelin, Germany; amplitude 6.0) to disrupt cell membranes. The solvent was filtered three times through a cotton-stuffed filter glass Pasteur pipette to remove all solid residues. The sample was washed with 3.5 mL potassium chloride (0.44% in water:MeOH [3:1]) and incubated for 12 h in the dark. Then, the water phase on top was discarded and the liquid methanol phase containing the lipids transferred to pre-weighed clean 15 mL Falcon tubes. The solvent was dried at 30°C in a Dri-block (Techne, UK) under a flow of nitrogen. The dried lipid content was weighed (Kern ABS 220-4N Precision Balance) and standardized to AFDW.
2.6.3 Protein Content
Protein content was analyzed using the 2-D Quant kit (GE Healthcare Life Sciences, USA) according to kit descriptions. Briefly, 10–20 mg of coral sample were transferred into 100 µl standard 2D lysis buffer and stored at -20°C. Absorbance at 480 nm was measured and used to determine protein concentrations against a bovine serum albumin (BSA) standard. Energy content (kJ g-1 AFDW) was additionally calculated from the enthalpy of combustion for the sum of lipid (39.5 kJ g-1) and protein (23.9 kJ g-1) content using values by Gnaiger and Bitterlich (1984) and can be inspected in Supplementary Material (Supplementary Figure S4).
2.6.4 Apoptotic Activity
Apoptotic activity was determined by measuring Caspase-3 and -7 activities modified after Liu et al. (2004), using the Caspase-Glo® 3/7 Assay kit (Promega, USA). 60 and 70 mg of the frozen coral sample, respectively, were mixed with a lysis buffer in a ratio of 1:19 (w/v). Lysis buffer (0.5 mL mL-1 50 mM HEPES, 0.468 mg mL-1 EGTA, 1.017 mg mL-1 MgCl2*6H2O, 1.867 µL mL-1 Protease Inhibitor Cocktail (Sigma Aldrich, 8340), and 7.5 mL mL-1 MilliQ) was prepared daily to ensure full activity of all components. Samples were homogenized with glass beads (1.0 mm, Cat. No. 11079110, BioSpec Products, USA) for 2 min in a swing mill (MM 200, Retsch, Germany). Then, samples were centrifuged (15 000 x g, 4°C, 15 minutes) and the supernatant was recovered and stored on ice. Three replicate samples were each mixed with Caspase-Glo reagent (1:1) in white-walled 96-well microplates and stored in the dark at RT for 90 min. Luminescence in relative light units (RLU) of all samples was determined on a microplate-reader (ClarioStar, BMG LABTECH, Germany). The obtained RLU corrected against blanks is proportional to the caspase activity of the sample and was normalized to protein content, resulting in apoptotic activity expressed as RLU µg protein-1.
2.7 Statistical Analyses
Physiological responses of six coral species to OA were investigated using a Bayesian generalized linear latent variable model (GLLVM; Hui, 2016). This method extends the generalized linear model (GLM) by including latent variables, which include any residual correlations between responses not accounted for by model predictors (Hui, 2016). The model was fit using the physiological parameters as model response, and species and treatment as model predictors with an interaction between them. Tank and coral colony were used as random effects and two latent variables were used to account for unknown interactions between the physiological parameters and shared responses to unknown predictors (Hui, 2016). Physiological parameters were log-transformed to meet model assumptions and scaled (i.e., subtracting the mean and dividing by the standard deviation). Potential outliers were detected by inspecting boxplots and Cleveland dotplots of parameters (Zuur et al., 2010) and were excluded from the GLLVM and subsequent statistical analyses. The GLLVM was performed with 60 000 iterations, with the first 10 000 discarded as burn-in, a thinning rate of 30, a set seed of 123, and using a normal distribution to model the response data. Model convergence was checked via model diagnostic tools using Dunn–Smyth residuals and normal quantile plot of residuals (Hui, 2016; Supplementary Figure S5).
Differences between treatments were tested by performing multiple comparisons using the GLLVM and assessed for each physiological parameter and for all parameters combined. Statistically significant differences were estimated from multiple comparisons of the posterior distributions of regression coefficients of each model simulation and assessed through 95% credible intervals (CIs), which capture the 95% most probable values of the parameter (Kruschke, 2018). 75% CIs were used to assess trends. In contrast to traditional null hypothesis testing, no test statistic is required in a Bayesian framework because the uncertainty in model parameter values is indicated by the width of the parameter distribution, which is given by the 95% CI. When the probability distribution over the parameter space is narrower, certainty in the model estimate is higher (Kruschke, 2018). In addition, since hypotheses are tested by directly contrasting the posterior distributions of regression coefficients of each model simulation (Neath and Cavanaugh, 2006), no statistical corrections are needed and are directly assessed through 95% CIs. If the CI of a particular comparison does not include zero, it indicates a credible difference between groups (Kruschke, 2010).
Principal component analyses (PCA) were performed to visualize treatment effects on the combined physiological parameters (hereafter referred to as overall response) and to investigate patterns among coral species. PCAs were conducted using seven variables: calcification, volume growth (growthV), surface area growth (growthSA), tissue biomass (biomass), lipid content (lipids), protein content (proteins), and apoptotic activity (apoptosis). Data were centered and scaled and only individuals with values for all variables were used. PCAs were performed for all species together and for each genus separately.
All statistical analyses were performed in R (v.4.1.0; R Core Team, 2021) using RStudio (v1.4.1103; R Studio Team, 2021). The GLLVM was fit using the R package boral (v.1.9; 2020; Hui, 2016) and PCAs were performed and visualized using the R packages FactoMineR (v.2.4; Lê et al., 2008) and factoextra (v.1.0.7; Kassambara and Mundt, 2020). Plots were created using R package ggplot2 (v.3.3.5; Wickham, 2016).
3 Results
3.1 Ocean Acidification Reduces Coral Growth and Affects Metabolic Maintenance and Cellular Stress
After three months’ exposure to ambient or low pH, the seven physiological parameters relating to growth (calcification, volume, and surface area), maintenance (tissue biomass, and lipid and protein content), and cellular stress (apoptotic activity) varied between coral species (Table 2; Supplementary Figures S3, 4). The low pH treatment induced differential changes in the physiological parameters with few significant effects (GLLVM, Figure 1; Supplementary Table S5). Coral species generally showed significant changes in different physiological parameters but calcification was largely maintained in all species (GLLVM, Figure 1A). Volume growth decreased significantly by 129% in P. cylindrica (GLLVM, Figure 1B; ambient pH: 0.07 ± 0.08 mm3 mm-2 month -1 vs. low pH: -0.02 ± 0.06 mm3 mm-2 month-1) and by 64% in P. lutea (GLLVM, Figure 1B; ambient pH: 0.25 ± 0.19 mm3 mm-2 month-1 vs. low pH: 0.09 ± 0.07 mm3 mm-2 month-1). Surface area growth decreased significantly by 53% in P. verrucosa (GLLVM, Figure 1C; ambient pH: 21.73 ± 9.11% month-1 vs. low pH: 10.16 ± 6.23% month-1). Significant changes in tissue biomass were only observed in P. damicornis (GLLVM, Figure 1D; ambient pH: 43.1 ± 14.2 mg g DW-1 vs. low pH: 74.1 ± 43.5 mg g DW-1), which presented a 72% increase. Apoptotic activity increased significantly by 101% in A. millepora (GLLVM, Figure 1G; ambient pH: 206 ± 137 RLU µg protein-1 vs. low pH: 415 ± 151 RLU µg protein-1). Lipid and protein content were largely maintained in all species (GLLVM, Figures 1E, F).
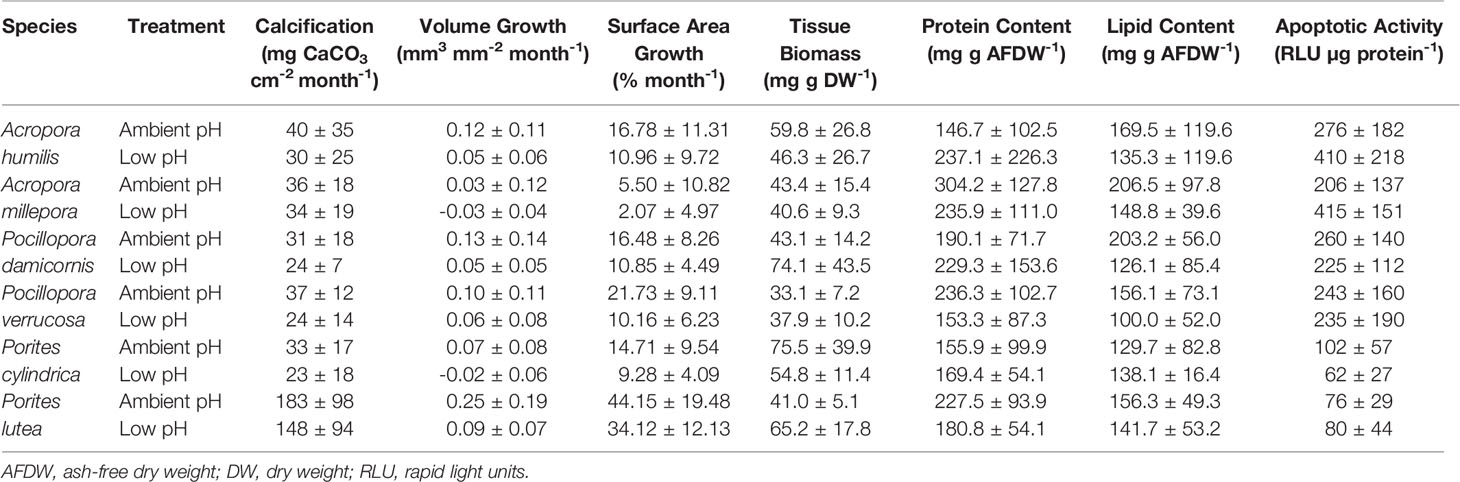
Table 2 Physiological parameters (mean ± sd) of Acropora humilis, Acropora millepora, Pocillopora damicornis, Pocillopora verrucosa, Porites cylindrica, and Porites lutea maintained in ambient and low pH treatments, for three months.
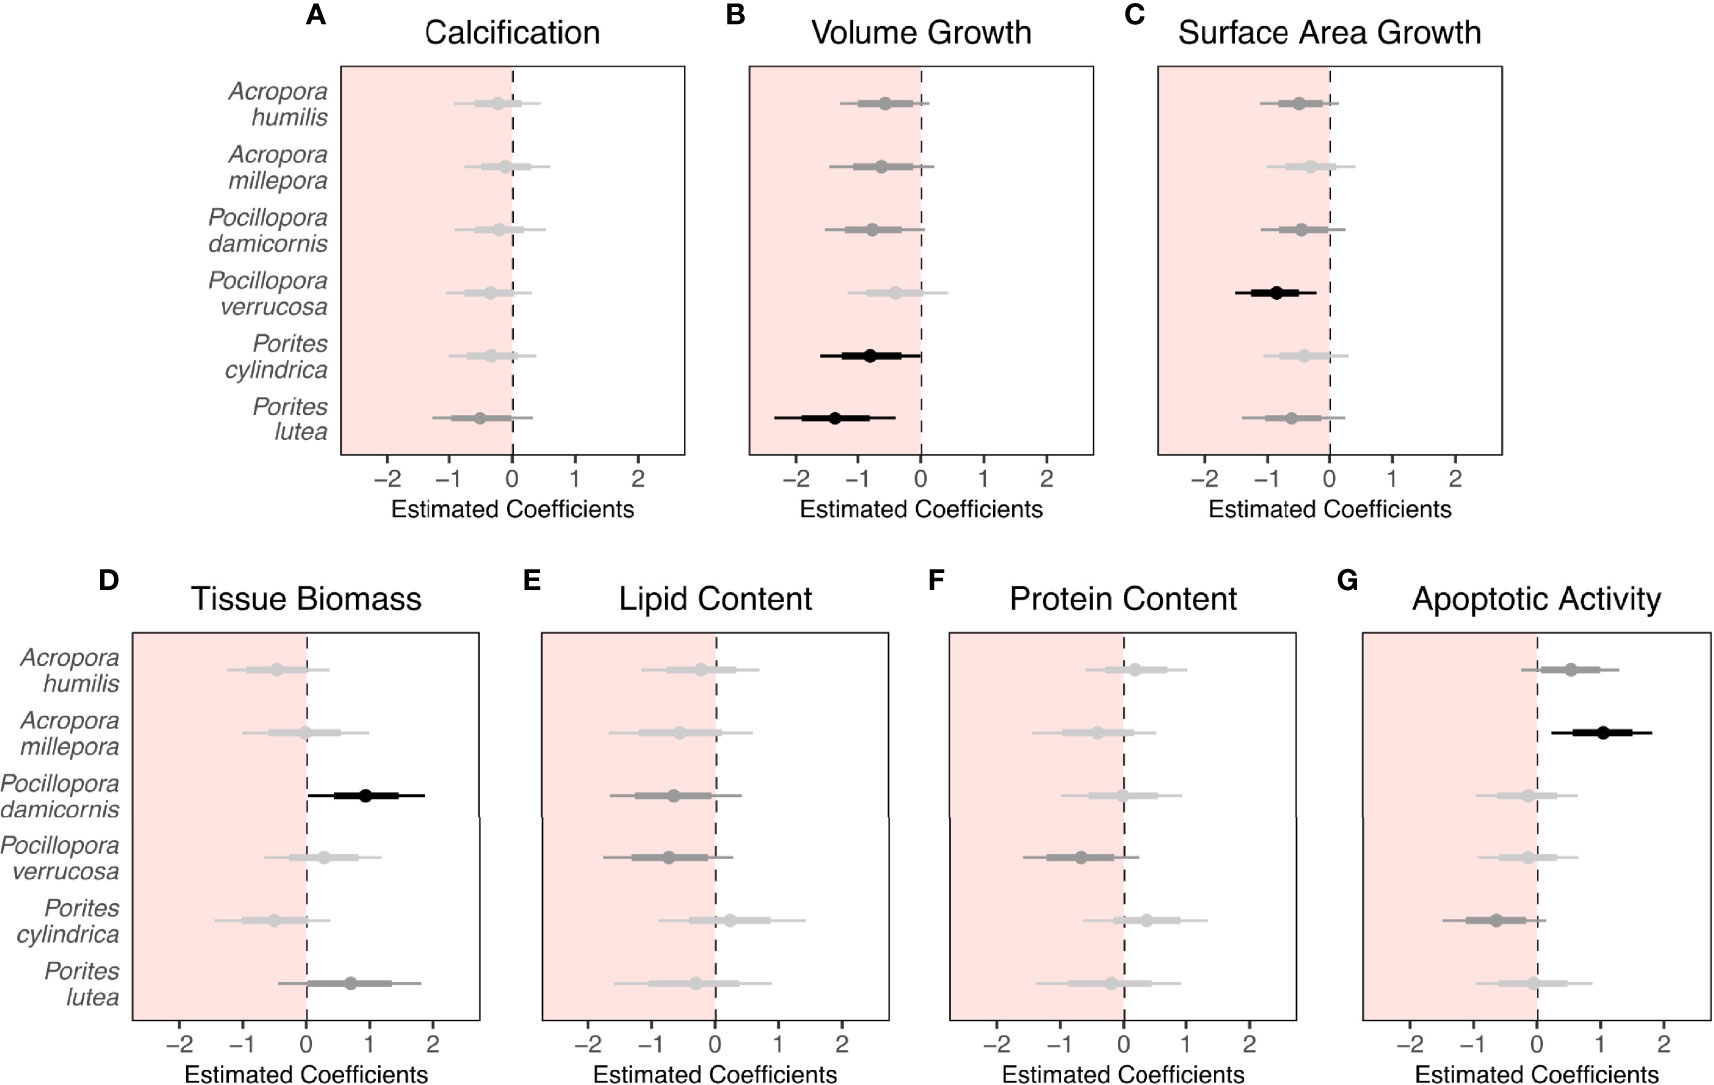
Figure 1 Effect of three-month low pH treatment on (A) calcification, (B) volume growth, (C) surface area growth, (D) tissue biomass, (E) lipid content, (F) protein content, and (G) apoptotic activity of six scleractinian coral species (n = 9 fragments per species per treatment). Points indicate the median of modeled regression coefficients of comparisons between treatment groups within a Bayesian framework from a generalized linear latent variable model (GLLVM). Thin and thick lines are 95% and 75% credible intervals (CIs), respectively. Statistically significant effects (i.e., 95% CIs that do not overlap zero) are colored black, trends (i.e., 75% CIs that do not overlap zero) are colored dark grey, and non-significant effects are colored light grey. Summarized parameter coefficients and CIs extracted from the GLLVM are provided in Supplementary Table S5.
3.2 Combined Changes in Physiological Parameters Reveal Genus- and Species-Specific Responses to Ocean Acidification
We found no unifying response to the low pH treatment across our six coral species (Figure 2A, no significant difference in the overall response of all species pooled, GLLVM, Table 3). Instead, PCA analyses revealed a taxonomic separation in the overall response to low pH at the genus level (Figures 2B–D). In the PCA projection of Acropora and Pocillopora, low pH treatment groups separated from their respective ambient pH groups in the same direction along the PC1 axis regardless of species (no significant difference between species within genera, GLLVM, Table 3), indicating a genus-specific response to low pH. In Acropora, the low pH treatment was associated with increased apoptotic activity and decreased growth in volume and surface area (Figure 2B). In Pocillopora, the low pH treatment was associated with increased biomass and decreased growth (calcification, volume, and surface area) as well as lipid and protein content (Figure 2C). Porites revealed a contrasting response to the low pH treatment. Although both Porites spp. showed a significant decrease in volume growth rates (Figure 1B), treatment groups of P. cylindrica and P. lutea separated differently from their respective ambient pH groups in the PCA (Figure 2D), indicating a species-specific response to low pH in this genus. However, this difference between Porites spp. was not statistically significant (GLLVM, Table 3), potentially due to lower sample size in P. lutea, introduced through mortality of one colony. In P. cylindrica, the separation of the low and ambient pH groups was associated with increased protein content and decreased volume and surface area growth and apoptotic activity. In P. lutea, it was associated with increased biomass and decreased volume and surface area growth as well as lipid and protein content (Figure 2D).
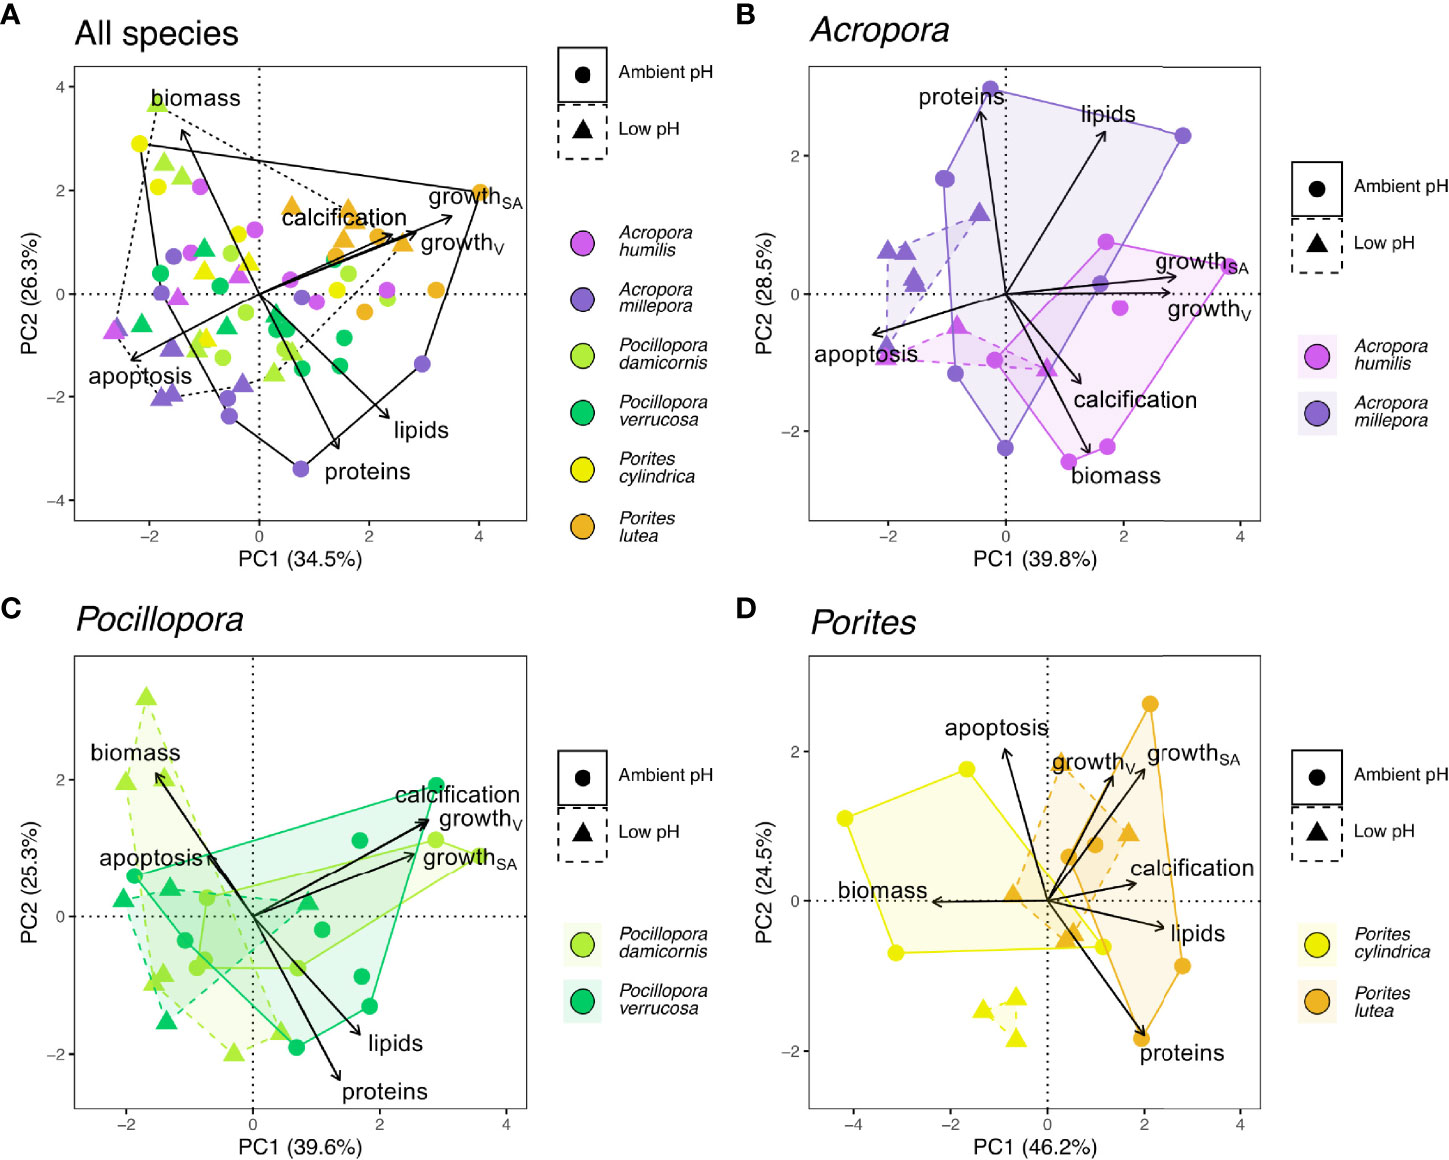
Figure 2 Principal component analyses (PCA) using seven physiological parameters (calcification; growthV, volume growth; growthSA, surface area growth; biomass, tissue biomass; lipids, lipid content; proteins, protein content; apoptosis, apoptotic activity) of six scleractinian coral species maintained in ambient and low pH treatments. PCAs were performed for (A) all coral species and for two species each in the genera (B) Acropora, (C) Pocillopora, and (D) Porites. Convex polygons outline ambient pH (solid line) and low pH (dashed line) treatments.
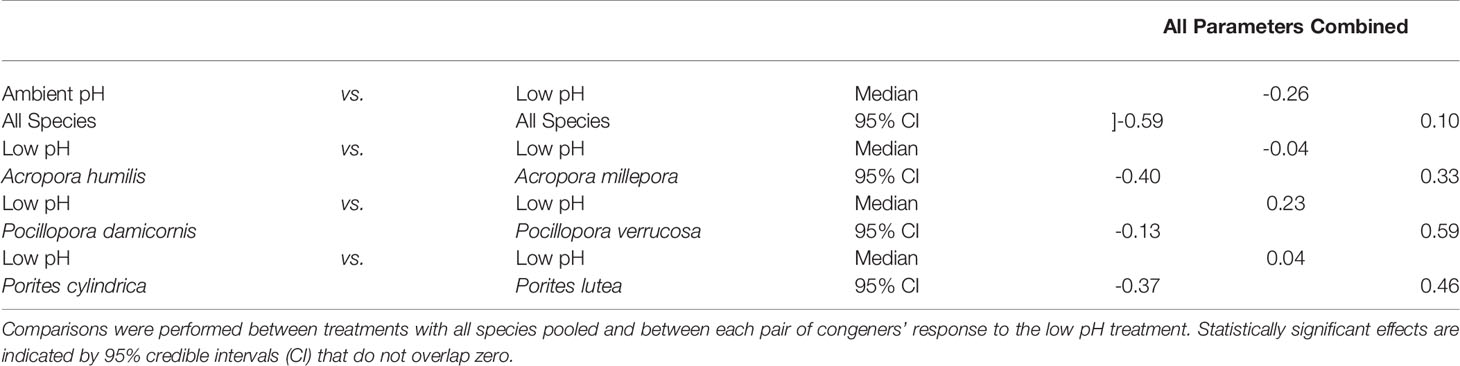
Table 3 Pairwise comparison of estimated coefficients from generalized linear latent variable model (GLLVM) of the overall response (i.e., of all physiological parameters combined) to the low pH treatment.
4 Discussion
Our study suggests that the growth response in volume and surface area of the six investigated coral species under low pH may be mediated by differential changes in maintenance and cellular stress parameters. Our results indicate that these patterns are genus-specific for Acropora and Pocillopora, and species-specific for Porites.
While calcification rates remained largely unaffected in our study, growth in volume and surface area generally declined under low pH. These declines differed in magnitude among species. Significant decreases in volume growth were observed in P. cylindrica and P. lutea. These two species are also known to respond with decreased calcification under low pH (e.g., Bahr et al., 2016; Kavousi et al., 2016), which highlights the negative effects of OA. However, Porites compressa from a naturally acidified reef (pH 7.9) have been shown to maintain calcification under pH 7.7 by upregulating pH of the calcifying fluid but maintaining its DIC relatively low (Schoepf et al., 2017). A similar strategy to regulate calcifying fluid conditions might have been employed by the Porites spp. tested here and explain the lack of calcification impacts. Low pH effects on calcification and volume growth may differ from each other in intensity (Enochs et al., 2014) due to changes in skeletal density and porosity (Tambutté et al., 2015; Mollica et al., 2018) and might explain the lack of differences observed here for calcification alongside decreased volume growth. Additionally, the high precision of the 3D scanning method used to study volume and surface area growth (Reichert et al., 2016) was able to document subtle changes in volume and surface area, which might have also contributed to this picture. Effects on volume and surface area growth were also not always consistent in this study, despite being related (Pratchett et al., 2015). For example, P. verrucosa showed no major changes in volume growth but experienced the largest reduction in surface area growth, as seen in previous studies (Horwitz et al., 2017). In sum, our findings suggest that the coral species tested exhibited different strategies to cope with the low pH treatment.
OA effects were strongest in Acropora. Although Acropora spp. showed a potential mediation of low pH effects on calcification and growth, the underlying changes included an increase in cellular stress. This increase can become detrimental to fitness when acute and prolonged (Sørensen et al., 2003), suggesting that the patterns observed in Acropora spp. constitute a ‘dead-end strategy’. The elevated cellular stress observed in Acropora is the first report of increased apoptosis in scleractinian corals in response to low pH inferred from caspase activity—a response previously suspected based on up-regulated gene expression patterns of caspase and caspase-like enzymes (Kaniewska et al., 2012; Kaniewska et al., 2015). These findings, however, stand in contrast with observations from A. millepora living in CO2 seeps, where gene expression of chaperones (proteins also involved in cellular stress response) is found to be down-regulated (Kenkel et al., 2018). Although factors of the experimental setup might also contribute to this picture, this finding potentially indicates that the activation of a cellular stress response depends on the duration of low pH conditions and represent a short- to medium-term response.
In contrast, Pocillopora spp. and P. lutea showed no increase in stress level but a tendency to decrease lipid and protein content. This might indicate an ability to better mobilize existing energy reserves in response to low pH. This pattern has not been observed in previous studies (e.g., Schoepf et al., 2013; Strahl et al., 2016), suggesting that this OA response may also depend on other factors, such as variable feeding capabilities (Palardy et al., 2005; Towle et al., 2015). In Pocillopora spp., the changes in maintenance-associated parameters occurred without major reductions of calcification and volume growth under low pH. This was more pronounced in P. damicornis, which showed increased biomass while surface area growth decreased. The latter pattern might constitute a ‘buffering strategy’ via tissue thickening, previously observed only in Stylophora pistillata (Krief et al., 2010), but not in P. damicornis (Comeau et al., 2013; Schoepf et al., 2013). Thicker tissues might alleviate low pH effects by creating a larger pH-regulated separation between the callicoblastic layer and ambient seawater (Krief et al., 2010; Edmunds, 2011). Tissue thickness is thus considered a mediating trait of coral susceptibility to environmental stress (Loya et al., 2001; Thornhill et al., 2011), including OA (Putnam et al., 2017). A ‘buffering strategy’ might also be available to P. lutea due to the tendency observed here to increase tissue biomass while surface area growth decreased. However, this assumption needs to be further tested since both increases and no changes in area-normalized tissue biomass have been observed in massive Porites spp. (Edmunds, 2012; Brown and Edmunds, 2016).
The response of P. cylindrica presents another pattern, which has not previously been described. The marked reductions in volume growth were accompanied by a tendency to decrease cellular stress but without major changes of the underlying physiological parameters. This overall response to low pH was different to the one observed in P. lutea and could potentially be related to the morphological differences between these two species. However, similar calcification responses to OA have been found between mounding and branching morphologies (Comeau et al., 2014b) and both mounding and branching species have shown stronger impacts in multispecies comparisons (e.g., Brown and Edmunds, 2016; Godefroid et al., 2021). Instead, a potential explanation might be that P. cylindrica responds to low pH with a ‘hibernation strategy’. Accordingly, this species may avoid buffering the growth decrease through other physiological processes and suppress cellular stress alarms to potentially survive prolonged periods of stress. For instance, under high temperature stress coral species are able to avoid colony death following bleaching events by down-regulating caspase activity (Tchernov et al., 2011). Thus, at the expense of growth, this strategy might cause the least harm to the overall survival of the colony despite its weedy life-history (Darling et al., 2012).
Other factors may have contributed to the species-specific growth rates under OA in our study. First, coral responses to OA may be determined by growth rates, with faster calcifying corals experiencing larger calcification decreases than slower calcifying corals (Comeau et al., 2014b). Accordingly, the stronger low pH impacts observed here on growth of Porites spp. than Acropora spp. could be due to species’ growth rates during this study. Second, coral surface area growth is generally influenced by environmental parameters such as light or water flow (Schutter et al., 2011). However, additional external factors present in the system may also have played a role. In our study, volume and surface area growth were relatively low in general, especially in Acropora spp., which could potentially be attributed to indirect competition through allelopathy (Gross, 2003) and explain the null low pH effects on surface area growth of this genus (Horwitz et al., 2017). Furthermore, our massive Porites spp. showed higher volume and surface area growth rates than Acropora spp. despite being slow- and fast-growing corals, respectively (Darling et al., 2012 and references therein). This might be due to the colony fragmentation of our Porites spp., which provided more surface for the coral fragment to overgrow and led to an initial high growth response regardless of treatment. Third, coral growth responses to OA may also vary intraspecifically at colony level (e.g., Kavousi et al., 2016; Shaw et al., 2016). However, only three coral colonies per species were included in our study, which does not allow for investigation of colony sensitivity to low pH and was thus beyond the scope of our study. Fourth, OA effects on calcification are strongly determined by minimum pH values experienced (Vargas et al., 2022) and may be exacerbated by diel pH oscillation (Comeau et al., 2014a). In this study, acclimation and the ambient pH treatment had a larger pH range (ΔpH 0.6 units) than the low pH treatment (ΔpH 0.2 units). Therefore, our low pH effects might be underestimated. Similarly, variability experienced naturally by our colonies may have had further unknown effects. In summary, our findings indicate that growth responses alone may not fully reflect coral susceptibility to OA. Therefore, future studies incorporating non-calcification parameters and non-calcifying early coral life stages (e.g., Moya et al., 2015) will be important to better understand coral OA susceptibility. In addition, incorporating natural pH oscillation regimes may help understand the role of pH variability in coral acclimatization to OA, which is key since diel pH ranges are predicted to increase under future OA conditions (Shaw et al., 2013).
5 Conclusions
Our study suggests that coral growth under low pH is (i) mediated by different physiological parameters, whose interplay is (ii) genus- or species-specific. Specifically, our results indicate that the decrease in growth under low pH is mediated differently in Acropora and Pocillopora but is unmediated in Porites spp. These different physiological changes may include successful acclimatization as seen in Pocillopora and Porites spp. via buffering or hibernation strategies, but also unsuccessful acclimatization as seen in Acropora spp., in which growth was maintained at the expense of cellular stress. These findings underline the value of a multi-parametric approach to assess coral susceptibility to OA. This might help to improve our ability to interpret growth changes that reef-building corals experience under OA conditions and better predict the susceptibility of coral species to OA.
Data Availability Statement
Details of experimental tanks and coral species, seawater chemistry data and results of its statistical analysis, processed physiological data, model diagnostic plots, and model coefficients and CIs used in Figure 1 can be accessed in the Supplementary Material (Supplementary Figures S1–5, Supplementary Tables S1–5). Raw data and the physiological basis calculated from it were uploaded to figshare and are accessible at https://doi.org/10.6084/m9.figshare.19107380.
Author Contributions
Conceptualization: JR, PS, and TW; Investigation: AA, KK, PS, and JR; Formal analysis, Visualization, Writing – original draft: CM; Writing – review and editing: CM, MZ, TW, and JR; Project administration: JR; Funding acquisition: TW. All authors contributed to the article and approved the submitted version.
Funding
This study was conducted as part of the ‘Ocean2100’ global change simulation project of the Colombian-German Center of Excellence in Marine Sciences (CEMarin), funded by the German Academic Exchange Service. (DAAD, project number 57480468).
Conflict of Interest
The authors declare that the research was conducted in the absence of any commercial or financial relationships that could be construed as a potential conflict of interest.
Publisher’s Note
All claims expressed in this article are solely those of the authors and do not necessarily represent those of their affiliated organizations, or those of the publisher, the editors and the reviewers. Any product that may be evaluated in this article, or claim that may be made by its manufacturer, is not guaranteed or endorsed by the publisher.
Acknowledgments
We thank Thomas Timm and Silvia Nachtigall for their support in the lab and Torsten Hauffe for his help with the statistical analyses.
Supplementary Material
The Supplementary Material for this article can be found online at: https://www.frontiersin.org/articles/10.3389/fmars.2022.872631/full#supplementary-material
References
Al-Horani F. A. (2015). “Physiology of Skeletogenesis in Scleractinian Coral,” in Diseases of Coral (Hoboken, NJ: John Wiley & Sons, Inc), 192–205. doi: 10.1002/9781118828502.ch12
Anthony K. R. N. (2016). Coral Reefs Under Climate Change and Ocean Acidification: Challenges and Opportunities for Management and Policy. Annu. Rev. Environ. Resour. 41, 59–81. doi: 10.1146/annurev-environ-110615-085610
Bahr K. D., Jokiel P. L., Ku’ulei R. (2016). Relative Sensitivity of Five Hawaiian Coral Species to High Temperature Under High-Pco2 Conditions. Coral Reefs 35, 729–738. doi: 10.1007/s00338-016-1405-4
Brown D., Edmunds P. J. (2016). Differences in the Responses of Three Scleractinians and the Hydrocoral Millepora Platyphylla to Ocean Acidification. Mar. Biol. 163, 1–10. doi: 10.1007/s00227-016-2837-7
Buddemeier R. W., Maragos J. E., Knutson D. W. (1974). Radiographic Studies of Reef Coral Exoskeletons: Rates and Patterns of Coral Growth. J. Exp. Mar. Bio. Ecol. 14, 179–199. doi: 10.1016/0022-0981(74)90024-0
Chan N. C. S., Connolly S. R. (2013). Sensitivity of Coral Calcification to Ocean Acidification: A Meta-Analysis. Glob. Change Biol. 19, 282–290. doi: 10.1111/gcb.12011
Cignoni P., Callieri M., Corsini M., Dellepiane M., Ganovelli F., Ranzuglia G. (2008). MeshLab: An Open-Source Mesh Processing Tool. Sixth Eurographics Ital. Chapter Conf. 129–136. doi: 10.2312/LocalChapterEvents/ItalChap/ItalianChapConf2008/129-136
Comeau S., Cornwall C. E., DeCarlo T. M., Doo S. S., Carpenter R. C., McCulloch M. T. (2019). Resistance to Ocean Acidification in Coral Reef Taxa is Not Gained by Acclimatization. Nat. Clim. Change 9, 477–483. doi: 10.1038/s41558-019-0486-9
Comeau S., Cornwall C. E., McCulloch M. T. (2017). Decoupling Between the Response of Coral Calcifying Fluid pH and Calcification to Ocean Acidification. Sci. Rep. 7, 7573. doi: 10.1038/s41598-017-08003-z
Comeau S., Edmunds P. J., Spindel N. B., Carpenter R. C. (2013). The Responses of Eight Coral Reef Calcifiers to Increasing Partial Pressure of CO2 Do Not Exhibit a Tipping Point. Limnol. Oceanogr. 58, 388–398. doi: 10.4319/lo.2013.58.1.0388
Comeau S., Edmunds P. J., Spindel N. B., Carpenter R. C. (2014a). Diel Pco2 Oscillations Modulate the Response of the Coral Acropora Hyacinthus to Ocean Acidification. Mar. Ecol. Prog. Ser. 501, 99–111. doi: 10.3354/meps10690
Comeau S., Edmunds P. J., Spindel N. B., Carpenter R. C. (2014b). Fast Coral Reef Calcifiers Are More Sensitive to Ocean Acidification in Short-Term Laboratory Incubations. Limnol. Oceanogr. 59, 1081–1091. doi: 10.4319/lo.2014.59.3.1081
Conlan J. A., Jones P. L., Turchini G. M., Hall M. R., Francis D. S. (2014). Changes in the Nutritional Composition of Captive Early-Mid Stage Panulirus Ornatus Phyllosoma Over Ecdysis and Larval Development. Aquaculture 434, 159–170. doi: 10.1016/j.aquaculture.2014.07.030
Conlan J. A., Rocker M. M., Francis D. S. (2017). A Comparison of Two Common Sample Preparation Techniques for Lipid and Fatty Acid Analysis in Three Different Coral Morphotypes Reveals Quantitative and Qualitative Differences. PeerJ 5, e3645. doi: 10.7717/peerj.3645
Cuif J.-P., Dauphin Y. (2005). The Two-Step Mode of Growth in the Scleractinian Coral Skeletons From the Micrometre to the Overall Scale. J. Struct. Biol. 150, 319–331. doi: 10.1016/j.jsb.2005.03.004
Darling E. S., Alvarez-Filip L., Oliver T. A., McClanahan T. R., Côté I. M. (2012). Evaluating Life-History Strategies of Reef Corals From Species Traits. Ecol. Lett. 15, 1378–1386. doi: 10.1111/j.1461-0248.2012.01861.x
Dickson A. G., Millero F. J. (1987). A Comparison of the Equilibrium Constants for the Dissociation of Carbonic Acid in Seawater Media. Deep Sea Res. Part A. Oceanogr. Res. Pap. 34, 1733–1743. doi: 10.1016/0198-0149(87)90021-5
Dornelas M., Madin J. S., Baird A. H., Connolly S. R. (2017). Allometric Growth in Reef-Building Corals. Proc. R. Soc B Biol. Sci. 284, 20170053. doi: 10.1098/rspb.2017.0053
Edmunds P. (2007). Evidence for a Decadal-Scale Decline in the Growth Rates of Juvenile Scleractinian Corals. Mar. Ecol. Prog. Ser. 341, 1–13. doi: 10.3354/meps341001
Edmunds P. J. (2011). Zooplanktivory Ameliorates the Effects of Ocean Acidification on the Reef Coral Porites spp. Limnol. Oceanogr. 56, 2402–2410. doi: 10.4319/lo.2011.56.6.2402
Edmunds P. J. (2012). Effect of Pco2 on the Growth, Respiration, and Photophysiology of Massive Porites spp. In Moorea, French Polynesia. Mar. Biol. 159, 2149–2160. doi: 10.1007/s00227-012-2001-y
Edmunds P. J., Burgess S. C., Putnam H. M., Baskett M. L., Bramanti L., Fabina N. S., et al. (2014). Evaluating the Causal Basis of Ecological Success Within the Scleractinia: An Integral Projection Model Approach. Mar. Biol. 161, 2719–2734. doi: 10.1007/s00227-014-2547-y
Enochs I. C., Manzello D. P., Carlton R., Schopmeyer S., van Hooidonk R., Lirman D. (2014). Effects of Light and Elevated Pco2 on the Growth and Photochemical Efficiency of Acropora Cervicornis. Coral Reefs 33, 477–485. doi: 10.1007/s00338-014-1132-7
Enochs I. C., Manzello D. P., Jones P. J., Aguilar C., Cohen K., Valentino L., et al. (2018). The Influence of Diel Carbonate Chemistry Fluctuations on the Calcification Rate of Acropora Cervicornis Under Present Day and Future Acidification Conditions. J. Exp. Mar. Bio. Ecol. 506, 135–143. doi: 10.1016/j.jembe.2018.06.007
Evensen N. R., Bozec Y.-M., Edmunds P. J., Mumby P. J. (2021). Scaling the Effects of Ocean Acidification on Coral Growth and Coral–Coral Competition on Coral Community Recovery. PeerJ 9, e11608. doi: 10.7717/peerj.11608
Folch J., Lees M., Stanley G. H. S. (1957). A Simple Method for the Isolation and Purification of Total Lipides From Animal Tissues. J. Biol. Chem. 226, 497–509. doi: 10.1016/S0021-9258(18)64849-5
Gaylord B., Kroeker K. J., Sunday J. M., Anderson K. M., Barry J. P., Brown N. E., et al. (2015). Ocean Acidification Through the Lens of Ecological Theory. Ecology 96, 3–15. doi: 10.1890/14-0802.1
Gnaiger E., Bitterlich G. (1984). Proximate Biochemical Composition and Caloric Content Calculated From Elemental CHN Analysis: A Stoichiometric Concept. Oecologia 62, 289–298. doi: 10.1007/BF00384259
Godefroid M., Arçuby R., Lacube Y., Espiau B., Dupont S., Gazeau F., et al. (2021). More Than Local Adaptation: High Diversity of Response to Seawater Acidification in Seven Coral Species From the Same Assemblage in French Polynesia. J. Mar. Biol. Assoc. United Kingdom 101, 675–683. doi: 10.1017/S0025315421000618
Gross E. M. (2003). Allelopathy of Aquatic Autotrophs. CRC. Crit. Rev. Plant 22, 313–339. doi: 10.1080/713610859
Holcomb M., Venn A. A., Tambutté E., Tambutté S., Allemand D., Trotter J., et al. (2014). Coral Calcifying Fluid pH Dictates Response to Ocean Acidification. Sci. Rep. 4, 1–4. doi: 10.1038/srep05207
Horwitz R., Hoogenboom M. O., Fine M. (2017). Spatial Competition Dynamics Between Reef Corals Under Ocean Acidification. Sci. Rep. 7, 40288. doi: 10.1038/srep40288
Hui F. K. C. (2016). BORAL – Bayesian Ordination and Regression Analysis of Multivariate Abundance Data in R. Methods Ecol. Evol. 7, 744–750. doi: 10.1111/2041-210X.12514
Hui F. K. C. (2020) Boral: Bayesian Ordination and Regression Analysis. Available at: https://CRAN.R-project.org/package=boral.
IPCC, Core Writing Team (2014). Climate Change 2014: Synthesis Report. Contribution of Working Groups I, II and III to the Fifth Assessment Report of the Intergovernmental Panel on Climate Change. Eds. Pachauri R. K., Meyer L. A. (Geneva, Switzerland: IPCC).
Kaniewska P., Campbell P. R., Kline D. I., Rodriguez-Lanetty M., Miller D. J., Dove S., et al. (2012). Major Cellular and Physiological Impacts of Ocean Acidification on a Reef Building Coral. PloS One 7, e34659. doi: 10.1371/journal.pone.0034659
Kaniewska P., Chan C. K., Kline D., Yew E., Ling S., Rosic N., et al. (2015). Transcriptomic Changes in Coral Holobionts Provide Insights Into Physiological Challenges of Future Climate and Ocean Change. PloS One 10, e0139223. doi: 10.1371/journal.pone.0139223
Kassambara A., Mundt F. (2020) Factoextra: Extract and Visualize the Results of Multivariate Data Analyses. Available at: https://CRAN.R-project.org/package=factoextra.
Kavousi J., Tanaka Y., Nishida K., Suzuki A., Nojiri Y., Nakamura T. (2016). Colony-Specific Calcification and Mortality Under Ocean Acidification in the Branching Coral Montipora Digitata. Mar. Environ. Res. 119, 161–165. doi: 10.1016/j.marenvres.2016.05.025
Kayal M., Lenihan H. S., Brooks A. J., Holbrook S. J., Schmitt R. J., Kendall B. E. (2019). Predicting Coral Community Recovery Using Multi-Species Population Dynamics Models. Ecol. Lett. 22, 605–615. doi: 10.1111/ele.13203
Kenkel C. D., Moya A., Strahl J., Humphrey C., Bay L. K. (2018). Functional Genomic Analysis of Corals From Natural CO2-Seeps Reveals Core Molecular Responses Involved in Acclimatization to Ocean Acidification. Glob. Change Biol. 24, 158–171. doi: 10.1111/gcb.13833
Kornder N. A., Riegl B. M., Figueiredo J. (2018). Thresholds and Drivers of Coral Calcification Responses to Climate Change. Glob. Change Biol. 24, 5084–5095. doi: 10.1111/gcb.14431
Krief S., Hendy E. J., Fine M., Yam R., Meibom A., Foster G. L., et al. (2010). Physiological and Isotopic Responses of Scleractinian Corals to Ocean Acidification. Geochim. Cosmochim. Acta 74, 4988–5001. doi: 10.1016/j.gca.2010.05.023
Kroeker K. J., Kordas R. L., Crim R., Hendriks I. E., Ramajo L., Singh G. S., et al. (2013). Impacts of Ocean Acidification on Marine Organisms: Quantifying Sensitivities and Interaction With Warming. Glob. Change Biol. 19, 1884–1896. doi: 10.1111/gcb.12179
Kruschke J. K. (2010). Doing Bayesian Data Analysis: A Tutorial With R and BUGS. 1st ed (Cambridge, MA: Academic Press).
Kruschke J. K. (2018). Rejecting or Accepting Parameter Values in Bayesian Estimation. Adv. Methods Pract. Psychol. Sci. 1, 270–280. doi: 10.1177/2515245918771304
Lê S., Josse J., Husson F. (2008). FactoMineR: An R Package for Multivariate Analysis. J. Stat. Software 25, 1–18. doi: 10.18637/jss.v025.i01
Liu T., Brouha B., Grossman D. (2004). Rapid Induction of Mitochondrial Events and Caspase-Independent Apoptosis in Survivin-Targeted Melanoma Cells. Oncogene 23, 39–48. doi: 10.1038/sj.onc.1206978
Loya Y., Sakai K., Yamazato K., Nakano Y., Sambali H., Van Woesik R. (2001). Coral Bleaching: The Winners and the Losers. Ecol. Lett. 4, 122–131. doi: 10.1046/j.1461-0248.2001.00203.x
Mehrbach C., Culberson C. H., Hawley J. E., Pytkowicx R. M. (1973). Measurement of the Apparent Dissociation Constants of Carbonic Acid in Seawater at Atmospheric Pressure. Limnol. Oceanogr. 18, 897–907. doi: 10.4319/lo.1973.18.6.0897
Mollica N. R., Guo W., Cohen A. L., Huang K., Foster G. L., Donald H. K., et al. (2018). Ocean Acidification Affects Coral Growth by Reducing Skeletal Density. Proc. Natl. Acad. Sci. 115, 1754–1759. doi: 10.1073/pnas.1712806115
Moya A., Huisman L., Forêt S., Gattuso J.-P., Hayward D. C., Ball E. E., et al. (2015). Rapid Acclimation of Juvenile Corals to CO2-Mediated Acidification by Upregulation of Heat Shock Protein and Bcl-2 Genes. Mol. Ecol. 24, 438–452. doi: 10.1111/mec.13021
Neath A. A., Cavanaugh J. E. (2006). A Bayesian Approach to the Multiple Comparisons Problem. J. Data Sci. 4, 131–146. doi: 10.6339/JDS.2006.04(2).266
Ohde S., Van Woesik R. (1999). Carbon Dioxide Flux and Metabolic Processes of a Coral Reef, Okinawa. Bull. Mar. Sci. 65, 559–576.
Palardy J., Grottoli A., Matthews K. (2005). Effects of Upwelling, Depth, Morphology and Polyp Size on Feeding in Three Species of Panamanian Corals. Mar. Ecol. Prog. Ser. 300, 79–89. doi: 10.3354/meps300079
Pelletier G., Lewis E., Wallace D. (2007). CO2Sys. Xls: A Calculator for the CO2 System in Seawater for Microsoft Excel/VBA. Washingt. State Dep. Ecol. Natl. Lab. Olympia WA/Upton NY U.S.A.
Pratchett M. S., Anderson K. D., Hoogenboom M. O., Widman E., Baird A. H., Pandolfi J. M., et al. (2015). Spatial, Temporal and Taxonomic Variation in Coral Growth—Implications for the Structure and Function of Coral Reef Ecosystems. Oceanogr. Mar. Biol. Annu. Rev. 53, 215–295.
Putnam H. M., Barott K. L., Ainsworth T. D., Gates R. D. (2017). The Vulnerability and Resilience of Reef-Building Corals. Curr. Biol. 27, R528–R540. doi: 10.1016/j.cub.2017.04.047
R Core Team (2021) R: A Language and Environment for Statistical Computing. Available at: https://www.r-project.org/.
Reichert J., Schellenberg J., Schubert P., Wilke T. (2016). 3D Scanning as a Highly Precise, Reproducible, and Minimally Invasive Method for Surface Area and Volume Measurements of Scleractinian Corals. Limnolgy Oceanogr. Methods 14, 518–526. doi: 10.1002/lom3.10109
R Studio Team (2021) RStudio: Integrated Development Environment for R. Available at: http://www.rstudio.com/.
Sørensen J. G., Kristensen T. N., Loeschcke V. (2003). The Evolutionary and Ecological Role of Heat Shock Proteins. Ecol. Lett. 6, 1025–1037. doi: 10.1046/j.1461-0248.2003.00528.x
Schoepf V., Grottoli A. G., Warner M. E., Cai W. J., Melman T. F., Hoadley K. D., et al. (2013). Coral Energy Reserves and Calcification in a High-CO2 World at Two Temperatures. PloS One 8, e75049. doi: 10.1371/journal.pone.0075049
Schoepf V., Jury C. P., Toonen R. J., McCulloch M. T. (2017). Coral Calcification Mechanisms Facilitate Adaptive Responses to Ocean Acidification. Proc. R. Soc B Biol. Sci. 284, 20172117. doi: 10.1098/rspb.2017.2117
Schutter M., Kranenbarg S., Wijffels R. H., Verreth J., Osinga R. (2011). Modification of Light Utilization for Skeletal Growth by Water Flow in the Scleractinian Coral Galaxea Fascicularis. Mar. Biol. 158, 769–777. doi: 10.1007/s00227-010-1605-3
Shaw E. C., Carpenter R. C., Lantz C. A., Edmunds P. J. (2016). Intraspecific Variability in the Response to Ocean Warming and Acidification in the Scleractinian Coral Acropora Pulchra. Mar. Biol. 163, 1–11. doi: 10.1007/s00227-016-2986-8
Shaw E. C., McNeil B. I., Tilbrook B. (2012). Impacts of Ocean Acidification in Naturally Variable Coral Reef Flat Ecosystems. J. Geophys. Res. Ocean. 117, 1–14. doi: 10.1029/2011JC007655
Shaw E. C., McNeil B. I., Tilbrook B., Matear R., Bates M. L. (2013). Anthropogenic Changes to Seawater Buffer Capacity Combined With Natural Reef Metabolism Induce Extreme Future Coral Reef CO2 Conditions. Glob. Change Biol. 19, 1632–1641. doi: 10.1111/gcb.12154
Spencer Davies P. (1989). Short-Term Growth Measurements of Corals Using an Accurate Buoyant Weighing Technique. Mar. Biol. 101, 389–395. doi: 10.1007/BF00428135
Strahl J., Francis D. S., Doyle J., Humphrey C., Fabricius K. E. (2016). Biochemical Responses to Ocean Acidification Contrast Between Tropical Corals With High and Low Abundances at Volcanic Carbon Dioxide Seeps. ICES J. Mar. Sci. 73, 897–909. doi: 10.1093/icesjms/fsv194
Sunday J. M., Fabricius K. E., Kroeker K. J., Anderson K. M., Brown N. E., Barry J. P., et al. (2017). Ocean Acidification can Mediate Biodiversity Shifts by Changing Biogenic Habitat. Nat. Clim. Change 7, 81–86. doi: 10.1038/NCLIMATE3161
Takahashi T. (1982). “Carbonate Chemistry,” in GEOSECS Pacific Expedition, Volume 3, Hydrographic Data 1973-1974 (Washington, DC: National Science Foundation), 77–83.
Tambutté E., Venn A. A., Holcomb M., Segonds N., Techer N., Zoccola D., et al. (2015). Morphological Plasticity of the Coral Skeleton Under CO2-Driven Seawater Acidification. Nat. Commun. 6, 7368. doi: 10.1038/ncomms8368
Tchernov D., Kvitt H., Haramaty L., Bibbyd T. S., Gorbunov M. Y., Rosenfeld H., et al. (2011). Apoptosis and the Selective Survival of Host Animals Following Thermal Bleaching in Zooxanthellate Corals. Proc. Natl. Acad. Sci. U. S. A. 108, 9905–9909. doi: 10.1073/pnas.1106924108
Thornhill D. J., Rotjan R. D., Todd B. D., Chilcoat G. C., Iglesias-prieto R., Kemp D. W., et al. (2011). A Connection Between Colony Biomass and Death in Caribbean Reef-Building Corals. PloS One 6, e29535. doi: 10.1371/journal.pone.0029535
Towle E. K., Enochs I. C., Langdon C. (2015). Threatened Caribbean Coral is Able to Mitigate the Adverse Effects of Ocean Acidification on Calcification by Increasing Feeding Rate. PloS One 10, 1–17. doi: 10.1371/journal.pone.0123394
Vargas C. A., Cuevas L. A., Broitman B. R., San Martin V. A., Lagos N. A., Gaitán-Espitia J. D., et al. (2022). Upper Environmental Pco2 Drives Sensitivity to Ocean Acidification in Marine Invertebrates. Nat. Clim. Change 12, 200–207. doi: 10.1038/s41558-021-01269-2
Wall C. B., Mason R. A. B., Ellis W. R., Cunning R., Gates R. D. (2017). Elevated Pco2 Affects Tissue Biomass Composition, But Not Calcification, in a Reef Coral Under Two Light Regimes. R. Soc Open Sci. 4, 170683. doi: 10.1098/rsos.170683
Watson S. A., Fabricius K. E., Munday P. L. (2017). Quantifying Pco2 in Biological Ocean Acidification Experiments: A Comparison of Four Methods. PloS One 12, e0185469. doi: 10.1371/journal.pone.0185469
Wickham H. (2016). Ggplot2: Elegant Graphics for Data Analysis (New York:Springer). Available at: https://ggplot2.tidyverse.org.
Ziegler M., Anton A., Klein S. G., Rädecker N., Geraldi N. R., Schmidt-Roach S., et al. (2021). Integrating Environmental Variability to Broaden the Research on Coral Responses to Future Ocean Conditions. Glob. Change Biol. 27, 5532–5546. doi: 10.1111/gcb.15840
Keywords: ocean acidification, scleractinian corals, eco-physiology, susceptibility, coral metabolism
Citation: Martins CPP, Arnold AL, Kömpf K, Schubert P, Ziegler M, Wilke T and Reichert J (2022) Growth Response of Reef-Building Corals to Ocean Acidification Is Mediated by Interplay of Taxon-Specific Physiological Parameters. Front. Mar. Sci. 9:872631. doi: 10.3389/fmars.2022.872631
Received: 09 February 2022; Accepted: 06 May 2022;
Published: 09 June 2022.
Edited by:
Aldo Cróquer, The Nature Conservancy (Dominican Republic), Dominican RepublicReviewed by:
Ian C. Enochs, Atlantic Oceanographic and Meteorological Laboratory (NOAA), United StatesSam Dupont, University of Gothenburg, Sweden
Copyright © 2022 Martins, Arnold, Kömpf, Schubert, Ziegler, Wilke and Reichert. This is an open-access article distributed under the terms of the Creative Commons Attribution License (CC BY). The use, distribution or reproduction in other forums is permitted, provided the original author(s) and the copyright owner(s) are credited and that the original publication in this journal is cited, in accordance with accepted academic practice. No use, distribution or reproduction is permitted which does not comply with these terms.
*Correspondence: Catarina P. P. Martins, Y2F0YXJpbmEucGFkaWxoYS1waXJlcy1tYXJ0aW5zQGJpby51bmktZ2llc3Nlbi5kZQ==