 Yudisleyvis Ventura1,2
 Yandy Rodríguez2
 Itxaso Odériz2,3
 Valeria Chávez2*
 Nobuhito Mori4,5
 Angélica Felix2,6
 Sergio Cerdeira-Estrada7
 Rodolfo Silva2
- 1Posgrado en Geografía, Facultad de Filosofía y Letras, Universidad Nacional Autónoma de México, Mexico City, Mexico
- 2Instituto de Ingeniería, Universidad Nacional Autónoma de México, Mexico City, Mexico
- 3IHCantabria - Instituto de Hidráulica Ambiental de la Universidad de Cantabria, Santander, Spain
- 4Disaster Prevention Research Institute, Kyoto University, Kyoto, Japan
- 5School of Engineering, Swansea University, Swansea, United Kingdom
- 6Consejo Nacional de Ciencia y Tecnología, Mexico City, Mexico
- 7Dirección General de Geomática, Comisión Nacional para el Conocimiento y Uso de la Biodiversidad, Mexico City, Mexico
The electrical grid of the Baja California peninsula, Mexico, operates separately from the National Interconnected System, with Baja California connected to the Western Electricity Coordinating Council of the USA; and Baja California Sur having an isolated, independent network. Based on the need for alternative renewable sources of electricity generation in the region, this work evaluates the wave energy power at specific locations on the Pacific coast of the peninsula, and identifies wave generation sites (WEGS). The WEGS were defined as rocky shore sites associated with a wave energy potential of over 10 kW/m (where the installation of oscillating water columns (OWC) is feasible) and the presence of coastal settlements that are less than 10 km from the shoreline. It was found that 370 km of the Pacific coast of the peninsula have characteristics suitable for the installation of OWC, and up to 1.4 million inhabitants could be benefited by this wave energy harvesting.
1 Introduction
The increase in size of touristic, residential, and industrial areas in the Baja California peninsula, Mexico, has increased the demand for electricity in the region. In addition, economic activities related to the tourist industry contribute to the Mexican gross domestic product (4.4% in 2019) (INEGI, Producto interno bruto por entidad federativa 2019, 2020), exacerbating the irregularity in the demand for electricity from this isolated system of electricity supply.
The Baja California peninsula is located in the northwest of Mexico and comprises two states: Baja California (BC) and Baja California Sur (BCS) (Figure 1A); and 5 municipalities each (Figure 1B). In this region, the electrical energy needs of urban areas (see Figure 1C) are supplied mainly by thermal and geothermal plants, highlighting the need for a climate change mitigation plan in the region. These plants are in the north of BC and along the coast of BCS, as shown in (Figure 1D) (INEGI, 2021). The electrical systems of the peninsula operate independently from the National Interconnected System of Mexico, with the BC system connected to the electricity network of the western region of the USA; and the BCS system, comprised of the BCS and Mulegé, isolated from other electricity networks and operating independently from each other (INEGI, Instituto Nacional de Estadística y Geografía (México)., 2017).
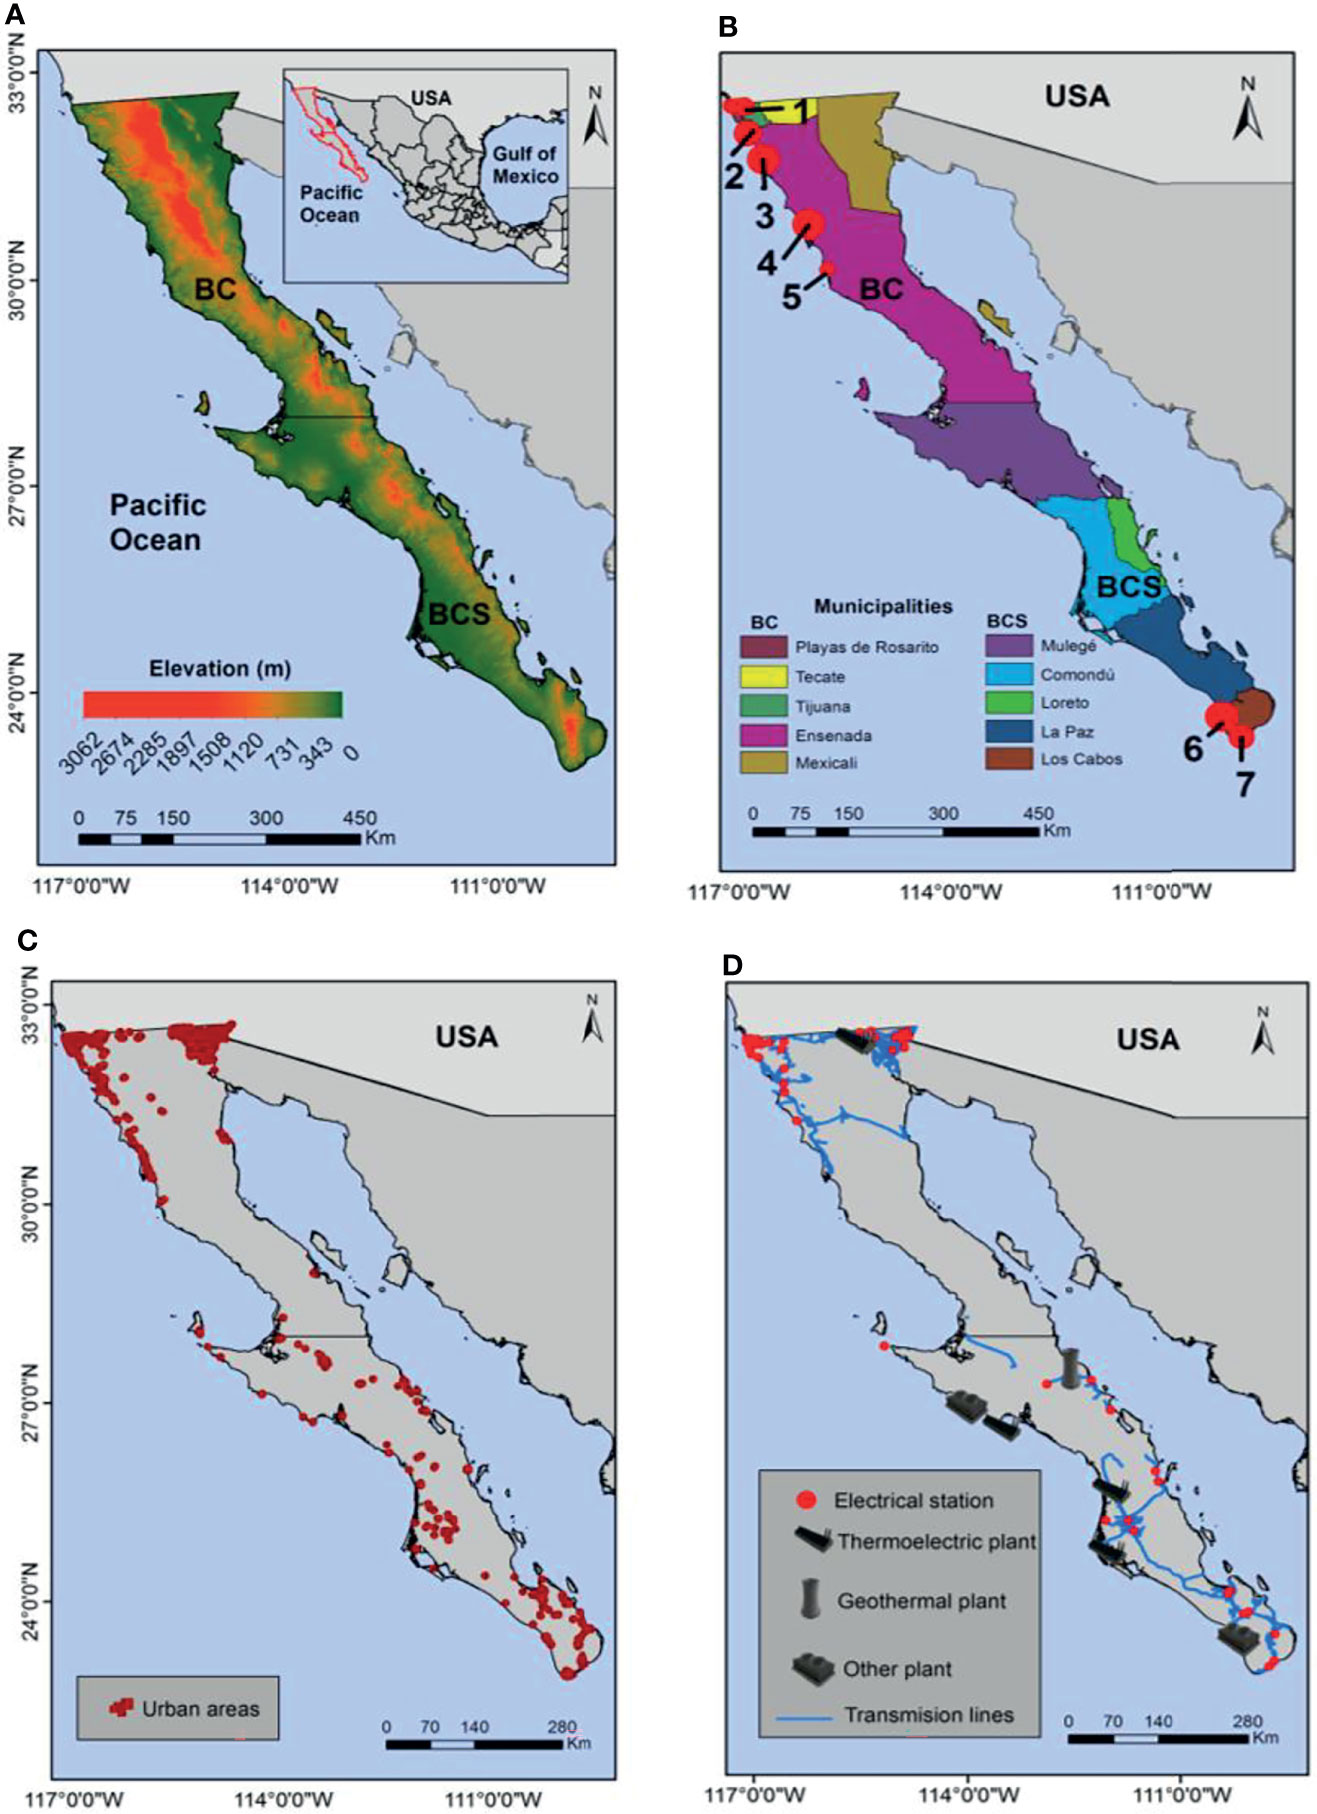
Figure 1 (A) Location of the Mexican states of Baja California (BC) and Baja California Sur (BCS). (B) Municipalities and the most populated coastal settlements (>3 000 inhabitants): 1. Tijuana, 2. Santa Anita, 3. Coronel Esteban Cantú, 4. San Ramón, 5. El Rosario de Abajo, 6. Ejido Plutarco Elías Calles, and 7. Residencial Amalfid). (C) Urban areas (>800 inhabitants). (D) Electricity networks in the peninsula. Data from INEGI (2021).
According to the National Institute of Statistics and Geography (INEGI), from 2002 to 2017, more energy was produced than was consumed in both states (Figures 2A, B). Furthermore, an increase in consumption and generation was reported. However, in rural settlements of <800 inhabitants, less than 30% of the population had access to electricity in 2015 (Figure 2C). In this context, micro-generating plants could solve the electricity needs of small populations. Furthermore, in the case of small coastal settlements, the harvesting of ocean energy is a promising option (Hernández-Fontes et al., 2019) and is aligned with United Nations Sustainable Goals (UN-SG7, 9, 10, 11, and 13).
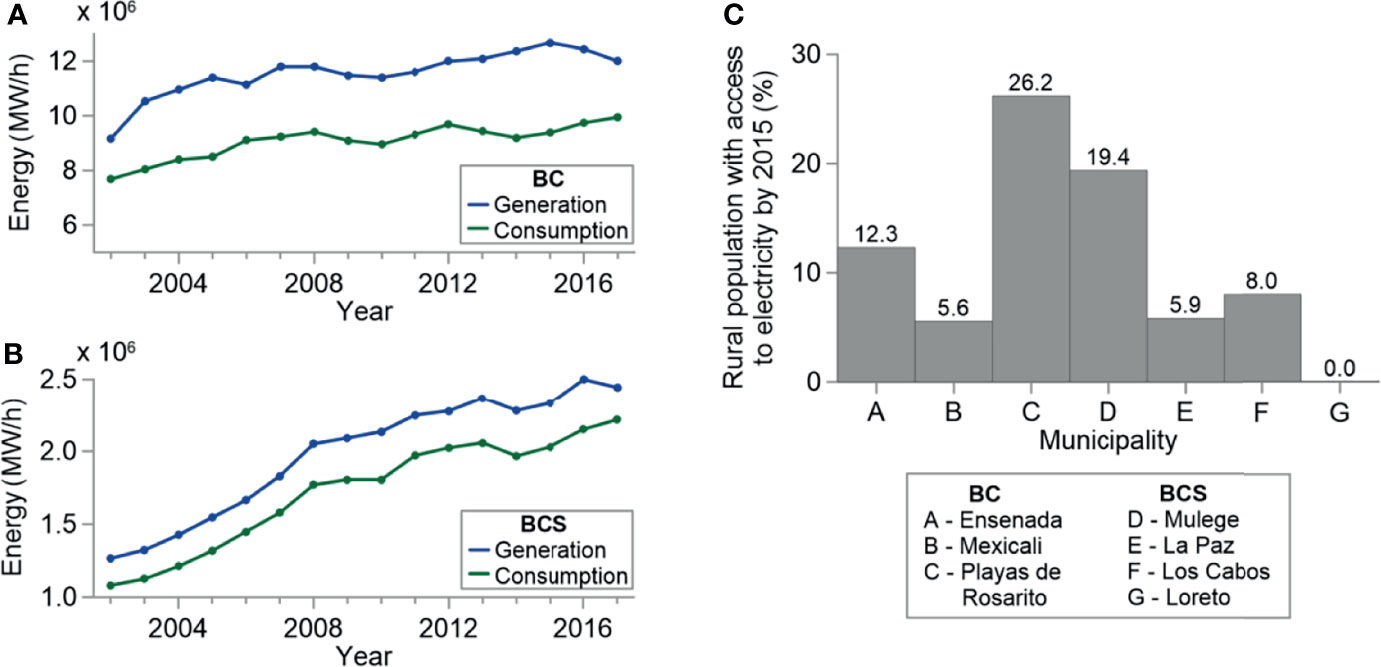
Figure 2 Energy generated and consumed in (A) Baja California (BC) and (B) Baja California Sur (BCS) from 2002 - 2017. (C) Rural population with access to electricity in BC and BCS.
While several works have described the potential of ocean wave energy in Mexico (González-Ramírez et al., 2016; Hernández-Fontes et al., 2019; Hernández-Fontes et al., 2019; Alcérreca-Huerta et al., 2019), no devices have yet been installed due to the high cost of the devices and the lack of studies on the development of technology. Fairley et al. (2020) (Fairley et al., 2020) classified world coastlines by their wave energy, categorizing the Pacific coast of the Baja California peninsula as promising, with “moderate wave energy” available almost all the year, mainly in the northern part of the peninsular Pacific coast. They concluded that, in specific locations, deploying efficient devices with low but persistent energy is feasible. These studies did not assess the relationships between wave-energy generation at the ERA-5 nodes, the geomorphological characteristics of the coastline and the social conditions of coastal settlements here. As yet, these relationships have not been studied to any extent, and specifically, the influence of coastal settlement distribution and the geomorphological characteristics of the coastline on the spatial planning for wave energy extraction has not been evaluated in this area.
This paper aims to analyse the wave power characteristics off the Pacific coast of the Baja California peninsula and identify possible sites on rocky shore sites for wave energy harvesting. Based on the work of (Rangel Carboney, 2018), the Oscillating Water Column (OWC) technology was chosen over other WECs because of its advantages on rocky shores.
2 Materials and Methods
In order to choose the most suitable sites for wave energy harvesting (wave energy generation sites, WEGS), variables and indicators, such as wave power, geomorphology and social aspects, were jointly analysed. In relation to the wave regime, the variables analysed were: mean, 90, 95 and 99 percentiles of wave power; duration, time elapsed between storms, mean significant wave height, maximum wave height, peak period, mean wave direction, mean wave power, and wave directional spectral width; and wave energy projections based on a climate change scenario. In relation to geomorphological characteristics, the Topographic Position Index was selected as an indicator. For demographic conditions, the total population and population density were analysed (Evans and Antonio, 2012).
2.1 Historical Wave Energy Data
To characterize the historical wave climate, wave parameters from the reanalysis dataset ERA-5 (Evans and Antonio, 2012) were used, with a grid of 0.5°, hourly resolution, and temporal coverage from 1979 to 2018. The wave power (kW/m) was calculated for irregular waves using equation 1 (Evans and Antonio, 2012).
where Hs (m) is the significant wave height of combined wind waves and swell, and Te is the energy period (s); where α=1.08 (Webb and Fox-Kemper, 2011) and T01 (s) is the mean wave period.
Long-term statistical analysis of sea states was carried out by computing the mean and some representative percentiles (90%, 95%, and 99%) of the Pw. The mean value reflects the average power that we can obtain from waves, while the percentiles reflect the maximum wave power that could be extracted a certain percentage of the time without taking into account the extreme meteorological events associated with wave energy. These statistics were correlated with the geomorphological characteristics and settlements in the coastal zone of the study area.
As extreme meteorological events can put at risk an OWC device, these became an important part of this paper because the devices would be faced with maximum wave power during extreme meteorological events. Therefore, the devices must be designed to withstand these conditions or to stop working for the duration of them.
Storms induced by extreme events were defined following (Martell et al., 2020), with an extreme event having a significant wave height that exceeds the percentile 90th (Hs90) or the percentile 99th (Hs99) [according to (Bromirski et al., 2013; Martell et al., 2020)], and the minimum time interval between two events being 12 hours. The following parameters of storm-generated waves were analysed, duration (hr), time intervals of storm clusters (IN, defined as the time elapsed between storms in days), mean significant wave height (Hs), maximum significant wave height (Hsmax), peak period (2021), mean wave direction (Dirm), mean wave power (PwE), and wave directional spectral width (Sw).
In order to evaluate long-term variability, the dataset of (Odériz et al., 2020a) was used, which consists of correlation coefficients between wave power and climate indexes. This dataset includes three climate patterns El-Niño Southern Oscillation (ENSO), Pacific Decadal Oscillation (PDO), and Atlantic Multi-decadal Oscillation (AMO). For each climate pattern, the ONI (Oceanic Niño Index), PDO index, and AMO index, from NOAA were respectively used to compute the correlation coefficients.
2.2 Wave Energy Projections Based on a Climate Change Scenario
The wave energy was evaluated for the high-emissions scenario Representative Concentration Pathway (RCP) 8.5, and the wave climate projection dataset (Shimura and Mori, 2020) was used. The wave propagation was modelled with WAVEWATCHIII, and forced with atmospheric wind conditions, using ensembles from the Japanese Meteorological Research Institute-Atmospheric GCM (MRI-AGCM3.2H), and the COBE SST and CMIP5 for sea ice concentrations. The dataset has a 0.5° spatial and hourly temporal resolution over the globe, but this study focuses on the monthly average of wave power (equation 1). The time range is 25 years, 1979 - 2003, for the baseline conditions, and 2075 - 2099 for the RCP8.5 scenario. Although the validation process is not presented here, the monthly significant wave height of baseline conditions was validated with altimetry data, using GlobWave for 1992-2003. This showed a good performance with an annual bias of ~ -0.1.
2.3 Coastal Geomorphology
Coastline characteristics are one of the most important parameters in defining potential sites for Oscillating Water Column (OWC) (Nezhad et al., 2018). Rocky shores are the most feasible type, as they offer a stable and hard substrate onto which an onshore device can be anchored.
Rocky shores were identified by computing the Topographic Position Index (TPI) (Weiss, 2000; Spijker, 2013; Jasiewicz and Stepinski, 2013), using the ASTER Digital Elevation Model (DEM) at 30 m spatial resolution (NASA., 2019). The TPI is the difference between the elevation of a specific location and the average elevation of neighbouring locations within a radius of 100 m. Positive TPI is peaks or hills, while negative TPI are valleys or depressions. The average elevation of neighbouring locations was computed using a zonal statistic tool, from the ArcMap Toolbox. Once the TPI values where computed, rocky shore sites were identified as locations on the coastline where the relative elevation is higher than the surrounding TPI values. These sites were identified as either natural, or as having infrastructure. These were then validated and a consensus reached, using the dataset of Cruz et al. (2019).
2.4 Social Characteristics
The total population and population density of the coastal settlements on the peninsula were the parameters used. The data was obtained from (Cruz et al., 2019), as these were the only variables available for all the coastal settlements along the Baja California Pacific coast. Also, in urban settlements, generally, energy consumption directly relates to the total population and population density
The total population and population density for the coastal settlements also include the data from Population Density v4.11, for the year 2020 (Warszawski et al., 2017). The analysis of this data includes extraction by mask, summary statistics and tabulate intersection; all those processes developed using ArcMap 10.4.
2.5 Wave Energy Generation Sites (WEGS) Identification
Each rocky shore site was associated with one of the ERA-5 nodes. Since detailed bathymetry is not available for most of the marine area of the Baja California peninsula, the wave values at the ERA-5 nodes were considered to be representative of the wave values that would be found in rocky coastal areas. While some of the wave energy may be lost from the nodes, where the information was taken, to the coast, due to friction effects, the seabed configuration near the cliffs concentrates the energy through refraction and diffraction, so that the wave power values could actually be slightly higher at the coast than at the node. As sites with wave power of less than 10 kW/m, low-consuming electrical grids are needed for energy extraction, therefore the wave energy threshold selected was 10 kW/m.
Regarding the coastal settlements that could be benefited from wave energy harvesting, those located up to 10 km inland from the coastline were selected, in order guarantee the economic feasibility by selecting half the distance reported by (Hernández-Fontes et al., 2020).
These variables, in conjunction with rocky shore sites suitable for OWC deployment, lead to the definition of the WEGS (sites where wave energy is over 10 kW/m, and there are human settlements within 10 km of the rocky shores).
3 Results
3.1 Potential Wave Energy
The predominant wave climate in Baja California is extratropical, with a subtropical wave climate in summer, mainly in the southern part of the peninsula. This condition influences the persistence of the wave power and the values it can reach.
The average annual wave power on the peninsula (Figure 3A) is less than 20 kW/m, 20% of the region analysed is less than 10 kW/m, and 80% exceeds this threshold.
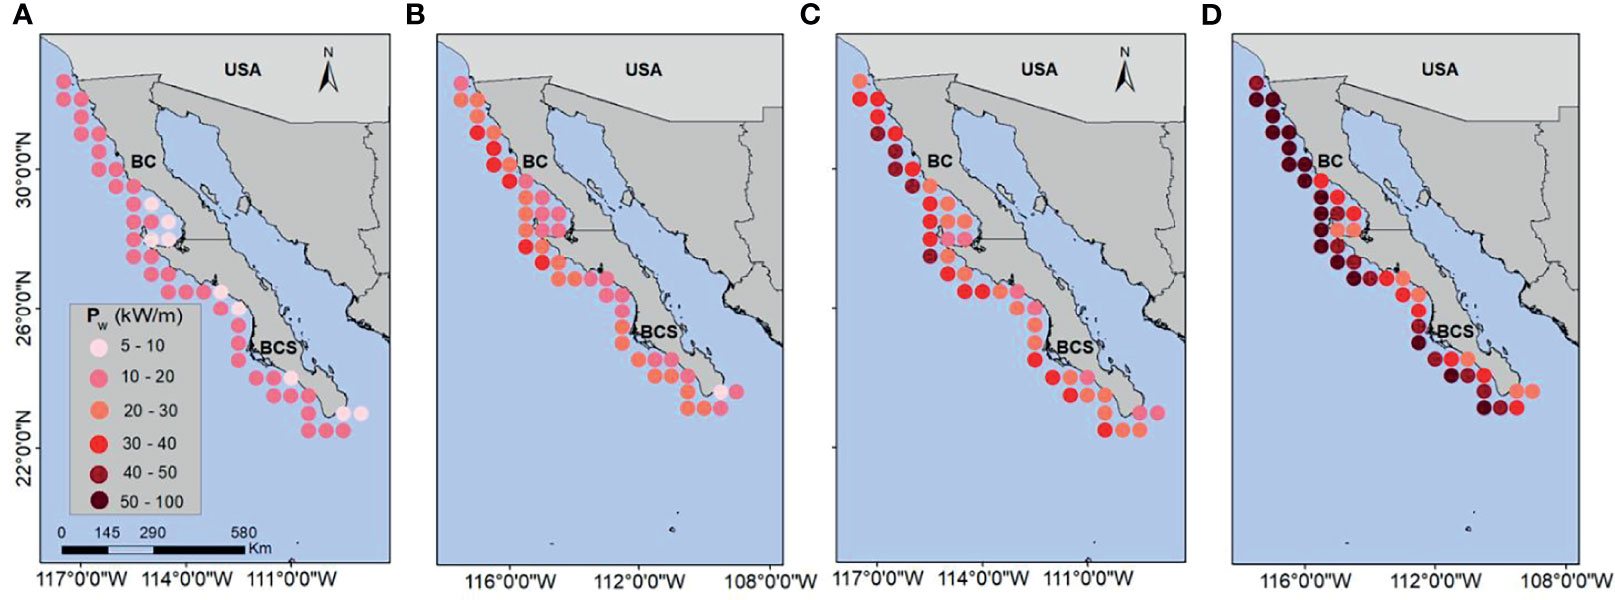
Figure 3 Wave Power: (A) Annual average, (B) annual average of percentile 90%, (C) annual average of percentile 95%, and (D) annual average of percentile 99%.
As expected, from analysis of the 90th, 95th and 99th percentiles (Figures 3B-D), it was seen that the wave power increases with the percentile rank. Secondly, the differences in wave power between the percentile ranks are greater in the north of the peninsula, in BC, where there is the highest number of possible ERA-5 nodes with a wave power potential over 50 kW/m. On the BCS area, the ERA-5 nodes with the lowest values of wave power are found, and only three nodes have wave power of over 50 kW/m; in both annual average and the percentiles analysed.
3.1.1 Storms Waves
Analysis of storm data shows that the highest significant wave heights are found in the north part of the BCS Pacific coast (Figure 4A), while maximum values for peak periods are in the southern part of the peninsula (Figure 4B). The storm wave direction for ERA-5 nodes in BC is over 270° from the north (Figure 4C); while in BCS the storm wave direction for the ERA-5 nodes lies in the three identified ranges (<180°, 180° - 270° and > 270°), with only one ERA-5 node, in the south of the peninsula, having a value of less than 180° (163°).
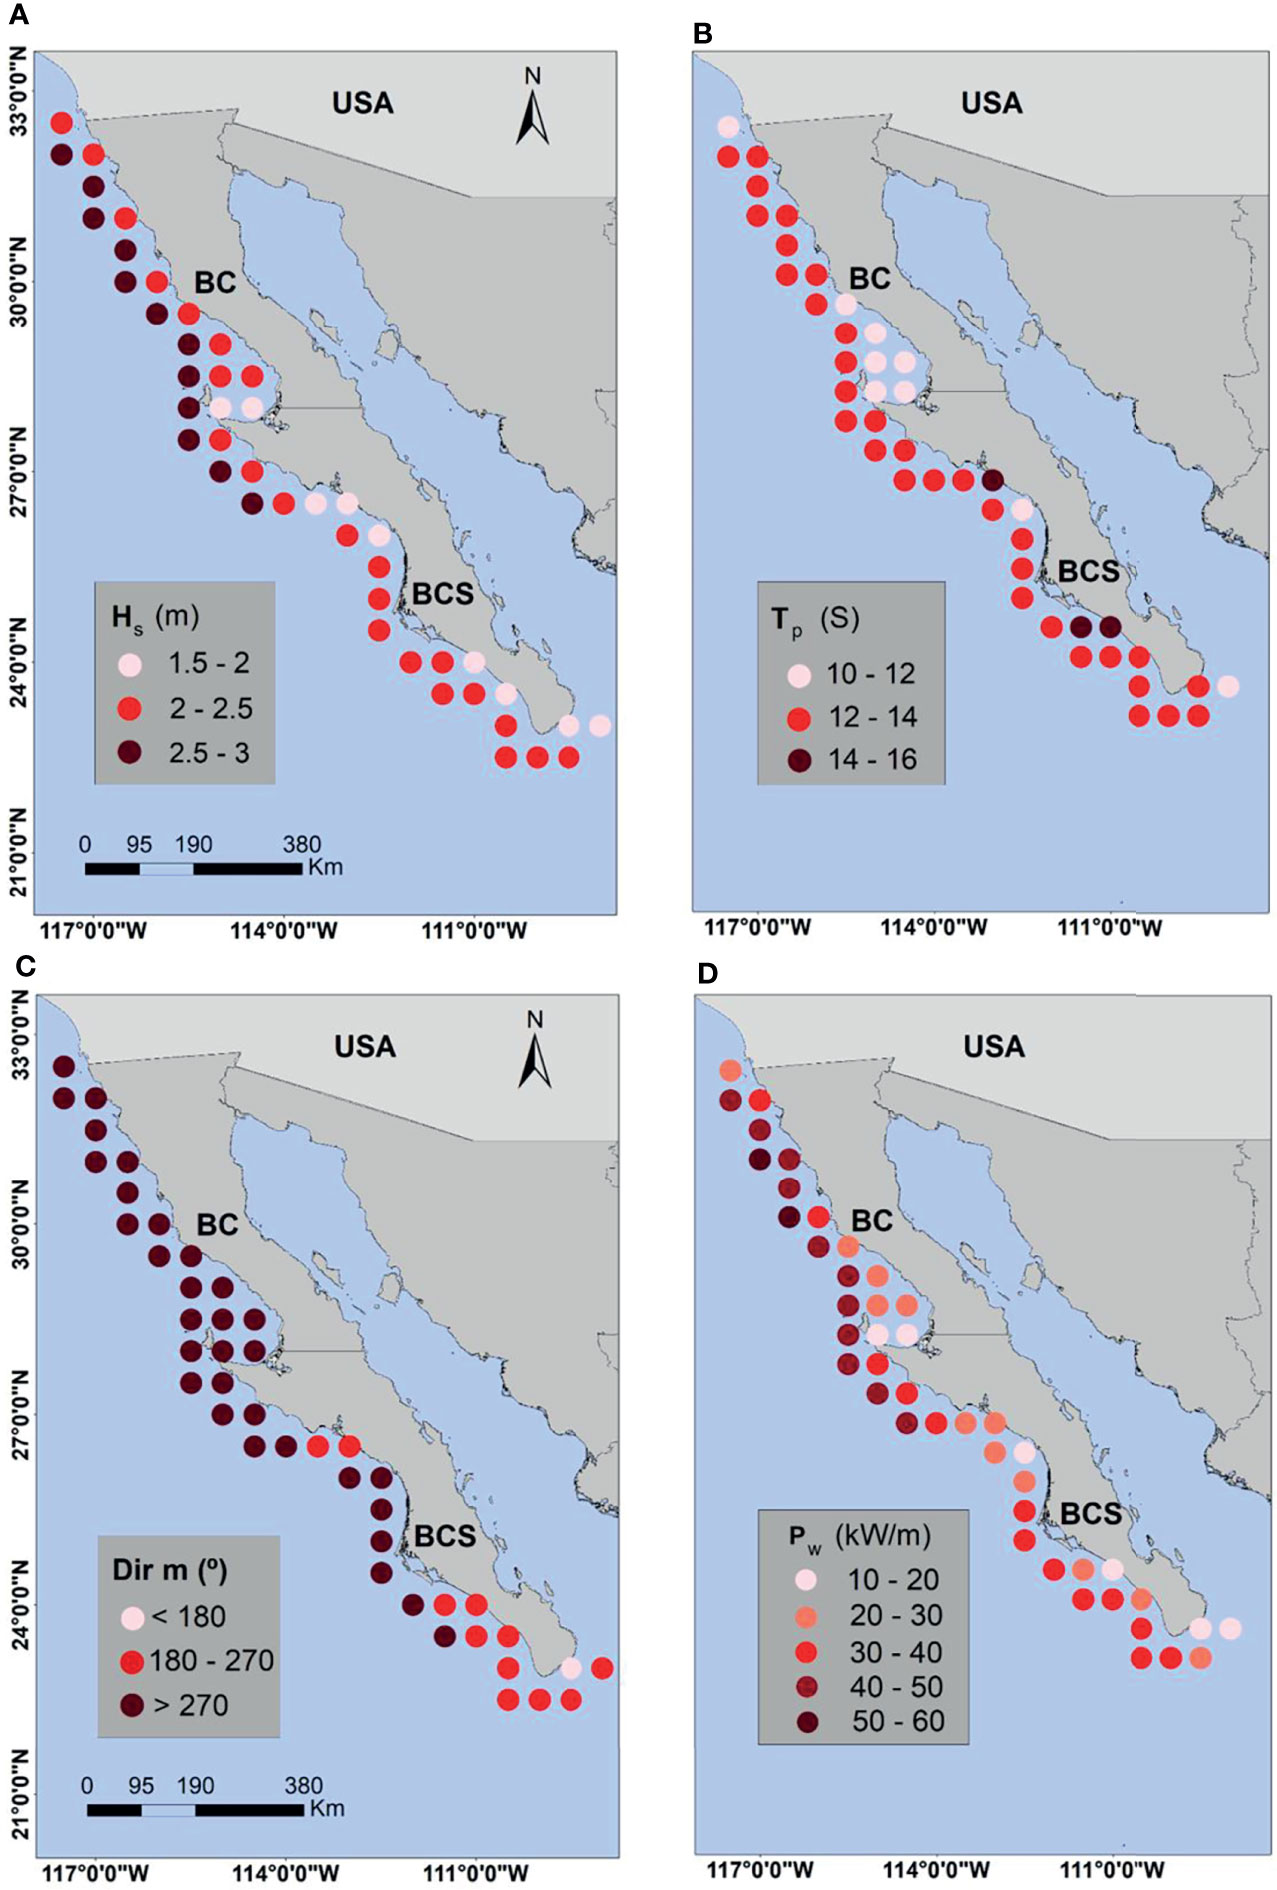
Figure 4 Annual averages of storm wave parameters: (A) Significant wave height, (B) Peak period; (C) Mean direction; (D) Wave energy power.
Analysis of wave power related to storm occurrence on this coast (Figure 4D), shows high energy, values of over 20 kW/m, suitable for electricity generation in the great majority of sites. Wave power of over 40 kW/m is found mostly along the BC coast, with some parts having values of over 50 kW/m.
This is important when comparing the range of movement of a floating WEC device, as well as for an onshore OWC, as it defines the relative orientation of the incidence wave to the converter and the feasibility of harnessing the wave energy.
3.1.2 Natural Variability
Natural variability must be taken into account for long-term wave energy assessment, as it modifies wave power, and, consequently, the electricity generated. It has been demonstrated that natural variability impacts the wave power in the region studied [(Barnard et al., 2017; Reguero et al., 2019; Odériz et al., 2020a; Odériz et al., 2020b; Odériz et al., 2021)].
The correlation between wave power and climate index (Figure 5) is positive, indicating that increasing the climate index value will increase the wave power in the study area. There is a clear difference in the influence of climate index on the Pacific coast of the peninsula, with ONI driving the wave power in the north and PDO and AMO driving the wave power in the south. The variations in the central part of the peninsula depend on the climate index analysed.
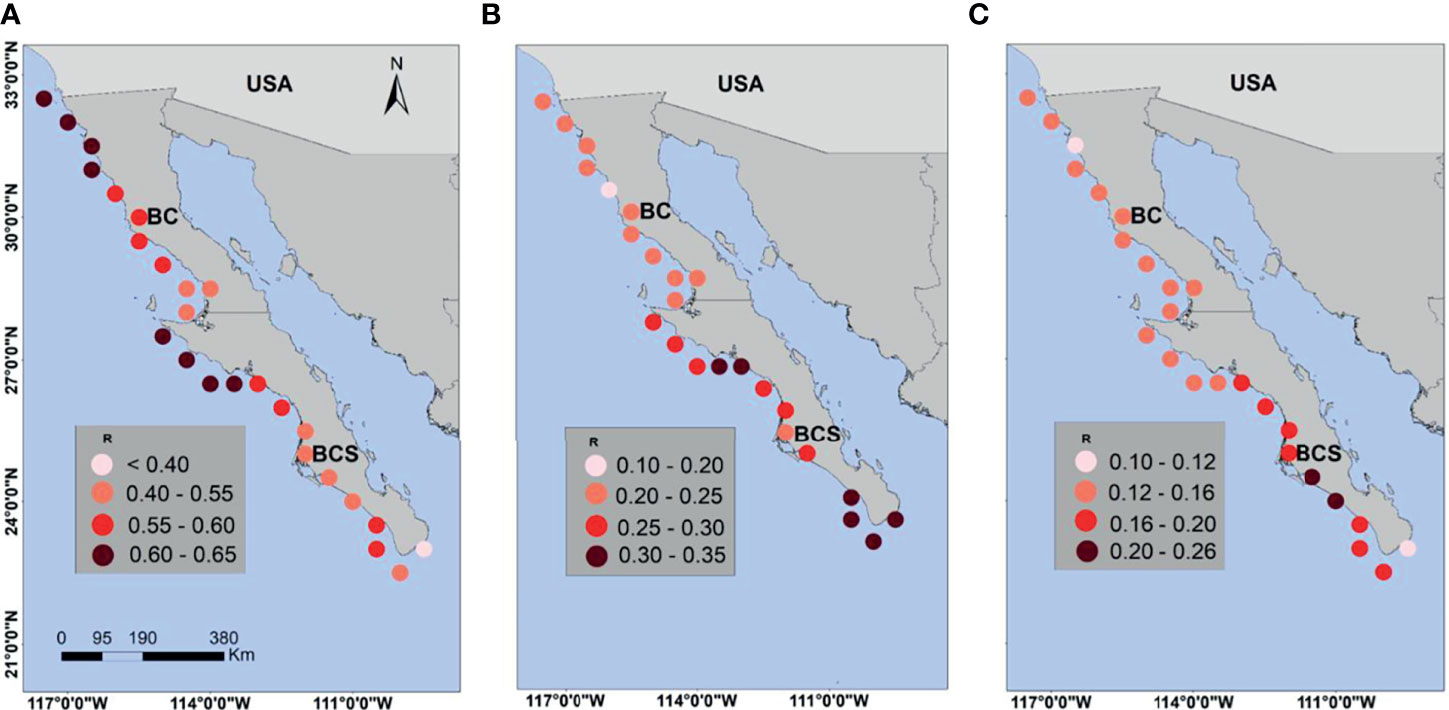
Figure 5 Correlation coefficients, R, for wave power and (A) ONI, (B) PDO, (C) AMO climate indices. Points indicate 95% confidence level.
Therefore, coastal settlements near Tijuana and north of Ensenada will be affected by ONI, while the coastal settlements along the municipalities included at the BCS state will be affected by PDO and AMO, and this will affect any future decisions on electricity generation from wave power.
3.1.3 Wave Climate Projections for the RCP 8.5 Scenario
The likelihood of stronger and more frequent extreme wave conditions in the future has been broadly demonstrated [(Morim et al., 2019; Meucci et al., 2020; Lobeto et al., 2021; Odériz et al., 2021)]. It is therefore wise to analyse warming scenarios to understand what to expect in relation to wave power.
Figure 6 shows the RCP 8.5 scenario (2075 - 2099) (Figure 6A) and baseline conditions (1979-2003) for winter (Figure 6B), spring (Figure 6C), summer (Figure 6D), and autumn (Figure 6E). Summer is the only season where differences greater than 1 kW/m are observed (Figure 6D), all of them off the BCS coast. However, in summer, a decrease in power was detected (-0.1 kW/m) in the southern area of BC. In winter (Figure 6B), a small range of difference is seen at only one node of ERA-5. In spring (Figure 6C) and autumn (Figure 6E), the lowest range of difference was at the same location as the WEGS with the summertime lowest values, meaning that these two nodes of ERA-5 maintain the wave conditions in comparison to the RCP 8.5 scenario, all year round.
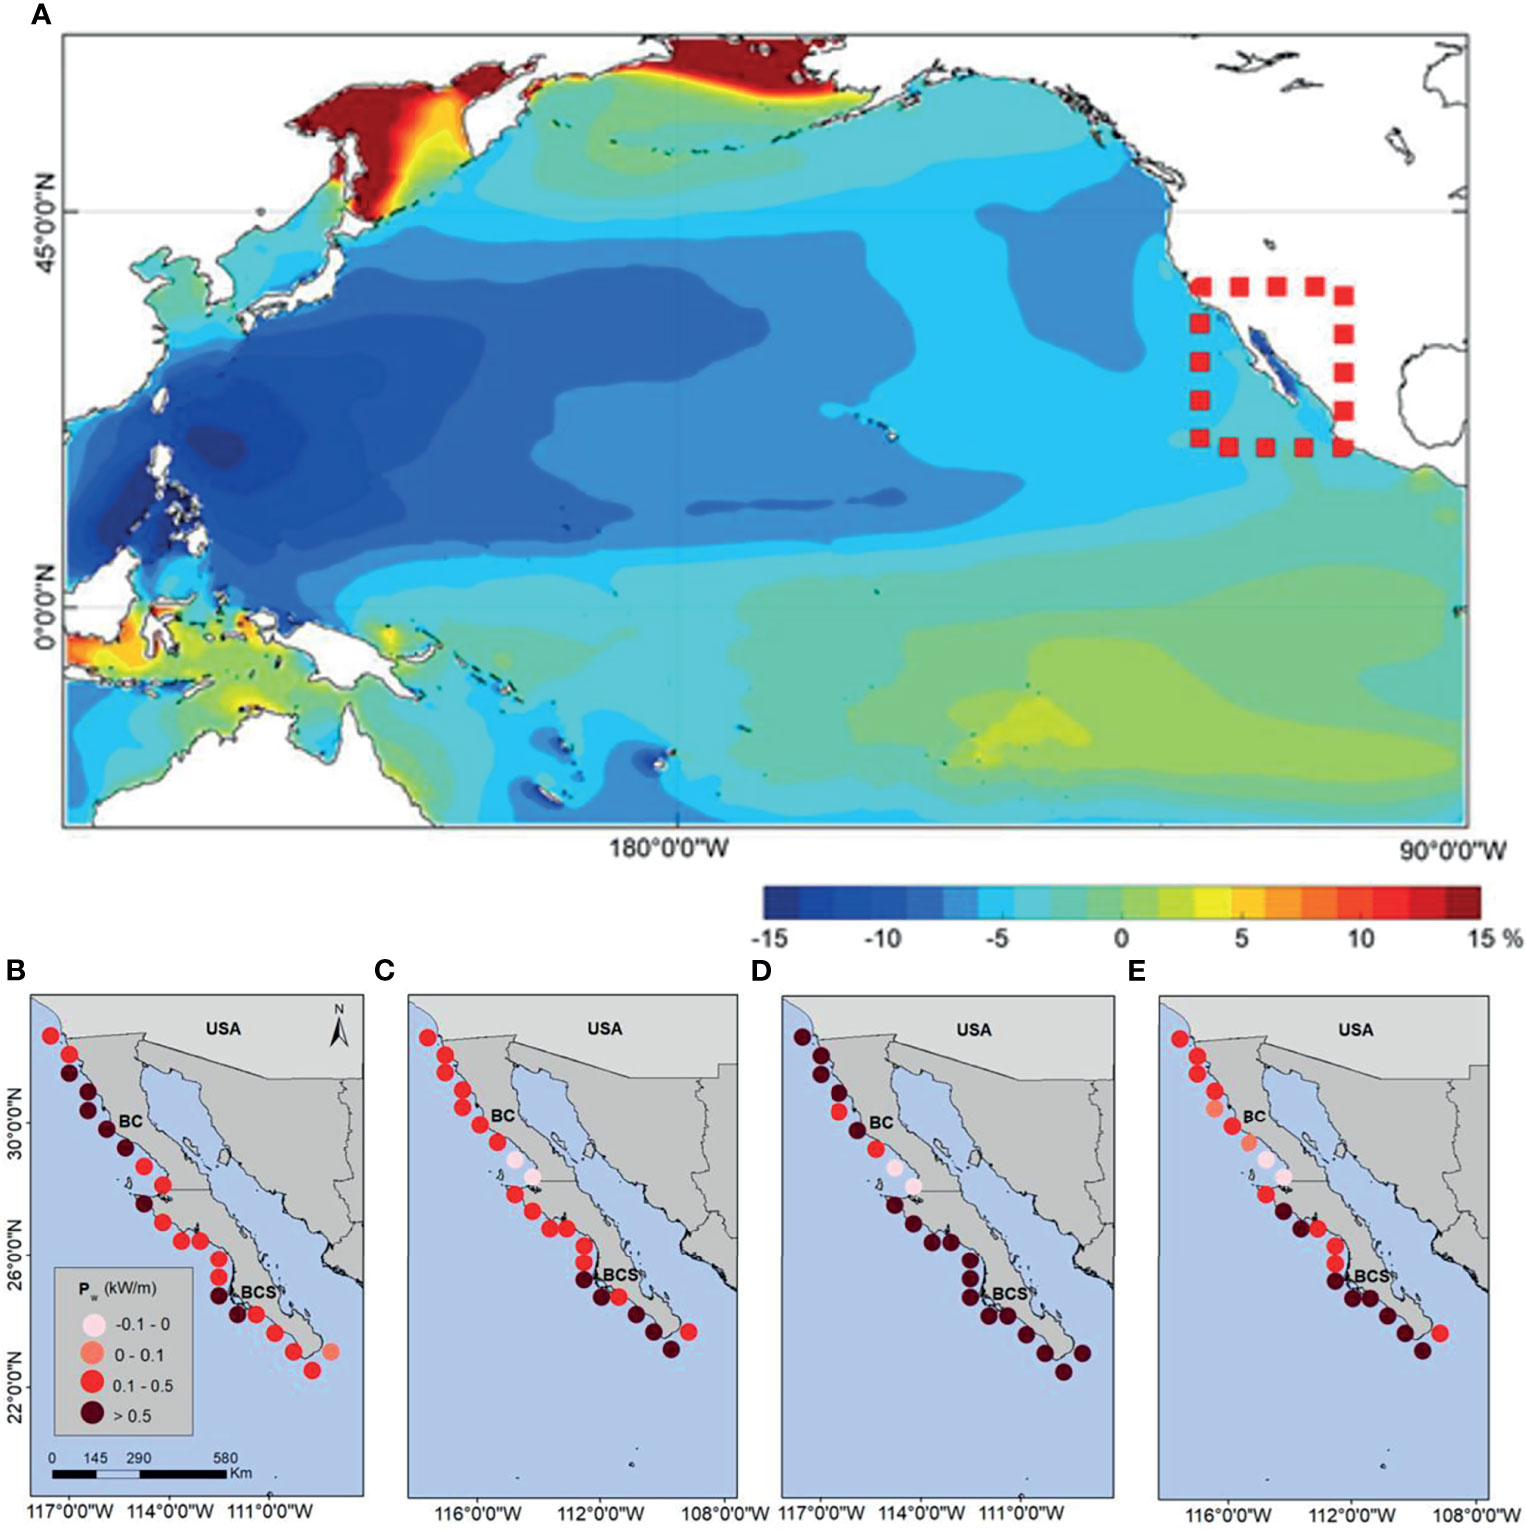
Figure 6 Differences between RCP 8.5 scenario and the baseline conditions: (A) annual significant wave height change (percentage) in the North Pacific; seasonal differences in wave power in Baja California during (B) winter, (C) spring, (D) summer, and (E) autumn.
The greatest differences are off BCS for spring and autumn, while for winter, the greatest number of nodes with high values is found off BC. This could be associated with the cold fronts, which pass over the region in winter, affecting BC more than BCS. Meanwhile, the higher summer differences off BCS could be associated with the increase in hurricane frequency due to climate change.
3.2 Geomorphological Analysis
The exploitation of wave energy using WECs could be on the coastline, mainly at rocky shore sites. Therefore, the identification of rocky shore is an important aspect to deciding where to locate an OWC device to extract energy from waves at the coastline.
The implementation of the TPI resulted 41,606 rocky shore sites which geomorphological characteristics would permit the installation of an onshore OWC, which is 56% of all the possible sites along the Pacific coastline of the peninsula. In general, these locations are rocky shore sites, with or without infrastructure.
3.3 Social Characteristics
Analysis of the social characteristics of coastal settlements in BC shows that most settlements are in the north, with only isolated settlements in the south (Figure 7A). In BCS (Figure 7B), settlements are distributed more equally along the coast. The coastal settlements with the highest populations and highest population densities are found in the northern and southern extremes of the peninsula, while in the central part of the Pacific coast, settlements are mainly small, isolated towns.
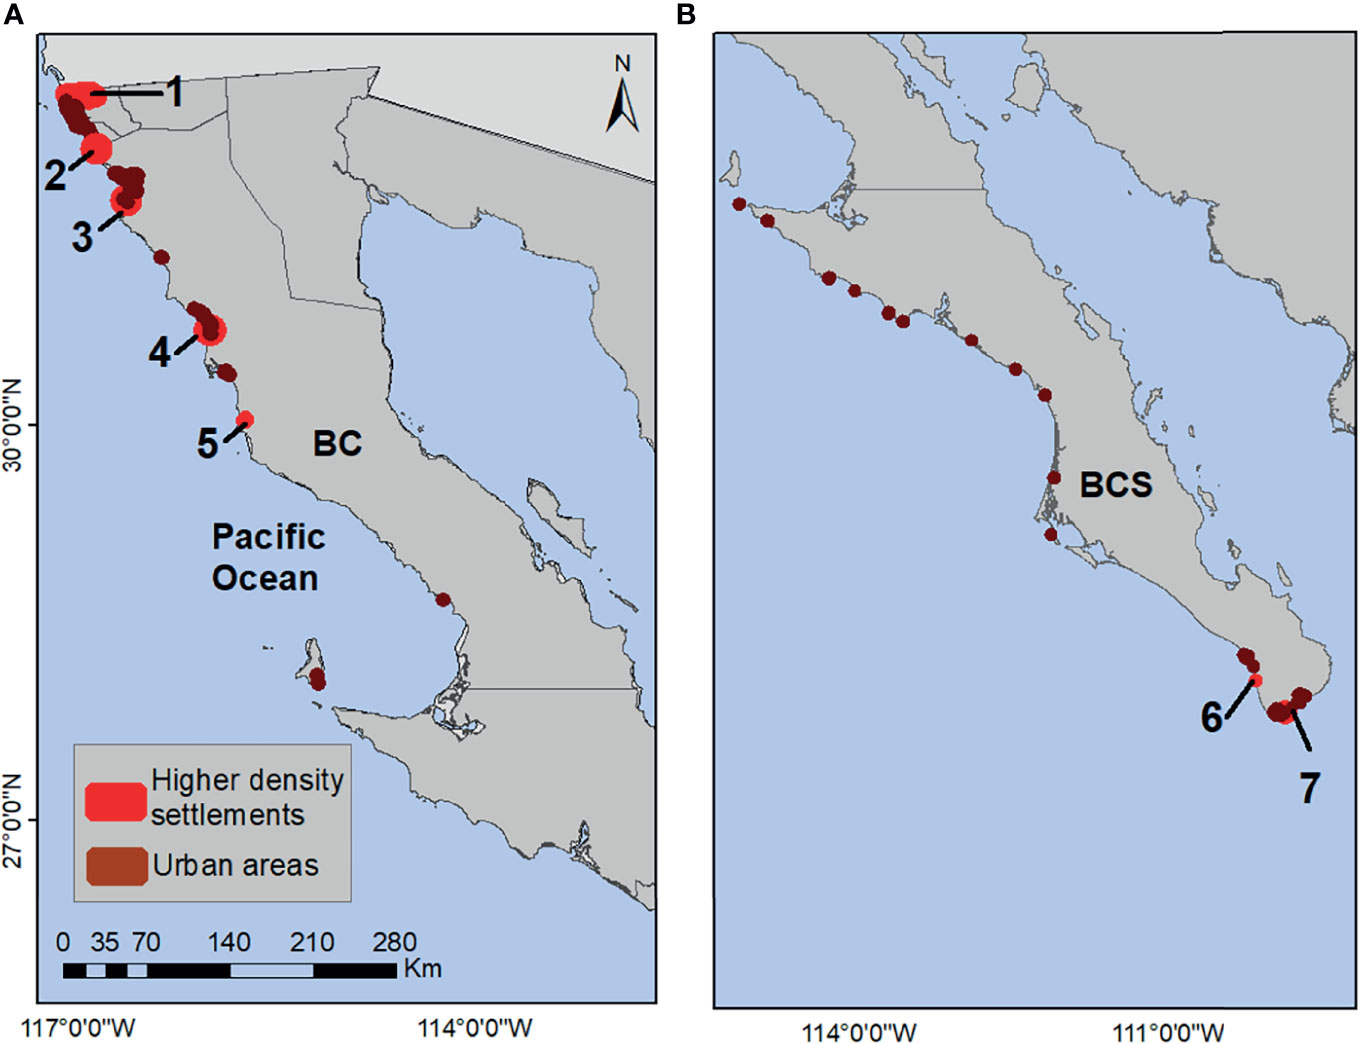
Figure 7 Main coastal settlements along the coastline of (A) Baja California and (B) Baja California Sur. Settlements mentioned in the text below are numbered.
The settlements with the highest total population and population density are shown in Table 1. Five of these settlements are in BC. The largest city is Tijuana, with over 1 million inhabitants, followed by Santa Anita. Tijuana is also the city with the greatest area, although it does not have the highest density. In fact, Residencial Amalfi, in BCS, with 7815 inhabitants/km2, and only 369 inhabitants, has the highest population density.
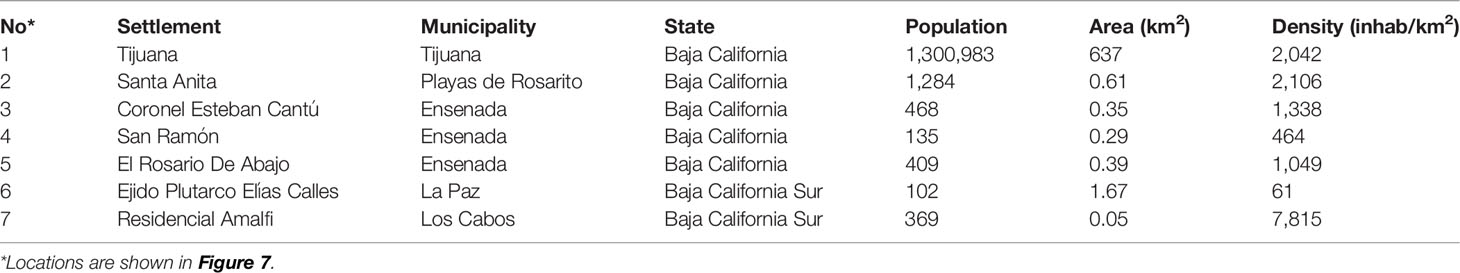
Table 1 Main demographic characteristics of coastal settlements.
3.4 Spatial Relationship of Analysed Variables: WEGS Identification
Figure 8A shows the human settlements with and without grid connection, the location of rocky shore sites, and the ERA-5 nodes with wave power above 5 kW/m and 10 kW/m. For analysis purposes, the peninsula was divided in three regions: North (Figure 8B), Central (Figure 8C) and South (Figure 8D). It can easily be seen that in the northern region on all the rocky shores there is a mean wave potential of over 10 kW/m, while the central zone has more lengths of rocky shore associated with nodes with a mean wave potential of less than 10 kW/m. About 10% of the rocky shores on the coast in the south are associated with nodes with an average potential less than 10 kW/m.
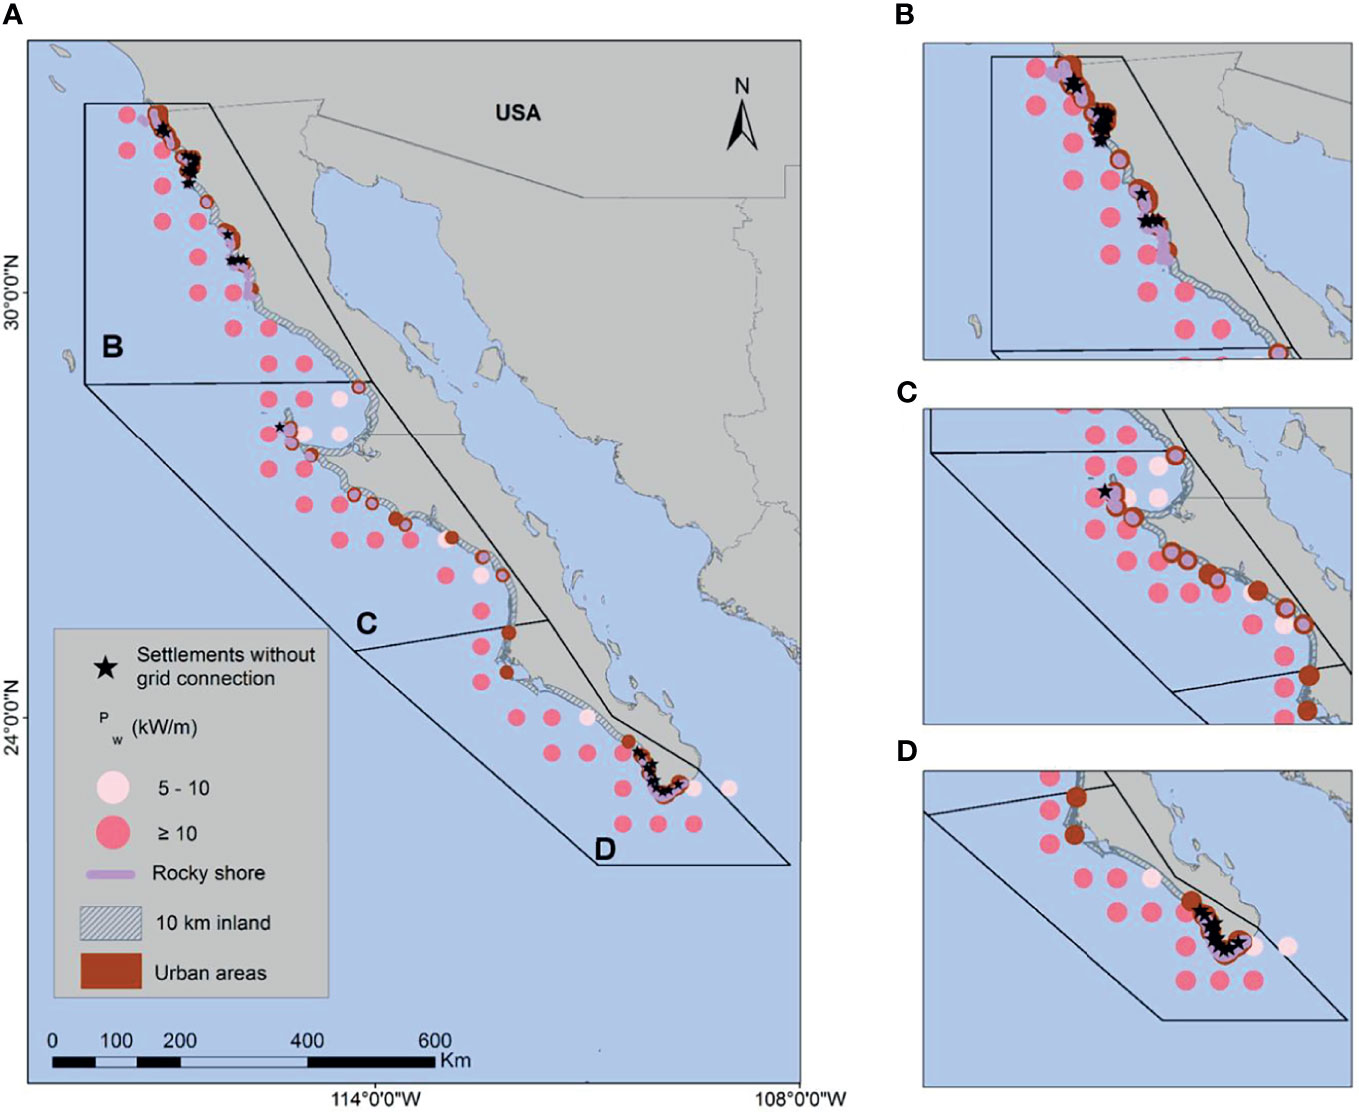
Figure 8 Spatial conjunction of selected variables with potential interest for decision makers. (A) for all the peninsula, (B) for the northern, (C) the central, and (D) the southern part of the peninsula.
The clustering of the WEGS (coastal human settlements with power values greater than 10 kW/m that coincide with a rocky coastline within a radius of 10 km) is shown in Figure 9A. In the north of the peninsula (Figure 9B) near to the United States border, and including the settlements of Tijuana, Santa Anita and Coronel Estaban Cantú. The second region is in the middle of the BC state, and includes the settlement of San Ramón (Figure 9C). Finally, the southern part of the peninsula, in BCS state, and including the settlements of Ejido Plutarco Elías Calles and Residencial Amalfi (Figure 9D) is also promising.
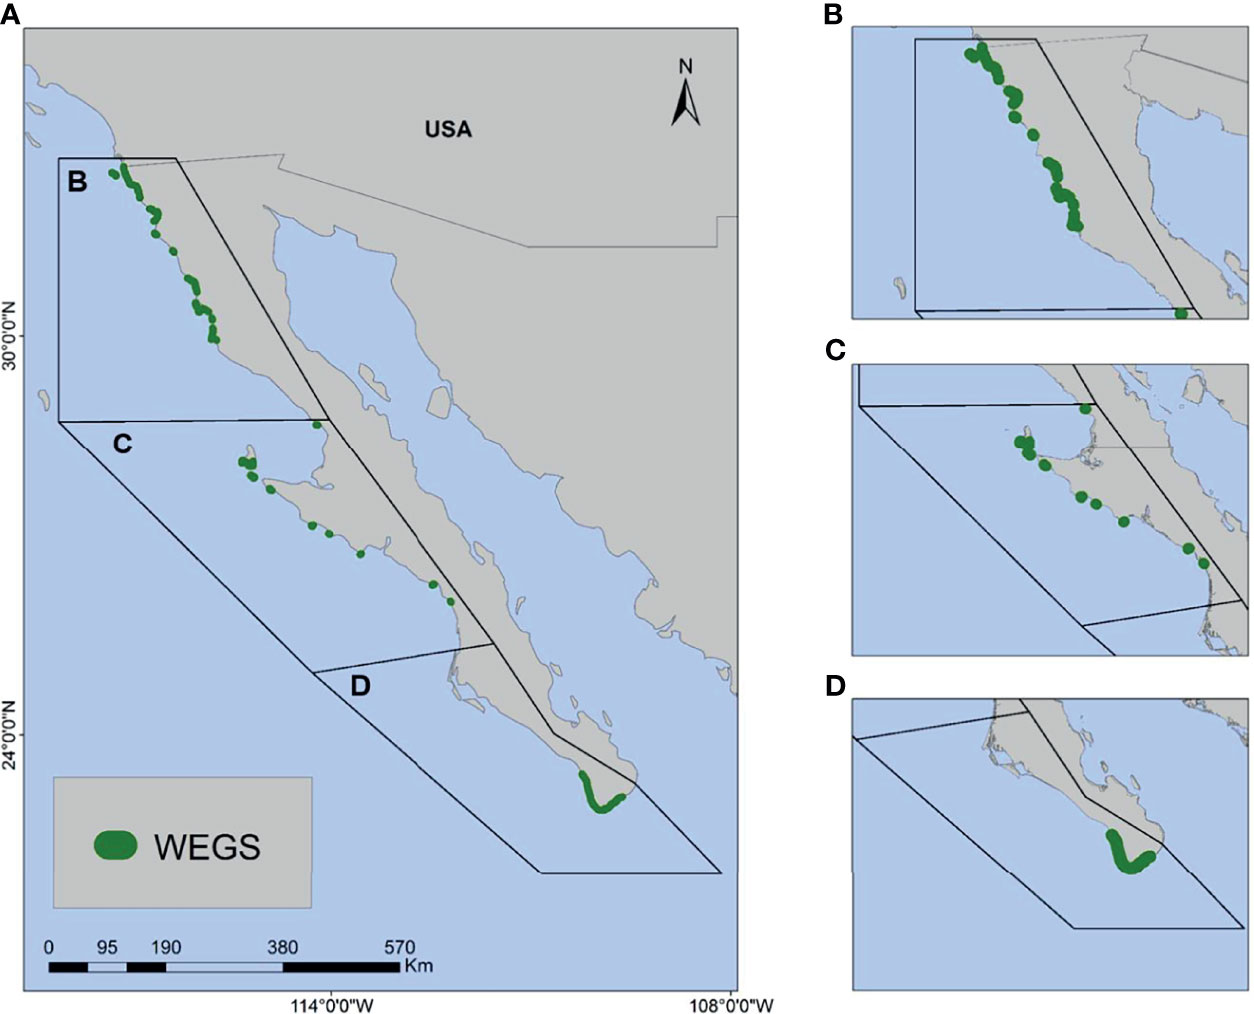
Figure 9 Spatial distribution of WEGS along the Pacific coast of the peninsula. (A) all the peninsula, (B) the northern part, (C) central, and (D) southern part of the peninsula.
Table 2 shows the total length defined as rocky shore sites associated to mean wave power of over 5 kW/m and 10 kW/m. It also shows the population, number of settlements and the population density within 10 km from the shoreline, both connected, and unconnected, to the electrical power grid. The table also shows the total length covered by the WEGS identified, and the population (connected and unconnected to the grid) found within them.
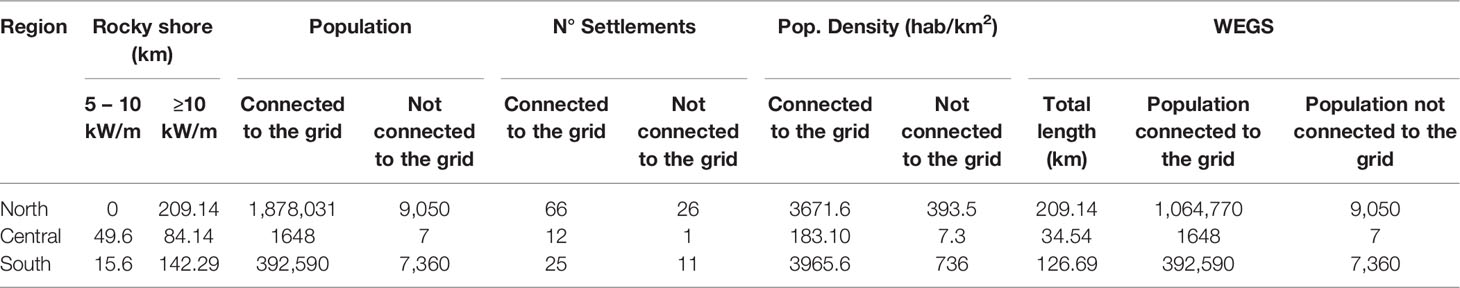
Table 2 Main characteristics of coastal sites and the identified WEGS.
For the WEGS that are unconnected to the electrical power grid, harnessing wave energy would have to include the creation of the electrical infrastructure or electrical micro grids. This point is interesting for decision makers and governors when deciding which regions to prioritize for investment in electrical infrastructure.
4 Discussion
The present analysis shows the annual average wave power along the Pacific coast of the Baja California peninsula is over 10 kW/m at 80% of the ERA-5 nodes, demonstrating that it is viable to generate electricity from wave energy along this side of the peninsula. These figures rise when the 90, 95, and 99 percentiles of the dataset are analysed.
The fact that the highest values of wave power are on BC coast indicates that the influence of seasonal variability over wave power behaviour is smaller and the effect of winds over wave characteristics is more important at BC coast than BCS coast. Thus, the storm characteristics are seen to directly affect the wave power along this coast, with wave power values higher in BC than BCS under storm conditions. The effect of storms on wave power is important when determining the characteristics of the OWC needed for each site. In addition, wave characteristics in the storm will determine the structural design of the devices to be deployed.
Analysis of the wave climate-related with climate drivers and projected scenarios of Representative Concentration Pathways (RCP) shows that ONI drives the wave power at the northern part of the peninsula, and PDO and AMO drive the wave power at the southern part of the peninsula. This is important because the choice of devices for energy harvesting should consider the effects of these drivers when estimating energy variation in the long term, as wave-energy availability changes with changes to wave characteristics. The changes predicted for the RCP are expected to be greater in summer and winter, mainly related to the increase in the incidence of winter storms and hurricanes in the study area. The greatest changes in winter are expected in BC, and in summer, in BCS. Since an OWC should be expected to have a useful lifetime of over 30 years, variations in wave climate and wave power associated with global climate drivers in the Pacific coast of the Baja California peninsula must be taken into account.
As the spatial resolution of the wave reanalysis ERA-5 dataset is coarse (0.5°, around 50 km) for the analysis near to the coastal settlements, geomorphological analysis is necessary to determine the best locations for wave energy extraction. From these results, a model can be run, and waves propagated into shallow waters at the best locations mentioned earlier.
The analysis of the spatial relationships of the variables shows only three regions (North, Central and South) where wave energy, settlements, the rocky shore and the electrical infrastructure make energy extraction possible in the near future. These regions are irregularly distributed along the Pacific coastline of the peninsula (see Figures 8 and 9), so the supply of energy to the other settlements would need infrastructure development. This is a very important issue for decision makers and governors in the region.
Another interesting feature is the marked difference between the number of settlements/total population with and without electricity in all zones (Table 2), both overall, and for the population living in the first 10 km from the coastline. In this regard, it is striking that in the central zone there are far fewer settlements than in the other zones, half of that in the southern zone and almost six times that in the northern zone. In the case of settlements without electricity, in the central zone there is only one, while in the south there are 11 and in the north, 26. Similarly, the population density is much higher in the northern and southern zones compared to the central zone, although there is not much difference, the southern zone having the highest population density, for settlements, both with, and without, electricity. This is extremely important because it shows that, even though the number of settlements in the southern zone is lower than that in the northern zone, there is higher density. The results of these analyses are key for decision-makers. They show the areas where harnessing wave energy would have greatest impact, both in supplying electricity to settlements that do not have this service at present, and in supplying extra electricity to settlements where population whose growth means they require a more.
5 Conclusions
On the Pacific coast of the Baja California peninsula, the mean value of wave power was below 20 kW/m from 1979 to 2018. However, on 370 km it would be viable to install onshore wave energy converters (OWC) to produce electricity for nearby settlements, many of which are not connected to the electrical power grid, potentially benefiting around 1.4 million habitants. The highest wave power values are in the north of the peninsula. There are some wave-energy generation sites with interesting power values in the south. The lowest wave power values are in sites associated with river mouths and bays in the coastline configuration.
It is expected that future wave power availability in the region will vary according to the scenario of Representative Concentration Pathway and the influence of global climate drivers such as ONI, PDO, and AMO. The greatest influence of these scenarios and drivers is expected in summer and winter and will be different depending on the location along the coast of the peninsula.
Further site analyses in areas near coastal settlements, including a wave propagation model, are needed to provide data on local-scale wave power and potentials for the installation of wave energy converters. In addition, a study of the availability of electrical energy in coastal settlements is also recommended to prioritize sites where electricity generation from wave power is most required.
Electricity generated from waves would reduce Mexico´s dependency on fossil fuels and cut CO2 emissions, as well as lessening our dependency on the US for electricity connection. Additionally, the generation of electricity from waves would help Mexico to meet its international commitments regarding renewable energy generation.
Data Availability Statement
The raw data supporting the conclusions of this article will be made available by the authors, without undue reservation.
Author Contributions
Conceptualization, YV, YR, and RS. Methodology, YV, YR, IO, VC, and RS. Software, YV, YR, and IO. Validation, YV, IO, and RS. Formal analysis, YR and IO. Investigation, YV, IO, AF, SC-E, VC, and RS. Resources, RS and VC. Data curation, YR, IO, and NM. Writing—original draft preparation, YV, IO, YR, and VC. Writing—review and editing, VC, SC-E, AF, and RS. Visualization, YV, VC, and RS. Supervision, AF, SC-E, NM, and RS. Project administration, VC, AF, and RS. Funding acquisition, VC, AF, and RS. All authors contributed to manuscript revision, read, and approved the submitted version.
Funding
This research was funded by the Mexican Centre for Ocean Energy Innovation (CEMIE-Océano, Centro Mexicano de Innovación en Energía del Océano) CONACYT-SENER Sustentabilidad Energética project: FSE-2014-06-249795.
Conflict of Interest
The authors declare that the research was conducted in the absence of any commercial or financial relationships that could be construed as a potential conflict of interest.
The reviewer IF declared a shared affiliation with the author NM to the handling editor at the time of review.
Publisher’s Note
All claims expressed in this article are solely those of the authors and do not necessarily represent those of their affiliated organizations, or those of the publisher, the editors and the reviewers. Any product that may be evaluated in this article, or claim that may be made by its manufacturer, is not guaranteed or endorsed by the publisher.
References
Alcérreca-Huerta J. C., Encarnacion J. I., Ordoñez-Sánchez S., Callejas-Jiménez M., Gallegos Diez Barroso G., Allmark M., et al. (2019). Energy Yield Assessment From Ocean Currents in the Insular Shelf of Cozumel Island. J. Marine Sci. Eng. 7 (5), 147. doi: 10.3390/jmse7050147
(2021) Online: O.W.s.O.-I.W.a. Available at: https://www.ocean-energy-systems.org/ocean-energy/gis-map-tool/ (Accessed June 5th, 2021).
Barnard P. L., Hoover D., Hubbard D. M., Snyder A., Ludka B. C., Allan J., et al. (2017). Extreme Oceanographic Forcing and Coastal Response Due to the 2015–2016 El Niño. Nat. Commun. 8 (1), 1–8. doi: 10.1038/ncomms14365
Bromirski P. D., Cayan D. R., Helly J., Wittmann P. (2013). Wave Power Variability and Trends Across the North Pacific. J. Geophys. Res.: Oceans 118 (12), 6329–6348. doi: 10.1002/2013JC009189
Cruz C. J., Mendoza E., Silva R., Chávez V. (2019). Assessing Degrees of Anthropization on the Coast of Mexico From Ecosystem Conservation and Population Growth Data, in. J. Coastal Res. p, 136–144. doi: 10.2112/SI92-016.1
Evans D. V., Antonio F. (2012). Hydrodynamics of Ocean Wave-Energy Utilization: IUTAM Symposium Lisbon/Portugal 1985 (Lisbon: Springer Science & Business Media).
Fairley I., Lewis M., Robertson B., Hemer M., Masters I., Horrillo-Caraballo J., et al. (2020). A Classification System for Global Wave Energy Resources Based on Multivariate Clustering. Appl. Energy 262, 114515. doi: 10.1016/j.apenergy.2020.114515
González-Ramírez e., Barrios-Piña H., Hernandez-Robles I. A. (2016). Wave Energy Conversion Assessment at Mexican Seaside Points. In 2016 IEEE PES Transmission & Distribution Conference and Exposition-Latin America (PES T&D-LA) (Morelia, México: IEEE).
Hernández-Fontes J. V., Felix A., Mendoza E., Rodríguez-Cueto Y., Silva R. (2019). On the Marine Energy Resources of Mexico. J. Marine Sci. Eng. 7 (6), 191. doi: 10.3390/jmse7060191
Hernández-Fontes J. V., Martínez M. L., Wojtarowski A., González-Mendoza J. L., Landgrave R., Silva R. (2020). Is Ocean Energy an Alternative in Developing Regions? A Case Study in Michoacan, Mexico. J. Cleaner Prod. 266, 121984. doi: 10.1016/j.jclepro.2020.121984
INEGI (2021) Mapas Espacios Y Datos De México. Available at: https://www.inegi.org.mx/app/mapa/espacioydatos/default.aspx.
INEGI, Instituto Nacional de Estadística y Geografía (México) (2017). Anuario Estadístico Y Geográfico De Baja California Sur 2017/Instituto Nacional De Estadística Y Geografía.– México: INEGI, 2017 (Inegi Ciudad de México:INEGI).
INEGI, Producto interno bruto por entidad federativa 2019 (2020). Comunicado De Prensa NUM 632/20. Aguascalientes: INEGI. 13.
Jasiewicz J., Stepinski T. F. (2013). Geomorphons—A Pattern Recognition Approach to Classification and Mapping of Landforms. Geomorphology 182, 147–156. doi: 10.1016/j.geomorph.2012.11.005
Lobeto H., Menendez M., Losada I. J. (2021). Future Behavior of Wind Wave Extremes Due to Climate Change. Sci. Rep. 11 (1), 1–12. doi: 10.1038/s41598-021-86524-4
Martell R., Mendoza E., Mariño-Tapia I., Odériz I., Silva R. (2020). How Effective Were the Beach Nourishments at Cancun? J. Marine Sci. Eng. 8 (6), 388. doi: 10.3390/jmse8060388
Meucci A., Young I. R., Hemer M., Kirezci E., Ranasinghe R. (2020). Projected 21st Century Changes in Extreme Wind-Wave Events. Sci. Adv. 6 (24), eaaz7295. doi: 10.1126/sciadv.aaz7295
Morim J., Hemer M., Wang X. L., Cartwright N., Trenham C., Semedo A. (2019). Robustness and Uncertainties in Global Multivariate Wind-Wave Climate Projections. Nat. Climate Change 9 (9), 711–718. doi: 10.1038/s41558-019-0542-5
NASA (2019). Aster Global Digital Elevation Model V003 (South Dakota: NASA EOSDIS Land Processes DAAC). Available at: 10.5067/ASTER/ASTGTM.003.
Nezhad M. M., Groppi D., Rosa F., Piras G., Cumo F., Garcia D. A. (2018). Nearshore Wave Energy Converters Comparison and Mediterranean Small Island Grid Integration. Sustain. Energy Technol. Assessments 30, 68–76. doi: 10.1016/j.seta.2018.08.009
Odériz I., Silva R., Mortlock T. R., Mendoza E. (2020a). Climate Drivers of Directional Wave Power on the Mexican Coast. Ocean Dynamics 70 (9), 1253–1265. doi: 10.1007/s10236-020-01387-z
Odériz I., Silva R., Mortlock T. R., Mori N. (2020b). El Niño-Southern Oscillation Impacts on Global Wave Climate and Potential Coastal Hazards. J. Geophys. Res.: Oceans 125 (12), e2020JC016464. doi: 10.1029/2020JC016464
Odériz I., Silva R., Mortlock T. R., Mori N., Shimura T., Webb A. (2021). Natural Variability and Warming Signals in Global Ocean Wave Climates. Geophys. Res. Lett. 48, e2021GL093622. doi: 10.1029/2021GL093622
Rangel Carboney J. A. (2018). “Optimización De La Cámara De Aire De Una Columna De Agua Oscilante,” in Tesis En Opción Al Grado De Maestro En Eficiencia Energética Y Energías Renovables (México: División de Ingeniería Mecánica, Mecatrónica e Industrial, Tecnológico de Estudios Superiores de Ecatepec), 54.
Reguero B. G., Losada I. J., Méndez F. J. (2019). A Recent Increase in Global Wave Power as a Consequence of Oceanic Warming. Nat. Commun. 10 (1), 1–14. doi: 10.1038/s41467-018-08066-0
Shimura T., Mori N. (2020). Future Changes in Spectral Wave Climate Around Japan Under Global Warming. Coastal Eng. Proc. 36v), 10–10. doi: 10.9753/icce.v36v.waves.10
Spijker V. (2013). Morphological Landscape-Classifications of the Front Range of the Rocky Mountains Near Boulder, Colorado. Wageningen, The Netherlands:Wageningen University.
Warszawski L., Frieler K., Huber V., Piontek F., Serdeczny O., Zhang X., et al. (2017). Center for International Earth Science Information Network—CIESIN—Columbia University. “Gridded Population of the World, Version 4 (Gpwv4): Population Density. Palisades. NY: NASA Socioeconomic Data and Applications Center (SEDAC),” in tlas of Environmental Risks Facing China Under Climate Change. New York: The Trustees of Columbia University in the City of New York, 228. doi: 10.7927/H4NP22DQ
Webb A., Fox-Kemper B. (2011). Wave Spectral Moments and Stokes Drift Estimation. Ocean Modelling 40 (3-4), 273–288. doi: 10.1016/j.ocemod.2011.08.007
Keywords: coastal settlements, electricity generation, wave power, renewable energy, climate change
Citation: Ventura Y, Rodríguez Y, Odériz I, Chávez V, Mori N, Felix A, Cerdeira-Estrada S and Silva R (2022) New Assessment of Wave Energy in Relation to Geomorphological and Demographic Characteristics on the Pacific Coast of Baja California, Mexico. Front. Mar. Sci. 9:872707. doi: 10.3389/fmars.2022.872707
Received: 09 February 2022; Accepted: 16 March 2022;
Published: 08 April 2022.
Edited by:
Juan Jose Munoz-Perez, University of Cádiz, SpainReviewed by:
Iain Fairley, Swansea University, United KingdomMaria Graça Neves, National Laboratory for Civil Engineering, Portugal
Antonio Contreras De Villar, University of Cádiz, Spain
Copyright © 2022 Ventura, Rodríguez, Odériz, Chávez, Mori, Felix, Cerdeira-Estrada and Silva. This is an open-access article distributed under the terms of the Creative Commons Attribution License (CC BY). The use, distribution or reproduction in other forums is permitted, provided the original author(s) and the copyright owner(s) are credited and that the original publication in this journal is cited, in accordance with accepted academic practice. No use, distribution or reproduction is permitted which does not comply with these terms.
*Correspondence: Valeria Chávez, dmNoYXZlY0BpaW5nZW4udW5hbS5teA==