Abstract
Flemish Cap cod collapsed in the early 90’s after facing multiple threats due to climate variability and anthropogenic pressures. A master 35-year cod growth chronology was reconstructed in the present study by using sclerochronology techniques. Three additional chronologies were developed to account for the age-dependent effect of maturity and fishing intensity on growth. All chronologies showed that cod growth has decreased over the years and it is currently at the minimum level in the historic of data series. Hierarchical mixed-effects models were applied to the master chronology to identify extrinsic drivers of growth. The master chronology was divided into 3 periods: Premoratorium (1988-1998), Moratorium (1999-2009), and Postmoratorium (2010-2019). Our results showed that drivers of cod growth in the Flemish Cap varied between periods (Premoratorium: bottom temperature and fishing mortality, Moratorium: cod and pandalus abundance, and Postmoratorium: cod abundance and thickness of the cold intermediate layer). Our results suggest that density-dependence processes, food availability, and global warming may be behind the lack of recovery of the Flemish Cap cod stock. The Flemish Cap cod growth chronology shows variations on growth over time and identifies its drivers, having the potential to be included in the NAFO stock assessments or to be used to set dynamic reference points that guarantees the stock sustainability.
Introduction
Worldwide, oceans face multiple hazards that threaten not just marine organisms but also the whole ecosystem. Climate change has been identified as one of the main causes for drastic shifts in marine ecosystem compositions that, together with fishing, can alter the behavior and physiology of marine organisms from individual to higher ecological levels (Perry et al., 2010). Changes in physical and chemical ocean conditions can modify the dynamics that control ecosystems structures and function (Perry et al., 2010; Planque et al., 2010) and are likely to have associated socio‐economic implications on ecosystem services, marine fisheries, and fishery‐dependent communities (Link et al., 2015).
The capability of an individual to cope with changes in the environment essentially depends on its physiology. If the new environmental conditions are physiologically tolerable for the individual, it will be able to adapt or acclimate; on the contrary, intolerable conditions can result in migration, phenological modifications, or death (Parmesan, 2006; Doney et al., 2012). Climate change is creating new scenarios where some species will be benefited as a result of a decrease in competition and increase in food availability. In contrast, others will be stressed, experiencing higher mortality and reduced growth, size, and reproductive potential (Doney et al., 2012), or even evolutionary changes of life-history parameters (O’Connor et al., 2009; Pauly and Kinne, 2010; Cheung et al., 2013). In this context, resilience is defined as “the degree to which ecosystems can absorb natural and anthropogenic perturbations and continue to regenerate without slowly degrading or suddenly flipping into alternate states” (Hughes et al., 2005). Increasing ecosystem resilience will help to preserve ecosystem structure and functioning. In some cases, depending on the intensity and duration of the stressing driver, the ecosystem crosses a threshold that leads into a new stable state (Hughes et al., 2005). This seems to be the case in the Newfoundland and Labrador ecosystem, where most groundfish stocks collapsed in the early 90’s and have not shown recovery signals despite the strong management measures adopted for their recovery (González-Troncoso et al., 2021). The reasons behind the collapse have been attributed to overfishing and change of the environmental conditions, which generated an ecosystem regime shift towards a crustacean-dominated community (Rose, 2003).
In the case of fishery-exploited ecosystems, fishing acts as an important driver for its dynamics. Fishing is selective on specific traits (mainly size), removing them from the gene pool and ultimately reshaping the population and its capacity to react to environmental variations (Enberg et al., 2009). At a population level, selective fishing modifies the shape of the age or size distribution due to, for example, targeting of smaller fish or a minimum or maximum size limit, which often reduces the buffering capacity of the population by decreasing reproductive potential (Saborido-Rey and Kjesbu, 2005), feeding and mating capacity (Peters, 1986) and could cause depensation (Shelton and Healey, 2011). Consequently, the fish population becomes more and more sensitive to environmental fluctuations. Furthermore, fishing may reshape the spatial distribution of a population by reducing its distributional range or because of loss of population sub-units (Perry et al., 2010; Planque et al., 2010). Local overfishing has contributed to the spatial aggregation of Atlantic cod in the Scotian shelf and some core areas would disappear as the population declines (Carson et al., 2017). Smedbol and Wroblewski, 2002 also concluded that in the Newfoundland and Labrador shelf, the northern cod metapopulation would decline as some subpopulations associated with major spawning locations are eradicated. Although fishing can positively affect fish population by removing individuals, reducing competition and relaxing density dependence (Planque et al., 2010), at the ecosystem level, it can also modify predator-prey relationships by removing key species, reducing food web complexity and stability. Therefore, fishing can erode ecosystem resilience and increase its sensitivity to climate variability (Perry et al., 2010). Unfortunately, it is challenging to disentangle fishing and environmental effects on the marine ecosystem regardless of whether they are a consequence of climate change or not (Hsieh et al., 2006; Perry et al., 2010). However, the population growth trend has proved to be an excellent index to study the impact of environmental and anthropogenic pressures on marine species (Morrongiello and Thresher, 2015; Smoliński and Mirny, 2017; Martino et al., 2019).
The impact of environmental factors controlling the growth of an organism will be maximized at the margins of its spatial distribution because the organism will be at the limit of its adaptation capacity and, consequently, more sensitive to environmental stressors (Speer, 2010). The Flemish Cap is a seamount located East of Newfoundland’s Grand Banks. The bank is outside the Canadian economic exclusive zone (EEZ) and its exploitation is regulated by international agreements supervised by the Northwest Atlantic Fisheries Organization (NAFO). This bank is located in a convergence zone formed by the Labrador (cold) current and the North Atlantic (warm) current (Colbourne et al., 2018); therefore, the water of the Flemish Cap is warmer and saltier than the adjacent Newfoundland Shelf waters. The convergence of these water masses generates an anticyclonic gyre that dominates circulation (Colbourne et al., 2018) and the intensity of this gyre plays a major role in the recruitment of cod and Sebastes spp. of Flemish cap (Borovkov et al., 2006). Another interesting feature of this region is the existence of a Cold intermediate layer (CIL), which is a cold water mass present at all seasons that ranges from <1°C in spring to >3°C in autumn and it is usually located at a mean depth of 100 m (Colbourne et al., 2018). This layer cause a strong stratification that limits the flow of water between upper and lower layers (Stein, 2007). These characteristics lead to a high degree of isolation of Flemish Cap ecosystems. Other factors that contribute to its isolation are: i) the Flemish Pass, a channel with a depth of more than 1100 m that blocks the migration of shallow demersal species between the Flemish Cap and the Gran Bank; and ii) an anticyclonic gyre that retains pelagic eggs and larvae (González-Troncoso et al., 2018). Isolation of Flemish Cap cod has been reported in genetic studies (Beacham et al., 2002). Moreover, the Flemish Cap is the southern distribution limit of many species from the North Atlantic, like Atlantic cod, Greenland and Atlantic halibut, American plaice, Roughhead grenadier, and Arcadian redfish. Given its geographical location, particular hydrography, special bathymetry, and isolation, the Flemish Cap demersal ecosystem is potentially vulnerable to climate change, whose impacts might be strengthened by fishing pressure.
Northwest Atlantic cod stock was subject to a high level of fishing pressure in Newfoundland’s continental shelf. In 1977, Canada extended its EEZ to 200 nautical miles pushing foreign vessels to the Grand Bank nose and tail, and to the Flemish Cap, which until that moment had been a minor fishing ground (González-Troncoso et al., 2018). Such an increase in the harvesting pressure ended up in the collapse of Flemish Cap stock in the mid 90’s. However, this collapse occurred almost concurrently with the major cod collapse in the Grand Banks, suggesting that other reasons together with fisheries contributed to the collapse (Rose, 2003). In 1999, the NAFO established a fishing moratorium in the region that lasted 10 years. These circumstances also implied a change in the behavior of the major fleets in these waters. Before the collapse of the Flemish Cap cod, the trawl fishery targeted older individuals (> 5 years old), whereas after the collapse, the fishery started targeting younger individuals (>2 years old), as reflected in the age composition of cod catches (Pérez-Rodríguez, 2012). The objective of the present study is to analyze the growth history of Atlantic cod (Gadus morhua) from the Flemish Cap by using sclerochronological techniques to disentangle the impact of fishing and climate on this stock. To do so, we: i) measure ring increments on cod otoliths along the entire time series (1988-2016) and develop a growth chronology of the cod population accounting for differences in age groups; and ii) identify primary intrinsic (age and age at capture) and extrinsic (climate, fishing, density dependence, and prey availability) drivers affecting cod growth by period (Premoratorium, Moratorium and Postmoratorium) by applying linear mixed-effects models.
Materials and Methods
Data were collected during a series of research bottom trawl surveys carried out in Flemish Cap since 1988 within the European Data Collection Multiannual Program for fisheries assessment, accounting for 33 years of biological and oceanographic data. It was a random stratified survey, following NAFO methodological specification (Doubleday, 1981). One hundred eighty hauls of 30 minutes effective fishing time were normally performed in each survey during the daytime. The survey took place in summer with a month of duration (from the end of June to the end of July). Currently, the surveyed area is divided into 32 strata (Figure 1), and although it has experienced some variations during the years, it was not significant for the purpose of this study. During the survey, the catches of all fish species and invertebrates were recorded (Atlantic cod, redfish, American plaice, Greenland halibut, roughhead grenadier, and northern shrimp) (Vázquez et al., 2013). Biological data recorded were total length, total and gutted weight, and sex and macroscopic maturity stage. Additionally, otoliths (of both sexes) and ovaries (only females) were collected. Fish age was determined in all the target species by age-reading experts once in the laboratory.
Figure 1
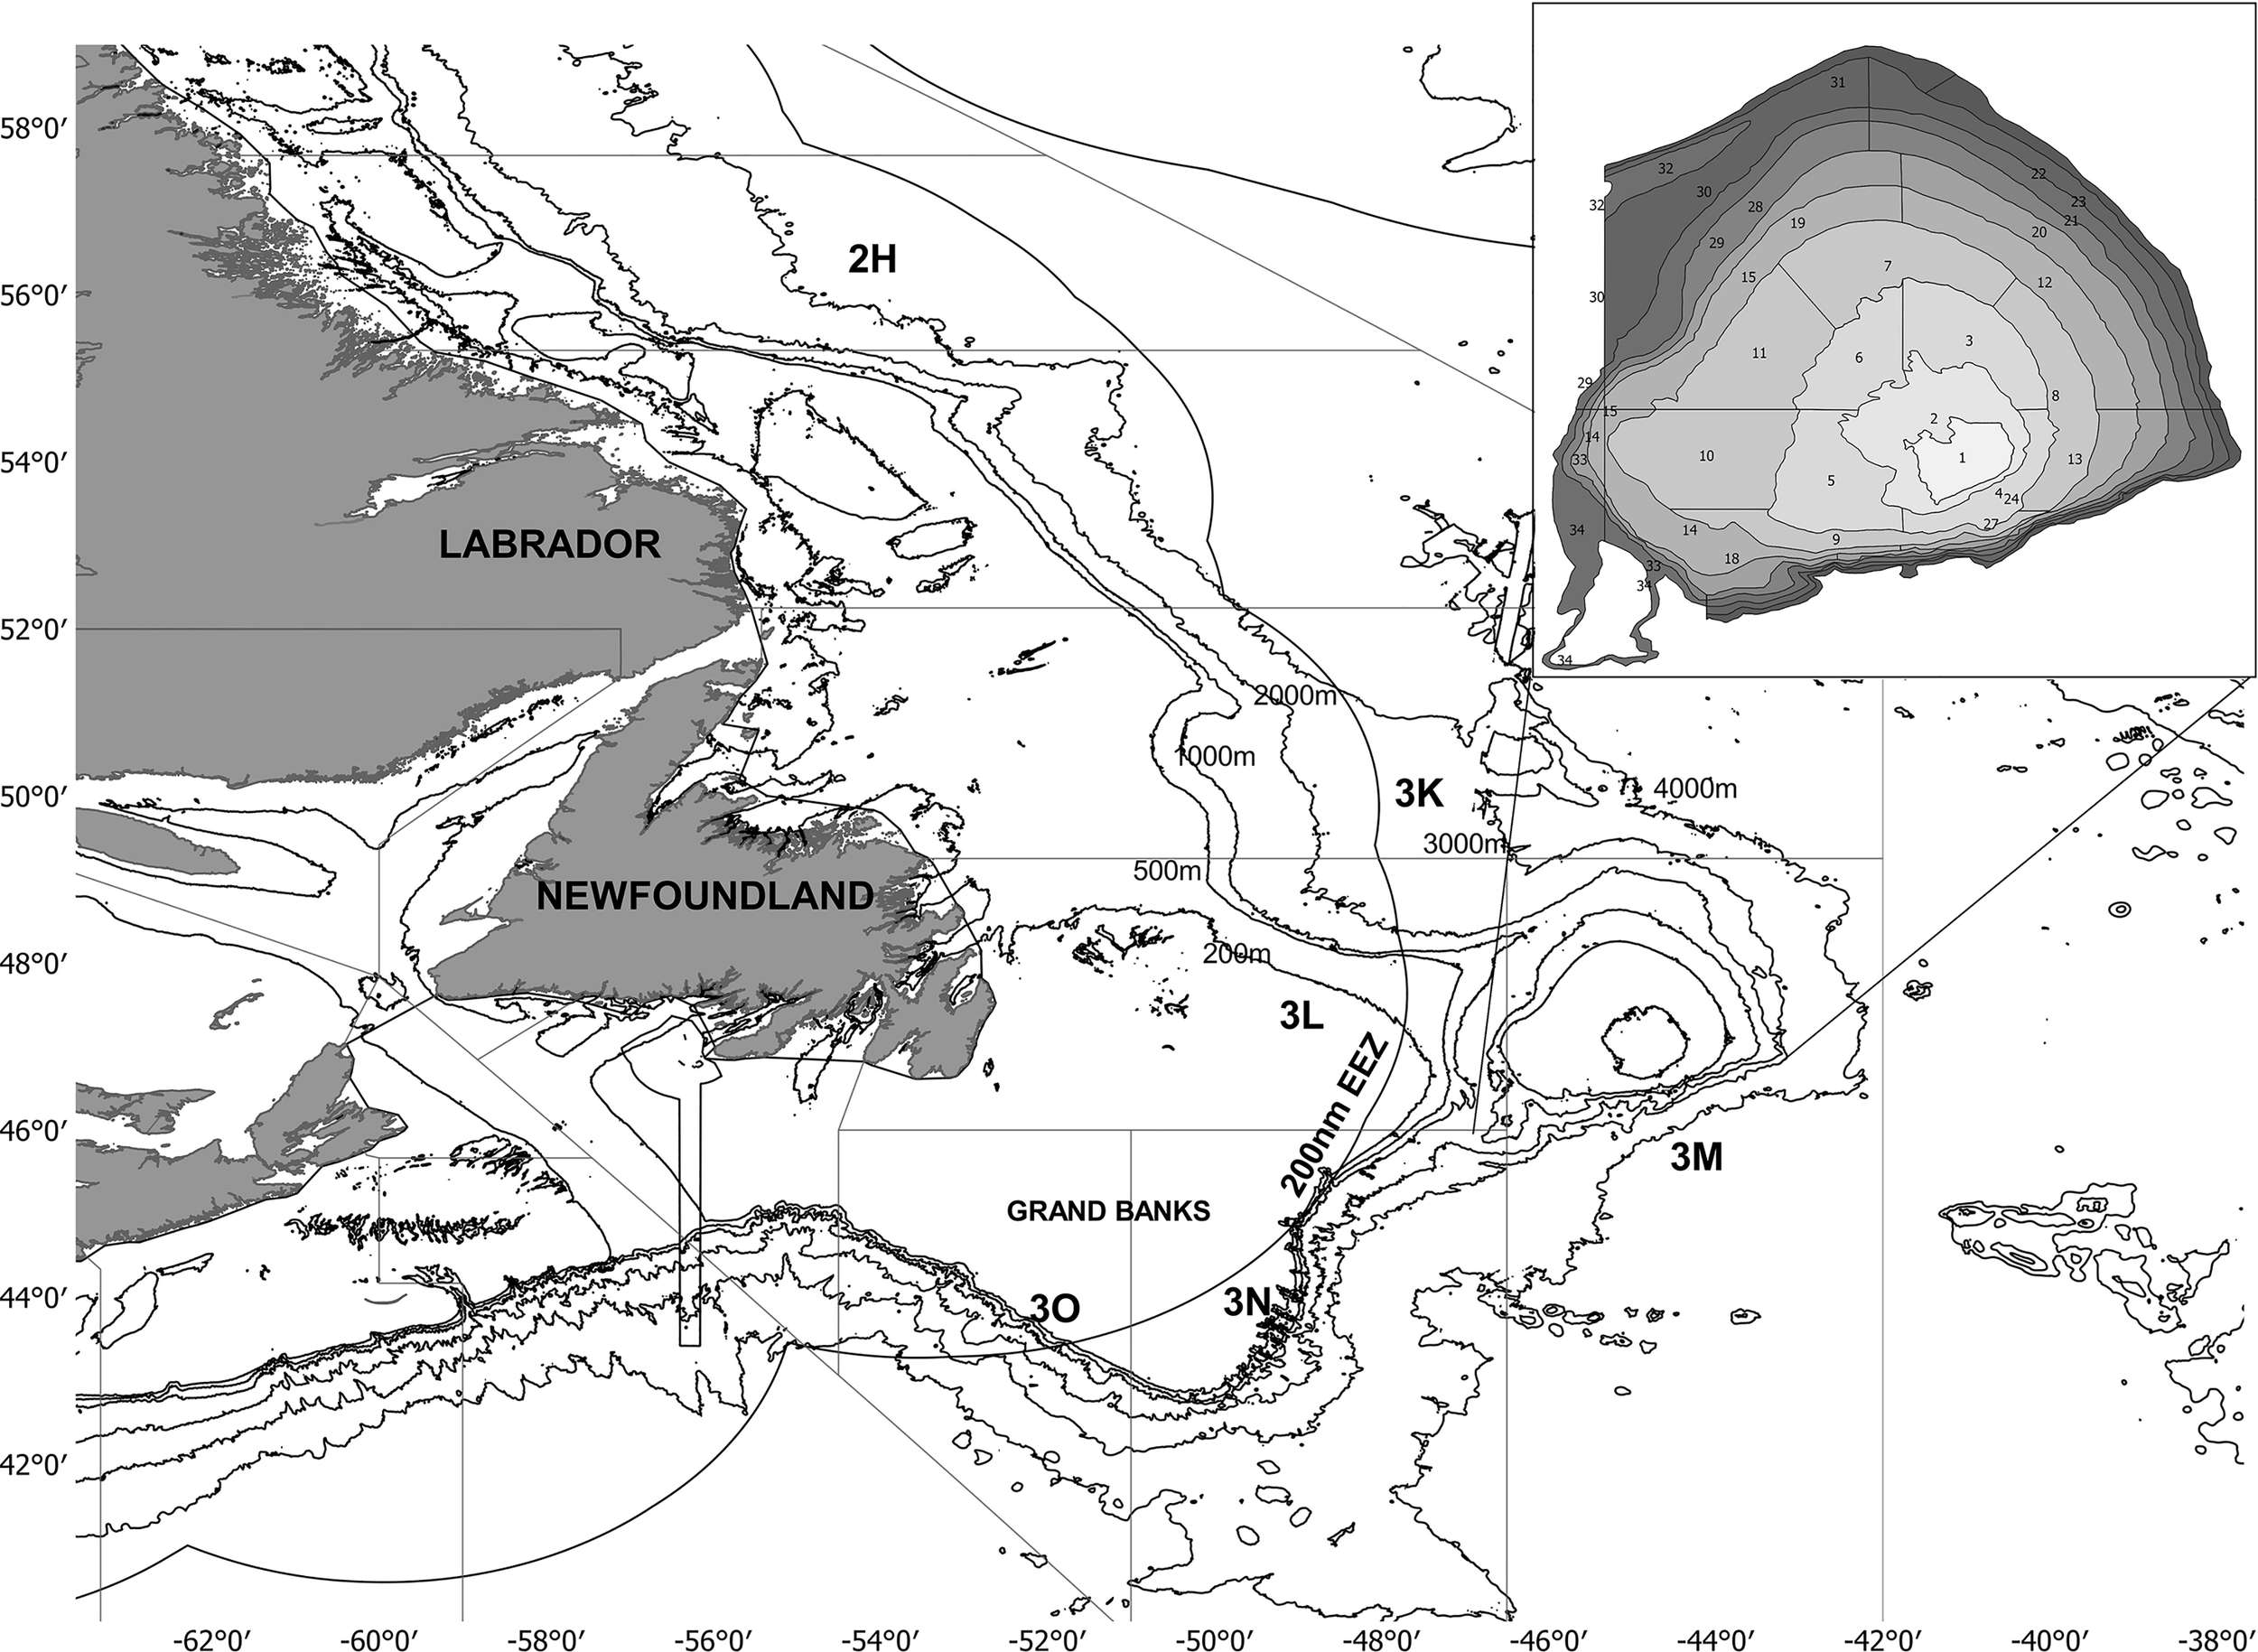
Map of Newfoundland and Labrador waters. Lines indicated isobaths (200, 500, 1000, 2000, 3000 and 4000 m depth). Fisheries management units in which the continental shelf is divided are identified with the following letters: 2H, 3K, 3L, 3M, 3N and 3O. The Flemish cap has been zoomed in the upper right panel to show strata division (total: 32 strata). Source: Adapted from Pérez-Rodríguez, (2012).
Otolith Processing and Measurements
A total of 137 cod otoliths of individuals equal to or older than eight years old were selected for this study. The threshold age was selected to guarantee the best sample depth through the series. All otoliths were aged before starting biochronological studies. Since all the samples were collected in summer, the last annulus width measurement was excluded from the analysis because it is considered incomplete. Identifying the first annual ring in cod from Flemish Cap is difficult. The first ring was counted but sometimes could not be placed precisely. In these cases, annotation of otoliths started at the second annual ring. Dendrochronology approaches (crossdating) cannot be applied to this species due to the short longevity of the cod (about 16 years in Flemish Cap). However, if a dating error is made in a short-lived fish, the consequences of that error do not back-propagate far in time, as they would do in longer-lived fish for which crossdating is more important (and possible) (Smoliński et al., 2020). The relationship between fish length and otolith radius was analyzed in the present study by conducting a lineral regression (a = 2.11, b= 0.039; n=137, adjusted R² = 0.437, p< 0.01).
A strong relationship between cod growth and otolith growth has been proven for Atlantic cod (Hüssy and Mosegaard, 2004). Hence, changes in increment widths can be used directly as a proxy for changes in somatic growth (Campana, 1990). A total of 137 individuals of Atlantic cod caught between 1988 and 2017 in the study area were included in the analysis. Otoliths were sectioned and polished to measure annual increment widths. High-resolution digital pictures of the transversal section were taken with the Leica stereomicroscope M205C at 2.5 magnification. Each annual ring was measured from the nucleus to the dorsal distal edge (Figure 2). Otolith radius (from the nucleus to dorsal margin) was also measured to test if the detected ring width variations reflected fish size variability, i.e., if otoliths act as a record of the individual growth through its entire life. Images were analyzed using Object J, a plugin of the open-access software Image J. Otoliths showing damage, abnormalities, or crystalline were excluded from the analyses.
Figure 2
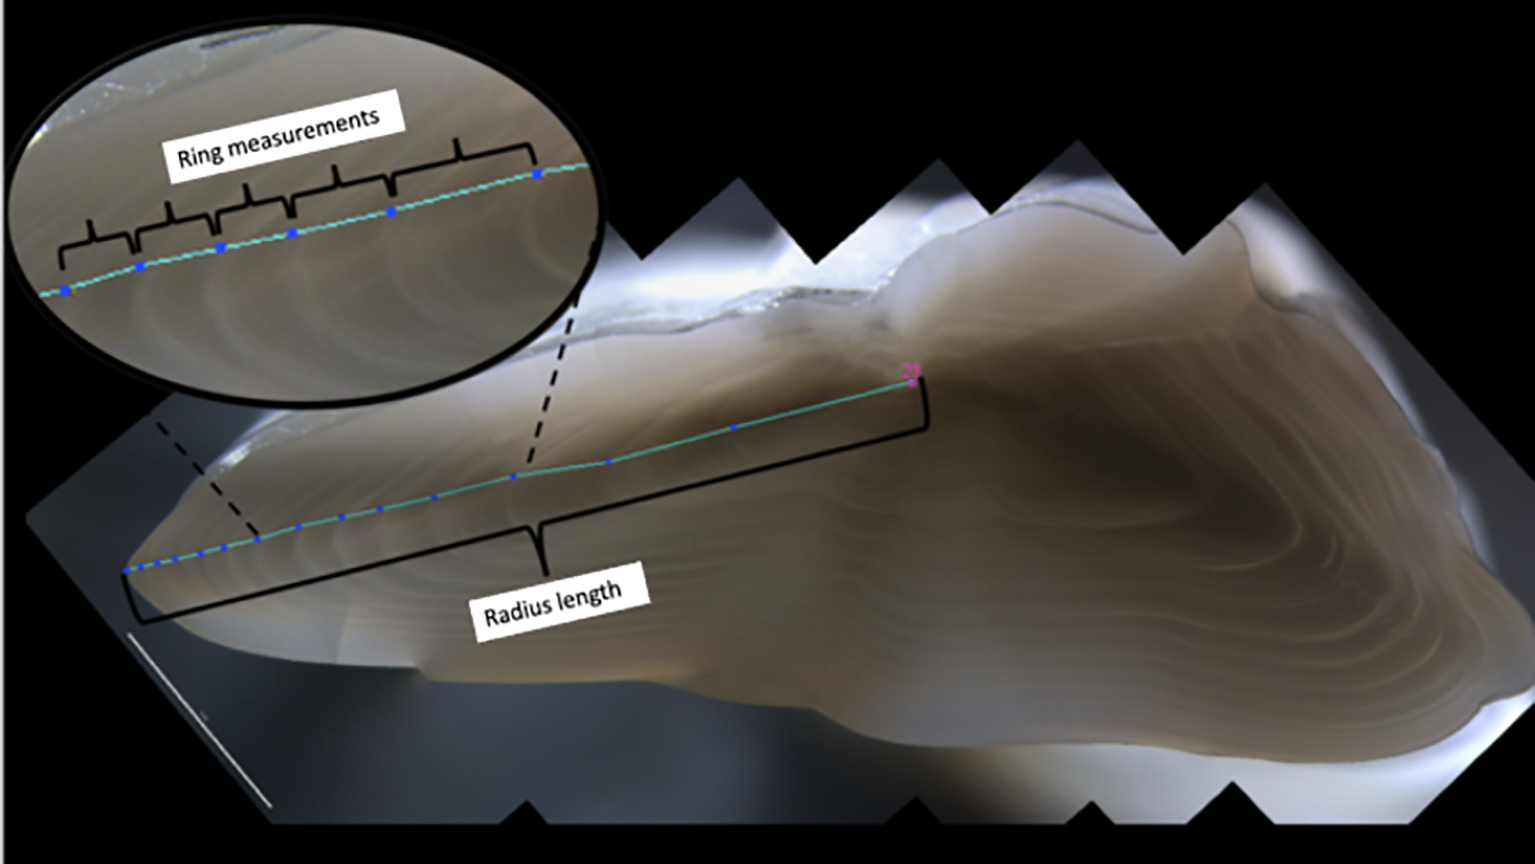
Transversal section of an Atlantic cod otolith. Radius length indicates measurement from nucleus (pink number) and otolith edge. Annual ring measurements were zoom in the upper left panel. Measurements were taken from nucleus to the border. Growth rings were identified and marked (blue dots) and distance between them (cyan line) were automatically measured by the Image J software.
Growth Analysis
An annual rings measurement series was used as an indicator of growth performance at both individual and population levels, being the response variable in our analysis. To analyse the factors that drive growth in Flemish Cap cod, a number of explanatory variables were selected based on literature review and the current knowledge on the Flemish Cap ecosystem. These variables were chosen after considering two main ecological processes known to potentially impact growth in marine fish (food availability and density dependence) and anthropogenic and environmental pressures (fishing intensity and climatic variables) (See SM-1 to further details on extrinsic variables calculations). To avoid correlation and collinearity between explicative variables, the Pearson’s rank correlation index and the variance inflation factor (VIF) were calculated before running the models (Zuur et al., 2009). Specifically, correlations among variables was checked by performing a Pearson’s correlation test with the corrplot package in R software. Collinearity was tested by computing the generalized variance-inflation factors (GVIF), which are the corrected VIF values, by the number of degrees of freedom of a predictor variable. GVIF was assessed using the corvif function in R software. Pairs of variables with high correlation values (Pearson correlation r > 0.6) or high variance inflation (VIF > 3) were identified and only one was included in the modeling process.
Growth chronologies were performed for the whole dataset and by age groups. First, the entire dataset, which includes all pooled annual ring increments for fish aged 1–16 (the so-called “Master chronology”), was used to generate the general population chronology. Then, the dataset was split into three age groups: Group 1, age 1-4; Group 2, age 5-7; and Group 3, ages 8–16. The aim was to calculate growth chronologies by age group considering that the age-dependent effect of maturity and fishing intensity on growth. In that sense, Group 1 includes mostly immature individuals as cod reaches maturity around 4 years old in Flemish Cap (González-Troncoso et al., 2018); Group 2 includes mature individuals not targeted in the fishery before the moratorium but becoming an important target after that. Finally, Group 3 includes the biggest and more targeted individuals of the population. The effect of extrinsic factors was only tested in the Master chronology of cod growth (i.e. all pooled ages), as we wanted to test how the entire population responds to periods of different fishing intensity (Premoratorium (1988-1998), Moratorium (1999-2009), and Postmoratorium (2010-2016). Note: In a preliminary analysis, we tried to split the dataset by both age groups and fishing periods, but we ended up with low observations, and the model was not able to computed.
The framework developed by Morrongiello and Thresher, 2015 was used in the present study to perform a series of hierarchical mixed-effects models in R using the packages lme4 (Bates et al., 2015), AICcmodavg (Mazerolle, 2015), and effects (Fox, 2003). Annual ring width was used as the response variable and a set of fixed and random effects (Table 1) were included in the model. Fixed effects consist of: i) those independent variables that are inherent to our samples, called intrinsic factors (Age and Age at capture), which account for age-related trends, bias and selectivity (Morrongiello and Thresher, 2015; Martino et al., 2019); and ii) variables that consider external causes, so-called extrinsic factors (Year, Sebastes and Pandalus abundances, Bottom temperature, NAO index, Fishing Mortality, Cod abundance, and Proportion of matures) (Table 1). Sex was not included in the model as an intrinsic factor because this information was not collected during the first years of the survey. This model also allows the inclusion of a random structure, which is key for growth analysis as ring measurements are correlated. The random component was incorporated into the model with four variables: Fish ID, Year, Cohort, and Age (See SM-2). Random intercepts allowed for higher or lower growth within each variable relative to the model average (intercepts) (Martino et al., 2019). Therefore, the FishID accounts for correlation among ring measurements within a fish, allowing each fish to have higher or lower growth than the average. Year refers to the natural year within which a particular ring is formed and, together with FishID, accounts for correlations among the increments of different fish deposited the same year, providing estimates of whether conditions were better or worse for growth in a particular year compared with the average through the time series. Cohort was included as a random effect as it induces correlations among the growth of individuals born in the same year. As with Year, Cohort also provides temporal estimates of fixed factors growth variations but, instead of being annual, it captures systematic growth deviations for groups of fish across their lifetime. Random Age slopes were also included for FishID and Year to facilitate detrending the age-related effect (Monrrongiello and Thresher, 2015).
Table 1
| Effect | Type | Variable | Description |
|---|---|---|---|
| Fixed | Intrinsic | Age | Age when otolith increment was formed |
| Age at capture (AAC) | Age when fish was caught | ||
| Extrinsic | Year | Calendar year when increment was formed (1 Jan-31 Dic) | |
| Sebastes abundance | Abundance of Sebastes mentella and fasciatus (main prey of cod) | ||
| Pandalus abundance | Abundance of Pandalus borealis (main prey of cod) | ||
| Bottom Temperature | Water temperature at depth at which cod is found at each age | ||
| NAO index | Indication of the strength and direction of the North Atlantic Oscillation | ||
| CIL thickness | Thickness of the Cold intermediate layer | ||
| Fishing Mortality | Indication of cod mortality due to fishing at age | ||
| Cod abundance | Annual abundance of cod at age | ||
| Random | Random | Age | Age when otolith increment was formed |
| Fish ID | Unique fish identifier | ||
| Year | Year in which increment was formed (1 Jan-31 Dic). Quantifies inter-annual growth variability | ||
| Cohort | The year at which fish was born |
List of explanatory variables used as fixed and random factors in the linear mixed-effects model.
Data transformation was needed for building up the model. Ring width, Age, and Age at Capture (AAC) were log-transformed to satisfy model assumptions (normality, heteroscedastic, and independency). Extrinsic variables were standardized to the mean to help model convergence (Morrongiello and Thresher, 2015). Analysis of random effects was performed by including all intrinsic factors (Age and AAC) with a series of random structures (combinations of random slope and/or intercepts FishID, Age, Year, and Cohort). Models were fitted by using Restricted Maximum Likelihood criterion (REML) and ranked using Akaike’s Information Criterion corrected for small sample sizes (AICc). The model with the lowest AICc was selected as the best model (Burnham and Anderson, 2004). The amount of variance explained by the models was assessed using two R2 metrics (calculated on models fit with REML) defined for mixed-effects models by Nakagawa and Schielzeth, 2013. Marginal R2 describes the proportion of variance explained by fixed effects alone, whereas Conditional R2 describes the proportion of variance explained by fixed and random effects combined. The master growth chronology was developed by extracting the best linear unbiased predictors (BLUPs) from the model with the best Year random effect and including intrinsic effects only (Morrongiello and Thresher, 2015). This chronology estimated the annual and interannual variation around an overall chronology mean of zero. Once the optimum random structure was selected, the fixed intrinsic source of growth variation was studied (Age and Age at capture) yij= β1Ageij + β2ACCij + bi1FishIDij × ageij + bi2Yearij + ϵij. To compare models with nested fixed effects but the same random structure, ML estimation must be used instead of REML (Zuur et al., 2009). Models were fitted with maximum likelihood (ML); (REML = F). Once the best intrinsic effect structure was selected, it was refitted with REML to get unbiased parameter estimates (Zuur et al., 2009). The best intrinsic structure was called the base model. Then, a new model, including the optimal random and intrinsic structures, was performed by adding Year as a fixed effect in a linear or curvilinear form.
To assess external influences on Atlantic cod growth, extrinsic factors were added to the base model. In this step, the dataset was limited to the years in which environmental variables were available (1988–2016). This analysis was performed using the growth chronology of the population with all pooled ages (i.e., Master chronology) but, this time, the temporal series was divided into three periods: Premoratorium (1988-1998), Moratorium (1999-2009), and Postmoratorium (2010-2016). The effect of extrinsic variables on cod growth was first assessed individually by running three different models per variable: (i) the base model, which was the best intrinsic model for each age group; ii) the linear model, which includes the base model plus the extrinsic variable to be tested fitted to a linear relationship; and iii) the curvilinear model, which was the same as the previous one but fitted to a non-linear relationship and selecting the best model based on lower AICc. Once the effect and relationship type of the extrinsic variables with cod growth were defined, we proceeded to create the three final models (Morrongiello and Thresher, 2015). Model selection was performed by beginning with all possible interaction terms and carrying out a stepwise backward model selection. The best model selection was based on AICc, which was used to measure goodness-of-fit. The smaller the AICc values, the better the compromise among fit, parsimony, and predictive quality.
Results
A total of 1096 annual rings were measured from 137 cod individuals covering a period of 35 years (From 1981 to 2016). During the early 90’s, Atlantic cod stock collapsed in Flemish Cap and hence, sample depth of the time series decreased in that period. However, it was never lower than 5 observations per year (mean sample depth before collapse (1980-1989) = 277, during collapse (1990-2004) = 180 and after collapse (2004-2016) = 638). Additionally, as reading the first annual ring in cod from Flemish Cap is hard, sample depth at this age is slightly low (around 40 observations) (Figure 3).
Figure 3
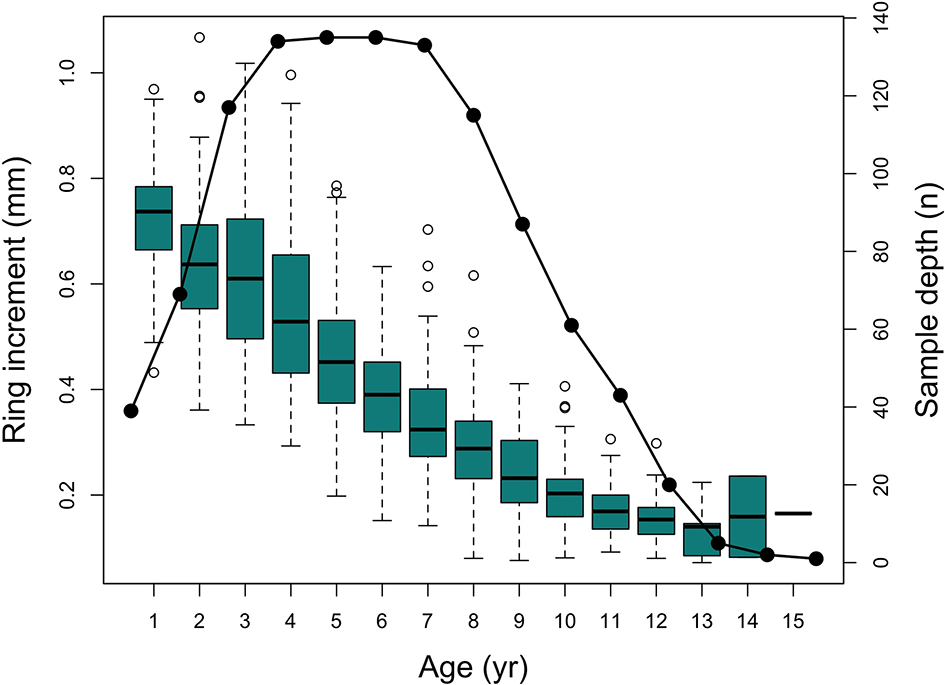
Box-and-whiskers plot of annual increment measurements of all analyzed otoliths with lines, boxes and whiskers representing medians, interquartile range (IQR), and 1.5 IQR respectively. White circles represent outliers; black circles represents sample depth.
The growth master chronology of Flemish Cap cod exhibited considerable interannual variation with noticeable positive and negative growth phases. In the master chronology (Figure 4A), cod growth index (based on annual increments of the otolith) increased from 1981 until 1985 followed by a sharp decline, reaching a minimum value in 1990 (-20%). Between 1990 and 1998, growth fluctuated above the zero value of the index and then increased gradually up to 2006 (about 20%). Finally, the growth index sharply decreased, reaching the historical minimum of the series in 2015 (-80%). In general, despite fluctuations, growth showed a clear and deep decrease since 1985. This temporal trend was also supported by the model that included Year as a fixed factor (Figure 4A.1). However, when we unravel this information by age groups, similar interannual growth phases are displayed for groups 1 and 2, while group 3 was less pronounced (Figures 4B-D). Looking at the values of minimum growth in group 1, they were reached in 2008, 2009, 1998, and 2001 (> -10% growth); group 2 showed its minimum in 1995, 1998, 2009, and 2012 (> -7% growth); whereas group 3 reached its minimum values in 2015, 2009, 2014, 1991, and 2016 (> - 2% growth), it has also dropped in 1998 (-1.9%) coinciding with group 1 and 2. In contrast, maximum values of cod growth were reached in 1984, 1983, 2006, and 2002 for group 1 (> 6%); in 1985, 2006, and 2005 for group 2 (>8%); and in 2011, 1989, and 1988 for group 3 (>4%). The growth index was correlated between groups 1 and 2 (R=0.415) and groups 1 and 3 (R=0.411). The Pearson correlation between groups 2 and 3 was low (R=0.109). The chronologies of age groups 1, 2, and 3 displayed a negative trend on cod growth (Figures 4B.1, C.1, D.1). The Pearson correlation between the master chronology and groups 1, 2, and 3 chronologies were 0.5, 0.72, 0.52, respectively.
Figure 4
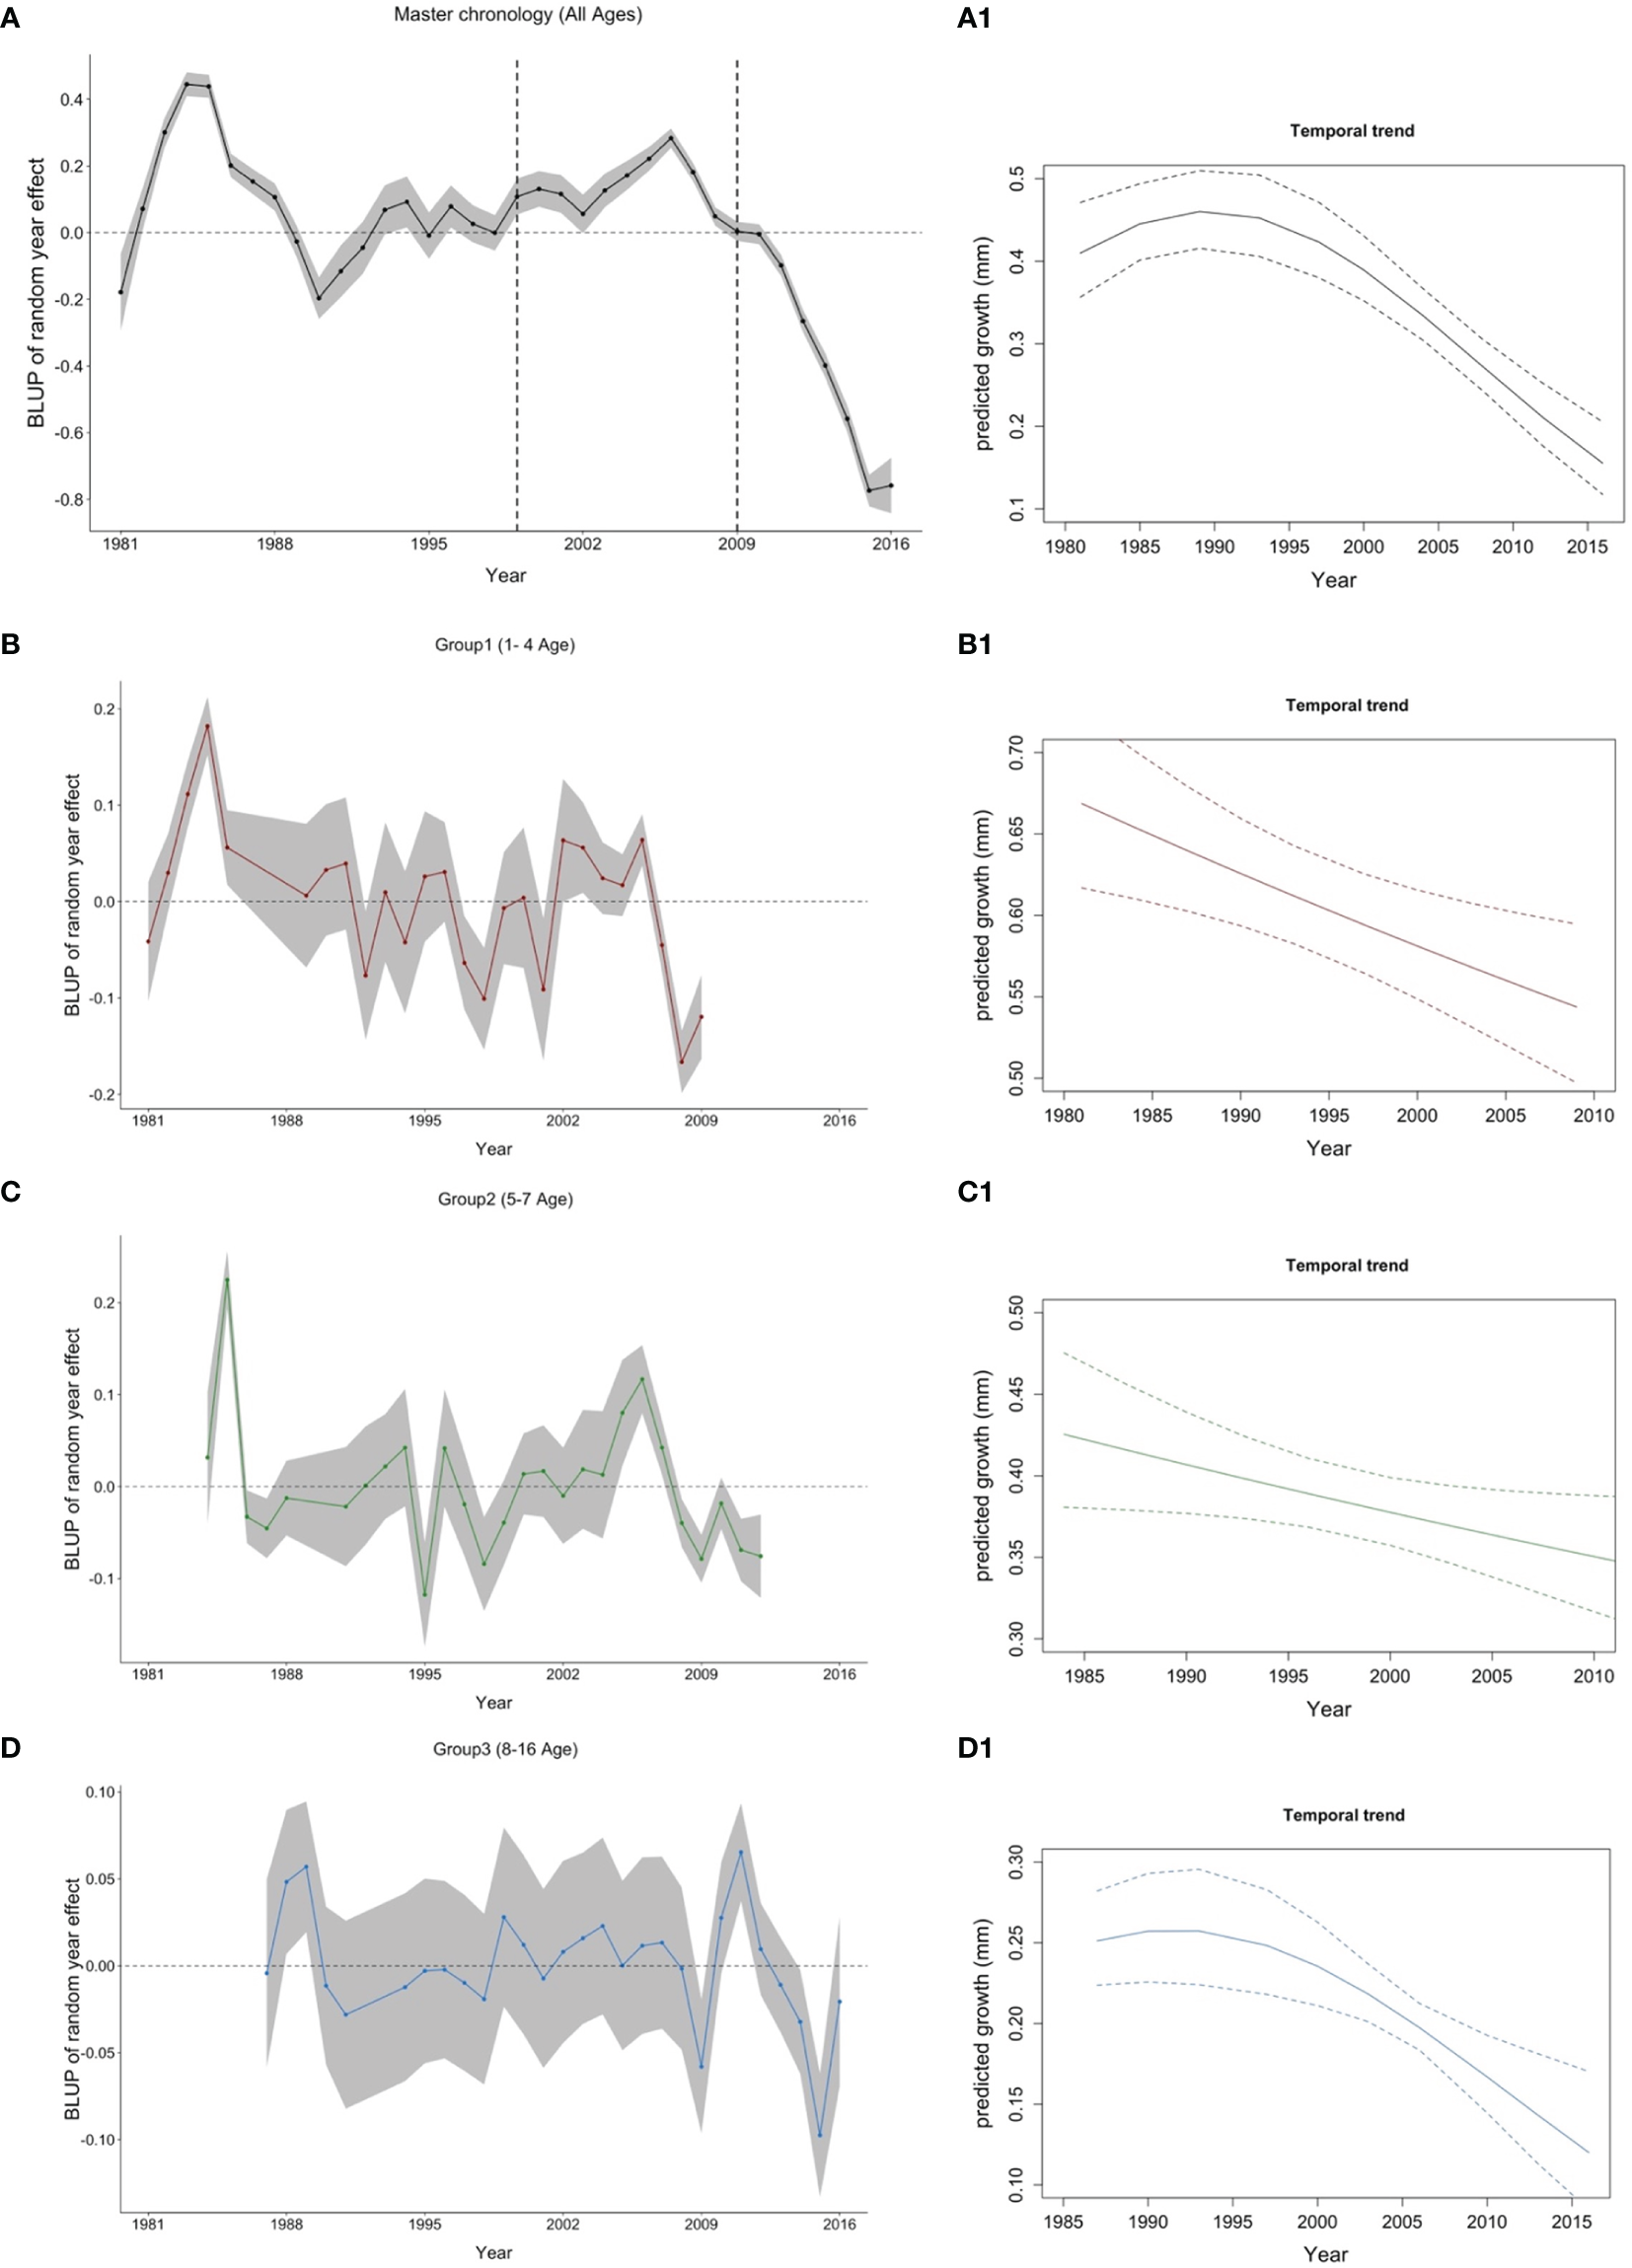
Best linear unbiased predictor (BLUP) for the year random effect (left panel- A) Master chronology, (B) Group 1, (C) Group 2 and (D) Group 3) and temporal trend of cod growth (right panel—A1) All ages, B1) Group 1, C1) Group 2, and D1) Group 3. Age groups are also indicated by the following colors: All ages (1-16): black; Group 1 (age 1-4): red; Group 2 (age 5-7): green and Group 3 (age >=8): blue. Vertical dashed lines in the master chronology indicate the beginning and the end of the Moratorium.
The optimum random structure was the one that had a random intercept and the age-specific slope for each FishID, and a random intercept for each Year. This structure was the best one for each age group and for all the data as a whole. Then, a set of intrinsic variable combinations were analyzed, keeping the optimum random structure for each age group (See SM-2). For all pooled age groups (i.e. master chronology), group 1 and group 3, the best model included just the “Age” effect. However, for group 2, the best model also included Age at capture (AAC). The conditional R2 indicated that the selected models explained 91.4%, 81.4%, 87.6%, and 89.1% of the fish growth variability for all ages group (age 1–16), group 1 (1-4), group 2 (age 5–7), and group 3 (age 8–16), respectively. For group 2, a negative relationship between growth and Age at capture (AAC) was identified. This relationship was also observed for the group 1, but as including this variable did not improve the model AICc more than 3 units, we left it out.
Finally, “Age” effect was extracted and analyzed for the three age groups and the master chronology. As expected, annual ring increments declined with fish age, being this drop continued until the 4th year, coinciding with the average age at which cod reach maturity in Flemish Cap (Figure 5; See SM-1).
Figure 5
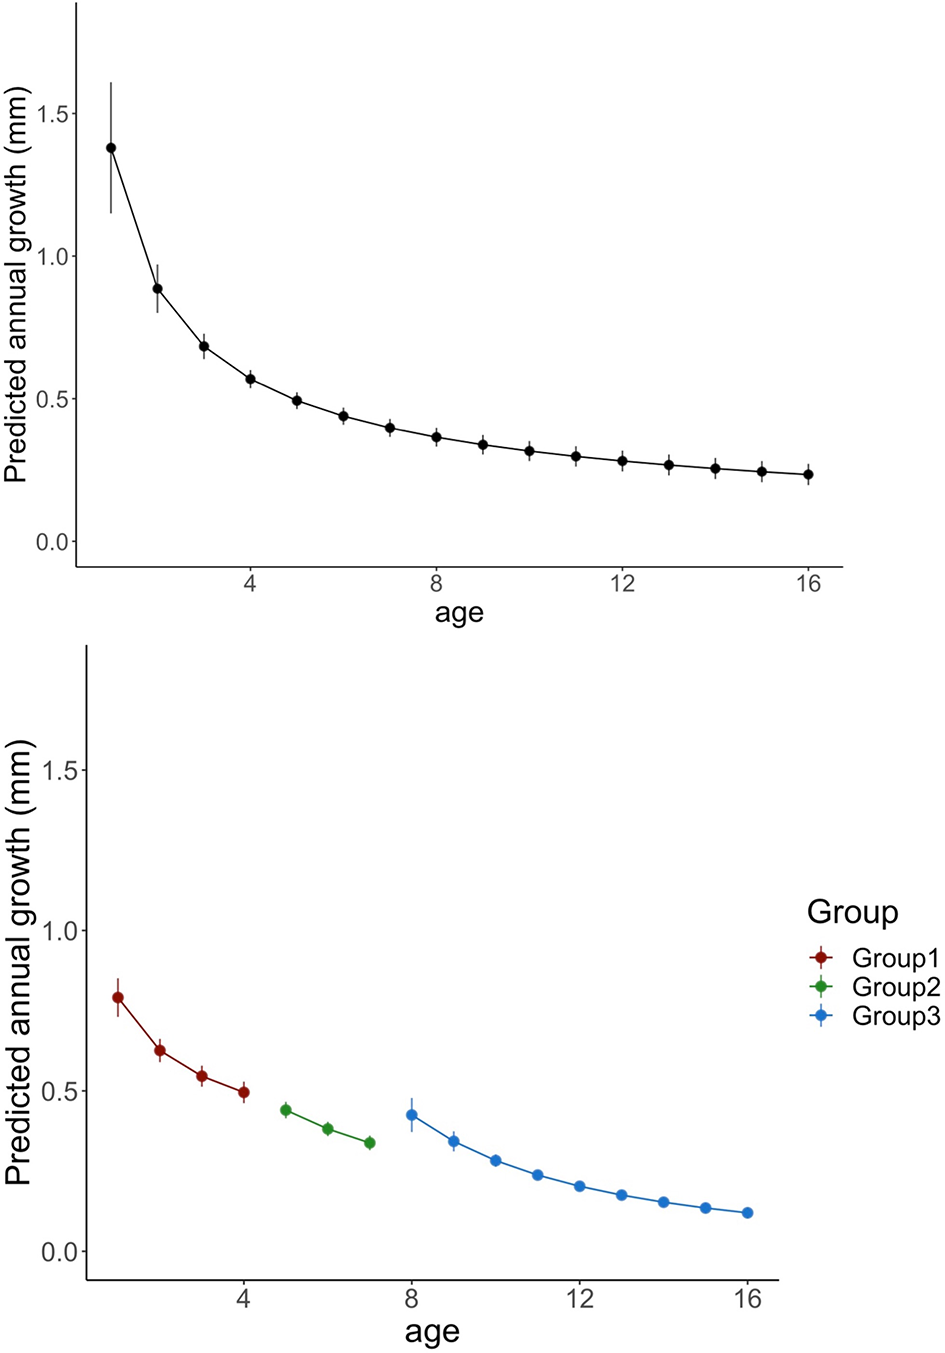
Predicted variations in annual growth of cod for all age groups (left panel) and for each age group (right panel). Line colors indicates age groups (All groups: black; group 1: red; Group 2: green and Group 3 blue). Vertical lines denotes standard errors.
Extrinsic Drivers of Cod Growth
According to the correlation and collinearity analyses, the final explanatory variables included in the model were: Pandalus abundance, Sebastes abundance, Bottom temperature, CIL Thickness, Fishing mortality, and Cod abundance. The amount of variance explained by each model is shown in the terms Marginal R2 (for fixed effects) and Conditional R2 (for fixed + random effects) (Table 2). Our results showed that drivers of cod growth varied between periods. Growth drivers during the Premoratorium period were: age, fishing mortality, and bottom temperature (Marginal R2=0.719; Conditional R2=0.932). During the Moratorium drivers were: age, Pandalus abundance, and cod abundance (Marginal R2=0.601; Conditional R2=0.904). Finally, during the Postmoratorium period, cod growth drivers were: age, CIL thickness, and cod abundance (Marginal R2=0.607; Conditional R2=0.904). The rest of the covariates were removed from the model during the stepwise process
Table 2
| Predictors | Premoratorium log(ring measu) |
Moratorium log(ring measu) |
Postmoratorium log(ring measu) |
|||||||||
|---|---|---|---|---|---|---|---|---|---|---|---|---|
| Estimates | CI | p | df | Estimates | CI | p | df | Estimates | CI | p | df | |
| (Intercept) | -0.95 | -1.05 – -0.86 | <0.001 | 21.69 | -0.68 | -0.75 – -0.61 | <0.001 | 36.56 | -1.52 | -1.59 – -1.46 | <0.001 | 33.98 |
| c.(age) [c.(log] | -0.91 | -1.08 – -0.73 | <0.001 | 37.38 | -0.52 | -0.60 – -0.44 | <0.001 | 144.22 | -1.15 | -1.48 – -0.82 | <0.001 | 8.50 |
| c.(temp.bottom) | 0.11 | 0.01 – 0.22 | 0.024 | 9.79 | ||||||||
| c.(F) | 0.07 | 0.02 – 0.13 | 0.005 | 52.17 | ||||||||
| c.(F)^2 | -0.02 | -0.03 – -0.00 | 0.030 | 73.56 | ||||||||
| c.(pan.ab) | 0.13 | 0.05 – 0.20 | 0.002 | 11.07 | ||||||||
| c.(pan.ab)^2 | -0.05 | -0.10 – -0.01 | 0.017 | 8.50 | ||||||||
| c.(Cod.ab) | -0.04 | -0.20 – 0.12 | 0.60 | 199.86 | -0.34 | -0.55 – -0.14 | 0.006 | 113.04 | ||||
| c.(Cod.ab)^2 | -0.18 | -0.31 – -0.05 | 0.007 | 100.69 | ||||||||
| c.(thicknessCIL) | -0.11 | -0.17 – -0.06 | <0.001 | 4.34 | ||||||||
| Random Effects | ||||||||||||
| σ2 | 0.015 | 0.01 | 0.02 | |||||||||
| τ00 | 0.038 FishID | 0.04 FishID | 0.07 FishID | |||||||||
| τ01 | 0.005 fYear | 0.002 fYear | 0.00 fYear | |||||||||
| τ11 | 0.98 FishID.c.(log(age)) | 0.03 FishID.c.(log(age)) | 0.14 FishID.c.(log(age)) | |||||||||
| ρ01 | 0.59 FishID | 0.05 FishID | 0.38 FishID | |||||||||
| ICC | 0.83 | 0.79 | 0.80 | |||||||||
| N | 54 FishID | 88 FishID | 72 FishID | |||||||||
| 9 fYear | 11 fYear | 7 fYear | ||||||||||
| Observations | 136 | 416 | 318 | |||||||||
| Marginal R2/Conditional R2 | 0.719/0.932 | 0.601/0.904 | 0.607/0.904 | |||||||||
Parameter estimates of fixed and random factors for the best model describing growth variantion in Femish Cap cod for the three periods of different fishing intersity: Premoratorium (1988-1998), Moratorium (1999-2009) and Postmoratorium (2010-2016).
Estimate, Estimates; CI, Confidence Interval; p, p-value; df, degree of freedom; σ2, Residuals; τ00, FishID intercept; τ01, Year intercept; τ11, FishID|Age (age slope); ρ01, FishID correlation; ICC, Intraclass correlation coefficient; N, Number of observations per FishID and Year) and Observations, observations. Finally; Marginal R2, Marginal R2 and Conditional R2, Conditional R2 (using Nakagawa and Schielzeth; 2013). Significant value (p < 0.05) are highlighted in bold.
During the Premoratorium (1988-2008), Bottom temperature showed a positive linear relationship with cod growth (Figure 6A). The model showed the maximum growth of Flemish Cap cod at a temperature around 4°C. In this period, Cod otolith growth has an asymptotic relation with fishing mortality [max. growth at fishing mortality between 1.5 and 2 (Figure 6B)]. It is interesting to note that increasing fishing mortality had, to some extent, a positive effect on the growth rate, which is likely connected with density-dependent factors. During the Moratorium, the main drivers of growth were Pandalus abundance, which showed a positive and asymptotic relationship with cod growth, and cod abundance, which had a linear negative effect on cod growth probably indicating high competitiveness between individuals (Figures 6C, D, respectively). Finally, during the Postmoratorium, thickness of the cold intermediate layer (CIL) and cod abundance had linear negative effects on Flemish Cap cod growth (Figures 6F, G).
Figure 6
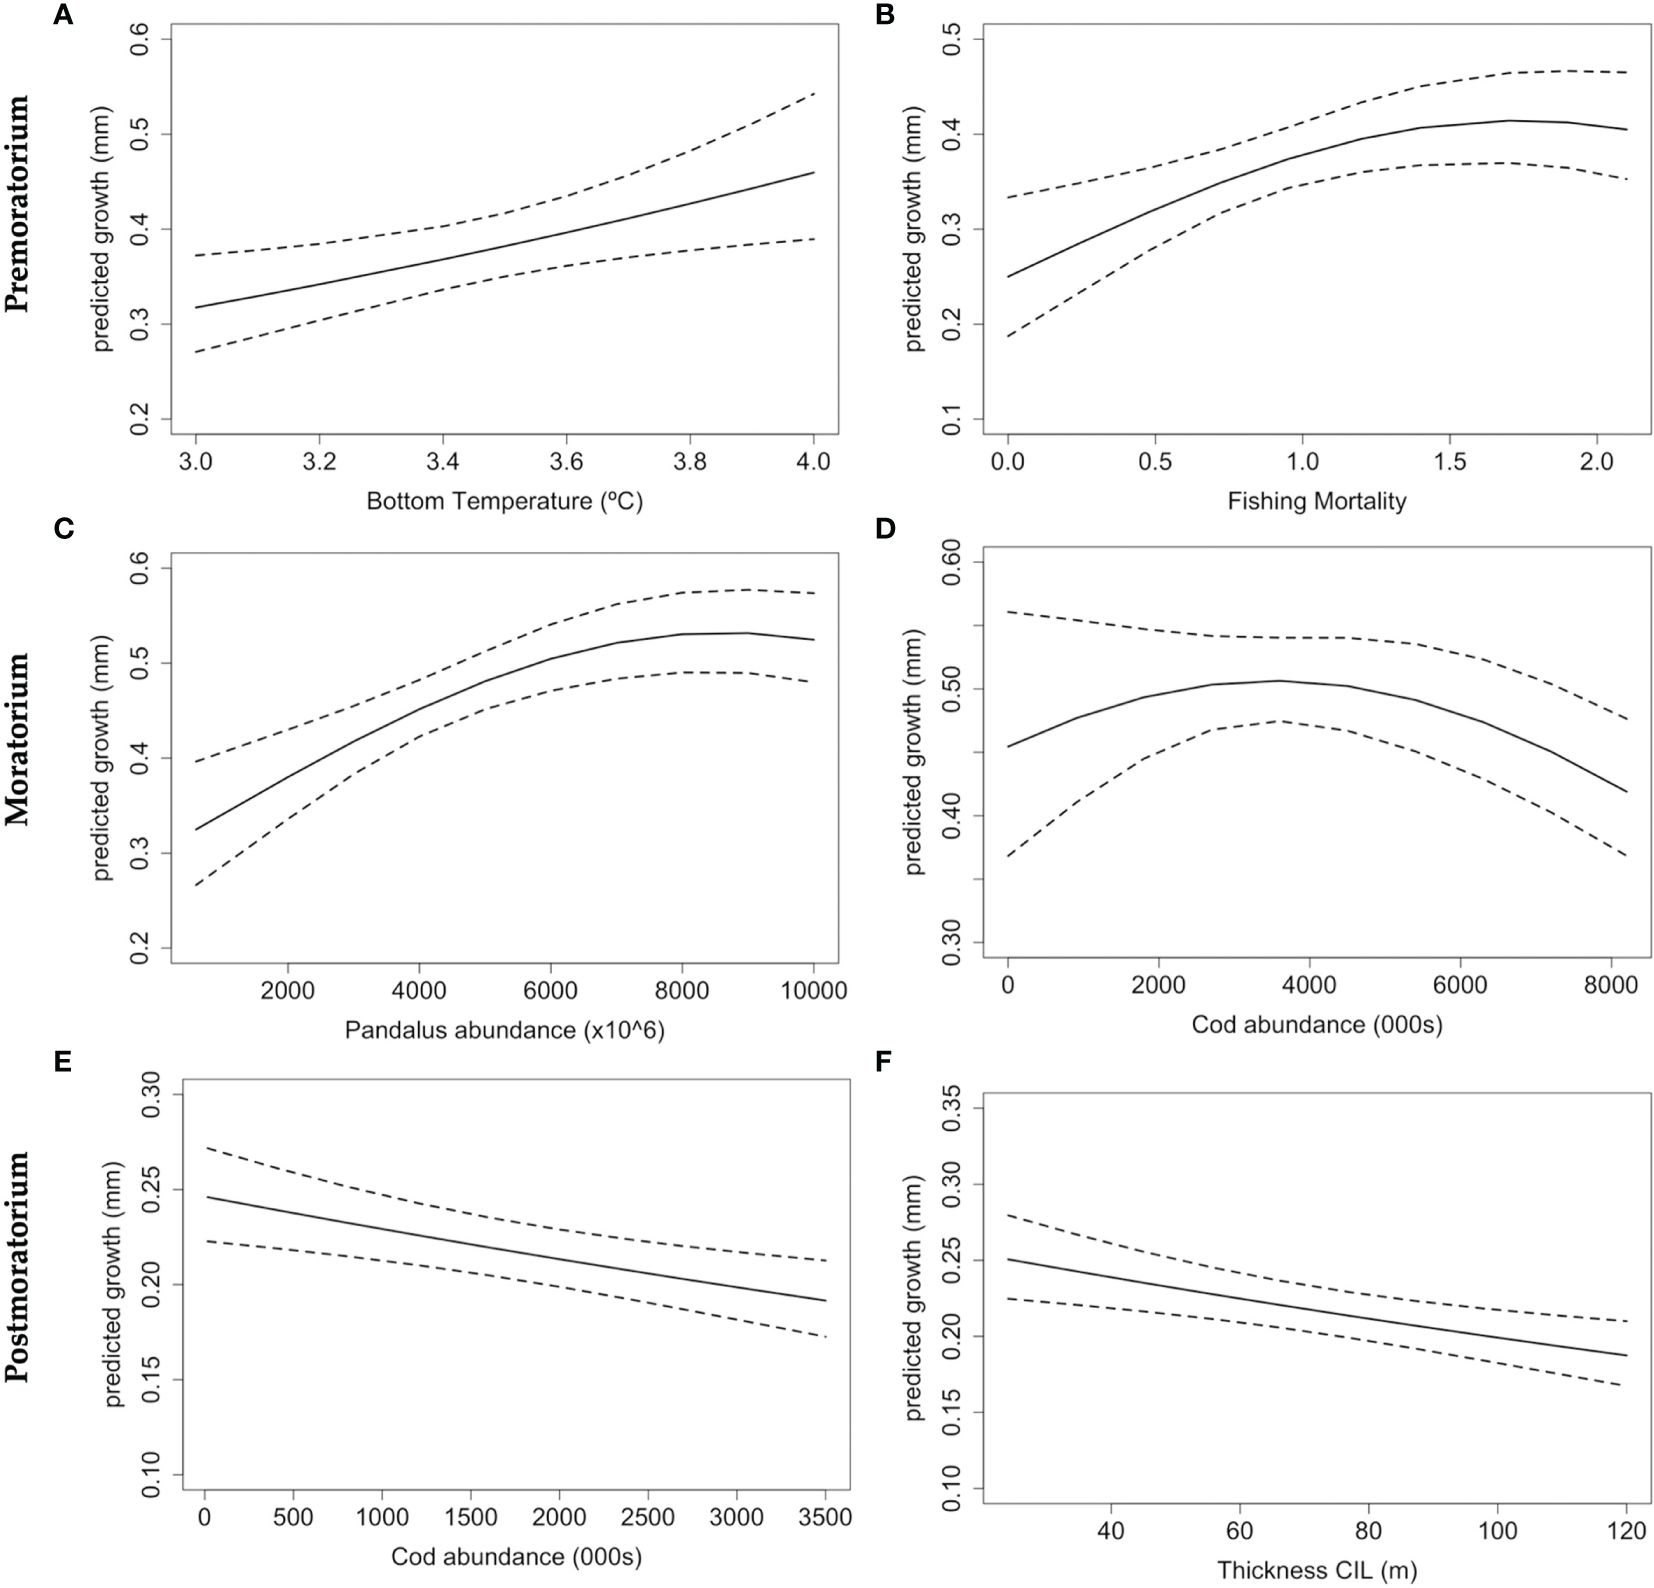
Predicted effects of extrinsic variables on Atlantic cod growth of the Flemish cap during 3 periods: Premoratorium (1988-1998), Moratorium (1999-2009) and Postmoratorium (2010-2019), using the Master chronology (i.e. all pooled ages). Panels indicates: Postmoratorium effects: Sea Bottom Temperature (A) and Fishing mortality (B); Moratorium effects: Pandalus abundance (C) and Cod abundance (D); and Postmoratorium effects: Cod abundance (E), and Thickness of the cold intermediate layer (CIL) (F). Dashed lines represent 95% Confidence intervals.
Discussion
In the present study, four growth chronologies were developed for one of the most iconic species in the North Atlantic Ocean, the Atlantic cod. The chronologies cover a time series of 35 years and are divided by age groups [group 1 (1-4 years old), group 2 (5-7 years old), and group 3 (8-16 years old)] considering the age-dependent effect of maturity and fishing intensity on growth. A master chronology (including all pooled ages) was also created and used to disentangle significant drivers of cod growth in 3 different periods: Premoratorium (1988-1998), Moratorium (1999-2009), and Postmoratorium (2010-2019). Our results indicate that, in the Flemish Cap region, cod has suffered a steep decline in its growth since 1981, but this decline is less pronounced in group 3 (>8 years old). Moreover, chronologies showed higher interannual variations in age group 1 and 2 than in age group 3. The three age group chronologies showed a minimum growth in 2009, which may be related to food competition as in that year the abundance of Pandalus borealis was low (570x106 individuals) compared with the mean value of the series. Cod growth was also low in 1998 for groups 1 and 2, corresponding with a year of high surface temperature (13.5°C, the maximum value of the temporal series), an intense negative NAO phase (-0.48), and high fishing mortality for group 2 (See SM-1). In contrast, high growth values were observed in 2006 for groups 1 and 2, corresponding with years of high surface temperature (11.75 and 12°C, respectively) and the negative NAO phase (-0.26 and -0.20, respectively). This contradiction in growth direction suggests that there may be several factors driving cod growth simultaneously. Some of those factors are not considered in our analysis (e.g. reproductive investment, metabolic costs, oxygen size-related limitations, change in fish distribution) (Chabot and Claireaux, 2019). Moreover, there is a carryover effect in which fish performance can be determined by previous experience (O’Connor et al., 2014). This phenomenon may be reflected in group 2 and 3 chronologies, where it seems to be a delayed effect on cod growth compared to group 1. In all the models used to build the chronologies, age was the most substantial factor influencing cod growth. The reduction of growth through age was steeper until the cod reached an age of 4, coinciding with the average age at which cod reach maturity in Flemish Cap (González-Troncoso et al., 2018). This is not surprising as fish growth significantly decreases as they get older and it has being reported in many other studies using otolith chronologies (Smoliński and Mirny, 2017; Martino et al., 2019; Tanner et al., 2019). Age at capture was significant for group 2 and it was slightly significant for group 1, although we did not include this variable in group 1 as it did not improve the AICc more than 3 units. However, it is worth mentioning that this negative relationship between Age at capture and cod growth (i.e., younger individuals growing faster) may be reflecting sexual maturity and/or fisheries-related mechanisms such as the size selectivity of the fishing gear (Tanner et al., 2019).
Mixed-effects models were applied to the master chronology (all pooled ages) to provide insight into cod growth drivers. Results from the extrinsic analysis showed that prey abundance, fishing mortality, cod abundance, bottom temperature and thickness of the cold intermediate layer were variables that contributed significantly to explain cod growth variability. However, the effect of these factors on growth changed depending on the fishing period [Premoratorium (1988-1998), Moratorium (1999-2009) and Postmoratorium (2010-2019)]. This highlights the importance of including sources of variations in biochronology studies not just for fishing or climate but for the whole branch of variables that can potentially affect fish growth. In fact, not simultaneously considering different sources of variability (especially size-selective mortality) on fish growth studies can lead to incorrect conclusions about the role of environmental factors (Sinclair et al., 2002).
The effect of climate on marine organisms and, more broadly, on marine ecosystems has recently drawn the attention of researchers as a consequence of new evidence of global warming. Atmospheric mean temperature and extreme events are predicted to increase within the 21st century, ultimately influencing ocean temperature, oxygen concentration, and current circulation, among other oceanographic parameters (IPCC, 2014). The shrinkage of individual body sizes in response to global warming has been reported for a broad set of organisms, from zooplankton (Moore and Folt, 1993) to vertebrates (Yom-Tov and Geffen, 2011), in both marine and terrestrial environments. In the case of fish, the impact of temperature on growth varies depending on depth. Some species from the Southwest Pacific that inhabit about 250 m (Redfish, Jackass morwong, and Banded morwong) have shown an increase of growth with temperature. In contrast, the growth of species that inhabit deeper water (Orange roughy, Smooth oreo, and Warty oreo) has decreased (Thresher et al., 2007). Therefore, fish growth responses due to warming do not have a clear direction as similar species in the same habitat show opposite trends (Thresher et al., 2007; O’Gorman et al., 2012). Our study showed a positive linear relationship of cod growth with bottom temperature only during the Premoratorium period (Beta=0.11, CI[0.01 – 0.22]). This could be related to the cold period that the region experienced in the 90’s (Rose, 2003). In fact, the mean temperature during the Premoratorium was 3.55°C, whereas during the Moratorium and Postmoratorium was 4.16°C and 4.23°C, respectively. The effect of temperature on growth has been tested in many other studies (Gillanders et al., 2012; Morrongiello and Thresher, 2015; Tanner et al., 2019), being significant although its direction varies among regions and species. Further, temperature has a dome-shaped effect on fish growth and affects the kinematics of biophysical and biochemical reactions that directly influence the metabolism of ectotherm species and ultimately reshapes fish physiology and behavior (Chabot and Claireaux, 2018). Atlantic cod, as a species, has a wide yearly thermal range, experiencing temperatures from 0 to 11°C, with extremes found at the Labrador Sea and the Celtic Sea (Chabot and Claireaux, 2018). Whitin their thermal niche, the growth rates of Atlantic cod increase with temperature, although there are evidence of a downturn once the thermal optima is exceeded (Righton et al., 2010). In the case of Flemish Cap cod, where the Bottom temperature has ranged from 2.5°C to 4.7°C for the time series (SM-1), this threshold seems to be around 4°C (see SM-1). The optimal temperature for the specific population in the Flemish Cap may be much lower than in other cod populations, as it is adapted to colder environments and ecosystems. Bottom temperature has increased in Flemish Cap over time, although since 2011 it has slightly decreased and kept relatively constant around 4.2°C (See SM-1). Additionally, climate change scenarios predict further warming and deoxygenation in the region (Saba et al., 2016; Claret et al., 2018). This information suggests that the species may currently be close to its temperature threshold and it will potentially be exceeded in the future, having drastic consequences for the cod population. Assuming we accept that Flemish Cap is a closed demersal ecosystem (due to its isolation attributes explained above), and migration is not possible. Then, the growth of Flemish Cap cod and its reproductive potential will fall irremediably once the temperature threshold is crossed. This would reduce biomass and abundance and ultimately affect the fishery and the ecosystem.
Regarding the impact of prey availability on the growth of Atlantic cod, it is essential to consider that Atlantic cod is an omnivorous species whose diet is mainly composed of crustaceans and teleost fish. In Flemish Cap, cod experience an ontogenically shift in diet: feeding on small crustaceans such as copepods, hyperiids, and small shrimps at small sizes (immature cods); on large crustaceans and small fish at medium sizes [small mature cod (< 85cm)]; and on shrimps, medium-sized demersal, and forage fishes when they are large [large mature cod (>85 cm)] (Pérez-Rodríguez et al., 2016; Link and Sherwood, 2019). In this study, the abundance of Northern shrimp, Pandalus borealis, had a positive and asymptotic effect on growth (Beta=0.13, CI[0.05 – 0.20]). Shrimp has been reported as one of the main prey of cod in the Flemish Cap ecosystem (Pérez-Rodríguez et al., 2011); hence, as the abundance of shrimp increases, it is expected that cod growth will increase as well. However, this significant relationship is only observed during the Moratorium period. Pandalus abundance has enormously fluctuated in the Flemish Cap region, being low when the abundance of cod is high and vice versa. During the Moratorium, Pandalus abundance was at higher abundance (mean= 3843x10^6 individuals) compared to Premoratorium (mean= 2047x10^6 individuals) and Postmoratorium (mean=346.2x10^6 individuals). On the contrary, the effect of Sebastes spp. abundance on cod growth was not significant, in spite of Sebastes being reported as a main prey for cod (Pérez-Rodríguez et al., 2016). This positive asymptotic relationship between cod growth and its main prey item has also been observed in Atlantic cod of the Barents Sea, being related to capelin abundance (Denechaud et al., 2020). Low prey availability influences the population’s resilience as the amount and quality of food items alter fish’s condition and growth. Lower body condition results in lower growth, size-at-age, reproductive potential, and overall lower productivity of the stock (Rätz et al., 2000). In this sense, for many fish species, including cod, females with poor body conditions may show high levels of atresia, which reduces the production of released eggs or even provokes skip spawning (Saborido-Rey and Kjesbu, 2005). The average proportion of skip spawning cod females in Flemish Cap between 1978 and 1985, likely associated with low liver conditions, was about 33.7%. This proportion was the highest for individuals of 50-79 cm (Rideout et al., 2006). However, some fish species have exhibited a compensatory growth after a period of starvation (such as Atlantic salmon and brown trout), although those individuals exhibited decreased performance and increased mortality over a long-time scale (O’Connor et al., 2014). The indicators used in the present study to analyze the effect of climate on the growth of Flemish Cap cod are restricted to the summer season (Jun/Jul). This corresponds with the period of active feeding, (i.e., when most of the annual growth occurs -opaque zones in the otolith), being appropriated for our purposes. However, summer growth could be influenced by the conditions experienced by cod during the winter spawning season and the reproductive effort made in this period (Carryover effects). Therefore, it could be interesting to broaden the study to include seasonal information (Smoliński and Mirny, 2017), as well as look at other phenomena that could potentially affect growth, such as skip spawning and transgenerational (epigenetic) effects (Folkvord et al., 2014).
Atlantic cod individuals of the same age inhabiting the same depth (See SM-1) prey on the same resources (type and size) and, therefore, competition among them is higher than competition with cod of other ages. In general, a higher abundance of cod adults results in intraspecific competition (space and/or resources) (Van Gemert and Andersen, 2018). A linear negative effect on cod growth as cod abundance increases was observed in our results for the Moratorium (Beta=-0.18, CI[-0.31 – 0.05]) and Postmoratorium (Beta=-0.34, CI[-0.55 – 0.14]). However, this relationship was not significant during the Premoratorium period, despite having higher cod abundance. This may be explained by the significant effect that fishing mortality had on cod growth during the Premoratorium counteracting the effect of cod abundance on growth. The same negative relationship between cod growth and cod abundance was observed in the Barents Sea Atlantic Cod (Denechaud et al., 2020). Density-dependent processes are key in the regulation of the population and hence they should be considered in fish growth studies. Fishing directly affects density-dependence processes as it removes individuals, frequently the large ones, thus reducing competition, reproductive potential, and genetic variability (Lorenzen and Enberg, 2002). However, during the Moratorium, cod abundance had an asymptotic effect on cod growth, which may be showing depensation (See Figure 3). When population density is low, as during the Moratorium, there is an accelerated growth on juvenile cod, making individuals grow faster and reach maturity earlier in life with what that entails for the population productivity (Liermann and Hilborn, 2001). However, confidence intervals during that time are wide, so we should be cautious with this interpretation. Moreover, the Allee effect can also be present in collapsed populations, affecting fish physiology and behavior. Some examples of the Allee effect include difficulties finding mates, social structure fragmentation, and difficulties avoiding predators or competitors (Frank and Brickman, 2000). Therefore, it is likely that both phenomena could be contributing to the lack of recovery of Atlantic cod in Flemish Cap.
Finally, fishing mortality had a positive and asymptotic relationship with cod growth during the Premoratorium period (Beta=0.07, CI[0.02 – 0.13]). This is expected, as fishing reduces the number of individuals and hence competition, favoring an accelerated individual growth. However, this result is the opposite as the one reported in the growth chronology of Atlantic Cod of the Barents Sea, where fishing pressure had a weak but still significant negative effect on Atlantic cod growth, suggesting that fishing may have caused a decline on cod growth through selective harvesting of faster-growing individuals (Denechaud et al., 2020). In Flemish Cap, the cod fishery started to be regulated by TAC (total allowed catches) in 1974, and catches remained relatively constant during the years when the fishery was opened (González-Troncoso et al., 2021). Therefore, fishing was high from the beginning of the series until 1999, when the fishery was closed. However, the temporal trend plot of cod growth for the master chronology and group 3 chronology (individuals older than 8, the fishing target) indicates that the drop in cod growth started in 1994, suggesting that the moratorium may have been implemented a bit late. Even though the fishery was opened again in 2009, fishing mortality remained low (slightly over 0.25, a value almost 7 times lower than the maximum reached in this fishery around 1995). This explains why fishing mortality is not significant during the Postmoratorium. Finally, our results also indicate that thickness of the Cold Intermediate Layer (CIL) was a significant driver of cod growth during the Postmoratorium (Beta=-0.11, CI[-0.017 – 0.06]). This parameter is an indicator of water column stratification and provides valuable information on the ecosystem since the thicker the CIL, the less energy is transferred to deeper waters. Since 2010, CIL thickness steeply increased until 2015, when a drop was observed (See SM-1). Surprisingly, our results indicate that CIL thickness was insignificant during the Premoratorium despite suffering a big drop from 1990 to 1995.
Changes in population size-structure, especially in top predators as cod in Flemish Cap, may result in a cascading effect that affects the entire food web (Planque et al., 2010; Ohlberger, 2013). This modification in the ecosystem may not be easy to reverse because of the new links generated. During cascading effects, the middle trophic levels, which become dominant, may be prey on the early life stages of the former top predator (Perry et al., 2010). Additionally, cannibalism may increase in cod due to food limitations that may complicate predator-prey relationships. Removing top predators results in a decrease in the stability of the ecosystem due to a simplification of the food web, making the ecosystem more vulnerable to perturbations (Perry et al., 2010). A deteriorated environment combined with overfishing may result in a stock decrease below the level of minimum population biomass (Jiao, 2009). Several studies have suggested that overfishing can be a key factor driving marine *ecological regime shifts (Daskalov, 2002; Harvey et al., 2003), which are characterized by changes in species abundances, community composition, and trophic relationships. Ecological regime shifts driven by fishing have been reported in different regions such as the Baltic Sea (Österblom et al., 2007) and the Black Sea (Daskalov, 2002; Lees et al., 2006). However, there are examples in which fishing efforts do not fully explain these changes, such as in the Southern Grand Bank and Flemish Cap (Nogueira et al., 2015; Nogueira et al., 2016). It is likely then that human impact and climate effect on a struggling population, as the strong decrease in cod growth indicates, could have led to an ecological regime shift in Flemish Cap ecosystem. If so, the ecosystem would have reached a state of alternative equilibrium in which cod would modify its fitness and performance to adapt to this new situation. This has major implications when managing the resource, as cod abundance is not likely to return to the levels reached before the collapse at least in the short term (Sguotti et al., 2019) and therefore, the sustainability and profitability of the fishery may be questionable. In this case, biological reference points should be reviewed.
*Ecological regime shift can be defined as “an abrupt change on several trophic levels leading to rapid ecosystem reconfiguration between alternative states” (Andersen et al., 2009).
Growth is a critical component of fish populations and, hence, it has been commonly used in stock assessments models. However, most of these models assume that growth is invariant over time, which has been demonstrated to be far from true (Gillanders et al., 2012; Coulson et al., 2014; Matta et al., 2016, and the present study). A decrease in fish growth often implies a modification of life-history traits such as age- and size-at-maturity directly affect stock biomass and reproductive output (Morrongiello et al., 2012). Growth chronologies allow the detection of growth variations over time and determine its drivers, offering a framework to incorporate them into population dynamic models and allowing exploration of population resilience to exploitation and environmental changes (Devine et al., 2012). Currently, fisheries management strategies rely on reference points to define desire and undesire states of stocks productivity based on the definition of target and limit reference points (Carpenter et al., 2017). However, these reference points are mostly derived from equilibrium assumptions on population dynamics, which may not be appropriate for populations experiencing multiple equilibrium states or that are cyclical or dynamic through time (Bakun et al., 2010; Punt et al., 2014). Therefore, fisheries management strategies should adapt reference points to the stock and ecosystem regime to prevent overexploitation and maintain fisheries yields. A way to do so is by using dynamic reference points, which could benefit from the information provided from growth chronologies. On another note, successful management will require shifting from single-species models, which aim to maximize yield, to those that protect the age and size structure of the population (Devine et al., 2012). Using multispecies models would also allow accounting for trophic interactions and their relation with size. Examples of multispecies models include the food web model GADGET (Pérez-Rodríguez et al., 2016) and the multispecies size spectrum model (MIZER) (Scott et al., 2014). Finally, management requires flexibility to adapt to novel and unexpected events, such ecological regime shifts, through new adaptive management strategies that should consider ecological, social, and economic dimensions of fisheries (DeYoung et al., 2008; Barange et al., 2010).
Funding
The samples analyzed in this study were collected during the Flemish Cap survey that are co-funded by the European Union through the European Maritime and Fisheries Fund (EMFF) within the National Program of collection, management and use of data in the fisheries sector and support for scientific advice regarding the Common Fisheries Policy.
Publisher’s Note
All claims expressed in this article are solely those of the authors and do not necessarily represent those of their affiliated organizations, or those of the publisher, the editors and the reviewers. Any product that may be evaluated in this article, or claim that may be made by its manufacturer, is not guaranteed or endorsed by the publisher.
Statements
Data availability statement
The raw data supporting the conclusions of this article will be made available by the authors, without undue reservation.
Author contributions
Conceptualization, RR-D, RD-P and FS-R; methodology, RR-D, RD-P; software, RR-D; validation, RR-D, RD-P, FS-R; formal analysis, RR-D; investigation, RR-D, RD-P; resources, FS-R; data curation, RR-D; writing-original draft preparation, RR-D; writing-review and editing, RR-D, RD-P, FS-R; visualization, RR-D; supervision, RD-P and FS-R; project administration, RR-D; funding acquisition, FS-R. All authors have read and agreed to the published version of the manuscript.
Acknowledgments
We thank BA Black for discussions on otolith measurement and chronology development. We would also like to acknowledge the contribution of the experts who were involved in the Flemish Cap Survey. Finally, we would like to thank Marina Fabeiro (technical assistant at IIM-CSIC) for helping with otolith reading and processing. The present manuscript is an extension of a Master thesis developed within the International Master in Marine Biological Resources (IMBRSea).
Conflict of interest
The authors declare that the research was conducted in the absence of any commercial or financial relationships that could be construed as a potential conflict of interest.
Supplementary material
The Supplementary Material for this article can be found online at: https://www.frontiersin.org/articles/10.3389/fmars.2022.876488/full#supplementary-material
References
1
Andersen T. Carstensen J. Hernandez-Garcia E. Duarte C. M. (2009). Ecological Thresholds and Regime Shifts: Approaches to Identification. Trends Ecol. Evol.24 (1), 49–57. doi: 10.1016/j.tree.2008.07.014
2
Bakun A. Babcock E. A. Lluch-Cota S. E. Santora C. Salvadeo C. J. (2010). Issues of Ecosystem-Based Management of Forage Fisheries in “Open” Non-Stationary Ecosystems: The Example of the Sardine Fishery in the Gulf of California. Rev. Fish Biol. Fisheries20 (1), 9–29. doi: 10.1007/s11160-009-9118-1
3
Barange M. O’Boyle R. Cochrane K. L. Fogarty M. J. Jarre A. Kell L. T. et al . (2010). Marine Resources Management in the Face of Change: From Ecosystem Science to Ecosystem-Based Management. Global Change and Marine Ecosystems (Oxford: Oxford University Press), 253–283.
4
Bates D. Maechler M. Bolker B. Walker S. (2015). Lme4: Linear Mixed-Effects Models Using Eigen and S4, R Package Version 1. Available at: https://cran.r-project.org/web/packages/lme4/index.html.
5
Beacham T. D. Brattey J. Miller K. M. Le K. D. Withler R. E. (2002). Multiple Stock Structure of Atlantic Cod (Gadus Morhua) Off Newfoundland and Labrador Determined From Genetic Variation. ICES J. Marine Sci.59 (4), 650–665. doi: 10.1006/jmsc.2002.1253
6
Borovkov V. A. Vaskov A. A. Karsakov A. L. (2006). The Impact of Water Circulation on the Year-Class Abundance Dynamics of Redfish and Cod on the Flemish Cap. J. Northwest Atlantic Fishery Sci.37, 127–134. doi: 10.2960/J.v37.m553
7
Burnham K. P. Anderson D. R. (2004). Multimodel Inference: Understanding AIC and BIC in Model Selection. Sociological Methods Res.33 (2), 261–304. doi: 10.1177/0049124104268644
8
Campana S. E. (1990). How Reliable Are Growth Back-Calculations Based on Otoliths? Can. J. Fisheries Aquat. Sci.47 (11), 2219–2227. doi: 10.1139/f90-246
9
Carpenter S. R. Brock W. A. Hansen G. J. A. Hansen J. F. Hennessy J. M. Isermann D. A. et al . (2017). Defining a Safe Operating Space for Inland Recreational Fisheries. Fish Fisheries18 (6), 1150–1160. doi: 10.1111/faf.12230
10
Carson S. Shackell N. Mills Flemming J. (2017). Local Overfishing May Be Avoided by Examining Parameters of a Spatio-Temporal Model. PloS One12 (9), e0184427. doi: 10.1371/journal.pone.0184427
11
Chabot D. Claireaux G. (2019). “Ecophysiology,” Atlantic Cod: A Bio‐Ecology (Hoboken, NJ, USA: John Wiley & Sons Ltd.), 27–86. doi: 10.1002/9781119460701.ch2
12
Cheung W. W. L. Sarmiento J. L. Dunne J. Frölicher T. L. Lam V. W. Y. Palomares M. L. D. (2013). Shrinking of Fishes Exacerbates Impacts of Global Ocean Changes on Marine Ecosystems. Nat. Climate Change3 (3), 254–258. doi: 10.1038/nclimate1691
13
Claret M. Galbraith E. D. Palter J. B. Bianchi D. Fennel K. Gilbert D. et al . (2018). Rapid Coastal Deoxygenation Due to Ocean Circulation Shift in the Northwest Atlantic. Nat. Climate Change8 (10), 868–872. doi: 10.1038/s41558-018-0263-1
14
Colbourne E. Pérez-Rodríguez A. Cabrero A. González-Nuevo G. (2018). Ocean Climate Variability on the Flemish Cap in NAFO Subdivision 3M During 2017 (NAFO Scientific Council Studies, 18/010), 1–19. Available at: https://www.nafo.int/Portals/0/PDFs/sc/2018/scr18-010.pdf.
15
Coulson P. G. Black B. A. Potter I. C. Hall N. G. (2014). Sclerochronological Studies Reveal That Patterns of Otolith Growth of Adults of Two Co-Occurring Species of Platycephalidae are Synchronised by Water Temperature Variations. Mar. Biol.161 (2), 383–393. doi: 10.1007/s00227-013-2343-0
16
Daskalov G. M. (2002). Overfishing Drives Atrophic Cascade in the Black Sea. Mar. Ecol. Prog. Ser.225, 53–63. doi: 10.3354/meps225053
17
Denechaud C. Smoliński S. Geffen A. J. Godiksen J. A. Campana S. E. (2020). A Century of Fish Growth in Relation to Climate Change, Population Dynamics and Exploitation. Global Change Biol.26 (10), 5661–5678. doi: 10.1111/gcb.15298
18
Devine J. A. Wright P. J. Pardoe H. E. Heino M. (2012). Comparing Rates of Contemporary Evolution in Life-History Traits for Exploited Fish Stocks. Can. J. Fisheries Aquat. Sci.69 (6), 1105–1120. doi: 10.1139/f2012-047
19
DeYoung B. Barange M. Beaugrand G. Harris R. Perry R. I. Scheffer M. et al . (2008). Regime Shifts in Marine Ecosystems: Detection, Prediction and Management. Trends Ecol. Evol.23 (7), 402–409. doi: 10.1016/j.tree.2008.03.008
20
Doney S. C. Ruckelshaus M. Duffy J. E. Barry J. P. Chan F. English C. A. et al . (2012). Climate Change Impacts on Marine Ecosystems. Annu. Rev. Marine Sci.4, 11–37. doi: 10.1146/annurev-marine-041911-111611
21
Doubleday W. G. (1981). Manual of Groundfish Surveys in the Northwest Atlantic. NAFO Sci. Counc. Stud.2, 55pp. Available at: https://archive.nafo.int/open/studies/s2/doubleday.pdf.
22
Enberg K. Jørgensen C. Dunlop E. S. Heino M. Dieckmann U. (2009). Implications of Fisheries-Induced Evolution for Stock Rebuilding and Recovery. Evol Appl.2 (3), 394–414. doi: 10.1111/j.1752-4571.2009.00077.x
23
Folkvord A. Jørgensen C. Korsbrekke K. Nash R. D. Nilsen T. Skjæraasen J. E. (2014). Trade-Offs Between Growth and Reproduction in Wild Atlantic Cod. Can. J. Fisheries Aquat. Sci.71 (7), 1106–1112. doi: 10.1139/cjfas-2013-0600
24
Fox J. (2003). Effect Displays in R for Generalised Linear Models. J. Stat. Software8, 1–27. doi: 10.18637/jss.v008.i15
25
Frank K. T. Brickman D. (2000). Allee Effects and Compensatory Population Dynamics Within a Stock Complex. Can. J. Fisheries Aquat. Sci.517, 513–517. doi: 10.1139/f00-024
26
Gillanders B. M. Black B. A. Meekan M. G. Morrison M. A. (2012). Climatic Effects on the Growth of a Temperate Reef Fish From the Southern Hemisphere: A Biochronological Approach. Marine Biol.159, 1327–1333. doi: 10.1007/s00227-012-1913-x
27
González-Troncoso D. Fernández C. González-Costas F. (2018). Assessment of the Cod Stock in NAFO Division 3m (NAFO Scientific Council Studies, SCR 18/42), 1–19. Available at: https://www.nafo.int/Portals/0/PDFs/sc/2018/scr18-042.pdf.
28
González-Troncoso D. Fernández C. González-Costas F. (2021). Assessment of the Cod Stock in NAFO Division 3m (NAFO Scientific Council Studies, SCR 21/017REV2), 1–48. Available at: https://www.nafo.int/Portals/0/PDFs/sc/2021/scr21-017REV2.pdf.
29
Harvey C. Cox S. Eddington T. Hansson S. Kitchell F. (2003). An Ecosystem Model of Food Web and Fisheries Interactions. ICES J. Marine Sci.60, 939–950. doi: 10.1016/S1054
30
Hsieh C. Reiss C. S. Hunter J. R. Beddington J. R. May R. M. Sugihara G. (2006). Fishing Elevates Variability in the Abundance of Exploited Species. Nature443 (19), 859–862. doi: 10.1038/nature05232
31
Hughes T. P. Bellwood D. R. Folke C. Steneck R. S. Wilson J. (2005). New Paradigms for Supporting the Resilience of Marine Ecosystems. Trends Ecol. Evol.20 (7), 380–386. doi: 10.1016/j.tree.2005.03.022
32
Hüssy K. Mosegaard H. (2004). Atlantic Cod (Gadus Morhua) Growth and Otolith Accretion Characteristics Modelled in a Bioenergetics Context. Can. J. Fisheries Aquat. Sci.61 (6), 1021–1031. doi: 10.1139/f04-038
33
IPCC . (2014). Climate Change 2014: Synthesis Report. Contribution of Working Groups I, II and III to the Fifth Assessment Report of the Intergovernmental Panel on Climate Change. Eds. Core Writing TeamPachauriR.K.MeyerL.A (Geneva, Switzerland: IPCC) 151 pp.
34
Jiao Y. (2009). Regime Shift in Marine Ecosystems and Implications for Fisheries Management, a Review. Rev. Fish Biol. Fisheries19 (2), 177–191. doi: 10.1007/s11160-008-9096-8
35
Lees K. Pitois S. Scott C. Frid C. MacKinson S. (2006). Characterizing Regime Shifts in the Marine Environment. Fish Fisheries7 (2), 104–127. doi: 10.1111/j.1467-2979.2006.00215.x
36
Liermann M. Hilborn R. (2001). Depensation: Evidence, Models and Implications. Fish Fisheries2, 33–58. doi: 10.1046/j.1467-2979.2001.00029.x
37
Link J. S. Griffis R. B. Busch D. S. (2015). NOAA Fisheries Climate Science Strategy. NOAA Technical Memorandum NMFS-F/SPO-155, 70pp.
38
Link J. S. Sherwood G. D. (2019). Feeding, Growth, and Trophic Ecology. Atlantic Cod: A Bio-Ecology (Hoboken, NJ, USA: John Wiley & Sons Ltd), 218–296.
39
Lorenzen K. Enberg K. (2002). Density-Dependent Growth as a Key Mechanism in the Regulation of Fish Populations: Evidence From Among-Population Comparisons. Proc. R. Soc. B: Biol. Sci.269 (1486), 49–54. doi: 10.1098/rspb.2001.1853
40
Martino J. C. Fowler A. J. Doubleday Z. A. Grammer G. L. Gillanders B. M. (2019). Using Otolith Chronologies to Understand Long-Term Trends and Extrinsic Drivers of Growth in Fisheries. Ecosphere10 (1), 2–23. doi: 10.1002/ecs2.2553
41
Matta M. E. Helser T. E. Black B. A. (2016). Otolith Biochronologies Reveal Latitudinal Differences in Growth of Bering Sea Yellowfin Sole Limanda Aspera. Polar Biol.39 (12), 2427–2439. doi: 10.1007/s00300-016-1917-y
42
Mazerolle M. (2015) AICcmodavg: Model Selection and Multimodel Inference Based on (Q)AIC(C). Available at: https://cran.r-project.org/web/packages/AICcmodavg/index.html.
43
Moore M. Folt C. (1993). Zooplankton Body Size and Community Structure: Effects of Thermal and Toxicant Stress. Trends Ecol. Evol.8, 5, 178–183. doi: 10.1007/s11277-013-1450-z
44
Morrongiello J. R. Thresher R. E. (2015). A Statistical Framework to Explore Ontogenetic Growth Variation Among Individuals and Populations: A Marine Fish Example. Ecol. Monogr.85 (1), 93–115. doi: 10.1890/13-2355.1
45
Morrongiello J. R. Thresher R. E. Smith D. C. (2012). Aquatic Biochronologies and Climate Change. Nat. Climate Change2, 849–857. doi: 10.1038/nclimate1616
46
Nakagawa S. Schielzeth H. (2013). A General and Simple Method for Obtaining R2 From Generalized Linear Mixed-Effects Models. Methods Ecol. Evol.4 (2), 133–142. doi: 10.1111/j.2041-210x.2012.00261.x
47
Nogueira A. González-Troncoso D. Tolimieri N. (2014). Changes and Trends in the Overexploited Fish Assemblages of Two Fishing Grounds of the Northwest Atlantic. ICES J. Mar. Sci.73 (2), 345–358. doi: 10.1093/icesjms/fsv172
48
Nogueira A. Paz X. González-Troncoso D. (2016). Changes in the Exploited Demersal Fish Assemblages in the Southern Grand Banks (NAFO Divisions 3no): 2002–2013. ICES J. Mar. Sci.72 (3), 753–770. doi: 10.1093/icesjms/fsu182
49
O’Connor C. M. Norris D. R. Crossin G. T. Cooke S. J. (2014). Biological Carryover Effects: Linking Common Concepts and Mechanisms in Ecology and Evolution. Ecosphere5 (3), 1–11. doi: 10.1890/ES13-00388.1
50
O’Connor M. I. Piehler M. F. Leech D. M. Anton A. Bruno J. F. (2009). Warming and Resource Availability Shift Food Web Structure and Metabolism. PloS Biol.7 (8), 3–8. doi: 10.1371/journal.pbio.1000178
51
O’Gorman E. J. Pichler D. E. Adams G. Benstead J. P. Cohen H. Craig N. et al . (2012). Impacts of Warming on the Structure and Functioning of Aquatic Communities: Individual-to Ecosystem-Level Responses. Adv. Ecol. Res.47, 81–176). doi: 10.1016/b978-0-12-398315-2.00002-8
52
Ohlberger J. (2013). Climate Warming and Ectotherm Body Size - From Individual Physiology to Community Ecology. Funct. Ecol.27 (4), 991–1001. doi: 10.1111/1365-2435.12098
53
Österblom H. Hansson S. Larsson U. Hjerne O. Wulff F. Elmgren R. et al . (2007). Human Induced Trophic Cascades and Ecological Regime Shifts in the Baltic Sea. Ecosystems10 (6), 877–889. doi: 10.1007/s10021-007-9069-0
54
Parmesan C. (2006). Ecological and Evolutionary Responses to Recent Climate Change. Annu. Rev. Ecol Evol System37 (1), 637–669. doi: 10.1146/annurev.ecolsys.37.091305.110100
55
Pauly D. Kinne O. (2010). Gasping Fish and Panting Squids: Oxygen, Temperature and the Growth of Water-Breathing Animals Vol. Vol. 22 (Oldendorf/Luhe, Germany: International Ecology Institute).
56
Pérez-Rodríguez A. (2012). An Integrative Study to the Functioning of the Flemish Cap Demersal Community (CSIC digital repository) (Vigo: University of Vigo). Available at: http://hdl.handle.net/10261/57219.
57
Pérez-Rodríguez A. Howell D. Casas M. Saborido-Rey F. Ávila-de Melo A. González-Costas F. et al . (2016). GadCap: A GADGET Multispecies Model for the Flemish Cap Cod, Redfish and Shrimp (NAFO Scientific Council Studies, 16/35), 1–36. Available at: https://www.nafo.int/Portals/0/PDFs/sc/2016/scr16-035.pdf.
58
Pérez-Rodríguez A. Koen-Alonso M. González-Iglesias C. Saborido-Rey F. (2011). Analysis of Common Trends in the Feeding Habits of Main Demersal Fish Species on the Flemish Cap (Nafo, NAFO SCR D), 1–19. Available at: https://www.nafo.int/Portals/0/PDFs/sc/2011/scr11-077.pdf.
59
Pérez-Rodríguez A. Koen-Alonso M. Saborido-Rey F. (2012). Changes and Trends in the Demersal Fish Community of the Flemish Cap, Northwest Atlantic, in the Period 1988–2008. J. Mar. Syst.69 (5), 902–912. doi: 10.1093/icesjms/fss019
60
Perry R. I. Cury P. Brander K. Jennings S. M.llmann C. Planque B. (2010). Sensitivity of Marine Systems to Climate and Fishing: Concepts, Issues and Management Responses. J. Mar. Syst.79 (3–4), 427–435. doi: 10.1016/j.jmarsys.2008.12.017
61
Peters R. H. (1986). The Ecological Implications of Body Size (Vol. 2) (Cambridge, UK: Cambridge University Press).
62
Planque B. Fromentin J. M. Cury P. Drinkwater K. F. Jennings S. Perry R. I. et al . (2010). How Does Fishing Alter Marine Populations and Ecosystems Sensitivity to Climate? J. Marine Syst.79 (3–4), 403–417. doi: 10.1016/j.jmarsys.2008.12.018
63
Punt A. E. A’mar T. Bond N. A. Butterworth D. S. de Moor C. L. De Oliveira J. A. (2014). Fisheries Management Under Climate and Environmental Uncertainty: Control Rules and Performance Simulation. ICES J. Marine Sci.71 (8), 2208–2220. doi: 10.1093/icesjms/fst057
64
Rätz H. Lloret J. Casey J. Aglen A. Schopka S. A. O'Brien L. et al . (2000). Variation in Fish Condition Between Atlantic Cod (Gadus Morhua) Stocks and Implications for Their Management (Fisheries Resource Managment: ICES CM 2000/V:2007), 1–10. Available at: https://imr.brage.unit.no/imr-xmlui/bitstream/handle/11250/100467/V0700.pdf?sequence=1.
65
Rideout R. M. Morgan M. J. Lilly G. R. (2006). Variation in the Frequency of Skipped Spawning in Atlantic Cod (Gadus Morhua) Off Newfoundland and Labrador. ICES J. Mar. Sci.63 (6), 1101–1110. doi: 10.1016/j.icesjms.2006.04.014
66
Righton D. A. Andersen K. H. Neat F. Thorsteinsson V. Steingrund P. Svedäng H. et al . (2010). Thermal Niche of Atlantic Cod Gadus Morhua: Limits, Tolerance and Optima. Mar. Ecol. Prog. Ser.420, 1–13. doi: 10.3354/meps08889
67
Rose G. A. (2003). Fisheries Resources and Science in Newfoundland and Labrador: An Independent Assessment (Royal Commission on Renewing and Strengthening Our Place in Canada). Available at: https://www.gov.nl.ca/publicat/royalcomm/research/Rose.pdf.
68
Saba V. S. Griffies S. M. Anderson W. G. Winton M. Alexander M. A. Delworth T. L. et al . (2016). Enhanced Warming of the Northwest Atlantic Ocean Under Climate Change. J. Geophysical Res: Oceans121 (1), 118–132. doi: 10.1002/2015JC011346
69
Saborido-Rey F. Kjesbu O. S. (2005). “Growth and Maturation Dynamics,” in Fisheries-Induced Adaptive Changes. DieckmannU.GodøO. R.HeinoM.MorkM. (Cambridge, UK: Cambridge University Press), 501–516. Available at: http://digital.csic.es/handle/10261/47150.
70
Scott F. Blanchard J. L. Andersen K. H. (2014). Mizer: An R Package for Multispecies, Trait-Based and Community Size Spectrum Ecological Modelling. Methods Ecol. Evol.5 (10), 1121–1125. doi: 10.1111/2041-210X.12256
71
Sguotti C. Otto S. A. Frelat R. Langbehn T. J. Ryberg M. P. Lindegren M. et al . (2019). Catastrophic Dynamics Limit Atlantic Cod Recovery. Proc. R. Soc. B286 (1898), 20182877. doi: 10.5061/dryad.037jr6v
72
Shelton P. A. Healey B. P. (2011). Should Depensation be Dismissed as a Possible Explanation for the Lack of Recovery of the Northern Cod (Gadus Morhua) Stock? Can. J. Fisheries Aquat. Sci.56 (9), 1521–1524. doi: 10.1139/f99-124
73
Sinclair A. F. Swain D. P. Hanson J. M. (2002). Disentangling the Effects of Size-Selective Mortality, Density, and Temperature on Length-at-Age. Can. J. Fisheries Aquat. Sci.59 (2), 372–382. doi: 10.1139/f02-014
74
Smedbol R. K. Wroblewski J. S. (2002). Metapopulation Theory and Northern Cod Population Structure: Interdependency of Subpopulations in Recovery of a Groundfish Population. Fisheries Res.55 (1-3), 161–174. doi: 10.1016/S0165-7836(01)00289-2
75
Smoliński S. Mirny Z. (2017). Otolith Biochronology as an Indicator of Marine Fish Responses to Hydroclimatic Conditions and Ecosystem Regime Shifts. Ecol. Indic.79, 286–294. doi: 10.1016/j.ecolind.2017.04.028
76
Smoliński S. Schade F. M. Berg F. (2020). Assessing the Performance of Statistical Classifiers to Discriminate Fish Stocks Using Fourier Analysis of Otolith Shape. Can. J. Fisheries Aquat. Sci.77 (4), 674–683. doi: 10.1139/cjfas-2019-0251
77
Speer J. H. (2010). Fundamentals of Tree-Ring Research (Tucson: University of Arizona Press).
78
Stein M. (2007). Oceanography of the Flemish Cap and Adjacent Waters. J. Northwest Atlantic Fishery Sci.37(2), 135–146. doi: 10.2960/J.v37.m652
79
Tanner S. E. Vieira A. R. Vasconcelos R. P. Dores S. Azevedo M. Cabral H. N. et al . (2019). Regional Climate, Primary Productivity and Fish Biomass Drive Growth Variation and Population Resilience in a Small Pelagic Fish. Ecol. Indic.103 (4), 530–541. doi: 10.1016/j.ecolind.2019.04.056
80
Thresher R. E. Koslow J. A. Morison A. K. Smith D. C. (2007). Depth-Mediated Reversal of the Effects of Climate Change on Long-Term Growth Rates of Exploited Marine Fish. Proc. Natl. Acad. Sci.104 (18), 7461–7465. doi: 10.1073/pnas.0610546104
81
Van Gemert R. Andersen K. H. (2018). Implications of Late-in-Life Density-Dependent Growth for Fishery Size-at-Entry Leading to Maximum Sustainable Yield. ICES J. Marine Sci.75 (4), 1296– 1305. doi: 10.1093/icesjms/fsx236
82
Vázquez A. Casas J. M. Alpoim R. (2013). Protocols of the EU Bottom Trawl Survey of Flemish Cap. NAFO Sci. Council Stud.46 (June), 1–42. doi: 10.2960/S.v46.m1
83
Yom-Tov Y. Geffen E. (2011). Recent Spatial and Temporal Changes in Body Size of Terrestrial Vertebrates: Probable Causes and Pitfalls. Biol. Rev.86 (2), 531–541. doi: 10.1111/j.1469-185X.2010.00168.x
84
Zuur A. Ieno E. N. Walker N. Saveliev A. A. Smith G. M. (2009). Mixed Effects Models and Extensions in Ecology With R (New York: Springer Science and Business Media).
Summary
Keywords
Gadus morhua , life-history, sclerochronology, climate change, fishing-induced evolution, mixed-effects modeling
Citation
Ruiz-Díaz R, Dominguez-Petit R and Saborido-Rey F (2022) Atlantic Cod Growth History in Flemish Cap Between 1981 and 2016: The Impact of Fishing and Climate on Growth Performance. Front. Mar. Sci. 9:876488. doi: 10.3389/fmars.2022.876488
Received
15 February 2022
Accepted
18 April 2022
Published
19 May 2022
Volume
9 - 2022
Edited by
Kenneth Alan Rose, University of Maryland Center for Environmental Science (UMCES), United States
Reviewed by
Nancy Louise Shackell, Bedford Institute of Oceanography (BIO), Canada; Côme Denechaud, Norwegian Institute of Marine Research (IMR), Norway
Updates
Copyright
© 2022 Ruiz-Díaz, Dominguez-Petit and Saborido-Rey.
This is an open-access article distributed under the terms of the Creative Commons Attribution License (CC BY). The use, distribution or reproduction in other forums is permitted, provided the original author(s) and the copyright owner(s) are credited and that the original publication in this journal is cited, in accordance with accepted academic practice. No use, distribution or reproduction is permitted which does not comply with these terms.
*Correspondence: Raquel Ruiz-Díaz, rruizdiaz@mun.ca
This article was submitted to Global Change and the Future Ocean, a section of the journal Frontiers in Marine Science
Disclaimer
All claims expressed in this article are solely those of the authors and do not necessarily represent those of their affiliated organizations, or those of the publisher, the editors and the reviewers. Any product that may be evaluated in this article or claim that may be made by its manufacturer is not guaranteed or endorsed by the publisher.