 Zhiqiang Su
 Zhaoru Zhang
 Yiwu Zhu
- School of Oceanography, Shanghai Jiao Tong University, Shanghai, China
The Gerlache Strait plays an important role for the transports of heat, nutrients, and primary producers between the northern West Antarctic Peninsula (WAP) and the continental shelf in the southern WAP. The means, seasonal variations, and long-term trends of currents in the Gerlache Strait are analyzed based on Acoustic Doppler Current Profiler (ADCP) data between 1999 and 2016 available from the Joint Archive for Shipboard ADCP (JASADCP) dataset. The results revealed that the mean currents between the sea surface and 300 m in the Gerlache Strait (known as the Gerlache Strait Current) were predominantly northeastward, associated with the northeastward intrusion of Modified Circumpolar Deep Water (MCDW). The variance ellipses of currents were in parallel to the principal axis of the strait. The currents reached the maximum during austral spring and summer and were minimum during austral winter. The long-term trends revealed that the mean currents were southwestward during austral fall or winter before 2005, and the northeastward currents increased between 1999 and 2011, weakened, and reversed between 2011 and 2016. The long-term shifts between warm and cold phases in the Gerlache Strait were associated with shifts between the dominance of northeastward and southwestward currents in the strait, which are respectively associated with the intrusion of warm MCDW in the south and the transport of cold water from the Bransfield Strait in the north.
Introduction
Physical and biological processes in the Gerlache Strait in the Antarctica Peninsula have been studied in the last 50 years due to the sensitivity of this area to climate change and high productivity of all trophic levels from primary production to mammals and birds. The circulation and mixing in the region transport both nutrients and primary producers determining krill recruitment and aggregations of predators. The recent warming up in the West Antarctic Peninsula (WAP) and the reduction of sea ice extent have caused the poleward shift of ecosystems (Shepherd et al., 2004; Meredith and King, 2005; Selz et al., 2018; Schultz et al., 2021). The Gerlache Strait behaves as the gateway between the Bransfield Strait in the northern WAP and the shelf region in the southern WAP controlling regional exchanges of heat, water masses, and krill populations.
The Gerlache Strait Current (GSC) was revealed from analyzing the Surface Velocity Program (SVP) drifter data, which were obtained during the RACER program (Niiler et al., 1990; Niiler et al., 1991; Zhou, 1998; Zhou et al., 2002). A total of 39 SVP drifters were deployed during the period from November 1988 to January 1990 to study the surface current characteristics in the Bransfield Strait and Gerlache Strait. It was found that the surface currents flowed along the deep channel of the Gerlache Strait northeastward to the southwestern Bransfield Strait (Figure 1A), where it became the Bransfield Current. The observed mean current reached approximately 30 cm s–1 in the Gerlache Strait. The northeastward surface current in the Gerlache Strait was also revealed by analyzing Acoustic Doppler Current Profiler (ADCP) data (Savidge and Amft, 2009; Du et al., 2018). Geostrophic balance had been used to estimate the mean current in the Gerlache Strait to research the northeastward geostrophic current (Garcia et al., 1994; Zhou and Dorland, 2004).
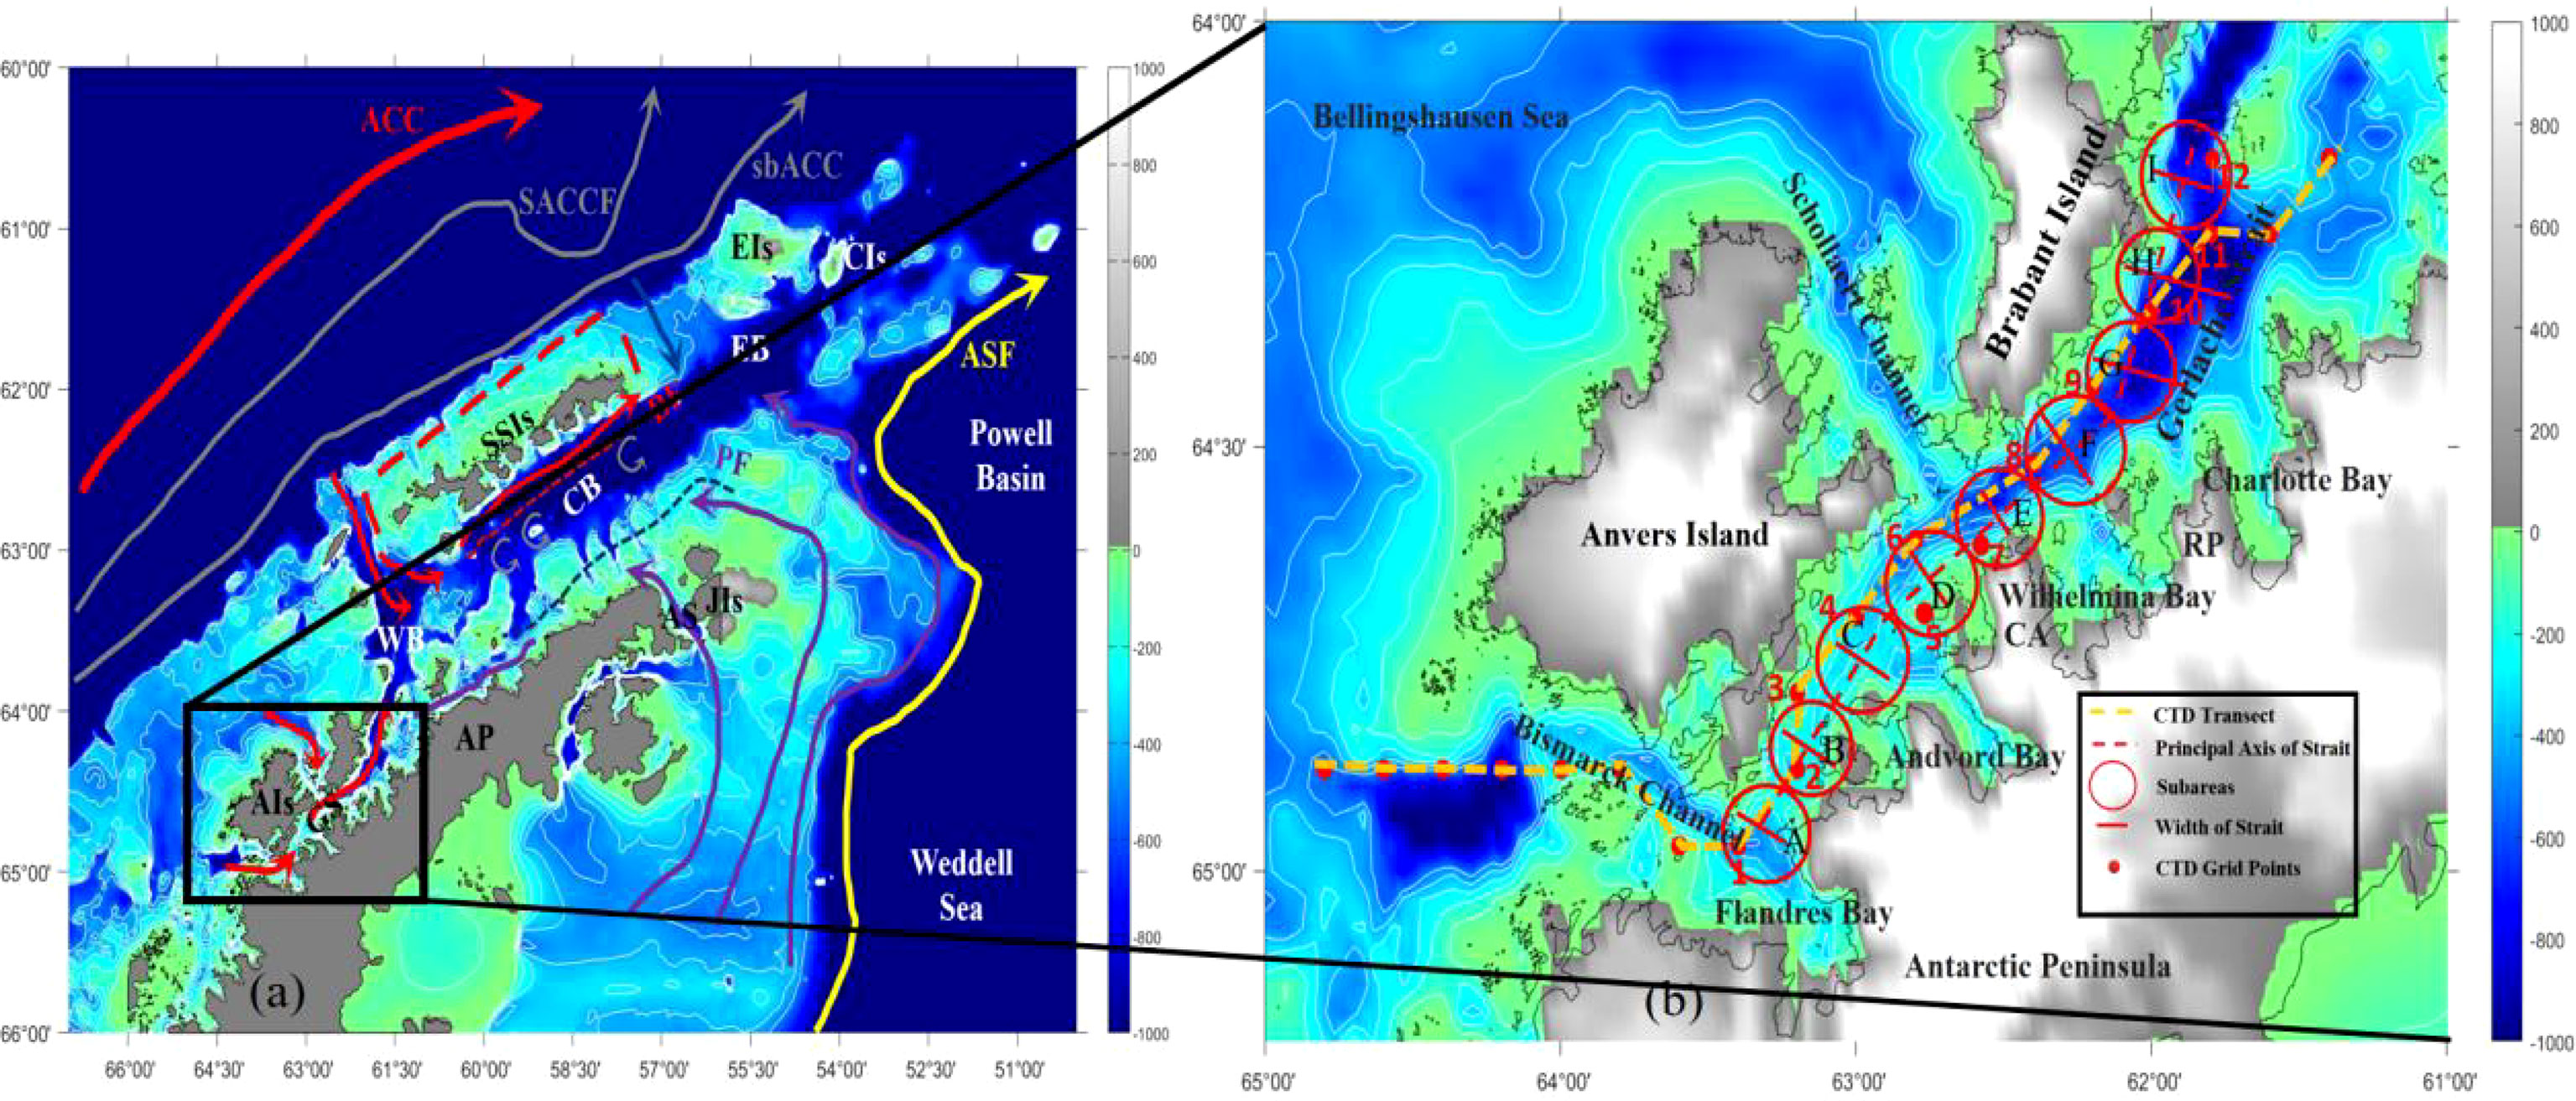
Figure 1 (A) Schematic of circulations in the northern Antarctic Peninsula (Ferreira et al., 2020). Purple and red arrows show the flow paths of the cold and warm water masses, respectively. The purple arrow shows the Weddell Gyre circulation and the yellow arrow shows the path of the Antarctic Slope Front (ASF). The dotted purple and red lines depict, respectively, the Peninsula front (PF) and the Bransfield front (BF). The dashed red line shows the recirculation around the South Shetland Islands (SSIs). The Antarctic Circumpolar Current (ACC) is shown in thick red line, and the southern ACC front (SACCF) and the southern boundary of the ACC (sbACC) are shown in gray lines. Within the Bransfield Strait, the area is divided into the eastern basin (EB), the central basin (CB), and the western basin (WB). The inset shows the study region covering the Weddell Sea, the Bellingshausen Sea (BeS), and the Drake Passage (DP). (B) The bathymetry in the Gerlache Strait and its vicinity. The red circles indicate the nine subareas (A–I). The red solid lines represent the mean widths of the strait, and the red dashed line represents the principal axis of the strait. Red dots are the locations of CTD grid points in the Gerlache Strait and its vicinity, and the yellow thick dashed line represents the CTD transect in Figure 11.
The structures and driven mechanisms of the current systems have been investigated by a couple of studies. The surface current could be simply estimated by the balance between the acceleration term and the Coriolis force term based on the drifter data. The results indicated that the acceleration in the direction traverse to the surface current was northward, which pushed the surface current closer to the Bradant Island. Exiting from the Gerlache Strait, the mainstream of surface currents turned to the north corresponding to the northward transversal acceleration (Zhou et al., 2002). In addition, the surface currents are affected by Antarctic surface water (ASW) which was relatively fresh and warm in the Gerlache Strait affected by freshwater runoff from precipitation, sea ice melting, and wind. ASW flowed northeastward into the Bransfield Strait indicated by drifter studies implying a persistent surface current. In the middle and deep layer of the strait, the density difference between the modified Circumpolar Deep Water (MCDW) from the south and the cold Bransfield Strait water (BSW) from the north was small but noticeable, leading to weak baroclinicity in this area and then a deep penetration of barotropic northeastward currents down to 300 m (Huntley and Niiler, 1995; Hofmann et al., 1996; Zhou et al., 2006; Dorland et al., 2008).
Mesoscale jets and eddies were persistently found in the Gerlache Strait (Huntley and Niiler, 1995; Hofmann et al., 1996; Zhou et al., 2002). The driving mechanisms of mesoscale jets and eddies were associated with mesoscale wind forcing, baroclinic instabilities, and topographical steering (Hofmann et al., 1996; Zhou et al., 2002; Zhou et al., 2006). The scale of these mesoscale features was governed by the mesoscale quasi-geostrophic dynamics, i.e., the internal Rossby deformation radius (Ri) of 5–20 km. Previous studies in Antarctic marginal seas indicated that such strong jet-like currents exist in a number of places associated with topography (Beardsley et al., 2004; Dinneman and Klinck, 2004; Zhou & Dorland, 2004; Zhou et al., 2006). These jets often penetrated into a great depth due to a weak but deep baroclinic pressure gradient. Because of these mesoscale variations, wind-driven inertial oscillations, and tidal currents, current measurements contained large degrees of uncertainties.
The region around the Antarctic Peninsula has recently undergone a rapid atmospheric and oceanic warming (Meredith and King, 2005; Hendry et al., 2018; Vaughan et al., 2003). Glacier melting is mainly driven by the thermal effect of relatively warm CDW available on the WAP shelf (Cook et al., 2016). Onshelf intrusions of CDW are associated with climate modes controlling the variability of atmospheric and oceanic process in the Southern Hemisphere high latitudes, such as the Southern Annular Mode (SAM). It was found that the CDW intrusion onto the WAP shelf was enhanced when SAM was shifted toward its positive phase (Dinniman et al., 2012; Zhang et al., 2020), as a result of strengthened westerlies that promotes upwelling of the CDW on the slope or enhanced transport of the Antarctic Circumpolar Current. Previous studies had indicated long-term variations and trends in the physical and biological environments in the WAP related to the climate change.
A number of studies on Antarctic krill and ecosystem productivity in the Bransfield Strait and Gerlache Strait had been carried out (Huntley et al., 1991a and Huntley and Brinton, 1991b; Hofmann et al., 2004; Ducklow et al., 2013), and their seasonal variations are revealed (Brinton and Townsend 1981; Brinton, 1991). Larval krill were carried by eddies in the strait and adult krill followed the transport of nutrients by currents. It was found that the GSC was important for transporting and redistributing biogenic materials from the Gerlache Strait to the Bransfield Strait based on the estimates of geostrophic currents and eddy diffusion rates (Brinton, 1991; Ducklow, 2008). These studies indicated that the physical processes of advection and mixing at the scales of tens of kilometers interact with biogeochemical and biological processes, especially primary production, and recruitment and aggregations of krill populations (Huntley and Niiler, 1995; Zhou and Dorland, 2004; Zhou et al., 2006). As such, it is important to study the seasonal variations and long-term trends of currents and intrusions of MCDW and BSW in WAP coastal areas, which can drive local changes in biogeochemical cycling, plankton populations, and ecosystem functioning (Moreau et al., 2015; Meredith et al., 2017; Kerr et al., 2018; Moffat and Meredith, 2018).
In this study, current data acquired by ship-mounted ADCPs (JASADCP: Joint Archive for Shipboard ADCP) between 1999 and 2016 in the Gerlache Strait were analyzed for understanding the seasonal means and long-term changes of the currents. Hydrography measurements integrated in NAPv1.0 database from 1990 to 2019 in the strait were also employed to illustrate the water mass properties associated with the current system and the potential driving mechanisms. The results were intended to advance the understandings of mechanisms on regime shifts of the physical environments and ecosystems in the Gerlache Strait.
Data and Methods
Study Sites
The bathymetry and circulations in the northern Antarctic Peninsula region where the Gerlache Strait locates are shown in Figure 1A. And the warm water intrudes into Gerlache Strait from Bellingshausen Sea through the Bismarck Channel and Schollaert Channel. The Gerlache Strait is narrow with a shallow sill in the southwestern end of the strait about 300 m (Figure 1B). It is open to the Bismarck Strait, which has a deep canyon connecting with the shelf region. The embayments in the Gerlache and Bismarck Straits include the Flandres Bay, the Andvord Bay, the Wilhelmina Bay, and the Charllotte Bay where a number of super-aggregations of Antarctic krill and whales reoccur every year (Nowacek et al., 2011; Espinasse et al., 2012). The northern Gerlache Strait is over 600-m deep and open to the western Bransfield Strait. These deep channels on the shelf of the WAP allow the Upper Circumpolar Deep Water to intrude onto the shelf regions and coastal embayments, providing heat as a critically important component to ecosystem processes.
Data
Data collected by the 153-kHz ship-mounted ADCPs between 1999 and 2016 are used in this study, which are available at the JASADCP of the United States National Oceanic Data Center (http://uhslc.soest.hawaii.edu/sadcp/INVNTORY/new.html). Five-minute ensemble average had been used for processing current velocities. Thus, the data have the resolutions of 5 min in time average, 8 m in depth, and approximately 1 km of an equivalent horizontal spacing dependent on ship speed throughout the entire duration of a cruise. The two Ice Breaker Research Vessels, N.B. Palmer and L.M. Gould, conducted monthly or bimonthly research cruises and service cruises through the study area during the period of this study. Because both research vessels took the similar tracks through the Gerlache Strait to the Palmer Station, there were significant spatial and temporal coverages of the ADCP data. However, the available data in austral winter were reduced due to reduced research activities and rough weather conditions. All available data have been standardized through quality controlling, calibration, and formation (Firing and Hummon, 2010; Firing et al., 2012). The number of observations in different seasons between 1999 and 2016 was summarized in Figures 2A–C. Most observations were conducted in austral summer and fall seasons, and the number of observations was much reduced in austral winter. Also, the spatiotemporal distributions of observational locations of JASADCP in different seasons between 1999 and 2016 in the Gerlache Strait were outlined in Appendix.
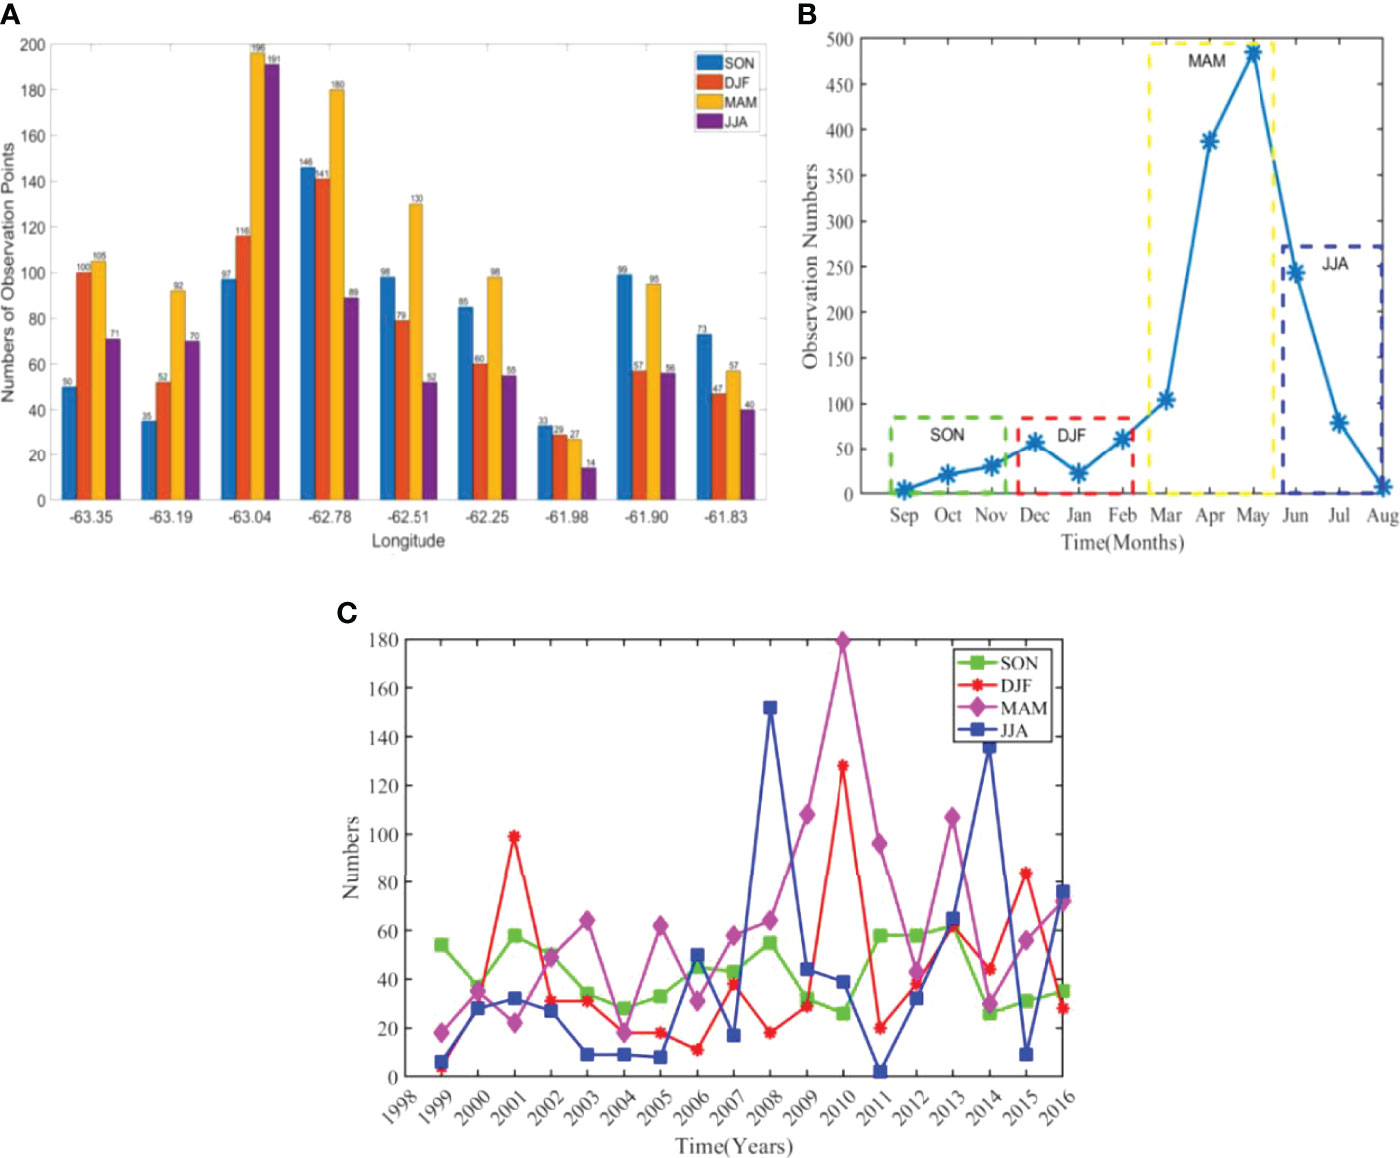
Figure 2 (A) Numbers of ADCP observations in the subareas in the Gerlache Strait between 1999 and 2016 in austral spring (SON), summer (DJF), fall (MAM), and winter (JJA). Each abscissa value represents the longitude of the center of a subarea. (B) Numbers of observations in different months of 1999–2016 in the entire study area. (C) Numbers of observations in different seasons from 1999 to 2016 in the entire study area. * represent the numbers of observation of JASADCP for each month.
In order to explore the seasonal variations of hydrographic features in the Gerlache Strait, the database NAPv1.0 that is integrated by Brazilian scientists (Dotto et al., 2021) was used in this study (Table 1). The database integrates the hydrological datasets of CTD, Marine Mammals Exploring the Oceans Pole to Pole, and Array for Real-time Geostrophic Oceanography (Argo) profiles sampled in the North Antarctic Peninsula (NAP) and adjacent areas from 1990 to 2019 with optimal objective interpolation. It had been divided into four seasons: summer (January, February, and March), fall (April, May, and June), winter (July, August, and September), and spring (October, November, and December). The profiles were linearly interpolated to 90 depth levels and a horizontal grid system with a grid resolution of ~10 km.
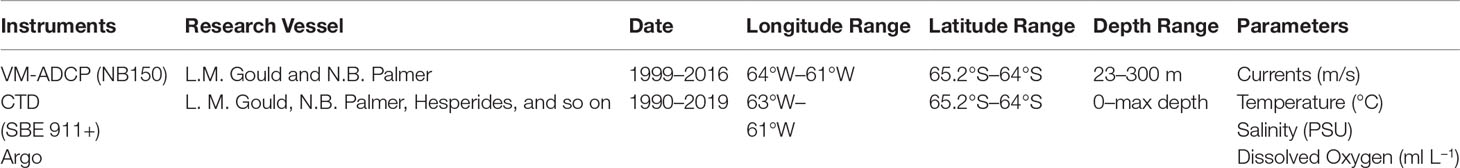
Table 1 The data have been used to analyze the seasonal mean current and driven mechanism.
Methods
The study area in the Gerlache Strait is divided into nine subareas with a distance of approximate 15 km between the centers of two adjacent regions (Figure 1B and Table 2). The ADCP data are sorted into subareas based on their geographic locations, seasons (austral spring, summer, fall, and winter) and depth, and then seasonal means and variances were computed. Because the percentage goods of current estimates were low below 300 m, our computations were limited in the upper 300 m. The volume transport in Sv (seasonal volume) (1 Sv = 106 m3 s–1) along the strait is estimated as the product of the mean current along the strait and the cross-strait (section) area in the upper 300 m. The original ADCP data in the Geodetic coordinate are converted into the along-strait and cross-strait directions as
where uL and uT are the velocity along the strait and the transversal component of velocity across the strait, respectively, θ is the angle between the along-strait and zonal directions, and u and v are the eastward and northward components of currents, respectively.
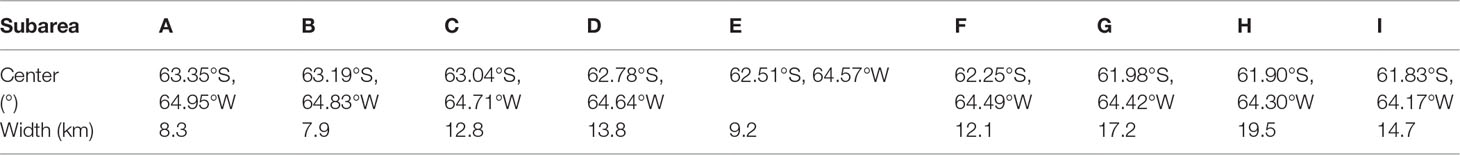
Table 2 The centers and cross-strait widths of the subareas defined in this study.
The angle θ varies along the principal axis of the strait (Figure 1B). The strait is divided into three regions: the southwest region composed by three subareas A, B, and C with θ of 55.7°; the middle region composed by three subareas D, E, and F with θ of 33.8°; and the northeast region composed by three subareas G, H, and I with θ of 77.5°. The means and variance ellipses of currents are computed to describe the mean and fluctuations of current fields in the nine subareas in different seasons. The calculation process of the variance ellipse is as follows. The original currents u (zonal direction) and v (meridional direction) are detided using the model tidal current data (Padman et al., 2002). Then, the mean currents (and and anomalies (, ), are computed. To compute an ellipse fitted to current anomalies in the term of least-squares, u_r and v _r are rotated an angle of φ as
The standard deviations σu’ and σv’ in u_r and v_r directions are equal to
where ui and vi are the ith observation in a subarea, and N is the number of observations. The angle φ is rotated until σu’ and σv’ reaching their maxima and minima, respectively, noted as σu’max and σv’min at θmax. σu’max and σv’min are the major and minor axes, respectively, and θmax is the orientation of the ellipse. As such, there are three angles to represent the current characteristics: the angle of the principal axis of the strait, the angle of the mean current, and the angle of the ellipse.
Results
The area- and depth-mean currents of zonal and meridional directions in the entire Gerlache Strait were analyzed in different seasons (Figures 3, 4). The compass was divided into four areas
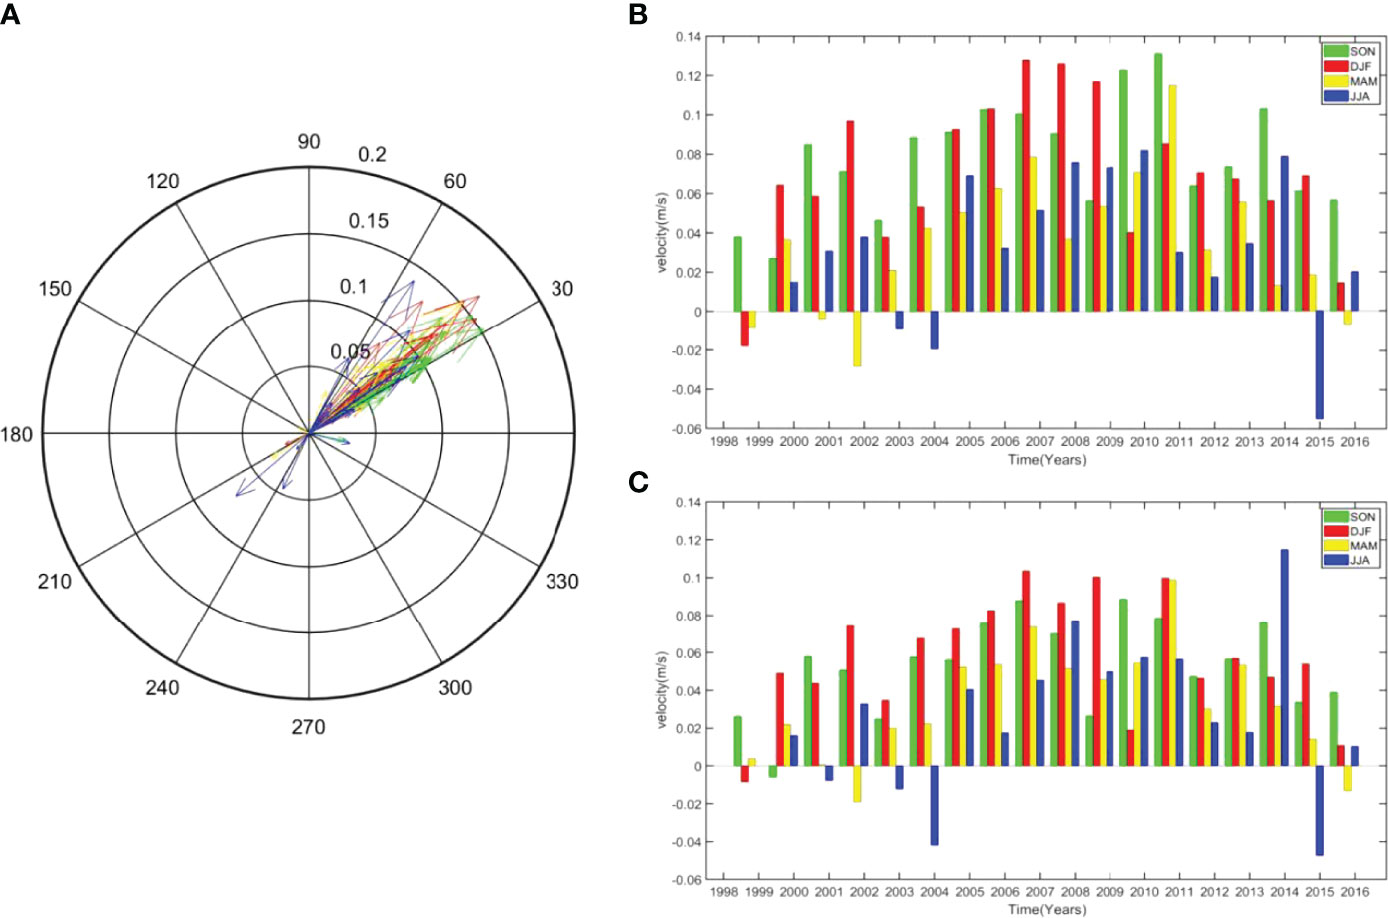
Figure 3 (A) The compass diagram of seasonal area- and depth-mean currents in the Gerlache Strait obtained from the JASADCP data between 1999 and 2016. The green, red, yellow, and blue colors represent data from austral spring, summer, fall, and winter, respectively. (B) and (C) are the bar diagrams of annual seasonal mean currents in the zonal direction and meridional direction between 1999 and 2016, respectively.
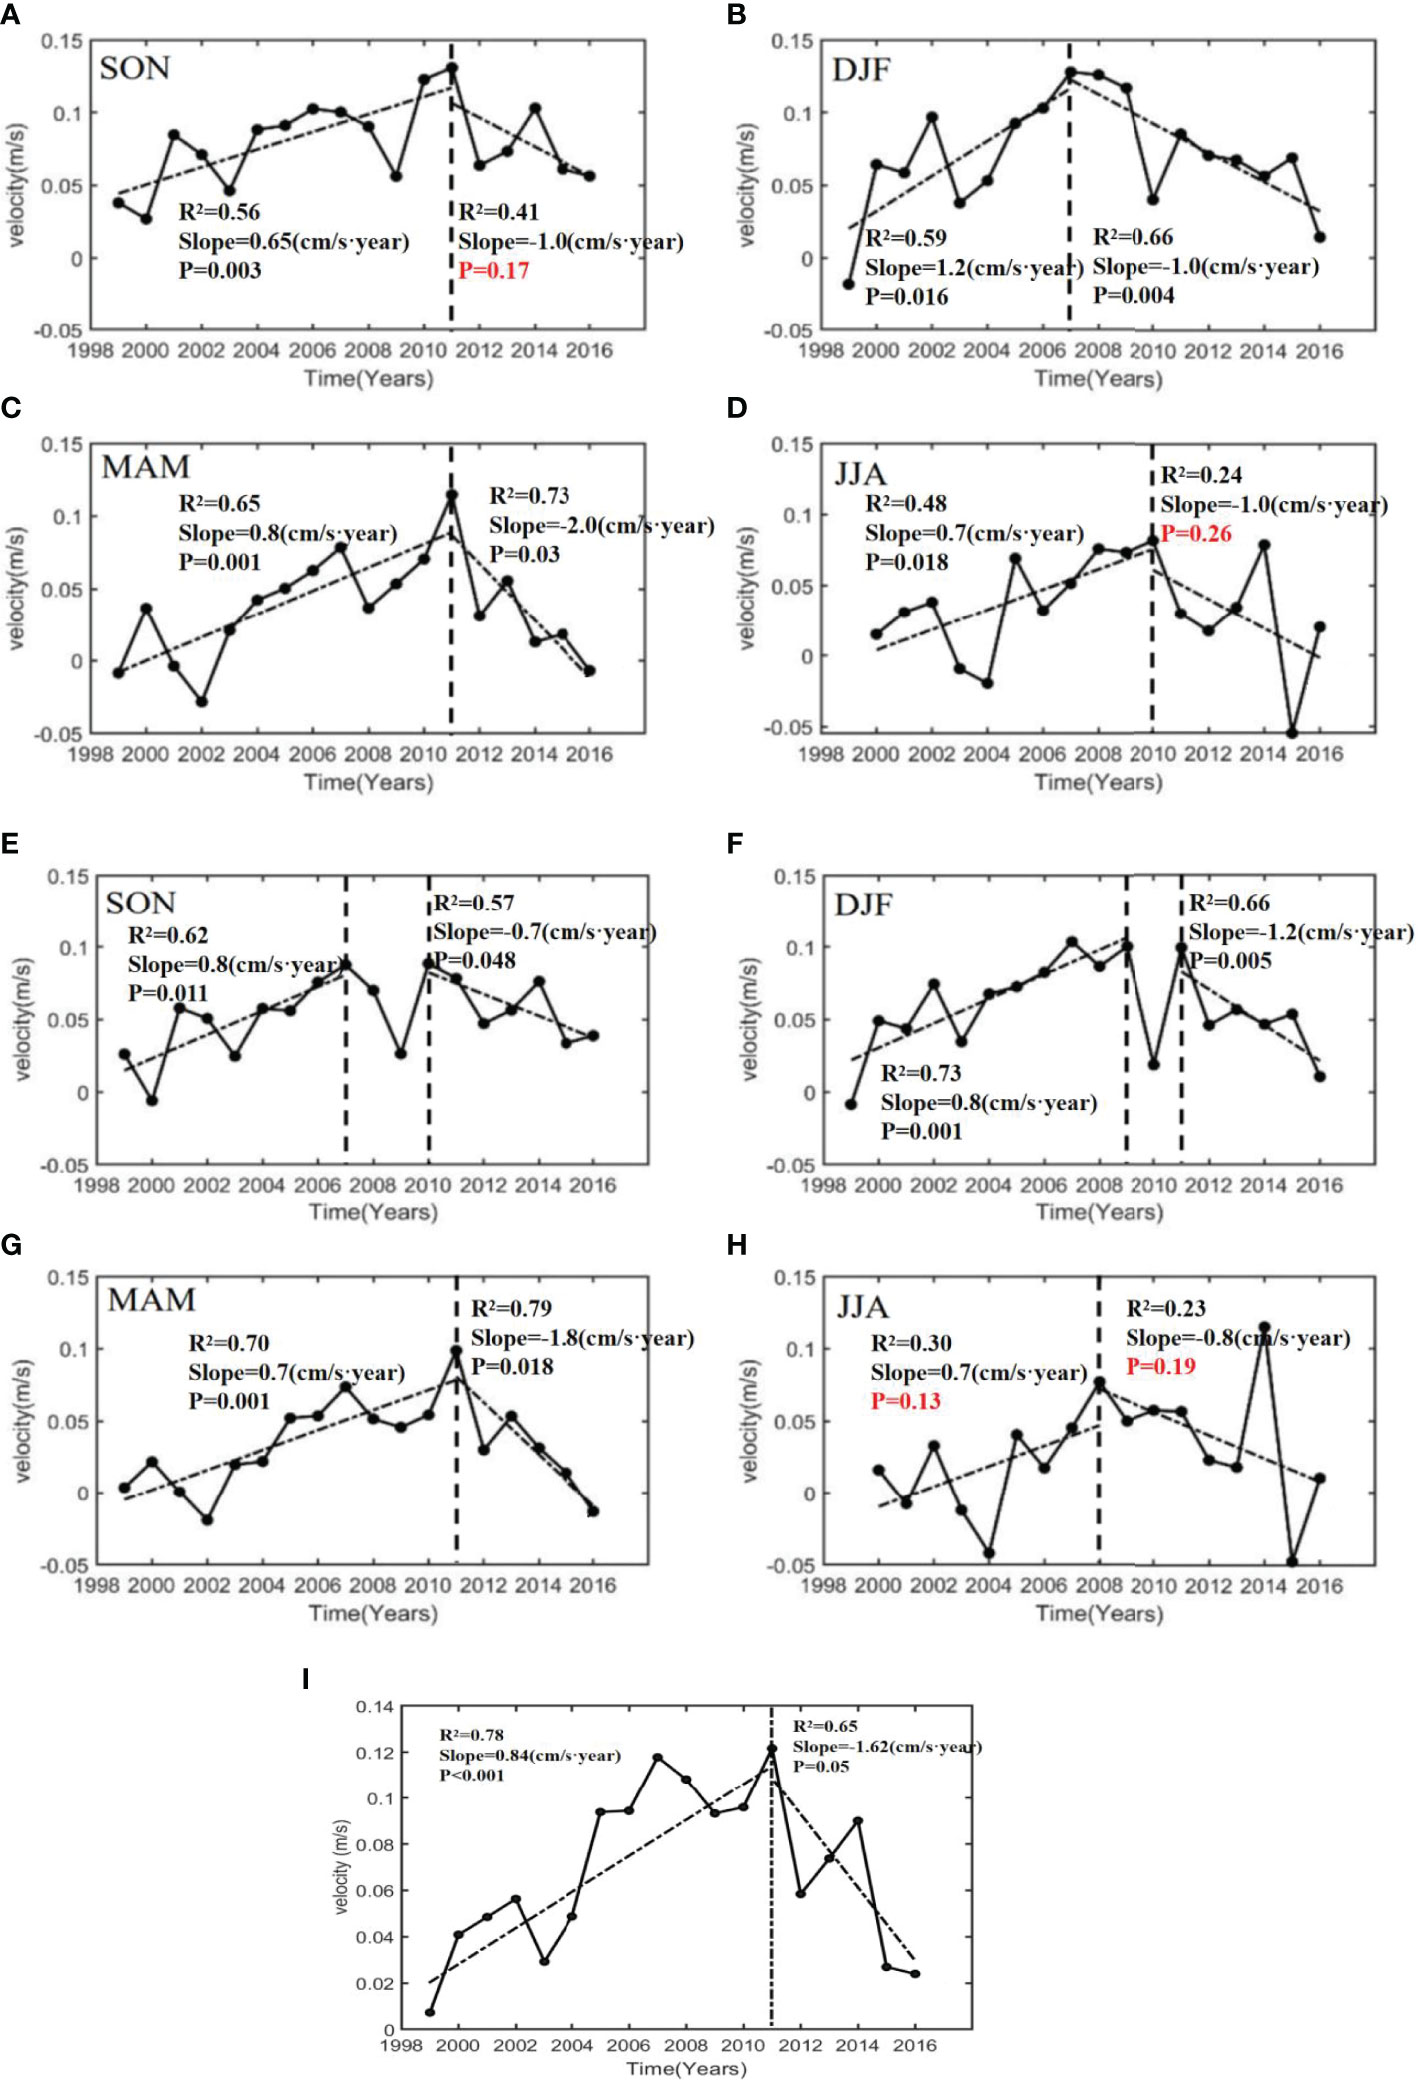
Figure 4 The seasonal area- and depth-mean currents between the sea surface and 300 m in the Gerlache Strait obtained from the JASADCP data from 1999 to 2016. (A–D) Time series of seasonal depth-mean currents in the zonal direction in different years; (E–H) time series of seasonal depth-mean currents in the meridional direction in different years. (I) time series of depth-mean northeastward currents in different years. The dashed lines represent the linear trends of currents. R2 is coefficient of linear regression, P is the value of t-test for R2 and slopes represent the increasing (positive) and decreasing (negative) of depth-mean currents for one year.
to show the directions and speeds of currents according to the angles and radiuses, respectively. The angles of 0°–90°, 90°–180°, 180°–270°, and 270°–360° corresponded to the northeastward, northwestward, southwestward, and southeastward directions, respectively. The radiuses of 0–0.05, 0.05–0.10, 0.10–0.15, and 0.15–0.2 corresponded to 0–0.05 m s−1, 0.05–0.1 m s−1, 0.1–0.15 m s−1, and 0.15–0.2 m s−1, respectively. Obviously, most arrows were in the range of 30°–60° indicating that most of the current directions were northeastward. In addition, the speeds of most currents were in the range of 0.05–0.15 m/s (Figure 3). In austral spring, the results exhibited an increase in the northeastward currents between 1999 and 2008, and a decrease between 2011 and 2016. During austral summer, the currents increased from 1999 to 2009 and decreased from 2011 to 2016. In austral fall, the currents increased from 1999 to 2011 and decreased from 2011 to 2016. In austral winter, the flows increased from 1999 to 2008 and decreased from 2010 to 2016 in austral winter (Figure 4). Overall, the depth-mean northeastward currents increased from 1999 to 2011 and decreased from 2011 to 2016 (Figure 4).
The seasonal depth-mean currents and variance ellipses in all subareas are shown in Figure 5. The depth-mean currents were predominantly northeastward, and the major axes of variance ellipses were in parallel to the axis of the deep channel in the
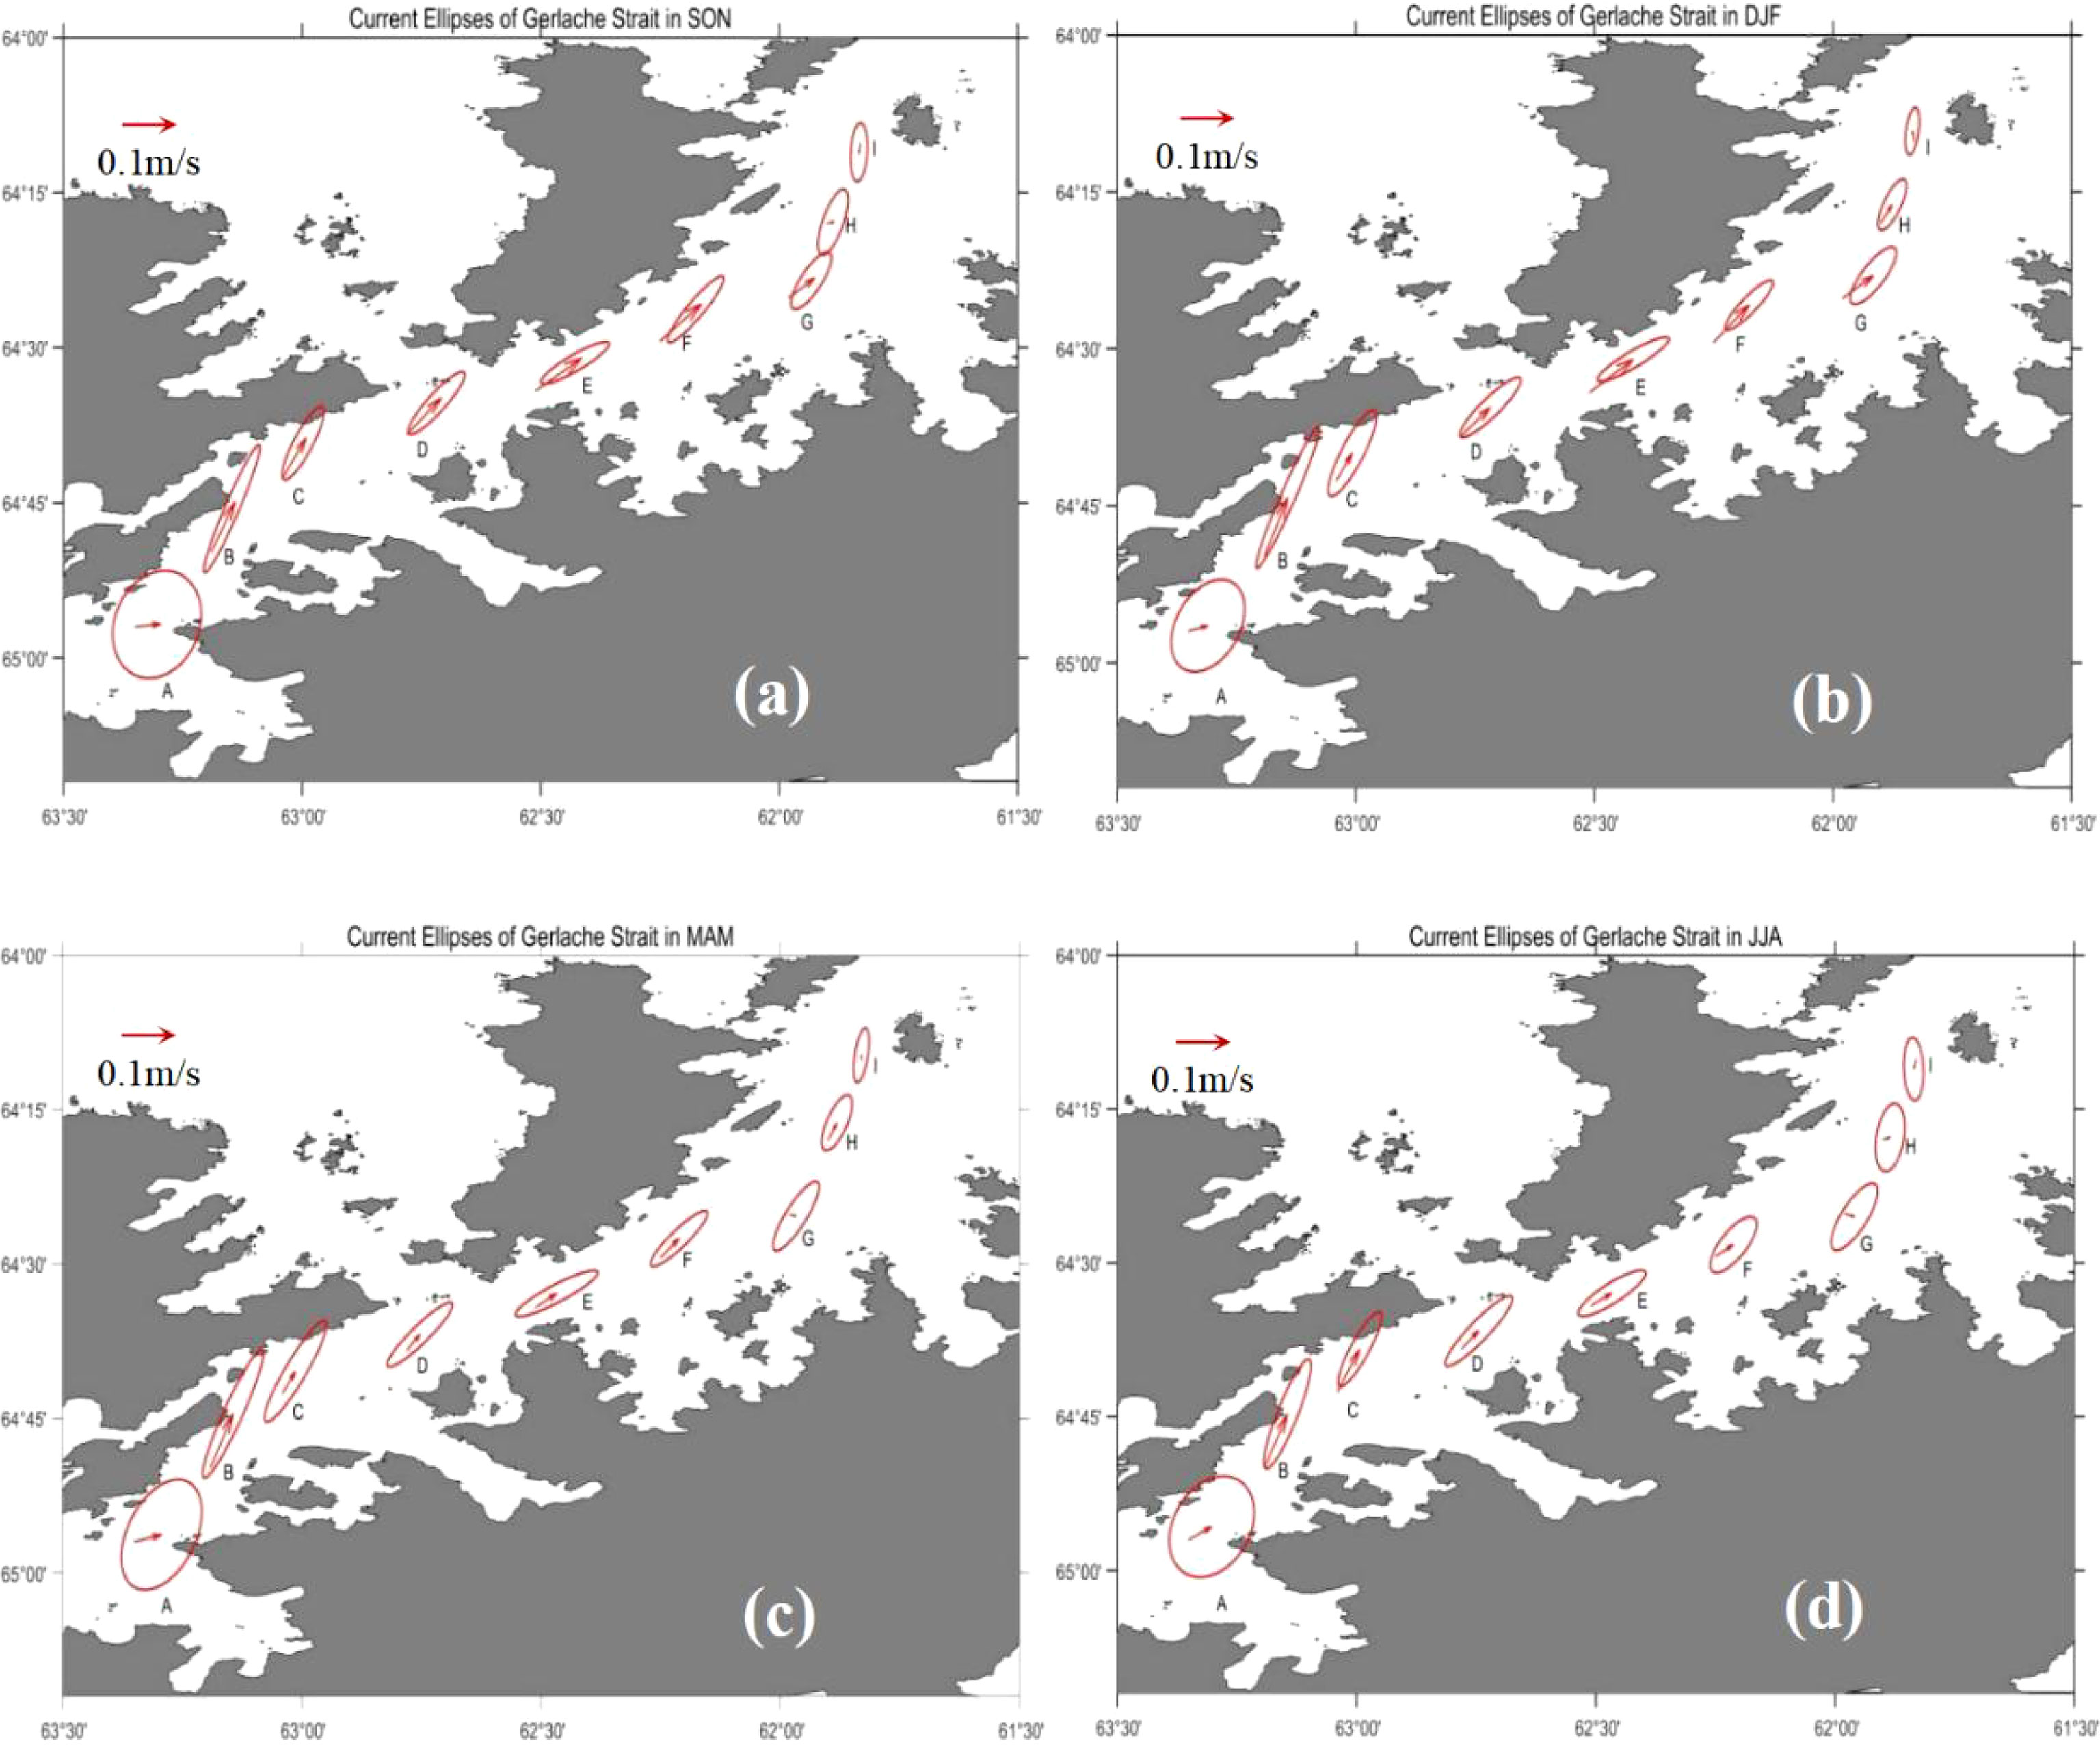
Figure 5 The seasonal depth-mean currents between the sea surface and 300 m and the variance ellipses of the currents in subareas A–I in (A) austral spring, (B) summer, (C) fall, and (D) winter.
Gerlache Strait. The fluctuations of currents were significantly larger than the depth-mean currents. At the southwestern entrance (subarea A, Zhou et al., 2002) of the Gerlache Strait Current, the depth-mean current was lower than 0.08 m s−1, and the major and minor axes of the ellipse were 1.5 and 1.0 cm s−1, respectively. The ratio of minor to major was approximately 0.66 representing nearly isotropic variations of the currents. In the mid strait, the ratio was less than 0.2 representing the current predominantly limited by side walls with small components in the cross-strait direction. At the northeastern exit (subarea I, Zhou et al., 2002) of the Gerlache Strait Current where the GSC became the Bransfield Strait Current, the depth-mean current was reversed during austral spring (−0.02 m s−1) and winter (−0.015 m s−1). The correlation between the magnitude of the GSC and the width of the channel had been analyzed, and a significant negative relationship (R = −0.68, P = 0.04) was found.
The vertical sections of seasonal currents and transports on the along-strait transect elucidated a two-layer flow structure (Figures 6–10). Currents in the upper layer shallower than 200 m flowed northeastward, whereas currents in the lower layer flowed southwestward. The strongest northeastward along-strait current reached 0.2 m s−1 in the surface layer above 100 m during all seasons The northeastward currents were stronger in austral spring and summer, and weaker in austral fall and winter. In the deep layer, the southwestward currents were visibly stronger in austral fall and winter, and weaker in austral spring and summer, contrary to the pattern of currents in the upper layer. The depth-integrated transport over the entire water column reached 0.52 Sv in austral spring and summer and 0.35–0.42 Sv in austral fall and winter (Figure 7) The diagrams of temperature versus salinity with potential density anomaly in the Gerlache Strait and adjacent fjords from NAPv1.0 dataset were shown in Figure 8. In spring (Figure 8D) and summer (Figure 8A), the water masses of ASW, the winter water (WW), the warm MCDW, and the cold BSW were found in the strait. And the two domination water masses (MCDW and ASW) with BSW occupied the whole water column in austral fall (Figure 8B) and winter (Figure 8C).
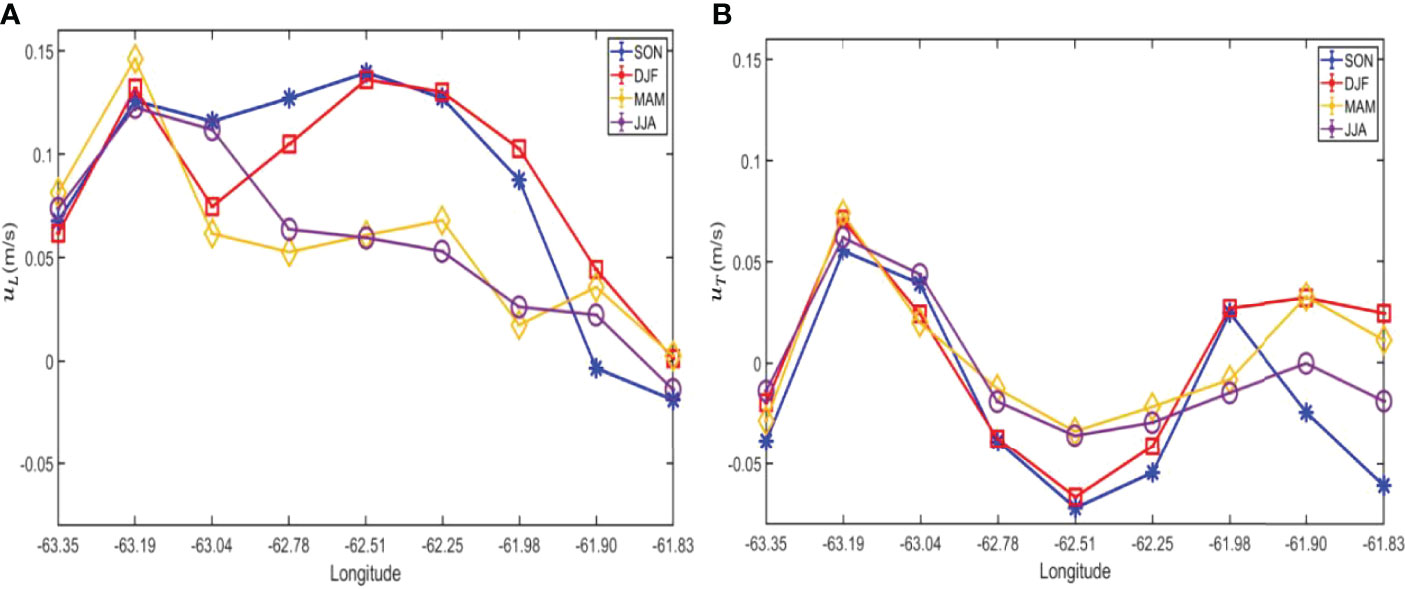
Figure 6 The (A) along-strait and (B) across-strait seasonal depth-mean currents in the nine subareas.
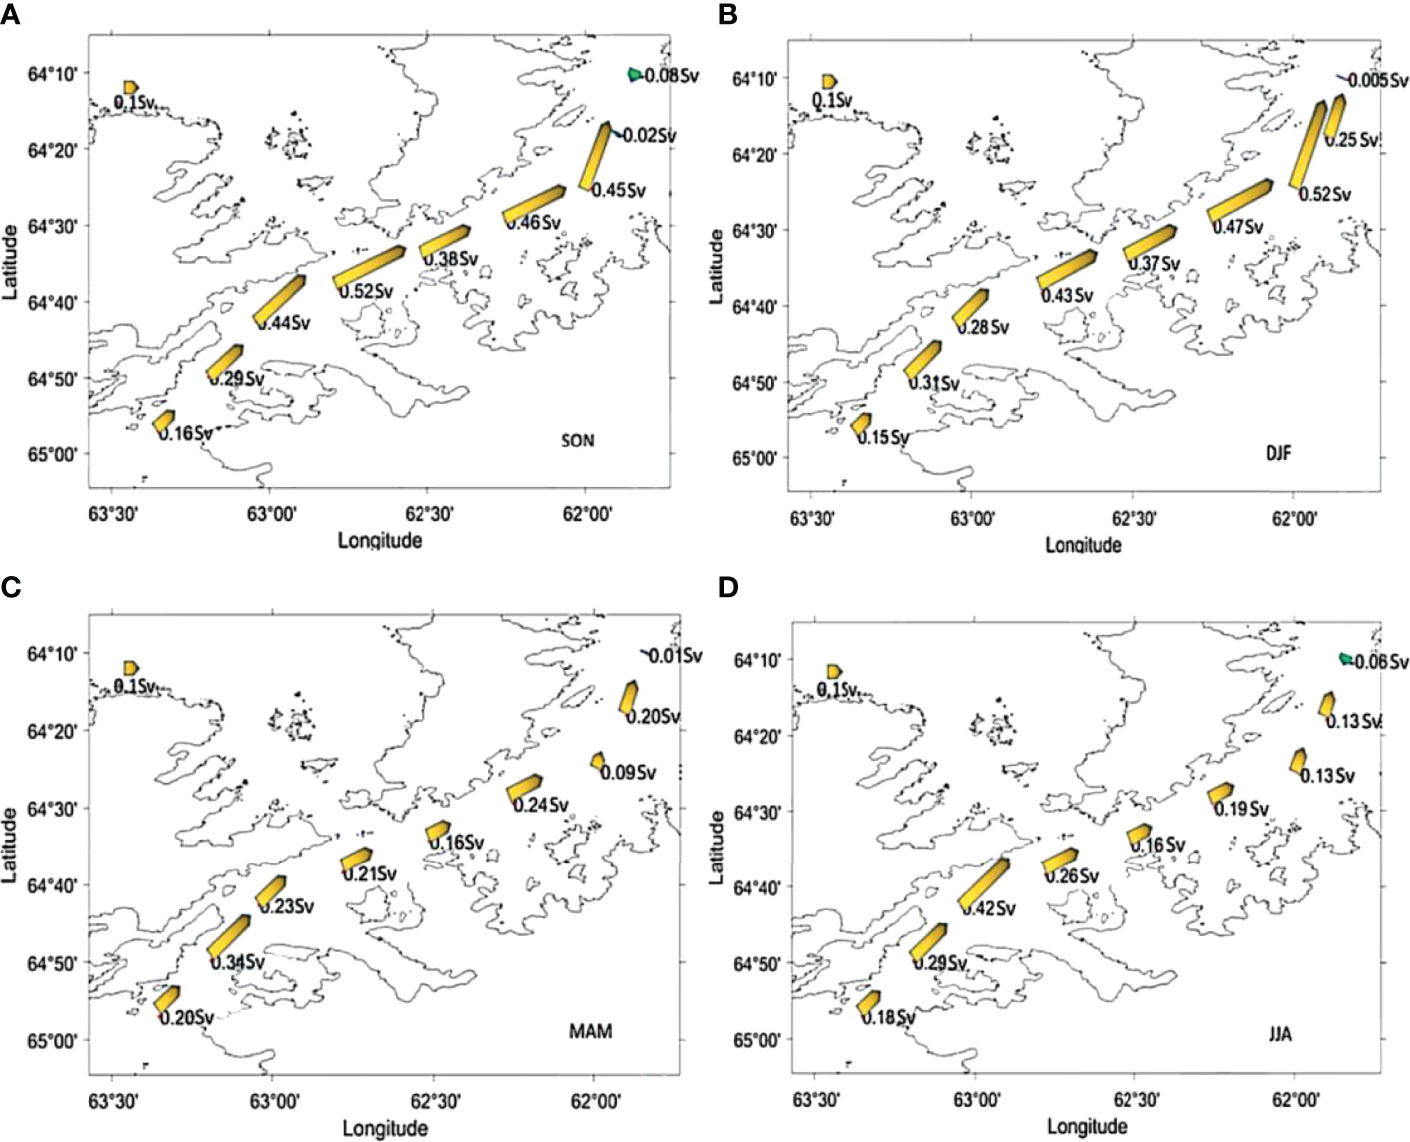
Figure 7 The seasonal volume transports (unit: Sv) in the nine subareas in the Gerlache Strait in (A) austral spring, (B) summer, (C) fall, and (D) winter, respectively. The thick yellow arrows represent northeastward transports and the thick green arrows represent southwestward transports. The length of the arrow indicates the magnitude of transport.
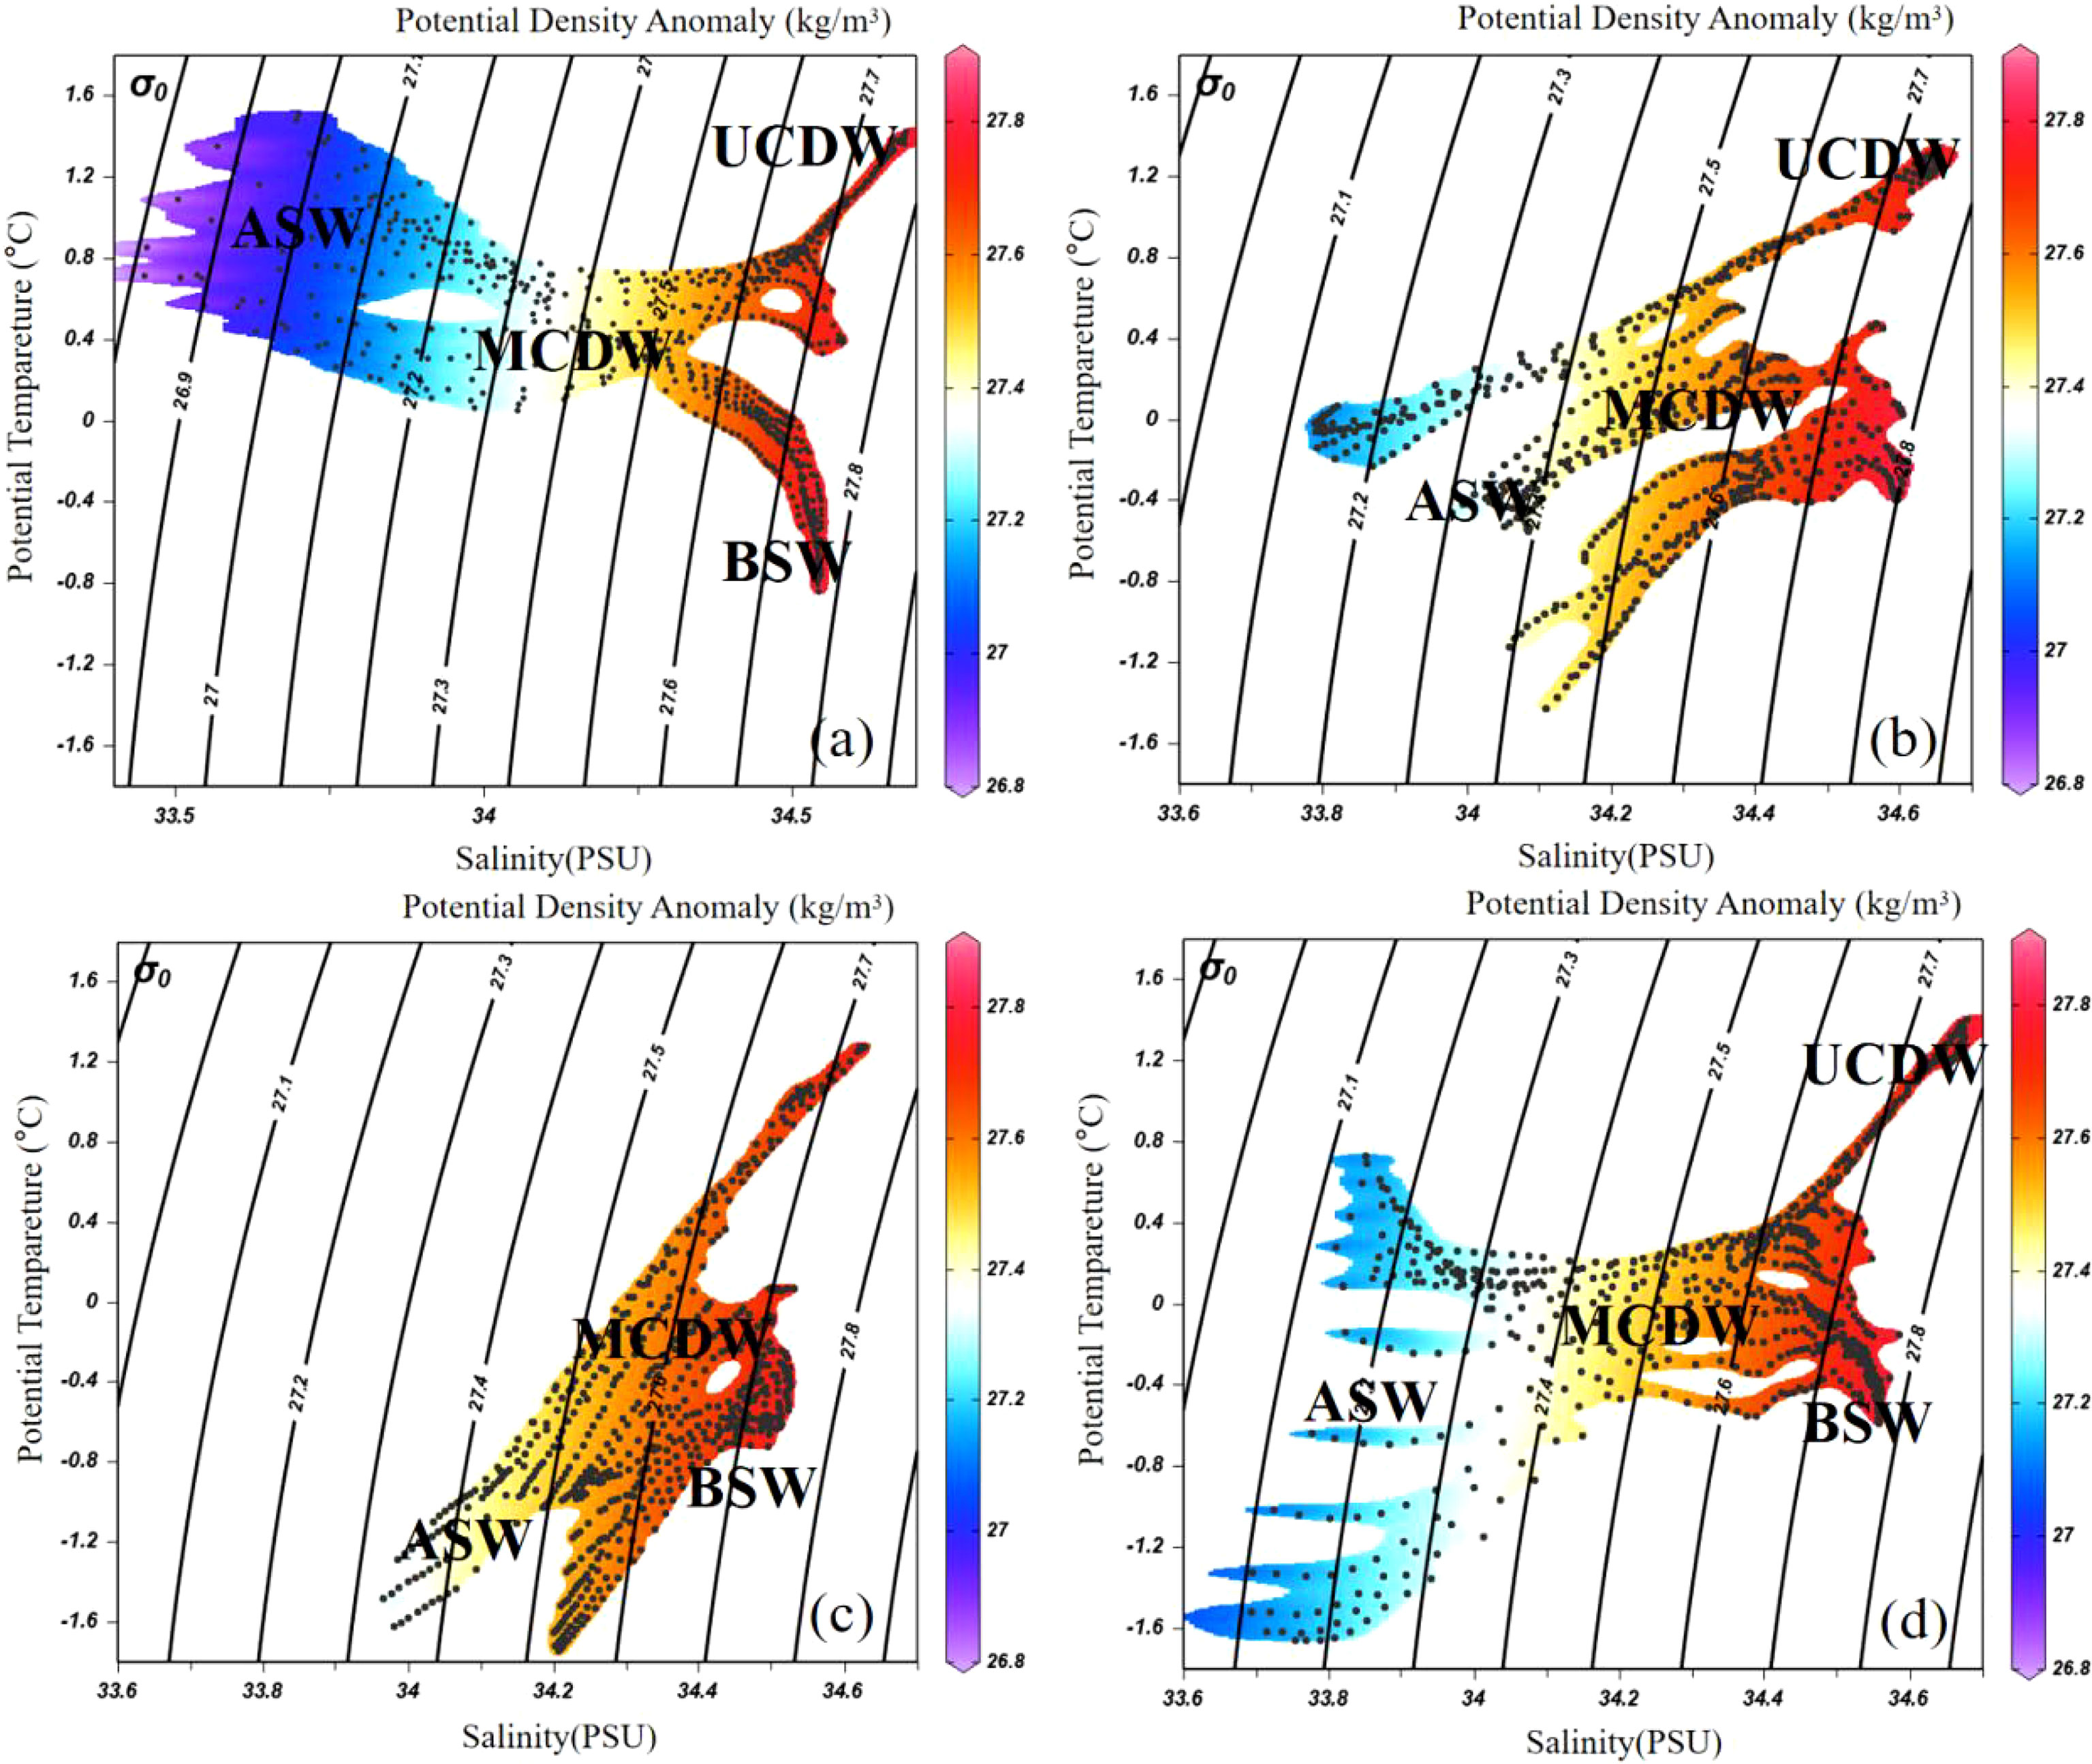
Figure 8 The diagram of temperature versus salinity in the Gerlache Strait in (A) austral summer, (B) austral fall, (C) austral winter, and (D) austral spring. The colormap represent the potential density anomaly (kg m−3) in different seasons.
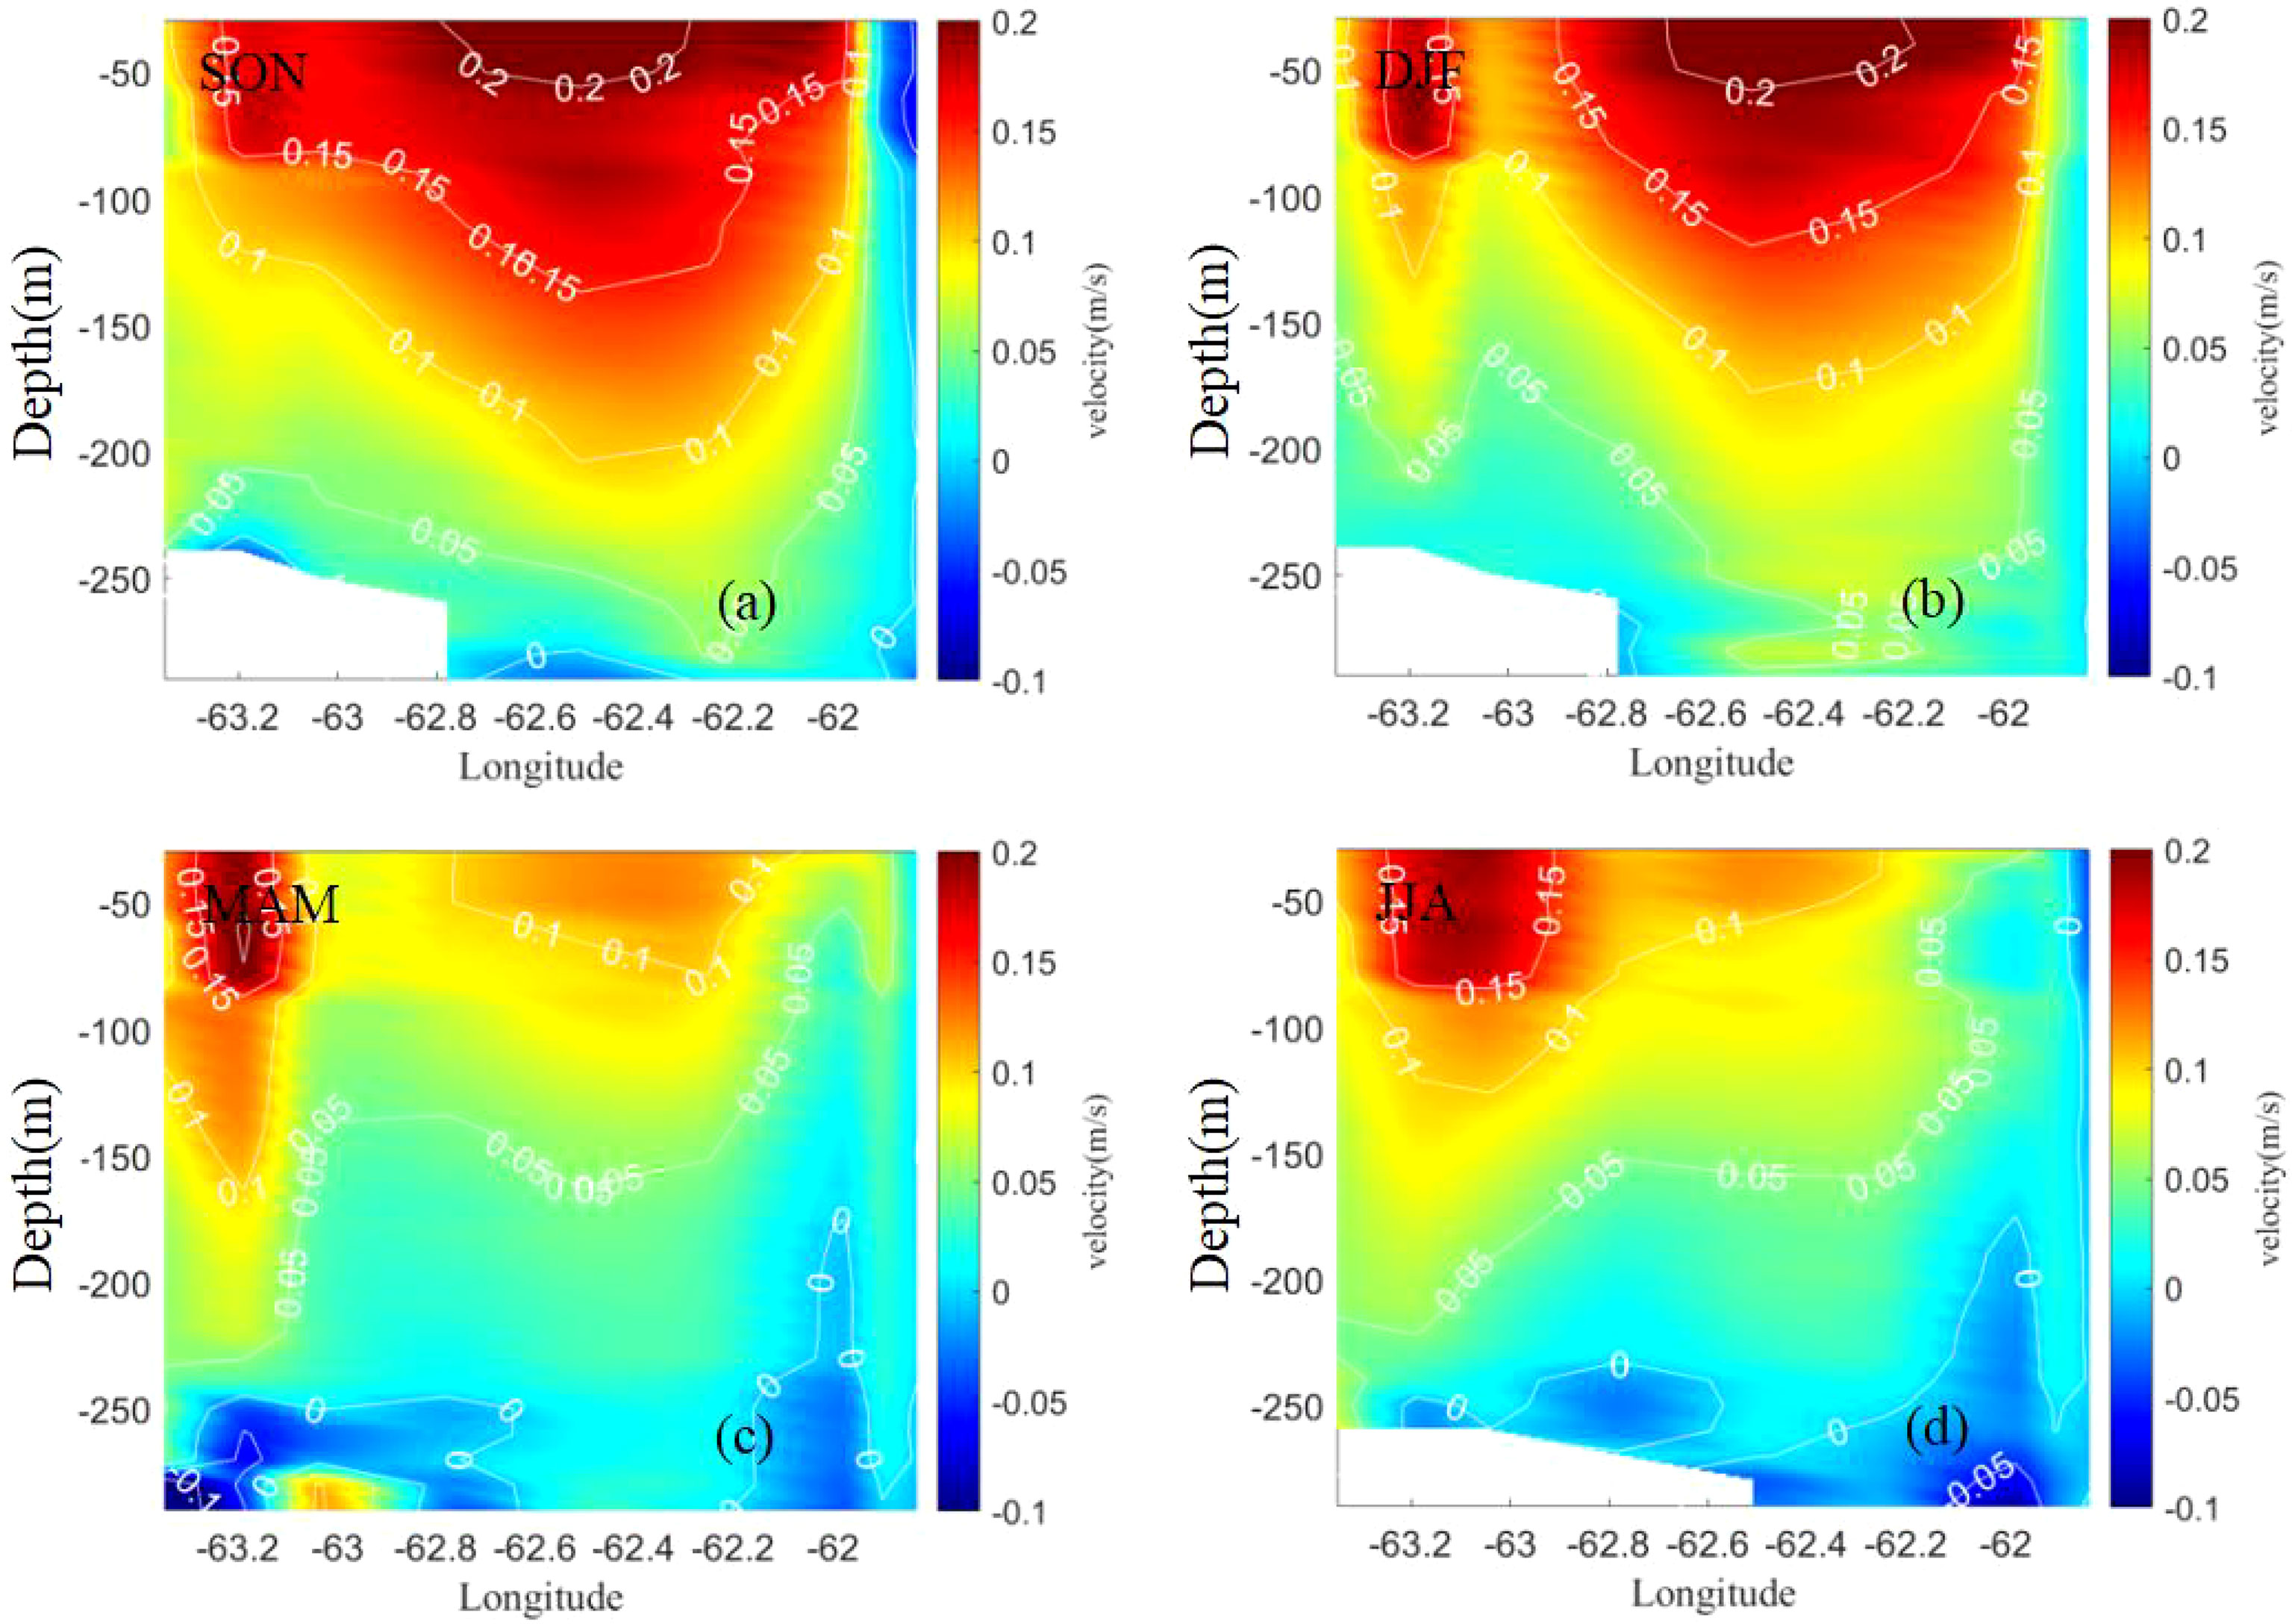
Figure 9 The vertical currents sections along the principal axis in (A) austral spring, (B) summer, (C) fall and (D) winter, respectively.
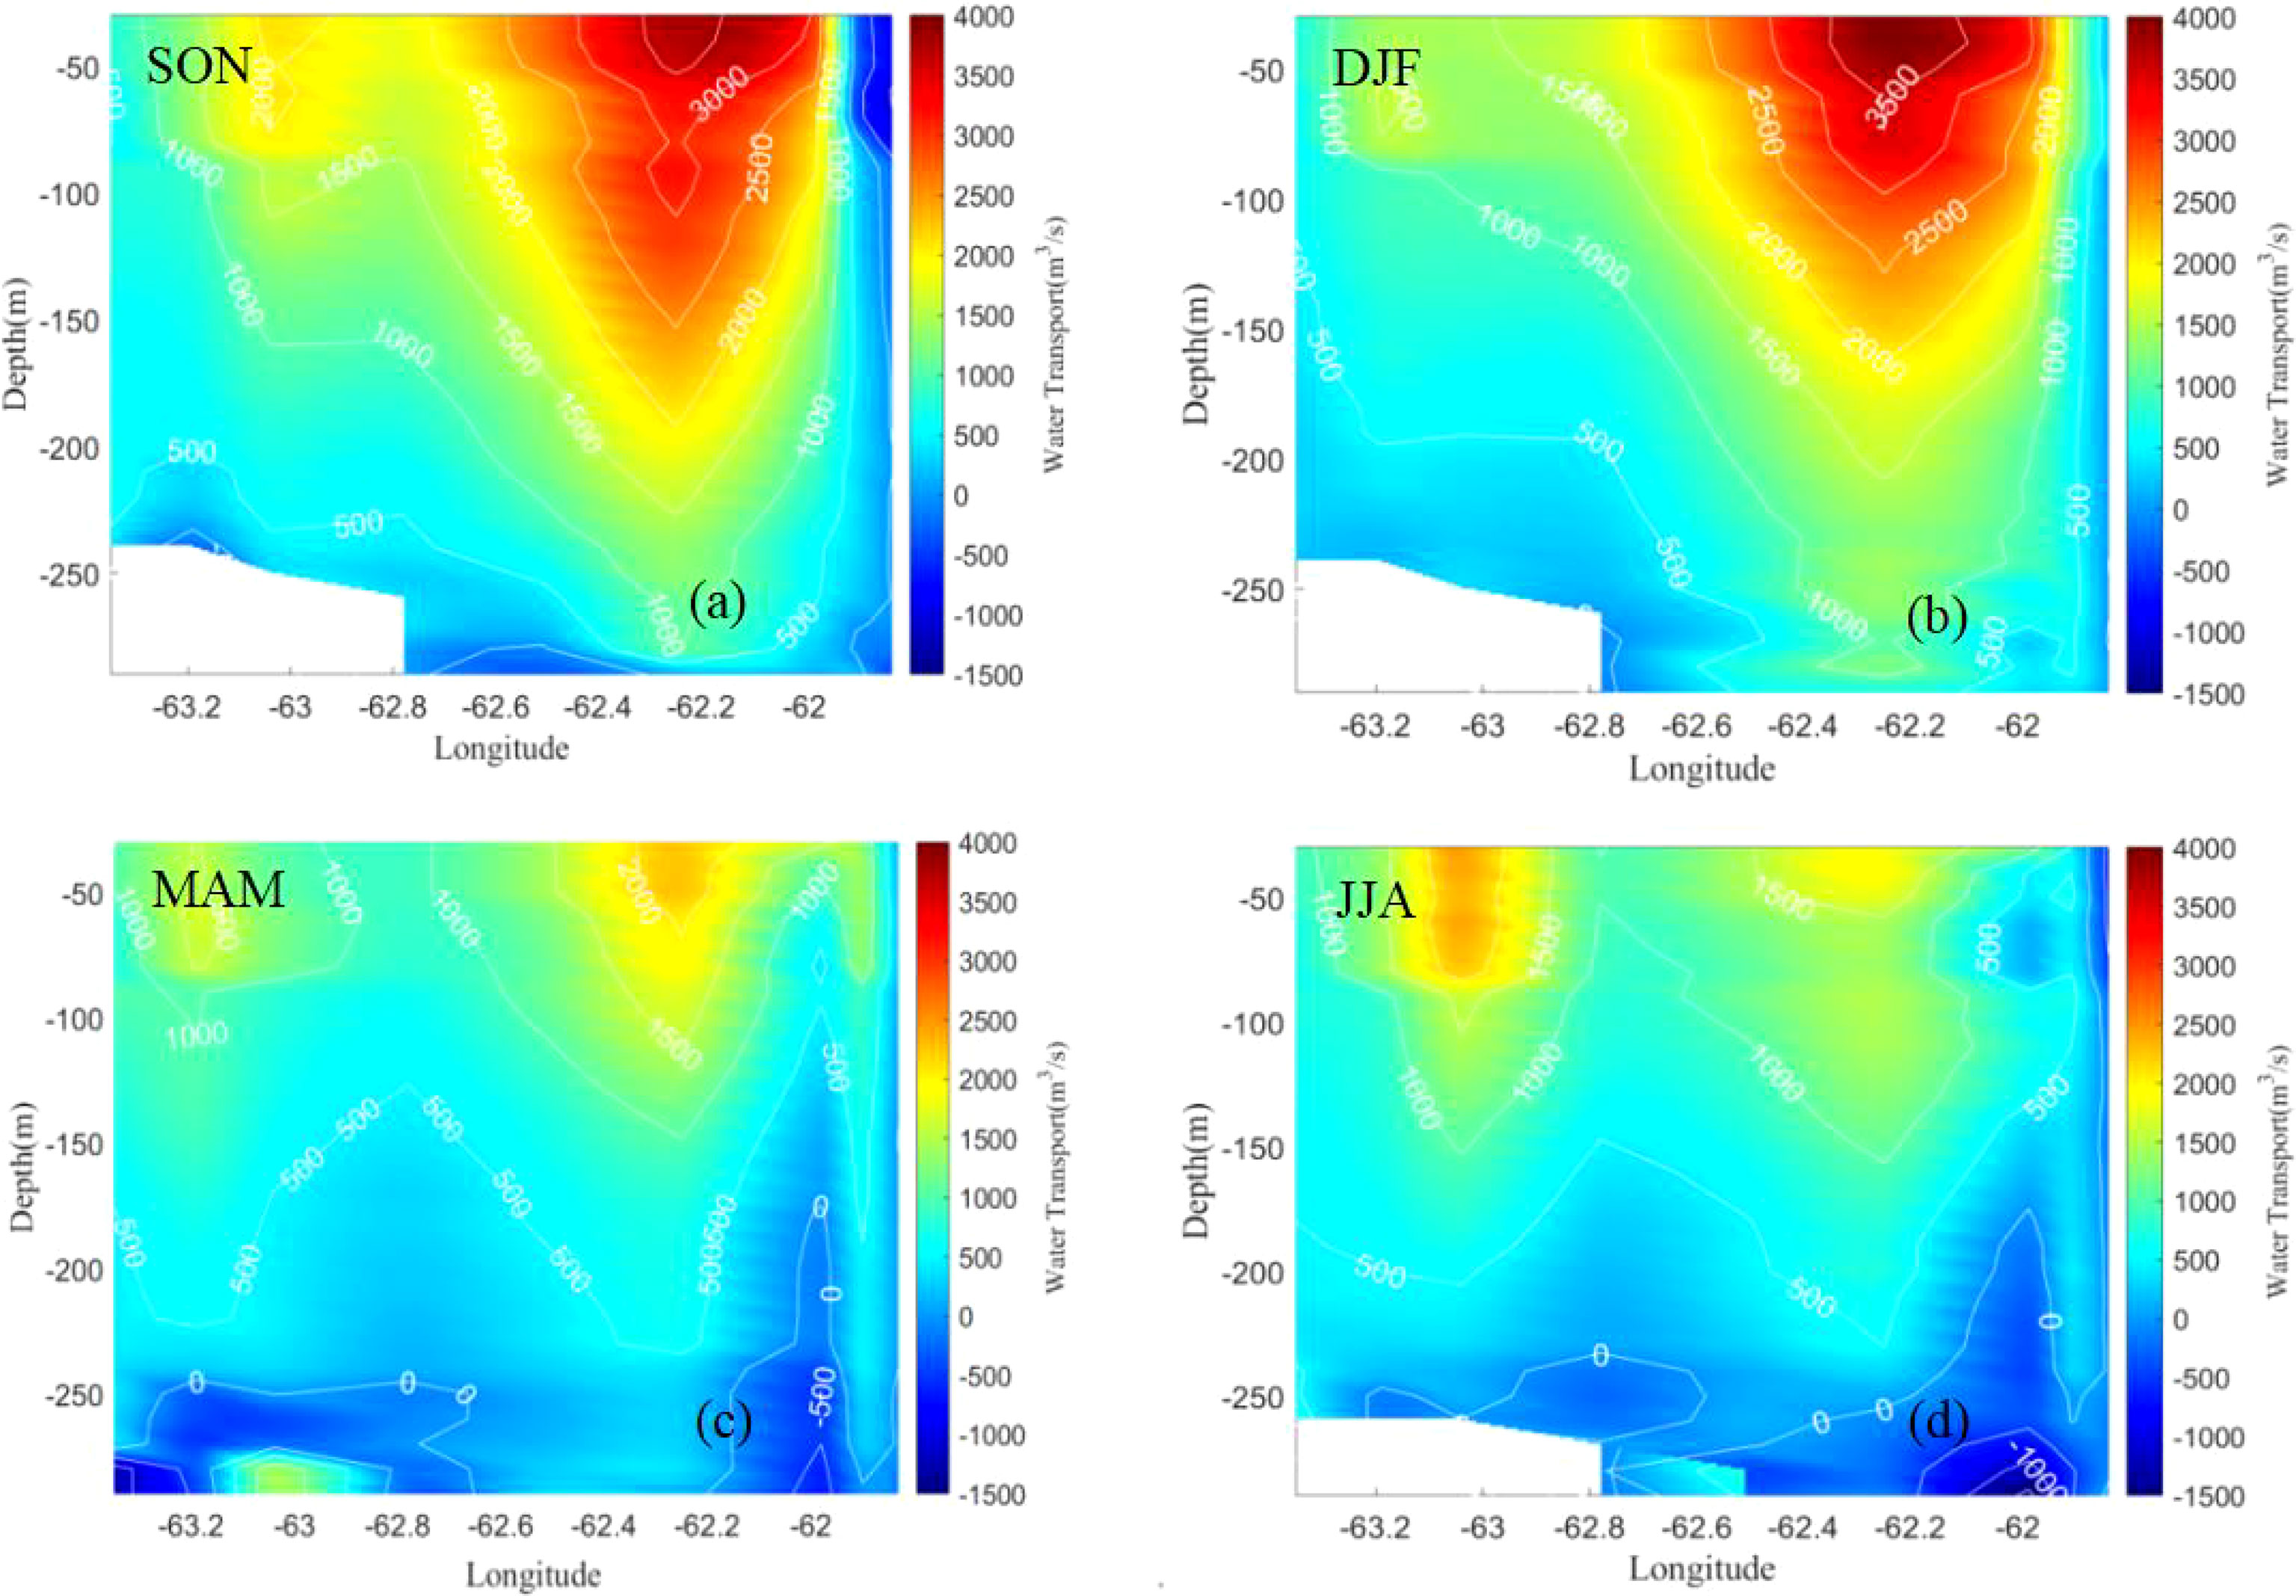
Figure 10 The vertical transport sections along the principal axis in (A) austral spring, (B) summer, (C) fall and (D) winter, respectively.
The potential density anomaly, potential temperature, dissolved oxygen (DO), and salinity were analyzed along the transects indicated in Figure 1B to explore the relationship between water masses structures and currents in vertical direction. The two-layer flow composed of MCDW and BSW were clearly revealed in Figure 11. The warm water tongue approximately 1.5°C represented the northeastward intruding MCDW in the depth range between the ASW and the BSW in austral summer (Figure 11A). The water below 400 m was cold and approximately −1°C, which was typically of the southwestward intruding BSW from the Bransfield Strait. The MCDW intrusion were also found based on the concentration of DO between 4 ml L–1 and 6 ml L−1 in Figure 11A.
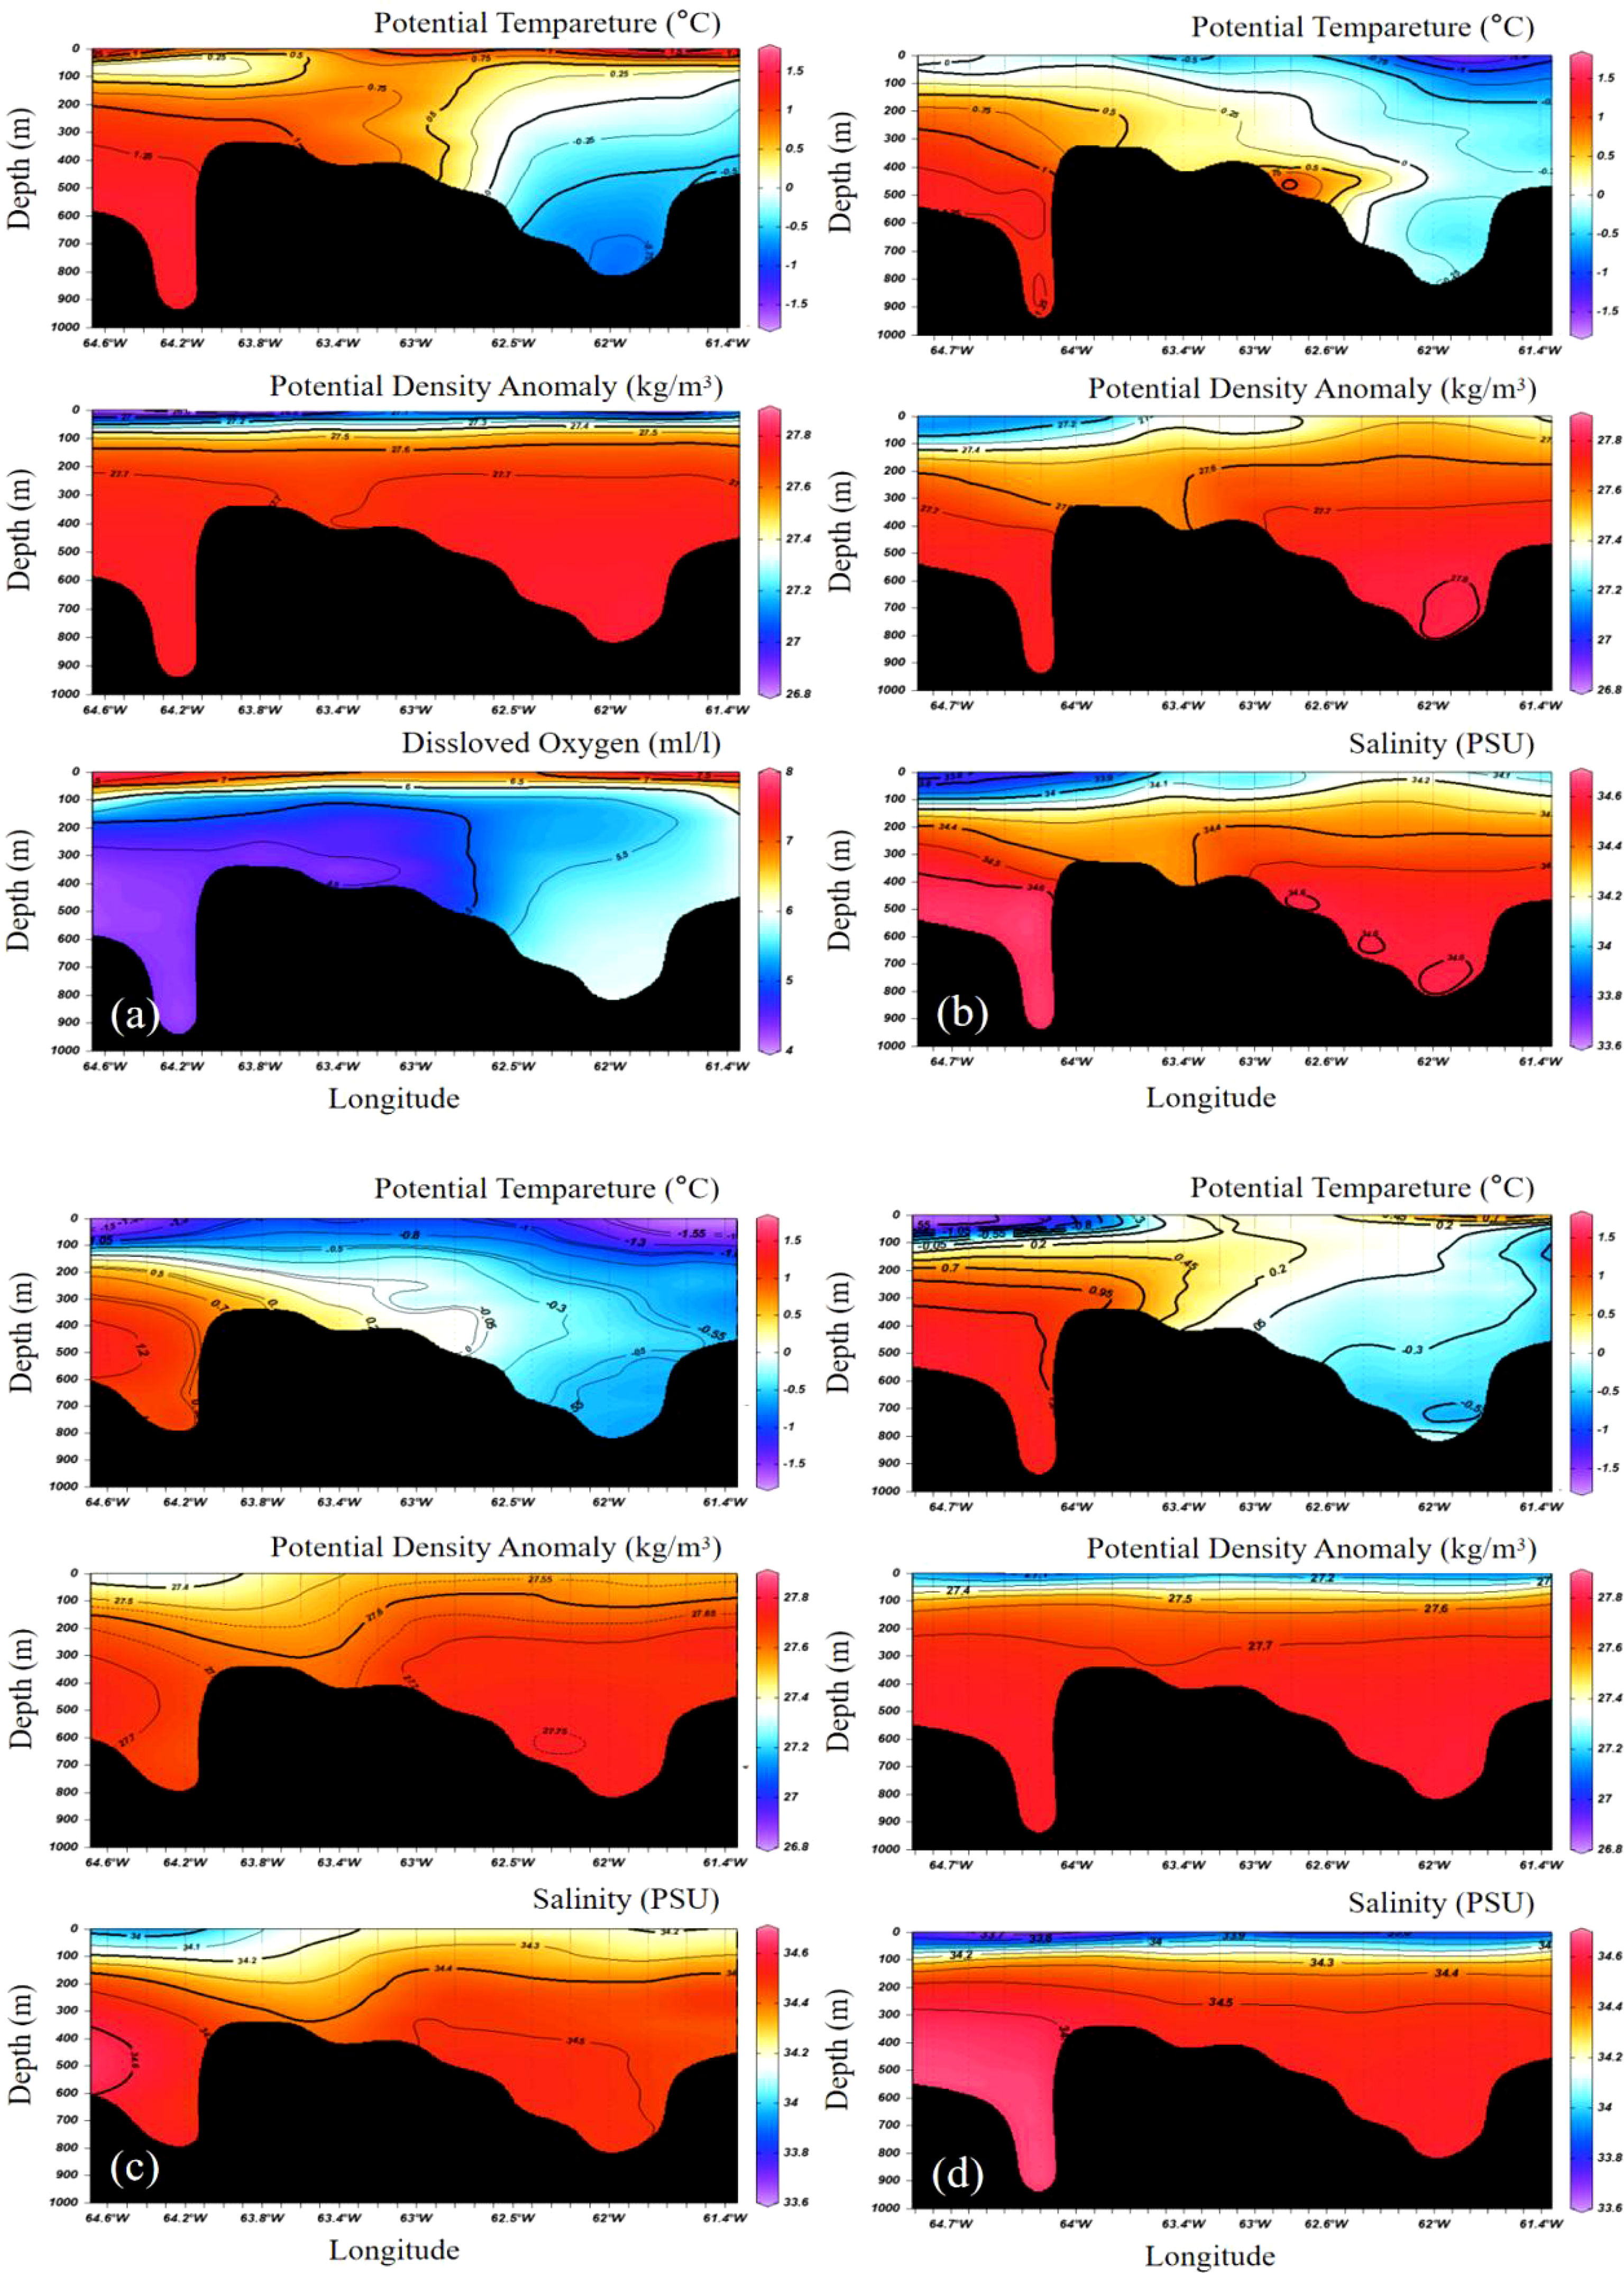
Figure 11 The water masses transects of potential temperature (°C), potential density anomaly (kg m−3), dissolved oxygen (ml L-−1), or salinity (PSU) in (A) austral summer, (B) austral fall, (C) austral winter, and (D) austral spring.
The vertical variation of temperature in different seasons at the same grid point was shown in Figure A2 based on the distribution of CTD grid points (Figure 1B and Table A1). In the upper layer (<300 m), the temperature increased gradually from austral winter to austral summer, and the maximum temperature difference was in the surface layer (>2°C). However, the temperature difference between the four seasons decreased gradually with the increase of depth. Mostly, the highest temperature occurred in austral fall but lowest in austral summer below 300 m. Therefore, the depth of ~300 m was the turning depth of the vertical distribution of temperature. The upper layer was composed by warm MCDW mainly and lower layer (>300 m) occupied by cold BSW. It indicated that the intrusion of BSW was the weakest in austral fall and the strongest in austral summer.
Discussions
Spatial and Seasonal Variations of Depth-Mean Currents and Water Masses
The results revealed that the depth-mean currents were persistently northeastward, indicating persistent MCDW intrusions from the southwestern entrance into the Gerlache Strait (Figures 3–9). Because MCDW was the warmest water, the intrusion of this water mass into the Gerlache Strait brought significant amount of heat into the strait and its embayments, which could then affect the stratification and mixing as well as sea ice formation. Previous studies showed that all drifters deployed in the Gerlache Strait exited in the north into the southern shelf slope region off the South Shetland Islands, which suggested that the MCDW could reach the Bransfield Strait with the currents (Niiler et al., 1990; Zhou et al., 2002, 2006).
The northeastward currents exhibited a seasonal variation pattern, which were strongest in austral spring and summer, weaker or even reversed in austral fall, and weakest in austral winter (Figures 3–9). The seasonal changes of mean currents were significant though they are much smaller than their variances (Figure 5). Such seasonality was associated with the decrease in MCDW intrusion and increase in southwestward intrusion of BSW during austral fall and winter (Figure 9). The depth-mean currents in the midsection of the Gerlache Strait were significantly larger in austral spring and summer than those in austral fall and winter, indicating that MCDW played a more important role in determining the seasonal variability of currents in this area (Figure 6). The depth-mean currents in the southwestern and northeastern ends, which were respectively dominated by MCDW and BDW, showed relatively weak seasonal changes (Figure 6).
The spatial changes of depth-mean currents were also significant (Figures 5, 6). The major axes of variance ellipses were much larger than the mean currents. The variations could be induced by small-mesoscale topographic features in a subarea, or by coastal waves and meteorological forcing. The ellipticity at the southwestern entrance of the strait was the largest reflecting the complexity of upstream forcing in the Bismarck and Flandres Straits. In the Gerlache Strait, the major axes of variance ellipses were oriented in parallel to the axis of the deep channel, and ellipticities were small reflecting the side-wall limitation on the current directions.
Seasonal Variations in the Two-Layer Flows
The currents in the Gerlache Strait exhibited the characteristics of a two-layer flow predominantly consisting of MCDW from the southwest and BSW from the northeast (Figures 9–11). The
upper layer current was typically dominant, whereas the lower layer current was relatively small compensated by the depth-mean current (Figure 9). The MCDW at the southwestern entrance of the strait was in turn determined by onshelf intrusions of CDW, which were further associated with south–north wobbling of the southern boundary of Antarctic Circumpolar Current and the wind field (Zhou et al., 2013). The southwestward currents in the lowery layer were associated with the southwestward Sverdrup transport in the Bransfield Strait resulting from the local wind stress curl (Zhou et al., 2006). As such, the reversing of mean southwestward currents in the Gerlache Strait could be driven by either weakening of the MCDW or strengthening of Sverdrup transport in the Bransfield Strait.
The maximum depth affected by MCDW reached to 200 and 300 m in fall–winter and spring–summer periods, respectively. The MCDW occupied a great depth range; the waters in the Flandres, Andvord, and Wilhelmina Bays were dominated by the intruding MCDW. In the north, the waters in the Charlotte Bay contained significant amount of BSW (Espinasse et al., 2012; Cleary et al., 2016). In spring and summer, the currents were dominantly northeastward and there was a lack of BSW or a mixture between the WW and BSW in the Gerlache Strait. The two layers were dominated by the intruding MCDW (Figures 9, 11). Both of the WW and BSW had relatively high DO concentrations because both of them were in contact with atmosphere and formed by fall–winter surface cooling and vertical convection processes. The northeastward intrusions of MCDW were reduced in fall and winter seasons accompanying a southwestward flow in the bottom layer of the BSW. Because the BSW occupied the layer deeper than 300 m, the southwestward flow of BSW was blocked by the shallow sill less than 300 m at the southwestern entrance of the Gerlache Strait. However, the mean currents during winter seasons were reversed southwestward before 2005.
The blockage of the sill to BSW overflow at the southwestern entrance of the Gerlache Strait was analyzed by using a two-layer model with the upper layer between the surface and the sill depth (h1, 0–300 m) and the lower layer between the sill depth and the bottom (h2, 300–700 m) in the Gerlache Strait (Figure 12A). Froude number (Fr=u/c) was defined as the ratio of current speed to internal wave speed [Eq.(6)] (Cummins et al., 2006; Hager and Castro-Orgaz, 2017; Tanaka et al., 2021)
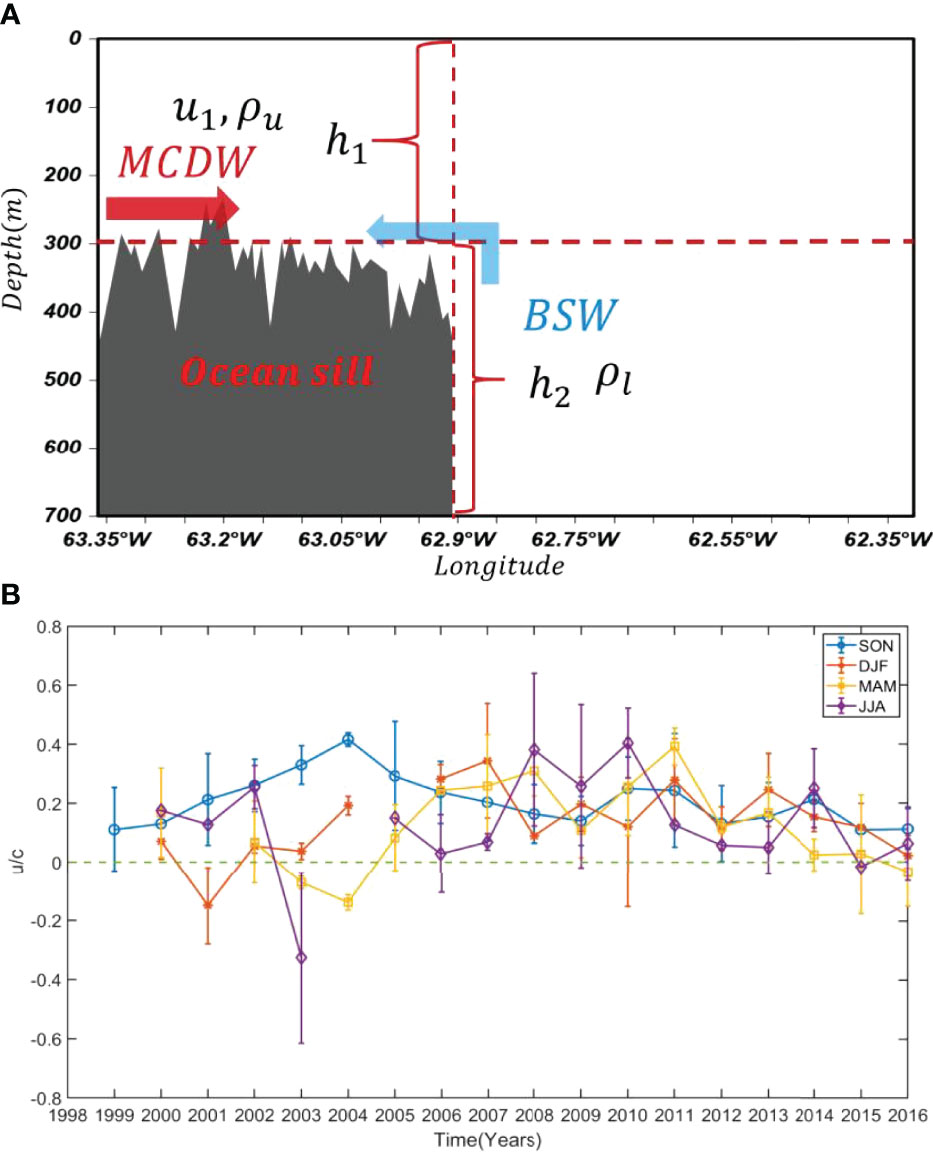
Figure 12 (A) The schematic of the two-layer flow in the Gerlache Strait. u1 is the velocity of the upper layer, and ρu and ρl are the mean density of the upper and lower layers, respectively. h1 and h2 are the mean thickness of the upper and lower layers, respectively. c is the internal wave speed at the interface between the upper and lower layers. The thick red arrow and blue arrow represent the movements of MCDW and BSW, respectively. (B) The ratio between current velocity (u1 ) of the upper layer and internal wave speed (c). The vertical bars represent the variance of the ratio in each season from 1999 to 2016.
where g = 9.8 N kg−1 was the acceleration of gravity, and ρu = 1027.6 kg m−3 and ρl = 1027.8 kg m−3 are the mean density of the upper and lower layers, respectively. When Fr was larger than one, the water mass from the lower layer was not able to overflow to the other side of the sill out of the Gerlache Strait. When Fr was lower than one, the internal waves propagated toward the sill and potentially produced overflow of the BSW into the Flanders Bay region. The ratio of the mean current velocity (u1) in the upper layer to internal wave velocity (c) was computed (Figure 12B). Fr was always lower than one in all seasons from 1999 to 2016. It indicated that BSW could overflow to the sill mixed with MCDW in the southwest of Gerlache Strait in every season.
Long-Term Trends
There were decadal variability existing in the seasonal mean currents (Figures 3, 4). Overall, the northeastward currents associated with the MCDW intrusion increased in the period between 2000 and 2011, and decreased afterwards. In austral spring, the northeastward MCDW intrusion currents were increased continuously until 2011; in austral summer to fall, the intruding currents beared significant interannual variability throughout our study period; in austral winter, the intruding currents beared the largest change, characterized by the strongest northeastward currents (0.15 m s−1) in 2014 that were reversed to the strongest southwestward currents (−0.08 m s−1) in 2015.
Many studies indicated a warming trend in the WAP region associated with a positive trend of SAM (Dinniman et al., 2012; Zhang et al., 2020). Enhanced intrusions of the warm CDW onto the WAP shelves should hypothetically lead to a warmer WAP region and the stronger northeastward Gerlache Strait Current. Thus, the correlation between the along-strait current and SAM was analyzed. Monthly SAM index data were obtained from the online database established by the Natural Environmental Research Council British Antarctic Survey (http://www.nerc-bas.ac.uk/icd/gima/sam/html; Marshall, 2003). Seasonal variations of SAM were calculated based on the average values observed during the austral spring (SON), summer (JJA), and autumn (MAM) for the years 1999–2016 and during the summer (December–February) where values from December of the prior year were averaged with those from January and February in the year of each survey. As shown in Figure 13, there were no significant correlations between SAM and the GSC in the four seasons from 1999 to 2016. However, positive correlations between SAM and GSC were found from 2000 to 2010 in austral spring (R = 0.56, P = 0.06) and from 2000 to 2011 (2007 excluded) in austral fall (R = 0.54, P = 0.09). This indicates that there were decadal and seasonal variations in the relations between GSC and SAM, which could be built up by the relationship between the onshelf CDW intrusion and SAM. Such relationship and temporal variations are worthy of explorations in future work.
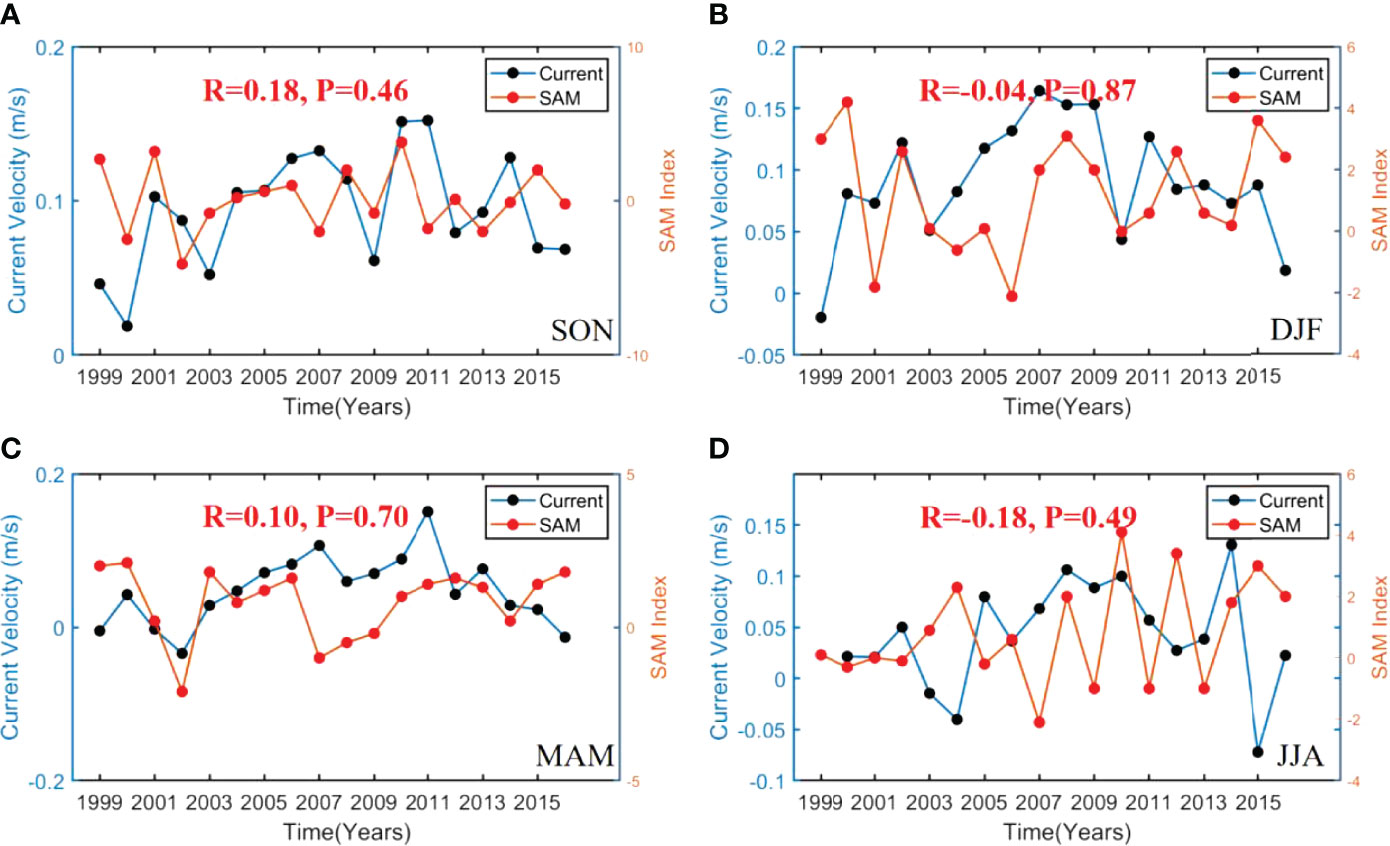
Figure 13 The correlation analysis of seasonal mean along-strait current and SAM for (A) austral spring, (B) austral summer, (C) austral fall and (D) austral winter. The blue line indicates the current velocity and the orange line indicates the SAM index. R is correlation coefficient and P is the value of significance test.
Summary
The means, seasonal variations, and long-term trends of the currents in the Gerlache Strait had been analyzed based on ADCP data available at JASADCP between 1999 and 2016. The mean currents were predominantly northeastward representing an overall MCDW intrusion from the southwestern entrance of the strait and an exit in the northeast of the strait. The seasonal mean currents exhibited significant variations and long-term trends. In austral spring, the currents increased continuously until 2011; in austral summer to fall, the intruding currents were featured by large variations; in austral winter, the intruding currents beared the largest change, which were characterized by northeastward currents in 2014 reversed to southwestward currents in 2015. The means, seasonal variations, and long-term trends were strongly tied with water masses analysis presented in the Gerlache Strait based on the database of NAPv1.0 from1990 to 2019. The seasonal mean currents were the strongest in austral spring summer, weaker or even reversed in austral fall, and weakest in austral winter. It was consistent with the seasonal variation of MCDW intrusion indicating that the primary driven mechanism of GSC was MCDW intrusion. The seasonal mean currents increased in the period between 1999 and 2011, and decreased afterward, which reflected the long-term trend of the MCDW intrusion. The two-layer circulation in the strait was primarily affected by the MCDW intrusion in the upper layer from the southwest and the BSW intrusion in the lower layer from the northeast of the Gerlache Strait. Based on the results of Froude number, BSW could overflow to the sill mixed with MCDW in the southwest of Gerlache Strait during long-term investigation. The local heating and cooling processes and freshwater input from precipitation and melting sea ice water affected the ASW and WW in the strait. The northeastward warm MCDW intrusion was the primary heat source in the region, determining the cold or warm phase and affecting sea ice formation with the southwestward BSW intrusion. Moreover, the decadal and seasonal variations in the relations between GSC and SAM were found, and the relationship and temporal variations were worthy of explorations in future.
The Gerlache Strait is well known as a biological hot spot where super aggregations of Antarctic krill, mammals, and birds have been found. The environmental and ecosystem settings in the strait and its embayments are fundamentally determined by intrusions of the warm MCDW and cold BSW. More importantly in austral fall and winter seasons, large numbers of krill, mammals, and birds aggregate in the strait and its embayments. Their survivorship during austral winter season greatly depends on the open water for mammals and birds to access, and also on the transport of biota for krill to feed. Thus, the balance between the MCDW and BSW sets the warm or cold phase of the environment, sea ice formation, and transport of biota during austral winter season.
Data Availability Statement
The original contributions presented in the study are included in the article/Supplementary Material. Further inquiries can be directed to the corresponding authors.
Author Contributions
ZS: Software, Validation, Formal analysis, Writing – Original Draft, Visualization. ZZ: Data Curation, Writing – Review & Editing, Funding acquisition. YZ: Investigation, Data Curation, Resources. MZ: Conceptualization, Methodology, Data Curation, Investigation, Writing – Review & Editing, Funding acquisition, Project administration. All authors contributed to the article and approved the submitted version.
Funding
This work is funded by the National Natural Science Foundation of China (Grant No. 41941008 and 41876221), the Impact and Response of Antarctic Seas to Climate Change (Grant 583 No: IRASCC 1-02-01B), the National Key Research and Development Program of China (Grant No. 2019YFC1509102), the Shanghai Science and Technology Committee (Grant No. 20230711100 and Grant No. 21QA1404300), the Shanghai Frontiers Science Center of Polar (SFSCP), and the Shanghai Key Laboratory of Polar Life and Environment Sciences (Grant No. 21DZ2260100). The field data was collected under the support from the US National Science Foundation (Grant #: ANT-0739566, ANT-1142082) to MZ. Also, we appreciated the anonymous reviewers for insightful comments and suggestions to improve this manuscript.
Conflict of Interest
The authors declare that the research was conducted in the absence of any commercial or financial relationships that could be construed as a potential conflict of interest.
Publisher’s Note
All claims expressed in this article are solely those of the authors and do not necessarily represent those of their affiliated organizations, or those of the publisher, the editors and the reviewers. Any product that may be evaluated in this article, or claim that may be made by its manufacturer, is not guaranteed or endorsed by the publisher.
Supplementary Material
The Supplementary Material for this article can be found online at: https://www.frontiersin.org/articles/10.3389/fmars.2022.877043/full#supplementary-material
References
Beardsley R. C., Limeburner R., Owens W. B. (2004). Drifter Measurements of Surface Currents Near Marguerite Bay on the Western Antarctic Peninsula Shelf During Austral Summer and Fall 2001 and 2002. Deep-Sea. Res. II. 51, 1947–1964. doi: 10.1016/j.dsr2.2004.07.031
Brinton E. (1991). Distribution and Population Structures of Immature and Adult Euphausia Superba in the Western Bransfield Strait Region During the 1986–87 Summer. Deep-Sea. Res. II. 38, 1169–1194. doi: 10.1016/0198-0149(91)90101-K
Brinton E., Townsend A. (1991). Development Rates and Habitat Shifts in the Antarctic Neritic Euphausiid Euphausia Crystallorophias 1986–87. Deep-Sea. Res. II. 38, 1195–1211. doi: 10.1016/0198-0149(91)90102-L
Cleary A. C., Durbin E. G., Casas M. C., Zhou M. (2016). Winter Distribution and Size Structure of Antarctic Krill, Euphausia Superba, Populations in-Shore in the West Antarctic Peninsula. Mar. Ecol. Prog. Ser. 552115–129 doi: 10.3354/meps11772
Cook A. J., Holland P. R., Meredith M. P., Murray T., Luckman A., Vaughan D. G. (2016). Ocean Forcing of Glacier Retreat in the Western Antarctic Peninsula. Science 353, 283–286. doi: 10.1126/science.aae0017
Cummins P. F., Armi L., Vagle S. (2006). Upstream Internal Hydraulic Jumps. J. Phys. Oceanogr. 36 (5), 753–769. doi: 10.1175/JPO2894.1
Dinneman M. S., Klinck J. M. (2004). A Model Study of Circulation and Cross-Shelf Exchange on the West Antarctic Peninsula Continental Shelf. Deep-Sea. Res. II. 51, 2003–2022. doi: 10.1016/j.dsr2.2004.07.030
Dinniman M. S., Klinck J. M., Hofmann E. E. (2012). Sensitivity of Circumpolar Deep Water Transport and Ice Shelf Basal Melt Along the West Antarctic Peninsula to Changes in the Winds. J. Climate 25 (14), 4799–4816. doi: 10.1175/JCLI-D-11-00307.1
Dorland R. D., Zhou M. (2008). Circulation and Heat Fluxes During the Austral Fall in George Vi Sound, Antarctic Peninsula. Deep. Sea. Res. Part II.: Topical. Stud. Oceanogr. 55 (3-4), 294–308. doi: 10.1016/j.dsr2.2007.01.014
Dotto T. S., Mata M. M., Kerr R., Garcia C. A. E. (2021). A Novel Hydrographic Gridded Data Set for the Northern Antarctic Peninsula. Earth Syst. Sci. Data 13, 671–696. doi: 10.5194/essd-13-671-2021
Ducklow H. W. (2008). Long-Term Studies of the Marine Ecosystem Along the West Antarctic Peninsula. Deep-Sea. Res. Part II. 55 (18-19), 1945–1948. doi: 10.1016/j.dsr2.2008.05.014
Ducklow H. W., Fraser W. R., Meredith M. P., Stammerjohn S. E., Doney S. C., Martinson D. G., et al. (2013). West Antarctic Peninsula: An Ice-Dependent Coastal Marine Ecosystem in Transition. Oceanography 26 (3), 190–203. doi: 10.5670/oceanog.2013.62
Du G., Zhang Z., Zhou M., Zhu Y., Zhong Y. (2018). The Upper 1000-M Slope Currents North of the South Shetland Islands and Elephant Island Based on Ship Cruise Observations. J. Ocean. Univ. China 17 (2), 420–432. doi: 10.1007/s11802-018-3353-9
Espinasse B., Zhou M., Zhu Y., Hazen E. L., Friedlaender A. S., Nowacek, et al. (2012). Austral Fall-Winter Transition of Mesozooplankton Assemblages and Krill Aggregations in an Embayment West of the Antarctic Peninsula. Mar. Ecol. Prog. 452 (1), 63–80. doi: 10.3354/meps09626
Ferreira A., Costa R. R., Dotto T. S., Kerr R., Mendes C. R. (2020). Changes in Phytoplankton Communities Along the Northern Antarctic Peninsula: Causes, Impacts and Research Priorities. Front. Mar. Sci. 7. doi: 10.3389/fmars.2020.576254
Firing E., Hummon J. M. (2010). “Ship-Mounted Acoustic Doppler Current Profilers,” in The GO-SHIP Repeat Hydrography Manual: A Collection of Expert Reports and Guidelines. Eds. Hood E. M., Sabine C. L., Sloyan B. M. (ICPO Publication Series Number 134). IOCCP Report Number 14.
Firing E., Hummon J. M., Chereskin T. K. (2012). Improving the Quality and Accessibility of Current Profile Measurements in the Southern Ocean. Oceanography 25 (3) , 164-165. doi: 10.5670/oceanog.2012.91
Garcia M. A., Lopez O., Sospedra J., Espino M., Gracia V., Morrison G., et al. (1994). Mesoscale Variability in the Bransfield Strait Region (Antarctica) During Austral Summer. Annales. Geophysicae. 12, 856–867. doi: 10.1007/s00585-994-0856-z
Hager W. H., Castro-Orgaz O. (2017). William Froude and the Froude Number. J. Hydraulic. Eng. 143 (4), 02516005.1–02516005.9. doi: 10.1061/(ASCE)HY.1943-7900.0001213
Hendry K. R., Meredith M. P., Ducklow Hugh W. (2018). The Marine System of the West Antarctic Peninsula: Status and Strategy for Progress. Philos. Trans. R. Soc Math. Phys. Eng. Sci. 376, 20170179. doi: 10.1098/rsta.2017.0179
Hofmann E. E., Klinck J. M., Lascara C. M., Smith D. A. (1996). “Water Mass Distribution and Circulation West of the Antarctic Peninsula and Including Bransfield Strait,” in Foundations for Ecological Research West of the Antarctic Peninsula, Antarctic Res. Ser. Eds. Ross R. M., Hofmann E. E., Quetin L. B. (AGU, Washington, DC), 61–80. doi: 10.1098/rsta.2017.0179
Hofmann E. E., Wiebe P. H., Costa D. P., Torres J. J. (2004). An Overview of the Southern Ocean Global Ocean Ecosystems Dynamics Program. Deep-Sea. Res. Part II. 51 (17-19), 1921–1924. doi: 10.1016/j.dsr2.2004.08.007
Huntley M. E., Brinton E. (1991b). Mesoscale Variation in Growth and Early Development of Euphausia Superba Dana in the Western Bransfield Strait Region. Deep-Sea. Res. II. 38, 1213–1240. doi: 10.1016/0198-0149(91)90103-M
Huntley M. E., Karl D. M., Niiler P. P., Holm-Hansen O. (1991a). Research on Antarctic Coastal Ecosystem Rates (RACER): An Interdisciplinary Field Experiment. Deep-Sea. Res. Part A. 38, 911–941. doi: 10.1016/0198-0149(91)90090-3
Huntley M. E., Niiler P. P. (1995). Physical Control of Population Dynamics in the Southern Ocean. ICES. J. Mar. Sci. 52, 457–468. doi: 10.1016/0198-0149(91)90100-T
Kerr R., Mata M. M., Mendes C. R. B., Secchi E. R. (2018). “Northern Antarctic Peninsula: A Marine Climate Hotspot of Rapid Changes on Ecosystems and Ocean Dynamics,” in Deep Sea Res. Part II Top. Stud. Oceanogr., Oceanographic Processes and Biological Responses Around Northern Antarctic Peninsula: A 15-Year Contribution of the Brazilian High Latitude Oceanography Group, 4–9. doi: 10.1016/j.dsr2.2018.05.006
Marshall G. J. (2003). Trends in the Southern Annular Mode From Observations and Reanalyses. J. Clim. 16, 4134–4143. doi: 10.1175/1520-0442(2003)0162.0.CO;2
Meredith M. P., King J. C. (2005). Rapid Climate Change in the Ocean West of the Antarctic Peninsula During the Second Half of the 20th Century. Geophys. Res. Lett. 32. , 1-5 doi: 10.1029/2005GL024042
Meredith M. P., Stefels J., van Leeuwe M. (2017). Marine Studies at the Western Antarctic Peninsula: Priorities, Progress and Prognosis. Deep. sea. Res. Part II. Top. Stud. Oceanogr. 139, 1–8. doi: 10.1016/j.dsr2.2017.02.002. Advances in understanding the marine system west of the Antarctic Peninsula.
Moffat C., Meredith M. (2018). Shelf–Ocean Exchange and Hydrography West of the Antarctic Peninsula: A Review. Philos. Trans. R. Soc. A. Math. Rttttphysical. Eng. Sci. 376 (2122), 20170164. doi: 10.1098/rsta.2017.0164
Moreau S., Mostajir B., Belanger S., Schloss I. R., Vancoppenolle M., Demers S., et al. (2015). Climate Change Enhances Primary Production in the Western Antarctic Peninsula. Global Change Biol. 21, 2191–2205. doi: 10.1111/gcb.12878
Niiler P. P., Amos A. F., Hu J. H. (1991). Water Masses and 200 M Relative Geostrophic Circulation in the Western Bransfield Strait Region. Deep-Sea. Res. II. 38, 943–959. doi: 10.1016/0198-0149(91)90091-S
Niiler P. P., Illeman J., Hu J. H. (1990). RACER: Lagrangian Drifter Observations of Surface Circulation in the Gerlache and Bransfield Straits. Antarctic. J. United. States 25, 135–137.
Nowacek D. P., Friedlaender A. S., Halpin P. N., Hazen E. L., Johnston D. W., Read A. J., et al. (2011). Super-Aggregations of Krill and Humpback Whales in Wilhelmina Bay, Antarctic Peninsula. PLoS One 6 (4), e19173. doi: 10.1371/journal.pone.0019173
Padman P., Fricker H. A., Coleman R., Howard S., Erofeeva L. (2002). A New Tide Model for the Antarctic Ice Shelves and Seas. Ann. Glaciology. 34, 247–254. doi: 10.3189/172756402781817752
Savidge D. K., Amft J. A. (2009). Circulation on the West Antarctic Peninsula Derived From 6 Years of Shipboard ADCP Transects. Deep-Sea. Res. I. 56, 1633–1655. doi: 10.1016/j.polar.2021.100695
Schultz C., Doney S. C., Hauck J., Kavanaugh M. T., Schofield O. (2021). Modeling Phytoplankton Blooms and Inorganic Carbon Responses to Sea-Ice Variability in the West Antarctic Peninsula. J. Geophysical. Research.: Biogeosciences. 126, 4. doi: 10.1029/2020JG006227
Selz V., Lowry K. E., Lewis K. M., Joy-Warren H. L.others (2018). Distribution of Phaeocystis Antarctica-Dominated Sea Ice Algal Communities and Their Potential to Seed Phytoplankton Across the Western Antarctic Peninsula in Spring. Mar. Ecol. Prog. Ser. 586, 91–112. doi: 10.3354/meps12367
Shepherd A., Wingham D., Rignot E. (2004). Warm Ocean is Eroding West Antarctic Ice Sheet, Geophys. Res. Lett. 31. doi: 10.1029/2004GL021106
Tanaka T., Hasegawa D., Okunishi T., Kaneko H., Ono T. (2021). Internal Hydraulic Jump in the Tsugaru Strait. J. Oceanogr., 77, 215–228. doi: 10.1007/s10872-020-00588-w
Vaughan D. G., Marshall G. J., Connolley W. M., Parkinson C., Mulvaney R., Hodgson D. A., et al. (2003). Recent rapid regional climate warming on the antarctic peninsula. Climatic Change. 60 (3), 243–274 doi: 10.1023/A:1026021217991
Zhang Z., Hofmann E. E., Dinniman M. S., Reiss C., Zhou M. (2020). Linkage of the Physical Environments in the Northern Antarctic Peninsula Region to the Southern Annular Mode and the Implications for the Phytoplankton Production. Prog. In. Oceanogr. 188, 102416. doi: 10.1016/j.pocean.2020.102416
Zhou M. (1998). An Objective Interpolation Method for Spatiotemporal Distribution of Marine Plankton. Mar. Ecol. Prog. Ser. 174, 197–206. doi: 10.3354/meps174197
Zhou M.Niiler P. P.Zhu Y.Dorland R. D. (2006). The western boundary current in551 the Bransfield strait, Antarctica. Deep Sea Research Part I, 53 (7), 1244–1252.552. doi: 10.1016/j.dsr.2006.04.003
Zhou M., Dorland R. D. (2004). Aggregation and Migration Behavior of Euphausia Superba. Deep. Sea. Res. II. 51, 2118–2138. doi: 10.1016/j.dsr2.2004.07.009
Zhou M., Niiler P. P., Hu J. H. (2002). Surface Currents in the Bransfield and Gerlache Straits, Antarctica. Deep. Sea. Res. Part I. 49 (2), 267–280. doi: 10.1016/S0967-0637(01)00062-0
Keywords: Gerlache Strait, mean currents, currents ellipses, antarctic ecosystem, warm-cold phase shifts
Citation: Su Z, Zhang Z, Zhu Y and Zhou M (2022) Long-Term Warm–Cold Phase Shifts in the Gerlache Strait, Western Antarctic Peninsula. Front. Mar. Sci. 9:877043. doi: 10.3389/fmars.2022.877043
Received: 16 February 2022; Accepted: 30 May 2022;
Published: 06 July 2022.
Edited by:
Stephen Rintoul, Commonwealth Scientific and Industrial Research Organisation (CSIRO), AustraliaReviewed by:
Giovanni Daneri, Patagonian Ecosystems Investigation Research Center (CIEP), ChileKeishi Shimada, Tokyo University of Marine Science and Technology, Japan
Copyright © 2022 Su, Zhang, Zhu and Zhou. This is an open-access article distributed under the terms of the Creative Commons Attribution License (CC BY). The use, distribution or reproduction in other forums is permitted, provided the original author(s) and the copyright owner(s) are credited and that the original publication in this journal is cited, in accordance with accepted academic practice. No use, distribution or reproduction is permitted which does not comply with these terms.
*Correspondence: Meng Zhou, bWVuZy56aG91QHNqdHUuZWR1LmNu; Zhaoru Zhang, enJ6aGFuZ0BzanR1LmVkdS5jbg==