 Sang-Bin Lee1
 Sang-Wook Yeh
 Young-Gyu Park
 Sang-Yoon Jun
 Hyun-Su Jo
- 1Department of Marine Sciences and Convergent Technology, Hanyang University, ERICA, Ansan, South Korea
- 2Korea Institute Ocean Science and Technology, Pusan, South Korea
- 3Korea Polar Research Institute, Incheon, South Korea
- 4Department of Oceanography, Chonnam National University, Gwangju, South Korea
By analyzing the European Centre for Medium-Range Weather Forecasts reanalysis version 5 (ERA5) dataset, we found increased frequency of marine heatwaves (MHWs) in East Asian marginal seas (EAMS) during the boreal summer (June-July-August) in the recent past. To examine which processes are responsible for the upward trend of MHW occurrence, we performed three numerical simulations using Modular Ocean Model version 5 (MOM5) forced by ERA5 dataset. The first experiment used historical atmospheric variables to force the MOM5 for 1982 to 2020, which reasonably simulated the upward trend of MHWs as well as its dominant variability in terms of temporal and spatial structure in EAMS. The second (third) experiment is the same as in the first except that the atmosphere variables used to force the MOM5 consisted of thermodynamic (dynamic) variables only. The upward trend of MHW occurrence in EAMS is simulated in the first and the second experiment only. We argue that the atmosphere thermodynamic processes, in particular, the shortwave radiative forcing, play a key role in inducing the upward trend of MHW occurrence in EAMS during the boreal summer compared to the ocean dynamic processes.
Introduction
Marine heatwaves (MHWs) refer to a phenomenon in which sea surface temperature (SST) rises rapidly in a short period of time and persists from several days to several months (Hobday et al., 2016). MHWs devastate the marine ecosystem and disturb the supply of nutrients, reducing the biomass of marine organisms (McWilliams et al., 2005; Wernberg et al., 2013; Frolicher and Laufkotter, 2018). Concurrently, they can result in huge economic loss in the fishing industry and secondary damage to the marginal seas. Like the increase in occurrence of extreme climate events, it is expected that the occurrence of MHWs will continue to increase with climate warming (Meehl et al., 2000) due mainly to increase in mean SST (Li et al., 2019).
The occurrence of MHWs also has been observed at the regional scale, including in the North Pacific. In particular, the East Asia Marginal Seas (EAMS), including the East China Sea, South China Sea, and Yellow Sea, experience more rapid mean sea surface temperature (SST) warming than that in any other ocean region (Belkin, 2009; Oliver et al., 2018; Kim et al., 2018; Li et al., 2019). It has been reported that the MHWs that occurred near the Yellow Sea and East China Sea between 2016 and 2018 were due mainly to increase in shortwave radiation and warm water ocean advection along with reduced wind speeds in the surface layer (Gao et al., 2020). Using empirical orthogonal function (EOF) analysis, on the other hand, Lee et al. (2020) presented two main modes for explaining the variability in MHW occurrence in EAMS and argued that they are associated with El Niño and Southern Oscillation (ENSO) and the associated atmospheric teleconnections from the tropics to East Asia.
Despite a wealth of studies on individual MHW events in EAMS, few have examined the relative roles of atmosphere thermodynamic and ocean dynamic processes on the upward trend in MHW occurrence in EAMS. Identification of the processes that plays a key role in increasing the occurrence of MHWs in EAMS would help to predict them correctly in the present climate and to discern possible occurrence patterns in future climates. The purpose of this study is to understand the roles of atmosphere thermodynamic and ocean dynamic processes in the increase of MHWs occurrence in EAMS based on an ocean general circulation model (OGCM) experiment. We focused on the occurrence of MHWs during boreal summer (June-July-August, hereafter, JJA) because there is a high potential of severe impacts due to thermal tolerances exceeding those of other seasons. It is known that the MHW events during JJA have led to sometimes devastating impacts on sea life including the mortality of sea animals, critically reduced ocean primary productivity, and changes in biological species (Kintisch, 2015; Cavole et al., 2016). Unless stated otherwise in the text, the results are for the JJA season only.
The rest of the paper is organized as follows. Section 2 presents model experiments using an OGCM forced by an atmospheric dataset. Section 3 provides the main results based on the model experiments as well as the reanalysis datasets to examine the roles of atmosphere thermodynamic and ocean dynamic processes. A final summary is given in section 4.
Data Sets and Methods
Reanalysis Data
We used daily SST data obtained from the European Centre for Medium-Range Weather Forecasts reanalysis version 5 (ERA5) with a 1° × 1° horizontal fine resolution for the period of 1982 to 2020 (Hersbach et al., 2020). The SST dataset in ERA5 is originally taken from the Operational Sea Surface Temperature and Ice Analysis (OSTIA) (Minnett et al., 2001). Additional data, including surface net shortwave flux, longwave flux, latent heat, sensible heat, zonal and meridional winds at a height of 10 m, geopotential height at 850 hPa and outgoing longwave radiation(OLR), were sourced and analyzed from the ERA5 datasets. The data were compared with the results simulated by the OGCM. We also used data on potential temperature; mixed layer depth; and zonal, meridional, and vertical currents obtained from the NCEP Global Ocean Data Assimilation System (GODAS) to analyze the heat budget.
Model Experiment
We used the Modular Ocean Model version 5 (MOM5) with a 2-hour integration time step (Griffies et al., 2009; Adcroft et al., 2019). The MOM5 is a numerical model of hydrostatic primitive equations with 1°Cx1°C high resolution which can resolve the ocean boundary currents and shelf processes well in some regions. It has 360 longitudinal grid cells that are evenly distributed, 200 latitudinal grid cells with enhanced resolution in the tropics (1/3° equatorward of 30° N/S), and 50 vertical levels at 10m intervals in the upper 22 levels. The MOM5 involves a freshwater flux exchange between the ocean and the atmosphere (Zhang and Shu, 2010), and the vertical mixing, penetration of shortwave radiation into the ocean, etc. are parameterized (Griffies et al., 2005). Insolation varied from day to day, and wind pressure at the ocean surface was calculated using the wind speed relative to that of the current flowing over the surface. An efficient time-stepped system was adopted (Griffies et al., 2005). The MOM5 sea ice simulator is a dynamic ice model consisting of three vertical layers and five ice thickness categories.
To obtain the atmospheric variables to force the MOM5, we used the ERA5 dataset for 1982 to 2020. The atmospheric variables with their time intervals are displayed in Table 1. The ERA5 atmospheric datasets were fitted to a horizontal resolution of 1.875° × 1.875° to force the MOM5. We conducted three experiments, Exp_CTL, Exp_THER, and Exp_DYN (see Table 2). Exp_CTL is a control experiment in which all atmospheric variables to force the MOM5 were historical from 1982 to 2020. Exp_THER is the same as Exp_CTL except using climatological (1982-2020) mean dynamic variables of zonal wind at 10 m, meridional wind at 10 m, and sea level pressure (SLP) to force the MOM5. Exp_DYN is the same as Exp_CTL except using climatological mean thermodynamic variables of air temperature at 2 m, precipitation, downward radiation (shortwave and longwave), and specific humidity to force the MOM5
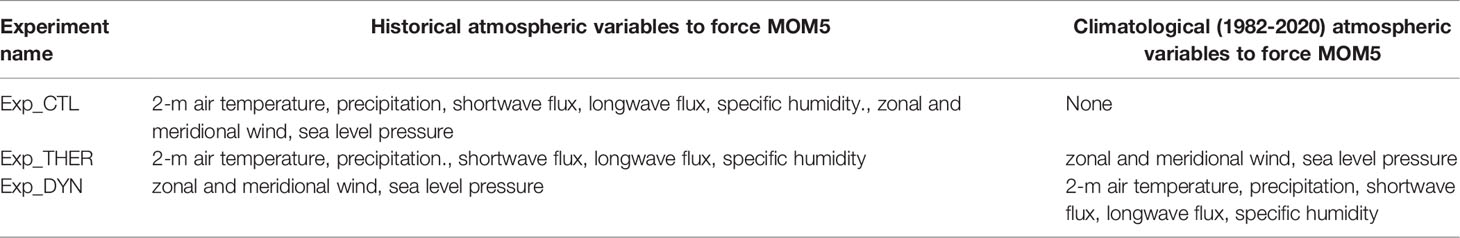
Table 1 Time scales of atmospheric forcing variables used in the three experiments.
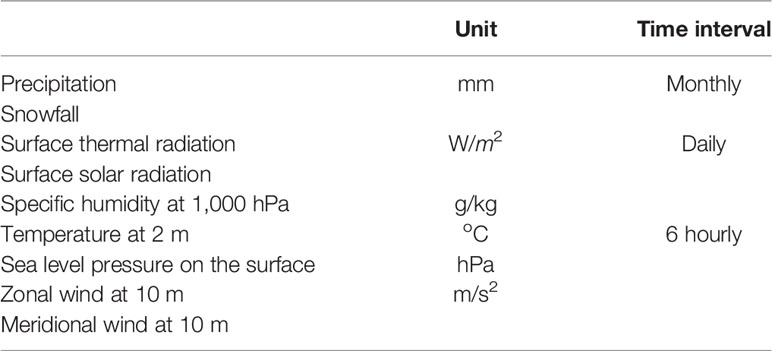
Table 2 Time and unit format of the atmospheric forcing variables file entered into the MOM5 model as input.
Definition of Marine Heatwaves
MHWs were defined based on the methodology of Hobday et al. (2016) and were identified by daily SSTs that exceeded the 90th percentile threshold above a daily varying climatology (1982-2020) for at least five consecutive days. In addition, if there is a time interval of 2 days or less between one event and the next, they are grouped as one event, rather than as separate event. We defined MHW days as the total number of occurrences of MHWs during JJA in each year. The same definition of MHWs was applied to the daily SST simulated from the OGCM experiments of Exp_CTL, Exp_THER, and Exp_DYN. That is, we used the same SST climatology for the three different experiments to define MHWs to directly compare with the simulated MHWs in each experiment. It should be noted that the main result does not change when we use its own SST climatology in each experiment. The 90th percentile threshold above a daily varying climatology obtained from Exp_CTL was applied to both Exp_THER and Exp_DYN to define the MHWs in these experiments.
Heat Budget Analysis
To explore the role of thermodynamic and ocean dynamic processes on the occurrence of MHWs simulated in MOM5, we conducted heat budget analysis using the following SST budget equation (Kang et al., 2001):
where ρ (1,024 kg/m3) is ocean density, Cp (= 4,200 J/kg oC) is specific heat capacity at constant pressure, and D represents the mixed layer depth simulated at each grid point. The mixed layer depth is defined according to the density criterion in the MOM5 model, in which the potential density difference relative to that of the surface was less than 0.03 kg/m3. The SST in the above equation is defined as the average ocean temperature from the surface to the mixed layer depth, and the residual term is obtained by subtracting the sum of surface net heat flux and the advection terms including the entrainment term from the SST change term. The residual term mentioned here refers to a component that could not be captured during heat budget analysis, i.e., an ocean-mixing term (Jo et al., 2019). This term encompasses physical quantities, such as diffusion or eddy-driven transport, and includes heat exchange by sub–grid-scale advection (Karsten et al., 2002; Foltz et al., 2003; Marshall and Beninati, 2003; Cook et al., 2018).
Results
MHWs in EAMS in the ERA5 Datasets
Figure 1A displays the time series of MHW occurrence frequency (hereafter, occurrence) averaged in EAMS (115°~135°E and 25°~45°N) for 1982 to 2020 in the ERA5 datasets. The most striking feature is that the occurrence of MHWs is increasing in EAMS as time progresses, and its linear trend is 0.013/year, which is statistically significant at the 95% confidence level. The year when the occurrence of MHWs was the highest and its duration was the longest was 2017, consistent with the results of previous studies (Gao et al., 2020; Lee et al., 2020). Recent studies suggested that a running climatology or detrended timeseries are better than a static one to separate the effect of global warming with the increase of MHW occurrences (Frolicher et al., 2018). Figure 1B is the same as Figure 1A after removing the climatological (1982–2020) mean and the linear trend. Without a linear trend, the occurrence of MHWs is characterized by its variability on interannual-to-decadal timescales. Indeed, the most dominant period in the occurrence time series is about 3.25 year based on the spectral analysis (Figure 1C), implying that the interannual variability of MHW frequency in EAMS is more prominent than decadal timescales. In spite of that, one may find that the occurrence of MHWs was suppressed from the early 2000s to the early 2010s, which is in contrast to the increasing period from the mid-1990s to the 2000s (Figure 1B). This result implies that the natural internal variability on the low-frequency timescales may influence the occurrence of MHW in EAMS.
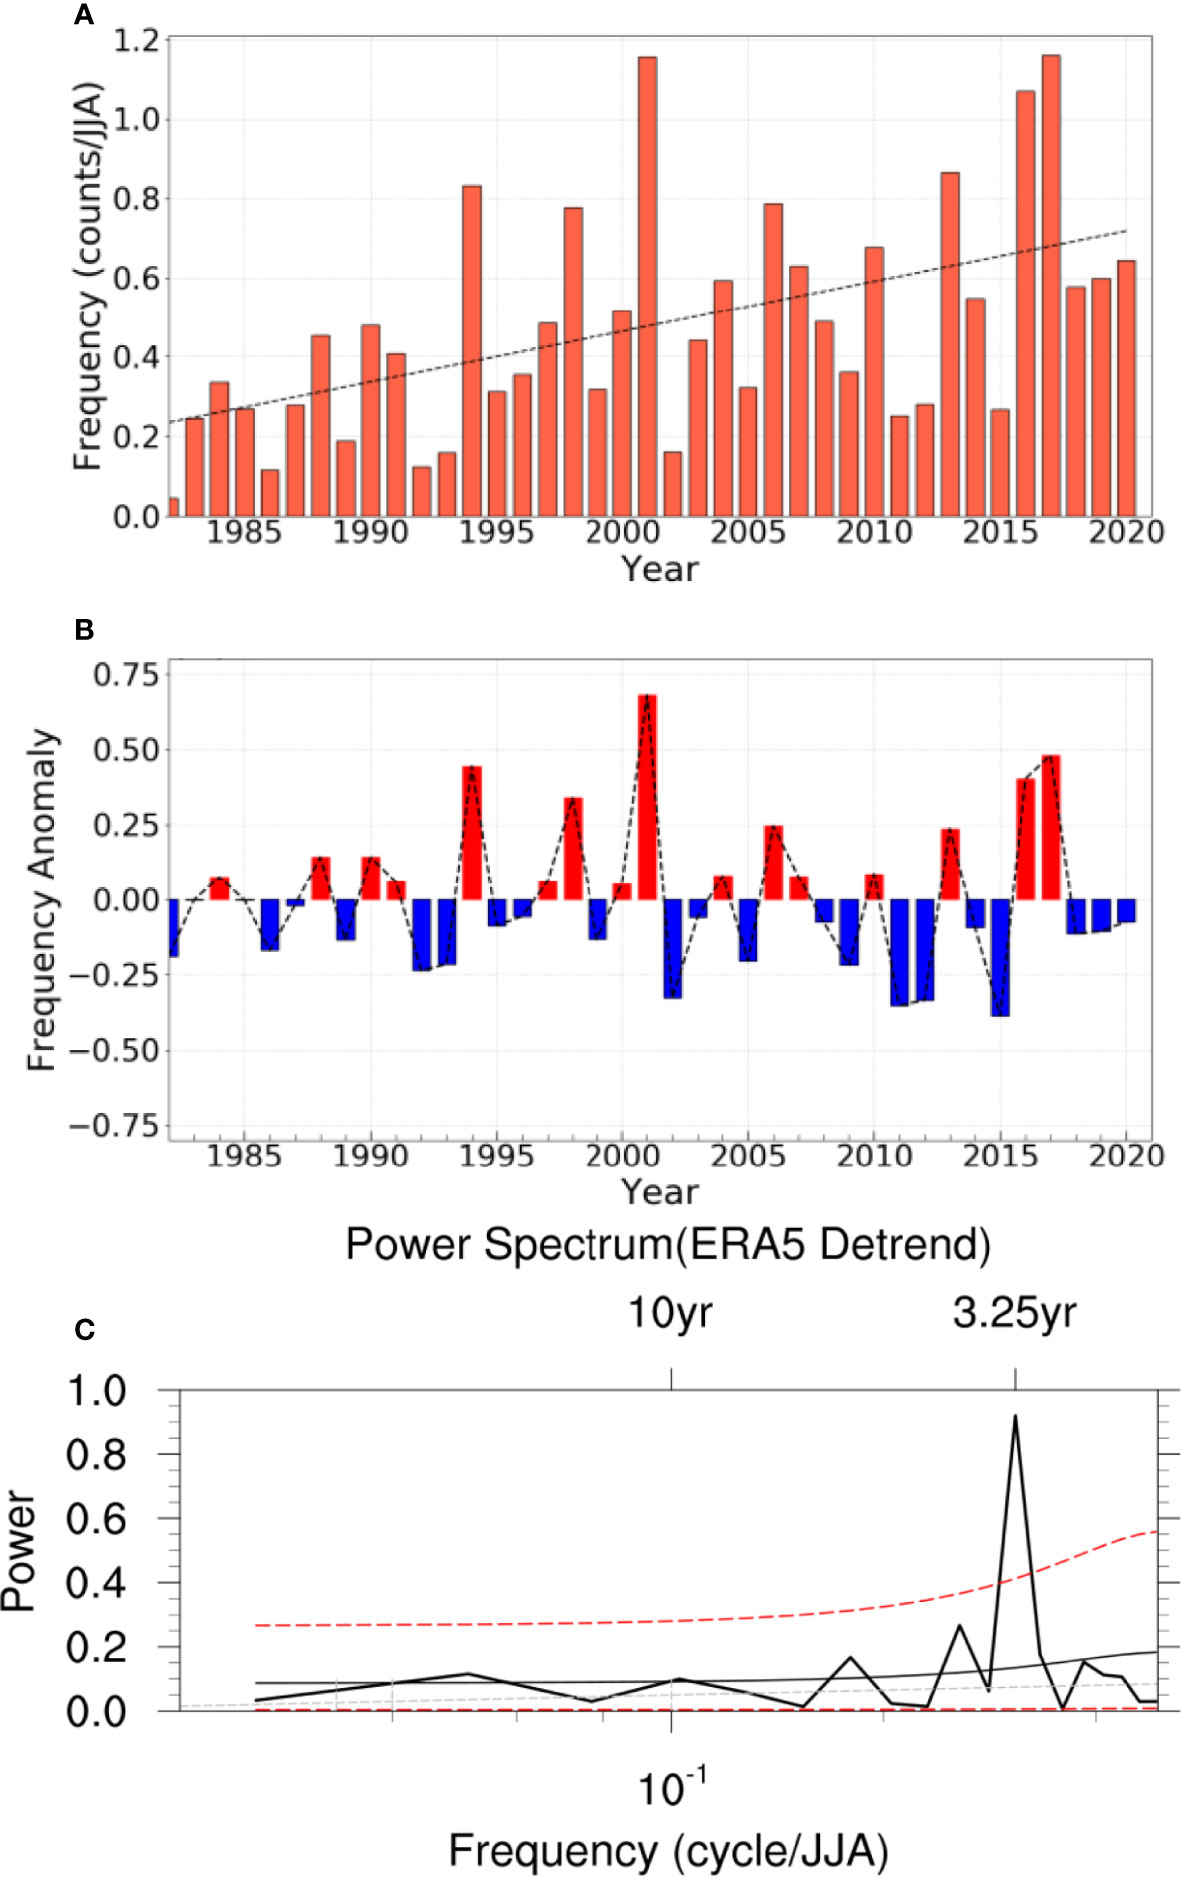
Figure 1 (A) The total frequency time series of summer MHWs area-average in EAMS (115~135° E, 25~45°) with ERA5 reanalysis data from 1982 to 2020. The dotted line indicates a linear trend. (B) The total frequency time series as seen in (A) but with the linear trend removed. (C) Results of power spectrum analysis obtained from the total frequency of MHWs in EAMS during summer. The dotted lines above shown in the spectrum analysis figure indicate significant values at the 95% and 5% confidence level, respectively.
To further examine the characteristics of the dominant variability of MHW occurrence in EAMS, we conduct an EOF analysis and display the spatial pattern of the first EOF (hereafter, EOF1) of MHW occurrence and its principal component (PC) time series in Figures 2A, B. The MHW occurrence retains a linear trend to understand its long term change in EAMS. Notably, the spatial structure of EOF1 is characterized by occurrence of MHW at a basin scale in EAMS, and its maximum variance is observed in the southern part of EAMS, including the East China Sea. Note that the EOF1 is statistically significantly separated from the EOF2 of MHW occurrence following the rule of thumb (North et al., 1982) (figure not shown). The EOF1 PC time series is characterized by a significant upward trend (Figure 2B), which largely explains the main characteristics of the total occurrence of MHWs in EAMS (Figure 1A). Simultaneous correlation coefficients between the total occurrence of MHWs and the EOF1 PC were significantly high at 0.97 and 0.95 with and without a linear trend, respectively, which is statistically significant at the 99% confidence level. Hereafter, we focus on understanding the characteristics associated with the EOF1 of MHW occurrence in EAMS.
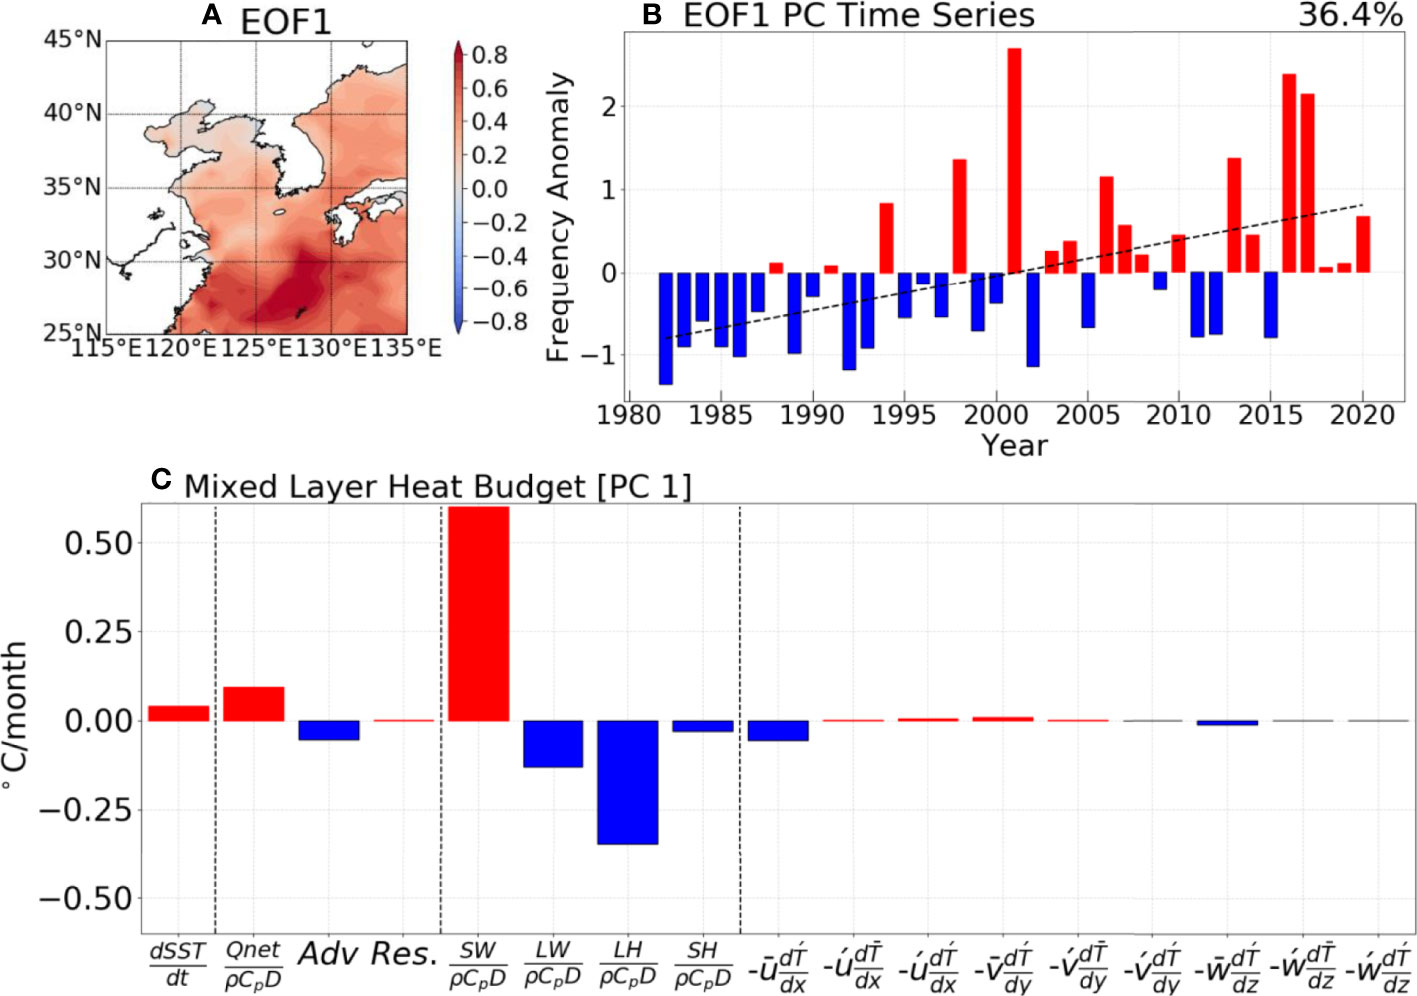
Figure 2 (A) EOF1 spatial pattern of the total frequency of summer MHWs in EAMS, analyzed with ERA5 reanalysis data from 1982 to 2020. (B) The EOF1 PC time series as seen in (A). The unit is loaded in the PC time series, not in spatial mode. (C) The bar plot of an area-averaged mixed layer heat budget regressed with EOF1 PC time series. Regression with PC indicates the contribution of each term to the change that occurs when the number of occurrences changes.
We conducted heat budget analysis using ERA5 and GODAS datasets. Figure 2C displays the regressed heat budget terms averaged in EAMS against the EOF1 PC time series. The SST tendency associated with the EOF1 of MHW occurrence is explained largely by heat flux forcing. In particular, net shortwave radiative forcing plays a key role in increasing the SST tendency, in contrast to the role of three other radiant heat flux forcings including longwave flux, latent heat flux and sensible heat flux. In addition, ocean advection processes and residual processes play a minor role to act a positive SST tendency associated with the EOF1 of the MHW occurrence. This result implies that the increased frequency of MHW in EAMS in the recent past is linked closely to the increase of thermodynamic processes related to heat flux forcing.
Figures 3A, B display the regressed SST anomalies and geopotential height anomalies with a horizontal wind at a low level (850 hPa) against the EOF1 PC time series of MHW occurrence, respectively. The occurrence of basin-scale MHWs in EAMS is associated closely with a high SST in the same place (Figure 3A), indicating that the increase in mean SST may trigger more frequent MHWs in EAMS, as suggested by a previous study (Li et al., 2019). In addition, a La Niña–like SST structure appears with an increase in basin-scale MHW occurrence in EAMS, which is also consistent with the results of a previous study (Lee et al., 2020). Lee et al. (2020) showed that an El Niño-like SST structure in previous winter (January-February-March) changed into a La Niña-like SST structure in the following summer (Figure 3 in Lee et al. (2020)), subsequently, such SST conditions may provide a favorable background condition for initiating MHW occurrence in EAMS through atmospheric teleconnections. Indeed, Figure 3B indicates that frequent occurrence of MHWs in EAMS are associated with a wave-train atmospheric teleconnection originating from the western tropical Pacific to the central North Pacific across EAMS, which is similar to the Pacific-Japan (PJ) pattern (Kosaka and Nakamura, 2006). The PJ pattern, which is induced by enhanced deep convection in the western Pacific warm pool and Maritime Continent (Nitta Tsuyoshi, 1987), acts to advect warm air with an increase in downward shortwave radiation due to anticyclone circulation anomalies around EAMS. Increased convective activity was observed in the warm pool around the Maritime Continent with the northern Indian Ocean (Figure 3C), which might induce the PJ-like atmospheric waves from the western tropical Pacific into East Asia, resulting in increased occurrence of basin-scale MHW in EAMS.
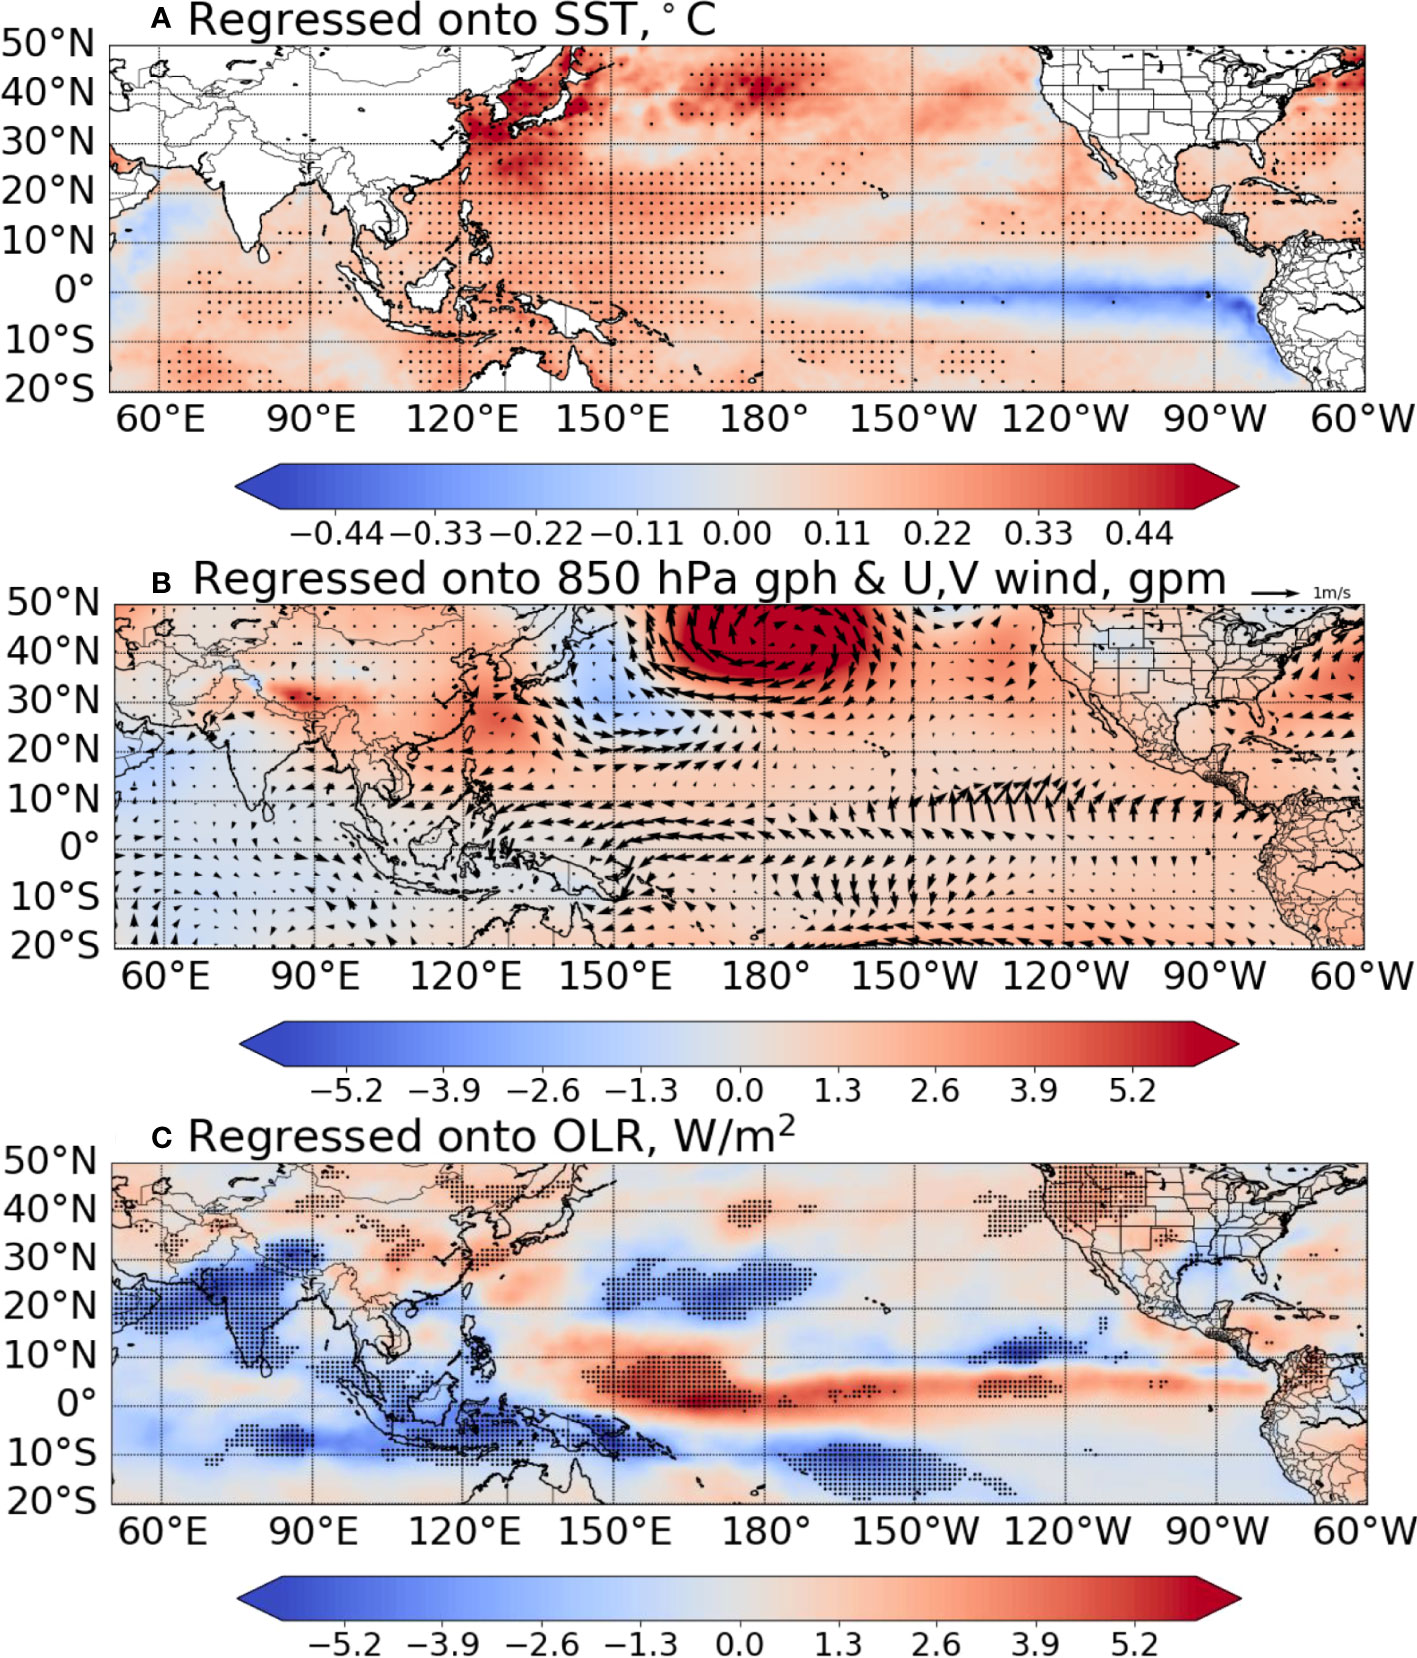
Figure 3 (A) SST map (50° E~60° W, 20° S~50° N) of regression with East Asian summer MHW EOF1 PC time series. Data used are from ERA5. (B) 850 hPa geopotential heights and wind map regression as seen in (A). The yellow dotted line on the map indicates the wave-train. The length of the black arrow on the map represents the wind speed. (C) Outgoing longwave radiation (OLR) map regression as seen in (A, B). In the case of OLR, the blue color denotes the enhanced convection. The dots on the map shown in (A, C) indicate significance at the 95% confidence level.
Model Experiments
In this subsection, we analyzed the occurrence of MHWs simulated in Exp_CTL, Exp_THER, and Exp_DYN to examine the roles of atmosphere thermodynamic and ocean dynamic processes on the occurrence of MHWs in EAMS.
It is necessary to validate how Exp_CTL reasonably simulates the mean SST and its variability in the North Pacific including EAMS compared to the ERA5 dataset. Figures 4A, B show the climatological (1982-2020) mean SST in ERA5 dataset and that simulated in Exp_CTL, respectively, and Figure 4C displays their differences (Exp_CTL minus ERA5). While the main structure of climatological mean SST is similar in the North Pacific in both ERA5 dataset and Exp_CTL (Figures 4A, B), Exp_CTL has cold bias in Yellow Sea and slightly warm bias in East China sea as well as East/Japan sea. This might be due to either a coarse resolution of Exp_CTL compared to ERA5 dataset or Exp_CTL may not adequately simulate the intensity and path of Kuroshio currents originated from the western tropical Pacific like other OGCMs (Kagimoto and Yamagata, 1997). Figures 4D–F are the same as in Figures 4A–C except the SST variance. Exp_CTL tends to simulate the suppressed SST variance in the entire North Pacific basin including EAMS compared to ERA5 dataset (Figure 4F). In spite of this, Exp_CTL reasonably simulates the main structure of SST variance elongated from the western to the eastern North Pacific (Figures 4D, E).
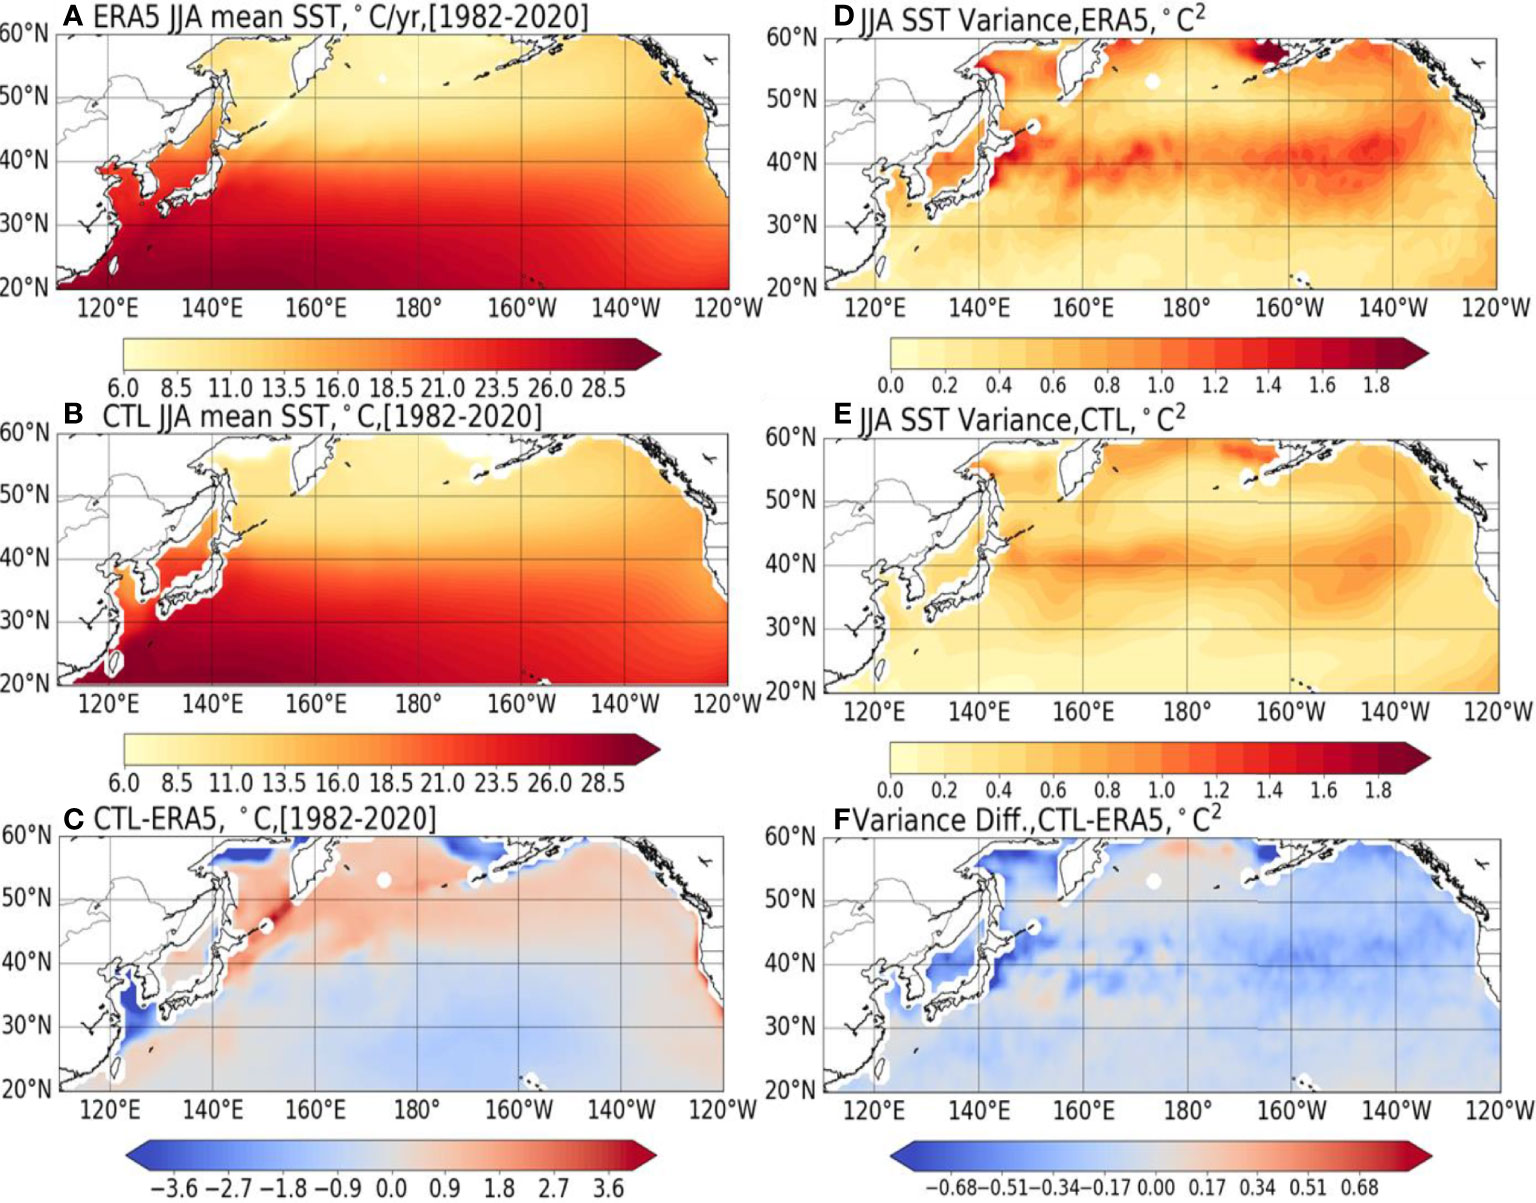
Figure 4 (A) The map of ERA5 SST climatology from 1982 to 2020 for the Pacific region (20° ~ 60° N, 120° E ~ 120° W) in summer, (B) MOM5 Exp_CTL, (C) Figure showing difference of SST climatology (Exp_CTL minus ERA5). (D) Variance of SST calculated through ERA5 SST anomaly, (E) MOM5 Exp_CTL, (F) difference of SST Variance.
Figures 5A, B show the linear trend of SST in the North Pacific during the entire analyzed period in the ERA5 dataset and Exp_CTL, respectively. The SST trend simulated in Exp_CTL (Figure 5B) is comparable to those in ERA5 dataset (Figure 5A) despite of some discrepancies including its spatial structures and magnitude. While the North Pacific is characterized by a basin scale warming trend in ERA5 dataset, a warming trend is dominant in the zonal direction from the western to the eastern North Pacific in Exp_CTL. However, two centers of maximum SST trend, which are observed in the Yellow Seas and East/Japan Sea in EAMS in ERA5 dataset (Figure 5A), are also simulated in Exp_CTL (Figure 5B). These results indicate that despite that there are some discrepancies of SST simulated in Exp_CTL including its mean, variance and trend compared to ERA5 dataset, it is reliable to examine the MHW characteristics simulated in OGCM forced by the atmospheric variables from the ERA5 dataset to understand the roles of atmosphere thermodynamic and ocean dynamic processes on the occurrence of MHWs in EAMS
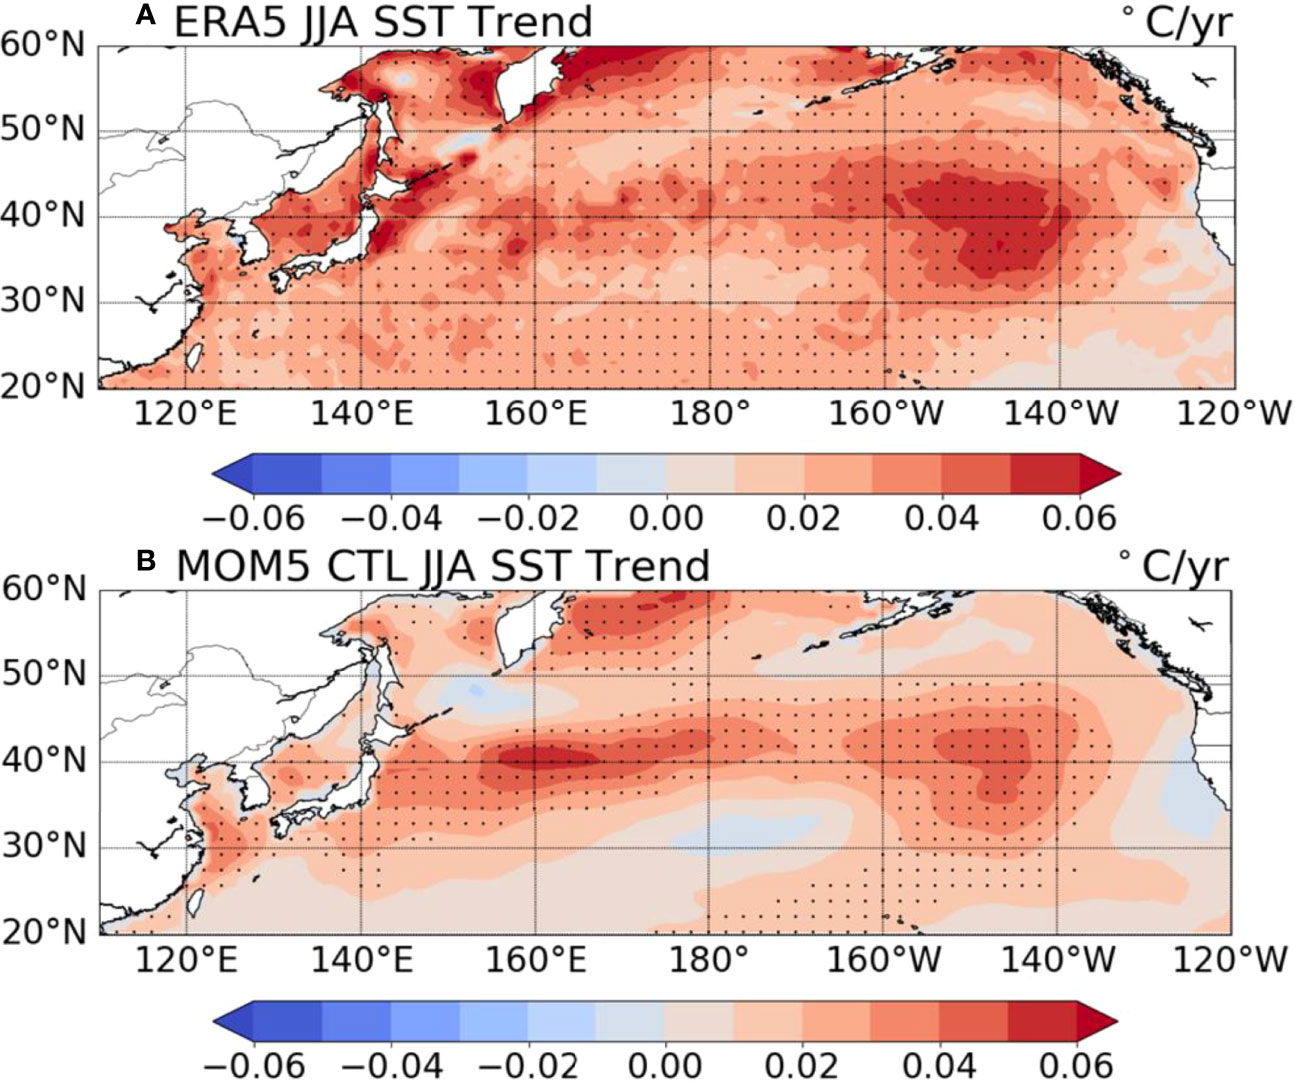
Figure 5 (A) The map of increasing and decreasing trend from 1982 to 2020 of ERA5 SST in the Pacific region during summer. (B) MOM5 Exp_CTL SST trend. The dots on the map mean a significant increase in the 95% confidence level.
Figures 6A through 6C depict the time series of MHW occurrence in EAMS in Exp_CTL. First, the main characteristics of the occurrence of MHW in EAMS are simulated reasonably in Exp_CTL (Figure 6A) compared to those in the ERA5 dataset (see Figure 1A). The occurrence of simulated MHWs in Exp_CTL appears to be gradually increasing in EAMS, like in the ERA5 dataset, and its linear trend is 0.007/year, which is statistically significant at the 95% confidence level. The linear trend in Exp_CTL is half the one obtained from the ERA5 reanalysis (0.013/year). A weak linear trend could be associated with either weaker linear trend of mean SST in Exp_CTL than ERA5 dataset (see Figure 5) or the lack of atmosphere-ocean coupled processes in Exp_CTL in which the OGCM is forced by the atmosphere variables only. In spite of this discrepancy, the correlation coefficients of MHW occurrence between Exp_CTL and the ERA5 dataset are 0.89 and 0.86 with and without a linear trend, respectively, and are above the 95% confidence level. Figures 6B, C are the same as Figure 6A except is MHW occurrence simulated in Exp_THER and Exp_DYN, respectively. The MHW occurrence simulated in Exp_THER is much weaker than that in Exp_CTL. Similar result is also seen in the MHW occurrence simulated in Exp_DYN (Figure 6C). The MHW occurrence simulated in Exp_CTL could be explained by an additive combination of MHW occurrence simulated in Exp_THER and Exp_DYN in which its linear trend is statistically significant above the 95% confidence level (Figure S1).
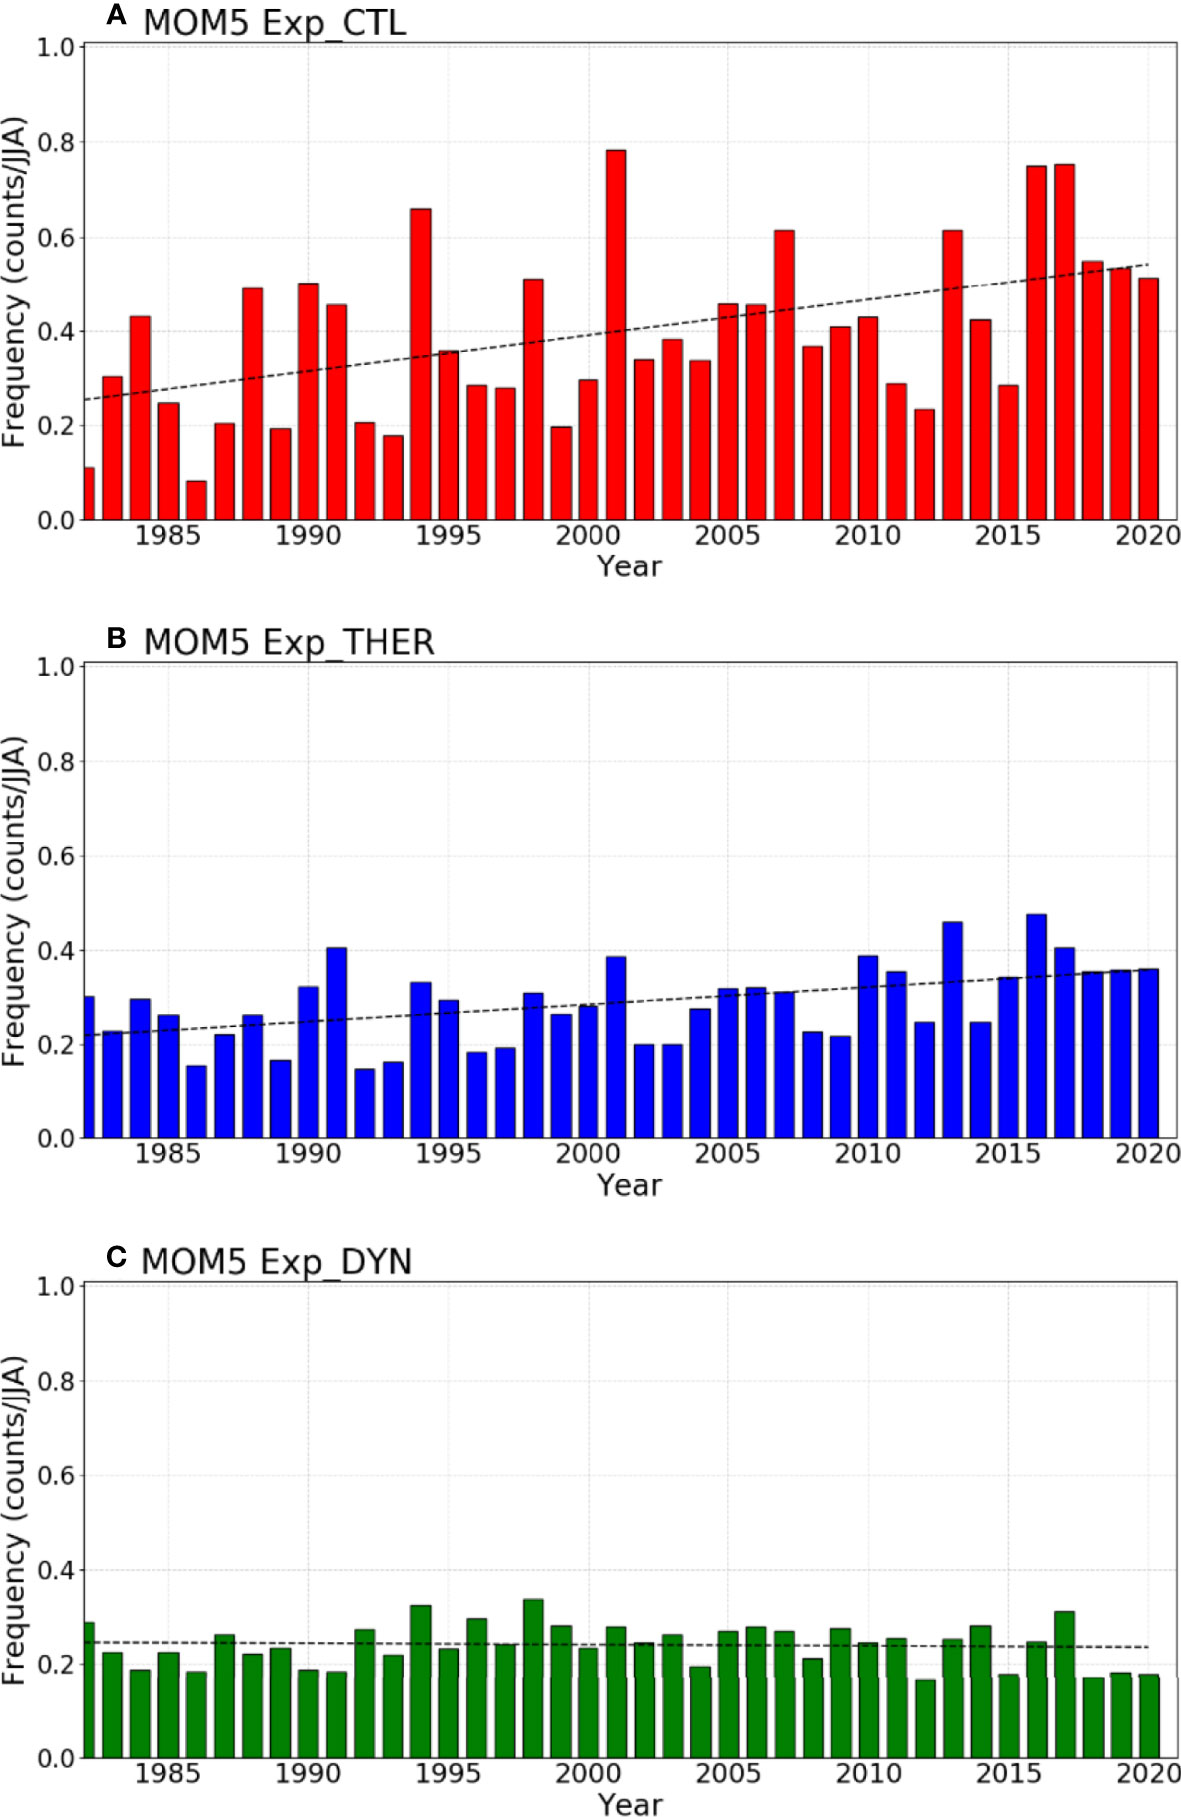
Figure 6 (A) Area-average time series of the total frequency of MHW during summer in EAMS in the MOM5 Exp_CTL experiment. (B) Total frequency time series of Exp_THER as shown in (A). (C) Total frequency time series of Exp_DYN. The 90th percentile threshold temperature in (B, C) was defined as the temperature of Exp_CTL. The black dotted line in the figure indicates a linear trend.
The linear trend of MHW occurrence simulated in Exp_THER is 0.003/year, which is statistically significant at the 95% confidence level. Unlike in Exp_CTL and Exp_THER, however, the linear trend of MHW occurrence simulated in Exp_DYN is not statistically significant (Figure 6C). In addition, the ratio of MHW occurrence frequency between Exp_CTL and Exp_DYN (figure not shown) is gradually decreasing as time progresses, which is consistent with the result in Figure 6. By comparing these three experiments, we concluded that the increasing trend of MHW occurrence in EAMS is due mainly to the atmosphere thermodynamic processes in association with heat flux forcing, which is consistent with the findings of the heat budget analysis in the ERA5 reanalysis dataset (Figure 2C). In contrast, the ocean dynamic processes play a minor role in the recent increase in MHW occurrence in EAMS.
We further calculated the EOF1 in Exp_CTL and Exp_THER and the corresponding PC time series (Figures 7A–D). The spatial structure of EOF1 MHW occurrence in Exp_CTL is characterized on a basin scale in EAMS (Figure 7A) and has some discrepancies with that in the EOF1 simulated with Exp_THER (Figure 7C), where there are local characteristics of MHW occurrence. Such differences in detailed features could be due to omission of ocean dynamic processes in Exp_THER compared to in Exp_CTL. In spite of this, however, the correlation coefficients of the two EOF1 PC time series (Figures 7B, D) in Exp_CTL and Exp_THER were 0.80 and 0.74 with and without a linear trend, respectively, which are statistically significant at the 95% confidence level. This indicates that the dominant variability of MHW occurrence represented by EOF1 in Exp_CTL can be largely explained by that in Exp_THER, which is consistent with the result in Figure 6. We further conducted heat budget analysis using Exp_CTL and calculated the regressed heat budget terms averaged in EAMS against the EOF1 PC time series in Exp_CTL (Figure S2). Similar to that in ERA5 dataset (Figure 2C), the SST tendency associated with the EOF1 of MHW occurrence is explained largely by heat flux forcing, in particular, net shortwave radiative forcing. In addition, ocean advection processes and residual processes play a minor role to act a positive SST tendency associated with the EOF1 of the MHW occurrence in Exp_CTL. These results also support the notion that the atmosphere thermodynamic processes play a key role in the upward occurrence trend of MHWs in EAMS.
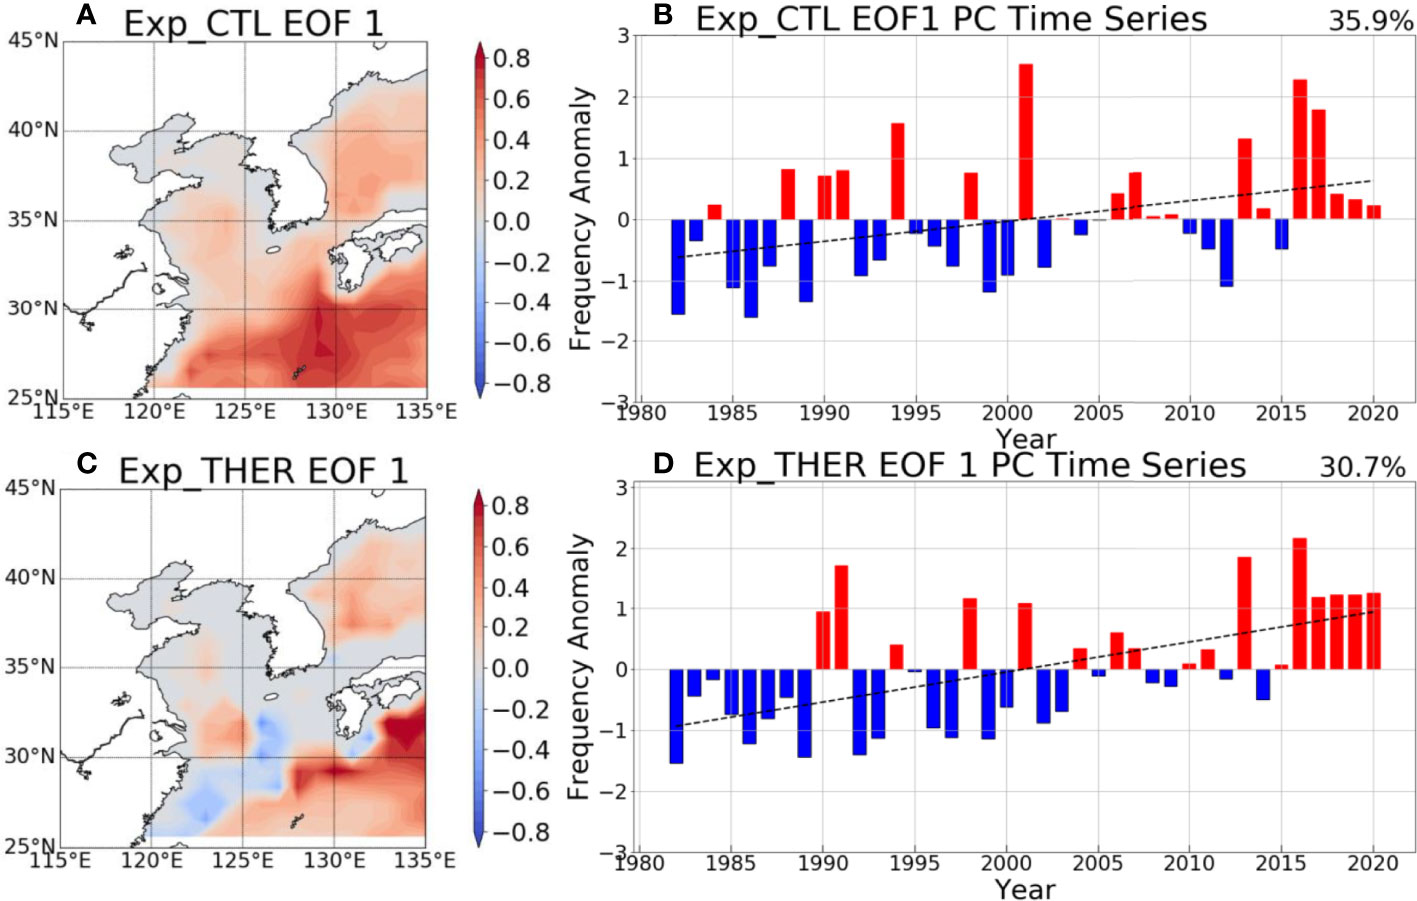
Figure 7 (A) EOF1 spatial pattern of the total frequency of summer MHWs in EAMS, analyzed by Exp_CTL of MOM5 from 1982 to 2020. (B) EOF1 PC time series of EAMS summer MHWs analyzed with Exp_CTL as in (A). (C) Same as (A) but with the EOF1 spatial pattern analyzed with Exp_THER. (D) EOF1 PC time series of Exp_THER as in (B). The dotted lines in (B, D) indicate a linear trend. As in Figure 2A, the unit is loaded on the PC time series.
Figure 8A displays the regressed SST anomalies against the EOF1 PC time series in Exp_CTL. Similar to that in the ERA5 dataset (see Figure 3A), the increase in mean SST contributes to frequent occurrence of MHWs in EAMS in Exp_CTL. In addition, a La Niña–like SST structure appears with an increase of MHW occurrence in EAMS in Exp_CTL, which is consistent with the result from the ERA5 dataset. Figure 8B is the same as Figure 8A except for regressed SST anomalies against those of EOF1 PC in Exp_THER. Similar to Exp_CTL, a frequent occurrence of MHWs in EASMs in Exp_THER is associated with the increase in mean SST from the western North Pacific to the central North Pacific. A La Niña-like cooling in Exp_THER is weak in the central-to-eastern tropical Pacific, where the ocean dynamics play a key role in inducing SST anomalies. The result in Figure 8 indicates that the increase in MHW occurrence in EAMS is associated with the increase in mean SST in the same place in both Exp_CTL and Exp_THER, implying that the occurrence of MHW and its associated warm SST in EAMS is explained largely by the atmosphere thermodynamic processes.
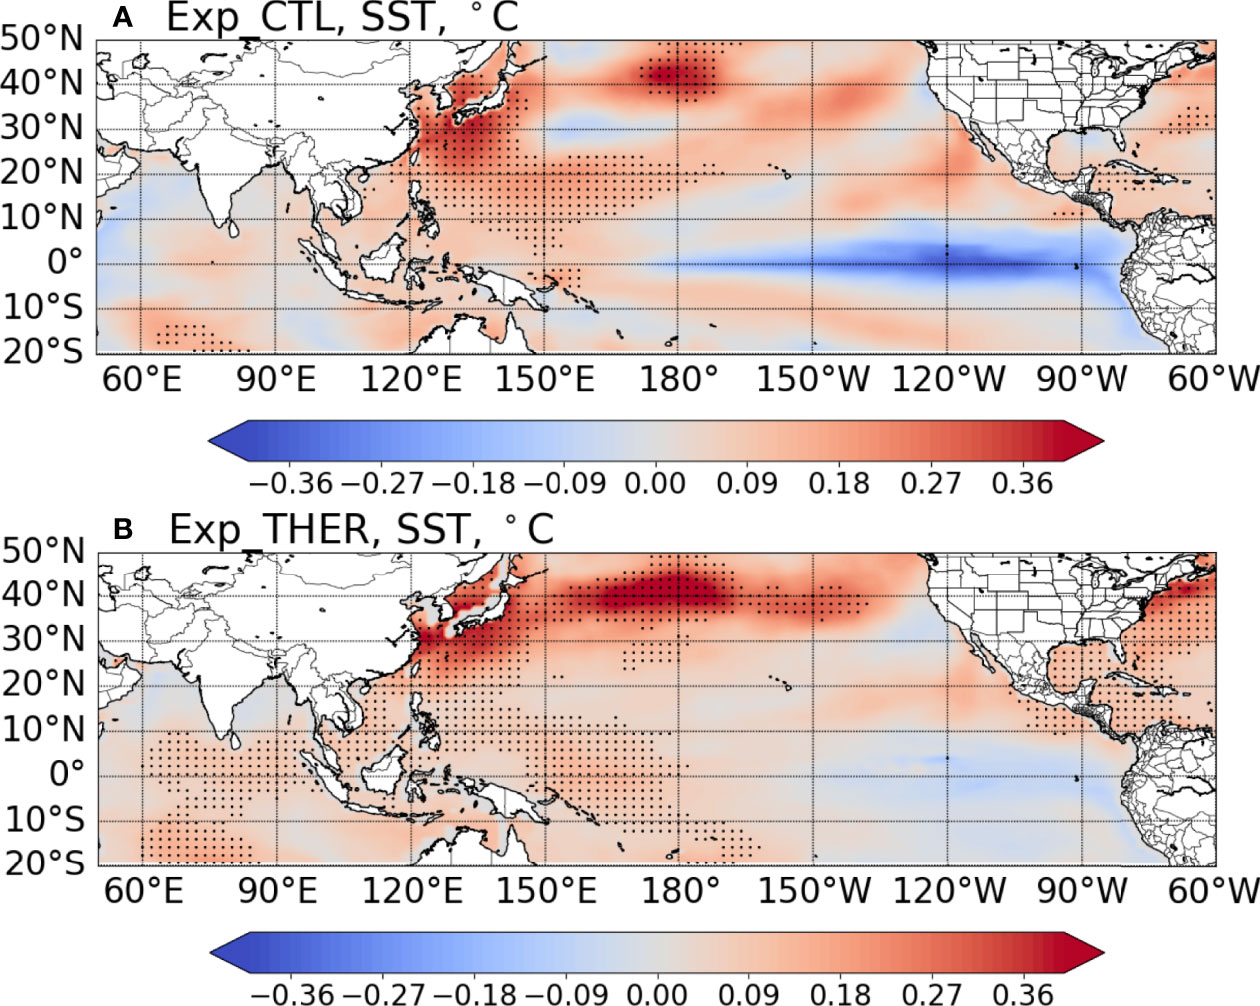
Figure 8 (A) The Northern Hemisphere SST map (20° S~50° N, 50° E~60° W) regressed with EOF1 PC time series of Exp_CTL shown in Figure 5B. (B) SST regression map as seen in (A) but with Exp_THER. The dots on the map indicate significance at the 95% confidence level.
Figure 9A–D show the regressed radiant heat fluxes against with the EOF1 PC time series in Exp_CTL. Consistent with the heat budget analysis in ERA5 dataset and Exp_CTL (see Figure 2C and Figures S2), the regressed shortwave radiation heat flux is significant in EAMS (Figure 9A), which is contrast to other radiant heat fluxes including longwave, latent heat, sensible heat fluxes. This result also supports that the contribution of shortwave radiation processes leading to the upward increase of MHW occurrence is significant. In spite of this, this result may have intrinsic limitations due to the very non-linear behavior of the heat fluxes. Indeed, the sensible heat flux directly depend on air temperature, while the latent non-linearly on all air and sea surface variables, therefore, Exp_CTL and Exp_THER may not be conclusive on the impact of solar radiation. To have a robust conclusion, it is necessary to run an experiment where only the downward shortwave flux is set to climatological values.
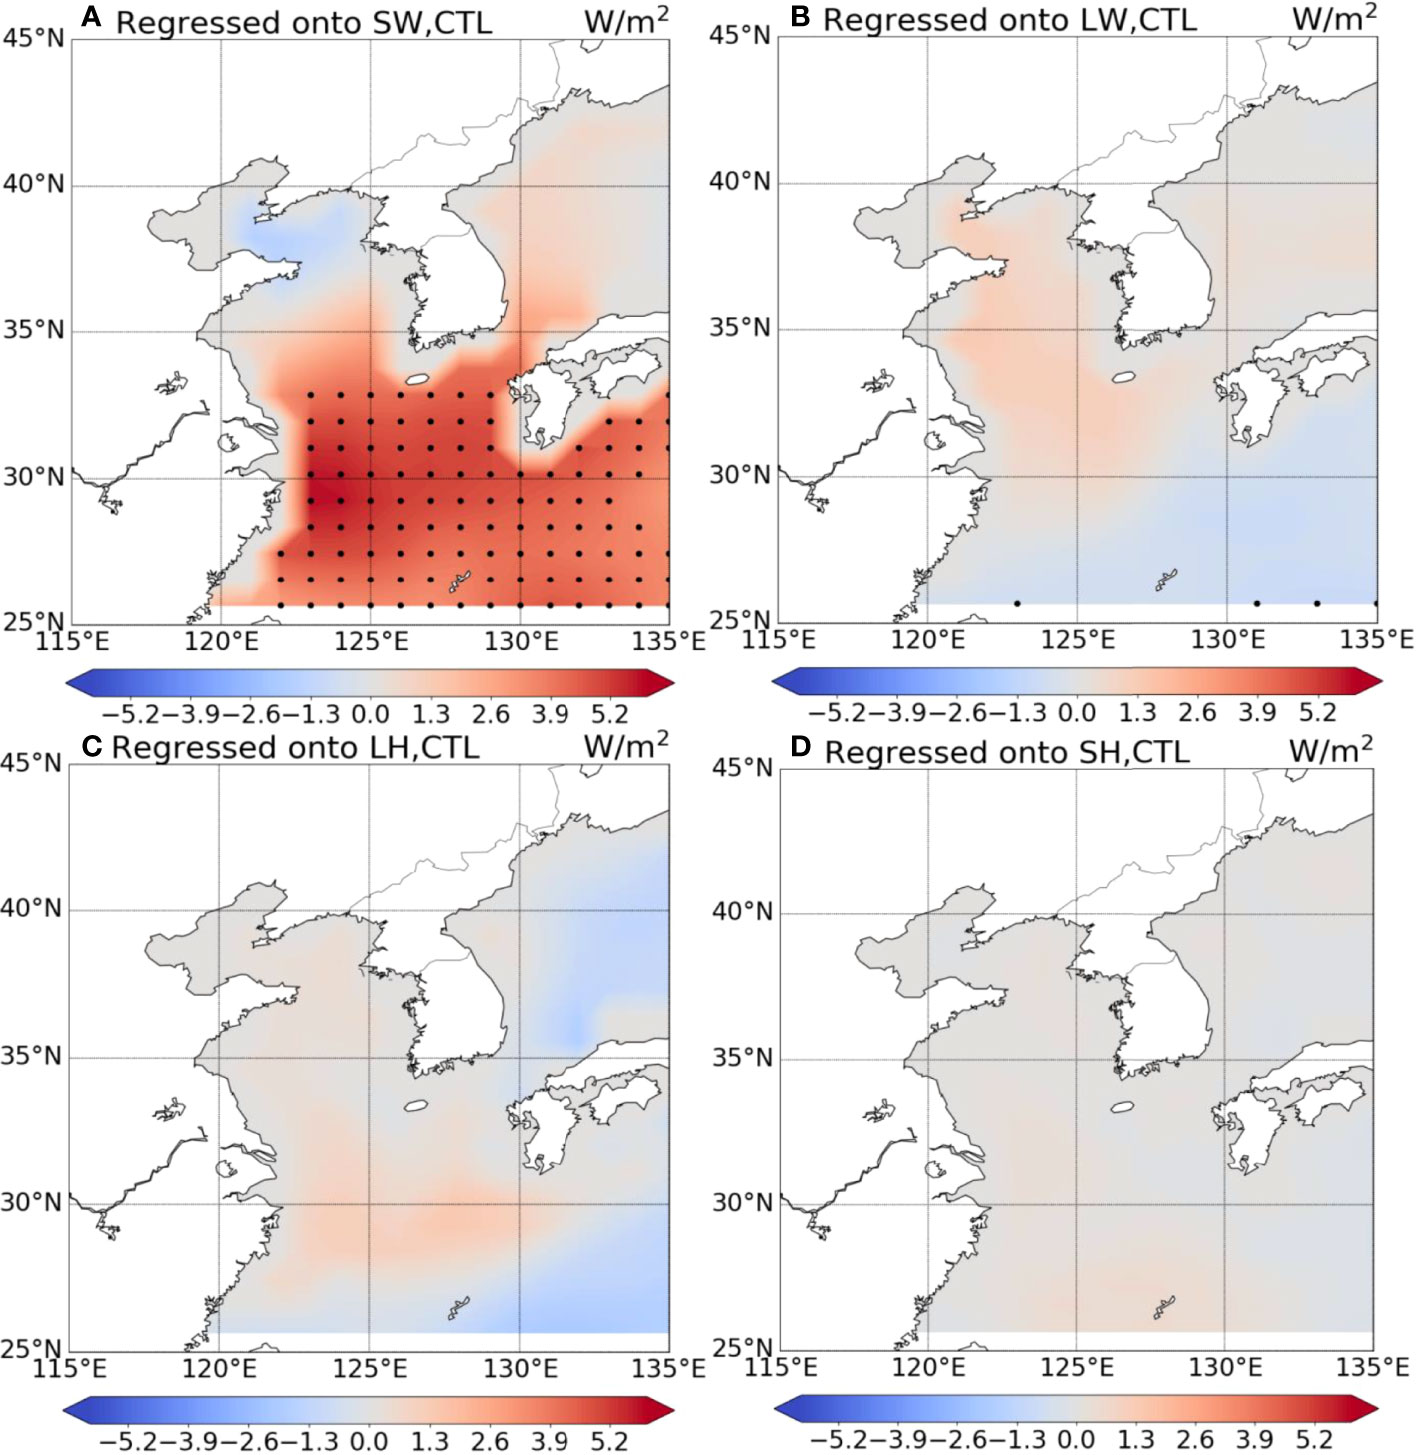
Figure 9 Regression maps of shortwave radiation (A), longwave radiation (B), latent heat flux (C) and sensible heat flux (D) against with the EOF 1 PC time series in Exp_CTL. The dots on the map indicate the statistical significance at the 95% confidence level.
Summary and Discussion
The purpose of this study was to examine the contribution of atmosphere thermodynamic and ocean dynamic processes to the upward trend of MHWs in EAMS during summer between 1982 and 2020 by analyzing the ERA5 reanalysis datasets and performing three model experiments (Exp_CTL, Exp_THER, and Exp_DYN). The analysis of the ERA5 reanalysis dataset indicated that the characteristics of the occurrence of MHWs in EAMS are largely explained by the EOF1, which is characterized by upward trend in basin-scale occurrence of MHWs. The EOF1 of MHW occurrence is associated with a La Niña–like SST structure with a PJ-like atmospheric circulation that originated from convection in the warm pool and the Maritime Continent. Indeed, heat budget analysis indicated that the SST tendency associated with the EOF1 of MHW occurrence in EAMS is explained largely by heat flux forcing—in particular, the net shortwave radiative forcing.
We further analyzed the upward trend of MHW occurrences simulated in three experiments in EAMS to examine the role of atmosphere thermodynamic and ocean dynamic processes, respectively. By comparing with the three experiments, we concluded that the increasing trend of MHW occurrence in EAMS is mainly due to the atmosphere thermodynamic processes in association with shortwave heat flux forcing, which is in contrast to the role of ocean dynamic processes. However, we cannot exclude that MOM5 ocean model suffers to simulate the regional ocean circulations including the Kuroshio current and its extension, therefore, there is a possibility that local ocean dynamics can be affected by net surface heat flux changes in Exp_THER. This implies that atmospheric wind pattern anomalies have a limited role on simulating MHWs in EAMS in three experiments.
Although MOM5 is useful in assessing the characteristics of MHW occurrence at the global scale, the spatial resolution of MOM5 (1x1) may not be enough to resolve mesoscale processes that play a substantial role in the dynamics of the ocean. In particular, western boundary currents are regions of intense mesoscale eddy activity where high-resolution models are able to simulate the regional ocean circulation properly than the coarse-resolution models (Pilo et al., 2019; Hayashida et al., 2020). In MOM5, on the other hand, sensible heating arises from turbulent exchange with the atmosphere, and is generally parameterized by turbulent bulk formula and latent heating is related to mass transport across the ocean surface where Hvapor=2.5 x 10⁶ J Kg-1 is the latent heat of vaporization, Qmvapor: the evaporative mass flux in units of Kg m-2 s-1) (Griffies, 2012). It should be noted that both sensible heat and latent heat fluxes depend on the wind forcing, so that Exp_THER and Exp_DYN may not fully separate the atmosphere thermodynamic processes and ocean dynamic processes.
We argued that the increase in basin-scale MHW occurrence in EAMS is associated with an increase in mean SST in the same place, which could be due to global warming and largely can be explained by the atmosphere thermodynamic processes. These results imply that it is necessary to carefully consider the atmosphere thermodynamic processes to improve the predictability of MHW occurrence in EAMS and to correctly project their future changes.
Data Availability Statement
The original contributions presented in the study are included in the article/Supplementary Material. Further inquiries can be directed to the corresponding author.
Author Contributions
SBL and SWY: conceptualization. SBL: methodology, data creation, and writing—original draft preparation. All authors have discussed the results and contributed to writing the manuscript.
Funding
This research was a part of the project titled ‘Investigation and prediction system development of marine heatwave around the Korean Peninsula originated from the subarctic and western Pacific’, funded by the Korean Ministry of Oceans and Fisheries (20190344).
Conflict of Interest
The authors declare that the research was conducted in the absence of any commercial or financial relationships that could be construed as a potential conflict of interest.
Publisher’s Note
All claims expressed in this article are solely those of the authors and do not necessarily represent those of their affiliated organizations, or those of the publisher, the editors and the reviewers. Any product that may be evaluated in this article, or claim that may be made by its manufacturer, is not guaranteed or endorsed by the publisher.
Supplementary Material
The Supplementary Material for this article can be found online at: https://www.frontiersin.org/articles/10.3389/fmars.2022.889500/full#supplementary-material
References
Adcroft A., Anderson W., Balaji V., Blanton C., Bushuk M., Dufour C. O., et al. (2019). The GFDL Global Ocean and Sea Ice Model Om4.0: Model Description and Simulation Features. J. Adv. Model Earth Sy. 11 (10), 3167–3211. doi: 10.1029/2019MS001726
Belkin I. M. (2009). Rapid Warming of Large Marine Ecosystems. Prog. Oceanogr. 81 (1-4), 207–213. doi: 10.1016/j.pocean.2009.04.011
Cavole L. M., Demko A. M., Diner R. E., Giddings A., Koester I., Pagniello C. M.L.S., et al. (2016). Biological Impacts of the 2013–2015 Warm-Water Anomaly in the Northeast Pacific: Winners, Losers, and the Future. Oceanography 29, 273–285. doi: 10.5670/oceanog.2016.32
Cook K. H., Vizy E. K., Sun X. M. (2018). Multidecadal-Scale Adjustment of the Ocean Mixed Layer Heat Budget in the Tropics: Examining Ocean Reanalyses. Clim. Dynam. 50 (5-6), 1513–1532. doi: 10.1007/s00382-017-3703-0
Foltz G. R., Grodsky S. A., Carton J. A., McPhaden M. J. (2003). Seasonal Mixed Layer Heat Budget of the Tropical Atlantic Ocean. J. Geophys. Res-Ocean. 108 (C5), 108.C5. doi: 10.1029/2002jc001584
Frolicher T. L., Fischer E. M., Gruber N. (2018). Marine Heatwaves Under Global Warming. Nature 560, 360–364. doi: 10.1038/s41586-018-0383-9
Frolicher T. L., Laufkotter C. (2018). Emerging Risks From Marine Heat Waves. Nat. Commun. 9 (1), 1–4. doi: 10.1038/s41467-018-03163-6
Gao G. D., Marin M., Feng M., Yin B. S., Yang D. Z., Feng X. R., et al. (2020). Drivers of Marine Heatwaves in the East China Sea and the South Yellow Sea in Three Consecutive Summers During 2016-2018. J. Geophys. Res-Ocean. 125 (8), e2020JC016518. doi: 10.1029/2020JC016518
Griffies S. M. (2012). Elements of the Modular Ocean Model (MOM) GFDL Ocean Group Technical Report No. 7 (Princet USA: NOAA Geophys Fluid Dyn Lab), 614 + xiii pages.
Griffies S. M., Gnanadesikan A., Dixon K. W., Dunne J. P., Gerdes R., Harrison M. J., et al. (2005). Formulation of an Ocean Model for Global Climate Simulations. Ocean. Sci. 1 (1), 45–79. doi: 10.5194/os-1-45-2005
Griffies S. M., Biastoch A., Böning C., Bryan F., Danabasoglu G., Chassignet E. P., et al. (2009). Coordinated Ocean-ice Reference Experiments (Cores). Ocean. Model 26 (1-2), 1–46. doi: 10.1016/j.ocemod.2008.08.007
Hayashida H., Matear R. J., Struttion and Xuebin Zang P. G. (2020). Insights Into Projected Changes in Marine Heatwaves From a High-Resolution Ocean Circulation Model. Nat. Communicat. 11, 4352. doi: 10.1038/s41467-020-18241-x
Hersbach H., Bell B., Berrisford P., Hirahara S., Horänyi A., Muñoz-Sabater J., et al. (2020). The ERA5 Global Reanalysis. Q. J. Roy. Meteor. Soc. 146 (730), 1999–2049. doi: 10.1002/qj.3803
Hobday A. J., Alexander L. V., Perkins S. E., Smale D. A., Straub S. C., Oliver E. C.J., et al. (2016). A Hierarchical Approach to Defining Marine Heatwaves. Prog. Oceanogr. 141, 227–238. doi: 10.1016/j.pocean.2015.12.014
Jo H. S., Yeh S. W., Cai W. J. (2019). An Episodic Weakening in the Boreal Spring SST-Precipitation Relationship in the Western Tropical Pacific Since the Late 1990s. J. Climate 32 (13), 3837–3845. doi: 10.1175/Jcli-D-17-0737.1
Kagimoto T., Yamagata T. (1997). Seasonal Transport Variations of the Kuroshio: An OGCM Simulation. J. Phys. Oceanogr. 27 (3), 403–418. doi: 10.1175/1520-0485(1997)027<0403:STVOTK>2.0.CO;2
Kang I. S., An S. I., Jin F. F. (2001). A Systematic Approximation of the SST Anomaly Equation for ENSO. J. Meteorol. Soc. Jpn. 79 (1), 1–10. doi: 10.2151/jmsj.79.1
Karsten R., Jones H., Marshall J. (2002). The Role of Eddy Transfer in Setting the Stratification and Transport of a Circumpolar Current. J. Phys. Oceanogr. 32 (1), 39–54. doi: 10.1175/1520-0485(2002)032<0039:TROETI>2.0.CO;2
Kim Y.-S., Jang C. J., Yeh S.-W. (2018). Recent Surface Cooling in the Yellow and East China Seas and the Associated North Pacific Climate Regime Shift. Continent. Shelf. Res. 156, 43–54. doi: 10.1016/j.csr.2018.01.009
Kintisch E. (2015). ‘The Blob’ Invades Pacific, Flummoxing Climate Experts. Science 348, 17–18. doi: 10.1126/science.348.6230.17
Kosaka Y., Nakamura H. (2006). Structure and Dynamics of the Summertime Pacific-Japan Teleconnection Pattern. Q. J. Roy. Meteor. Soc. 132 (619), 2009–2030. doi: 10.1256/qj.05.204
Lee S., Park M. S., Kwon M., Kim Y. H., Park Y. G. (2020). Two Major Modes of East Asian Marine Heatwaves. Environ. Res. Lett. 15 (7), 074008. doi: 10.1088/1748-9326/ab8527
Li Y., Ren G. Y., Wang Q. Y., You Q. L. (2019). More Extreme Marine Heatwaves in the China Seas During the Global Warming Hiatus. Environ. Res. Lett. 14 (10), 104010. doi: 10.1088/1748-9326/ab28bc
Marshall J. S., Beninati A. L. (2003). Analysis of Subgrid-Scale Torque for Large-Eddy Simulation of Turbulence. Aiaa. J. 41 (10), 1875–1881. doi: 10.2514/2.1903
McWilliams J. P., Cote I. M., Gill J. A., Sutherland W. J., Watkinson A. R. (2005). Accelerating Impacts of Temperature-Induced Coral Bleaching in the Caribbean. Ecology 86 (8), 2055–2060. doi: 10.1890/04-1657
Meehl G. A., Karl T., Easterling D. R., Changnon S., Pielke R. Jr., Changnon D., et al. (2020). An Introduction to Trends in Extreme Weather and Climate Events: Observations, Socioeconomic Impacts, Terrestrial Ecological Impacts, and Model Projections. B. Am. Meteorol. Soc. 81 (3), 413–416. doi: 10.1175/1520-0477(2000)081<0413:AITTIE>2.3.CO;2
Minnett P. J., Knuteson R. O., Best F. A., Osborne B. J., Hanafin J. A., Brown O. B. (2001). The Marine-Atmospheric Emitted Radiance Interferometer: A High-Accuracy, Seagoing Infrared Spectroradiometer J. Climate, 18 (6), 994–1013. doi: 10.1175/1520-0426(2001)018<0994:TMAERI>2.0.CO;2
Nitta T. (1987). Convective Activities in the Tropical Western Pacific and Their Impact on the Northern-Hemisphere Summer Circulation. J. Meteorol. Soc. Jpn. 65 (3), 373–390. doi: 10.2151/jmsj1965.65.3_373
North G. R., Bell T. L., Cahalan R. F., Moeng F. J. (1982). Sampling Errors in the Estimation of Empirical Orthogonal Functions. Mon. Wea. Rev. 110, 699–706.
Oliver E. C.J., Donat M. G., Burrows M. T., Moore P. J., Smale D. A., Alexander L. V., et al. (2018). Longer and More Frequent Marine Heatwaves Over the Past Century. Nat. Commun. 9 (1), 1–12. doi: 10.1038/s41467-018-03732-9
Pilo G. S., Holbrook N. J., Kiss A. E., Hogg M. A. (2019). Sensitivity of Marine Heatwave Metrics to Ocean Model Resolution. Geophys. Res. Lett. 46, 14604–14612. doi: 10.1029/2019GL084928
Wernberg T., Smale D. A., Tuya F., Thomsen M. S., Langlois T. J., de Bettignies T., et al. (2013). An Extreme Climatic Event Alters Marine Ecosystem Structure in a Global Biodiversity Hotspot. Nat. Clim. Change 3 (1), 78–82. doi: 10.1038/nclimate1627
Keywords: marine heatwaves, sea surface temperature, ocean general circulation model, East Asia marginal seas, upward trend
Citation: Lee S-B, Yeh S-W, Lee J-S, Park Y-G, Kwon M, Jun S-Y and Jo H-S (2022) Roles of Atmosphere Thermodynamic and Ocean Dynamic Processes on the Upward Trend of Summer Marine Heatwaves Occurrence in East Asian Marginal Seas. Front. Mar. Sci. 9:889500. doi: 10.3389/fmars.2022.889500
Received: 04 March 2022; Accepted: 26 April 2022;
Published: 31 May 2022.
Edited by:
Zhiyu Liu, Xiamen University, ChinaReviewed by:
Riccardo Farneti, The Abdus Salam International Centre for Theoretical Physics (ICTP), ItalyAndrea Storto, Institute of Marine Science (CNR), Italy
Ming Feng, Commonwealth Scientific and Industrial Research Organisation (CSIRO), Australia
Copyright © 2022 Lee, Yeh, Lee, Park, Kwon, Jun and Jo. This is an open-access article distributed under the terms of the Creative Commons Attribution License (CC BY). The use, distribution or reproduction in other forums is permitted, provided the original author(s) and the copyright owner(s) are credited and that the original publication in this journal is cited, in accordance with accepted academic practice. No use, distribution or reproduction is permitted which does not comply with these terms.
*Correspondence: Sang-Wook Yeh, c3d5ZWhAaGFueWFuZy5hYy5rcg==