 Andra Bucşe
 Oana Cristina Pârvulescu
 Dan Vasiliu
 Mihaela Mureșan
- 1National Institute for Research and Development on Marine Geology and Geoecology – GeoEcoMar, Bucharest, Romania
- 2Chemical and Biochemical Engineering Department, University POLITEHNICA of Bucharest, Bucharest, Romania
This study aimed at assessing the accumulation of some trace elements (arsenic, bromine, copper, mercury, selenium, and zinc) in the soft tissue of Mediterranean mussels (Mytilus galloprovincialis) from the Black Sea, near Agigea Port. The mussel samples were collected on a monthly basis between February and June 2019 from two stations located in front of the Danube–Black Sea Canal lock, along the two artificial dikes. The mussels (260 samples) were divided into three classes according to their length: A (3−5.9 cm), B (6−8.9 cm), and C (9−12 cm). The concentrations (dry basis) of As (12.5 ± 3.0 mg/kg), Br (173.6 ± 53.9 mg/kg), Cu (11.2 ± 2.5 mg/kg), Hg (0.02 ± 0.02 mg/kg), Se (2.9 ± 1.1 mg/kg), and Zn (179.5 ± 2.5 mg/kg) were determined using spectrometric techniques. The mean daily values of the physicochemical parameters of seawater (temperature, salinity, pH, chlorophyll a content, and dissolved oxygen content) within the study area were reported. Higher element concentrations were generally found for mussels from size classes A and B compared with those of the larger and older mussels from class C. Principal component analysis (PCA) suggested that the phytoplankton represented an important source of As and Br for the smaller mussels collected in February (when the levels of seawater temperature were lower and those of pH and salinity higher) compared to the larger mussels collected in June. Moreover, the multivariate analysis suggested that Cu, Se, Zn, and Br originated from similar anthropogenic sources and their higher concentrations reported in February and June were obtained at lower levels of seawater salinity. The contents of Cu, Zn, Se, As, and Hg in the mussel soft tissue were lower than the maximum permissible levels.
1 Introduction
Due to their tendency to accumulate in living tissues and toxicity potential, trace elements (TEs) have been a major concern for the marine environment in recent years (Belivermis et al., 2016). They enter the aquatic ecosystem, accumulate in aquatic organisms, e.g., fish, mollusks, algae, and are transferred to people through consumption. Consequently, TEs pose a risk to the health of the ecosystem and humans (Çevik et al., 2008).
Most of the TEs are naturally present in the marine environment, but their naturally occurring concentrations are generally very low (Ansari et al., 2004). Anthropogenic activities can significantly increase TE concentrations in the aquatic systems. Mining, metallurgy, fossil fuel and waste burning, industrial and domestic effluents, agricultural and port activities are main sources of contamination (Wagner and Boman, 2003; Ansari et al., 2004; Wagner and Boman, 2004; Oros and Gomoiu, 2010; Besada et al., 2011; Jakimska et al., 2011; Oros and Gomoiu, 2012; Belivermis et al., 2016; Oros, 2019). The rivers, underground water, and wind can transport large amounts of different pollutants into the seawater (Oros and Gomoiu, 2010; Oros and Gomoiu, 2012; Belivermis et al., 2016; Oros, 2019). After entering the marine environment, TEs can dissolve in the water column, accumulate in the aquatic organisms, become volatilized in the atmosphere, or be stored in the sediments (Oros, 2019). Moreover, some TEs can be released by phytoplankton in the water column or generated by natural rock erosion (Haglund et al., 2007; Oros and Gomoiu, 2012; Oros, 2019). TEs can be essential to aquatic organisms (e.g., Co, Cu, Fe, Mn, Mo, Se, Zn) or non-essential (e.g., As, Br, Cd, Hg, Pb) (Çevik et al., 2008; Jakimska et al., 2011; Santos et al., 2014). Essential elements are toxic at high concentrations, whereas non-essential ones are toxic even at very low concentrations.
Mytilus galloprovincialis has aroused a great interest among scientists, as the species has become a flagship species within the Mussel Watch Program, one of the oldest initiatives on pollution monitoring (Goldberg et al., 1983; Cantillo, 1998). These bivalve mollusks are suitable bioindicators (“sentinel organisms”) of environmental quality due to their well-known capacity to accumulate pollutants in different tissues through intense filtering activity as well as to their sedentary nature, abundance, wide geographical distribution, and good tolerance to environmental change and pollution (Çevik et al., 2008; Besada et al., 2011; Stanković et al., 2011; Kristan et al., 2014; Santos et al., 2014; Belivermis et al., 2016; Azizi et al., 2018; Bat et al., 2018).
The content of a TE in mussel tissues is usually proportional to the concentration of bioavailable TE in water and food (Ansari et al., 2004; Kljaković-Gašpić et al., 2007; Kristan et al., 2014). Generally, the mussel soft tissue is a more effective accumulator of different elements when compared with the shell (Çevik et al., 2008). The accumulation of TEs in mussels depends on various environmental factors (including seawater temperature, pH, salinity, dissolved oxygen content, dissolved organic carbon content, food availability, sediment type, currents, freshwater and anthropogenic inputs) and biological factors related to mussel growth and reproduction (mainly size, age, sex, and gametogenesis stages) (Cossa, 1989; Ansari et al., 2004; Fattorini et al., 2008; Besada et al., 2011; Kljaković-Gašpić et al., 2007; Maanan, 2007; Kristan et al., 2014; Nardi et al., 2017; Nardi et al., 2018; Romero-Freire et al., 2020). Seawater temperature and pH affect the bioaccumulation of TEs in mussels by changing their solubility and chemical speciation in seawater (Ansari et al., 2004; Nardi et al., 2017; Nardi et al., 2018; Romero-Freire et al., 2020). Higher temperatures and lower pH values usually lead to an increase in the bioaccumulation of TEs (Nardi et al., 2018; Romero-Freire et al., 2020). Moreover, the mass transfer of TEs from sediments to seawater can be intensified at low pH values (Nardi et al., 2018). The eutrophication caused by anthropogenic activities can significantly increase the amount of phytoplankton and facilitate the uptake of TEs by phytoplankton, resulting in enhanced accumulation of TEs in the food web, including in mussels (Wang and Dei, 2001; Fattorini et al., 2008; Kristan et al., 2014; Zhao et al., 2021). Environmental factors, especially the food availability, seawater temperature and salinity, can strongly affect the mussel size and gametogenesis stages (Aral, 1999; Suarez et al., 2005; Vasechkina and Kazankova, 2014; Azpeitia et al., 2017; Rouabhi et al., 2019). Higher concentrations of TEs were reported in the smaller and younger mussels, which may be related to their faster metabolism (Ansari et al., 2004; Yap et al., 2009; Kristan et al., 2014).
The present study highlights new data on the loading of some TEs (Cu, Se, Zn, As, Br, and Hg) in the soft tissue of M. galloprovincialis mussels collected from two sampling points near the Agigea Port, an industrial hot spot on the Romanian Black Sea coast. There is very little information in the related literature on the contents of Se and Br in the soft tissue of Black Sea mussels. According to the Agency for Toxic Substances and Diseases Registry (ATSDR), Cu, Se, Zn, As, Br, and Hg are among the elements with the highest priority that are present in the aquatic environment due to their frequency, toxicity, and potential for human exposure. They are also listed on the Substance Priority List in 2020 (Agency for Toxic Substances and Disease Registry (ATSDR), 2020).
2 Materials and Methods
2.1 Study Area
Mussel samples were collected from two points, i.e., stations A and B, located in front of the Danube–Black Sea Canal lock, along the two artificial dikes within the outer berths of Agigea Port (Figure 1). Stations A and B are 2.7 km and 2.3 km, respectively, away from the Canal exit. The mean water depth in the study area was about 8 m.
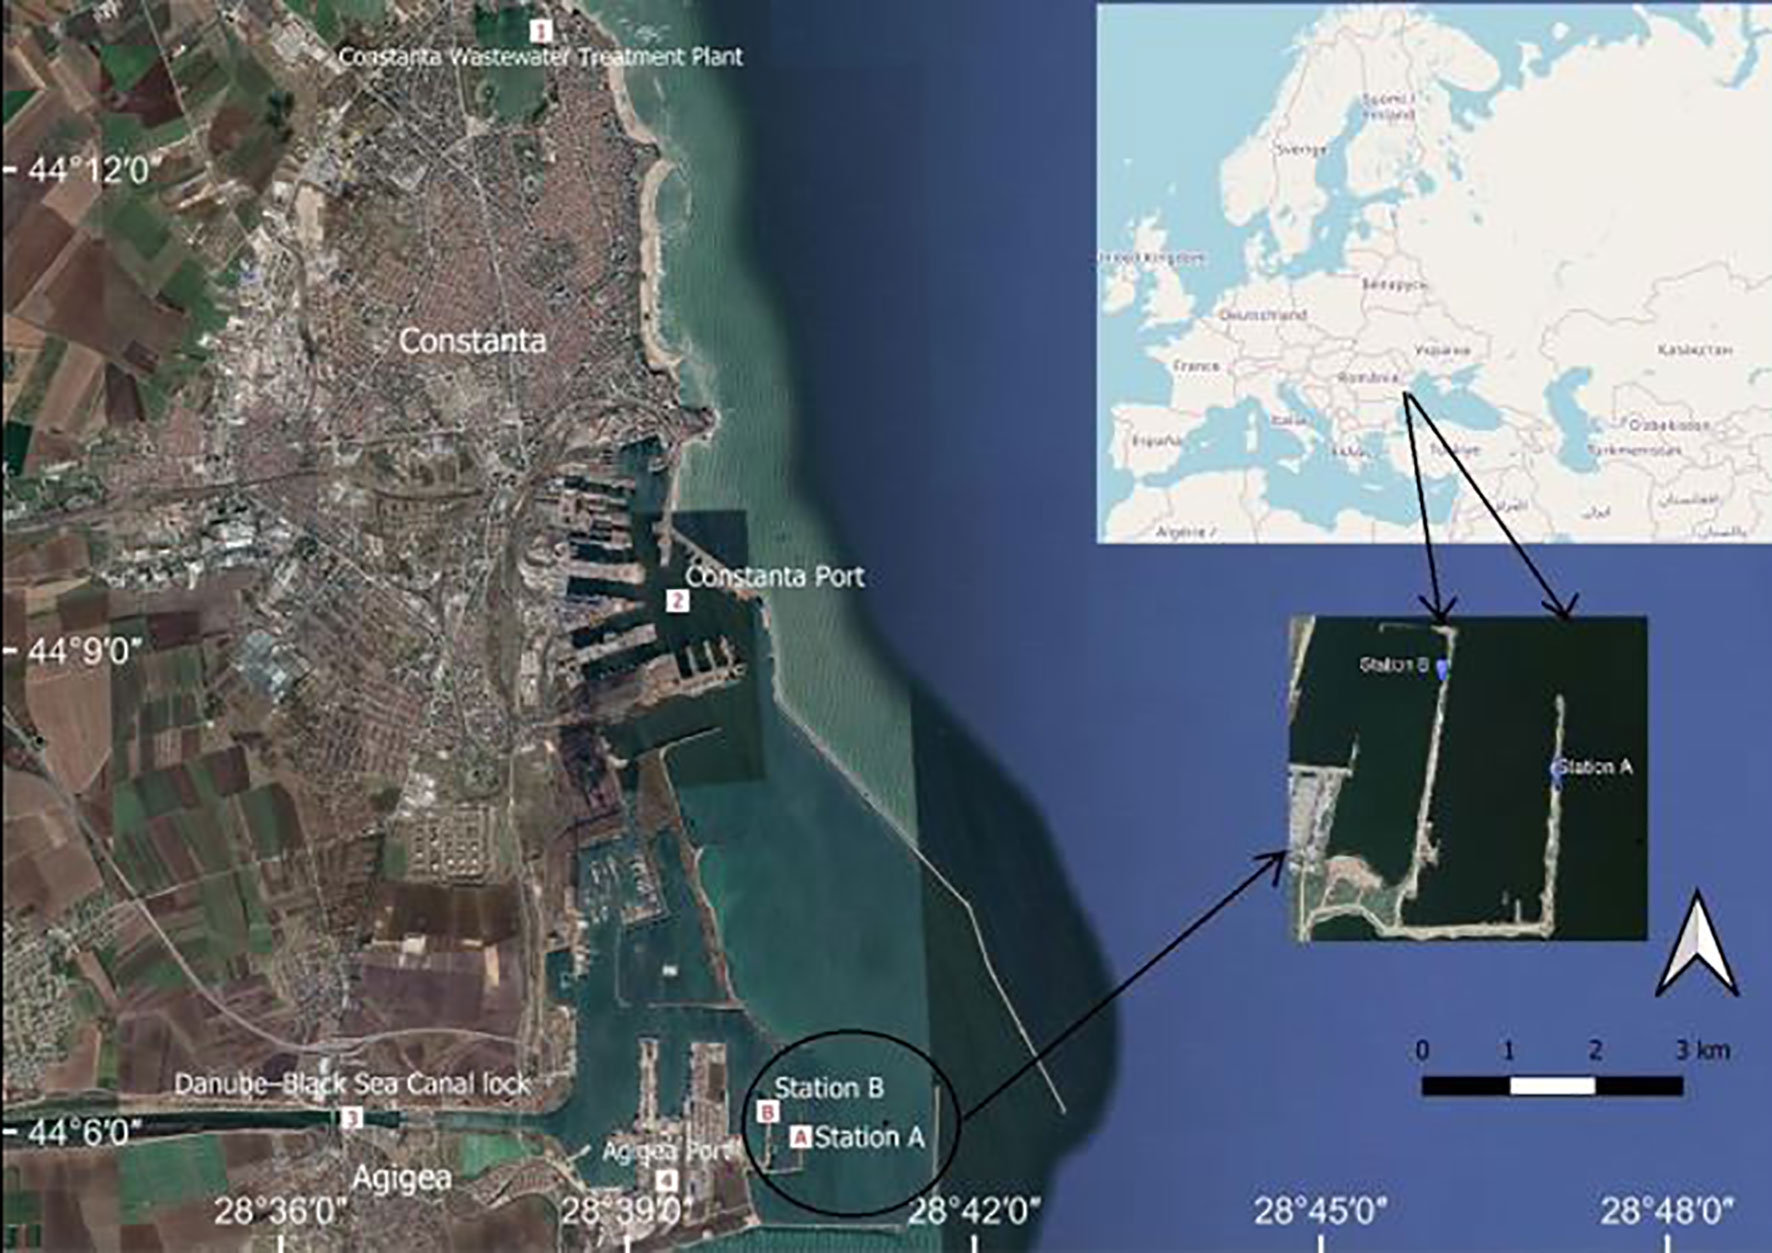
Figure 1 Constanta Sud−Agigea Port area map (Google Earth Pro 7.3.4.8248, 2021; http://earth.google.com).
Agigea Port represents the southern limit of Constanta Port, the most important industrial and maritime hub on the Romanian Black Sea coast. Accordingly, the study area is characterized by strong anthropogenic pressures resulting from intense port activities. Important cargo quantities are carried through the Danube–Black Sea Canal, while iron ores, bauxite, coal, coke, timber, chemicals, petrochemicals, and food are dealt with at specialized terminals in the port.
The study area is strongly impacted by effluents from the nearby Constanta South Wastewater Treatment Plant, which may be rich in TEs (e.g., Cd, Cr, Cu, Fe, Ni, Pb, Zn) and dissolved inorganic nitrogen (Lazar et al., 2013; Chirila et al., 2014; Robescu and Presură, 2017). Moreover, the predominant circulation of a north-south current along the Romanian coast imprints the influence of the Danube River on the area, which discharges approximately 200 km3/year of water into the Black Sea and is responsible for the highest amount of pollutants (Cozzi et al., 2019).
2.2 Sampling, Analysis, and Parameters
The mussels were randomly collected from their artificial rocky substrate (dyke) by scuba divers between February and June 2019. Similar environmental conditions for the mussels collected from the two sampling stations were assumed, given the relatively short distance between the dykes (0.4 km). The samples were stored in a freezer (-20°C) until further analysis. Prior to processing for spectrometric analyses, a series of biometric measurements were performed. The length (L) and wet mass (mw) of each mussel (after thawing and removing the excess water by blotting) were measured using a caliper and an analytical balance (Kern, Germany).
The mussels were classified into the following groups according to their length: A (L=3–5.9 cm), B (L=6–8.9 cm), and C (L=9–12 cm). Similar growth rates and ages were assumed for mussels from each size class. Two hundred and sixty mussel samples, i.e., 20 samples/class/month × 3 classes (A–C) × 3 months (February–April) and 20 samples/class/month × 2 classes (A and B) × 2 months (May and June), were dissected with a scalpel to separate the soft tissue from the shell. Flesh samples were weighed (after removing the excess intervalvar liquid by blotting), freeze-dried at -55°C for 48 h using a freeze-dryer (ilShin BioBase, Netherlands), and crushed with a mortar and a pestle. The meat yield (MY) was calculated using Eq. (1), where mwf represents the mass of wet flesh and mw is the mass of wet mussel (flesh and shell).
The concentrations of Cu, Se, Zn, As, and Br in each sample were measured using an energy dispersive X-ray fluorescence (EDXRF) spectrometer (SPECTRO XEPOS, Germany) with a Pd/Co tube and quantified with the XRF Analyser Pro software. The total content of Hg was measured using a direct mercury analyzer (DMA-80, Milestone, Italy) and quantified using atomic absorption spectrophotometry at 253.7 nm. All analyses were performed in triplicate. The accuracy of analytical methods was checked using two standard reference materials (SRMs) from the National Institute of Standards and Technology (NIST) and the International Atomic Energy Agency (IAEA), i.e., SRM 2976 (mussel tissue) and IAEA 407 (fish tissue). The measured and certified values of element concentration in SRM 2976 and IAEA 407 are summarized in Table 1, where the values are given as mean value ± standard deviation (SD), except for the certified levels for SRM, expressed as mean value ± expanded uncertainty (EU). The EU is defined by Eq. (2), where uc is the combined standard uncertainty, given by the standard error (SE) of the mean of available values, and k the coverage factor, which represents the Student’s t-value for a 95% confidence interval with n-1 degrees of freedom (n is the number of available data). As shown in Table 1, the percent recovery values for both SRMs range between 83% and 117%, indicating an acceptable accuracy of applied analytical procedures. The precision of element analyses was evaluated based on the relative standard deviation (RSD) of measured concentration values (n=3). The data specified in Table 1 highlight a good precision of analytical methods (RSD ≤ 10.7%)
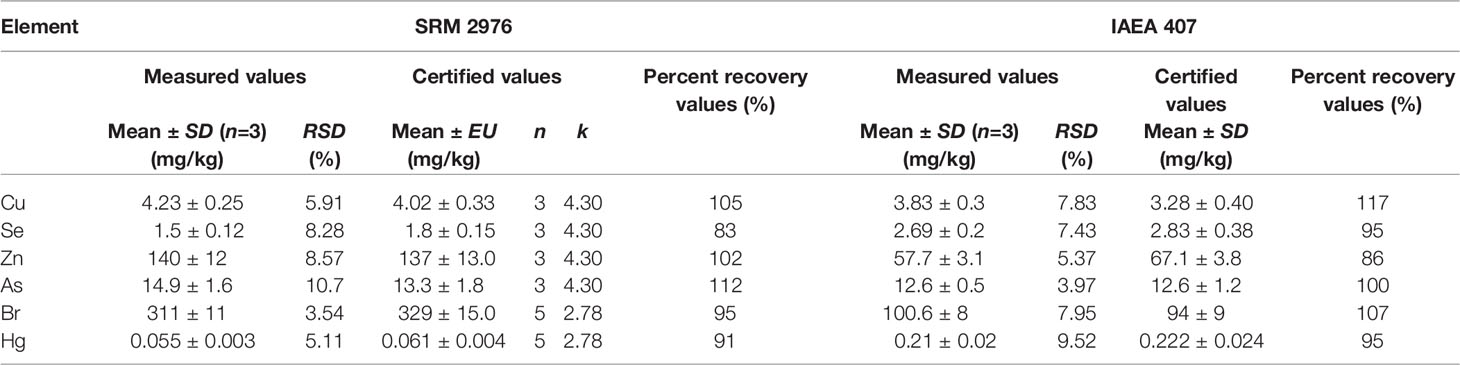
Table 1 Comparison between measured and certified values of element concentration in standard reference materials.
The mean daily values of the physicochemical parameters of seawater, in terms of the temperature (t), salinity (S), pH (pH), chlorophyll a concentration (cc), and dissolved oxygen concentration (cDO), within the study area were taken from the Copernicus Marine Environment Monitoring Service Platform. The physicochemical properties of the water (t, S, pH, cc, and cDO), meat yield (MY), and concentrations of the TEs in the mussel soft tissue (ci, i=Cu, Se, Zn, As, Br, Hg) were selected as relevant parameters.
2.3 Statistical Data Analysis
Statistical data analysis was performed using XLSTAT 2019.1. Pearson’s correlation coefficient (r) was used to reveal the strength of the linear correlations between the relevant parameters [at a significance level (α) of 0.05]. A data matrix with 13 rows [number of samples, i.e., A, B, and C in February (1), March (2), and April (3), as well as A and B in May (4) and June (5)] and 12 columns (number of relevant parameters) was used in principal component analysis (PCA). PCA is a multivariate exploratory technique, which aims at reducing the total number of independent variables (Vs) in the original data set to a few linear functions, i.e., principal components (PCs) or factors, of the most significant Vs (in terms of resulting variance) (Crăciun et al., 2020; Kapranov et al., 2021). The first PC (PC1) has the highest eigenvalue and variance, the second one (PC2) has the second highest eigenvalue and variance, and so forth. PCA is widely applied to determine the element sources and to assess the impact of environmental factors on contamination levels in seawater, marine organisms, and sediments (Roméo et al., 2005; Belivermis et al., 2016; Bucșe et al., 2020; Shen et al., 2020; Bucșe et al., 2021; Kapranov et al., 2021).
3 Results
3.1 Physicochemical Characteristics of Seawater
Variations in the physicochemical parameters of seawater over time, between February and June 2019, are shown in Figure 2. Seawater temperature (t=4−24°C) showed a normal seasonal variation pattern with low values in February (4−6°C) and high levels in June (20−24°C). The salinity (S=10.4−19 PSU) exhibited significant differences between and within the months, with fluctuations mainly caused by higher flow rates of the Danube. The lowest levels of salinity were measured in mid-June (10.4 PSU) and mid-April (11.4 PSU), whereas the highest value (19 PSU) was recorded in early May. The values of pH (8.20−8.40) were lower in June (8.20−8.26) and higher in February (≈8.38) and April (8.30−8.38). The chlorophyll a concentrations (cc=0.1−6 mg/m3) were lower in June (0.1−0.6 mg/m3), but higher in February, early March, and mid-April (2.5−6 mg/m3), corresponding to phytoplankton blooms in the Black Sea (Vasiliu et al., 2012). The dissolved O2 concentrations (cDO=289−357 mmol/m3) varied significantly between and within the months. Higher values (330−357 mmol/m3) were in the colder periods (lower seawater temperature, higher oxygen solubility), i.e., February and early March, as well as in mid-April. Higher levels of cDO in February−April corresponded to those of cc, caused by phytoplankton blooms.
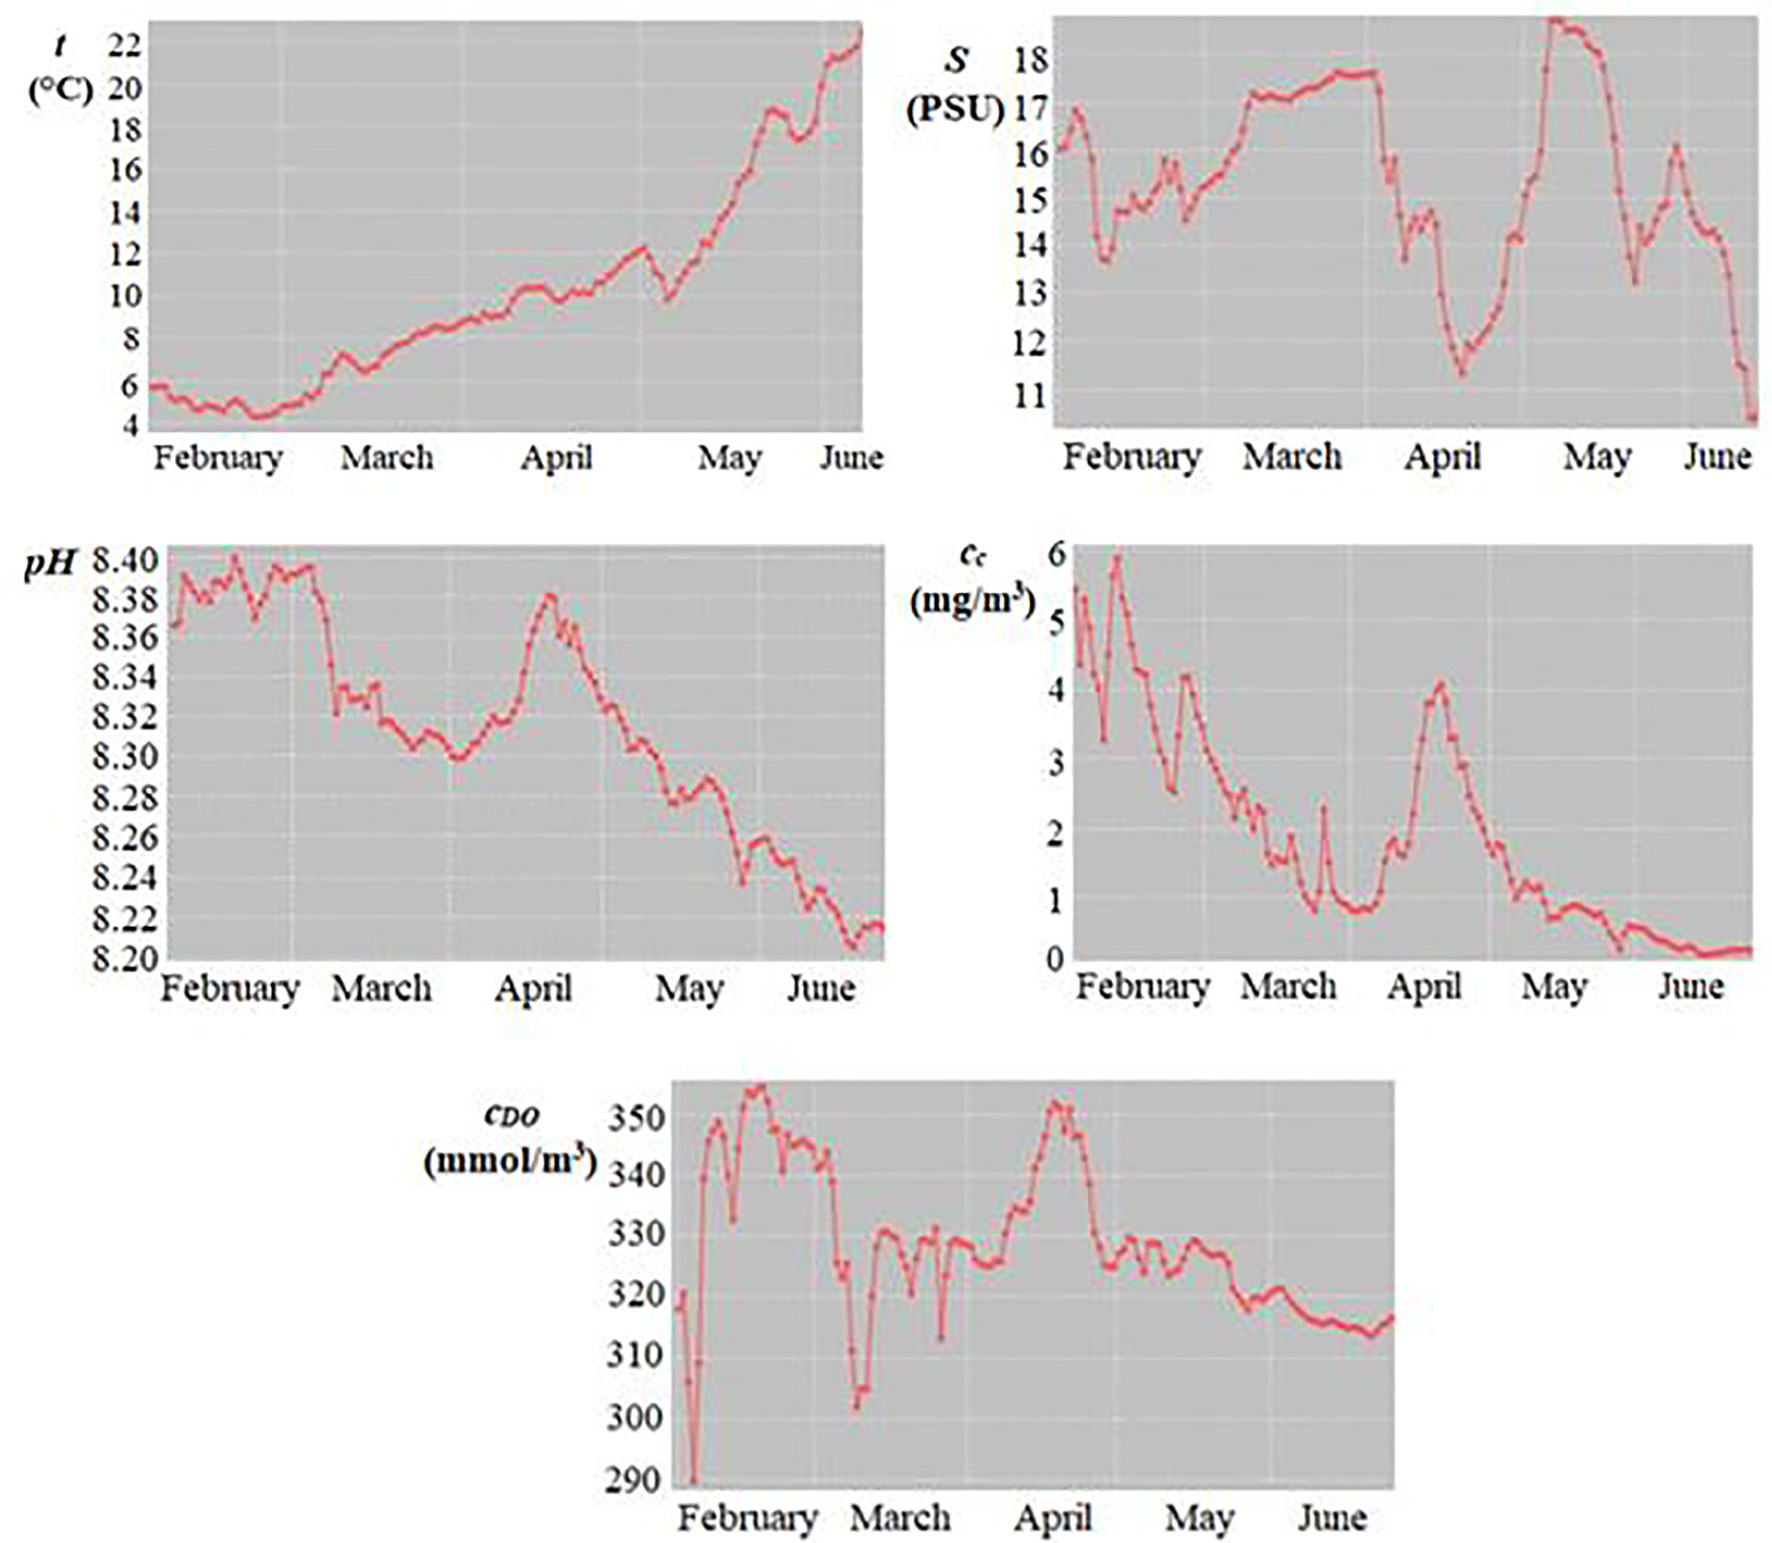
Figure 2 Time variation of mean daily values of seawater temperature (t), salinity (S), pH, chlorophyll a concentration (cc), and dissolved oxygen concentration (cDO) in February–June 2019.
3.2 Mussel Growth Patterns and Meat Yield
Variations in the wet flesh mass (mwf=5.1−23.4 g) and meat yield (MY=34.1−69.5%) between February and June 2019, which are shown in Figure 3, highlight the following issues: (i) for individuals from class A, the mwf (5.1−9.1 g) decreased slightly from February to May and the value of mwf in June was 1.80 times higher than that in May; the MY (34.6−69.5%) increased slightly from February to April, the values of MY in April and May were almost equal (≈41%), and the value of MY in June was 1.71 times higher than that in May; (ii) for individuals from class B, the mwf (8.6−14.8 g) exhibited an increase in March (1.36 times), a larger decrease in April (1.72 times), an increase in May (1.41 times), and a smaller decrease in June (1.16 times); the MY (34.1−40.2%) increased slightly until April, the values of MY in April and May were almost equal (≈37%), and the value of MY in June was 1.08 times lower than that in May; (iii) for individuals from class C, the mwf (15.8−23.4 g) increased from February to April; the MY (35.1−41.7%) increased until April and the increase was most significant in March (1.15 times).
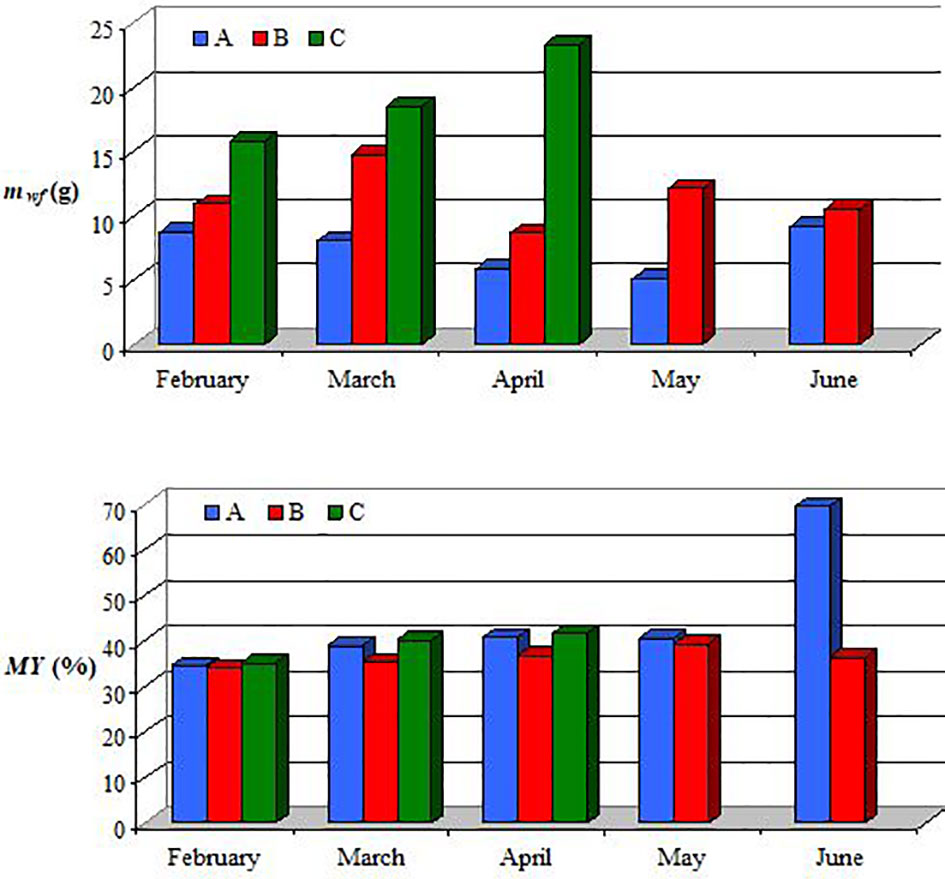
Figure 3 Variation of wet flesh mass (mwf) and meat yield (MY) in February−June 2019 for individuals from size classes A, B, and C.
3.3 The Contents of Trace Elements in Mussel Soft Tissue
The monthly concentrations of TEs in mussel soft tissue are shown in Figure 4. Supplementary Table S1 contains the relevant data on the monthly concentrations of TEs, i.e., the mean value ± standard deviation (ci,mean ± SD), the minimum (ci,min) and maximum (ci,max) levels, as well as the class, month, and code corresponding to these levels (i=Cu, Se, Zn, As, Br, Hg). The results presented in Figure 4 and Supplementary Table S1 indicate that the pattern of accumulation was Zn>Br>As>Cu>Se>Hg.
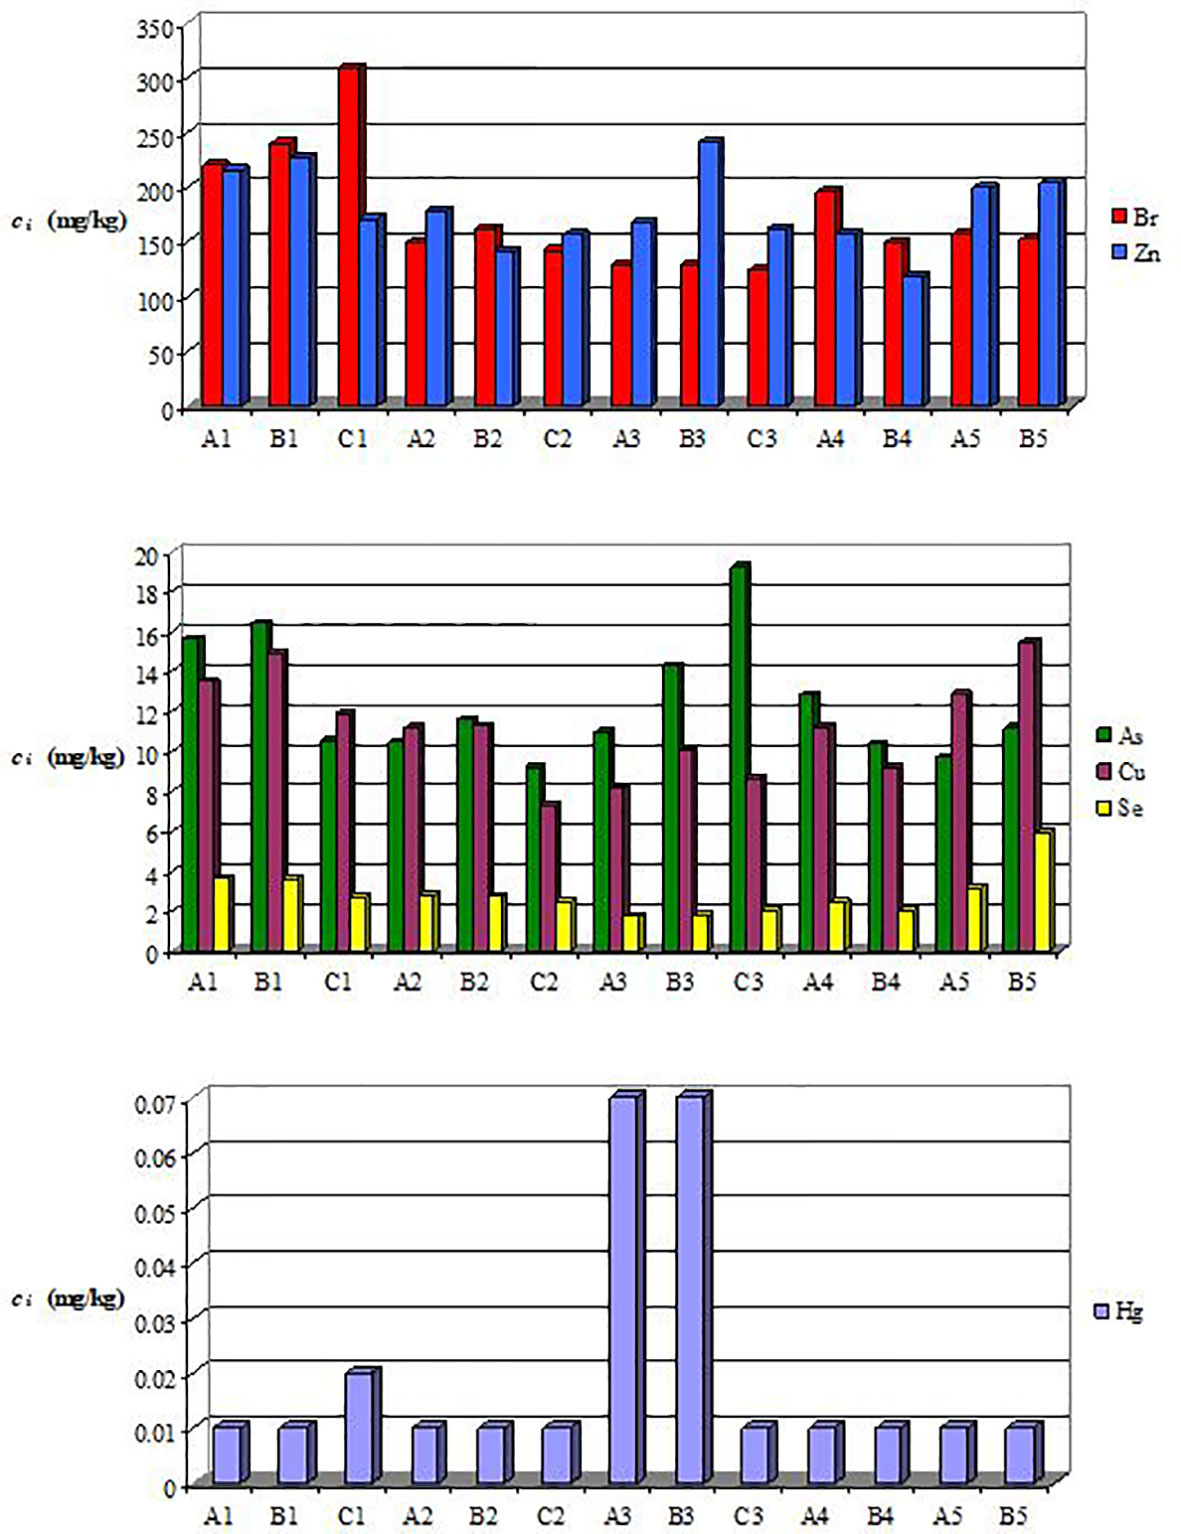
Figure 4 Levels of monthly concentration of trace elements in the soft tissue of mussel classes A, B, and C: 1−February, 2−March, 3−April, 4−May, 5−June.
3.4 Results of Statistical Data Analysis
The correlation matrix is presented in Table 2, where the significant values (except diagonal) of r at α=0.05 (two-tailed test) are highlighted in bold. The PCA results referring to eigenvalues indicated three eigenvalues that were >1, i.e., those corresponding to PC1 (5.06), PC2 (2.86), and PC3 (1.77). These first three PCs explain 80.7% (42.2%+23.8%+14.7%) of the total variance. Only PC1 and PC2 were used further in the analysis as the cumulative percentage of total variance explained by them was 66%. The factor loadings (coordinates of variables on the factor-plane PC1−PC2) are specified in Supplementary Table S2, where their significant levels [lj,PCk≥(m/n)0.5 = 0.408, j=1.n, k=1.m, n=12, m=2] are highlighted in bold. The factor scores (projections of cases on the factor-plane PC1−PC2) are summarized in Supplementary Table S3. The projections of variables (12) and cases (13 mussel samples) on the factor-plane PC1−PC2 are shown in Figure 5.
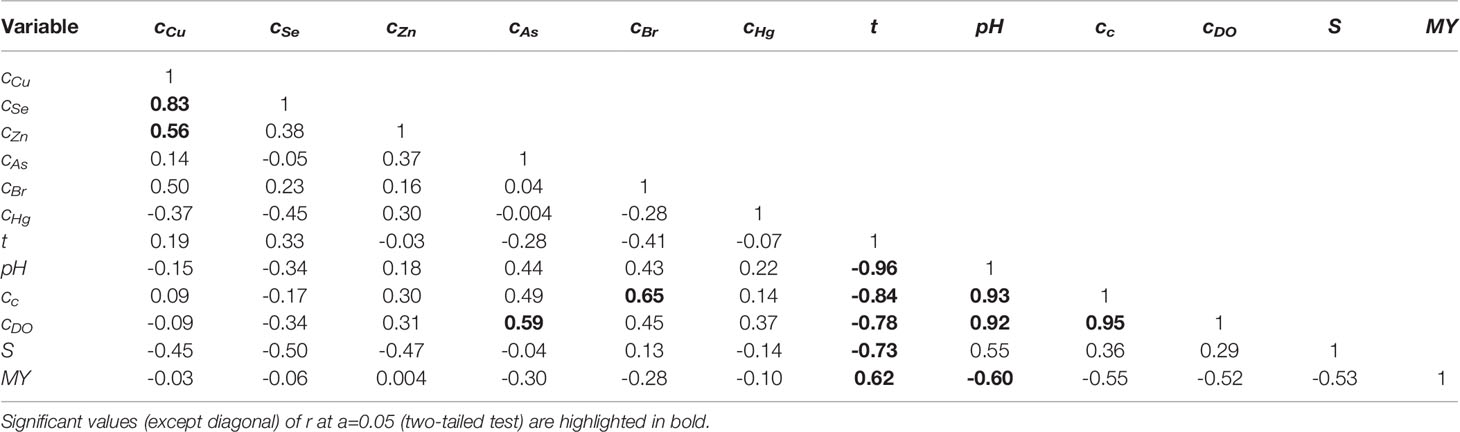
Table 2 Correlation matrix.
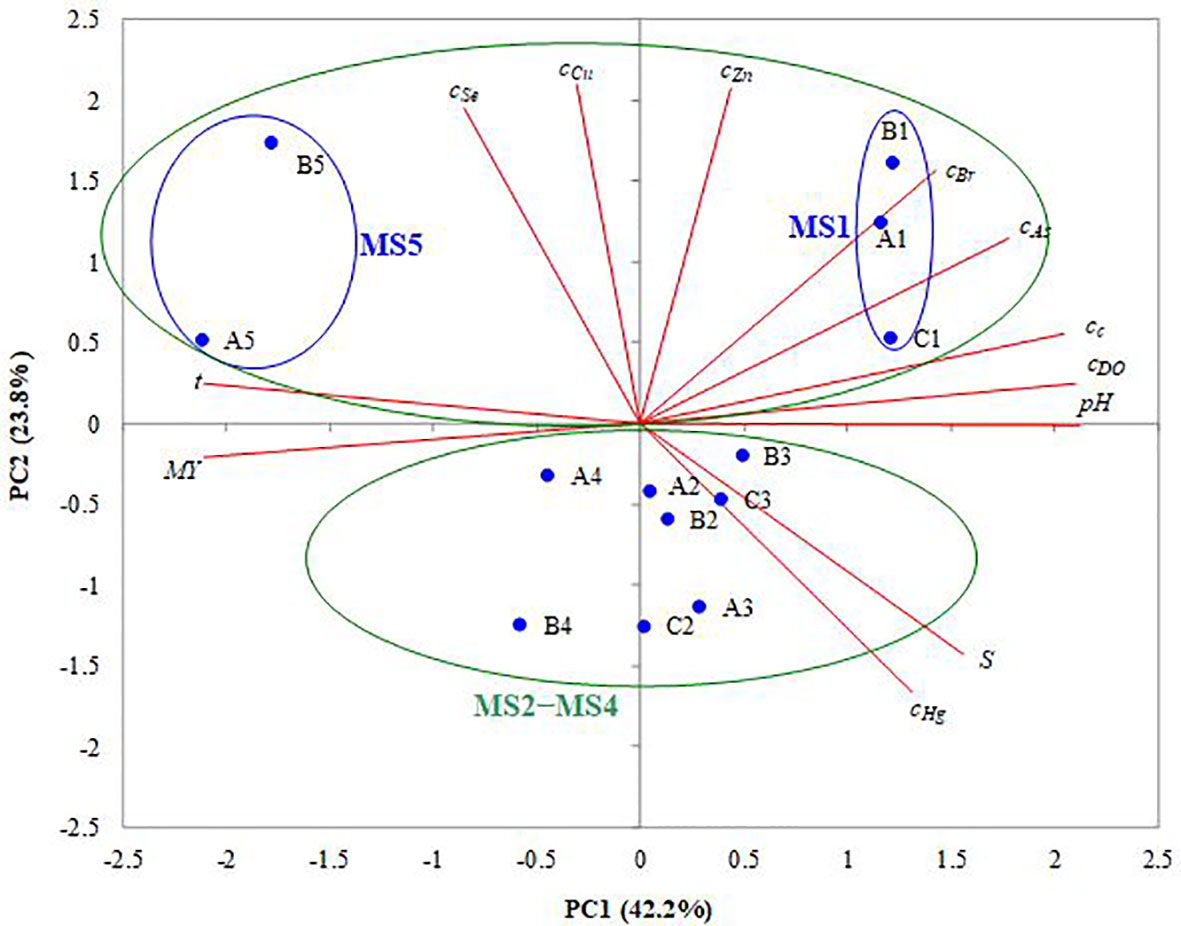
Figure 5 PCA bi-plot (projections of variables and samples on the factor-plane PC1−PC2).
4 Discussion
4.1 Physicochemical Characteristics of Seawater
The correlation coefficients (r) between the mean monthly values of seawater temperature (t), salinity (S), pH, chlorophyll a concentration (cc), and dissolved O2 concentration (cDO) are presented in Table 2. These correlation coefficients indicate the following issues: (i) a strong negative correlation between t and S (r=-0.73); (ii) a very strong negative correlation between t and pH (r=-0.96); an increase in the pH of seawater with a decrease in the temperature was reported in the related literature (Dickson, 1993); (iii) a very strong positive correlation between cc and pH (r=0.93); in the process of photosynthesis, CO2 from the water is taken up by algae, thus, the decomposition of into CO2 and HO− is favored, resulting in an increase in water pH (Zang et al., 2011); moreover, cc and t are very strongly negatively correlated (r=-0.84); (iv) very strong positive correlations between cDO and cc (r=0.95), cDO and pH (r=0.92), as reported in the literature (Zang et al., 2011), as well as a strong negative correlation between cDO and t (r=-0.78).
4.2 Mussel Growth Patterns and Meat Yield
The following mussel gametogenesis stages were reported for M. galloprovincialis (Ciocan, 2002; Suarez et al., 2005; Okaniwa et al., 2010; Bhaby et al., 2014; Azpeitia et al., 2017; Rouabhi et al., 2019): (i) 0 - sexual rest and accumulation of reserve substances (glycogen, lipids, proteins) in adipogranular (ADG) and vesicular connective tissue (VCT) cells; (ii) I - beginning of gametogenesis (multiplication of gonia, development of follicles); (iii) II - gamete development (immature ovules and spermatozoa, more apparent follicles); (iv) IIIa - gamete maturation (gonadal follicles full of mature gametes); (v) IIIb - spawning (gamete release); (vi) IIIc - gamete restoration; (vii) IIId - follicle cleaning process (gamete degradation).
Gametogenesis is energetically supported by two sources, i.e., reserve substances (stored in ADG and VCT cells) and directly ingested food (e.g, phytoplankton, dissolved organic matter, bacteria) (Azpeitia et al., 2017). Environmental conditions, especially the water temperature and salinity, the quantity and quality of available food, can heavily affect the gametogenesis stages and seasonal variations in mwf and MY (Aral, 1999; Suarez et al., 2005; Vasechkina and Kazankova, 2014; Azpeitia et al., 2017; Rouabhi et al., 2019). The mass of soft tissue increases significantly during the gamete development and maturation phases (II, IIIa) and can decrease up to 40% during the spawning phase (IIIb) (Cossa, 1989; Vasechkina and Kazankova, 2014). The data presented in Table 2 highlight a positive linear correlation between MY and t (r=0.62) as well as a negative correlation between MY and pH (r=-0.60).
According to the data reported in the related literature, specimens from class A (L=3−5.9 cm) are most likely in the first 2 years of life, whereas those from class C (L=9−12 cm) are more than 4 years old (Aral, 1999; Okaniwa et al., 2010; Vasechkina and Kazankova, 2014; Azpeitia et al., 2017). In M. galloprovincialis mussels, sexual maturity is attained in their first year of life (Vasechkina and Kazankova, 2014; Azpeitia et al., 2017).
Based on data from the literature (Ciocan, 2002; Suarez et al., 2005; Okaniwa et al., 2010; Bhaby et al., 2014; Vasechkina and Kazankova, 2014; Azpeitia et al., 2017; Rouabhi et al., 2019), the results presented in Figure 3 suggest the following issues: (i) for the smaller and younger mussels from class A, a sexual rest phase (0) is characteristic for the period of February−May, which suggests that immature specimens (up to 1 year old) are predominant; moreover, an early development phase (I) could occur at the end of this period; the significant increase in the flesh mass in June could be an effect of the gamete development and maturation phases (II and IIIa), and of favorable environmental factors (mainly higher temperatures and lower levels of salinity); (ii) for mussels from class B, the gamete development and maturation phases (II and IIIa) occur in February and March, followed by a first (intense) spawning phase (IIIb) in April, a restoration phase (IIIc) in May, and a second (slightly less intense) spawning phase (IIIb) in June; (iii) for the larger and older mussels from class C, the gamete development and maturation phases (II and IIIa) occur in the period of February−April (it is possible only in March and April), and are most likely followed by a spawning phase (IIIb) in May.
4.3 The Contents of Trace Elements in Mussel Soft Tissue
Cu, Se, and Zn are essential (physiological) elements for organisms, but at high concentrations they are also very toxic. Cu and Zn are constituents of hemocyanin and enzymes responsible for the proper functioning of metabolic pathways (Jakimska et al., 2011). The levels of cZn and cCu in February (171−226.5 mg/kg and 11.89−14.94 mg/kg, respectively) and June (199−203 mg/kg and 12.85−15.46 mg/kg, respectively) were among the highest of all months (Figure 4). Notably, the highest concentrations corresponded to specimens from classes A and B. It was reported that the concentrations of TEs (e.g., Cu, Zn, Se, Cd, Pb) in smaller and younger mussels, having higher metabolic rates, were higher than those in larger and older ones (Yap et al., 2009). Moreover, cZn and cCu were positively correlated (r=0.56 in Table 2). This finding suggests the possibility of similar sources of intake, e.g., port activities, wastewater discharges (Roméo et al., 2005; Kristan et al., 2014).
Se is involved in cell antioxidant mechanisms and can prevent excessive metal accumulation (Znidaric et al., 2006). The highest levels of cSe were in February (≈3.7 mg/kg) and June (3.2 mg/kg and 5.9 mg/kg, respectively) for specimens from classes A and B (Figure 4). For these size classes, the lowest levels of cSe (1.71 mg/kg and 1.76 mg/kg, respectively) and the highest level of cHg (0.07 mg/kg) were found in April. This finding is in line with that reported by Fowler and Benayoun (1976), who stated that the uptake of Se can be reduced in the presence of Hg. A negative correlation (r=-0.45) was observed between cSe and cHg, but it was not statistically significant at α=0.05 (Table 2). Moreover, the correlation matrix shown in Table 2 indicates a very strong positive correlation between cCu and cSe (r=0.83), suggesting the possibility of similar sources of intake.
Br, Hg, and As are considered non-essential elements for mussel metabolism. Br and Hg are harmful even at very low concentration. Inorganic forms of As, i.e., arsenate and arsenite, are toxic, whereas its organic forms, including arsenobetaine and arsenocholine, are generally considered non-toxic. Moreover, arsenobetaine has an important role in bivalve detoxification. The mussels take these non-essential elements from seawater as well as from ingested phytoplankton and other suspended particles (Stanković et al., 2011).
The Br present in the environment usually has an industrial origin, with the main anthropogenic sources being the brominated flame retardants (BFRs). Several organic forms of Br, e.g., polybrominated dibenzo-p-dioxins (PBDDs), polybrominated diphenyl ethers (PBDEs), have been found within the mussel tissues (Fernandes et al., 2009; Vidal-Liñán et al., 2015). Some researchers have reported that PBDDs may also be excreted by algae and/or cyanobacteria in the marine environment and transferred to marine species, e.g., mussels, fish, shellfish (Haglund et al., 2007). According to the data presented in Figure 4, higher levels of cBr were observed in February (220−309 mg/kg) and June (152−156 mg/kg), whereas lower levels were in April (124−129 mg/kg). The larger and older mussels from class C had the lowest value of cBr (124 mg/kg) in April, corresponding to the highest levels of mwf (23.4 g) and MY (41.71%). The mussels from classes A and B exhibited higher levels of cBr in March and April than those from class C, whereas the mussels from class C had the highest value of cBr (309 mg/kg) in February. The strong positive correlation between cBr and cc (r=0.65) (Table 2) indicates that the phytoplankton was an important source of Br.
The concentration of Hg (cHg) presented a major peak in April (0.07 mg/kg) for mussels from classes A and B. Notably, most of the Hg accumulated in the soft tissues of seafood is in the form of [CH3Hg]+, which is the toxic form (Stanković et al., 2011). Mytilus species are able to synthesize metal-binding proteins, i.e., metallothioneins (MTs), that protect the cell against metal toxicity. MTs are cysteine-rich proteins that can bind both essential (e.g., Cu, Zn, Se) and non-essential (e.g., Hg, As, Cd) elements by their thiol groups (Stanković et al., 2011).
The main sources of As in the marine environment are river inputs, groundwater, and marine sediments (Neff, 1997; Belivermis et al., 2016). Marine algae accumulate arsenate () from the water, reduce As5+ to As3+, convert the arsenite () to different organoarsenic compounds, and then release the and organoarsenic compounds into seawater (Neff, 1997). Some organic forms of As, such as dimethylarsinic acid (DMA) and methylarsonic acid (MMA), which are also found in mussels, were reported as potentially toxic to humans (Francesconi, 2010). Non-toxic arsenobetaine and arsenocholine are efficiently accumulated from seawater by blue mussels Mytilus edulis (Gailer et al., 1995). The plots in Figure 4 show that the mussels from classes A and B present higher levels of cAs in February and March than those from class C. In contrast, the larger and older mussels from class C had the highest value of cAs (19.26 mg/kg) in April, corresponding to the highest levels of mwf and MY. Positive correlations between cAs and cc (r=0.49), even if statistically non-significant at α=0.05, and between cAs and cDO (r=0.59) (Table 2) suggest that the phytoplankton blooms contributed to the enhanced uptake of As by the mussels.
4.3.1 PCA
Depending on the significant values of their coordinates (shown in bold in Supplementary Table S2), the most important variables are as follows: (i) pH (l8,PC1 = 0.981), cc (l9,PC1 = 0.943), cDO (l10,PC1 = 0.935), t (l7,PC1=-0.934), MY (l12,PC1=-0.675), S (l11,PC1 = 0.582), cAs (l3,PC1 = 0.481), and cBr (l2,PC1 = 0.476) for PC1; (ii) cCu (l4,PC2 = 0.940), cSe (l5,PC2 = 0.810), cZn (l1,PC2 = 0.708), S (l11,PC2=-0.533), and cBr (l2,PC2 = 0.523) for PC2. The projections of cases on the factor-plane PC1−PC2 (Supplementary Table S3 and Figure 5) indicate a good discrimination between the mussel (MS) groups collected in February and June on the PC1 direction. The PC1 coordinates of group MS1 (samples A, B, and C collected in February), i.e., 2.60−2.74, correspond to lower values of t (5°C) and MY (34.14−35.14%), as well as to higher values of pH (8.38), cc (4.16 mg/m3), cDO (339.8 mmol/m3), and cBr (220−309 mg/kg), where the values of t, pH, cc, and cDO between brackets are mean values. Concurrently, PC1 coordinates of group MS5 (samples A and B collected in June), i.e., from -4.77 to -4.01, correspond to higher values of t (22°C) and MY (69.46% for A5 class), as well as to lower values of pH (8.22), cc (0.29 mg/m3), cDO (318.0 mmol/m3), and S (13.3 PSU). In contrast, PC2 can discriminate between the samples collected in February and June (groups MS1 and MS5 with PC2 coordinates of 0.90−2.72), which generally had higher values of cBr (152−309 mg/kg), cZn (171−227 mg/kg), cCu (11.9−15.5 mg/kg), and cSe (2.71−5.92 mg/kg), and those collected in March−May (groups MS2−MS4 with PC2 coordinates between -2.12 and -0.33), which had lower values of cBr (124−195 mg/kg), cZn (118−178 mg/kg), cCu (7.32−11.3 mg/kg), and cSe (1.71−2.81 mg/kg).
On one hand, PCA emphasizes that PC1 is positively associated with cAs, cBr, cc, cDO, pH, and S, as well as negatively associated with t and MY. This indicates that the phytoplankton was an important source of As and Br for the smaller mussels collected in February (group MS1) compared to the larger ones collected in June (group MS5). Referring to the mean (m) values of seawater properties, lower levels of tm (5°C) as well as higher levels of pHm (8.38) and Sm (15.5 PSU) were reached in February compared to June (tm=22 °C, pHm=8.22, and Sm=13.3 PSU). On the other hand, PC2 is positively associated with cCu, cSe, cZn, and cBr, as well as negatively associated with S. This suggests that Cu, Se, Zn, and Br originated from similar anthropogenic sources and their higher concentrations reported in February and June were obtained at lower levels of S, corresponding to higher flow rates of the Danube in these two months.
4.3.2 Comparison With Other Studies and Maximum Permissible Levels of Element Concentration
The levels of TE concentrations in the soft tissue of M. galloprovincialis species determined in this study (dry basis) were compared with those reported in the related literature in Table 3. The values of cCu found in this study were up to 1.5 times higher and those of cHg 1.5 times lower than the values reported by Roméo et al. (2005) in the same location (2001−2002). The levels of cZn were similar to those reported by Roméo et al. (2005). Moreover, the levels of cCu, cZn, and cAs reported in this study were quite similar to those found for mussels from Turkey (Black Sea, Sea of Marmara, and Aegean Sea) (Belivermis et al., 2016), Montenegro (Adriatic Sea) (Stanković et al., 2011; Joksimović et al., 2012; Jović et al., 2012), Croatia (Bay of Mali Ston, Adriatic Sea) (Kljaković-Gašpić et al., 2007), Slovenia (Gulf of Trieste, Adriatic Sea) (Kristan et al., 2014; Bajc and Kirbis, 2019), Spain (Atlantic Ocean and Mediterranean Sea) (Deudero et al., 2009; Besada et al., 2011), and Morocco (Atlantic Ocean) (Maanan, 2007). In contrast, the levels of cHg (0.01−0.07 mg/kg) were generally much lower than the values in mussels from Montenegro (0.1−0.5 mg/kg) (Stanković et al., 2011; Jović et al., 2012), Croatia (0.08−0.28 mg/kg) (Kljaković-Gašpić et al., 2007), Spain (0.04−0.54 mg/kg) (Deudero et al., 2009; Besada et al., 2011), and Morocco (0.01−2.31 mg/kg) (Maanan, 2007). There is very little information on the Se and Br concentrations in the soft tissue of M. galloprovincialis species in the Black Sea. The values of cSe from 6.8 mg/kg to 40.8 mg/kg and of cBr from 30 mg/kg to 209 mg/kg were reported in a recent study on the mussels collected from coasts of Sevastopol (Crimea) (Kapranov et al., 2021). The values of cSe measured in the current study (1.71−5.92 mg/kg) were lower than those reported by Kapranov et al. (2021), whereas the values of cBr (124−309 mg/kg) were quite similar.
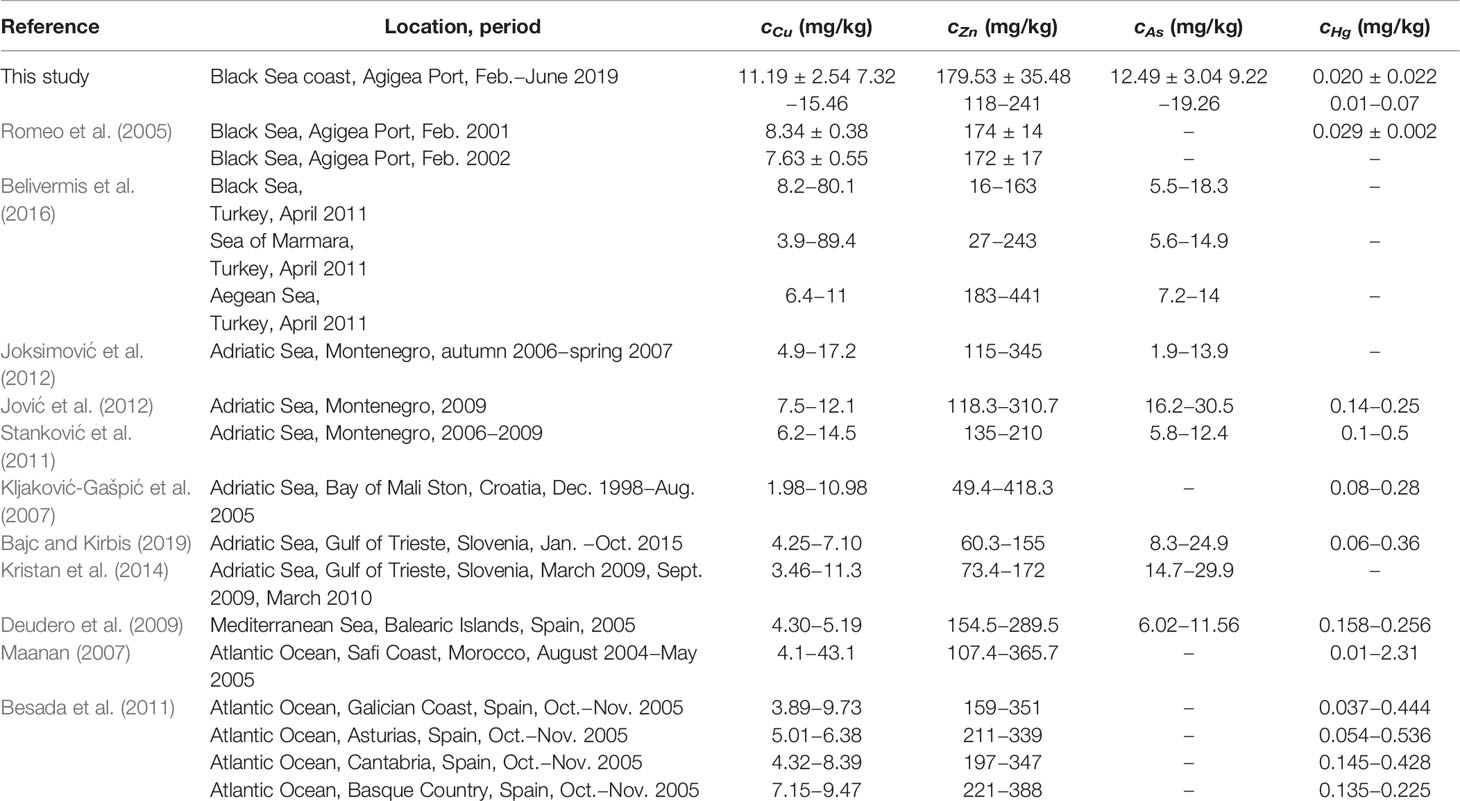
Table 3 Concentrations (dry basis) of some trace elements in the soft tissue of M. galloprovincialis mussels.
Where available, the element concentrations obtained in this study (wet basis) were compared with the maximum permissible levels (MPLs) (Wagner and Boman, 2003; Wagner and Boman, 2004; EC 1881, 2006) (Supplementary Table S4). The values of cCu (0.841−1.777 mg/kg), cZn (13.56−27.70 mg/kg), cSe (0.197−0.680 mg/kg), cAs (1.060−2.214 mg/kg), and cHg (0.001−0.008 mg/kg) were lower than their corresponding MPLs, i.e., 30 mg/kg, 100 mg/kg, 2 mg/kg, 5 mg/kg, and 0.5 mg/kg (wet basis).
5 Conclusions
The current study provides new information on the concentration of some TEs, i.e., Cu, Se, Zn, As, Br, and Hg, in the soft tissue of M. galloprovincialis mussels collected from an artificial rocky substrate (Agigea Port, Romania). The order of accumulation was as follows: Zn>Br>As>Cu>Se>Hg. Different element bioaccumulation patterns were identified within the three classes of mussel length, i.e., A (3−5.9 cm), B (6−8.9 cm), and C (9−12 cm). Higher element concentrations were generally found for the mussels from classes A and B compared to the larger and older mussels from class C.
The variables used in multivariate analysis were as follows: seawater temperature (t=4−24°C), salinity (S=10.4−19 PSU), pH (8.20−8.40), chlorophyll a concentration (cc=0.1−6 mg/m3), dissolved oxygen concentration (cDO=289−357 mmol/m3), meat yield (MY=34.1−69.5%), concentrations (dry basis) of As (cAs=9.22−19.3 mg/kg), Br (cBr=124−309 mg/kg), Cu (cCu=7.32−15.5 mg/kg), Hg (cHg=0.01−0.07 mg/kg), Se (cSe=1.71−5.92 mg/kg), and Zn (cZn=118−241 mg/kg). The MY was positively correlated with t and negatively correlated with pH. The results of PCA indicated the following relevant issues: (i) PC1 was positively associated with cAs, cBr, cc, cDO, pH, and S, as well as negatively associated with t and MY; this suggests that the phytoplankton represented an important source of As and Br for the smaller mussels collected in February (when the levels of t were lower and those of pH and S higher) compared to the larger mussels collected in June; (ii) PC2 was positively associated with cCu, cSe, cZn, and cBr, as well as negatively associated with S, indicating that Cu, Se, Zn, and Br originated from similar sources (e.g., port activities, wastewater discharges) and their higher concentrations reported in February and June were obtained at lower levels of S (corresponding to higher flow rates of the Danube).
The concentrations of As, Cu, Hg, and Zn fall in the range of those found in low to moderately polluted areas. The levels of cHg, i.e., 0.001−0.008 mg/kg (wet basis), were much lower than the maximum permissible level specified in EC 1881 (2006), i.e., 0.5 mg/kg. Furthermore, temporal variations of concentrations of Br and Se were reported. Few studies on mussels from the Black Sea have focused on the assessment of Br and Se bioaccumulation. The information provided may be useful in supplementing existing data on TE pollution in the Black Sea.
Data Availability Statement
The original contributions presented in the study are included in the article/Supplementary Material. Further inquiries can be directed to the corresponding authors.
Author Contributions
AB, OP, and DV wrote the main manuscript text. OP and DV had a substantial contribution to the conception of article, statistical analysis, and interpretation of results. AB and MM performed and described the experimental part. All authors reviewed the manuscript. All authors contributed to the article and approved the submitted version.
Funding
The study was financially supported by the Romanian Ministry of Research, Innovation and Digitization in the framework of the national CORE Program (projects PN 19200302 and 19200102) and PFE/2021 “Research of excellence for pointing out environmental and biotical changes in ancient and recent aquatic systems−AMBIACVA
Conflict of Interest
The authors declare that the research was conducted in the absence of any commercial or financial relationships that could be construed as a potential conflict of interest.
Publisher’s Note
All claims expressed in this article are solely those of the authors and do not necessarily represent those of their affiliated organizations, or those of the publisher, the editors and the reviewers. Any product that may be evaluated in this article, or claim that may be made by its manufacturer, is not guaranteed or endorsed by the publisher.
Acknowledgments
The authors thank SCECB “Natura Z” Association for providing M. galloprovincialis samples collected by scuba divers, the habitat destruction being carefully avoided.
Supplementary Material
The Supplementary Material for this article can be found online at: https://www.frontiersin.org/articles/10.3389/fmars.2022.899555/full#supplementary-material
References
Agency for Toxic Substances and Disease Registry (ATSDR) (2020). Completed Exposure Pathway (CEP) Site Count Report. Atsdr’s Substance Priority List. Available at: https://www.atsdr.cdc.gov/cep/index.html.
Ansari T. M., Marr I. L., Tariq N. (2004). Heavy Metals in Marine Pollution Perspective-a Mini Review. J. Appl. Sci. 4 (1), 1–20.
Aral O. (1999). Growth of the Mediterranean Mussel (Mytilus Galloprovincialis Lam. 1819) on Ropers in the Black Sea, Turkey. Turk. J. Vet. Anim. Sci. 23 (2), 183–189.
Copernicus Marine Environment Monitoring Service Platform. Available at: https://resources.marine.copernicus.eu.
Azizi G., Layachi M., Akodad M., Yáñez-Ruiz D. R., Martín-García A. I., Baghour M., et al. (2018). Seasonal Variations of Heavy Metals Content in Mussels (Mytilus Galloprovincialis) From Cala Iris Offshore (Northern Morocco). Mar. Pollut. Bull. 137, 688–694. doi: 10.1016/j.marpolbul.2018.06.052
Azpeitia K., Ortiz-Zarragoitia M., Revilla M., Mendiola D. (2017). Variability of the Reproductive Cycle in Estuarine and Coastal Populations of the Mussel Mytilus Galloprovincialis Lmk. From the SE Bay of Biscay (Basque Country). Int. Aquat. Res. 9, 329–350. doi: 10.1007/s40071-017-0180-3
Bajc Z., Kirbis A. (2019). Trace Element Concentrations in Mussels (Mytilus Galloprovincialis) From the Gulf of Trieste, Slovenia. J. Food Prot. 82 (3), 429–434. doi: 10.4315/0362-028X.JFP-18-378
Bat L., Arici E., Öztekin A. (2018). Human Health Risk Assessment of Heavy Metals in the Black Sea: Evaluating Mussels. Curr. World Environ. 13 (1), 15–31. doi: 10.12944/CWE.13.1.03
Belivermis M., Kılıç Ö., Çotuk Y. (2016). Assessment of Metal Concentrations in Indigenous and Caged Mussels (Mytilus Galloprovincialis) on Entire Turkish Coastline. Chemosphere 144, 1980–1987. doi: 10.1016/j.chemosphere.2015.10.098
Besada V., Andrade J. M., Schultze F., González J. J. (2011). Monitoring of Heavy Metals in Wild Mussels (Mytilus Galloprovincialis) From the Spanish North-Atlantic Coast. Cont. Shelf Res. 31 (5), 457–465. doi: 10.1016/j.csr.2010.04.011
Bhaby S., Belhsen O. K., Errhif A. (2014). Mytilus Galloprovincialis; Reproduction Activity and Mantle Structure in a Zone Located in the Northwest of the Atlantic Ocean (Imessouane, Morocco). J. Mar. Biol. Oceanogr. 3 (1), 1–8. doi: 10.4172/2324-8661.1000124
Bucșe A., Pârvulescu O. C., Vasiliu D., Lupașcu N., Voica C. (2021). Levels of Heavy Metal Concentration in M. Galloprovincialis Mollusc Species From NW Black Sea (Romania). U.P.B. Sci. Bull. Ser. B 83 (3), 51–60.
Bucșe A., Vasiliu D., Bălan S., Pârvulescu O. C., Dobre T. (2020). Heavy Metal Spatial Distribution and Pollution Assessment in the Surface Sediments of the North–Western Black Sea Shelf. Rev. Chim. 71 (4), 155–170. doi: 10.37358/RC.20.4.8054
Cantillo A. Y. (1998). Comparison of Results of Mussel Watch Programs of the United States and France With Worldwide Mussel Watch Studies. Mar. Pollut. Bull. 36 (9), 712–717. doi: 10.1016/S0025-326X(98)00049-6
Cevik U., Damla N., Kobya A. I., Bulut V. N., Duran C., Dalgıc G., et al. (2008). Assessment of Metal Element Concentrations in Mussel (M. Galloprovincialis) in Eastern Black Sea, Turkey. J. Haz. Mat. 160 (2–3), 396–401. doi: 10.1016/j.jhazmat.2008.03.010
Chirila E., Draghici C., Puhacel A. (2014). Total and Dissolved Metals Occurrence in Municipal Wastewater Treatment Plant Effluents. Environ. Eng. Manage. J. 13 (9), 2211–2218.
Ciocan C. (2002). Reproduction of Mytilus Galloprovincialis (Lmk) in the Romanian Waters of the Black Sea. Recherches. Mar. 34, 23–28.
Cossa D. (1989). A Review of the Use of Mytilus Spp. As Quantitative Indicators of Cadmium and Mercury Contamination in Coastal Waters. Oceanol. Acta 12 (4), 417–432.
Cozzi S., Ibáñez C., Lazar L., Raimbault P., Giani M. (2019). Flow Regime and Nutrient-Loading Trends From the Largest South European Watersheds: Implications for the Productivity of Mediterranean and Black Sea’s Coastal Areas. Water 11 (1), 1–27. doi: 10.3390/w11010001
Crăciun M. E., Pârvulescu O. C., Donise A. C., Dobre T., Stanciu D. R. (2020). Characterization and Classification of Romanian Acacia Honey Based on its Physicochemical Parameters and Chemometrics. Sci. Rep. 10 (1), 20690. doi: 10.1038/s41598-020-77685-9
Deudero S., Box A., Tejada S., Tintoré J. (2009). Stable Isotopes and Metal Contamination in Caged Marine Mussel Mytilus Galloprovincialis. Mar. Pollut. Bull. 58 (7), 1025–1031. doi: 10.1016/j.marpolbul.2009.02.011
Dickson A. G. (1993). The Measurement of Sea Water Ph. Mar. Chem. 44 (2–4), 131–142. doi: 10.1016/0304-4203(93)90198-W
EC 1881 (2006). Commission Regulation (EC) Setting Maximum Levels for Certain Contaminants in Foodstuffs. Off. J. Eur. Union.
Fattorini D., Notti A., Di Mento R., Cicero A. M., Gabellini M., Russo A., et al. (2008). Seasonal, Spatial and Inter-Annual Variations of Trace Metals in Mussels From the Adriatic Sea: A Regional Gradient for Arsenic and Implications for Monitoring the Impact of Off-Shore Activities. Chemosphere 72 (10), 1524–1533. doi: 10.1016/j.chemosphere.2008.04.071
Fernandes A., Mortimer D., Gem M., Dicks P., Smith F., White S., et al. (2009). Brominated Dioxins (PBDD/Fs) and PBDEs in Marine Shellfish in the UK. Food Addit. Contam. 26 (6), 918–927. doi: 10.1080/02652030902803026
Fowler S. W., Benayoun G. I. (1976). Influence of Environmental Factors on Selenium Flux in Two Marine Invertebrates. Mar. Biol. 37, 59–68. doi: 10.1007/BF00386779
Francesconi K. A. (2010). Arsenic Species in Seafood: Origin and Human Health Implications. Pure. Appl. Chem. 82 (2), 373–381. doi: 10.1351/PAC-CON-09-07-01
Gailer J., Francesconi K. A., Edmonds J. S., Lrgolic K. J. (1995). Metabolism of Arsenic Compounds by the Blue Mussel Mytilus Edulis After Accumulation From Seawater Spiked With Arsenic Compounds. Appl. Organomet. Chem. 9 (4), 341–355. doi: 10.1002/aoc.590090408
Goldberg E. D., Koide M., Hodge V., Flegal A. R., Martin J. (1983). U.S. Mussel Watch: 1977–1978 Results on Trace Metals and Radionuclides. Estuar. Coast. Shelf Sci. 16, 69–93. doi: 10.1016/0272-7714(83)90095-1
Haglund P., Malmvärn A., Bergek S., Bignert A., Kautsky L., Nakano T., et al. (2007). Brominated Dibenzo-P-Dioxins: A New Class of Marine Toxins. Environ. Sci. Technol. 41, 3069–3074. doi: 10.1021/es0624725
Jakimska A., Konieczka P., Skora K., Namieśnik J. (2011). Bioaccumulation of Metals in Tissues of Marine Animals, Part 1: The Role and Impact of Heavy Metals on Organisms. Pol. J. Environ. Stud. 20 (5), 1117–1125.
Joksimović D., Kljajić Z., Stanković S. (2012). Concentrations of Heavy Metals (Zn, Cu , Pb , Cd and As) in the Mediterranean Mussel Mytilus Galloprovincialis From the Montenegrin Coast of the Southeastern Adriatic Sea. Water Res. Manage. 2 (3), 3–9.
Jović M., Onjia A., Stanković S. (2012). Toxic Metal Health Risk by Mussel Consumption. Environ. Chem. Lett. 10, 69–77. doi: 10.1007/s10311-011-0330-6
Kapranov S. V., Karavantseva N. V., Bobko N. I., Ryabushko V. I., Kapranova L. L. (2021). Sex- and Sexual Maturation-Related Aspects of the Element Accumulation in Soft Tissues of the Bivalve Mytilus Galloprovincialis Lam. Collected Off Coasts of Sevastopol (Southwestern Crimea, Black Sea). Environ. Sci. Pollut. Res. 28, 21553–21576. doi: 10.1007/s11356-020-12024-z
Kljaković-Gašpić Z., Ujević I., Zvonarić T., Barić A. (2007). Biomonitoring of Trace Metals (Cu, Cd, Cr, Hg, Pb, Zn) in Mali Ston Bay (Eastern Adriatic) Using the Mediterranean Blue Mussel, (1998–2005). Acta Adriat. 48 (1), 73–88.
Kristan U., Kanduč T., Osterc A., Šlejkovec Z., Ramšak A., Stibilj V. (2014). Assessment of Pollution Level Using Mytilus Galloprovincialis as a Bioindicator Species: The Case of the Gulf of Trieste. Mar. Pollut. Bull. 89 (1–2), 455–463. doi: 10.1016/j.marpolbul.2014.09.046
Lazăr L., Boicenco L., Coatu V., Oros A., Tigănuș D., Mihailov M. E. (2013). Nutrient Levels and Eutrophication of the Romanian Black Sea Waters, (2006–2011)–Assessment Related to the Marine Strategy Framework Directive Implementation. Recherches. Mar. 43 (1), 162–173.
Maanan M. (2007). Biomonitoring of Heavy Metals Using Mytilus Galloprovincialis in Safi Coastal Waters, Morocco. Environ. Toxicol. 22 (5), 525–531. doi: 10.1002/tox.20301
Nardi A., Benedetti M., d’Errico G., Fattorini D., Regoli F. (2018). Effects of Ocean Warming and Acidification on Accumulation and Cellular Responsiveness to Cadmium in Mussels Mytilus Galloprovincialis: Importance of the Seasonal Status. Aquat. Toxicol. 204, 171–179. doi: 10.1016/j.aquatox.2018.09.009
Nardi A., Mincarelli L. F., Benedetti M., Fattorini D., d’Errico G., Regoli F. (2017). Indirect Effects of Climate Changes on Cadmium Bioavailability and Biological Effects in the Mediterranean Mussel Mytilus Galloprovincialis. Chemosphere 169, 493–502. doi: 10.1016/j.chemosphere.2016.11.093
Neff J. M. (1997). Ecotoxicology of Arsenic in the Marine Environment–Review. Environ. Toxicol. Chem. 16 (5), 917–927. doi: 10.1002/etc.5620160511
Okaniwa N., Miyaji T., Sasaki T., Tanabe K. (2010). Shell Growth and Reproductive Cycle of the Mediterranean Mussel Mytilus Galloprovincialis in Tokyo Bay, Japan: Relationship With Environmental Conditions. Plankton. Benthos. Res. 5, 214–220. doi: 10.3800/pbr.5.214
Oros A. (2019). Monitoring and Assessment of Heavy Metals in the Romanian Black Sea Ecosystem During 2006–2018, in the Context of Marine Strategy Framework Directive (MSFD) 2008/56/EC Implementation. Recherches. Mar. 49 (1), 8–33.
Oros A., Gomoiu M. T. (2010). Comparative Data on the Accumulation of Five Heavy Metals (Cadmium, Chromium, Copper, Nickel, Lead) in Some Marine Species (Mollusks, Fish) From the Romanian Sector of the Black Sea. Recherches. Mar. 39, 89–108.
Oros A., Gomoiu M. T. (2012). A Review of Metal Bioaccumulation Levels in the Romanian Black Sea Biota During the Last Decade – a Requirement for Implementing Marine Strategy Framework Directive (Descriptors 8 and 9). J. Environ. Prot. Ecol. 13 (3A), 1730–1743.
Robescu L. D., Presură E. (2017). Reducing Carbon Footprint of a Wastewater Treatment Plant Using Advanced Treatment and Renewable Energy Sources. Environ. Eng. Manage. J. 16 (5), 1055–1062. doi: 10.30638/eemj.2017.108
Roméo M., Frasila C., Gnassia-Barelli M., Damiens G., Micu D., Mustata G. (2005). Biomonitoring of Trace Metals in the Black Sea (Romania) Using Mussels Mytilus Galloprovincialis. Water Res. 39 (4), 596–604. doi: 10.1016/j.watres.2004.09.026
Romero-Freire A., Lassoued J., Silva E., Calvo S., Pérez F. F., Bejaoui N., et al. (2020). Trace Metal Accumulation in the Commercial Mussel M. Galloprovincialis Under Future Climate Change Scenarios. Mar. Chem. 224, 103840. doi: 10.1016/j.marchem.2020.103840
Rouabhi Y. L., Grosjean P., Boutiba Z., Hacene O. R., Richir J. (2019). Reproductive Cycle and Follicle Cleaning Process of Mytilus Galloprovincialis (Mollusca: Bivalvia) From a Polluted Coastal Site in Algeria. Invertebr. Reprod. Dev. 63 (4), 255–267. doi: 10.1080/07924259.2019.1631221
Santos I., Diniz M. S., Carvalho M. L., Santos J. P. (2014). Assessment of Essential Elements and Heavy Metals Content on Mytilus Galloprovincialis From River Tagus Estuary. Biol. Trace Elem. Res. 159, 233–240. doi: 10.1007/s12011-014-9974-y
Shen H., Kibria G., Wu R. S. S., Morrison P., Nugegoda D. (2020). Spatial and Temporal Variations of Trace Metal Body Burdens of Live Mussels Mytilus Galloprovincialis and Field Validation of the Artificial Mussels in Australian Inshore Marine Environment. Chemosphere 248, 126004. doi: 10.1016/j.chemosphere.2020.126004
Stanković S., Jović M., Milanov R., Joksimović D. (2011). Trace Elements Concentrations (Zn, Cu, Pb, Cd, As and Hg) in the Mediterranean Mussel (Mytilus Galloprovincialis) and Evaluation of Mussel Quality and Possible Human Health Risk From Cultivated and Wild Sites of the Southeastern Adriatic Sea, Montenegro. J. Serb. Chem. Soc 76 (12), 1725–1737. doi: 10.2298/JSC110420095S
Suarez M. P., Alvarez C., Molist P., San Juan F. (2005). Particular Aspects of Gonadal Cycle and Seasonal Distribution of Gametogenic Stages of Mytilus Galloprovincialis Cultures in the Estuary of Vigo. J. Shellfish. Res. 24 (2), 531–540. doi: 10.2983/0730-8000(2005)24[531:PAOGCA]2.0.CO;2
Vasechkina E. F., Kazankova I. I. (2014). Mathematical Modeling of the Growth and Development of the Mussel Mytilus Galloprovincialis on Artificial Substrates. Oceanology 54 (6), 763–770. doi: 10.1134/S0001437014060113
Vasiliu D., Boicenco L., Gomoiu M. T., Lazar L., Mihailov M. E. (2012). Temporal Variation of Surface Chlorophyll a in the Romanian Near-Shore Waters. Mediterr. Mar. Sci. 13 (2), 213–226. doi: 10.12681/mms.301
Vidal-Liñán L., Bellas J., Fumega J., Beiras R. (2015). Bioaccumulation of BDE-47 and Effects on Molecular Biomarkers Acetylcholinesterase, Glutathione-S-Transferase and Glutathione Peroxidase in Mytilus Galloprovincialis Mussels. Ecotoxicology 24, 292–300. doi: 10.1007/s10646-014-1377-5
Wagner A., Boman J. (2003). Biomonitoring of Trace Elements in Muscle and Liver Tissue of Freshwater Fish. Spectrochim. Acta B: At. Spectrosc. 58 (12), 2215–2226. doi: 10.1016/j.sab.2003.05.003
Wagner A., Boman J. (2004). Biomonitoring of Trace Elements in Vietnamese Freshwater Mussels. Spectrochim. Acta B: At. Spectrosc. 59 (8), 1125–1132. doi: 10.1016/j.sab.2003.11.009
Wang W. X., Dei R. C. H. (2001). Effects of Major Nutrient Additions on Metal Uptake in Phytoplankton. Environ. Pollut. 111, 233–240. doi: 10.1016/S0269-7491(00)00071-3
Yap C. K., Ismail A., Tan S. (2009). Effect of Body Size on Heavy Metal Contents and Concentrations in Green-Lipped Mussel Perna Viridis (Linnaeus) From Malaysian Coastal Waters. Pertanika J. Sci. Technol. 17 (1), 61–68.
Zang C., Huang S., Wu M., Du S., Scholz M., Gao F., et al. (2011). Comparison of Relationships Between Ph, Dissolved Oxygen and Chlorophyll for Aquaculture and non-Aquaculture Water. Water Air. Soil Pollut. 219, 157–174. doi: 10.1007/s11270-010-0695-3
Zhao L., Yang F., Yan X. (2021). Eutrophication Likely Prompts Metal Bioaccumulation in Edible Clams. Ecotoxicol. Environ. Saf. 224, 112671. doi: 10.1016/j.ecoenv.2021.112671
Znidaric M. T., Falnoga I., Skreblin M., Turk V. (2006). Induction of Metallothionein-Like Proteins by Mercury and Distribution of Mercury and Selenium in the Cells of Hepatopancreas and Gill Tissues in Mussel Mytilus Galloprovincialis. Biol. Trace Elem. Res. 111, 121–135. doi: 10.1385/BTER:111:1:121
Keywords: trace element, Mytilus galloprovincialis, Agigea Port, Black Sea, multivariate analysis
Citation: Bucşe A, Pârvulescu OC, Vasiliu D and Mureșan M (2022) The Contents of Some Trace Elements (As, Br, Cu, Hg, Se, and Zn) in Mytilus galloprovincialis Mussels From Agigea Port, Romania. Front. Mar. Sci. 9:899555. doi: 10.3389/fmars.2022.899555
Received: 18 March 2022; Accepted: 02 May 2022;
Published: 01 June 2022.
Edited by:
Xiutang Yuan, Yantai Institute of Coastal Zone Research (CAS), ChinaReviewed by:
Moslem Sharifinia, Iranian Fisheries Science Research Institute, IranLiqiang Zhao, Guangdong Ocean University, China
Copyright © 2022 Bucşe, Pârvulescu, Vasiliu and Mureșan. This is an open-access article distributed under the terms of the Creative Commons Attribution License (CC BY). The use, distribution or reproduction in other forums is permitted, provided the original author(s) and the copyright owner(s) are credited and that the original publication in this journal is cited, in accordance with accepted academic practice. No use, distribution or reproduction is permitted which does not comply with these terms.
*Correspondence: Oana Cristina Pârvulescu, b2FuYS5wYXJ2dWxlc2N1QHlhaG9vLmNvbQ==; Dan Vasiliu, ZGFuLnZhc2lsaXVAZ2VvZWNvbWFyLnJv