 Telmo Morato1,2*†
 Manuela Juliano1,3†
 Christopher K. Pham1,2
 Marina Carreiro-Silva1,2
 Inês Martins1,2
 Ana Colaço1,2
- 1Institute of Marine Sciences - Okeanos, University of the Azores, Horta, Portugal
- 2Instituto do Mar - IMAR, University of the Azores, Horta, Portugal
- 3Marine Environment and Technology Laboratory - Laboratório do Ambiente Marinho e Tecnologia University of Azores, Praia da Vitória, Portugal
It is increasingly recognised that deep-sea mining of seafloor massive sulphides (SMS) could become an important source of mineral resources. These operations will remove the targeted substrate and produce potentially toxic plumes from in situ seabed excavation and from the return water pumped back down to the seafloor. However, the spatial extent of the impact of deep-sea mining is still uncertain because few field experiments and models of plume dispersion have been conducted. In this study, we used three-dimensional hydrodynamic models of the Azores region together with a theoretical commercial mining operation of polymetallic SMS to simulate the potential dispersal of plumes originating from different phases of mining operations, and to assess the magnitude of potential impacts. Although the model simulations presented here were subject to many caveats, they did reveal some important patterns. The model projected marked differences among sites making generalisations about plume-dispersal patterns in mid-ocean ridges difficult. Nevertheless, the models predicted large horizontal and vertical plume-dispersals above the thresholds adopted. Persistent plumes (temporal frequency >50%, i.e., 6 months out of 12 months) were projected to disperse an average linear distance of 10 to 20 km, cover an area of 17 to 150 km2, and extend more than 800 m in the water column. In fact, the model projected that plumes may disperse beyond the licensed mining areas, reach the flanks and summits of nearby topographic features, and extend into the bathypelagic, mesopelagic, and epipelagic environments. Modelled plume-dispersal overlaps with the predicted distribution of cold-water corals and with existing fishing activities. These potential impacts would be of particular concern in regions such as the Azores, where local populations are highly dependent on the sea for their livelihoods. The findings of this study are an important initial step towards understanding the nature and magnitude of deep-sea mining impacts in space and time.
1 Introduction
Recognition that deep-sea seafloor massive sulphides (SMS) mining could become an important source of minerals has become increasingly prevalent (Petersen et al., 2016; Sharma, 2017), as large concentrations of copper, zinc, silver, and gold have been discovered in deep-sea hydrothermal vent deposits in many areas of the world’s oceans (Herzig et al., 2002; Hannington et al., 2011; Murton et al., 2019). Not surprisingly, the International Seabed Authority (ISA) has awarded several contracts for polymetallic sulphide exploration in the Mid-Atlantic Ridge (MAR) south of the Azores to Russia, France, and Poland, and in the Mid- and Southwest- Indian Ridges to China, the Republic of Korea, Germany, and India (ISA, 2021).
Although commercial mining of seafloor massive sulphides has not yet occurred, it will likely happen in the future, as the first pilot mining tests have successfully delivered large quantities of ore to the production vessel (Okamoto et al., 2018; Okamoto et al., 2019). These operations will remove the targeted substrate and associated organisms and will produce potentially toxic plumes from in situ seabed excavation and from the return water pumped back down close to the seafloor (Coffey Natural Systems, 2008; Boschen et al., 2013; Hauton et al., 2017; Weaver & Billett, 2019; Muñoz-Royo et al., 2021). These impacts will most likely affect local biodiversity, species abundance and ecosystem services, as well as the marine food webs and ecosystem functioning in both benthic and pelagic ecosystems (Boschen et al., 2016; Le et al., 2017; Van Dover et al., 2017; Drazen et al., 2020; Boschen-Rose et al., 2021). It is, therefore, widely recognised that the mining of polymetallic sulphides at active and inactive vent sites can impact the marine environment and human activities even far away from the actual mining site (Levin et al., 2016; Niner et al., 2018; Sharma, 2019; Van Dover, 2019; van der Grient & Drazen, 2021).
The spatial extent of deep-sea mining impacts from water and sediment plumes is, however, still uncertain as few field experiments and models of plume-dispersal have been conducted so far (Jones et al., 2017). In fact, studies on plume-dispersal resulting from the mining of seafloor massive sulphides are particularly limited, being those produced for the Solwara 1 the only ones currently found in the literature (ASA, 2008a; ASA, 2008b). The existing studies, which mostly addressed short term impacts, show very contrasting estimates of plume-dispersal ranging from very few to hundreds of square kilometres depending on the type of resources or threshold used (e.g., Jankowski and Zielke, 2001; Thiel and Tiefsee-Umweltschutz, 2001; Spearman et al., 2020; Muñoz-Royo et al., 2021). Similarly, sediment accumulation on the seafloor has been projected to range from less than one or few millimetres (Thiel and Tiefsee-Umweltschutz, 2001; Gillard et al., 2019; Purkiani et al., 2021) to several centimetres (Aleynik et al., 2017) depending on particle size and distance from the source. A recent expert survey suggested that the footprint of return plumes could reach hundreds of square kilometres in polymetallic nodule fields, tens of square kilometres in cobalt-rich crusts on seamounts, and only a few square kilometres in seafloor massive sulphide vents (Washburn et al., 2019). These discrepancies indicate that further studies are needed to forecast the long-term dispersal and impacts of mining plumes on benthic and pelagic ecosystems, which is of paramount importance to inform environmental management of polymetallic sulphide deposits (Van Dover, 2011; Wedding et al., 2015; Smith et al., 2020; Van Dover et al., 2020; Amon et al., 2022).
Several hydrothermal vents associated with polymetallic sulphide deposits have been identified along the northern Mid-Atlantic Ridge (MAR) (Cherkashov et al., 2010; Hannington et al., 2011; Wheeler et al., 2013; Cherkashov, 2017; Boschen-Rose and Colaço, 2021). The MAR in the Azores region, including both its Exclusive Economic Zone (EEZ) and extended continental shelf, host several active and inactive hydrothermal vents that might represent potential sources of polymetallic sulphide deposits. These vents make the Portuguese EEZ the only EEZ of an EU Member State with sufficient mineral reserves for deep-sea mining in European waters (ECORYS, 2014). The seafloor surrounding Lucky Strike and Rainbow hydrothermal fields are examples of areas with interest for deep-sea mining exploration, but many other locations may also be of interest (ISA, 2002; Marques & Scott, 2011). In this study, we used three dimensional (3-D) hydrodynamic models of the Azores region along with a theoretical commercial mining operation of polymetallic seafloor massive sulphides (Coffey Natural Systems, 2008; Ortega and Boomsma, 2014) to simulate the potential dispersal of plumes originating from the different phases of the mining operations, and to assess the scale of potential impacts. Additionally, we evaluated how the theoretical commercial mining operation could interact with local biodiversity and existing fishing activities.
2 Methods
2.1 Study Area
Several active deep-water hydrothermal vent fields have been discovered in the northern portion of the slow-spreading MAR. Five of them are located south of the Azores (Beaulieu et al., 2013; Beaulieu and Szafranski, 2020), relatively close to each other and to the Azores islands. These are the Menez-Gwen (at 850m depth) including Bubbylon, Lucky Strike (1,700m) including Ewan, Menez Hom (1,800m), Saldanha (2,200m), and Rainbow (2,400m). The Moytirra hydrothermal vent area was recently discovered north of the Azores (2,900m) at about 45.5°N (Wheeler et al., 2013). The detection of several hydrothermal plume signals on the northern Mid-Atlantic Ridge indicates that more active fields may occur in the region (Hydes et al., 1986; German et al., 1996; Aballéa et al., 1998; Chin et al., 1998; Beaulieu et al., 2015), as recently demonstrated for fast- and intermediate-rate spreading ridges (Baker et al., 2016).
Between 2006 and 2008, the mineral exploration company Nautilus Minerals Inc. approached the Regional Government of the Azores, intending to explore mineral resources in the deep sea inside the Portuguese EEZ around the Azores and the adjacent Extended Continental Shelf claim. Nautilus submitted the first proposal for exploration rights in several areas in the Azores region totalling 9,272 km2 (from North to South): Patorra (locally known as Cavala seamount), Moreto (known as Lucky Strike Hole, south of the Menez Gwen hydrothermal vent field and West of Monte Alto and Voador seamounts), Arinto (known as Menez Hom, south of Lucky Strike area, between Sarda and Farpas seamounts), Famous (in the Famous hydrothermal vent field), Saldanha (in the Saldanha hydrothermal vent), and Verdelho (known as the Rainbow hydrothermal vent fields) (Table 1 and Figure 1). With the exception of the Cavala seamount, five out of the six proposed areas were published in the National (Aviso n.° 13357-13360/2012 and 13446/2012) and Regional (Aviso n.° 85-89/2012) official governmental journals in 2012. In the same year, legislation for mineral exploration and exploitation in the Azores and legislation granting access and equitable distribution of scientific results (following the Nagoya Protocol) were created by Regional Government of the Azores. A dispute with the Portuguese government has ruled this legislation unconstitutional (ECORYS, 2014) and has put things on hold. Nautilus Minerals went bankrupt in 2019, and the company’s assets were received by Deep Sea Mining Finance Ltd1. In this study, we simulated the potential dispersal of SMS mining plumes in all study areas with special emphasis on two case study areas: Cavala and Lucky Strike Hole.
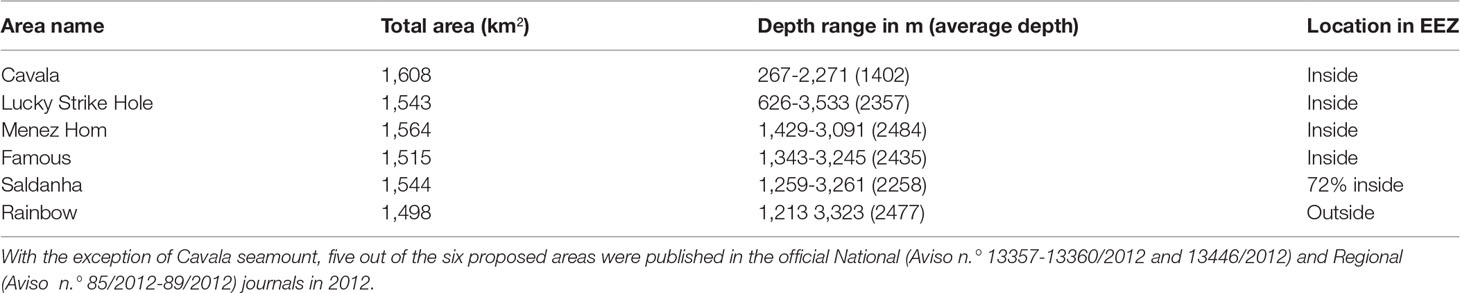
Table 1 Areas originally submitted to the Government of the Azores by Nautilus Minerals Inc. for deep-sea SMS mining exploration in the Azores region.
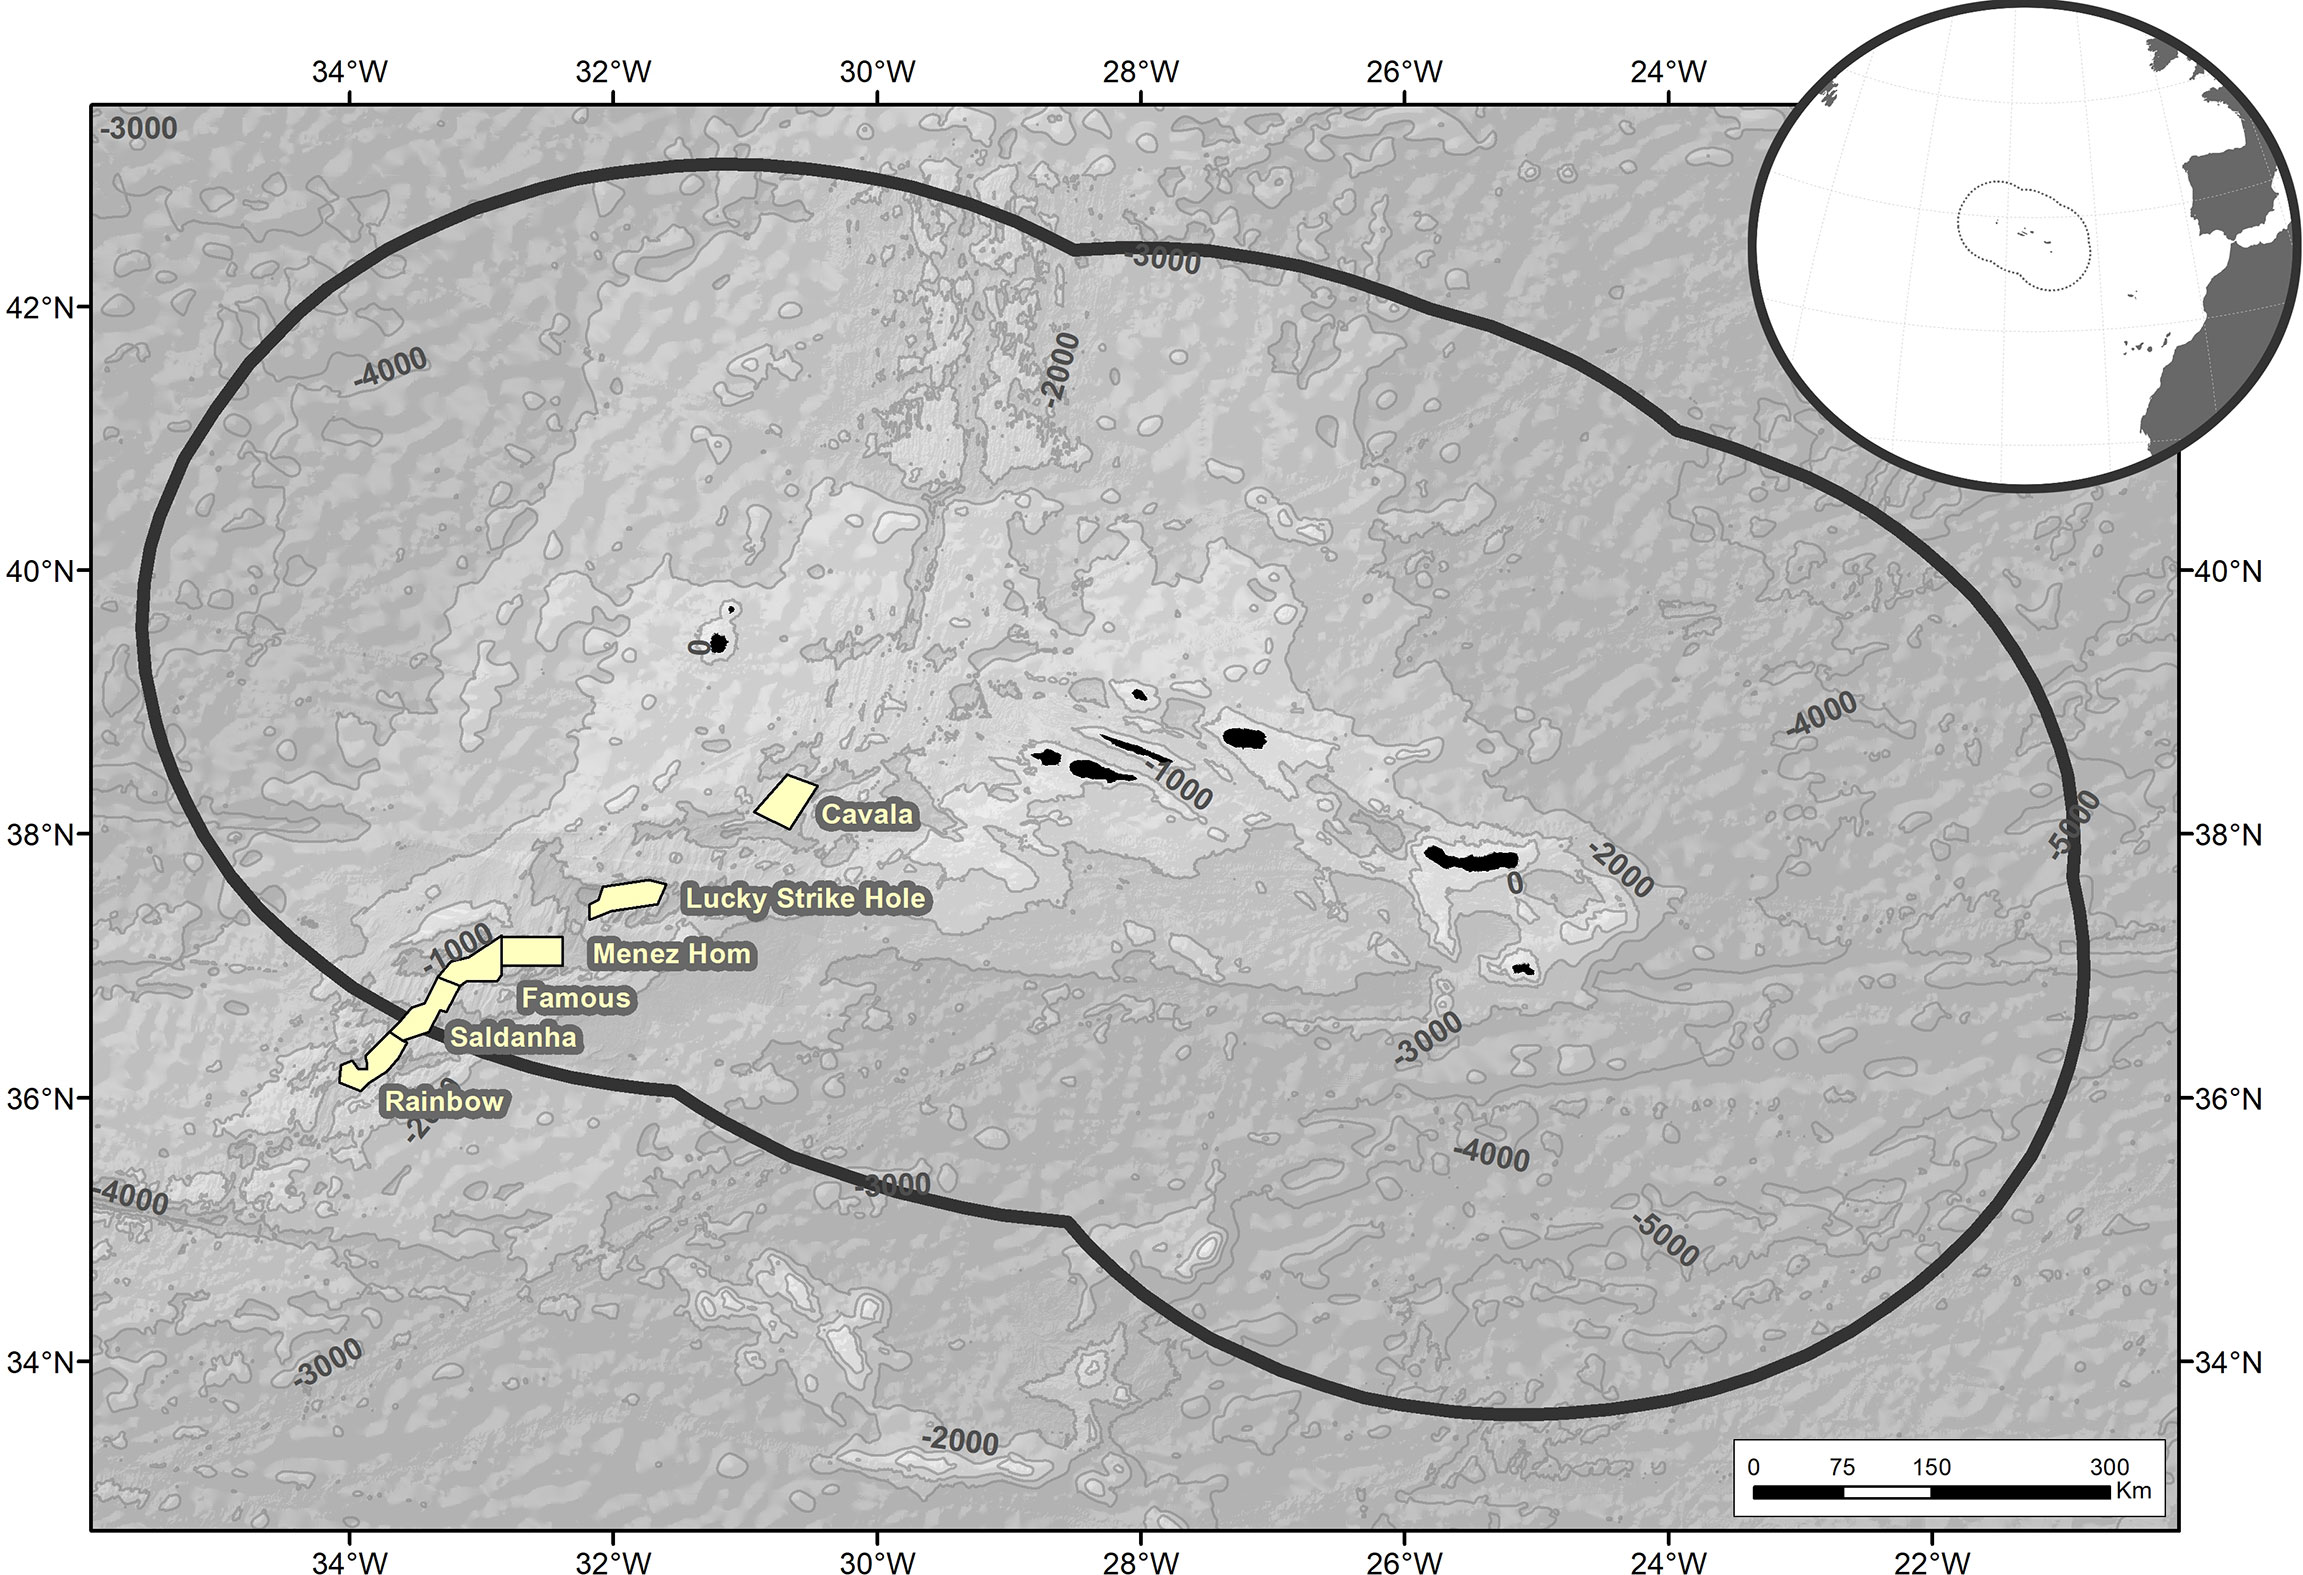
Figure 1 Location of the areas originally submitted to the Government of the Azores by Nautilus Minerals Inc. for deep-sea SMS mining exploration in the Azores region. With the exception of Cavala seamount, five out of the six proposed areas were published in the National (Aviso n.° 13357-13360/2012 and 13446/2012) and Regional (Aviso n.° 85-89/2012) official governmental journals in 2012.
2.2 3D Hydrodynamic Modelling Using MOHID
We used the 3-D hydrodynamic modelling system MOHID2 water, developed by the Marine and Environmental Technology Research Center at Instituto Superior Técnico, University of Lisbon (Mateus and Neves, 2013), to simulate the dispersal of water and sediment plumes originated from deep-sea mining operations. MOHID water is a three-dimensional water modelling system composed of several modules structured hierarchically (e.g., 3-D baroclinic hydrodynamic module, 1-D turbulence module, an eulerian transport module, 0-D water quality module, lagrangian transport module, oil dispersion module, jet model, a cohesive sediment transport module, and at the surface and the seabed boundary conditions modules). This modelling tool has been extensively used to simulate complex vertical and horizontal ocean circulation patterns and velocity fields, sediments and microplastic transport, seaweed and plume dispersion, primary and secondary production and nutrient cycling, oil spills, and others (e.g., Juliano et al., 2012; Ballent et al., 2013; Marín et al., 2013; Duarte et al., 2014; Plecha et al., 2014; Sousa et al., 2014; Garbossa et al., 2021). MOHID water has been successfully used to model the oceanography of a deep-sea coral reef area off Scotland (Navas et al., 2014).
The MOHID Eulerian model computes the hydrodynamic (velocity, free-surface level temperature and salinity) fields in a fixed grid. It solves Navier-Stokes equations assuming hydrostatic equilibrium and the Boussinesq approximation. The model uses a finite volume approach, with generic vertical discretisation allowing simultaneous implementation of different types of vertical coordinates. The coupled MOHID turbulence module applies the General Ocean Turbulence Model (GOTM3). The hydrodynamic model was forced by tide, atmospheric and open boundary conditions. The MOHID lagrangian transport module tracks the trajectories of selected water masses or particles and was used to simulate the movement of the plume generated by deep-sea mining activities using the transport fields calculated with the Eulerian hydrodynamic model. The dispersion was computed using the results from the turbulence model. The coupled MOHIDJET module was used to simulate the initial near field dilution and dispersion of outfalls jets composed of plumes and particles generated by deep-sea mining activities at the discharge point.
2.3 Implementation of the 3D Hydrodynamic Modelling Approach
The hydrodynamic model was implemented using a downscaling domain approach of increasing horizontal resolution (Supplementary Figure 1). Domain 1 represents the larger domain in the Azores region with a spatial resolution of 6x6 km (31.0-43.0°N, 21.8-38.9°W), with an area of approximately 2,160,000 km2. Domain 2 is the first nested grid corresponding to the MAR (34.7-40.2°N, 36.0-29.2°W), also with a spatial resolution of 6x6km and covering approximately 375,000 km2. Domain 3 is composed of two nested grids of 1.2x1.2 km (37.0-38.9°N, 30.1-32.7°W and 35.7-37.7°N, 31.9-34.5°W), representing the areas of potential deep-sea mining activities in the MAR, and covering approximately 50,000 km2 each. The time steps considered were 120 seconds for domains 1 and 2, and 60 seconds for domain 3. Bathymetry grids were generated using the Global Bathymetry and Elevation Data at 30 Arc Seconds Resolution (SRTM30_PLUS; Becker et al., 2009) and the European Marine Observation and Data Network (EMODNet) Digital Terrain Model4. The bathymetry data were interpolated to the different domain resolutions.
The open boundary tidal forcing for the hydrodynamic model was obtained from the finite element global tides atlas FES20125 and applied to domain 1 to generate a 2-D barotropic model. Atmospheric boundary conditions were obtained from the Global Forecast System (GFS6), while the Open Boundary Conditions (OBC) were provided by the Mercator Ocean (PSY2V4, Drillet et al., 2005). Domains 2 and 3 are fully 3-D baroclinic circulation models with a z-level vertical discretisation with 50 vertical layers, of which 43 in Cartesian coordinates and the top 7 in sigma coordinates, with a resolution of <1 m near the surface and about 150m at 1,000m depth. We have produced data from 12 months run in hindcast mode using 2011 as the reference year.
The model configuration, the selected parameters and validation results are detailed in Riflet et al. (2008). Validation was done by comparing the outputs of the MOHID hydrodynamic model with temperature and salinity data obtained from remote sensing and in situ from ARGO floats7. The ARGO data were collected and made freely available by the International Argo Project and the national programs that contribute to it8. The vertical thermohaline structure in domain 2 produced by the hydrodynamic model showed Pearson correlations coefficients greater than 0.95, with a large majority being 0.99, when compared to the ARGO float data (Supplementary Figures 2, 3). The outputs of the hydrodynamic model (horizontal and vertical components of the velocity, sea level, temperature, salinity, and density fields) were used to feed the MOHID lagrangian module coupled with MOHIDJET to simulate the plume-dispersal processes in offline mode.
2.4 Plume Dispersal Modelling
Nautilus Minerals developed the “world-first” project for mining high-grade polymetallic Seafloor Massive Sulphide (SMS) in the deep sea, at approximately 1,600m depth off Papua New Guinea (Solwara 1). Nautilus produced a detailed project report on the modus operandi of the expected operations for mining SMS deposits (Coffey Natural Systems, 2008). The IHC Merwede worked together with the EU FP7 MIDAS project and developed mining scenarios for SMS deposits in the Mid-Atlantic Ridge, with the main goal of assessing the scale of potential environmental impacts (Ortega and Boomsma, 2014). Although mining in Solwara 1 by Nautilus Minerals is no longer expected, the present study was based on the scenarios and operations developed in these two reports, adapted to our potential mining sites.
Pre-mining operations were expected to occur in the Solwara 1 project in Papua New Guinea, since the exploitation area was covered by a layer of sediment and rock that was expected to be removed prior to mining (ASA, 2008a). This operation would move 130,000 tonnes of unconsolidated sediment and 115,000 tonnes of rock (ASA, 2008a), creating sediment plumes that may spread out considerably. Contrary to Solwara 1 no major pre-mining operations are expected to occur in the Azores potential mining sites, and no estimates of the amount of sediment to be moved are available. In this study, we modelled the dispersal of the sediment plumes generated during the in situ mining operations and the plumes generated during the dewatering process.
2.4.1 Modelling In Situ Excavation Sediment Plume
In situ mining operations may generate sediment plumes in different ways (ASA, 2008b). When the seafloor mining tool (SMT) lands or crawls on the seafloor, sediments may be re-suspended and dispersed by local currents. Additionally, during mining operations, portions of the cut ore may escape from the SMT and cause cutting spills that will partially be re-suspended and therefore cause additional sediment plumes. Here, we used the scenarios developed by Ortega and Boomsma (2014) that considered that 25% of the cut materials would not be picked up by the SMT from the seafloor (i.e., cutting spill). Of these solids, 30% may be re-suspended by local and induced currents during the excavation process at the seabed (i.e., resuspension spill). It should be noted that the Coffey Natural Systems (2008) report assumed the mining tools were developed in a way that all fine materials with the potential of forming plumes would be collected by the system and pumped to the surface. However, since this is very unlikely, we based our simulations on Ortega and Boomsma (2014).
The plume created in situ during the excavation process was modelled adopting the Ortega and Boomsma (2014) parameters adjusted to local conditions. In these simulations, we have assumed a production of solids of 0.03 m3·s-1, a resuspension spill of 7.5% of the cut materials, and an average solids density of 3,780 kg·m-3. It was further assumed that the crawler at 0.05 m·s-1 would produce an initial plume of 2 m in height and 5 m in width at a flow rate of 0.5 m3·s-1. Therefore, the concentration of suspended solids was assumed to be 17,010 mg·L-1. The particle size distribution was estimated by Ortega and Boomsma (2014) in hyperbaric cutting experiments with different types of rocks (Supplementary Table 1). The hindered settling velocities of these particles were calculated using Zhiyao et al. (2008) equation, provided in the “Settling Velocity 2.1: Rapid Computer Calculations of the Sedimentation Velocity and the Hindered Settling Rate of Spherical and Natural Sediment Particles” produced by Janwillem Rouweler. The final settling velocities for the different particle sizes were calculated assuming an average particle density of 3,780 kg·m-3 (Ortega and Boomsma, 2014) and the local water density from MOHID (Supplementary Table 1). The in situ sediment plume was modelled assuming a continuous and stationary emission, using the MOHID lagrangian module, coupled to the MOHID water transport and water properties fields. The simulation model was run for 12 months starting on the 1st of January 2011.
2.4.2 Modelling the Dewatering Plume
Based on the Nautilus mining operations plan (Coffey Natural Systems, 2008), the ore extracted at the seafloor by the SMT will be pumped to the surface via a riser and lifting system as a slurry, i.e., a semi-liquid mixture of particles and bottom water. On board the mining support vessel, the material will be dewatered and the return water pumped back down to the sea with fine suspended solids smaller than 8 µm in diameter. During the dewatering process, plumes will be formed close to the seafloor, containing contaminated water enriched in toxic metals and fine sediments. Because the contaminated water and sediments have different dispersal patterns, we have modelled them separately as the return water discharge plume and the return sediment discharge plume. We adapted the Nautilus mining operations plan to our potential mining sites.
2.4.2.1 Modelling the Return Water Discharge Plume
The return water discharge plume was modelled based on the Nautilus mining operations plan and parameters (ASA, 2008b) adjusted to local conditions. In the simulations, the return water was released at 30m above the seabed at a rate of 0.253 m3·s-1 from two U-shaped 170mm diameter pipes that will discharge the water vertically upwards. It was assumed that the return water is composed of 83.3% seafloor water and 16.7% of surface water, representing a starting concentration after pre-dilution of 833,333,333 PPB (parts per billion).
The temperature of the return water discharge was estimated using the Law of Conservation of Energy, assuming that the final temperature of the mixture (i.e., 83.3% surface water and 16.7% of seafloor water) depends on the masses of the two amounts of water and their initial temperatures. The discharge temperature was calculated using the water density and temperature estimated by MOHID for each discharge location, assuming a 1°C increase and decrease during the transport of bottom water to the surface and the return back to the bed, respectively (Supplementary Table 2). Discharge temperature was kept constant throughout the simulations assuming a control temperature as the annual minimum temperature of each location (T1). Three scenarios were used in Cavala seamount and Lucky Strike Hole to analyse the sensitivity of the model projections to different discharge temperatures. Additionally to T1, we used a higher temperature considering the annual maximum temperature of each location (T2) and an extremely low temperature assuming the ambient temperature of the local conditions at the seabed (Tamb). The Salinity of discharge was calculated assuming the MOHID salinity of 83.3% surface water and 16.7% of seafloor water.
The return water discharge plume was modelled using the MOHID lagrangian module, MOHID water transport and water properties fields, and MOHIDJET module in the near field. It was further assumed that the return water would become too diluted and non-toxic after 10 days from discharge and therefore not modelled from this point onwards. The starting date for the simulations was 1st of January 2011.
2.4.2.2 Modelling Return Sediments Discharge Plume
The return sediments discharge plume was modelled using MOHID Water hydrodynamic module with turbulence and MOHID’s Lagrangian module coupled with MOHIDJET for the near field, following Nautilus mining operations plan and adopted parameters (ASA, 2008b). In our study, the return sediments discharge contained a concentration of suspended solids smaller than 8 µm in diameter at a concentration of approximately 6,000 mg·L-1. For all study areas, we used an average particle diameter of 4 µm, while for Cavala seamount and Lucky Strike Hole we also used an average diameter of 8 µm to test the sensitivity of the model to particle size. The hindered settling velocities of particles at high concentrations were calculated using Zhiyao et al. (2008) equation. The final settling velocities were calculated assuming an average particle density of 3,780 kg·m-3 (Ortega and Boomsma, 2014) and the local water density from MOHID are shown in Supplementary Table 3. For Cavala seamount and Lucky Strike Hole, an alternative scenario using an average particle density of 3,300 kg·m-3 was used to test the sensitivity of the outputs to particle density (ASA, 2008b). Simulations were run for 12 months. Temperature and salinity of discharge were calculated as described for the return water discharge plume.
2.4.3 Thresholds
Most of the deep seafloor away from the continental margins, with few exceptions, are known to have low concentrations of suspended solids (<0.01 mg·L-1), indicating low levels of resuspension and advection of sediments (Gardner et al., 2018). In the Azores region along the MAR, Gardner et al. (2018) estimated that the seafloor away from the influence of hydrothermal vent plumes may average between 0.01 and 0.025 mg·L-1 of suspended solids concentrations. In the Rainbow hydrothermal vent, the typical background of deep water not affected by the vent plume has an average total suspended solids concentration of 0.04 mg· L-1, while the maximum turbidity in the core of the 100-m-thick plume was 0.09 mg·L-1 (Haalboom et al., 2020).
The Coffey Natural Systems (2008) report, the Australian and New Zealand Environment and Conservation Council (ANZECC) and the Management Council of Australia and New Zealand (ARMCANZ) set a target for total suspended solids of 1.2 mg·L-1, which is one order of magnitude greater than the concentrations of solids in the Rainbow natural hydrothermal vent plume and thirty times higher than the background concentrations mentioned above. The Coffey Natural Systems (2008) set a 5,000-fold dilution as the threshold for meeting the guidelines for all contaminants in the return water discharged plume into the environment. In this study, we, therefore, adopted a concentration of solids in the return sediment discharge plume and in the in situ excavation sediment plume of 1.2 mg·L-1 and a 5,000 fold dilution of the return water discharge plume as the main thresholds for analysing the model projections.
2.5 Data Analyses
The results of the models were analysed in different ways. The concentration of solids and of the discharge water in each horizontal 2-dimensional space cell was calculated as the maximum concentration in the 50 vertical layers of each 2-dimensional cell, for each output time step (3 hours), averaged over all time steps during each trimester and during a 12-months simulation. We also estimated the proportion of simulated time (temporal frequency) that a specific 2-dimensional space contained plume concentrations higher than the adopted thresholds (1.2 mg·L-1 and 5,000-fold). For this, the maximum plume concentration in each cell and time step was compared to a threshold. Those cells whose temporal frequency above the thresholds was greater than 50%, i.e., 6 months out of 12 months, were considered as cells with persistent plumes. In addition to the thresholds and targets, we also analysed the results for Cavala seamount and Lucky Strike Hole against other thresholds: 5 mg·L-1, 10 mg·L-1 and 25 mg·L-1 for sediments and 1,000-, 600-, 300- and 200-fold dilution for discharge water. Seasonal variations in the plumes dispersal were analysed for Cavala seamount and Lucky Strike Hole by computing the probability of concentration above thresholds for four periods of three months (January-March, April-June, July-September, and October-December). In these scenarios, the model run duration was approximately 90 days. In addition, the vertical footprint of the plumes was assessed by computing plume concentration along meridional and zonal vertical cross-sections along the simulation period. The sediment thickness of the settled sediments from the in situ excavation and return sediment discharge were also estimated. Model outputs are available for download at https://doi.org/10.1594/PANGAEA.945244 (Morato et al., 2022).
The sensitivity of the plume-dispersal model projections to different input parameters was tested with Fuzzy Kappa statistic for assessing the similarity of numerical maps. In general terms, the fuzzy numerical map statistic goes beyond a traditional cell-by-cell comparison and takes the neighbouring cells into account to compensate for spatial offsets in correlation analyses through fuzziness of location (Hagen, 2003; Hagen, 2006). We adopted an exponential distance decay membership function considering a neighbourhood radius of 4 cells and a halving distance of 2 cells. These geometric input parameters are adequate for compensating spatial offset errors without exaggerating fuzziness (Negreiros et al., 2021). Cells with plume-dispersal projections of 0 were set to “no data” to prevent overestimating the fuzzy similarity statistics and their dependence on the map size. The similarity of each cell between model projection maps is expressed on a scale between 0 and 1. The resulting fuzzy similarity map was then used to calculate the average similarity over the whole map. All map comparisons were computed in the Map Comparison Kit (Visser and De Nijs, 2006), version 3.2.3.
3 Results
3.1In Situ Mining Excavation Sediment Plume
The 2-dimensional dispersal of the in situ excavation sediment plume was projected to vary considerably between sites (Figure 2), attaining maximum values in the northern sites of Lucky Strike Hole and Cavala seamounts (27 and 26 mg·L-1, respectively). In most cases, the excavation plume concentrations above the 1.2 mg·L-1 threshold were projected to be retained within the exploration areas, but large footprints below this threshold were projected well outside all areas. The horizontal footprint of persistent excavation sediment plumes (temporal frequency greater than 50%, i.e., 6 months out of 12 months) above the 1.2 mg·L-1 threshold was projected to average 60 km2 and to disperse for about 19 km in linear distance (Figure 3 and Table 2). The largest persistent horizontal extents were projected for Lucky Strike Hole, Cavala, and Menez Hom sites, ranging from 73 to 101 km2, but higher dispersal distances were projected for Lucky Strike Hole and Saldanha (28 and 24 km, respectively). The dispersal of the in situ excavation sediment plume, regardless of the temporal frequencies, can be very high, ranging from thousands (1.2 and 5 mg·L-1) to hundreds of squared kilometres (10 mg·L-1) (Supplementary Table 4). It should be noted that all concentrations and temporal frequencies were calculated for each 2-dimensional cell, therefore not showing where in the water column the plume is being dispersed.
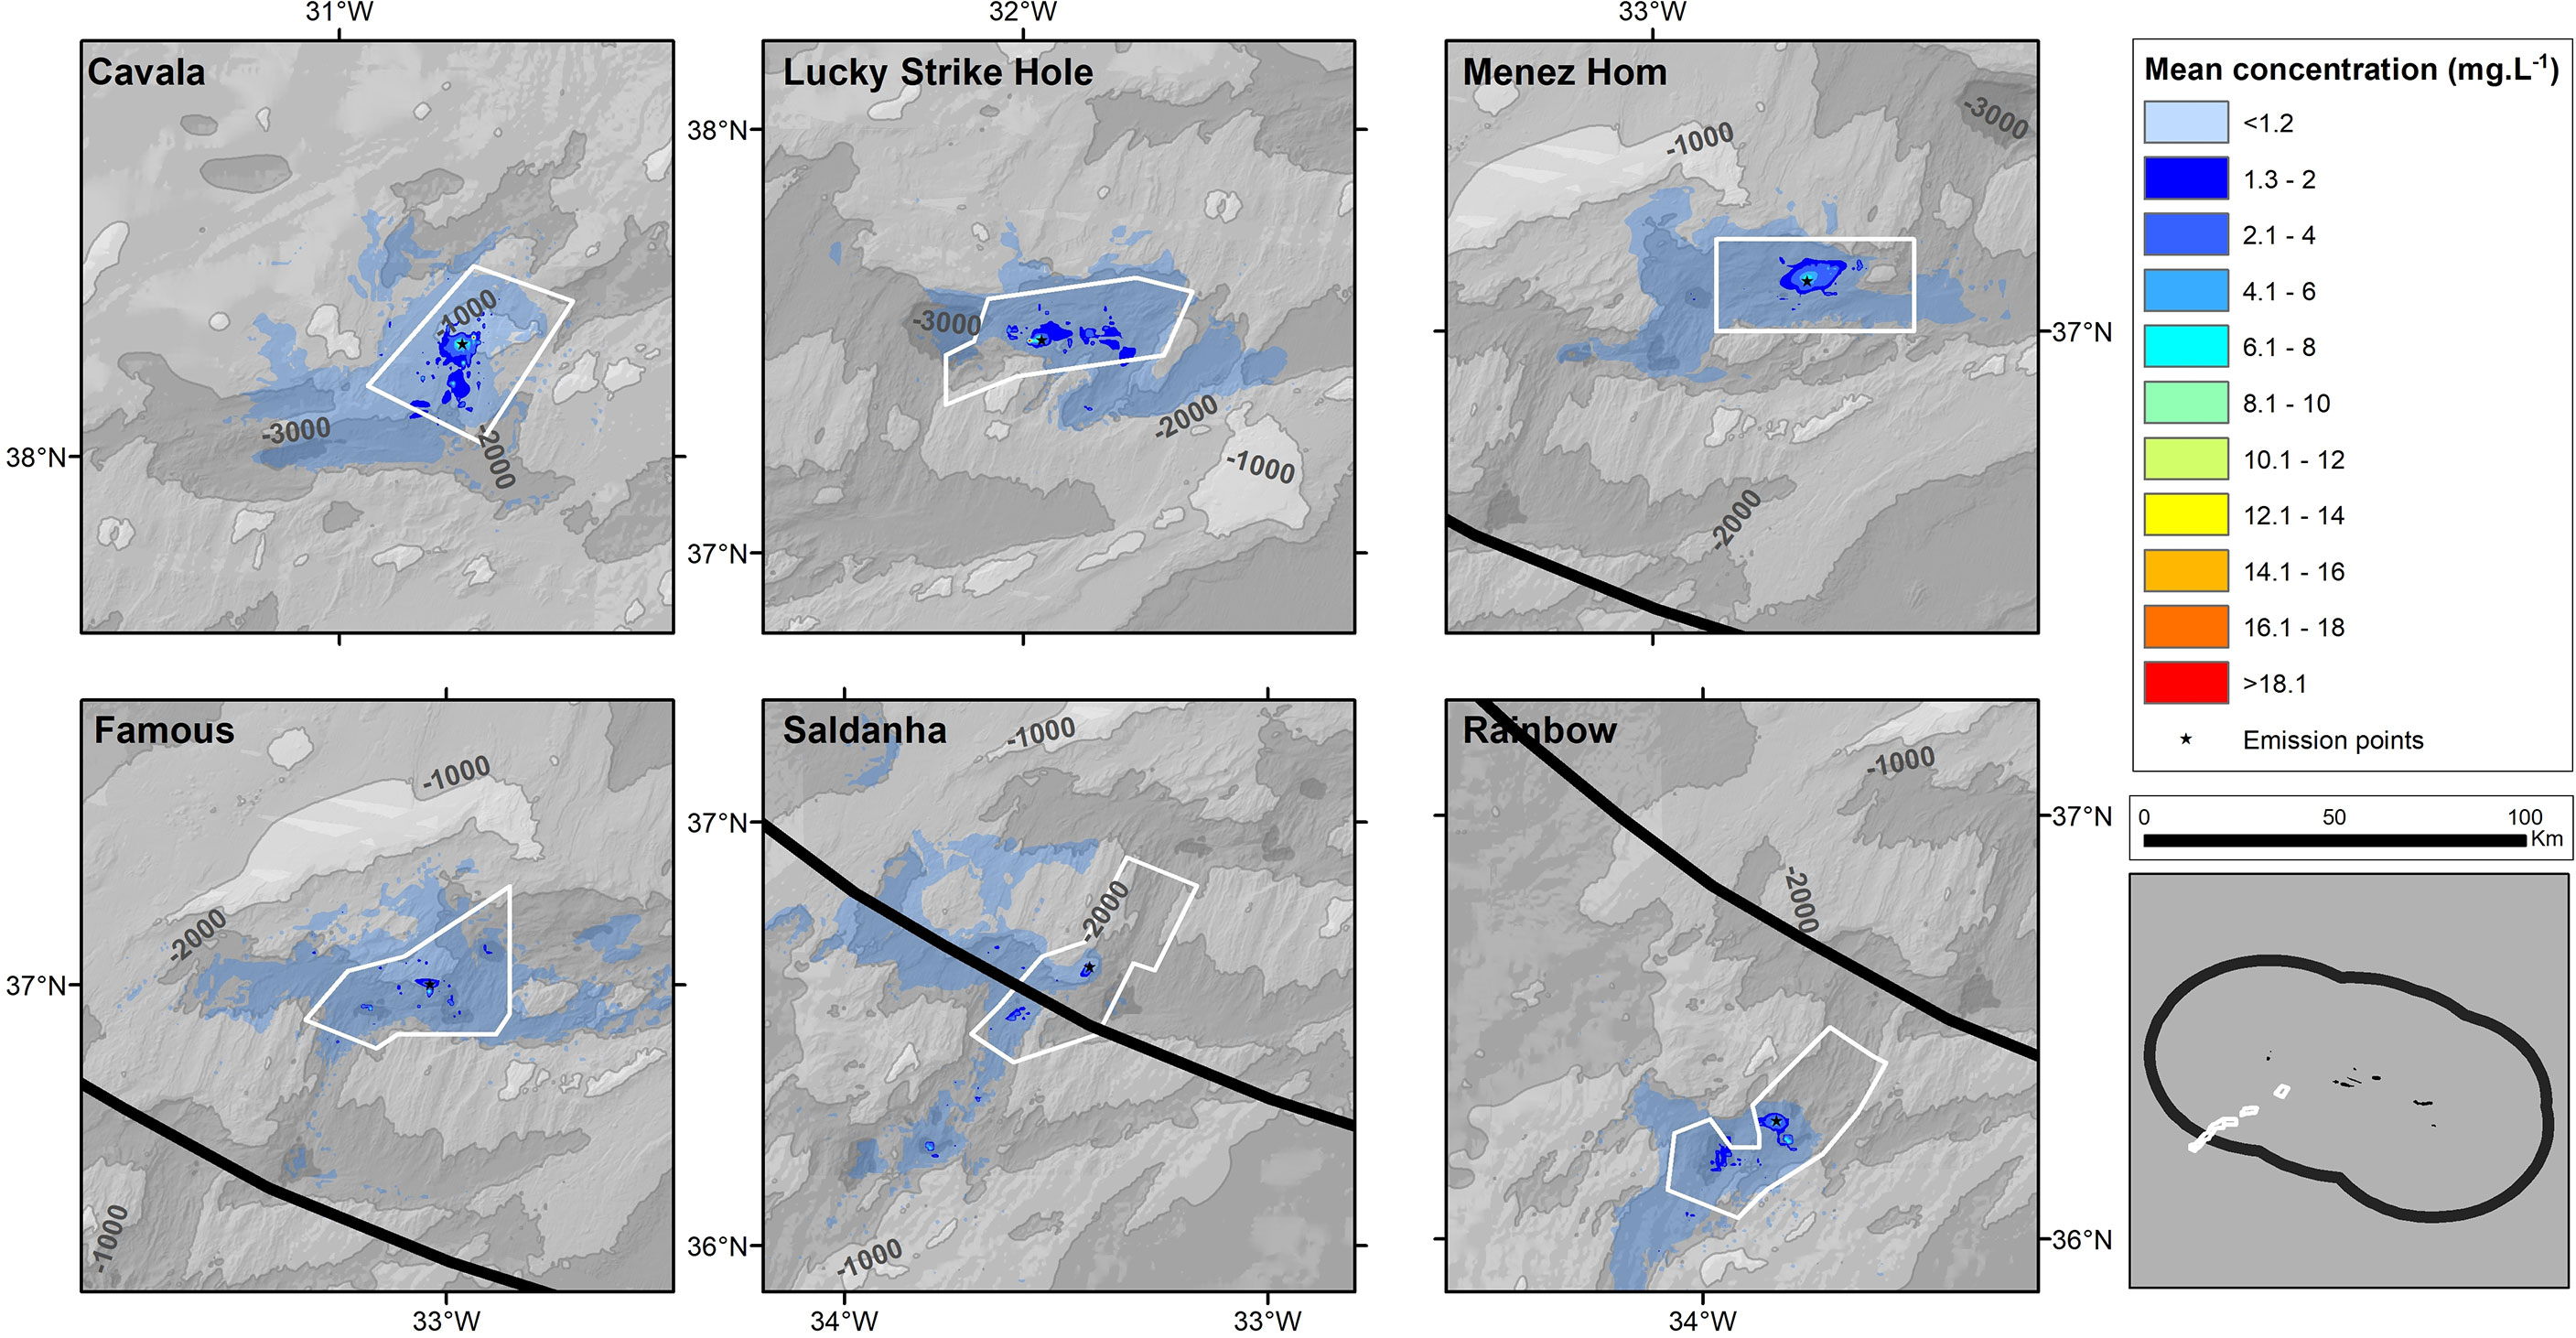
Figure 2 Concentration of sediments produced during the in situ excavation sediment plume calculated as the maximum concentration in the 50 vertical layers of each 2-dimensional cell, for each output time step (3 hours), averaged over all time steps during a 12-months simulation. Sediments were composed of six classes of different particle diameter (0-10 μm, 10-50 μm, 50-100 μm, 100-200 μm, 200-2,000 μm, and >2,000 μm), an average particle density of 3,780 kg·m-3, and resultant settling velocities ranging from 75.1 cm·s-1 to 0.002 cm·s-1.
Figure 3 Proportion of simulated time (temporal frequency) that a specific a 2-dimensional space cell, in six study areas, contained in situ excavation sediment plume above a 1.2 mg·L-1 concentration threshold, during a 12-months simulation, assuming six classes of particle diameter (0-10 μm, 10-50 μm, 50-100 μm, 100-200 μm, 200-2,000 μm, and >2,000 μm), an average particle density of 3,780 kg·m-3, and resultant settling velocities ranging from 75.1 cm·s-1 to 0.002 cm·s-1.
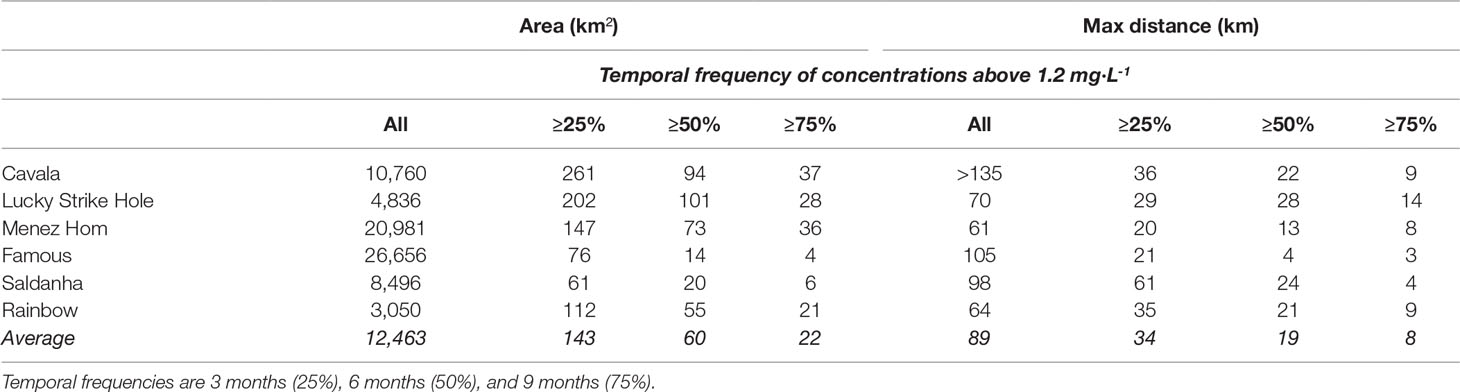
Table 2 Projected dispersal in 2-dimensional space of the in situ excavation plumes of sediments exceeding 1.2 mg·L-1 concentration in area (km2) and maximum linear distance (km) in relation to the estimated temporal frequency, i.e. the proportion of simulated days that a specific 2-dimensional space contained plumes above the adopted concentration threshold.
The vertical footprint of the excavation plume of sediment was projected to extend to much shallower depths than that of the emission point in all studied sites, averaging 800m of vertical thickness at concentrations above the 1.2 mg·L-1 threshold (Figure 4; Supplementary Figure 4). The in situ excavation sediment plumes were projected to spread along the flanks and summits of nearby topographic features (Supplementary Figure 4).
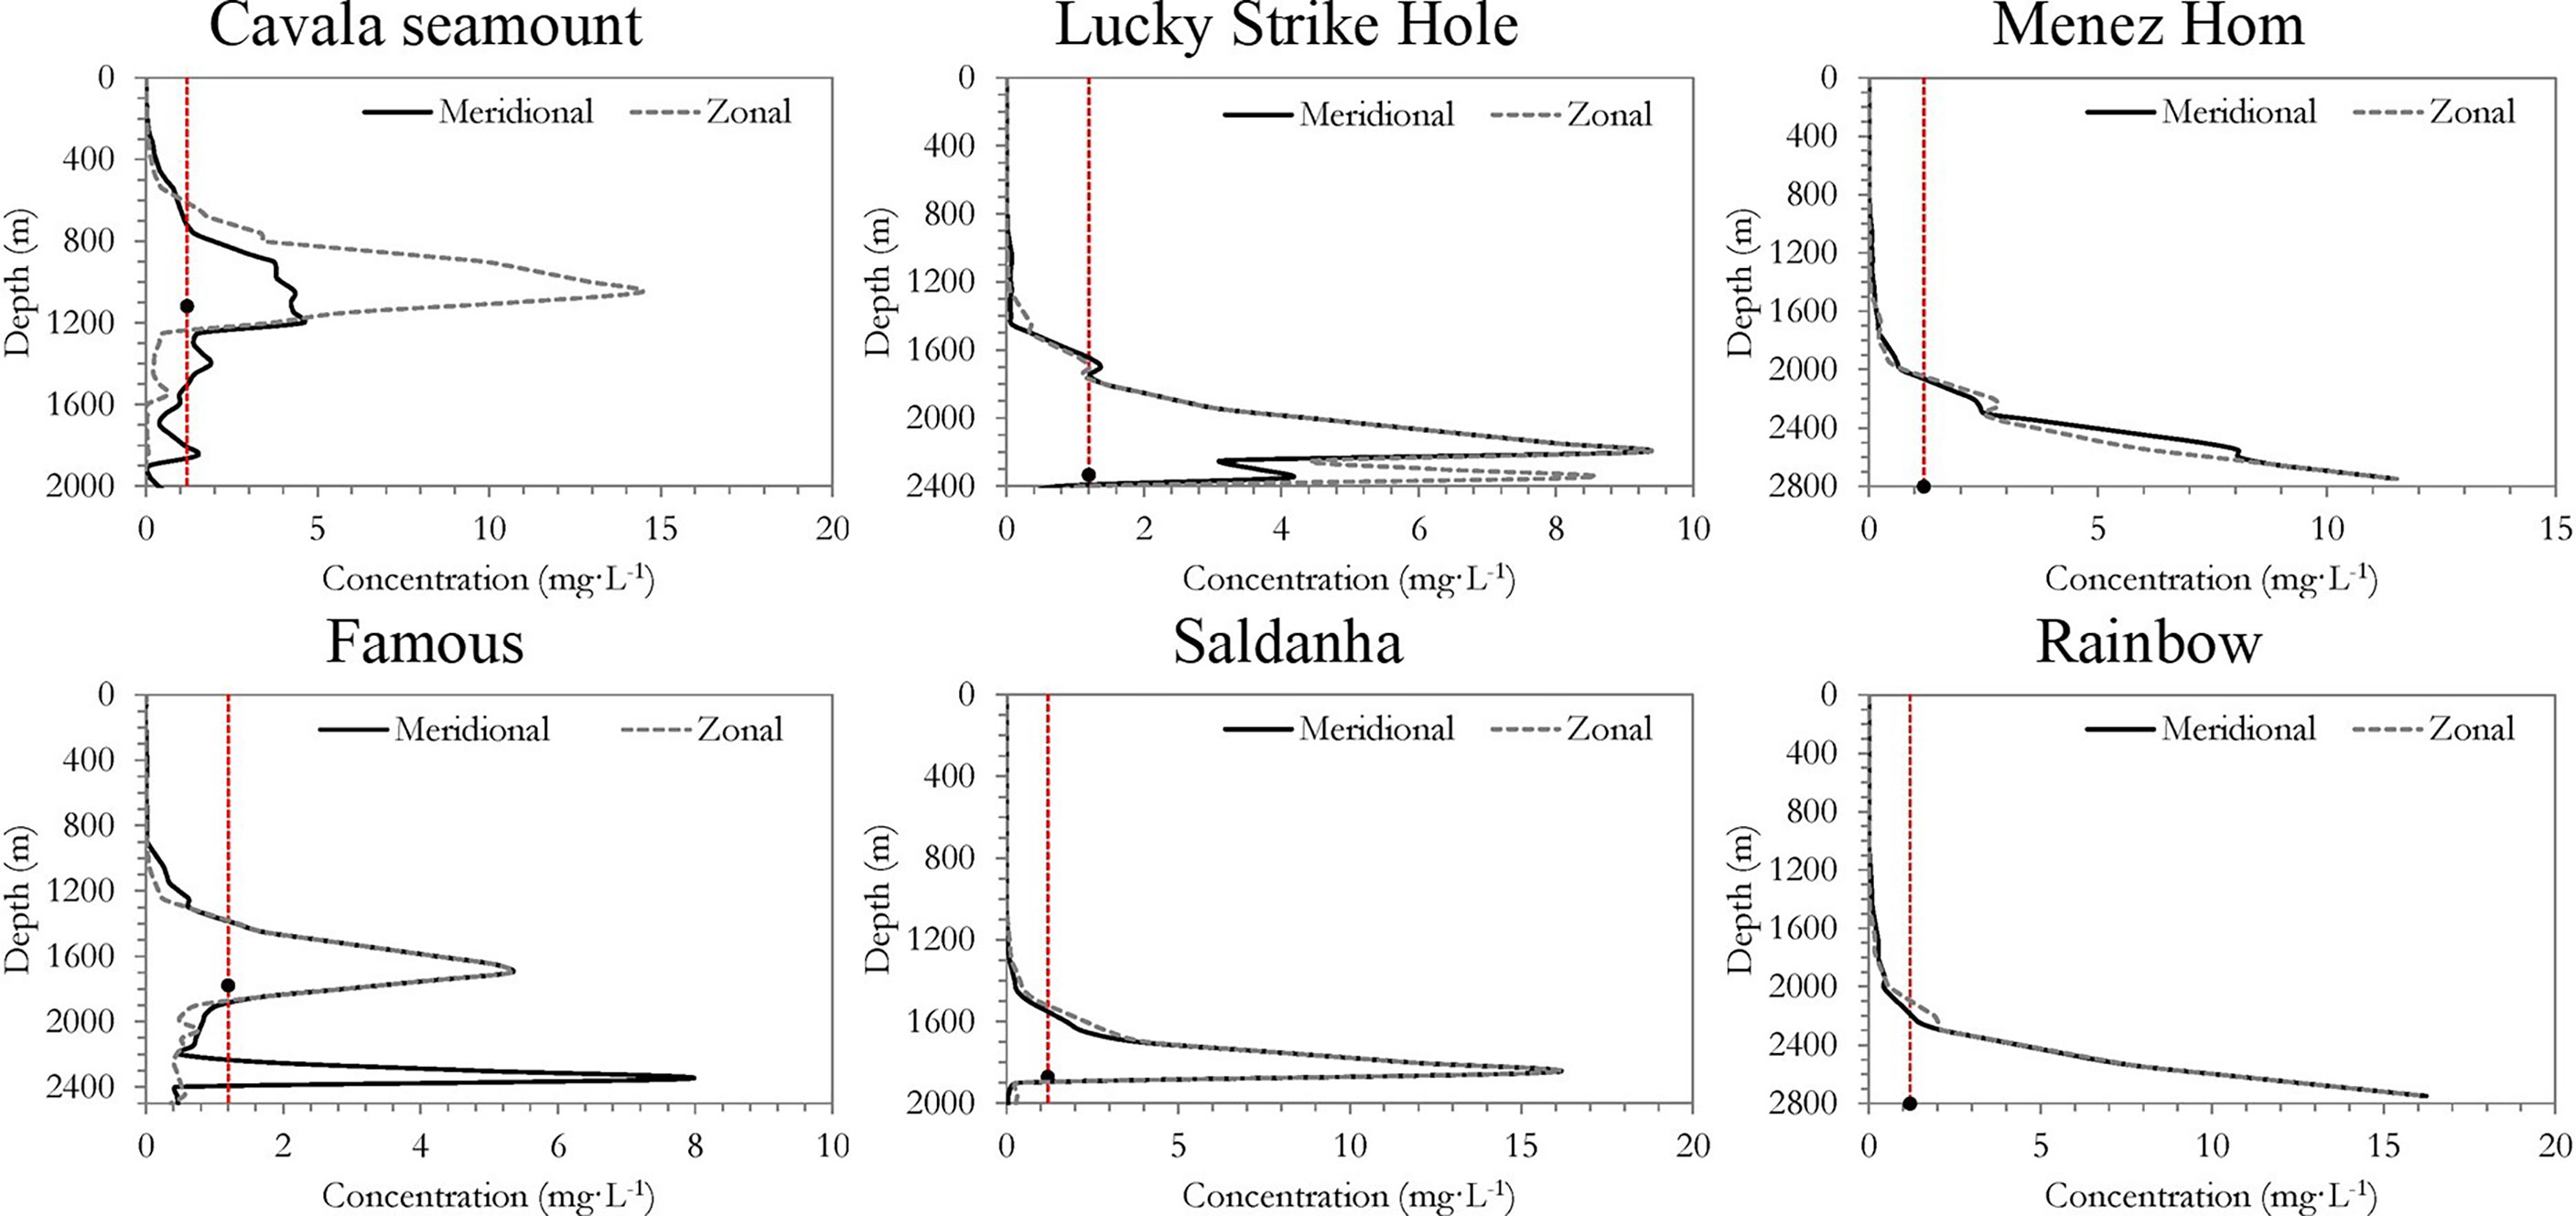
Figure 4 Vertical distribution of the concentration of sediments produced during the in situ excavation sediment plume (in mg·L-1) calculated as the maximum concentration in the 50 vertical layers of each 2-dimensional cell, averaged over a 12-months simulation period. Red line shows the 1.2 mg·L-1 concentration threshold and the black dot represents the depth of the stationary emission.
The cumulative bottom thickness of settled sediments produced from the in situ excavation plume was estimated to be from 159 to 402 mm in close vicinity (i.e., one cell) to the emission point (Figure 5). It should be noted that the emission point was stationary during this modelling exercise and that the deposited sediment will be distributed throughout the excavation area during commercial mining operations. In all other cells, including in many close topographic features, the thickness of the settled sediments was predicted to be small, averaging in sites from 0.06 to 0.24 mm (Figure 5).
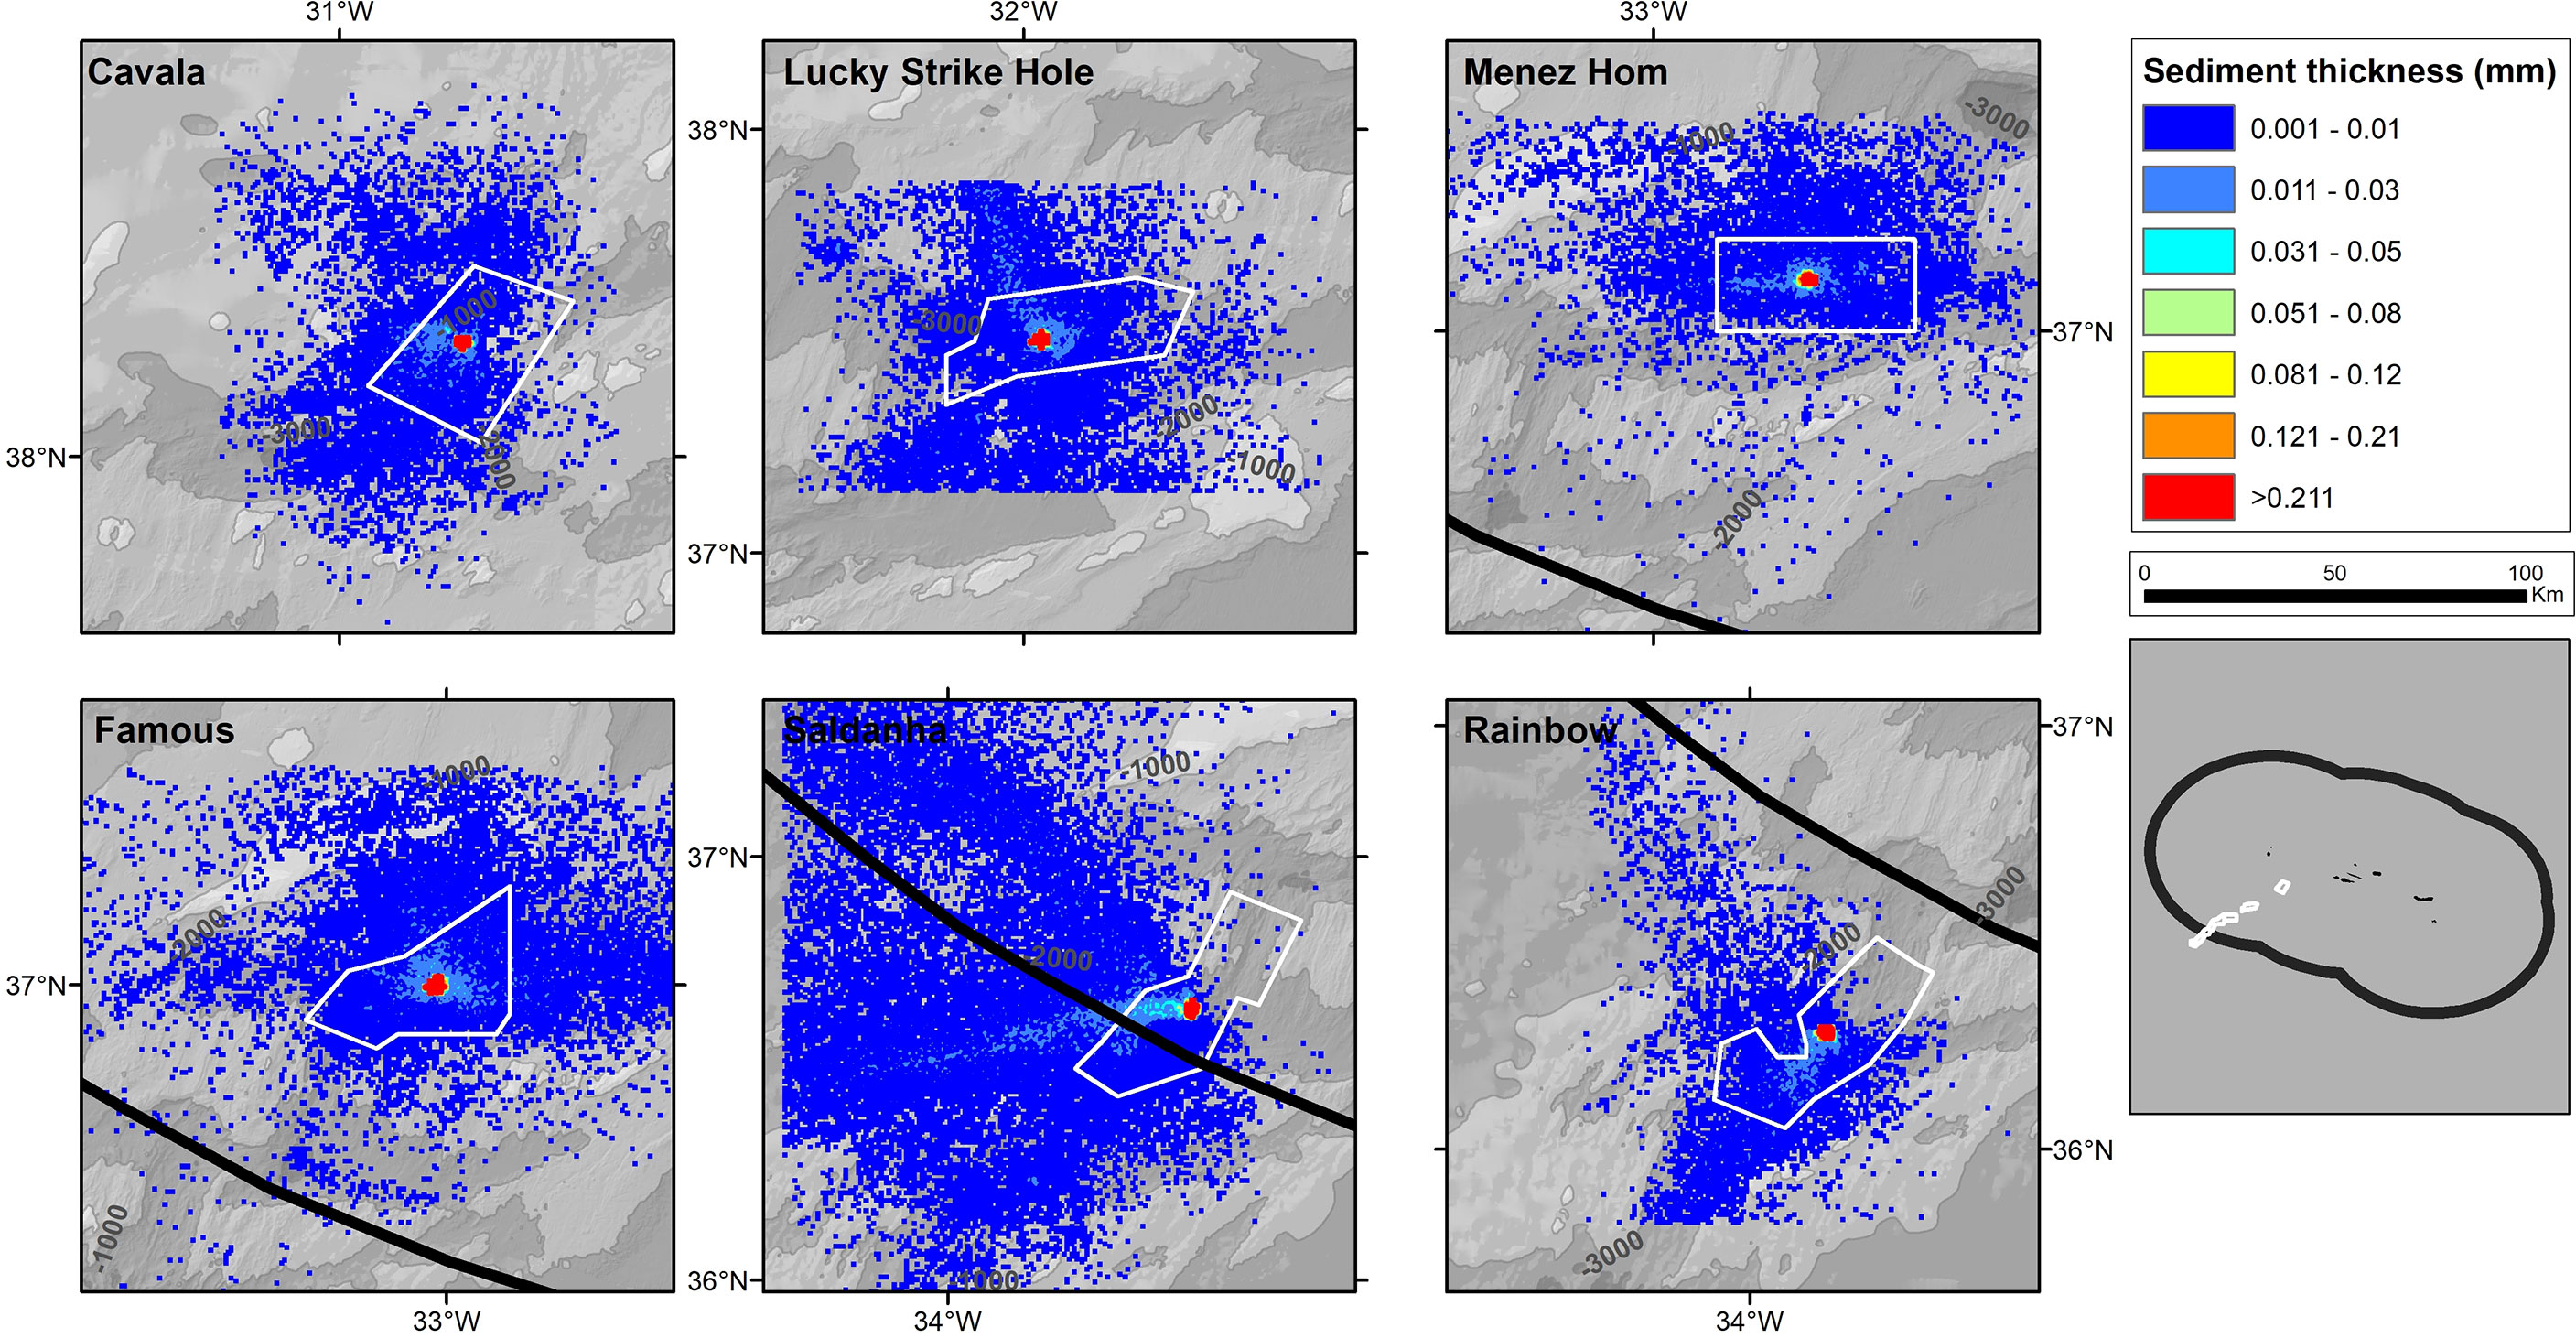
Figure 5 Bottom thickness of settled sediments produced during the in situ excavation sediment plume assuming six classes of particle diameter (0-10 μm, 10-50 μm, 50-100 μm, 100-200 μm, 200-2,000 μm, and >2,000 μm), an average particle density of 3,780 kg·m-3, and resultant settling velocities ranging from 75.1 cm·s-1 to 0.002 cm·s-1. Duration of the simulation is one year.
3.2 Dewatering Plume
3.2.1 Return Water Discharge Plume
The simulations of the expected footprint, in 2-dimensional space cells, of the return water discharge projected a large dispersal potential in all studied sites throughout the study period (Figure 6). The model simulations projected extensive areas with return water plume at higher concentrations than the accepted dilution threshold (5,000-fold) in many sites spreading beyond the proposed mining areas (Figure 6). Higher concentrations of return water plumes, averaged over a one-year period, were projected in Cavala seamount (average dilution= 971-fold), followed by Menez Hom (average dilution= 4,607 fold) and Rainbow site (average dilution= 5,160 fold). Additionally, our model projected high temporal frequencies of return water plumes concentrations greater than the 5,000-fold threshold in large areas of all study sites (Figure 7). Higher temporal frequencies were estimated to be attained close to the simulated release points but extending beyond the Rainbow mining area.
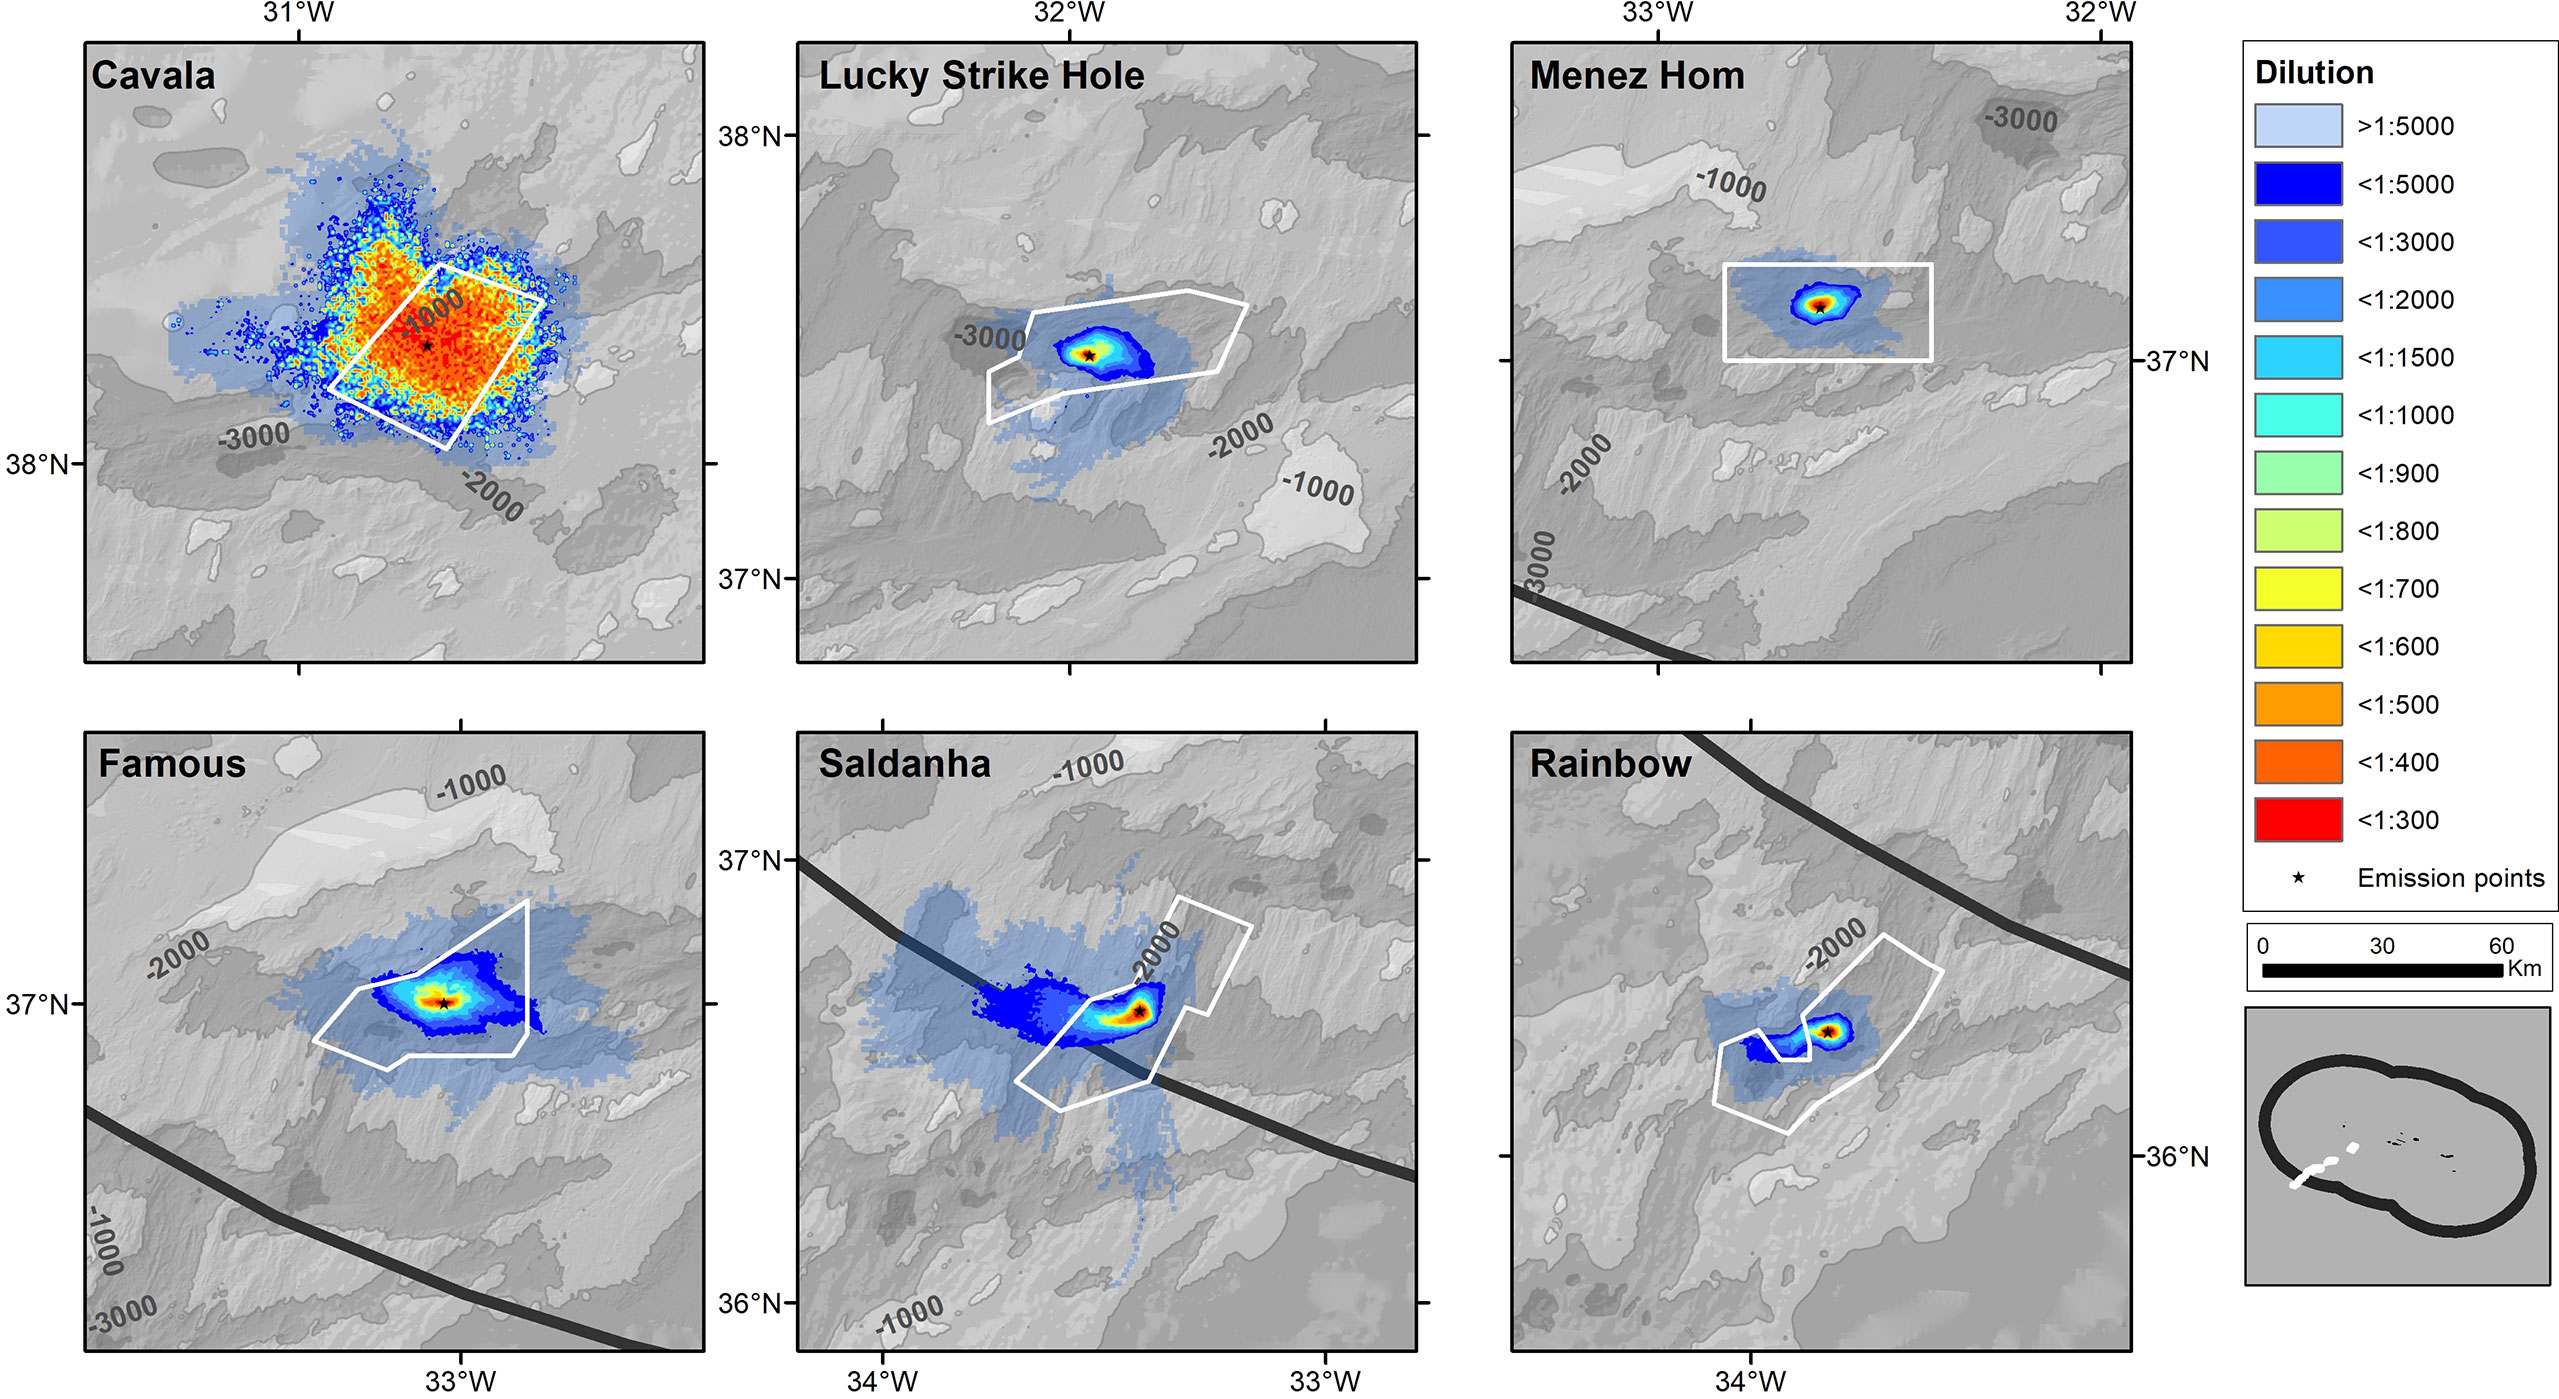
Figure 6 Concentration of return water discharge plume (shown in dilution folds) in six study areas calculated as the maximum concentration in the 50 vertical layers of each 2-dimensional cell, for each output time step (3 hours), averaged over all time steps during a 12-months simulation, and assuming a control temperature as the annual minimum temperature of each location (T1). Salinity of discharge was calculated assuming the MOHID salinity of 83.3% surface water and 16.7% of seafloor water.
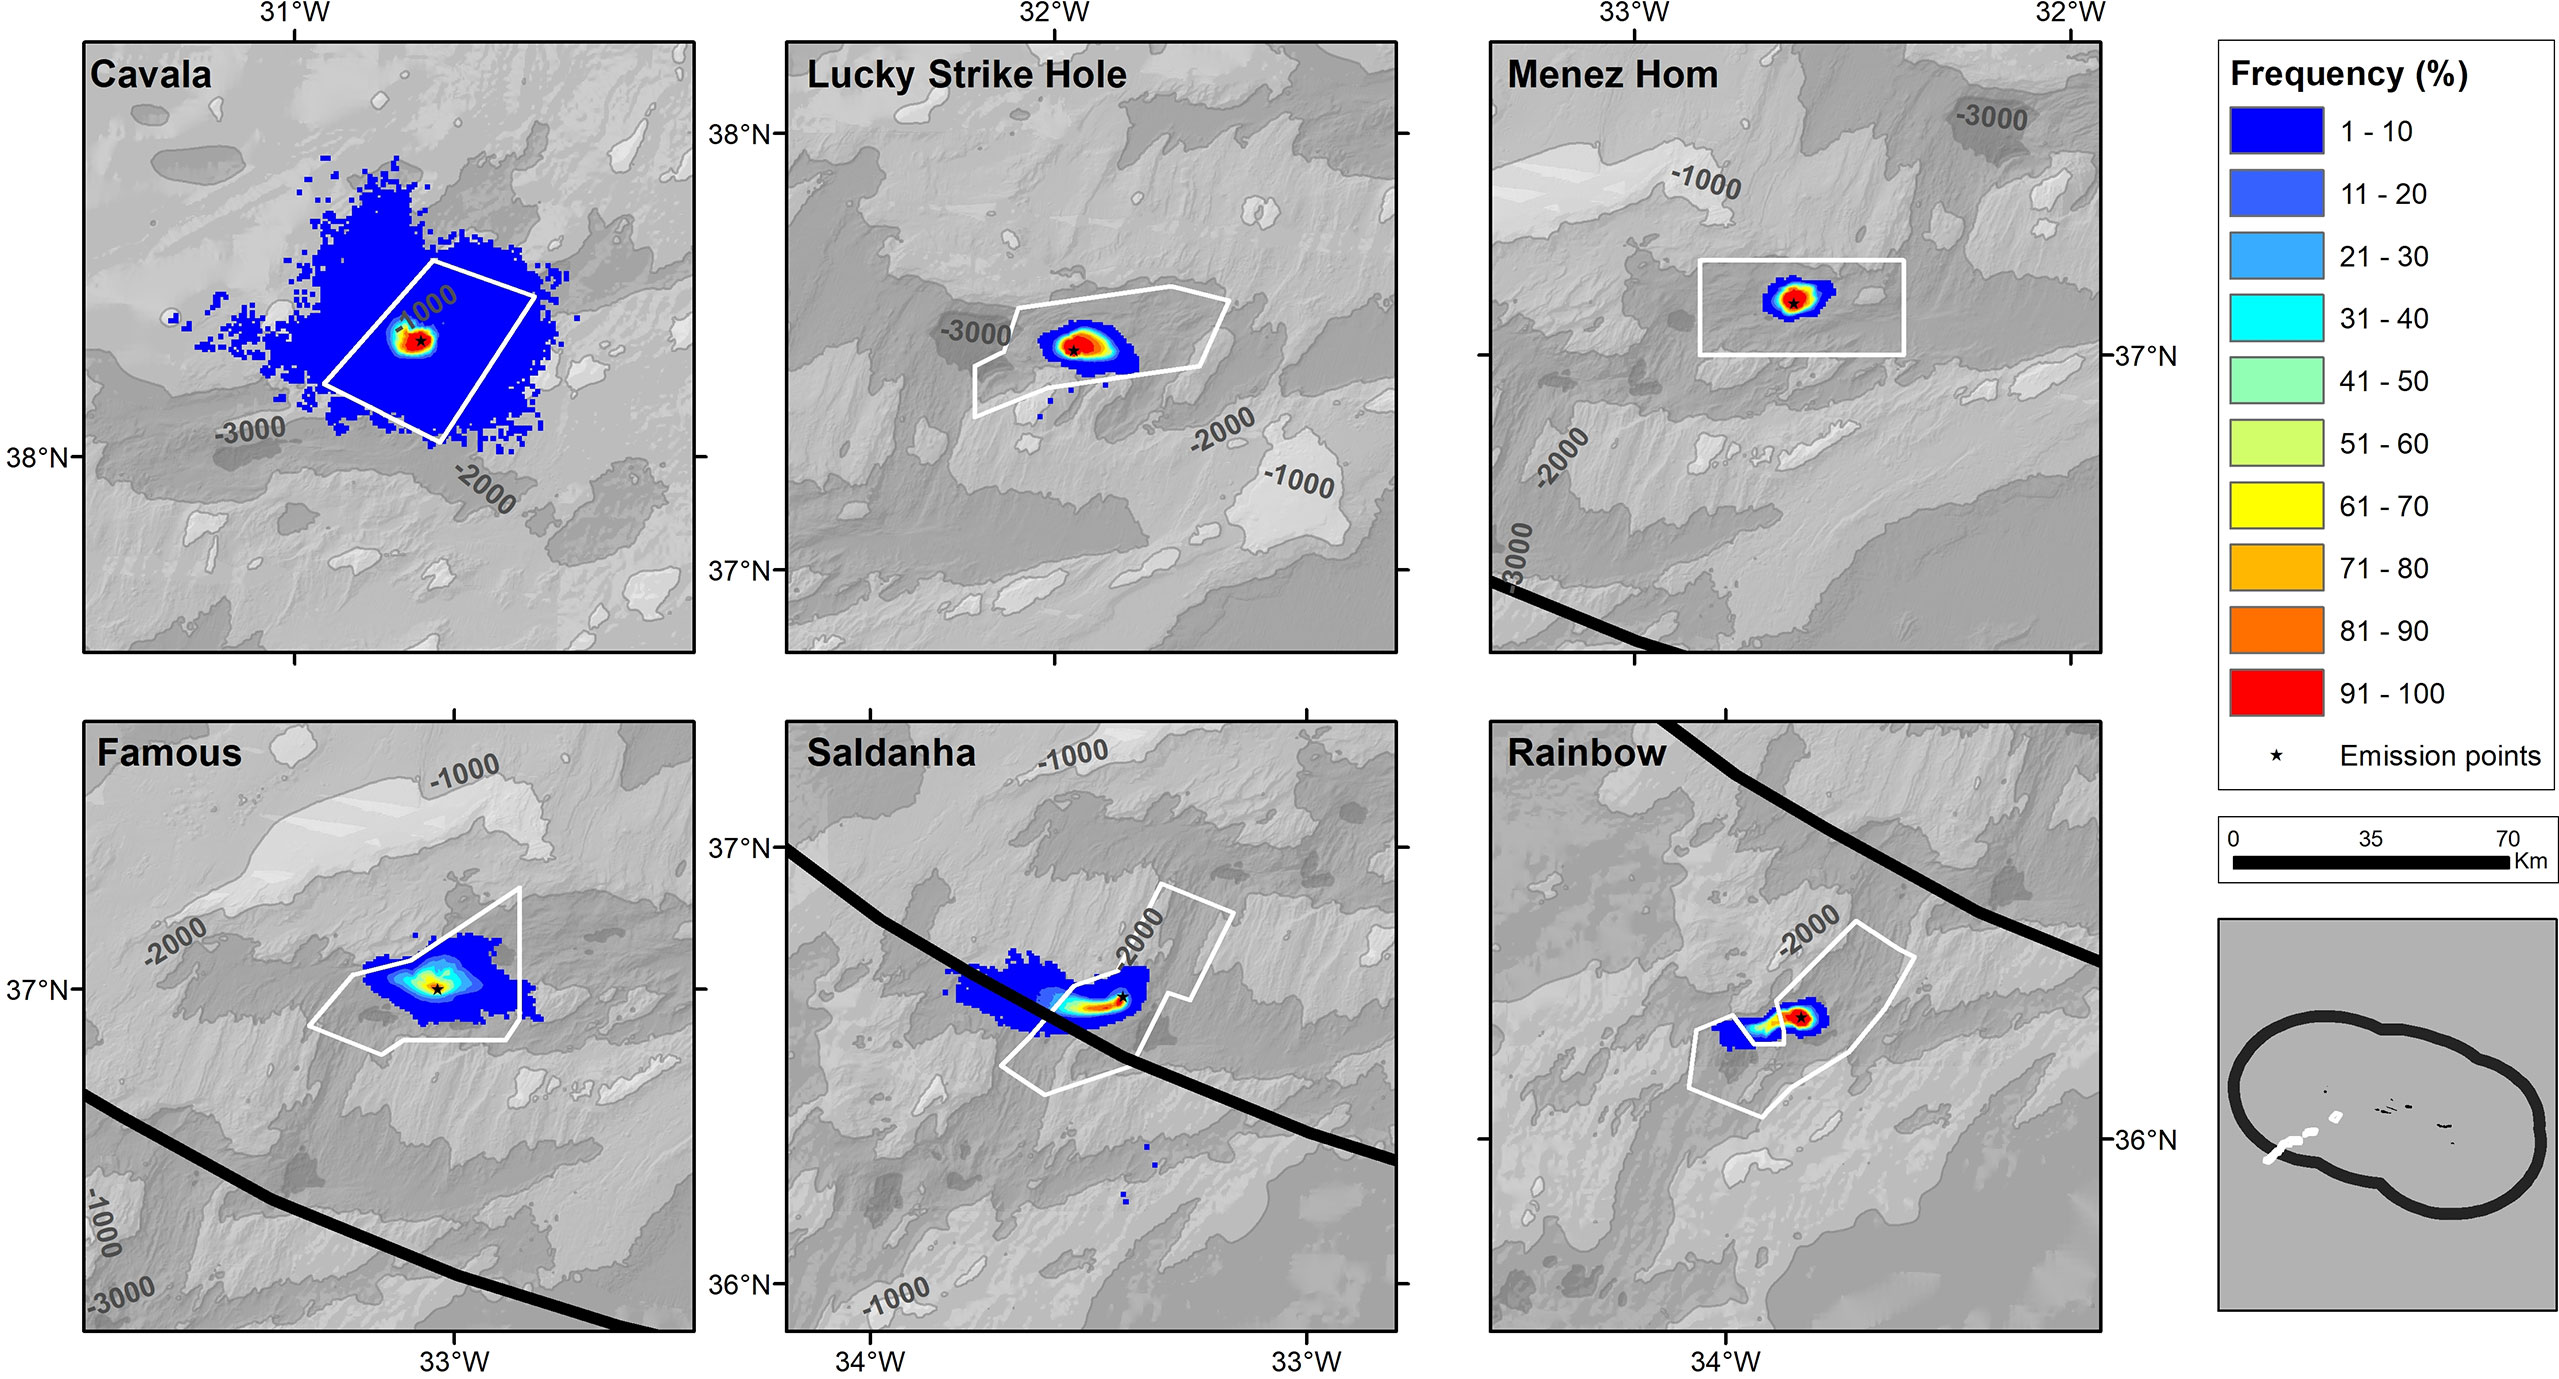
Figure 7 Proportion of simulated time (temporal frequency) that a specific 2-dimensional space, in six study areas, contained return water discharge plume concentrations higher than the adopted thresholds (i.e., 5,000-fold dilution), during a 12-months simulation and assuming a control temperature as the annual minimum temperature of each location (T1). Salinity of discharge was calculated assuming the MOHID salinity of 83.3% surface water and 16.7% of seafloor water.
The model also projected some differences among the study sites on the patterns of the return water discharge plume dispersal and frequencies above thresholds, probably due to localised current patterns associated with the local topography (Figures 6, 7). For example, the return water plume in Cavala seamount was projected to spread on a latitudinal and longitudinal gradient along the MAR axis, while in the Saldanha and Famous sites were projected to spread mostly on a longitudinal gradient across the main MAR axis. In Menez Hom and Lucky Strike sites, return water plume dispersion was projected to be somehow retained within the main MAR axis.
The models projected large 2-dimensional footprints of the return water discharge plume at larger concentrations than the 5,000-fold dilution threshold, averaging among sites 568 km2 and 37.3 km of maximum linear distance (Table 3). Footprints of the discharge water concentrations five and seventeen times greater than the threshold (i.e., dilutions of 1,000 and 300-fold) averaged among sites 237 km2 and 72 km2 (Supplementary Table 5). However, the footprint of persistent plumes with larger concentrations than the 5,000-fold threshold, was projected to be much smaller, averaging 36.5 km2 and 9.5 km of maximum linear distance (Table 3 and Supplementary Table 5). The model projected some differences among sites, with Saldanha, Rainbow, and Lucky Strike Hole projected to have the largest persistent horizontal footprint, ranging from 10.6 to 11.8 km.
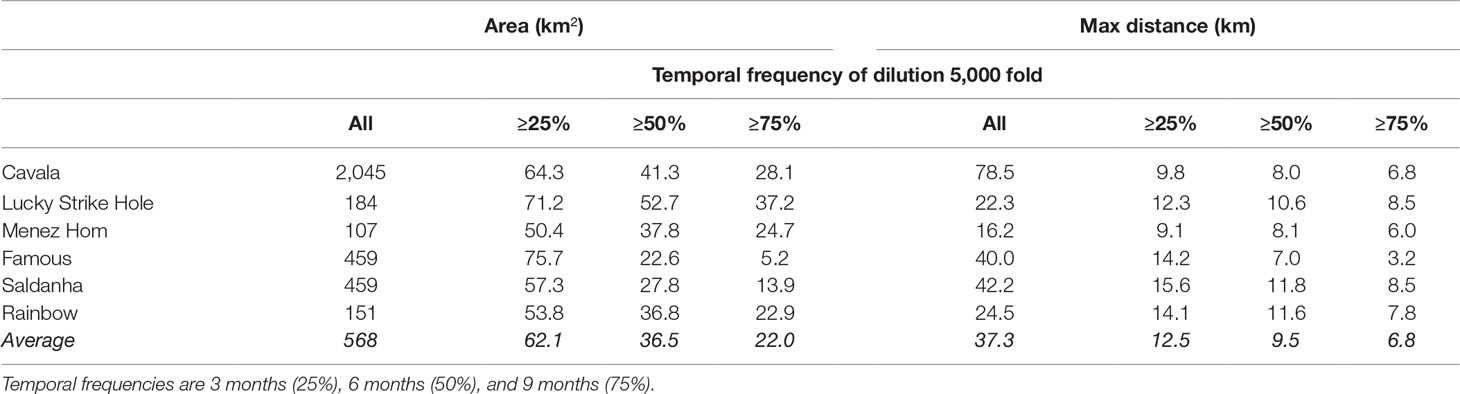
Table 3 Projected dispersal in 2-dimensional space of the return water discharge plume in area (km2) and maximum linear distance (km) in relation to the estimated temporal frequencies, i.e. the proportion of simulated days that a specific 2-dimensional space contained plumes at greater concentrations than the adopted threshold of 5,000-fold dilution.
The vertical footprint of the return water discharge plume at concentrations greater than the 5,000-fold dilution threshold showed similar patterns compared to the in situ excavation sediment plumes (see 3.1), extending to much shallower depths in all studied sites (Figure 8). In general, the model projected a vertical footprint greater than 600 m in the water column. In many study sites (e.g., Cavala, Lucky Strike Hole or Menez Hom), the meridional and zonal cross-sections showed that the plumes of the return water may get trapped on or spread along the flanks and summits of close topographic features (Supplementary Figure 5).
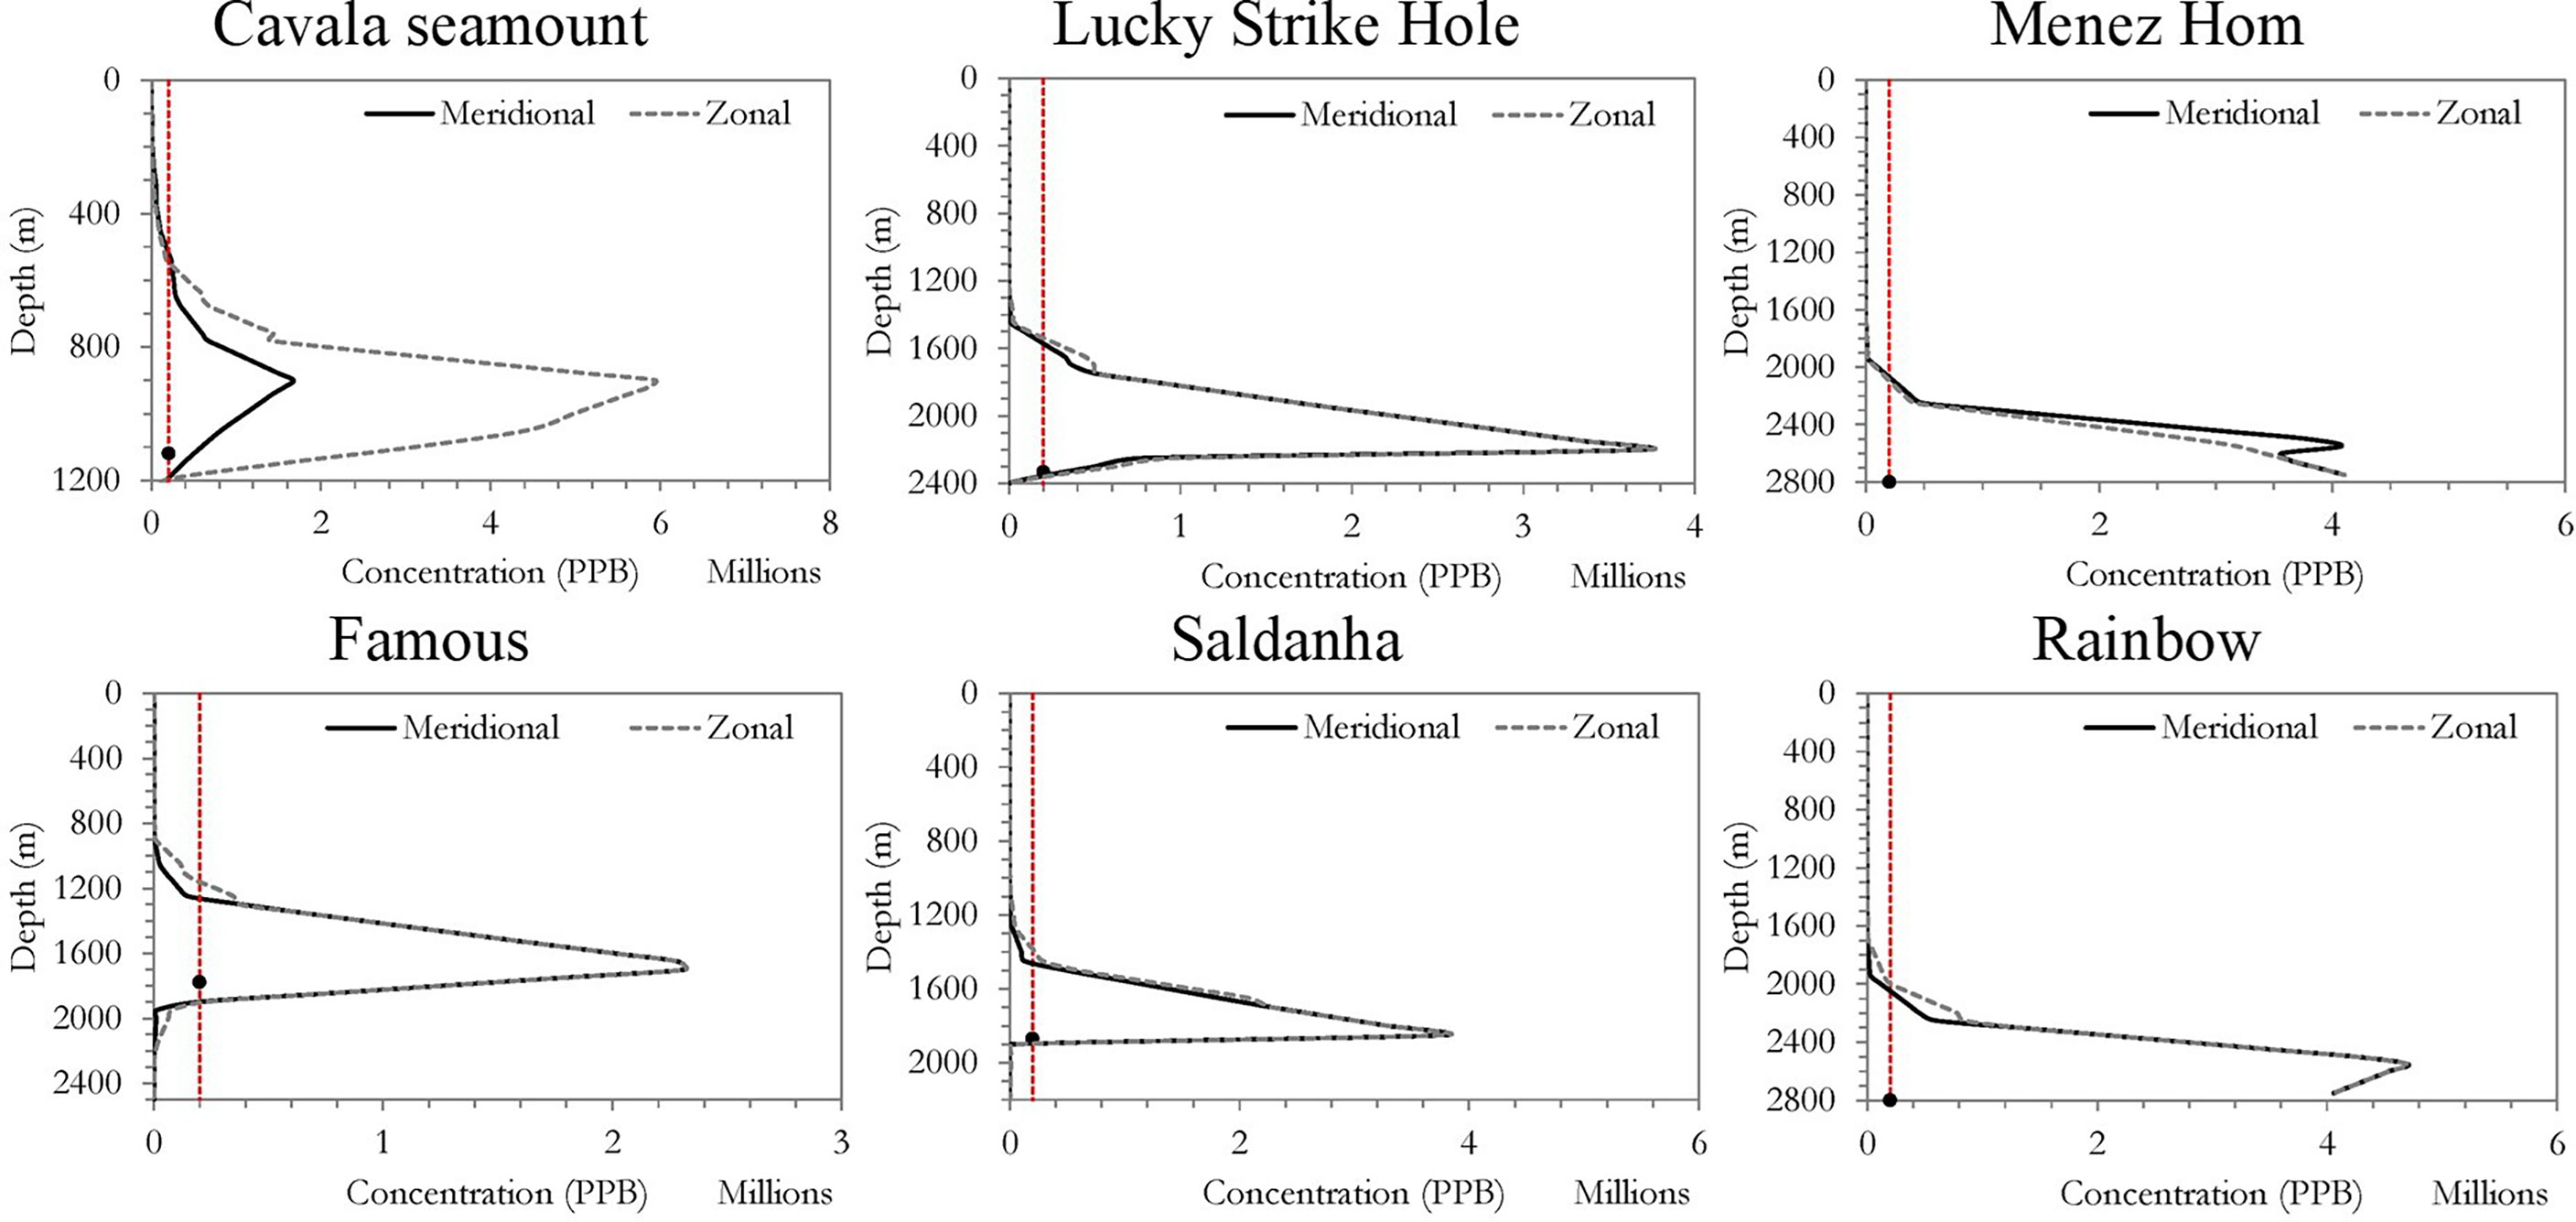
Figure 8 Vertical distribution of the return water discharge plume concentration (in PPB) along meridional and zonal cross sections of the study sites, calculated as the maximum concentration in the 50 vertical layers of each 2-dimensional cell, averaged over a 12-months simulation period. The control temperature was calculated as the annual minimum temperature of each location (T1). The salinity of discharge was calculated assuming the MOHID salinity of 83.3% surface water and 16.7% of seafloor water. Red line shows the 5,000-fold dilution threshold and the black dot represents the depth of the stationary emission.
The sensitivity of the return water plume-dispersal model projections to the input parameters in Cavala and Lucky Strike Hole showed some seasonal variations but small differences related to discharge temperatures (Supplementary Figures 6−9). The computed fuzzy numerical similarities between seasons ranged from 0.16 (poor) and 0.79 (good) for both plume concentrations and temporal frequencies at higher concentrations than the 5,000-fold dilution threshold (Supplementary Table 6), with most differences being measured in cells with low values on the plume-dispersal edges. It is worth noting that in Cavala seamount, the main direction of the predicted return water plume-dispersal varied between seasons and that in both sites slightly higher plume-dispersal were projected in the 4th trimester (October-December). The fuzzy numerical similarities between discharge temperatures ranged from 0.67 (good) and 0.79 (good) (Supplementary Table 6), with minor differences projected for both sites (Supplementary Figures 6–9). Similar to patterns in the discharge temperature, variations were projected for the temporal frequencies above other concentrations thresholds (Supplementary Figures 10, 11).
3.2.2 Return Sediment Discharge Plume
Similarly to the return water discharge, our simulation projected large 2-dimensional dispersal of the solids in the return sediment discharge plume (Figure 9), with higher concentrations, averaged over a one-year period, projected in Cavala seamount, Rainbow, and Menez Hom sites (45, 35 and 34 mg·L-1, respectively). In most sites, return sediment discharge plume concentrations above the accepted threshold of 1.2 mg·L-1 were projected to disperse only within the claimed areas. However, in the Rainbow site, we projected plume dispersal outside the claimed area. In all study sites, the model projected persistent sediment solids concentrations of 1.2 mg·L-1 (Figure 10). The horizontal footprint of persistent return sediment discharge plumes above the 1.2 mg·L-1 threshold was projected to average 150 km2 and 21 km in linear distance (Table 4); in some cases, slightly beyond the claimed areas. Menez Hom, Lucky Strike Hole and Rainbow sites were projected to have the largest horizontal footprints (Table 4). In three sites, the model projected large areas (>20 km2) with persistent sediment solids concentrations above 5 mg·L-1; i.e., approx. 125x higher than the background of 0.04 mg·L-1 and 4 times higher than the accepted threshold (Supplementary Table 7). However, it should be noted that the projected areas impacted by the return sediment discharge plume, regardless of the temporal frequency, can be extremely large (in the order of thousands of squared kilometres) for all concentrations examined (Table 4 and Supplementary Table 7).
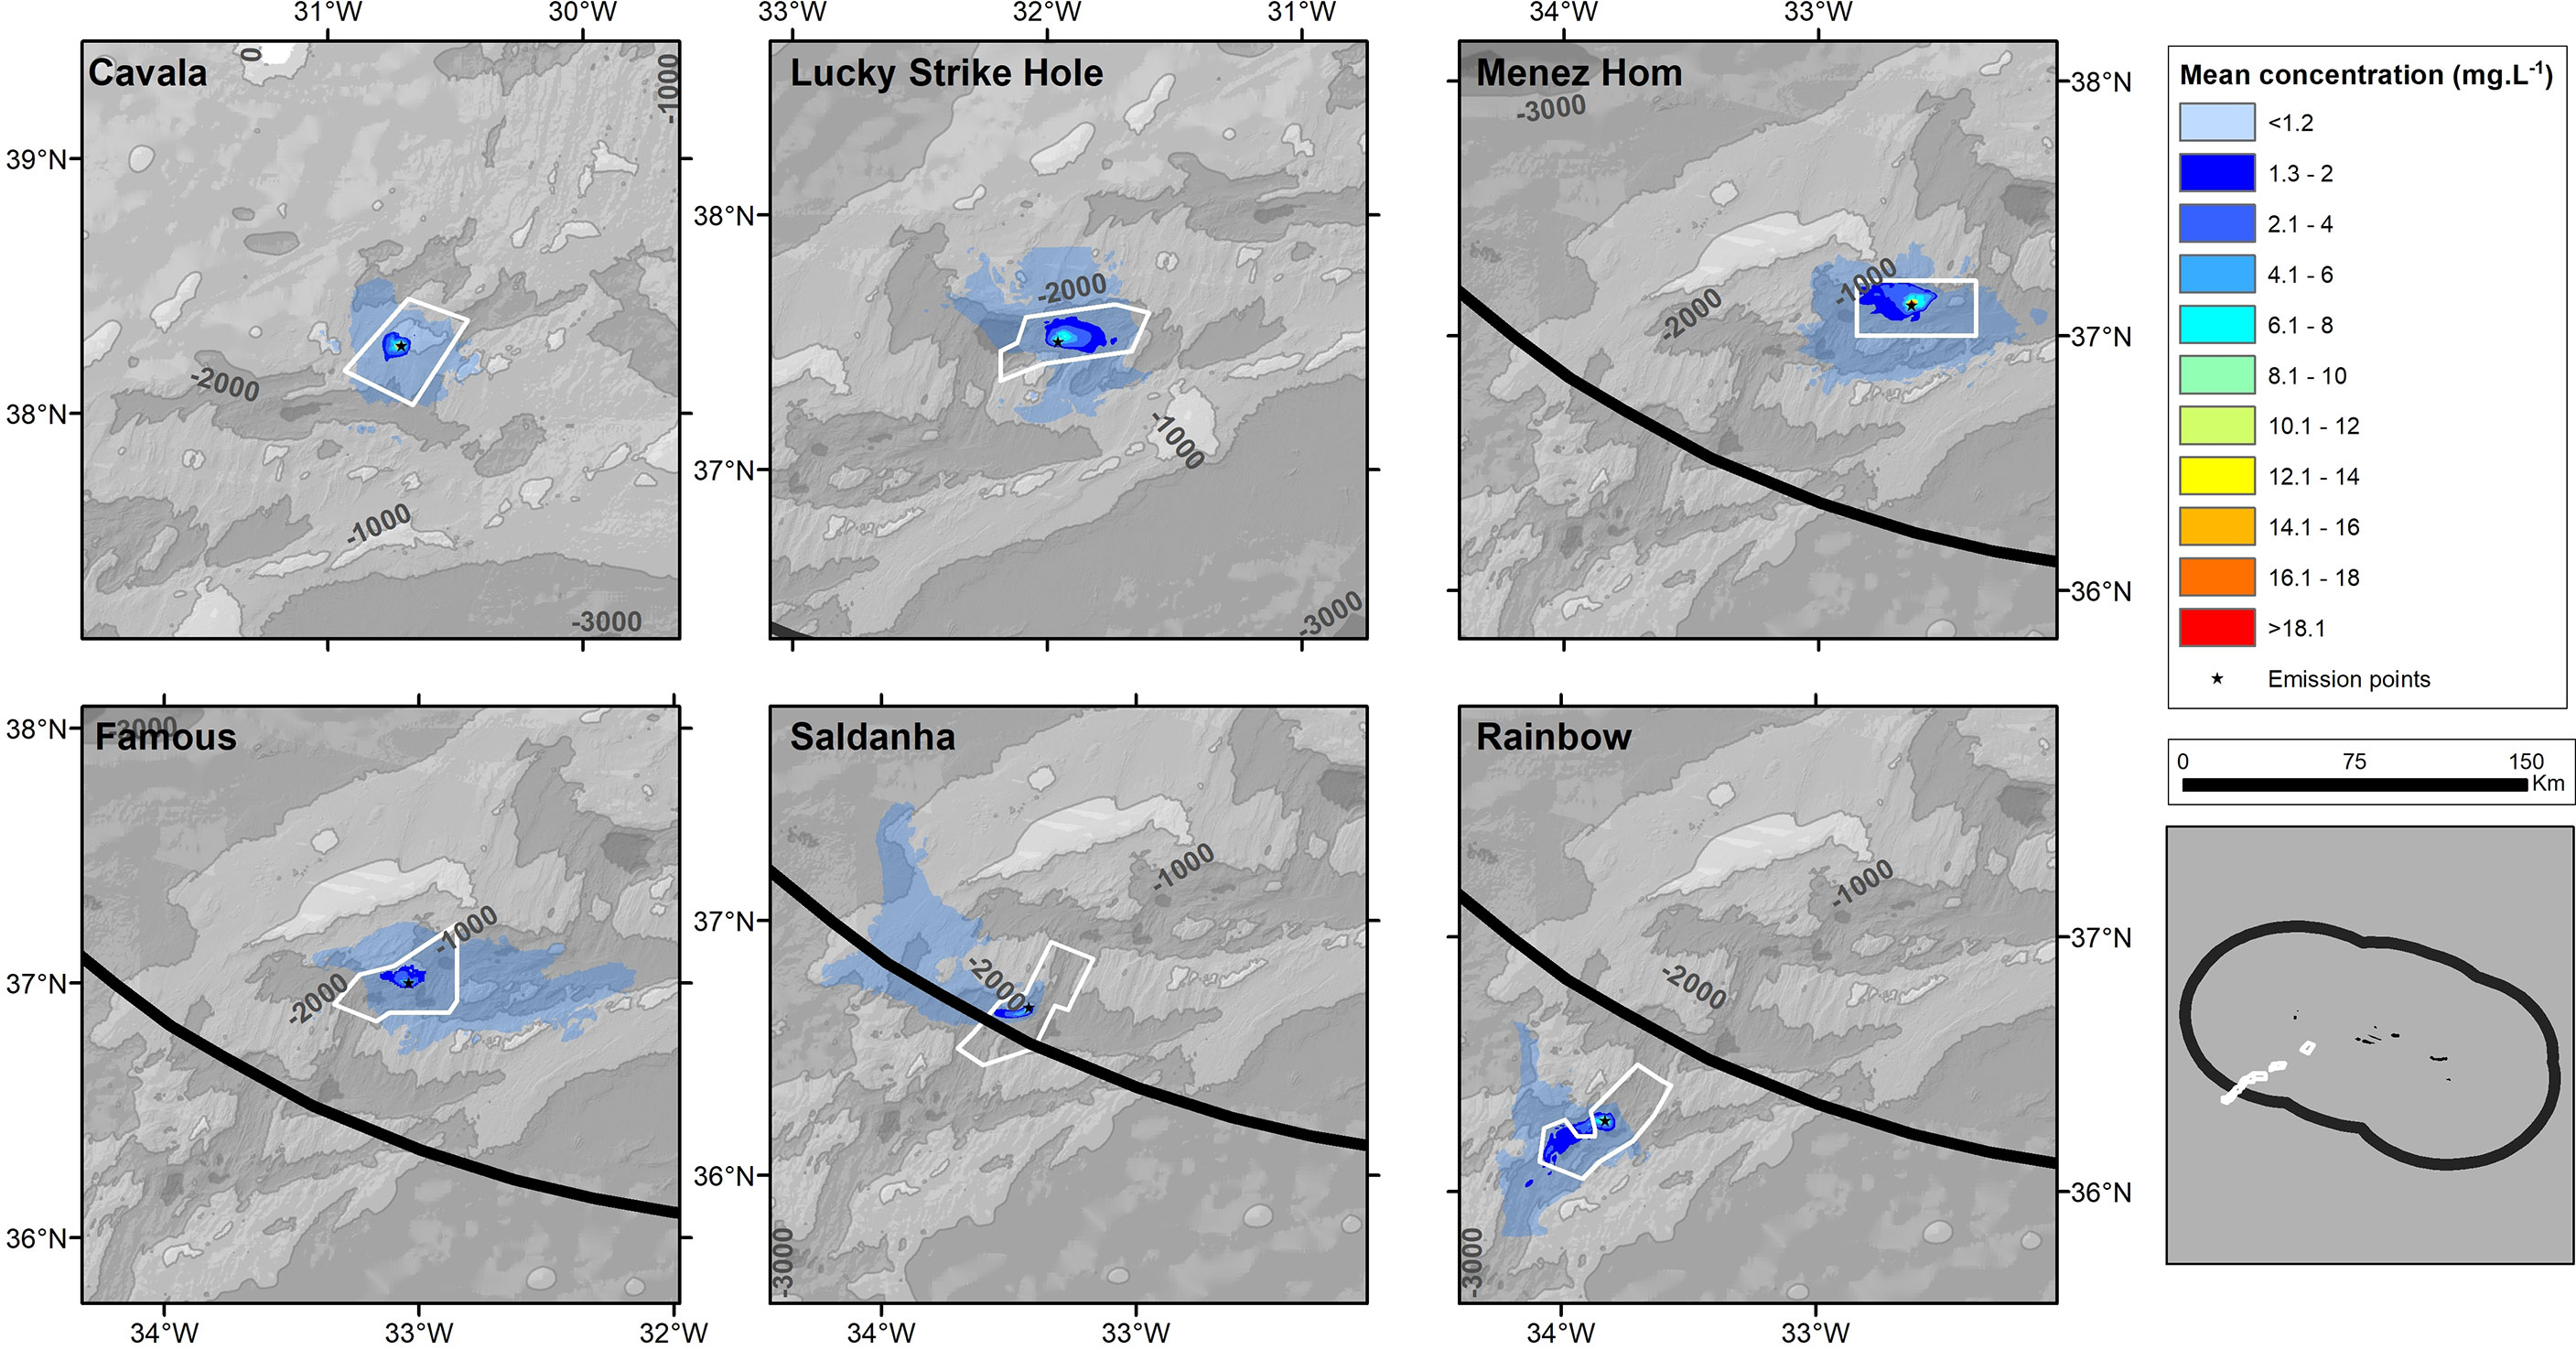
Figure 9 Concentration of sediments in the return sediment discharge plume, calculated as the maximum concentration in the 50 vertical layers of each 2-dimensional cell, for each output time step (3 hours), averaged over all time steps during a 12-months simulation. The average particle diameter was assumed to be 4 µm with an average particle density of 3,780 kg·m-3 and a resultant settling velocity of 0.002 cm·s-1.
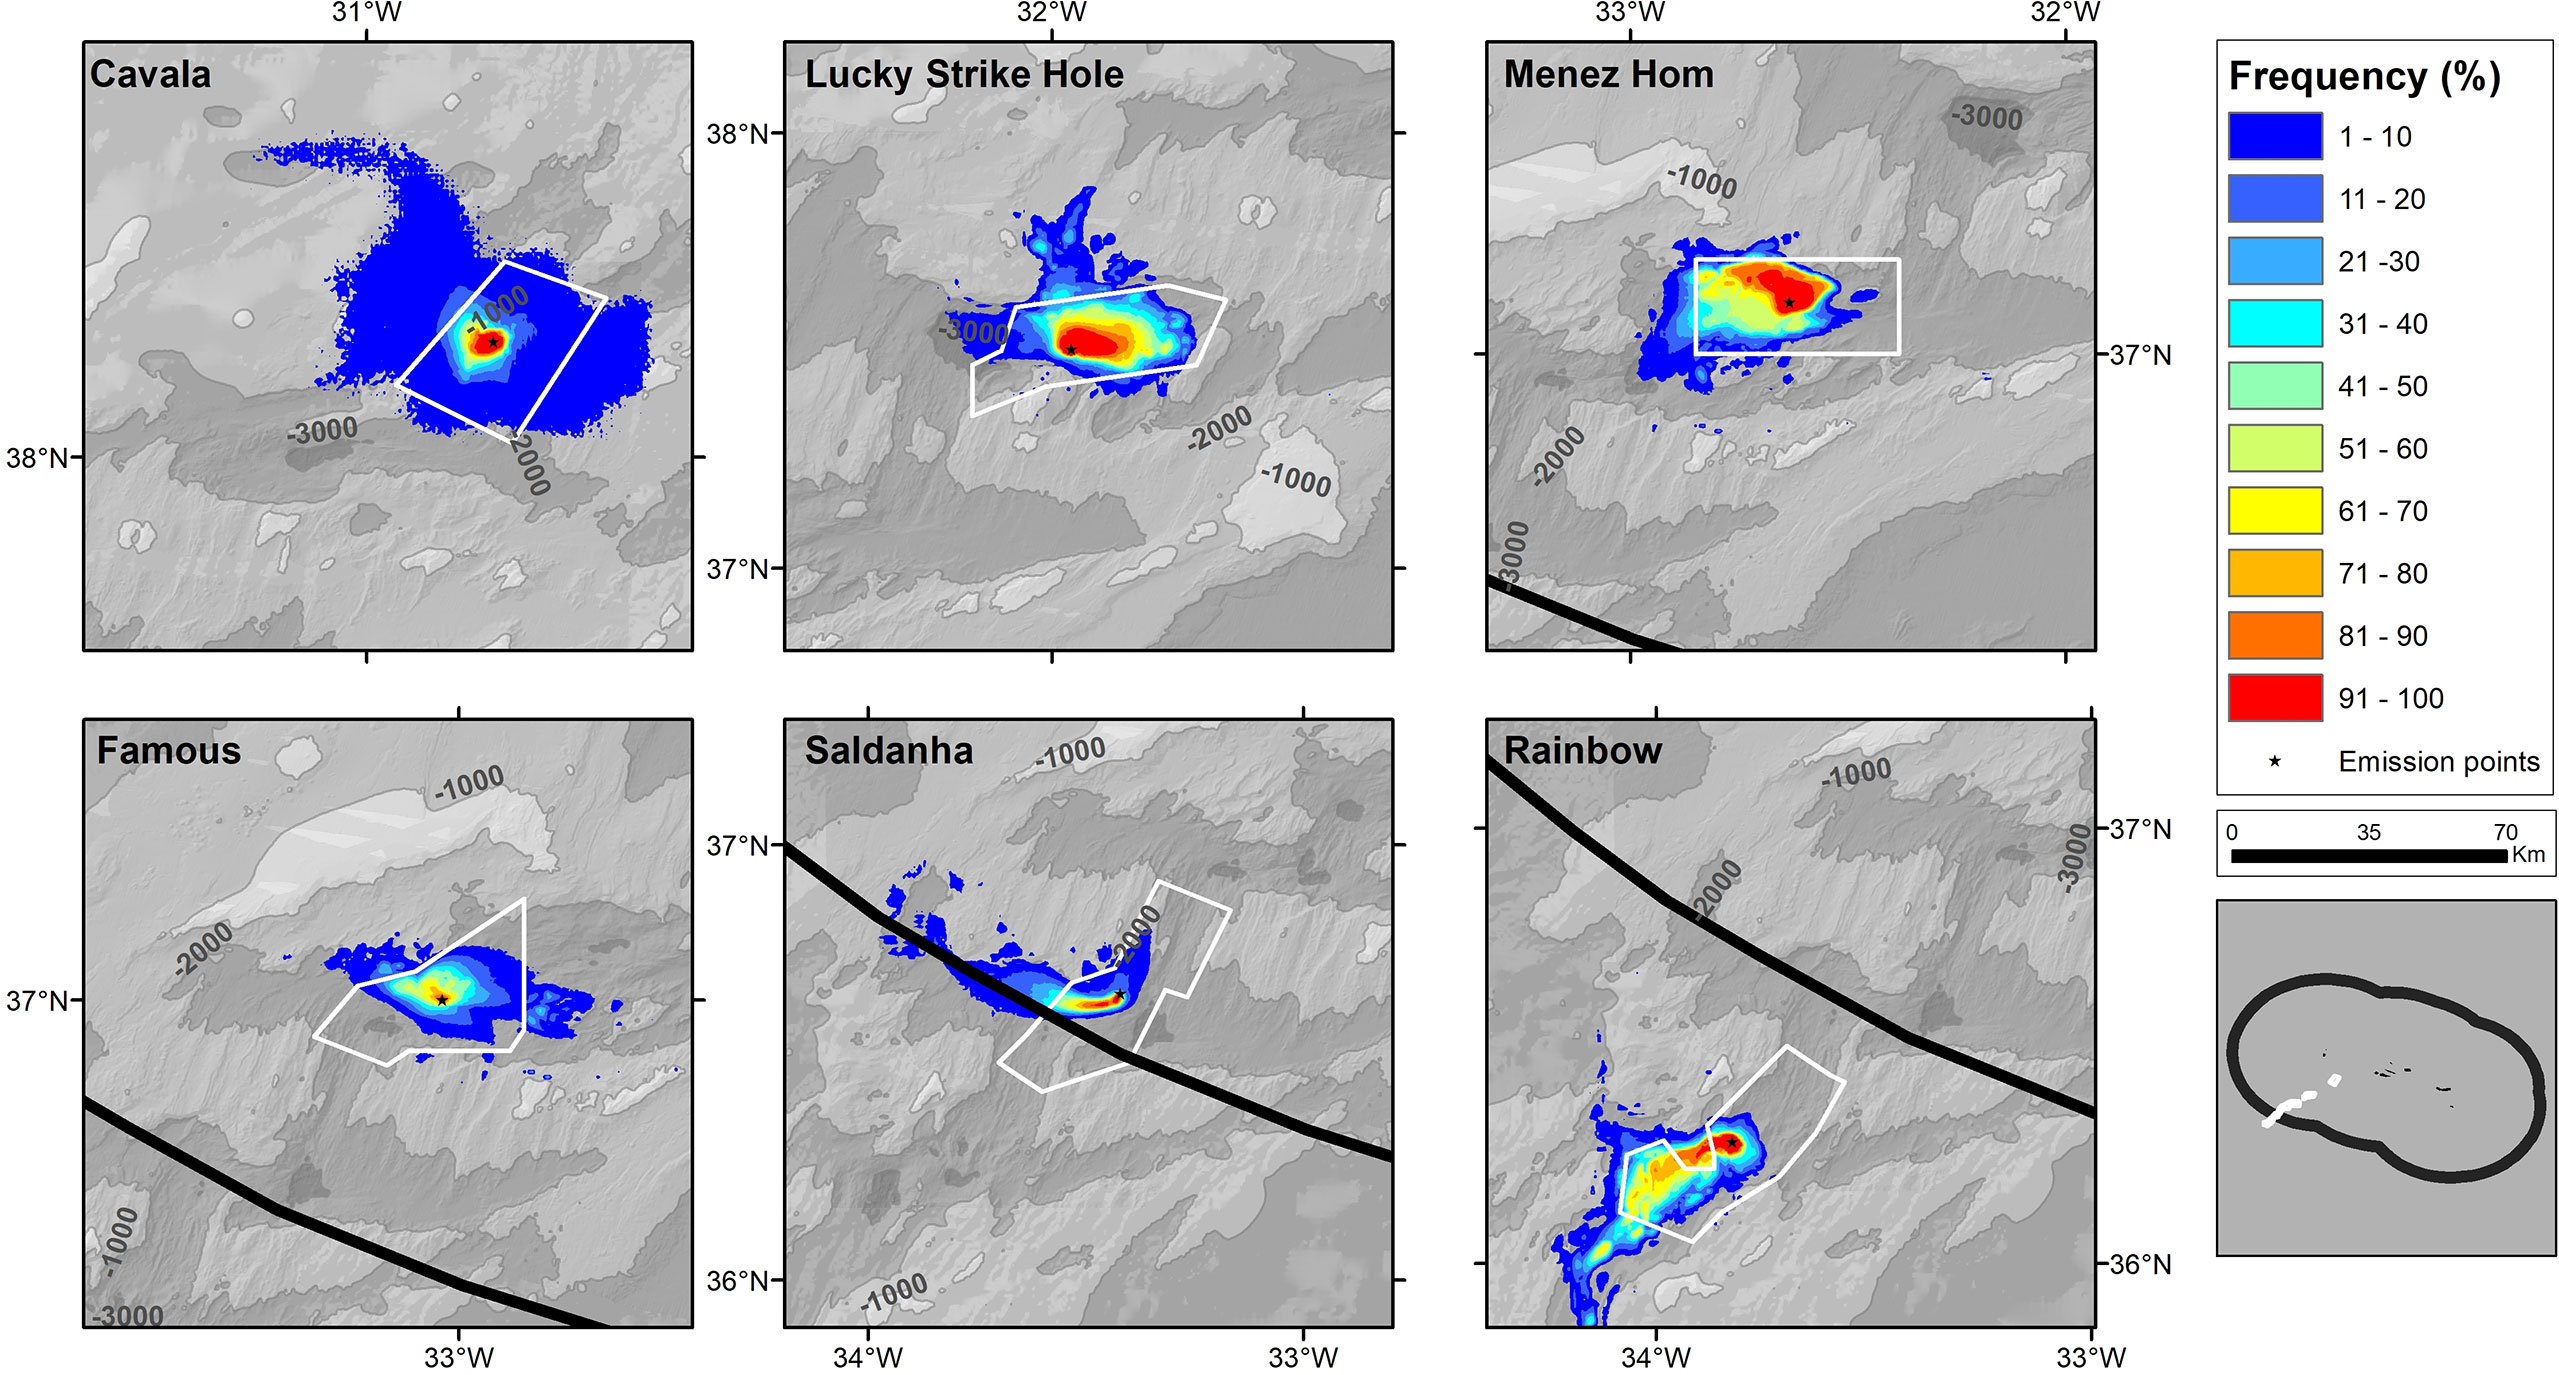
Figure 10 Proportion of simulated time (temporal frequency) that a specific 2-dimensional space cell, in six study areas, contained return sediments discharge plume above a 1.2 mg·L-1 concentration threshold, during a 12-months simulation, assuming an average particle diameter of 4 µm, an average particle density of 3,780 kg·m-3, and a resultant settling velocity of 0.002 cm·s-1.
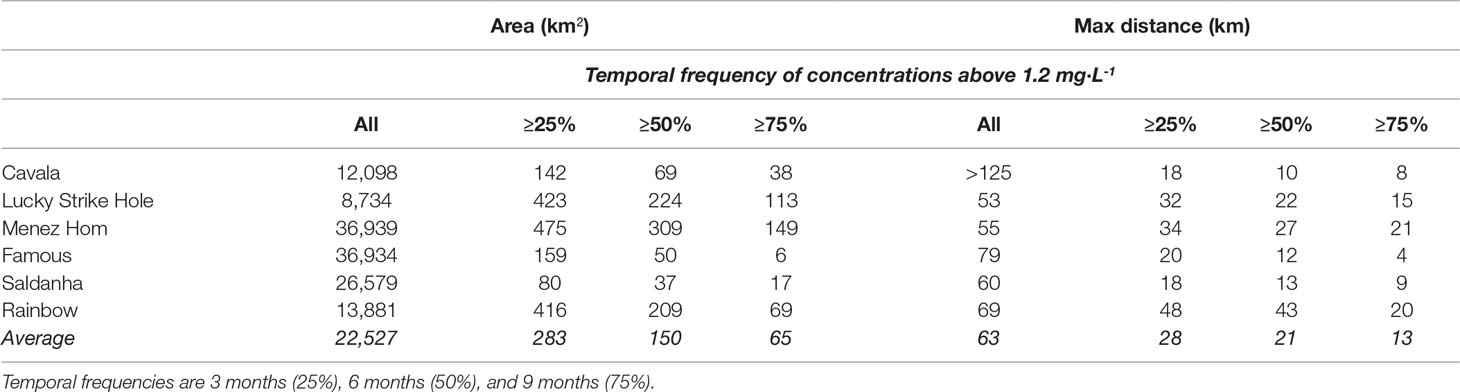
Table 4 Projected dispersal in 2-dimensional space of the discharge sediment plume exceeding 1.2 mg·L-1 concentration in area (km2) and maximum linear distance (km) in relation to the estimated temporal frequency, i.e. the proportion of simulated days that a specific 2-dimensional space contained plumes above the adopted concentration threshold.
The vertical footprint of the return sediment discharge plume showed similar patterns compared to the return water discharge plumes and the in situ excavation sediment plumes. It showed an average plume thickness of 800 m in all sites except Saldanha. On average, return sediment discharge plume thickness of 800 m at concentrations above the 1.2 mg·L-1 threshold were projected at most studied sites (Figure 11; Supplementary Figure 12). In many sites (e.g., Cavala, Lucky Strike Hole, Menez Hom, or Rainbow), the meridional and zonal cross-sections showed that the return sediment discharge plumes may get trapped on or spread along the flanks and summits of close topographic features (Supplementary Figure 12).
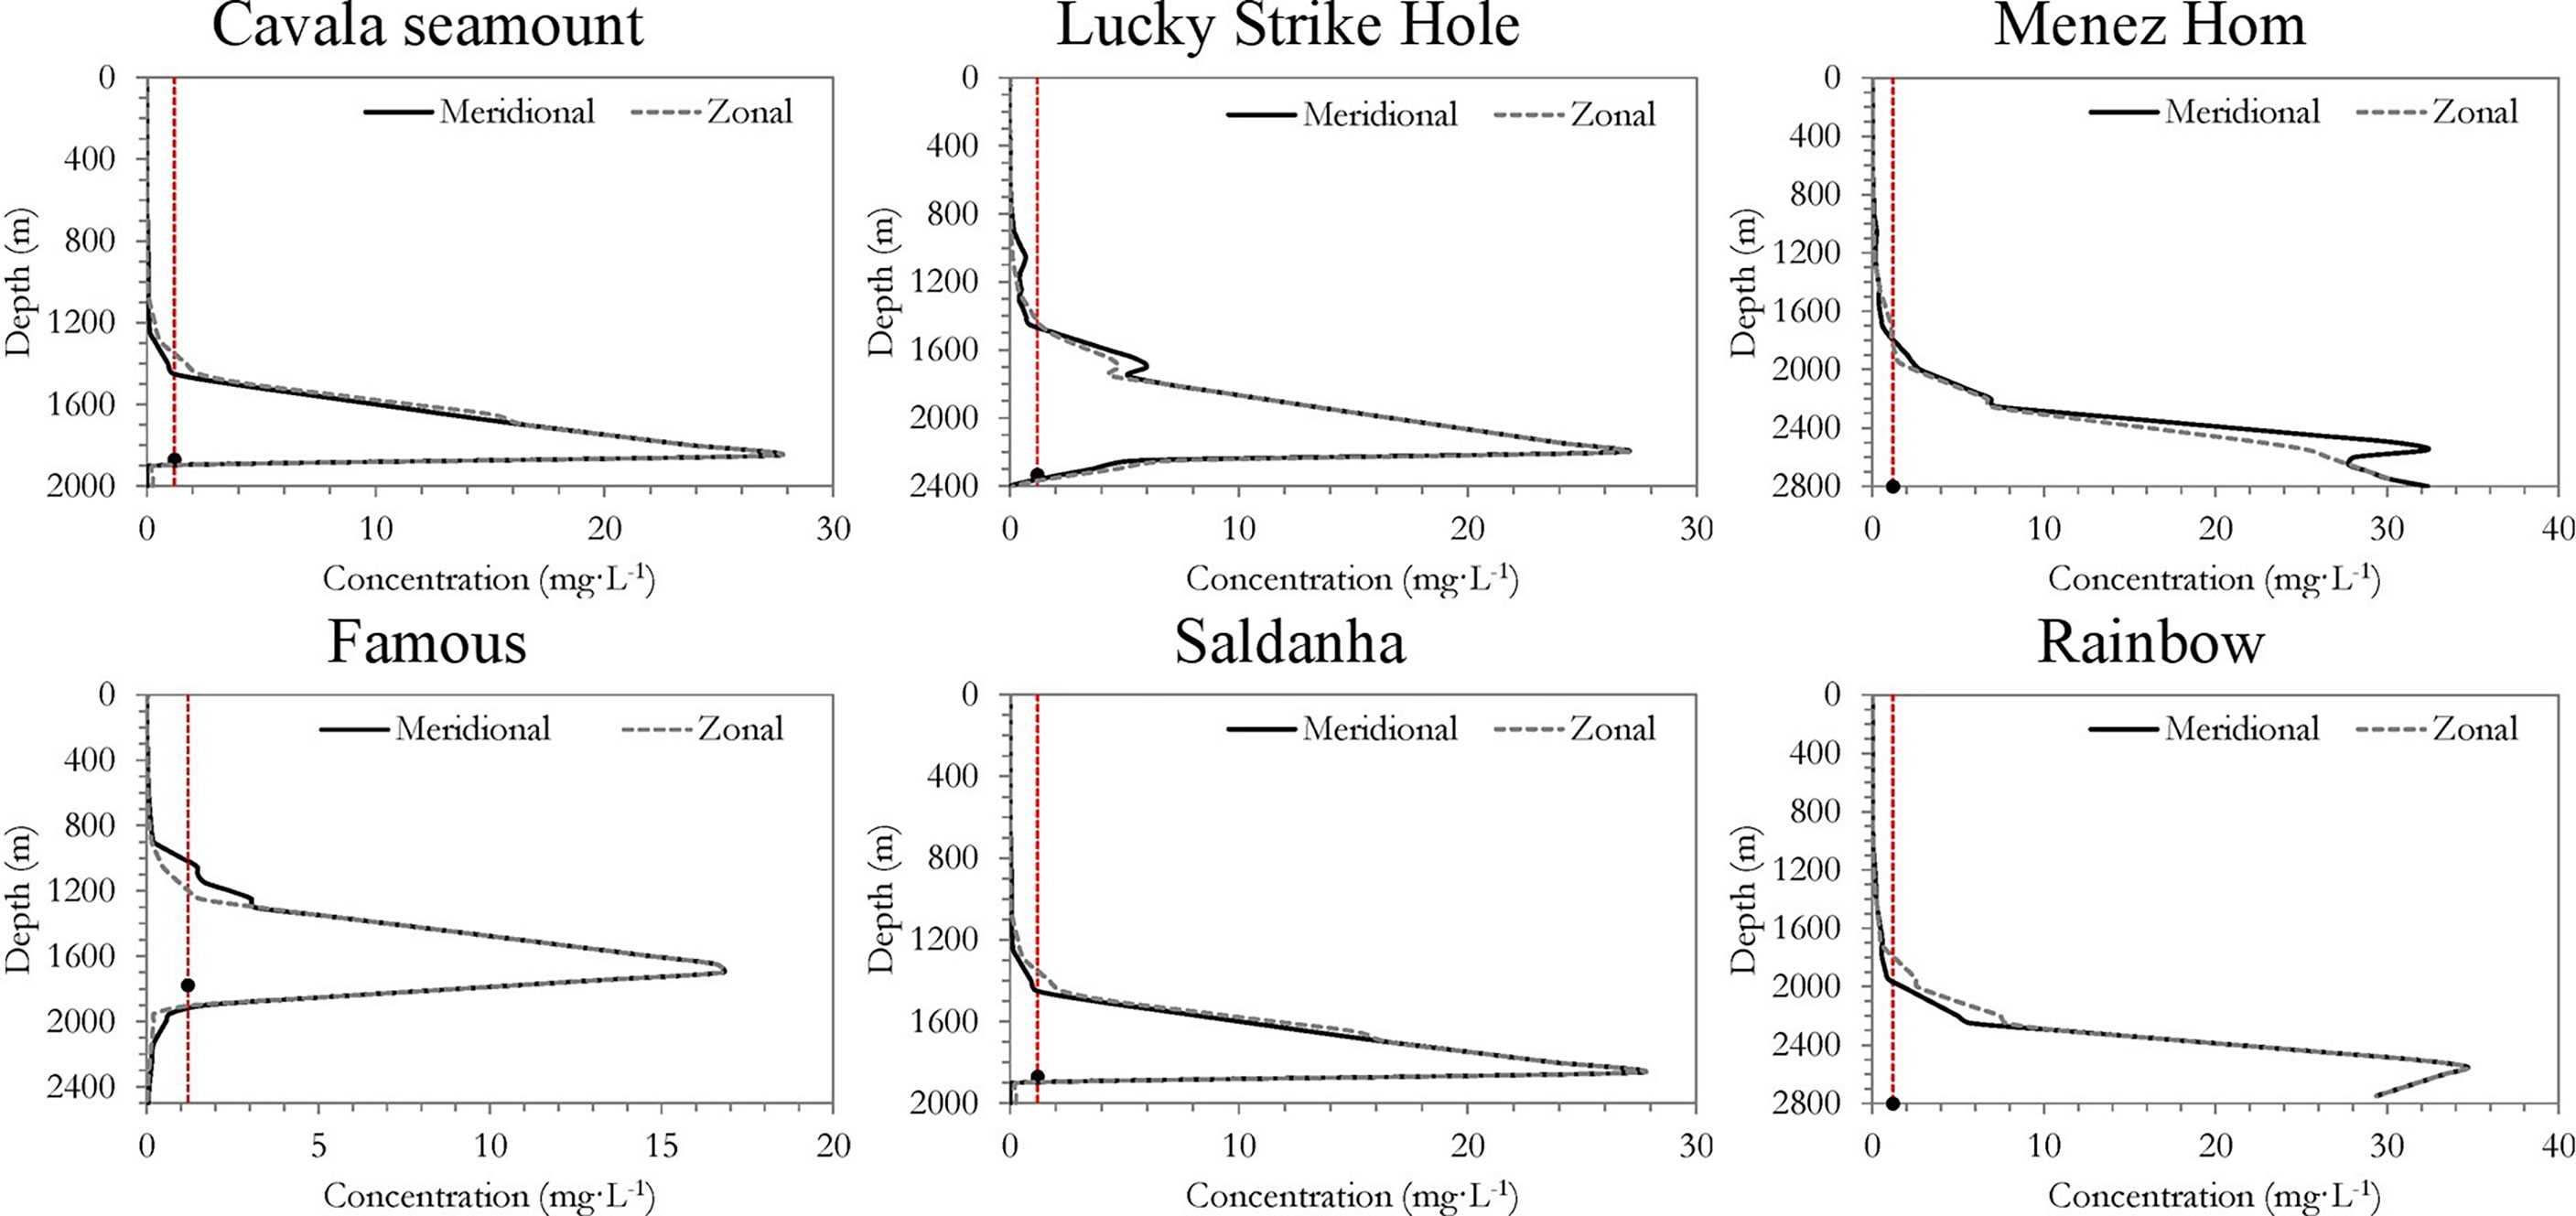
Figure 11 Vertical distribution of the return sediment discharge plume concentration (in mg·L-1) calculated as the maximum concentration in the 50 vertical layers of each 2-dimensional cell, averaged over a 12-months simulation. Red line shows the 1.2 mg·L-1 concentration threshold and the black dot represents the depth of the stationary emission.
The cumulative bottom thickness of the settled sediment from the sediment discharge was estimated to be very small (averaging in sites from 0.01 to 0.09 mm), with peaks of up to 0.92 mm mostly close to the discharge point (Figure 12). However, the estimated footprint varied considerably between sites, with Menez Hom, Famous and Saldanha models showing large areas with settled sediments, reaching many close topographic features (e.g., Sarda seamount, Cavalo and Farpas ridge).The model projections were not highly affected by the average particle size or particle densities adopted (Supplementary Figures 13–16) since the computed fuzzy numerical similarities were greater than 0.76 (good) for the concentration of sediments averaged over time and, in general, greater than 0.50 (fair) for the thickness of settled sediments (Supplementary Table 8). Nevertheless, smaller (4 µm) or lighter 4 µm (ρ= 3,300 kg·m- 3) particles were projected to settle further away from the emission points. Similar patterns were obtained for the temporal frequencies of all concentration thresholds (Supplementary Figures 17, 18).
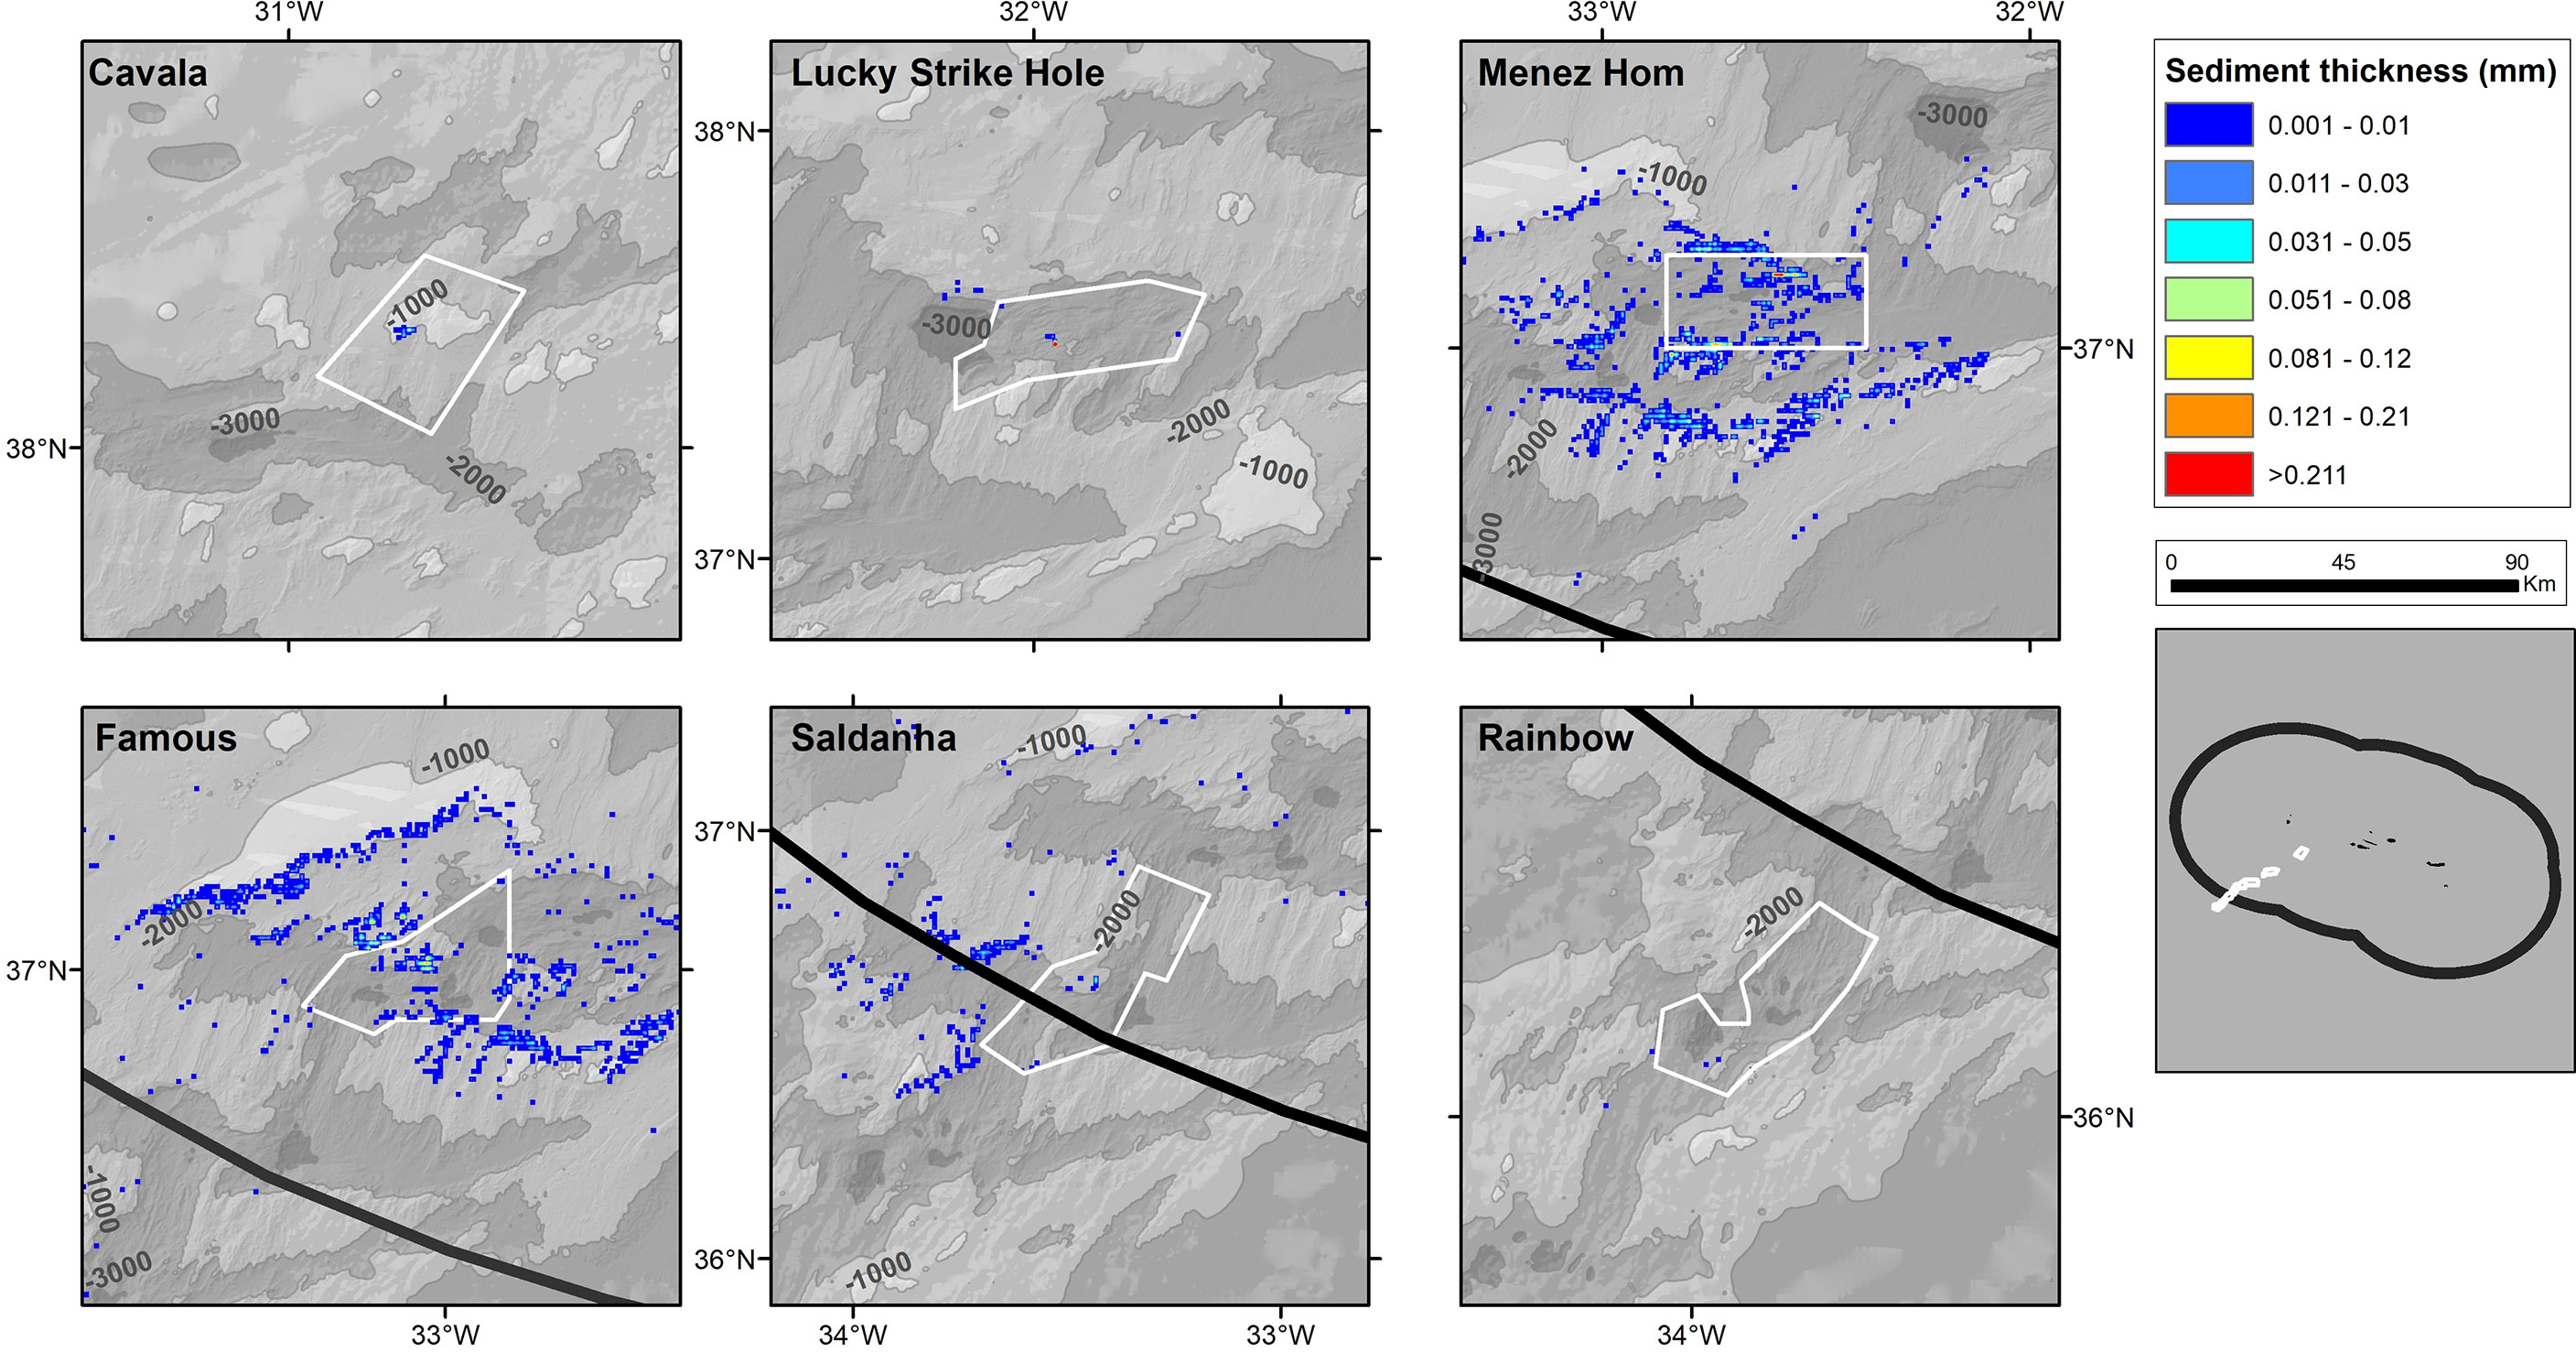
Figure 12 Bottom thickness of settled sediments from the return sediment discharge plume modelled assuming an average particle diameter of 4 µm, an average particle density of 3,780 kg·m-3, and a resultant settling velocity of 0.002 cm·s-1. Duration of the simulation is one year.
3.3 Overlap With Biodiversity and Human Uses
The cumulative plumes projected to be produced during the excavation and the dewatering processes total 2,133 km2 when all areas are considered simultaneously (Figure 13). Of this total, 1,684 km2 were within the Azores EEZ, representing 0.18% of the total EEZ area. Our model projections indicated that 13% of the sediment plumes produced within the Azores EEZ overlapped with the existing bottom longline fishery, while 10% overlapped with the local pelagic longline and 81% and 83% overlapped with the Portuguese mainland and international pelagic longline fisheries, respectively. In terms of area, the cumulative footprint within the Azores EEZ overlaps with 217 km2 of the local bottom longline fishing ground (2.6% of the total footprint) and 164 km2 of the local pelagic longline fishing ground (0.1% of the total footprint) (Morato, unpublished data). In addition, this cumulative footprint overlaps with 1,368 km2 (0.2% of the total footprint) and 1,395 km2 (0.9% of the total footprint) of the footprints of the Portuguese mainland and international pelagic longline fleets within the Azores EZZ. The areas of greater overlap were Cavala seamount for the bottom longline fleet and Lucky Strike Hole, Menez Hom, and Famous for the pelagic longline fleet. Finally, the cumulative plumes were projected to overlap 54 km2 of the predicted suitable habitat for several important habitat-structuring cold-water corals, or 0.5% of the total suitable habitat (Taranto et al., 2020).
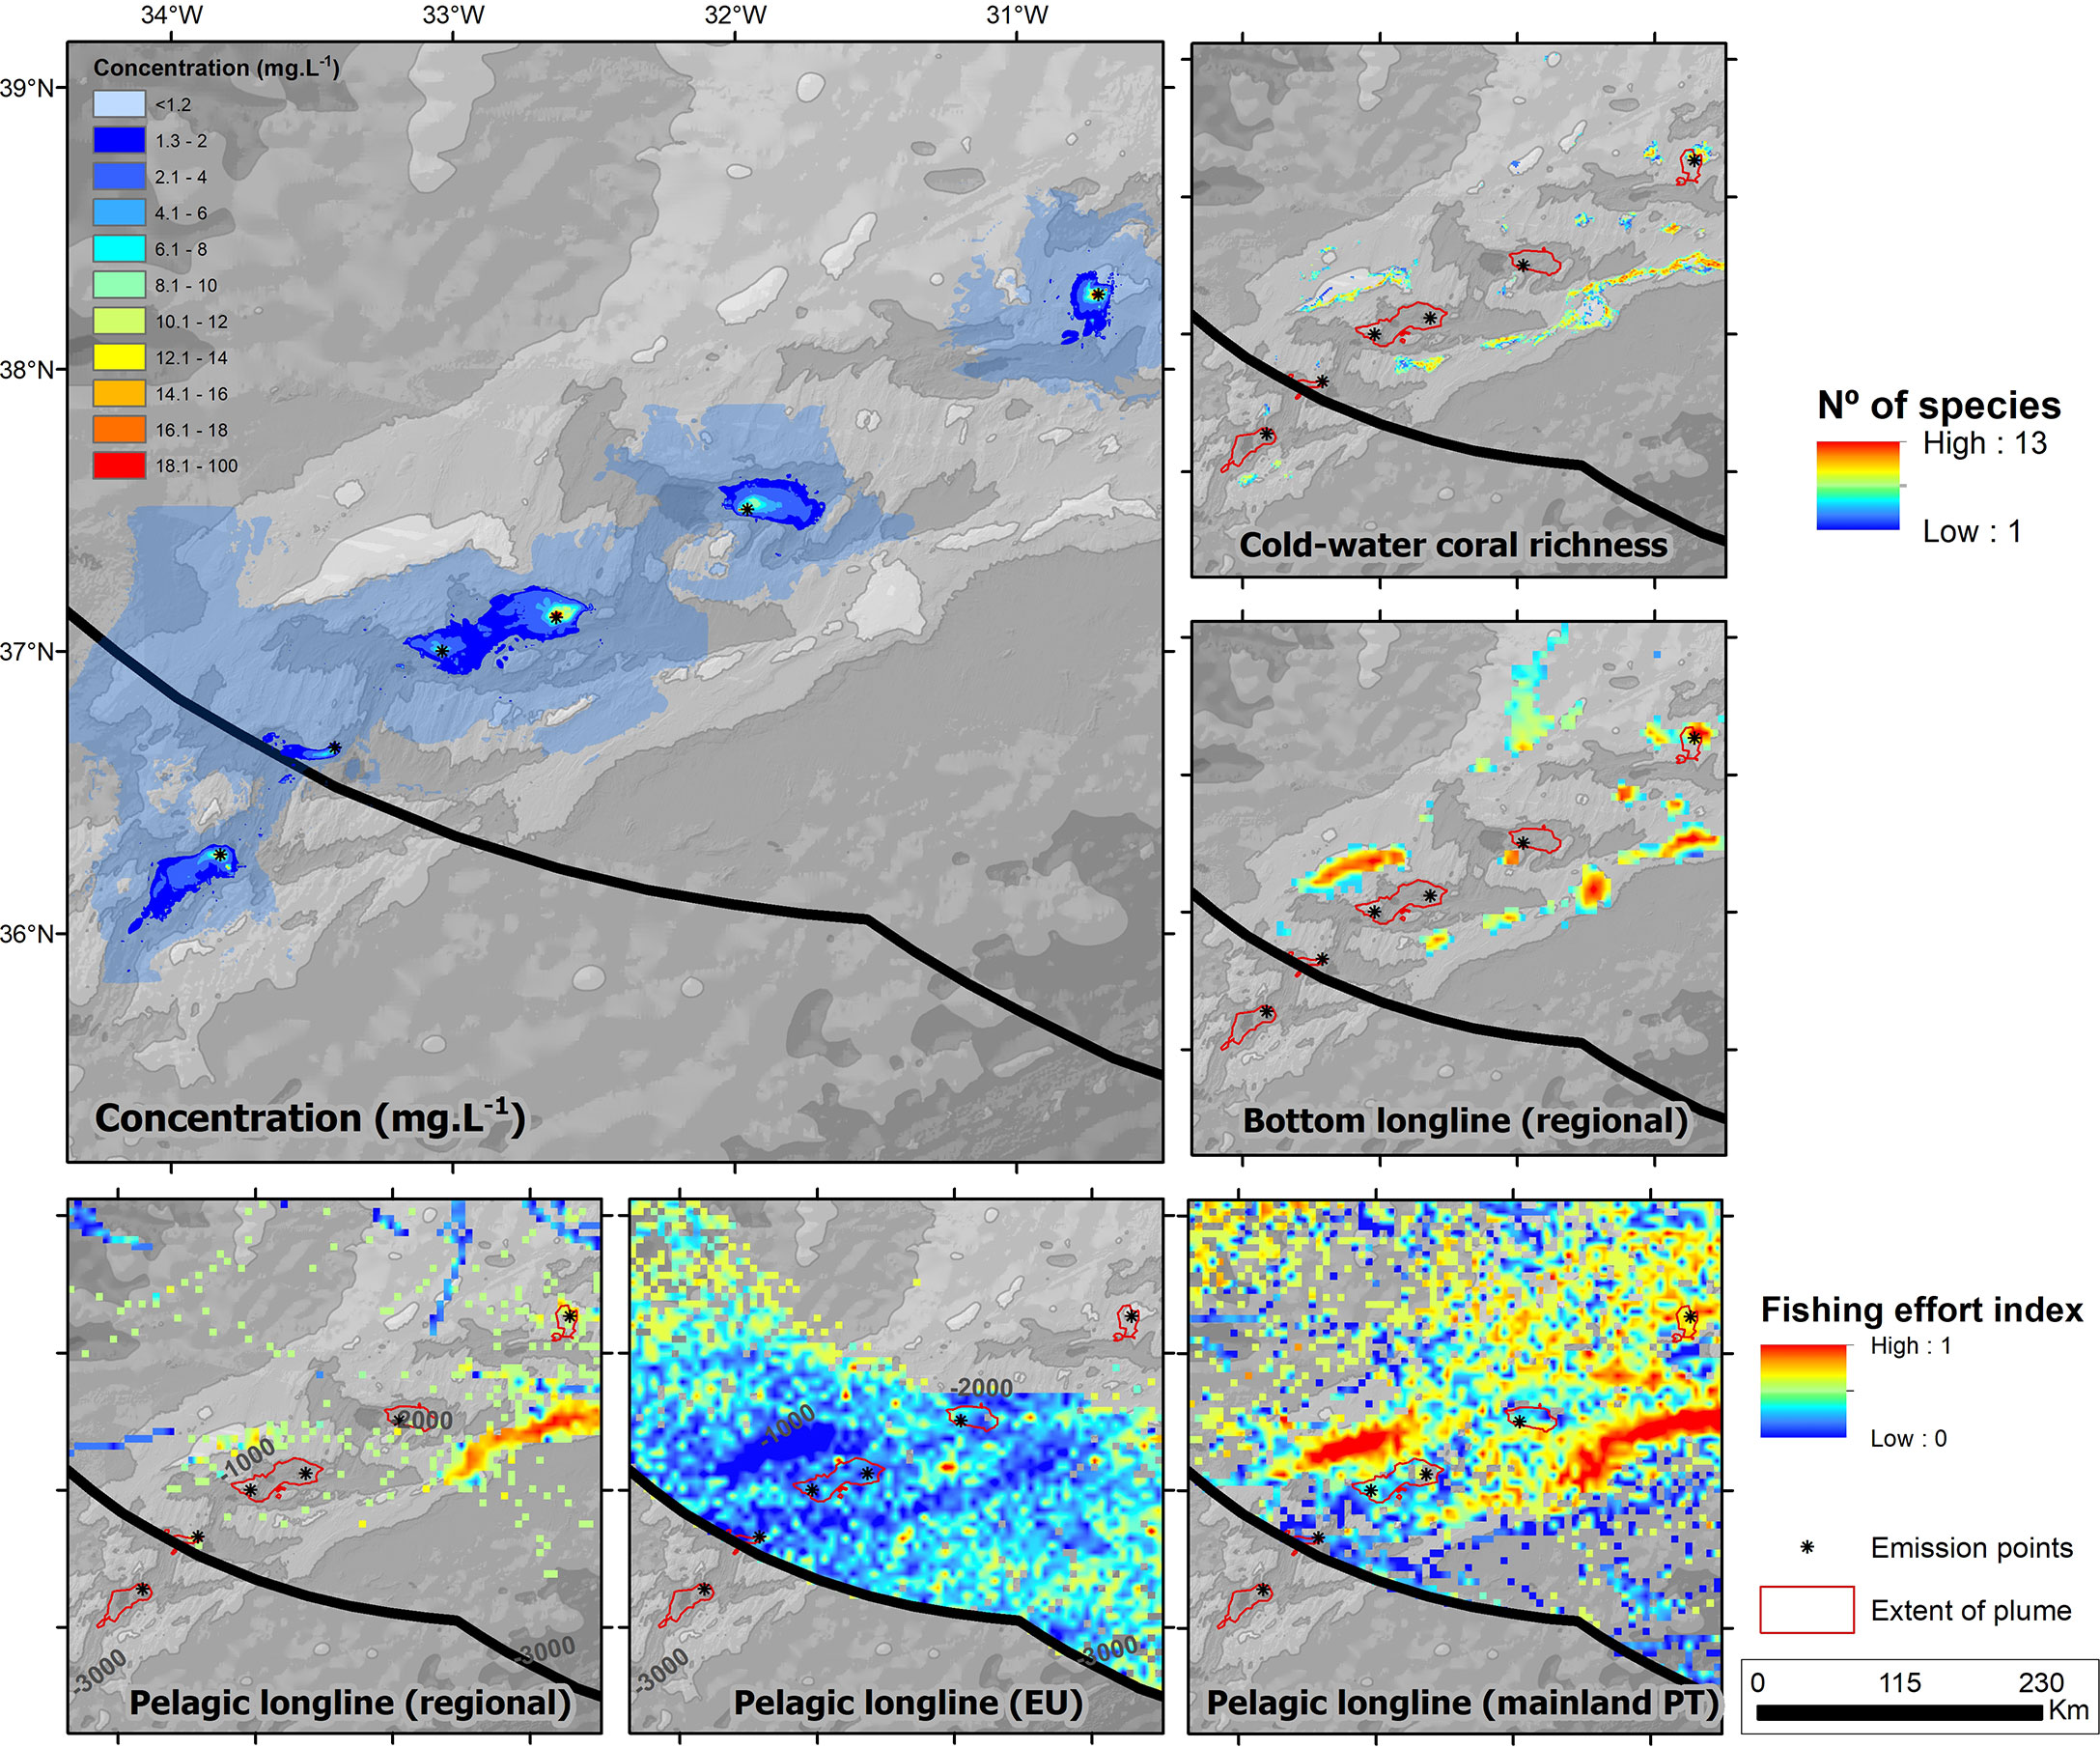
Figure 13 Overlap of the cumulative sediment plumes projected to be produced during the in situ excavation and the return sediment discharge process, with the current bottom longline and pelagic longline fishing footprint (Morato, unpublished data) and the predicted suitable habitat for several important habitat-structuring cold-water corals inside the Azores EEZ (Taranto, unpublished data).
4 Discussion
Predicting the dispersion of plumes originating from a future activity is challenging as there are still many uncertainties regarding the mining technologies to be used and the operations to be carried out (Atmanand and Ramadass, 2017; Sharma, 2017; Leng et al., 2021). Therefore, this study should be considered as a first assessment of the potential dispersal of deep-sea mining plumes generated during the exploitation of SMS deposits in the MAR. Our simulations were based on the Solwara 1 case study as described in Coffey Natural Systems (2008) and on the IHC Merwede mining scenario for SMS deposits in the Mid-Atlantic Ridge (Ortega and Boomsma, 2014) and may not represent the most recent views on SMS mining operations. In addition to the uncertainties associated with the mining operations per se, there is also a lack of detailed knowledge about the sediment composition at different sites (e.g., particle sizes, densities and settling velocities), flocculation rates, critical shear stress of erosion, critical shear stress of deposition, and erosion rates, among many others. Another important knowledge gap in our modelling work, relates to the degree of temperature changes during the uplift and subsequent descent of the ore and water, as the reported values varied from 1°C in the Coffey Natural Systems (2008) theoretical scenario to 11°C in a real lifting test (Okamoto et al., 2019). The temperature changes of the discharge water are extremely relevant because temperature oscillation mediates metal toxicity of the SMS mining plumes (Hauton et al., 2017). All these parameters are particularly important to generate realistic model projections and quantify the impacts on the marine environment (e.g., Jankowski and Zielke, 2001; Rolinski et al., 2001; Gillard et al., 2019) but, with few exceptions, in the case of the SMS deposits in the MAR they are mostly unknown. Finally, there are also some obvious uncertainties related to the MOHID hydrodynamic model, mostly considering the complex topography of the deep-sea environment in the Mid-Atlantic Ridge. For example, the resolution of the horizontal (1.2x1.2 km) and vertical (e.g., 150m at 1,000m depth) grids used, although similar to other studies, may not be sufficient to capture the localised mixing in the deep currents triggered mostly by tidal forcing of the mean circulation (Lahaye et al., 2019). Nevertheless, the comparisons made between the MOHID predictions and the remote sensing and in situ ARGO floats data suggested a good level of agreement.
Although the model simulations presented here were subject to several caveats, they did reveal some important patterns. The model projected marked differences among sites making generalisations of plume-dispersal patterns in mid-ocean ridges difficult to make. Nevertheless, the model predicted large horizontal plume-dispersal of return water, return sediments, and excavation sediments at concentrations well above the thresholds (1.2 mg·L-1 and 5,000-fold dilution) and the typical background of total suspended solids concentration of 0.04 mg·L-1 (Haalboom et al., 2020). Although the total footprint of the different plumes varies considerably depending on the adopted thresholds and site, we can make the questionable generalisation that persistent (temporal frequency >50%, i.e., 6 months out 12 months) plumes may disperse, on average, over a linear distance of from 10 to 20 km and cover an area from 17 to 150 km2. The model predicted that the plumes above concentration thresholds, regardless of the temporal frequencies, could travel for over 100 km and impact more than 10,000 km2.
In some cases, the plume footprints with higher concentrations than the adopted thresholds were predicted to extend beyond the licensed mining areas, suggesting the need for considering large buffer areas around the licensed areas (Wedding et al., 2013; Dunn et al., 2018). In fact, the model projected that plumes might reach the flanks and summits of close topographic features, potentially impacting the local biodiversity. Additionally, the models also predicted extensive vertical footprints of all plumes modelled, in many instances extending more than 800 m in the water column. If these predictions hold true, it may suggest that bathypelagic, mesopelagic, and epipelagic environments may also be affected by potentially toxic deep-sea mining plumes, corroborating the existing concerns over the impacts of deep-sea mining in oceanic primary productivity, midwater ecosystems and their fisheries (Fuchida et al., 2017; Drazen et al., 2020; van der Grient and Drazen, 2021).
In general, our plume-dispersal predictions extend larger horizontal and vertical distances when compared to previous studies related to seafloor massive sulphides (ASA, 2008b), deep-sea nodule mining on abyssal plains (Muñoz-Royo et al., 2021) and cobalt-rich crusts on seamounts (Spearman et al., 2020). Although we used similar or higher thresholds when compared to these studies, in general, some of the reported differences in plume dispersal estimates are related to the thresholds used in each study (Muñoz-Royo et al., 2021). In our case and similarly to ASA (2008b), we used widely accepted thresholds that, in the case of the sediments, was thirty times higher than the background value for the region (Haalboom et al., 2020). Moreover, these differences may be due in part to the fact that our simulations ran for an entire year, as opposed to field experiments that lasted only a few hours or model runs of a few days (Thiel and Tiefsee-Umweltschutz, 2001; ASA, 2008b; Aleynik et al., 2017; Spearman et al., 2020; Muñoz-Royo et al., 2021). It is also possible that the increased current velocities along the MAR in the Azores region (Lahaye et al., 2019) may increase the horizontal and vertical dispersal of deep-sea mining plumes compared to other locations such as the deep Bismarck Sea (ASA, 2008b) or the abyssal plain hosting nodules fields. On the other hand, sediment plumes consisting of very fine particles and having a lower settling velocity can remain in suspension for a very long time and be carried by local currents for hundreds of kilometres (Rolinski et al., 2001). The same may happen with dissolved metals and other potentially toxic compounds that can potentially harm the marine environment (Holmstrup et al., 2010; Mestre et al., 2014, Mestre et al., 2017; Martins et al., 2017; Martins et al., 2018), although the toxicity of deep-sea mining plumes and their behaviour are not yet understood (Hauton et al., 2017).
The average cumulative sediment thickness projected from both the return sediments (from 0.01 to 0.09 mm·y-1) and excavation sediments (0.06 to 0.24 mm·y-1) plumes are, in general, higher than the range of natural sedimentation. For example, the natural particle flux measured at Lucky Strike and Rainbow hydrothermal vent fields away from the vent influence were estimated as 0.047 mg·cm2·d-1 and 0.013 mg·cm2·d-1, respectively (Khripounoff et al., 2008), representing an annual deposition of 0.052 mm·y-1 and 0.014 mm·y-1, respectively. Other studies have produced estimates ranging from 0.0001 mm·y-1 from discharge sediment plumes of nodule mining (Muñoz-Royo et al., 2021) to 0.5-1 mm·10 days-1 from in situ excavation of nodules (Thiel and Tiefsee-Umweltschutz, 2001; Aleynik et al., 2017).
This study highlights several knowledge gaps and many uncertainties associated with modelling the dispersal of deep-sea mining plumes, but also the potential far-reaching impacts of this activity on the marine environment and existing human activities. Our model projected an overlap of mining plumes with the predicted distribution of cold-water corals. This overlap may be of conservation concern since seafloor massive sulphide mining plumes were demonstrated to produce high and rapid mortality rates on cold-water corals (Carreiro-Silva et al., this issue). Our model projections also indicated a large overlap between the predicted mining plumes and existing fishing activities. This overlap is of particular concern in regions such as the Azores, where local populations are highly dependent from the sea for their livelihoods (Diogo et al., 2015). Therefore, there is a need to quantify the baseline conditions and the nature and extent of mining impacts in space and time more precisely. This may only be achieved with experiments that are large enough to be representatively and accurately sampled over time (Jones et al., 2017). Future deep-sea mining plume dispersal studies should also consider the potential climate-related changes in the ocean circulation and deep water mass properties (e.g., warming, ocean acidification, and deoxygenation) and the climate-related effects on the dispersal and toxicity of metals associated to polymetallic sulphides (Millero et al., 2009; Levin et al., 2020).
Data Availability Statement
The datasets presented in this study can be found in online repositories. The names of the repository/repositories and accession number(s) can be found below: Model outputs are available for download from PANGAEA at https://doi.org/10.1594/PANGAEA.945244.
Author Contributions
TM, MJ, CP, MC-S, and AC contributed to the conception and design of the study. MJ developed the models. TM wrote the first draft of the manuscript. All authors contributed to manuscript revision, read, and approved the submitted version.
Funding
The research leading to this work has received funding from the European Union’s Seventh Framework Programme under the grant agreement No 603418 (MIDAS), the European Union’s Horizon 2020 programme under grant agreements No 678760 (ATLAS) and No 818123 (iAtlantic), by Fundação para a Ciência e a Tecnologia, I.P. (FCT) and Direção-Geral de Política do Mar (DGPM) project Mining2/0005/2017, as well as from the Regional Government of the Azores PO2020 MapGES project (Acores-01-0145-FEDER-000056). This output reflects only the authors’ views and the European Union and the Regional Government of the Azores cannot be held responsible for any use that may be made of the information contained therein. TM was also supported by Program Investigador FCT-IP (IF/01194/2013 and IF/01194/2013/CP1199/CT0002). TM and MC-S were also supported by the FCT-IP Program Stimulus of Scientific Employment (CCCIND/03345/2020 and CCCIND/03346/2020, respectively) and the H2020 programme No 689518 (MERCES) and No 818123 (iAtlantic). AC was also supported by the FCT-IP Program Stimulus of Scientific Employment (CEECIND/00101/2021). AC, IM, and CP received support from the Operational Program Azores 2020, through the Fund 01-0145-FEDER-000140 “MarAZ Researchers: Consolidate a body of researchers in Marine Sciences in the Azores” of the European Union. TM, MJ, CP, MC-S, IM, and AC also acknowledge funds through the FCT – Foundation for Science and Technology, I.P., under the project OKEANOS UIDB/05634/2020 and UIDP/05634/2020 and through the FCT Regional Government of the Azores under the project M1.1.A/REEQ.CIENTÍFICO UI&D/2021/010.
Conflict of Interest
The authors declare that the research was conducted in the absence of any commercial or financial relationships that could be construed as a potential conflict of interest.
Publisher’s Note
All claims expressed in this article are solely those of the authors and do not necessarily represent those of their affiliated organizations, or those of the publisher, the editors and the reviewers. Any product that may be evaluated in this article, or claim that may be made by its manufacturer, is not guaranteed or endorsed by the publisher.
Acknowledgment
The authors would like to acknowledge the contributions of many scientists and young researchers that were actively involved in the MIDAS project in the Azores, namely Ricardo Serrão Santos, António Godinho, Daphne Cuvelier, Maria Rakka, Meri Bilan, and Tara Van Belleghem, among many others. We would also like to acknowledge support from Ramiro Neves in the modeling work.
Supplementary Material
The Supplementary Material for this article can be found online at: https://www.frontiersin.org/articles/10.3389/fmars.2022.910940/full#supplementary-material
Footnotes
- ^ https://en.wikipedia.org/wiki/Nautilus_Minerals.
- ^ http://www.mohid.com/.
- ^ http://www.gotm.net/.
- ^ http://www.emodnet-bathymetry.eu/.
- ^ http://www.legos.obs-mip.fr/recherches/equipes/ecola/projets/.
- ^ https://www.ncdc.noaa.gov/data-access/model-data/modeldatasets/global-forcast-system-gfs.
- ^ http://www.argo.ucsd.edu
- ^ http://www.argo.ucsd.edu, http://argo.jcommops.org.
References
Aballéa M., Radford-Knoery J., Appriou P., Bougault H., Charlou J. L., Donval J. P., et al. (1998). Manganese Distribution in the Water Column Near the Azores Triple Junction Along the Mid-Atlantic Ridge and in the Azores Domain. Deep sea Res. Part I: oceanographic Res. papers 45 (8), 1319–1338. doi: 10.1016/S0967-0637(98)80012-5
Aleynik D., Inall M. E., Dale A., Vink A. (2017). Impact of Remotely Generated Eddies on Plume Dispersion at Abyssal Mining Sites in the Pacific. Scientific Reports, 7(1), 1–14.
Amon D. J., Gollner S., Morato T., Smith C. R., Chen C., Christiansen S., et al. (2022). Assessment of Scientific Gaps Related to the Effective Environmental Management of Deep-Seabed Mining. Mar. Policy 138, 105006. doi: 10.1016/j.marpol.2022.105006
ASA (2008a). “Modelling the Dispersion and Settlement of Sediment Removal Operation Prior to Mining at the Solwara 1 Mining Lease,” in Coffey Natural System 2008. Environmental Impact Statement: Solwara 1 Project, Volume B. Nautilus Minerals Niugini Limited(Papua New Guinea: Nautilus Minerals Niugini Limited). Available at: https://www.yumpu.com/en/document/read/12085050/appendices-5-13-nautilus-cares-nautilus-minerals. Appendix 11.
ASA (2008b). “Modelling the Dispersion of the Returned Water Discharge Plume From the Solwara 1 Seafloor Mining Project,” in Coffey Natural System 2008. Environmental Impact Statement: Solwara 1 Project, Volume B. Nautilus Minerals Niugini Limited(Papua New Guinea: Nautilus Minerals Niugini Limited). Available at: https://www.yumpu.com/en/document/read/12085050/appendices-5-13-nautilus-cares-nautilus-minerals. Appendix 12Manus Basin.
Atmanand M. A., Ramadass G. A. (2017). “Concepts of Deep-Sea Mining Technologies,” in Deep-Sea Mining (Cham: Springer), 305–343.
Baker E. T., Resing J. A., Haymon R. M., Tunnicliffe V., Lavelle J. W., Martinez F., et al. (2016). How Many Vent Fields? New Estimates of Vent Field Populations on Ocean Ridges From Precise Mapping of Hydrothermal Discharge Locations. Earth Planetary Sci. Lett. 449, 186–196. doi: 10.1016/j.epsl.2016.05.031
Ballent A., Pando S., Purser A., Juliano M. F., Thomsen L. (2013). Modelled Transport of Benthic Marine Microplastic Pollution in the Nazaré Canyon. Biogeosciences 10 (12), 7957–7970. doi: 10.5194/bg-10-7957-2013
Beaulieu S. E., Baker E. T., German C. R. (2015). Where are the Undiscovered Hydrothermal Vents on Oceanic Spreading Ridges? Deep Sea Res. Part II: Topical Stud. Oceanogr. 121, 202–212. doi: 10.1016/j.dsr2.2015.05.001
Beaulieu S. E., Baker E. T., German C. R., Maffei A. (2013). An Authoritative Global Database for Active Submarine Hydrothermal Vent Fields (Geophysics, Geosystems, 14(11), pp.4892-4905: Geochemistry).
Beaulieu S. E., Szafranski K. (2020) InterRidge Global Database of Active Submarine Hydrothermal Vent Fields, Version 3.4. World Wide Web Electronic Publication. Available at: http://vents-data.interridge.org (Accessed 2021-11-30).
Becker J. J., Sandwell D. T., Smith W. H. F., Braud J., Binder P., Depner J., et al. (2009). Global Bathymetry and Elevation Data at 30 Arc Seconds Resolution: Srtm30_PLUS. Mar. Geod. 32 (4), 355–371. doi: 10.1080/01490410903297766
Boschen-Rose R. E., Clark M. R., Rowden A. A., Gardner J. P. (2021). Assessing the Ecological Risk to Deep-Sea Megafaunal Assemblages From Seafloor Massive Sulfide Mining Using a Functional Traits Sensitivity Approach. Ocean Coast. Manage. 210, 105656. doi: 10.1016/j.ocecoaman.2021.105656
Boschen-Rose R. E., Colaço A. (2021). Northern Mid-Atlantic Ridge Hydrothermal Habitats: A Systematic Review of Knowledge Status for Environmental Management. Front. Mar. Sci., 8 657358 doi: 10.3389/fmars.2021.657358
Boschen R. E., Rowden A. A., Clark M. R., Gardner J. P. A. (2013). Mining of Deep-Sea Seafloor Massive Sulfides: A Review of the Deposits, Their Benthic Communities, Impacts From Mining, Regulatory Frameworks and Management Strategies. Ocean Coast. Manage. 84, 54–67. doi: 10.1016/j.ocecoaman.2013.07.005
Boschen R. E., Rowden A. A., Clark M. R., Pallentin A., Gardner J. P. (2016). Seafloor Massive Sulfide Deposits Support Unique Megafaunal Assemblages: Implications for Seabed Mining and Conservation. Mar. Environ. Res. 115, 78–88. doi: 10.1016/j.marenvres.2016.02.005
Carreiro-Silva M. I., Martins V., Riou J., Raimundo M., Caetano R., Bettencourt M., et al Submitted. Mechanical and toxicological effects of deep-sea mining sediment plumes on a habitat-forming cold-water octocoral. Front. Mar. Sci. Available at: https://review.frontiersin.org/review/915650/18/137790/
Cherkashov G. (2017). “Seafloor Massive Sulfide Deposits: Distribution and Prospecting,” in Deep-Sea Mining (Cham: Springer), 143–164.
Cherkashov G., Poroshina I., Stepanova T., Ivanov V., Bel’tenev V., Lazareva L., et al. (2010). Massive Sulfides From the Northern Equatorial Mid-Atlantic Ridge: New Discoveries and Perspectives. Mar. Georesources Geotechnology 28, 222–239. doi: 10.1080/1064119X.2010.483308
Chin C. S., Klinkhammer G. P., Wilson C. (1998). Detection of Hydrothermal Plumes on the Northern Mid-Atlantic Ridge: Results From Optical Measurements. Earth planetary Sci. Lett. 162 (1), 1–13. doi: 10.1016/S0012-821X(98)00141-1
Coffey Natural Systems (2008) Environmental Impact Statement: Solwara1 Project, Volume A. Nautilus Minerals Niugini Limited. Available at: https://www.yumpu.com/en/document/read/38646617/ environmental-impact- statement-nautilus-cares-nautilus-minerals.
Diogo H., Pereira J. G., Higgins R. M., Canha Â., Reis D. (2015). History, Effort Distribution and Landings in an Artisanal Bottom Longline Fishery: An Empirical Study From the North Atlantic Ocean. Mar. Policy 51, 75–85. doi: 10.1016/j.marpol.2014.07.022
Drazen J. C., Smith C. R., Gjerde K. M., Haddock S. H., Carter G. S., Choy C. A., et al. (2020). Opinion: Midwater Ecosystems Must be Considered When Evaluating Environmental Risks of Deep-Sea Mining. Proc. Natl. Acad. Sci. 117 (30), 17455–17460. doi: 10.1073/pnas.2011914117
Drillet Y., Bourdalle-Badie R., Siefridt L., Le Provost C. (2005). Meddies in the Mercator North Atlantic and Mediterranean Sea Eddy-Resolving Model. J. Geophysical Res. 110 (C3), C03016. doi: 10.1029/2003JC002170
Duarte B., Valentim J. M., Dias J. M., Silva H., Marques J. C., Cacador I. (2014). Modelling Sea Level Rise (SLR) Impacts on Salt Marsh Detrital Outwelling C and N Exports From an Estuarine Coastal Lagoon to the Ocean (Ria De Aveiro, Portugal). Ecol. Model. 289, 36–44. doi: 10.1016/j.ecolmodel.2014.06.020
Dunn D. C., Van Dover C. L., Etter R. J., Smith C. R., Levin L. A., Morato T., et al. (2018). A Strategy for the Conservation of Biodiversity on Mid-Ocean Ridges From Deep-Sea Mining. Sci. Adv. 4 (7), eaar4313. doi: 10.1126/sciadv.aar4313
ECORYS (2014). Study to Investigate State of Knowledge of Deep Sea Mining. Final Report Under FWC MARE/2012/06 - SC E1/2013/04. ECORYS (Rotterdam, The Netherlands: Nederland BV), 192 pp.
Fuchida S., Yokoyama A., Fukuchi R., Ishibashi J. I., Kawagucci S., Kawachi M., et al. (2017). Leaching of Metals and Metalloids From Hydrothermal Ore Particulates and Their Effects on Marine Phytoplankton. ACS omega 2 (7), 3175–3182. doi: 10.1021/acsomega.7b00081
Garbossa L. H. P., dos Santos A. A., Lapa K. R. (2021). Seaweed Dispersion Under Different Environmental Scenarios Based on Branches Settling Velocity and Hydrodynamic Lagrangian Model. Regional Stud. Mar. Sci. 47, 101909. doi: 10.1016/j.rsma.2021.101909
Gardner W. D., Richardson M. J., Mishonov A. V., Biscaye P. E. (2018). Global Comparison of Benthic Nepheloid Layers Based on 52 Years of Nephelometer and Transmissometer Measurements. Prog. Oceanogr. 168, 100–111. doi: 10.1016/j.pocean.2018.09.008
German C. R., Parson L. M., Bougault H., Coller D., Critchley M., Dapoigny A., et al. (1996). Hydrothermal Exploration Near the Azores Triple Junction: Tectonic Control of Venting at Slow-Spreading Ridges? Earth Planetary Sci. Lett. 138 (1), 93–104. doi: 10.1016/0012-821X(95)00224-Z
Gillard B., Purkiani K., Chatzievangelou D., Vink A., Iversen M. H., Thomsen L., et al. (2019). Physical and Hydrodynamic Properties of Deep Sea Mining-Generated, Abyssal Sediment Plumes in the Clarion Clipperton Fracture Zone (Eastern-Central Pacific). Elementa: Sci. Anthropocene 7, 1–14A. doi: 10.1525/elementa.343
Haalboom S., Price D. M., Mienis F., Van Bleijswijk J. D., Stigter H. C. D., Witte H. J., et al. (2020). Patterns of (Trace) Metals and Microorganisms in the Rainbow Hydrothermal Vent Plume at the Mid-Atlantic Ridge. Biogeosciences 17 (9), 2499–2519. doi: 10.5194/bg-17-2499-2020
Hagen A. (2003). Fuzzy Set Approach to Assessing Similarity of Categorical Maps. Int. J. Geographical Inf. Sci. 17 (3), 235–249. doi: 10.1080/13658810210157822
Hagen A. (2006). Comparing Continuous Valued Raster Data: A Cross Disciplinary Literature Scan, Technical Report (Maastricht: Research Institute for Knowledge Systems (RIKS).
Hannington M., Jamieson J., Monecke T., Petersen S., Beaulieu S. (2011). The Abundance of Seafloor Massive Sulfide Deposits. Geology 39, 1155–1158. doi: 10.1130/G32468.1
Hauton C., Brown A., Thatje S., Mestre N. C., Bebianno M. J., Martins I., et al. (2017). Identifying Toxic Impacts of Metals Potentially Released During Deep-Sea Mining—a Synthesis of the Challenges to Quantifying Risk. Front. Mar. Sci. 4, 368. doi: 10.3389/fmars.2017.00368
Herzig P. M., Petersen S., Hannington M. D. (2002). “Polymetallic Massive Sulphide Deposits at the Modern Seafloor and Their Resource Potential,” in Polymetallic Massive Sulphides and Cobalt-Rich Ferromanganese Crusts: Status and Prospects (Kingston, International Seabed Authority), 7–35.
Holmstrup M., Bindesbøl A. M., Oostingh G. J., Duschl A., Scheil V., Köhler H. R., et al. (2010). Interactions Between Effects of Environmental Chemicals and Natural Stressors: A Review. Sci. Total Environ. 408 (18), 3746–3762. doi: 10.1016/j.scitotenv.2009.10.067
Hydes D. J., Statham P. J., Burton J. D. (1986). A Vertical Profile of Dissolved Trace Metals (Al, Cd, Cu, Mn, Ni) Over the Median Valley of the Mid Atlantic Ridge, 43 N Kingston, Jamaica: Implications for Hydrothermal Activity. Sci. Total Environ. 49, 133–145. doi: 10.1016/0048-9697(86)90236-6
ISA (2021). “Polymetallic Sulphides Contractors,” in Minerals: Polymetallic Sulphides. Available at: https://www.isa.org.jm/exploration-contracts/polymetallic-sulphides.
ISA (2002). echnical Study 2: Polymetallic massive sulphides and cobalt-rich ferromanganese crusts: status and prospects. Kingston: International Seabed Authority.
Jankowski J. A., Zielke W. (2001). The Mesoscale Sediment Transport Due to Technical Activities in the Deep Sea. Deep Sea Res. Part II: Topical Stud. Oceanogr. 48 (17-18), 3487–3521. doi: 10.1016/S0967-0645(01)00054-6
Jones D. O., Kaiser S., Sweetman A. K., Smith C. R., Menot L., Vink A., et al. (2017). Biological Responses to Disturbance From Simulated Deep-Sea Polymetallic Nodule Mining. PloS One 12 (2), e0171750. doi: 10.1371/journal.pone.0171750
Juliano M., Neves R., Rodrigues P. P. G. W., Junior J. L., Fernandes R. (2012). Aplicação Da Plataforma MOHID Para Simulação Computacional De Deriva Oceânica De Petróleo Na Bacia De Campos – Rio De Janeiro. Boletim do Observatório Ambiental Alberto Ribeiro Lamego 6 (1), 161–172. doi: 10.5935/2177-4560.20120010
Khripounoff A., Vangriesheim A., Crassous P., Segonzac M., Lafon V., Warén A. (2008). Temporal Variation of Currents, Particulate Flux and Organism Supply at Two Deep-Sea Hydrothermal Fields of the Azores Triple Junction. Deep Sea Res. Part I: Oceanographic Res. Papers 55 (4), 532–551. doi: 10.1016/j.dsr.2008.01.001
Lahaye N., Gula J., Thurnherr A. M., Reverdin G., Bouruet-Aubertot P., Roullet G. (2019). Deep Currents in the Rift Valley of the North Mid-Atlantic Ridge. Front. Mar. Sci. 6, 597. doi: 10.3389/fmars.2019.00597
Le J. T., Levin L. A., Carson R. T. (2017). Incorporating Ecosystem Services Into Environmental Management of Deep-Seabed Mining. Deep Sea Res. Part II: Topical Stud. Oceanogr. 137, 486–503. doi: 10.1016/j.dsr2.2016.08.007
Leng D., Shao S., Xie Y., Wang H., Liu G. (2021). A Brief Review of Recent Progress on Deep Sea Mining Vehicle. Ocean Eng., 228, 108565. doi: 10.1016/j.oceaneng.2020.108565
Levin L. A., Mengerink K., Gjerde K. M., Rowden A. A., Van Dover C. L., Clark M. R., et al. (2016). Defining Serious Harm to the Marine Environment in the Context of Deep-Seabed Mining. Mar. Pol. 74, 245–259. doi: 10.1016/j.marpol.2016.09.032
Levin L. A., Wei C. L., Dunn D. C., Amon D. J., Ashford O. S., Cheung W. W., et al. (2020). Climate Change Considerations are Fundamental to Management of Deep-Sea Resource Extraction. Global Change Biol. 26 (9), 4664–4678. doi: 10.1111/gcb.15223
Marín V. H., Tironi A., Paredes M. A., Contreras M. (2013). Modeling Suspended Solids in a Northern Chilean Patagonia Glacier-Fed Fjord: GLOF Scenarios Under Climate Change Conditions. Ecol. Model. 264, 7–16. doi: 10.1016/j.ecolmodel.2012.06.017
Marques A. F. A., Scott S. D. (2011). “Azores Sea: Seafloor Hydrothermal Systems, VMS Deposits and New Exploration Targets,” in OCEANS’11 MTS/IEEE KONA. 1–2, IEEE.
Martins I., Godinho A., Goulart J., Carreiro-Silva M. (2018). Assessment of Cu Sub-Lethal Toxicity (LC50) in the Cold-Water Gorgonian Dentomuricea Meteor Under a Deep-Sea Mining Activity Scenario. Environ. pollut. 240, 903–907. doi: 10.1016/j.envpol.2018.05.040
Martins I., Goulart J., Martins E., Morales-Román R., Marín S., Riou V., et al. (2017). Physiological Impacts of Acute Cu Exposure on Deep-Sea Vent Mussel Bathymodiolus Azoricus Under a Deep-Sea Mining Activity Scenario. Aquat. Toxicol. 193, 40–49. doi: 10.1016/j.aquatox.2017.10.004
Mateus M., Neves R. (2013). Ocean Modelling for Coastal Management - Case Studies With MOHID (Lilsbon: IST Press), 265 pp.
Mestre N. C, Rocha T. L, Canals M, Cardoso C, Danovaro R., Dell’Anno A, et al (2017). Environmental hazard assessment of a marine mine tailings deposit site and potential implications for deep-sea mining. Environmental Pollution, 228, 169–178
Mestre N. C., Calado R., Soares A. M. (2014). Exploitation of Deep-Sea Resources: The Urgent Need to Understand the Role of High Pressure in the Toxicity of Chemical Pollutants to Deep-Sea Organisms Environ. pollut. 185, 369–371. doi: 10.1016/j.envpol.2013.10.021
Millero F. J., Woosley R., DiTrolio B., Waters J. (2009). Effect of Ocean Acidification on the Speciation of Metals in Seawater. Oceanography 22 (4), 72–85. doi: 10.5670/oceanog.2009.98
Morato T., Juliano M., Pham C. K., Carreiro-Silva M., Martins I., Colaço A. (2022). Model Outputs: Modelling the Dispersion of Seafloor Massive Sulphide Mining Plumes in the Mid Atlantic Ridge Around the Azores ( PANGAEA). doi: 10.1594/PANGAEA.945244
Muñoz-Royo C., Peacock T., Alford M. H., Smith J. A., Le Boyer A., Kulkarni C. S., et al. (2021). Extent of Impact of Deep-Sea Nodule Mining Midwater Plumes is Influenced by Sediment Loading, Turbulence and Thresholds. Commun. Earth Environ. 2 (1), 1–16. doi: 10.1038/s43247-021-00213-8
Murton B. J., Lehrmann B., Dutrieux A. M., Martins S., de la Iglesia A. G., Stobbs I. J., et al. (2019). Geological Fate of Seafloor Massive Sulphides at the TAG Hydrothermal Field (Mid-Atlantic Ridge). Ore Geology Rev. 107, 903–925. doi: 10.1016/j.oregeorev.2019.03.005
Navas J. M., Miller P. L., Henry L. A., Hennige S. J., Roberts J. M. (2014). Ecohydrodynamics of Cold-Water Coral Reefs: A Case Study of the Mingulay Reef Complex (Western Scotland). PloS One 9 (5), e98218. doi: 10.1371/journal.pone.0098218
Negreiros B., Schwindt S., Haun S., Wieprecht S. (2021). Fuzzy Map Comparisons Enable Objective Hydro-Morphodynamic Model Validation. Earth Surface Processes Landforms. 47, 793–806. doi: 10.1002/esp.5285
Niner H. J., Ardron J. A., Escobar E. G., Gianni M., Jaeckel A., Jones D. O., et al. (2018). Deep-Sea Mining With No Net Loss of Biodiversity—an Impossible Aim. Front. Mar. Sci. 5, 53. doi: 10.3389/fmars.2018.00053
Okamoto N., Shiokawa S., Kawano S., Sakurai H., Yamaji N., Kurihara M. (2018). “Current Status of Japan’s Activities for Deep-Sea Commercial Mining Campaign,” in 2018 OCEANS-MTS/IEEE Kobe Techno-Oceans (OTO), 1–7. IEEE.
Okamoto N., Shiokawa S., Kawano S., Yamaji N., Sakurai H., Kurihara M. (2019). “World’s First Lifting Test for Seafloor Massive Sulphides in the Okinawa Trough in the EEZ of Japan,” in The 29th international ocean and polar engineering conference. Kobe, Japan OnePetro.
Ortega A., Boomsma W. (2014). MIDAS: Mining Research Scenarios (Kinderdijk, Netherlands: Kinderdijk IHC Mining B.V.), 13pp.
Petersen S., Krätschell A., Augustin N., Jamieson J., Hein J. R., Hannington M. D. (2016). News From the Seabed–Geological Characteristics and Resource Potential of Deep-Sea Mineral Resources. Mar. Policy 70, 175–187. doi: 10.1016/j.marpol.2016.03.012
Plecha S., Picado A., Chambel-Leitão P., Dias J. M., Vaz N. (2014). Study of Suspended Sediment Dynamics in a Temperate Coastal Lagoon: Ria De Aveiro (Portugal). J. Coast. Res. 70 (sp1), 604–609. doi: 10.2112/SI70-102.1
Purkiani K., Gillard B., Paul A., Haeckel M., Haalboom S., Greinert J., et al. (2021). Numerical Simulation of Deep-Sea Sediment Transport Induced by a Dredge Experiment in the Northeastern Pacific Ocean. Front. Mar. Sci., 8, 719463. doi: 10.3389/fmars.2021.719463
Riflet G., Juliano M., Fernandes L., Leitão and R. Neves P. C. (2008). Operational Ocean Forecasting of the Portuguese Waters. Mercator Ocean Q. Newslett. 30, 20–32.
Rolinski S., Segschneider J., Sündermann J. (2001). Long-Term Propagation of Tailings From Deep-Sea Mining Under Variable Conditions by Means of Numerical Simulations. Deep Sea Res. Part II: Topical Stud. Oceanogr. 48 (17-18), 3469–3485. doi: 10.1016/S0967-0645(01)00053-4
Sharma R. (Ed.) (2017). Deep-Sea Mining: Resource Potential, Technical and Environmental Considerations (Cham, Switzerland: Springer).
Sharma R. (Ed.) (2019). Environmental Issues of Deep-Sea Mining: Impacts, Consequences and Policy Perspectives (Cham, Switzerland: Springer).
Smith C. R., Tunnicliffe V., Colaço A., Drazen J. C., Gollner S., Levin L. A., et al. (2020). Deep-Sea Misconceptions Cause Underestimation of Seabed-Mining Impacts. Trends Ecol. Evol. 35 (10), 853–857. doi: 10.1016/j.tree.2020.07.002
Sousa M. C., Mendes R., Alvarez I., Vaz N., Gomez-Gesteira M., Dias J. M. (2014). Unusual Circulation Patterns of the Rias Baixas Induced by Minho Freshwater Intrusion (NW of the Iberian Peninsula). PloS One 9 (11), e112587. doi: 10.1371/journal.pone.0112587
Spearman J., Taylor J., Crossouard N., Cooper A., Turnbull M., Manning A., et al. (2020). Measurement and Modelling of Deep Sea Sediment Plumes and Implications for Deep Sea Mining. Sci. Rep. 10 (1), 1–14. doi: 10.1038/s41598-020-61837-y
Taranto G. H, González-Irusta J.-M, Domínguez-Carrió C., Pham C. K, Tempera F, Carreiro-Silva M, et al, (2020) Habitat suitability and ecoscape predictions for vulnerable and foundation cold-water coral of the Azores (NE Atlantic). University of the Azores, PANGAEA, doi: 10.1594/PANGAEA.921282 (dataset in review)
Thiel H., Tiefsee-Umweltschutz F. (2001). Evaluation of the Environmental Consequences of Polymetallic Nodule Mining Based on the Results of the TUSCH Research Association. Deep Sea Res. Part II: Topical Stud. Oceanogr. 48 (17-18), 3433–3452. doi: 10.1016/S0967-0645(01)00051-0
van der Grient J. M. A., Drazen J. C. (2021). Potential Spatial Intersection Between High-Seas Fisheries and Deep-Sea Mining in International Waters. Mar. Policy 129, 104564. doi: 10.1016/j.marpol.2021.104564
Van Dover C. L. (2011). Tighten Regulations on Deep-Sea Mining. Nature 470 (7332), 31–33. doi: 10.1038/470031a
Van Dover C. L. (2019). Inactive Sulfide Ecosystems in the Deep Sea: A Review. Front. Mar. Sci. 6, 461. doi: 10.3389/fmars.2019.00461
Van Dover C. L., Ardron J. A., Escobar E., Gianni M., Gjerde K. M., Jaeckel A., et al. (2017). Biodiversity Loss From Deep-Sea Mining. Nat. Geosci. 10 (7), 464–465. doi: 10.1038/ngeo2983
Van Dover C. L., Colaço A., Collins P. C., Croot P., Metaxas A., Murton B. J., et al. (2020). Research is Needed to Inform Environmental Management of Hydrothermally Inactive and Extinct Polymetallic Sulfide (PMS) Deposits. Mar. Policy 121, 104183. doi: 10.1016/j.marpol.2020.104183
Visser H., De Nijs T. (2006). The Map Comparison Kit. Environ. Model. Software 21 (3), 346–358. doi: 10.1016/j.envsoft.2004.11.013
Washburn T. W., Turner P. J., Durden J. M., Jones D. O., Weaver P., Van Dover C. L. (2019). Ecological Risk Assessment for Deep-Sea Mining. Ocean Coast. Manage. 176, 24–39. doi: 10.1016/j.ocecoaman.2019.04.014
Weaver P. P. E., Billett D. (2019). “Environmental Impacts of Nodule, Crust and Sulphide Mining: An Overview,” in Environmental Issues of Deep-Sea Mining. Ed. Sharma R. (Cham: Springer), 27–62. doi: 10.1007/978-3-030-12696-4_3
Wedding L. M, Friedlander A. M, Kittinger J. N, Watling L., Gaines S. D., Bennett M, Smith C. R (2013). From principles to practice: a spatial approach to systematic conservation planning in the deep searoceedings of the Royal Society B: Biological Sciences,280(1773), 20131684
Wedding L. M., Reiter S. M., Smith C. R., Gjerde K. M., Kittinger J. N., Friedlander A. M., et al(2015). Managing Mining of the Deep Seabed. Science 349 (6244), 144–145. doi: 10.1126/science.aac6647
Wheeler A. J., Murton B., Copley J., Lim A., Carlsson J., Collins P., et al. (2013). Moytirra: Discovery of the First Known Deep-Sea Hydrothermal Vent Field on the Slow-Spreading Mid-Atlantic Ridge North of the Azores. Geochemistry Geophysics Geosystems 14 (10), 4170–4184. doi: 10.1002/ggge.20243
Keywords: deep-sea, mining, sediment plumes, spatial extent of impacts, hydrodynamic model, MOHID, Mid Atlantic Ridge
Citation: Morato T, Juliano M, Pham CK, Carreiro-Silva M, Martins I and Colaço A (2022) Modelling the Dispersion of Seafloor Massive Sulphide Mining Plumes in the Mid Atlantic Ridge Around the Azores. Front. Mar. Sci. 9:910940. doi: 10.3389/fmars.2022.910940
Received: 01 April 2022; Accepted: 13 June 2022;
Published: 20 July 2022.
Edited by:
Philip Weaver, Seascape Consultants Ltd., United KingdomReviewed by:
Andrew C. Dale, Scottish Association For Marine Science, United KingdomTravis William Washburn, Geological Survey of Japan (AIST), Japan
Copyright © 2022 Morato, Juliano, Pham, Carreiro-Silva, Martins and Colaço. This is an open-access article distributed under the terms of the Creative Commons Attribution License (CC BY). The use, distribution or reproduction in other forums is permitted, provided the original author(s) and the copyright owner(s) are credited and that the original publication in this journal is cited, in accordance with accepted academic practice. No use, distribution or reproduction is permitted which does not comply with these terms.
*Correspondence: Telmo Morato, dC5tb3JhdG9AZ21haWwuY29t
†These authors have contributed equally to this work